
Submitted:
27 January 2026
Posted:
28 January 2026
You are already at the latest version
Abstract
Many peer-reviewed studies report spatiotemporal or kinetic parameters of running gait without considering their stability, temporal structure, or relationship to typical run durations. This study investigated the stability and temporal structure of key spatiotemporal and kinetic parameters during a 30-minute easy-paced treadmill run (13 km∙h-1) while participants wore familiar and unfamiliar every day running shoes. Step-level data were analysed across the full time series and in sequential 1-minute epochs to determine how long each parameter takes to reach practical stability and whether this differs between shoe conditions. Approximately, 2,450 steps were analysed per condition. Within-participant variability was low (CV< 2.5%) for all parameters and conditions except for peak impact force (CV=6.9-7.0%) and average loading rate (CV=8.4-8.7%). DFA-α indicated persistent temporal structure for stride duration, swing time, and active peak force, whereas loading-phase kinetics showed weak long-range dependence. No significant differences were observed between shoe conditions for variability or temporal structure, although ground contact time was slightly longer in the unfamiliar shoe. Practical windows of stability relative to each participant’s 30-minute mean ranged from 11 to 17 minutes for spatiotemporal variables, 9-17 minutes for active peak force, and within the first minute for impact related parameters and impulse. These findings indicate that studies examining spatiotemporal and kinetic parameters during easy-paced treadmill running require 11-17 minutes of continuous data to obtain 1-minute epoch estimates that are practically stable relative to 30-minute averages, regardless of footwear familiarity.
Keywords:
running
; running shoes
; gait
; long-range correlations
; protocol duration
1. Introduction
While Homo erectus is credited with perfecting bipedalism and running [1,2], footwear emerged much later (3627-3377 BCE) for protective purposes [3], and much later again (1920’s) for performance purposes in the guise of the modern shoe [4]. One of the earliest studies examining midsole cushioning and its influence on running gait, with the aim of attenuating impact force [5], required participants to run repeatedly over a force plate until five successful right-foot strikes were obtained. Success was defined as achieving a speed ±5% of the 4.5 m∙s-1 target, equivalent to a considerable range 15.6-17.0 km∙h-1 or a running pace 3:32-3:51 min∙km-1 which could alter parameters considerable [6]. Although this methodology is traditional, concerns have been raised regarding its ecological validity due to limited exposure to the test condition [7]. Specifically, key methodological elements are often missing, including the mean ± variability of running speed, an appropriate duration of run time or number of steps [8,9], and the corresponding variability of spatiotemporal, kinematic or kinetic parameters [10,11].
A mini review of 56 relevant studies [7] found 91% of research analysed fewer than 10 steps, with only 9% analysing more than 10, with no clear justifications for either approach. A more recent, multi-database search (EbscoHost) for “running shoe” (English-language, peer-reviewed, full-text; January 27, 2024 - January 27, 2025) identified 161 articles from 16 databases. Of these, 52 pertained to running-shoe properties and their biomechanical or physiological effects, and 13 specifically examined ground reaction forces or parameters of gait. The most common protocol remained the repeated-force-plate approach, where participants ran over the same plate multiple times to acquire valid steps [12,13,14,15,16,17,18,19,20,21]. Only three studies used instrumented treadmills, with data collection windows ranging from 0.5 – 6.0 min [22,23,24]. Despite the availability of instrumented treadmills and pressure-sensing insoles capable of capturing thousands of consecutive steps, research practices have changed little.
Importantly, relatively short sampling windows that average many consecutive steps (e.g. 1-minute epochs), can give the impression of early stability because the averaging process smooths out step-to-step variability. This approach provides a practical and representative estimate of mean behaviour within a relatively short duration [25,26]. Understanding how using such a small epoch behaves relative to longer continuous running, and how many epochs are required to obtain stable mean estimates, would therefore be informative for running-protocol design. When individual continuous steps are analysed directly over prolonged periods typical of normal run duration, the gait signal is non-stationary, with fluctuations that accumulate over time [27]. Whereas, the use of discontinuous sampling can capture variability between different steps, it cannot reveal the temporal structure of these fluctuations or the presence of long-range correlations. The long-range structure of this continuous data can instead be examined using detrend fluctuation analysis (DFA), which has been used to explore running ability [28], injury proneness [29], and footwear effects [30]. As a result, far more consecutive steps may be required than typically used [7] before practical stability is reached. These underlying dynamics highlight the need for research designs that consider both mean behaviour and step-level structure when evaluating interventions such as footwear.
There is a lack of direction regarding the protocol duration or number of steps required to reliably assess kinetic and spatiotemporal parameters of running gait when comparing running shoes. Therefore, this study aims to investigate the stability and structure of key spatiotemporal and kinetic parameters over a 30-minute easy-paced treadmill run. Step-level were analysed across the full time series and in chronological 1-minute epochs to determine how long these parameters take to reach practical stability, defined as the time point at which a given 1-minute epoch no longer differs from the 30-minute average. A secondary aim is to evaluate whether differences occur between familiar and unfamiliar shoe conditions.
2. Materials and Methods
2.1. Material Properties
Sixteen recreational to nationally competitive endurance runners (mean ± SD; height (cm) 172.6 ± 6.4, body mass (kg) 64.2 ± 8.2, Body Mass Index 21.5 ± 1.4, and a typical weekly volume (km∙wk-1) 68.2 ± 16.1) free of injury participated, after giving written consent in accordance with the University Human Ethics Committee approval. All participants were accustomed to running on a treadmill.
This sample size was based on a priori statistic (G*power V 3.1.9.7, Heinrich-Heine University, Dusseldorf, Germany) for analysis of variance (ANOVA) repeated measures within factors, with an alpha value of 0.05, power 0.8, and various effect sizes (0.297-0.730) based on primary dependent variables including stride duration, ground contact time, peak impact force, and average loading rate. All effect size values were based on in-house preliminary analyses. Given the nature of the repeated measures design and the correlation among repeated observations it was deemed a sample size of 16 (8 male, 8 female) participants to be adequate for our analysis and exceeds the minimum required total sample size for most conditions.
2.2. Procedures and Measurements
The experimental protocol consisted of two trials with a footwear intervention where the participant wore their everyday running shoe that they complete most of their weekly volume in, and one they were unfamiliar with (Altra, Torin 7), whilst running for 30-minutes at a treadmill speed of 13 km∙h-1. This speed has been shown to produce significant differences in vertical ground reaction forces [25,31,32]. Participants were required to deem this pace as recovery-to-easy i.e. relatively slow, in order to participate. This pace was selected to facilitate completion of the two 30-minute trials and because slower speeds are recommended for reliably assessing long-range correlations in gait dynamics [33]. Each trial was performed in one session on the same day, performed in a counter-balanced order of shoe conditions, and separated by 10-15 min to minimise sequence effect on the dependent variables of interest.
Upon arrival at the laboratory, participants were measured, weighed, and had their footwear size determined by a shoe specialist to ensure best fit of the unfamiliar shoe based on participant input and expertise. Trial order was selected, and the appropriate footwear was fitted with a flexible pressure insole to record kinetic data (LoadSol® Pro, Novel GmbH, Munich, Germany), whereupon each insole (left and right) was configured for the specific participant and followed the manufacturer’s bipedal calibration process.
Participants were given no warm-up period on the treadmill (Life Fitness, Hamilton, New Zealand) to facilitate no interference with analysis. Each condition was performed for a period of 30 min, with data logged at 200Hz throughout where participants were blind to any dependent variables being measured.
LoadSol® time*force data were uploaded into MATLAB (R2022b, (MathWorks, Inc., Natick, MA, United States) as previously used by this group [26,34]. Data were up-sampled to 1,000 Hz, and processed using force threshold values of 20-30 N to determine initial foot contact and toe-off [35]. From these outputs the following dependent variables were calculated using techniques previously described for running [36,37] and expressed per body weight (N) where appropriate (BW): a) Peak vertical impact force (N∙BW-1) identified as the first peak in heel strikes and found between initial contact and the active peak. If a first peak was not present for any step (mid-forefoot strike) it was defined as the force at 13% of the stance phase; b) Active peak vertical force (N∙BW-1) was the second peak for heel strike runners, or the highest force reading of each step for mid-forefoot strikers; c) To calculate the average rate of loading (N∙BW-1∙s-1) the difference between forces at 20% and 80% of the peak impact force was divided by the corresponding time interval (s) between these two points; d) Impulse (N∙s), the area under the force-time curve; e) Ground contact time (s) was the time the foot remained in contact with the floor; f) Swing time (s) was the time the foot has no contact with the ground; g) Stride duration was the time from one initial impact to the next initial impact for the same foot.
2.5. Statistical Analysis
Dependent variable data were computed for each step and summarised as mean ± SD, along with the corresponding CV (%) per independent variable. Normality of all dependent variables were evaluated using the D’Agostino & Pearson normality test. Full series (30-minute) averages for each dependent variable and their corresponding CV% were compared between shoe familiarity conditions using paired t-tests when normality assumptions were met, or Wilcoxon signed-rank when they were violated.
DFA was employed to determine the scaling exponent alpha (α), characterising the long-range correlation structure of each dependent variable [38]. For each time series, the mean was subtracted, and the cumulative sum was computed to generate an integrated signal. This signal was divided into segments of varying window sizes. Within each window, a local linear trend was fitted and removed, and the root-mean-square fluctuation was calculated. Fluctuations were averaged across all windows of the same size, and this procedure was repeated across logarithmically spaced window sizes ranging from short segments (≥5 steps) to a fraction of the total series length (N/4 to N/9). The scaling exponent α was obtained as the slope of the linear fit to the log-log relationship between fluctuation magnitude and window size. DFA results were only interpreted when the scaling behaviour was clearly linear.
Full-series data was segmented into 1-minute epochs. To assess each epoch provided an estimate equivalent to the participants full 30-minute mean, epoch values (expressed as a percentage of the full-series mean) were tested against 100% using a one-sample t-test or Wilcoxon signed-rank test when normality were violated. For parameters in which a substantial proportion of epochs failed normality, Wilcoxon tests were applied to all epochs to ensure consistent and robust inference.
All statistical analyses were performed using GraphPad Prism (V 8.4, (GraphPad Software, San Diego, CA, United States). Statistical significance was set at p<0.05.
3. Results
This study analysed a mean±SD 2459±163 and 2449±150 steps for familiar and unfamiliar shoes, respectively. There was no paired t-test difference between condition (t=0.689, p=0.502). The overall 30-minute means, corresponding CV%, normality outcomes, and the paired difference tests for each shoe condition are summarised in table 1. Statistical difference between shoes were present in ground contact time, active peak force and impulse while CV% values were similar across conditions.

Table 1.
The overall mean ± (SD), mean CV%, dataset normality test results for the complete 30-min trial, with paired difference test results between conditions for both dependent variables.
Table 1.
The overall mean ± (SD), mean CV%, dataset normality test results for the complete 30-min trial, with paired difference test results between conditions for both dependent variables.
| Familiar Shoe | Unfamiliar Shoe |
Dependent Variable test (t- or W-; p-value) |
|||||
| Dependent Variable | Mean±SD | CV% |
Normality (K2, p-value) |
Mean±SD | CV% |
Normality (K2, p-value) |
|
| Stride Duration (s) | 0.733±0.045 | 1.4±0.6 | 1.133; 0.567 | 0.744±0.004 | 1.4±0.7 | 1.401; 0.496 | 1.263; 0.227 |
| Ground contact time (s) | 0.224±0.018 | 1.9±0.4 | 2.194; 0.334 | 0.227±0.019 | 1.8±0.3 | 3.652; 0.161 | 2.388; 0.032 |
| Swing time (s) | 0.509±0.048 | 1.9±0.7 | 0.246; 0.884 | 0.511±0.043 | 1.9±1.0 | 0.360; 0.835 | 0.367; 0.719 |
| Peak Impact Force (N) | 981±188 | 6.9±1.7 | 3.673; 0.162 | 1017±215 | 7.0±1.4 | 1.807; 0.405 | 1.884; 0.081 |
| AVLR (N∙s-1) | 37274±9140 | 8.4±1.1 | 2.228; 0.328 | 37747±9106 | 8.7±1.1 | 0.096; 0.953 | 0.473; 0.644 |
| Active Peak Force (N) | 1717±270 | 2.2±0.5 | 4.433; 0.109 | 1745±336 | 2.2±0.5 | 7.336; 0.026 | 59; 0.068 |
| Impulse (N∙s) | 238±44 | 1.8±0.4 | 10.39; 0.006 | 245±57 | 1.9±0.6 | 14.34; 0.008 | 59; 0.068 |
Where data is displayed as italics one or more trial did not pass the normal distribution test. That specific data is highlighted in bold and statistical difference testing uses Wilcoxon’s Signed-Rank Test. Otherwise, all difference testing uses a paired t-test.
DFA-α values indicated persistent temporal structure for stride duration and swing time, with α ranging from 0.81 to 0.85 across shoe conditions (Table 2). Ground contact time showed weaker persistence (α=0.73-0.74). Loading-phase kinetic parameters, including peak impact force and average loading rate, demonstrated weak to minimal long-range dependence (α=0.67-0.69). In contrast, propulsive-phase kinetics such as active peak force exhibited stronger persistence (α=0.77-0.79). Impulse also showed a relatively persistent structure (α=0.83). No significant differences in DFA-α were observed between familiar and unfamiliar shoes for any parameter (Table 2).
One-sample tests for the spatiotemporal parameters (Figure 3) compared each 1-minute epoch with the participant’s 30-minute mean and identified practical stability windows in which epoch values did not differ from the full-series mean (P>0.05). For stride duration, this stability window occurred between 9 and 17 minutes in both shoe conditions (Figure 3A-B). Ground contact time showed no significant difference across any epoch in the familiar shoe, whereas in the unfamiliar shoe the stability window extended from 2 to 17 minutes (Figure 3D). Swing time required epochs between 11 and 17 minutes to match the 30-minute mean in the familiar shoe (Figure 3E), and between 8 to 30 minutes for the unfamiliar shoe (Figure 3F).
One-sample tests for the kinetic parameters (Figure 4) were consistent with the variability observed in Table 1, where moderate-high between-participant variability meant epoch choice was less critical for loading-phase kinetics. Peak impact force, average loading rate and impulse showed no significant difference across any epoch (p>0.05) in either shoe condition. In contrast, active peak force showed low variability (Table 1) and demonstrated a practical stability window between 9 and 17 minutes in the familiar shoe (Figure 4E), whereas no significant differences were observed across any epoch in the unfamiliar shoe (Figure 4F).
4. Discussion
This study investigated the stability and temporal structure of key spatiotemporal and kinetic parameters during a 30-minute easy-paced treadmill run, with the goal of determining how long each parameter required to reach practical stability and whether this differed between familiar and unfamiliar shoe conditions. The main findings showed no differences between shoe conditions at a low relative speed for variability, long-term correlations, or practical windows of stability for any parameter. Spatiotemporal and active peak force exhibited low within-participant variability (<2.5%), whereas peak impact force and average loading rate were comparatively higher (6.9-8.7%). Parameters with low variability demonstrated strong persistent temporal structure (DFA-α >0.7), while loading-phase parameters showed only weak persistence (DFA-α <0.7). To capture data representative of an individual’s 30-minute run, a practical stability window of approximately 11 to 17 minutes was required, although this was parameter dependent. Specifically, loading-phase kinetics reached stability within the first minute of running.
Runners continuously adjust their gait to produce the most efficient movement for the conditions which are shaped by environmental, mechanical, and morphological constraints [9]. Consequently, it has been suggested that the variability rather than mean values provides more meaningful insight into system organization [39]. Using a treadmill helps minimize variability introduced by environmental factors when assessing running gait [10,40], but doing so requires a substantial number of steps to obtain reliable data. In this study, the overall mean±SD number of steps (2454±157) used for spatiotemporal and kinetic analyses was considerable and representative of run durations commonly performed by runners [41].
The low variability of spatiotemporal variables (Table 1) is not unexpected on a treadmill [33,42,43], where the surface is consistently flat and smooth, while the belt moves at a constant speed. Under these conditions there will still be small fluctuations to facilitate flexible motor control [29], including minor fore-aft shift in centre of mass position on the treadmill. This relative stability is reflected in the uniform ground reaction forces during the propulsive phase, evidenced by the within-participant mean CV of 2.2±0.5% for active peak force reported here for both familiar and unfamiliar footwear, and consistent with previous comparisons of minimalist versus cushioned footwear [34] and different midsole densities in geometrically identical shoes [44]. This consistency likely contributes to the stable timing of early swing, although not necessarily the terminal component of swing, which influences the resultant impact. However, impact loading exhibited considerably higher variability, which did not differ between shoes (CV=6.9±1.7% and 7.0±1.4% for familiar and unfamiliar shoes), and this variability cannot be attributed to proportional changes in active peak force, as no such changes occurred. Instead, prior work suggests that peak impact force is sensitive to natural variations in limb acceleration, joint positioning [45], and/or strike pattern [26] at the moment of contact. As these were not measured in this study, it is difficult to determine the specific source of fluctuation. Nevertheless, the variability observed here, while slightly lower, is consistent with some of the original work performed on discontinuous steps [5] and with continuous step data collected over much smaller duration samples (2 minutes), where peak impact force and average loading rate variability (CV%) were 8.7±2.4% and 11.8±2.0%, respectively [44].
While the CV% provides information about the magnitude of the step-to-step variability, it is insensitive to subtle neuromuscular changes related to how the body moves to control the centre of mass trajectory [46]. As such, it does not tell us anything about how the fluctuations are temporally structured [47]. DFA-α addresses this by characterizing the variability over time [48]. While all parameters exhibited α-values >0.5 in both shoe conditions, indicating positively correlated (non-random) fluctuations. Stride duration, swing time, and active peak force showed the strongest persistence with no differences between condition (Table 2), suggesting that the nervous system allows slow, coherent drifts in the centre of mass trajectory, rather than correcting them step-by-step. This tolerance likely reflects the lower balance related demands associated with these aspects of gait where peak active force is regulated primarily through feedback mechanism following initial contact of the current step [49]. The 1-minute epoch data (Figure 3 and Figure 4) further illustrates this behaviour, revealing a gradual upwards drift across the 30-minute run, with data starting below and ending above the overall mean. In contrast, loading-related parameters (peak impact force and average loading rate) showed weaker persistence with no difference between condition (Table 2), with tighter step-by-step regulation around the mean and a pattern in which high impacts were followed by lower impacts, reflected in the more scattered 1-minute epochs (Figure 4 A-D). This pattern likely relates to the runners’ need to maintain dynamic balance [50] through a combined feedback-feedforward control mechanism, in which they both react to the collision and anticipate the next one [51,52], and where medial-lateral instabilities require corrective responses [53]. Interestingly, ground contact time appeared to reflect the combined influence of loading and propulsive phases of gait, with the α-value falling between that of stride duration, swing phase, active peak force, and the loading parameters. As such, this variable likely integrates how the body manages both loading and propulsion, and its temporal structure represents the combined influence.
As the variability and temporal structure did not differ between shoe conditions, the one-sample analysis could be used to determine an optimal sampling window for each parameter to match the full 30-minute time series. Parameters with strong persistence and low variability, such as stride duration in both conditions, swing time (Figure 3), and active peak force in the familiar shoe condition (Figure 3E and 4E), required a sampling window duration centred around the middle of the run. This reflects the gradual and upwards drift observed across the time series, meaning early or late samples alone would not adequately represent the full dataset. In contrast, the loading phase kinetic variables showed weaker persistence, and the 1-minute epoch comparisons indicated that samples ranging from 1 to 30 minutes were similarly representative of the full time series. This suggests that impact related parameters stabilise almost immediately despite their higher step-to-step variability (Table 1). Impulse showed a similar sampling behaviour (Figure 4G-H), likely because it integrates the variable loading phase with the highly consistent propulsive phase. This integration smooths out the early stance fluctuations, resulting in a relatively stable and persistent overall signal.
While studies targeting specific parameters or phases of gait may choose sampling durations specific to their needs, the present findings indicate that, regardless of shoe familiarity or the parameter analysed, a minimum of 11 minutes of continuous running at the set speed (including warm-up) are required before collecting a 1-minute epoch that reflects a 30-minute run.
Although the primary aim of this study was to evaluate gait stability rather than compare mean gait performance between shoe conditions, the overall means are reported for transparency (Table 1). Only one parameter reached significance, where participants spent slightly longer during ground contact in the unfamiliar, standardised, with zero running kilometres compared to participants unrestricted age or type of familiar shoe. Other mean values (peak impact, active peak force, impulse) approached significance, but interpreting these differences is outside the scope of this discussion. Importantly, shoe familiarity did not influence variability, temporal structure, or stability windows which were the focus of this study.
5. Conclusions
This study showed that spatiotemporal and kinetic parameters during a 30-minute easy-paced treadmill run exhibit low variability and strong temporal persistence, except for loading-phase kinetics, which were more variable and demonstrated weaker persistence. These patterns did not differ between familiar and unfamiliar footwear, except in the case of a small increase in ground contact time in the unfamiliar shoe. Practical stability windows ranged from 11-17 minutes for spatiotemporal variables, 9-17 minutes for active peak force, and within the first minute for impact related parameters. Collectively, these findings indicate that studies investigating gait during easy-paced treadmill running require at least 11 minutes of continuous running at the set speed to obtain 1-minute epoch estimates that are relative to 30-minute averages, regardless of footwear familiarity.
Author Contributions
P.W.Macdermid: Conceptualization (lead); Project administration (equal); Methodology (lead); Software (lead); formal analysis (lead); Investigation (equal); Data curation (lead); Writing—Original draft (lead); Visualization (lead); Writing—review & editing (equal).S.J.Walker: Conceptualization (support); Methodology (support); Investigation (equal), Writing—review & editing (equal).D. Cochrane: Conceptualization (support); Project administration (equal); Methodology (support); Ethics (lead); Writing—review & editing (equal). All: authors have read and agreed to the published version of the manuscript.
Funding
This research received no external funding.
Institutional Review Board Statement
The study was conducted in accordance with the Declaration of Helsinki and approved by the Ethics Committee of Massey University (OM1 24/44 approved 12 June 2025).
Informed Consent Statement
Informed consent was obtained from all subjects involved in the study.
Data Availability Statement
All data supporting the conclusions of this article are provided within the manuscript.
Acknowledgments
We would like to acknowledge the support of Altra Running for the provision of the unfamiliar shoes used within this research.
Conflicts of Interest
There are no conflicts of interest.
References
- Bramble, D.M.; Lieberman, D.E. Endurance running and the evolution of Homo. Nature 2004, 432, 345–352. [Google Scholar] [CrossRef] [PubMed]
- Hatala, K.G.; Roach, N.T.; Ostrofsky, K.R.; Wunderlich, R.E.; Dingwall, H.L.; Villmoare, B.A.; Green, D.J.; Harris, J.W.K.; Braun, D.R.; Richmond, B.G. Footprints reveal direct evidence of group behavior and locomotion in Homo erectus. Sci. Rep 2016, 6, 28766. [Google Scholar] [CrossRef]
- Pinhasi, R.; Gasparian, B.; Areshian, G.; Zardaryan, D.; Smith, A.; Bar-Oz, G.; Higham, T. First direct evidence of chalcolithic footwear from the near eastern highlands. PloS one 2010, 5, e10984. [Google Scholar] [CrossRef]
- Smit, B. Sneaker Wars: The Enemy Brothers Who Founded Adidas and Puma and the Family Feud that Forever Changed the Business of Sports; Harper Perennial, 2008. [Google Scholar]
- Clarke, T.E.; Frederick, E.C.; Cooper, L.B. Effects of Shoe Cushioning Upon Ground Reaction Forces in Running. Int. J. Sports Med. 1983, 04, 247–251. [Google Scholar] [CrossRef]
- Hamill, J.; Bates, B.T.; Knutzen, K.M.; Sawhill, J.A. Variations in ground reaction force parameters at different running speeds. Human Movement Science 1983, 2, 47–56. [Google Scholar] [CrossRef]
- Oliveira, A.S.; Pirscoveanu, C.I. Implications of sample size and acquired number of steps to investigate running biomechanics. Sci. Rep 2021, 11, 3083. [Google Scholar] [CrossRef]
- Burns, G.T.; Joubert, D.P. Running Shoes of the Postmodern Footwear Era: A Narrative Overview of Advanced Footwear Technology. Int J Sports Physiol Perform 2024, 19, 975–986. [Google Scholar] [CrossRef]
- Godin, A.; Rouget, L.; Eustache, E.; Mourot, L.; Sagawa, Y. Evaluation of the optimal number of steps to obtain reliable running spatio-temporal parameters and their variability. Gait & Posture 2024, 111, 37–43. [Google Scholar] [CrossRef]
- Riazati, S.; Caplan, N.; Hayes, P.R. The number of strides required for treadmill running gait analysis is unaffected by either speed or run duration. J. Biomech. 2019, 97, 109366. [Google Scholar] [CrossRef] [PubMed]
- Chau, T.; Young, S.; Redekop, S. Managing variability in the summary and comparison of gait data. Journal of NeuroEngineering and Rehabilitation 2005, 2, 22. [Google Scholar] [CrossRef] [PubMed]
- Gao, S.; Song, Y.; Sun, D.; Zheng, Z.; Chen, H.; Zhang, Q.; Xu, Y.; Gu, Y. The Impact of Running Experience and Shoe Longitudinal Bending Stiffness on Lower Extremity Biomechanics: A cross-sectional study. Acta of Bioengineering & Biomechanics 2024, 26. [Google Scholar]
- Isherwood, J.; Woo, S.; Cho, M.; Cha, M.; Park, S.; Kim, S.; Han, S.; Jun, J.; Sung, N.; Sterzing, T. Advanced footwear technology and its impacts on running mechanics, running economy and perception of male and female recreational runners. Footwear Science 2024, 16, 179–189. [Google Scholar] [CrossRef]
- Esmaeili, A.; Hosseininejad, S.E.; Jafarnezhadgero, A.; Dionisio, V.C. The interaction effect of different footwear types and static navicular drop or dynamic ankle pronation on the joint stiffness of the lower limb during running. Gait & Posture 2024, 108, 28–34. [Google Scholar] [CrossRef]
- Song, Y.; Cen, X.; Sun, D.; Bálint, K.; Wang, Y.; Chen, H.; Gao, S.; Bíró, I.; Zhang, M.; Gu, Y. Curved carbon-plated shoe may further reduce forefoot loads compared to flat plate during running. Sci. Rep 2024, 14, 13215. [Google Scholar] [CrossRef] [PubMed]
- Lu, R.; Chen, H.; Huang, J.; Ye, J.; Gao, L.; Liu, Q.; Quan, W.; Gu, Y. Biomechanical Investigation of Lower Limbs during Slope Transformation Running with Different Longitudinal Bending Stiffness Shoes. Sensors 2024, 24, 3902. [Google Scholar] [CrossRef]
- Zhu, C.; Song, Y.; Xu, Y.; Zhu, A.; Baker, J.S.; Liu, W.; Gu, Y. Toe Box Shape of Running Shoes Affects In-Shoe Foot Displacement and Deformation: A Randomized Crossover Study. Bioengineering 2024, 11, 457. [Google Scholar] [CrossRef]
- Traut, A.G.; Hannigan, J.; Ter Har, J.A.; Pollard, C.D. Influence of Footwear Selection on Youth Running Biomechanics: A Pilot Study. Sports Health 2024, 16, 913–919. [Google Scholar] [CrossRef]
- Liu, T.; Matijevich, E.S.; Chu, Z.; Yang, F.; Nigg, B. Role of midsole hollow structure in energy storage and return in running shoes. J. Biomech. 2024, 171, 112197. [Google Scholar] [CrossRef]
- Miyazaki, T.; Aimi, T.; Yamada, Y.; Nakamura, Y. Curved carbon plates inside running shoes modified foot and shank angular velocity improving mechanical efficiency at the ankle joint. J. Biomech. 2024, 172, 112224. [Google Scholar] [CrossRef]
- Yang, Z.; Cui, C.; Zhou, Z.; Zheng, Z.; Yan, S.; Liu, H.; Qu, F.; Zhang, K. Effect of midsole hardness and surface type cushioning on landing impact in heel-strike runners. J. Biomech. 2024, 165, 111996. [Google Scholar] [CrossRef]
- Tankink, T.; Houdijk, H.; Hijmans, J.M. Human-in-the-loop optimized rocker profile of running shoes to enhance ankle work and running economy. Eur J Sport Sci 2024, 24, 164–173. [Google Scholar] [CrossRef]
- Martinez, E., 3rd; Hoogkamer, W.; Powell, D.W.; Paquette, M.R. The Influence of" Super-Shoes" and Foot Strike Pattern on Metabolic Cost and Joint Mechanics in Competitive Female Runners. In Medicine and Science in Sports and Exercise; 2024. [Google Scholar]
- Yawar, A.; Lieberman, D.E. Effects of shoe heel height on ankle dynamics in running. Sci. Rep 2024, 14, 17959. [Google Scholar] [CrossRef]
- Macdermid, P.W.; Walker, S.J.; Cochrane, D. The Effects of Cushioning Properties on Parameters of Gait in Habituated Females While Walking and Running. Preprints 2024. [Google Scholar] [CrossRef]
- Macdermid, P.W.; Walker, S.J. Spectral and Spatial Analysis of Plantar Force Distributions Across Foot-Strike Patterns During Treadmill Running. Applied Sciences 2025, 15, 8709. [Google Scholar] [CrossRef]
- Jordan, K.; Challis, J.H.; Newell, K.M. Long range correlations in the stride interval of running. Gait & Posture 2006, 24, 120–125. [Google Scholar] [CrossRef]
- Nakayama, Y.; Kudo, K.; Ohtsuki, T. Variability and fluctuation in running gait cycle of trained runners and non-runners. Gait & Posture 2010, 31, 331–335. [Google Scholar] [CrossRef]
- Meardon, S.A.; Hamill, J.; Derrick, T.R. Running injury and stride time variability over a prolonged run. Gait & Posture 2011, 33, 36–40. [Google Scholar] [CrossRef]
- Fuller, J.T.; Amado, A.; Emmerik, R.E.A.v.; Hamill, J.; Buckley, J.D.; Tsiros, M.D.; Thewlis, D. The effect of footwear and footfall pattern on running stride interval long-range correlations and distributional variability. Gait & Posture 2016, 44, 137–142. [Google Scholar] [CrossRef]
- Arampatzis, A.; Brüggemann, G.-P.; Metzler, V. The effect of speed on leg stiffness and joint kinetics in human running. J. Biomech. 1999, 32, 1349–1353. [Google Scholar] [CrossRef] [PubMed]
- Aird, J.; Cady, R.; Nagi, H.; Kullar, S.; MacDermid, J.C. The impact of wrist extension provocation on current perception thresholds in patients with carpal tunnel syndrome: A pilot study. Journal of Hand Therapy 2006, 19, 299–306. [Google Scholar] [CrossRef] [PubMed]
- Fuller, J.T.; Buckley, J.; Tsiros, M.; Thewlis, D. Reliability of the long-range correlations obtained from detrended fluctuation analysis of running stride intervals. ISBS Proceedings Archive 2018, 36, 702. [Google Scholar]
- Macdermid, P.W.; Walker, S.J.; Cochrane, D. The Effects of Cushioning Properties on Parameters of Gait in Habituated Females While Walking and Running. Applied Sciences 2025, 15, 1120. [Google Scholar] [CrossRef]
- Wright, I.C.; Neptune, R.R.; van den Bogert, A.J.; Nigg, B.M. Passive regulation of impact forces in heel-toe running. Clin. Biomech. 1998, 13, 521–531. [Google Scholar] [CrossRef] [PubMed]
- Hunter, J.G.; Smith, A.M.B.; Sciarratta, L.M.; Suydam, S.; Shim, J.K.; Miller, R.H. Standardized Lab Shoes Do Not Decrease Loading Rate Variability in Recreational Runners. J Appl Biomech 2020, 36, 340–344. [Google Scholar] [CrossRef] [PubMed]
- Chan, Z.Y.S.; Au, I.P.H.; Lau, F.O.Y.; Ching, E.C.K.; Zhang, J.H.; Cheung, R.T.H. Does maximalist footwear lower impact loading during level ground and downhill running? Eur J Sport Sci 2018, 18, 1083–1089. [Google Scholar] [CrossRef]
- Hardstone, R.; Poil, S.S.; Schiavone, G.; Jansen, R.; Nikulin, V.V.; Mansvelder, H.D.; Linkenkaer-Hansen, K. Detrended fluctuation analysis: a scale-free view on neuronal oscillations. Front Physiol 2012, 3, 450. [Google Scholar] [CrossRef]
- Mann, R.; Malisoux, L.; Urhausen, A.; Statham, A.; Meijer, K.; Theisen, D. The effect of shoe type and fatigue on strike index and spatiotemporal parameters of running. Gait & Posture 2015, 42, 91–95. [Google Scholar] [CrossRef]
- Macdermid, P.; Grayling, P. A comparative analysis of pace, work, and gait during national championship cross-country and road running events. J Sport Exerc Sci 2021, 5, 230–235. [Google Scholar]
- Lee, D.-c.; Pate, R.R.; Lavie, C.J.; Sui, X.; Church, T.S.; Blair, S.N. Leisure-time running reduces all-cause and cardiovascular mortality risk. J. Am. Coll. Cardiol. 2014, 64, 472–481. [Google Scholar]
- Lindsay, T.R.; Noakes, T.D.; McGregor, S.J. Effect of treadmill versus overground running on the structure of variability of stride timing. Percept. Motor Skills 2014, 118, 331–346. [Google Scholar] [CrossRef]
- Mo, S.; Chow, D.H.K. Reliability of the fluctuations within the stride time series measured in runners during treadmill running to exhaustion. Gait & Posture 2019, 74, 1–6. [Google Scholar] [CrossRef]
- Macdermid, P.W.; Walker, S.J.; Ingalla, B.; Leuchanka, A. Plantar Force Spectra Across Midsole Densities and Treadmill Speeds: A Spatially Resolved Analysis in Relation to Material Properties. Applied Sciences 2026, 16, 784. [Google Scholar] [CrossRef]
- Baltich, J.; Maurer, C.; Nigg, B.M. Increased Vertical Impact Forces and Altered Running Mechanics with Softer Midsole Shoes. PLOS ONE 2015, 10, e0125196. [Google Scholar] [CrossRef] [PubMed]
- Jordan, K.; Newell, K.M. The structure of variability in human walking and running is speed-dependent. Exerc. Sport Sci. Rev. 2008, 36, 200–204. [Google Scholar] [CrossRef]
- Hausdorff, J.M. Gait variability: methods, modeling and meaning. Journal of NeuroEngineering and Rehabilitation 2005, 2, 19. [Google Scholar] [CrossRef]
- Brahms, C.M.; Zhao, Y.; Gerhard, D.; Barden, J.M. Long-range correlations and stride pattern variability in recreational and elite distance runners during a prolonged run. Gait & Posture 2022, 92, 487–492. [Google Scholar] [CrossRef]
- Nigg, B.; Denoth, J.; Neukomm, P. Quantifying the load on the human body: Problems and some possible solutions. Biomechanics VII-B 1981, 88, 99. [Google Scholar]
- Bruijn, S.M.; van Dieën, J.H. Control of human gait stability through foot placement. Journal of The Royal Society Interface 2018, 15. [Google Scholar] [CrossRef]
- Nigg, B.M. The Role of Impact Forces and Foot Pronation: A New Paradigm. Clin. J. Sport Med. 2001, 11, 2–9. [Google Scholar] [CrossRef]
- Winter, S.L.; Challis, J.H. Classifying the variability in impact and active peak vertical ground reaction forces during running using DFA and ARFIMA models. Human Movement Science 2017, 51, 153–160. [Google Scholar] [CrossRef]
- Mahaki, M.; Bruijn, S.M.; Van Dieën, J.H. The effect of external lateral stabilization on the use of foot placement to control mediolateral stability in walking and running. PeerJ 2019, 7, e7939. [Google Scholar] [CrossRef] [PubMed]
Figure 3.
Spatiotemporal 1-minute epochs expressed as a percentage of each participants 30-minute mean. The shaded practical stability window denotes the period in which epoch values did not differ significantly from the full-series mean (one-sample tests). Panels show: A. Familiar shoe stride duration, B. Unfamiliar shoe stride duration, C. Familiar shoe ground contact time, D. Unfamiliar shoe ground contact, E. Familiar shoe swing time, and F. Unfamiliar shoe swing time.
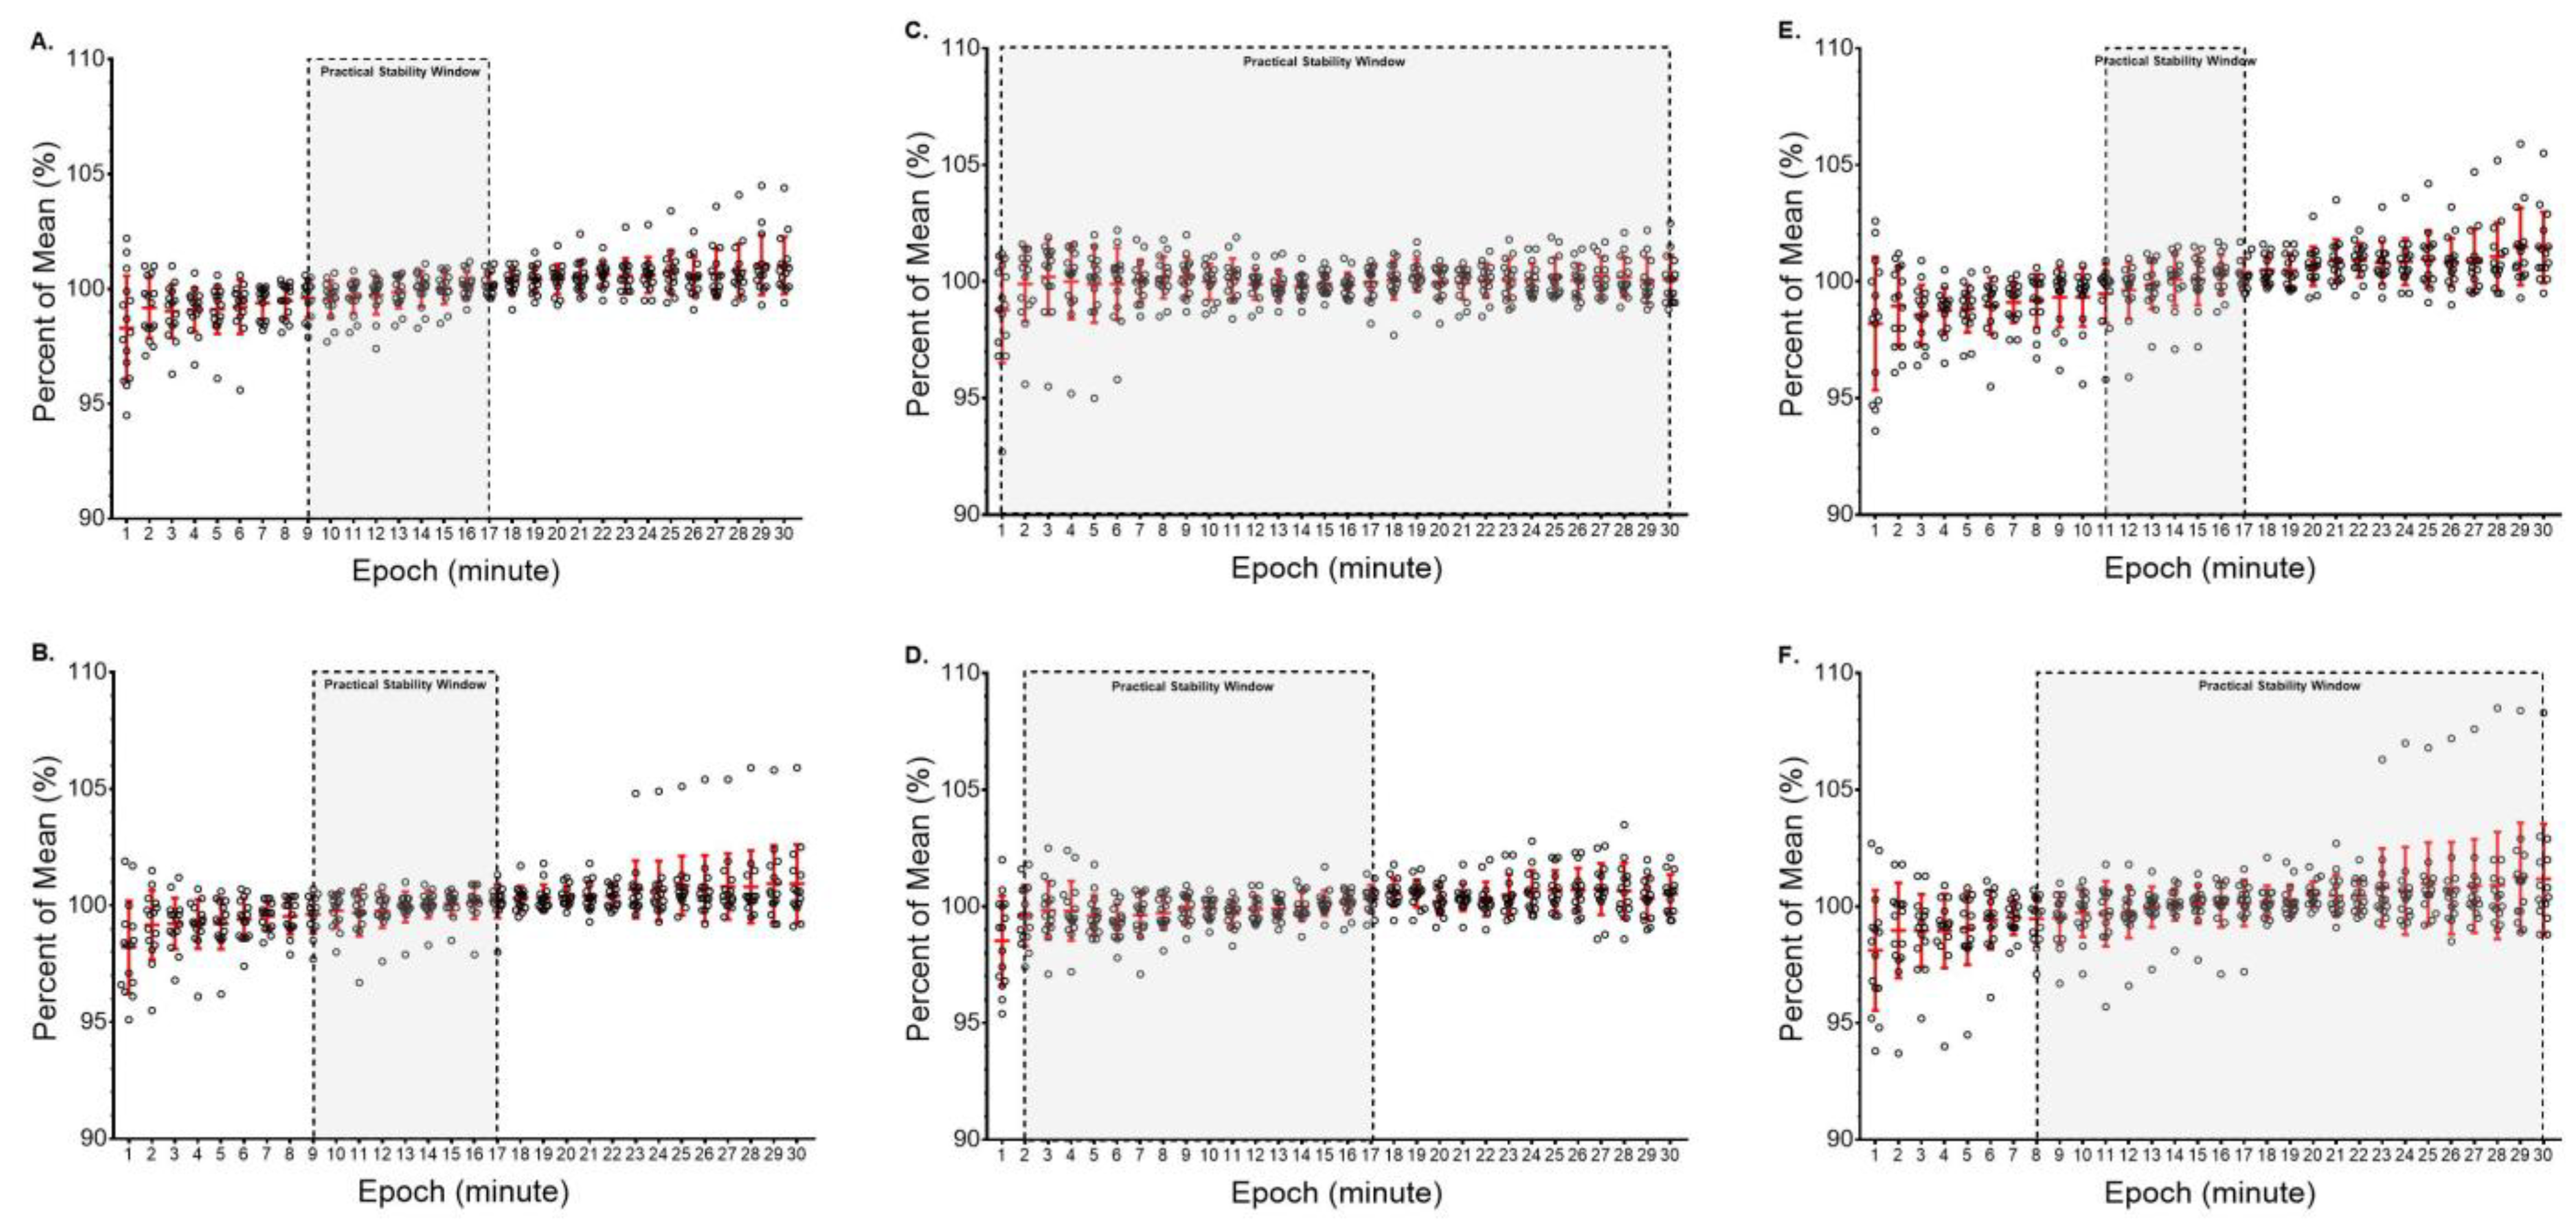
Figure 4.
kinetic 1-minute epochs expressed as a percentage of each participants 30-minute mean. The shaded practical stability window denotes the period in which epoch values did not differ significantly from the full-series mean (one-sample tests). Panels show: A. Familiar shoe peak impact force, B. Unfamiliar shoe peak impact force, C. Familiar shoe average loading rate, D. Unfamiliar shoe average loading rate, E. Familiar shoe active peak force, F. Unfamiliar shoe active peak force, G. Familiar shoe impulse, and H. Unfamiliar shoe impulse.
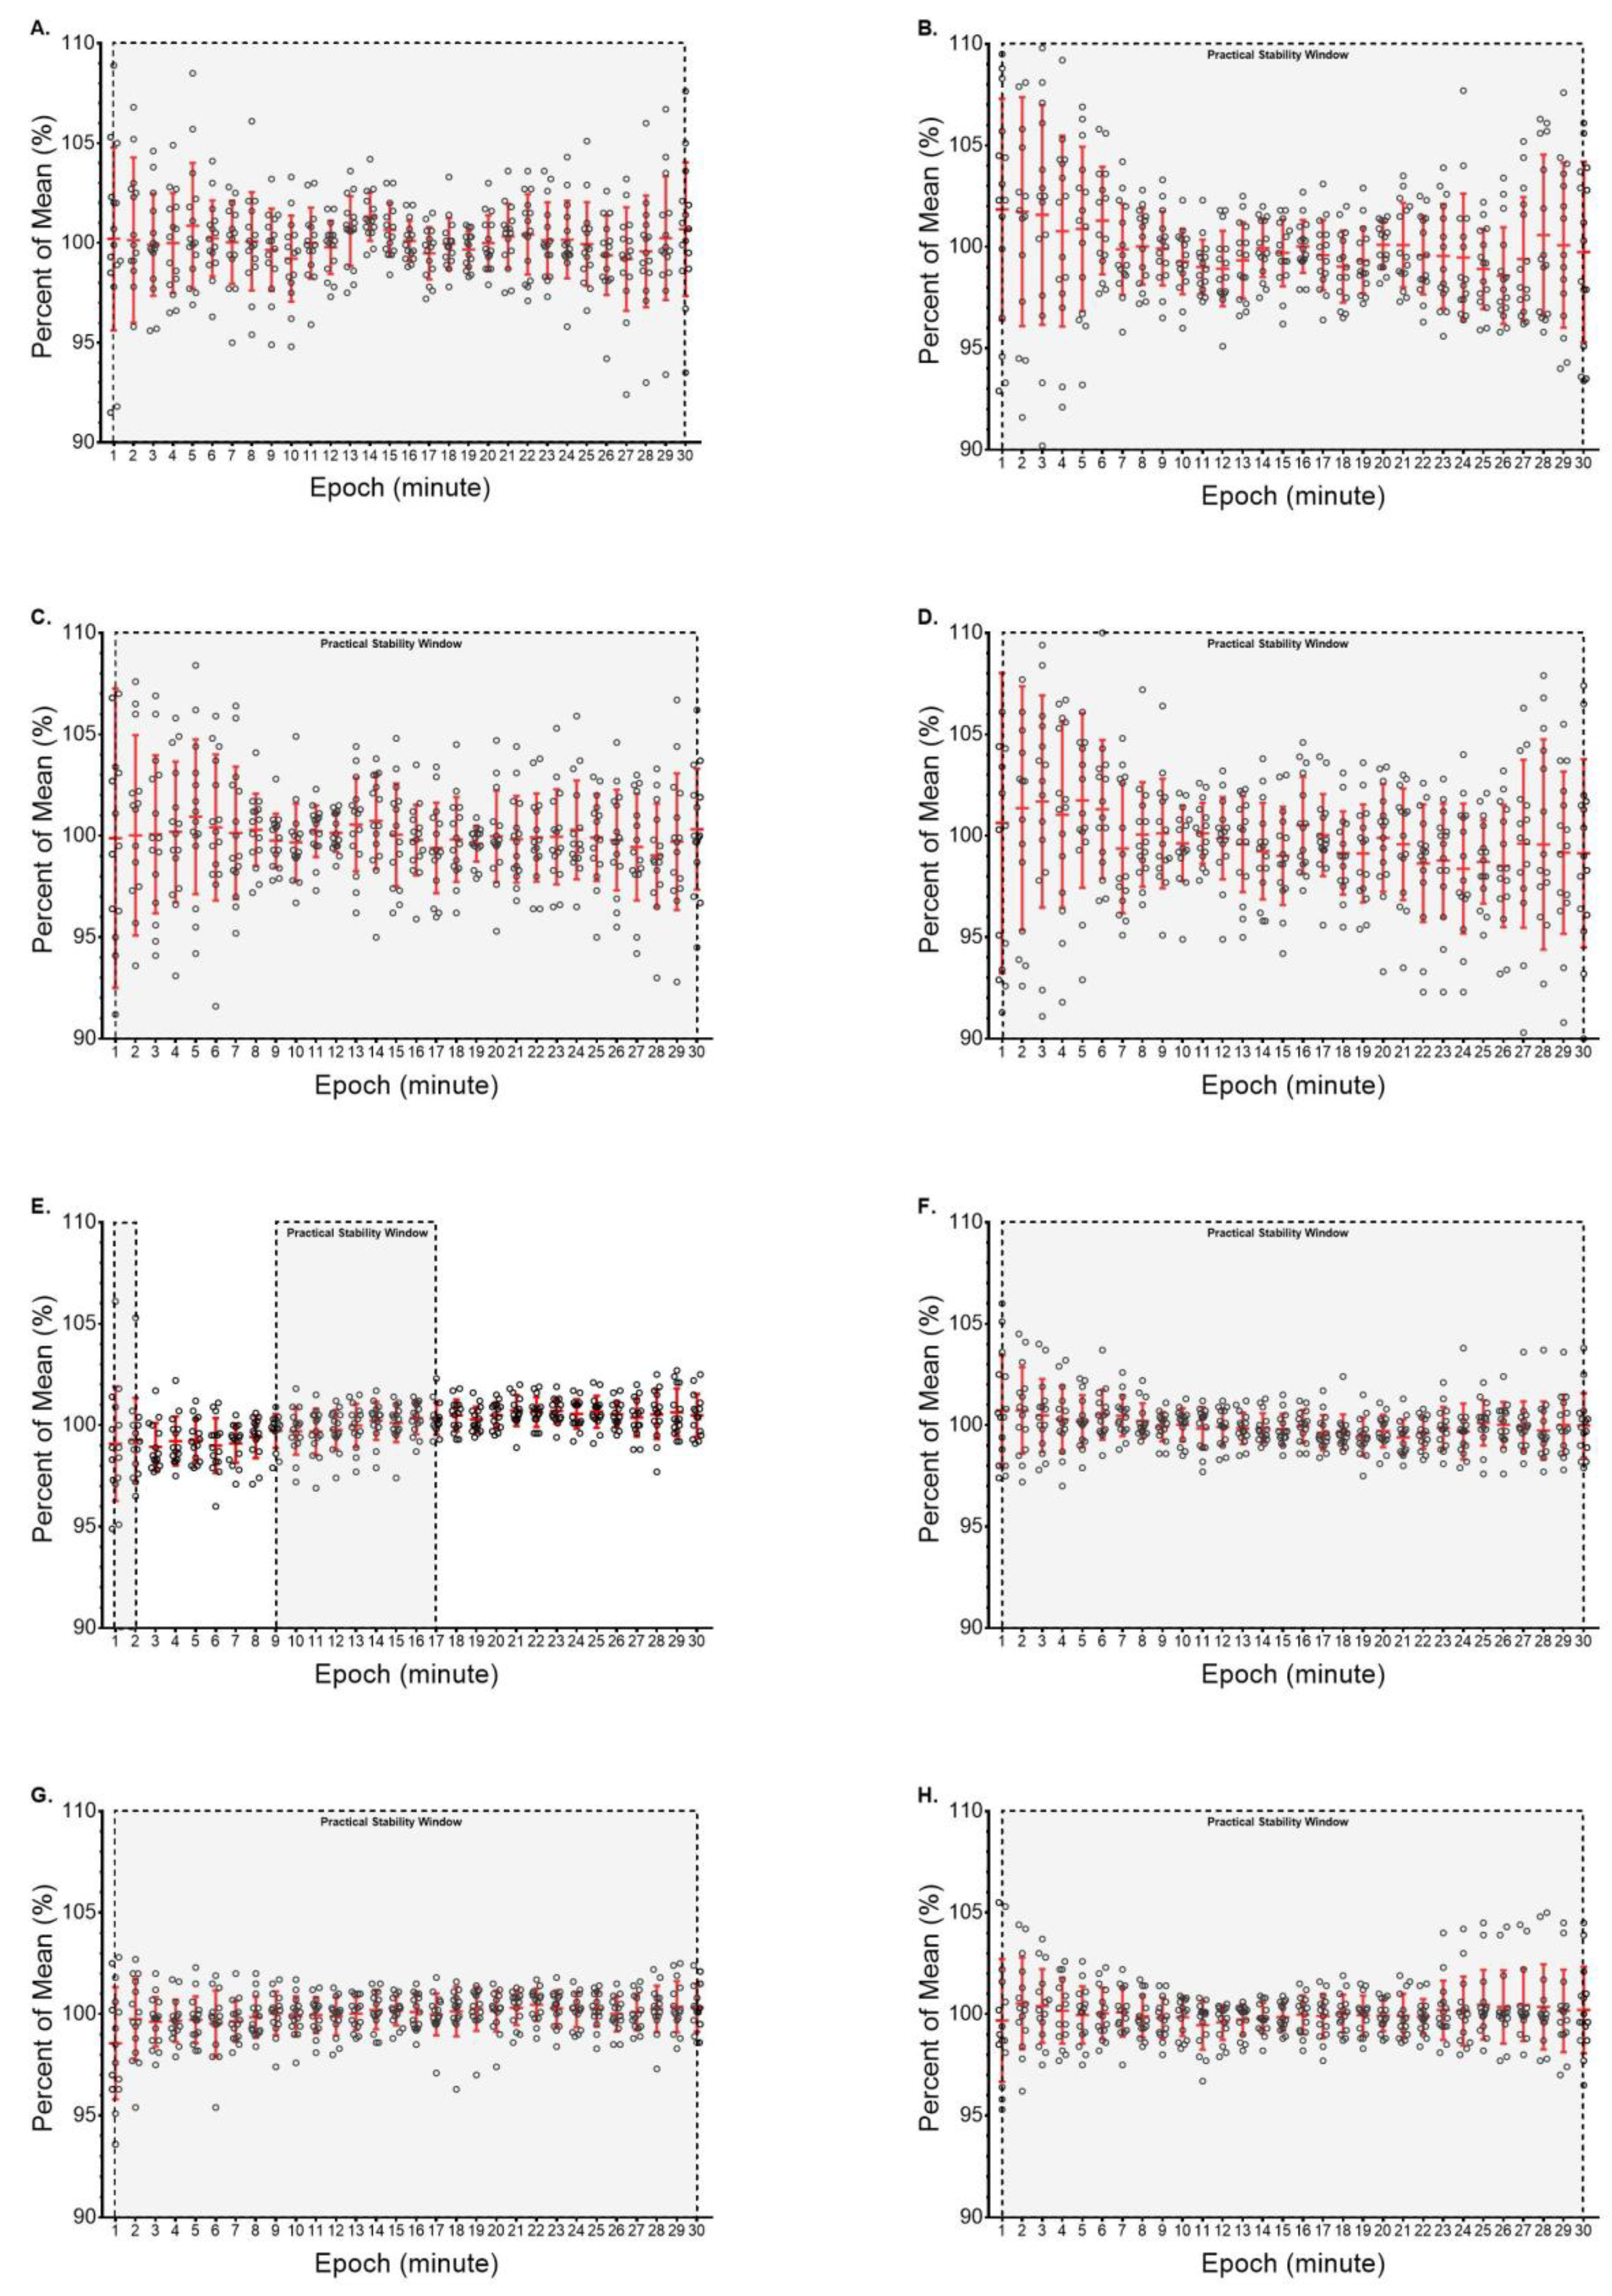
Table 2.
The DFA-α mean ± (SD), CV%, dataset normality test with the corresponding correct paired difference test results between conditions.
Table 2.
The DFA-α mean ± (SD), CV%, dataset normality test with the corresponding correct paired difference test results between conditions.
| Familiar Shoe | Unfamiliar Shoe |
Dependent Variable test (t- or W-; p-value) |
|||||
| Dependent Variable | Mean±SD | CV% |
Normality (K2, p-value) |
Mean±SD | CV% |
Normality (K2, p-value) |
|
| Stride Duration (s) | 0.85±0.09 | 10.3 | 0.269; 0.874 | 0.81±0.08 | 9.67 | 0.688; 0.709 | 0.029; 0.977 |
| Ground contact time (s) | 0.73±0.08 | 10.2 | 6.551; 0.038 | 0.74±0.05 | 6.51 | 11.560; 0.003 | 21; 0.541 |
| Swing time (s) | 0.84±0.08 | 9.9 | 0.075; 0.963 | 0.84±0.08 | 8.97 | 0.810; 0.667 | 0.001; 0.999 |
| Peak Impact Force (N) | 0.67±0.06 | 8.7 | 5.801; 0.055 | 0.69±0.07 | 10.0 | 2.884; 0.237 | 1.565; 0.140 |
| AVLR (N∙s-1) | 0.68±0.07 | 10.9 | 2.839; 0.242 | 0.69±0.07 | 9.7 | 1.823; 0.402 | 0.595; 0.561 |
| Active Peak Force (N) | 0.79±0.06 | 7.0 | 9.565; 0.008 | 0.77±0.06 | 7.3 | 9.320; 0.010 | -23; 0.502 |
| Impulse (N∙s) | 0.83±0.87 | 8.9 | 0.290; 0.865 | 0.83±0.07 | 7.9 | 0.767; 0.682 | 0.146; 0.886 |
Where data is displayed as italics one or more trial did not pass the normal distribution test. That specific data is highlighted in bold and statistical difference testing uses Wilcoxon’s Signed-Rank Test. Otherwise, all difference testing uses a paired t-test.
Disclaimer/Publisher’s Note: The statements, opinions and data contained in all publications are solely those of the individual author(s) and contributor(s) and not of MDPI and/or the editor(s). MDPI and/or the editor(s) disclaim responsibility for any injury to people or property resulting from any ideas, methods, instructions or products referred to in the content. |
© 2026 by the authors. Licensee MDPI, Basel, Switzerland. This article is an open access article distributed under the terms and conditions of the Creative Commons Attribution (CC BY) license (http://creativecommons.org/licenses/by/4.0/).
Copyright: This open access article is published under a Creative Commons CC BY 4.0 license, which permit the free download, distribution, and reuse, provided that the author and preprint are cited in any reuse.


