
Submitted:
27 January 2026
Posted:
28 January 2026
You are already at the latest version
Abstract
Assessing human embryo quality is a critical step in in vitro fertilization (IVF), yet traditional manual grading remains subjective and physically limited by the shallow depth-of-field in conventional microscopy. This study develops a novel "soft optical sensor" architecture that transforms standard optical microscopy into an automated, high-precision instrument for embryo quality assessment. The proposed system integrates two key computational innovations: 1) a multi-focal image fusion module that reconstructs lost morphological details from Z-stack focal planes, effectively creating a 3D-aware representation from 2D inputs; and 2) a retrieval-augmented generation (RAG) framework coupled with a Swin Transformer to provide both high-accuracy classification and explainable clinical rationales. Validated on a large-scale clinical dataset of 102,308 images (prior to augmentation), the system achieves a diagnostic accuracy of 94.11%. This performance surpasses standard single-plane analysis methods by over 10%, demonstrating the critical importance of fusing multi-focal data. Furthermore, the RAG module successfully grounds model predictions in standard ESHRE consensus guidelines, generating natural language explanations. The results demonstrate that this soft sensor approach significantly reduces inter-observer variability and offers a viable pathway for fully automated, transparent embryo evaluation in clinical settings.
Keywords:
soft sensor
; embryo grading
; data fusion
; vision transformer
; RAG
; explainable AI
; deep learning
1. Introduction and State of the Art
Infertility is a significant global health challenge, now affecting approximately 17.5% of the adult population worldwide [1]. While in vitro fertilization (IVF) serves as the primary treatment for these cases, the overall success rates remain suboptimal. A major bottleneck in this process is the selection of the single most viable embryo for transfer [2]. Traditionally, embryologists perform this selection by manually grading embryos using inverted optical microscopes. However, this manual approach is inherently subjective. It is susceptible to inter-observer variability—where two experts may grade the same embryo differently—and is limited by the physical constraints of standard optical systems [3,4]. One of the most fundamental limitations of conventional microscopy is the shallow depth of field. An embryo is a complex, spherical, three-dimensional structure, yet a standard microscope captures only a single thin focal plane at a time. This means critical morphological features—such as pronuclei, fragmentation, or blastomere symmetry—may be out of focus and invisible to the observer [5]. Consequently, manual grading often relies on a “partial view” of the biological reality.
To overcome these human limitations, the field of embryology has increasingly adopted Artificial Intelligence (AI) and computer vision. In the early stages, researchers employed classical machine learning methods, such as Support Vector Machines (SVM) or Logistic Regression. These systems, however, still required human experts to manually measure and input specific features. The introduction of Deep Learning revolutionized this landscape, establishing the current “State-of-the-Art” in the field. Convolutional Neural Networks (CNNs) demonstrated the ability to learn features directly from raw image pixels, bypassing the need for manual measurements. Prominent studies, such as the STORK framework by Khosravi et al. [7], achieved high accuracy in distinguishing between high- and low-quality blastocysts. Similarly, Tran et al. [8] showed that deep learning models trained on time-lapse videos could predict pregnancy outcomes with high reliability. More recently, the scientific community has shifted attention toward Vision Transformers (ViTs). Unlike CNNs, which focus on local pixels, ViTs analyze the global context of the image, allowing them to “understand” the entire embryo structure simultaneously. Studies by Kragh et al. [9] have demonstrated that these generalizable architectures can surpass traditional methods in accuracy. However, a distinct disconnect remains between these research metrics and clinical reality. Despite high reported accuracies in literature, the actual success rate of automated methods in improving live birth outcomes has remained static [10]. This disconnect exists for two main reasons. First, most current AI models still rely on 2D images, discarding the valuable 3D (Z-axis) information available in modern time-lapse incubators [6]. Second, deep learning models operate as “black boxes.” They output a probability score (e.g., “95% viable”) but cannot explain the biological rationale behind it. For a clinician to trust an automated diagnosis, they need a verifiable explanation, not just a number [11].
To address these limitations, we propose the design of a “Soft Optical Sensor.” This system integrates advanced computer vision with standard optical hardware to create an intelligent observer that mimics human reasoning. Our approach introduces two key innovations: 1) a multi-focus image fusion module that addresses the loss of 3D information by algorithmically fusing multiple focal planes into a single, high-fidelity image, and 2) a retrieval-augmented generation (RAG) framework. This framework bridges the “trust gap” by retrieving official medical guidelines to generate a natural-language text explaining the diagnosis, allowing the sensor to justify its decisions in medical terms.
2. Materials and Methods
2.1. System Architecture and Experimental Setup
The “soft optical sensor” is not a physical replacement for laboratory equipment but a computational extension of the standard IVF workstation. The system architecture, as illustrated in Figure 1, is designed to intercept the optical data stream from the incubator’s imaging system and process it through a multi-stage pipeline before presenting the final grading to the embryologist. The physical setup utilizes a commercial time-lapse monitoring system integrated directly into the culture incubator. This setup allows for continuous, non-invasive observation of embryo development while maintaining optimal environmental conditions (temperature, pH, and gas composition).
To capture the full volumetric structure of the embryo, the system utilizes an automated Z-stack acquisition protocol. Unlike standard single-plane imaging, the time-lapse system captures a sequence of images at discrete focal intervals ()along the vertical axis at regular time points. The focus motor automatically steps through the embryo in increments of 0.5–1.5 ensuring that every morphological feature—from the top of the zona pellucida to the inner cell mass—appears in focus in at least one frame of the sequence [12,13].
All computational experiments were executed on a mobile workstation (ASUS ROG Strix G16) equipped with an Intel Core Ultra 7 255HX processor and an NVIDIA GeForce RTX 5070 Ti GPU. This hardware configuration was selected to simulate a realistic deployment scenario where edge-computing capabilities are integrated directly into the clinical laboratory workflow. The software stack was built on Python 3.11.9 and PyTorch 2.10, utilizing CUDA 12.8 for GPU acceleration.
A critical definition for this study is the concept of “raw optical data.” In the context of this soft sensor, raw optical data refers to the unprocessed set of monochromatic intensity matrices obtained directly from the camera sensor at each Z-step . These images contain the fundamental optical information but are individually insufficient for diagnosis due to the optical system’s limited depth of field (DOF). In any single raw frame, only a thin slice of the embryo is sharp, while the remainder is obscured by blur. The proposed system fuses this raw optical data into a single, comprehensive representation, thereby functioning as a virtual sensor that “sees” more than the physical hardware alone permits.
The computational architecture processes this data in three distinct phases: (1) Pre-processing and Fusion, where the raw Z-stack is synthesized into an all-in-focus image; (2) Feature Extraction and Classification, performed by a Swin Transformer model [14]; and (3) Explainable Output Generation, driven by the RAG module which validates findings against established ESHRE consensus guidelines [15]. This hybrid hardware-software approach ensures that the final evaluation is based on the complete morphological reality of the embryo, addressing the limitations of 2D manual grading discussed in Section 1.
2.2. Optical Acquisition and Dataset Characteristics
Data acquisition was performed using a special non-invasive time-lapse incubator system. This device is crucial because it allows us to monitor the embryos continuously while keeping their environment (temperature, pH, and humidity) strictly stable, which is necessary for their survival. Figure 2 presents a matrix of representative optical microscopy images showing the seven distinct phenotypical classes used in the study’s dataset. The rows display sequential stages of early embryo development, ranging from the initial single-cell zygote through specific cleavage stages of two, three, and four cells. Additional categories include a “more” class for advanced cell divisions (morula/blastocyst), as well as “Not defined” and “empty” labels to account for ambiguous samples or artifacts like empty wells. These samples highlight the diverse morphological features and natural biological variety found in real clinical IVF cycles that the system is trained to classify.
A major problem with standard optical sensors in embryology is their limited “depth of field” [3]. This means they can only focus on a thin slice of the embryo at one time, making the rest look blurry. To fix this, our optical sensor was configured to capture data in “Z-stacks.” Instead of taking a single picture, the camera records a sequence of seven distinct focal planes at each time point. These planes are denoted as . This strategy ensures that we capture all critical details—such as the alignment of pronuclei, fragmentation, or the symmetry of cells—regardless of how deep they are located inside the embryo’s shell (zona pellucida) [13,14]. Figure 3 displays a sequential “Z-stack” of a single early-stage embryo captured at seven distinct focal depths, labelled from F-3 to F+3. The series illustrates the limited depth of field in standard microscopy, where the central image (F0) captures the equatorial plane, while the surrounding frames reveal features located above and below this point. As the focus shifts through the vertical axis, different cellular boundaries and textures become sharp while others blur, highlighting the complex three-dimensional structure of the embryo. This visual data demonstrates the raw input required by the soft sensor to reconstruct a complete, all-in-focus representation of the biological sample.
The dataset used in this study is extensive, containing a total of N = 102,308 multi-focal observations. It is important to note that these images were not taken from just one laboratory. They were collected from various IVF clinics around the world. This helps ensure that our results are valid for different hospital environments and patient groups. The data reflects the natural biological variety found in real clinical IVF cycles, as shown in Figure 2. The distribution of embryo stages in our dataset is as follows:
- Early Cleavage: 1-cell (19.2%), 2-cells (18.5%), 3-cells (4.7%), and 4-cells (17.4%).
- Advanced Stages: Embryos with more cells account for 21.5%.
- Control/Artifacts: Empty wells (7.6%) and undefined images (11.0%).
To ensure our testing was rigorous and fair, we split the dataset using a random sampling method into three isolated groups: Training (68%), Validation (12%), and a strictly separate Test set (20%).
2.3. Multi-Focus Image Fusion Algorithms
The central engineering challenge of this study is the fusion of volumetric data into a single 2D representation. The seven raw images collected at different focal depths contain complementary information. Features like the pronuclei might be sharp in the bottom layer, while fragmentation is visible only in the top layer. Merging these into one “super-image” is critical for the accuracy of the downstream AI grading. To determine the most effective strategy for our sensor, we implemented and rigorously compared four distinct image fusion architectures, ranging from classical mathematical transforms to advanced Deep Learning models.
We established our baseline using the Laplacian pyramid (LP) method, a classical algorithm that selects pixels based on their local sharpness or “energy” [15]. The process works by decomposing each of the seven source images into a pyramid of layers. Each layer acts like a filter, separating the image into different scales of detail. For every pixel at every level of this pyramid, the algorithm compares the seven inputs and selects the coefficient with the maximum absolute value. This rule ensures that the sharpest detail at any given location is preserved. Finally, the fused pyramid is collapsed to reconstruct the final single-channel image. Because this method mathematically maximizes local contrast, we treat its output as the “Ground Truth” ( ) for training our deep learning models.
We trained and evaluated three deep neural network models based on the U-Net architecture [16]. The training objective for all these models was to minimize the mean squared error (MSE) between the network’s predicted output ( )and the Laplacian-fused ground truth (). The formula for this loss function is:
The first architecture (Model 1), UNet-DC, represents a high-capacity model adhering to the standard U-Net design. It employs double convolutional blocks (Convolution-BatchNorm-ReLU×2) at each stage of the network. The encoder systematically down-samples the input using max-pooling to extract deep, hierarchical features, effectively capturing the image context. The decoder subsequently up-samples these features, combining them with high-resolution details from the encoder via skip connections. The final output utilizes a sigmoid activation function to constrain pixel values within the valid range of [0,1], maximizing the capture of feature detail.
The second architecture (Model 2), UNet-SC, is a lightweight variant engineered for processing speed. In this design, the standard double blocks are replaced by single convolutional blocks (Conv-BatchNorm-ReLU). This architectural simplification significantly reduces the parameter count and computational load. This model was included to test the hypothesis that a simplified network can achieve fusion quality comparable to heavier models while offering superior latency—a critical requirement for real-time clinical applications where high throughput is necessary.
The third architecture (Model 3), AFU-Net, integrates a global attention mechanism at the network’s bottleneck. While the encoder utilizes the resource-efficient single-convolution structure to conserve resources, the bottleneck employs layer normalization and a convolutional attention mechanism. This allows the network to weigh feature importance globally across the entire image context, rather than relying solely on local neighbourhoods. This design aims to optimize the selection of in-focus regions prior to decoding, theoretically improving the fusion of complex textures such as the zona pellucida.
The three proposed neural network architectures (UNet-DC, UNet-SC, and AFU-Net) were benchmarked against the classical Laplacian pyramid baseline, in order to determine the most effective computational strategy for the soft sensor. The Laplacian method served as the established “ground truth” for visual quality, providing a target for high-fidelity fusion but suffering from inherent processing delays that limit real-time applicability. As visualized in the architectural schematic of Figure 4, the primary objective was to train these U-Net-based models to replicate the intricate feature selection capability of the Laplacian algorithm using a data-driven approach. The diagram illustrates a U-Net-based neural network architecture designed to fuse a seven-channel stack of multi-focal images into a single composite representation. The input data flows through a contracting encoder path consisting of three convolutional blocks that progressively down-sample the image while increasing feature depth from 64 to 256 filters. A central bottleneck layer with 512 filters processes the most abstract latent features before passing them to the expansive decoder path. To preserve fine morphological details, skip connections link the encoder layers directly to the corresponding decoder blocks, merging high-resolution spatial information with up-sampled features. The pipeline concludes with a final convolution that reconstructs a single, high-fidelity output image where the salient details from all focal planes are combined.
2.4. Automated Region of Interest (ROI) Localization
The original images often contain background noise, plastic well edges, or debris that could confuse the AI. To fix this, we developed a “virtual probe” algorithm that automatically finds and crops the region of interest of the embryo. This approach mimics how a human eye searches for an object. Firstly, the whole area is scanned to find a candidate shape, and then the sharp edges of embryo is located using different focal planes [13].
The proposed algorithm initiates with a coarse search utilizing a Haar feature-based cascade classifier. This machine learning technique is trained to identify the specific circular morphology of an embryo using a dataset comprising thousands of positive samples and negative samples containing artifacts like empty wells or bubbles. This training enables the system to rapidly scan input images and generate approximate bounding boxes around candidate objects. Subsequently, a fine localization step utilizing a radial gradient transform is applied to detect the precise physical boundary of the zona pellucida. This detection relies on the calculation of the gradient magnitude to quantify pixel intensity variations. The magnitude G at each pixel (x, y) is calculated using the formula (2).
where, Gx and Gy measure the brightness changes in the horizontal and vertical directions. The system draws imaginary lines radiating outward from the centre of the rough box and checks the gradient along these lines. The point where the brightness jumps the most (the highest value) marks the true edge of the embryo. Finally, the system crops the image to this precise boundary and resizes it to a standard pixel square. This ensures that the AI model receives a clean, consistent picture every time, free from distracting background noise.
2.5. Vision Transformer Classification and RAG Explanation
Once the embryo has been fused into a single high-fidelity image and precisely cropped to pixels, it enters the final stage of the soft sensor pipeline. This stage transforms the raw visual data into actionable clinical knowledge. The process consists of two sequential steps: 1) classification, utilizing a vision transformer architecture (see Figure 5) to assign a diagnostic grade (Input: Image Output: Class Label), and 2) explanation, employing a RAG pipeline (see Figure 6) to justify that grade using medical evidence (Input: Class Label Output: Text Report).
The selection of the classification engine was driven by a benchmarking process designed to identify the most effective architecture for this specific application. Instead of defaulting to a standard model, we conducted a structural comparison of three distinct deep learning paradigms to isolate the optimal balance of accuracy and efficiency [10]. The ConvNeXt-Tiny architecture was selected to represent the state-of-the-art in convolutional neural networks. As a modernized CNN, it incorporates larger kernels and streamlined layers designed to challenge transformer-based architectures. Its inclusion allows us to test whether a purely convolutional approach can achieve parity with attention-based models while retaining superior computational efficiency. The ViT-Base architecture serves as the high-capacity benchmark for our study and represents the original vision transformer design. It effectively captures long-range dependencies that are often missed by local operations by processing the image globally through self-attention. We included this computationally intensive model to determine if a massive, resource-heavy architecture is strictly necessary to achieve high diagnostic accuracy. The Swin-Tiny architecture was selected as the proposed solution to balance local feature extraction with global awareness. By implementing a shifted window mechanism, this model captures fine details analogous to CNNs while retaining the contextual understanding of Transformers and achieves this duality with significantly lower computational overhead than the ViT-Base. It offers the best balance, it approaches the high accuracy of the massive ViT-Base but operates with the speed and efficiency closer to the ConvNeXt-Tiny, making it ideal for clinical deployment. In a standard transformer, the image is divided into fixed squares (patches), and the model processes each square independently. The Swin transformer introduces a hierarchical architecture with a shifted window mechanism. In the first layer, the model analyses tiny pixel patches to understand fine textures like cytoplasmic granularity. In the next layer, the window “shifts” and zooms out, allowing the model to see how these textures connect to form larger structures like the zona pellucida.
Mathematically, this attention mechanism is computed using the Self-Attention formula (3) within local windows. For a given window containing patches, the attention is calculated as:
where, , and are the Query, Key, and Value matrices, which represent the image features, d is the dimension of the key, used to scale the values and B is the Relative position bias. This term is important for embryology because it tells the model about the spatial relationship between pixels, knowing that the nucleus is inside the cell, not floating randomly. The model processes the image through four hierarchical stages. In each stage, “Patch Merging” layers reduce the resolution (down sampling) while increasing the feature depth. This creates a pyramid of features - the early layers capture high-resolution details (granulation), while the deeper layers capture low-resolution semantic information (blastocyst expansion grade). The final output is a probability vector that classifies the embryo into discrete quality grades.
A major criticism of AI in medicine is the “Black Box” problem, where clinicians hesitate to trust a system that outputs a score without an explanation. To address this, we integrated a retrieval-augmented generation (RAG) module “on top” of the classifier (see Figure 5). The input to this module is the discrete classification token generated by the Swin transformer (e.g., “Grade 1: 4-cell stage”). The output is a generated natural language report justifying this classification. The process functions as a semantic translator involving two key components, such as, vectorized knowledge base and generative synthesis (Mistral-7B).
The semantic knowledge base, a critical component of the RAG system, was constructed by ingesting and vectorizing a curated collection of authoritative scientific literature and clinical guidelines in the field of reproductive medicine. This process ensures that the generated explanations are grounded in peer-reviewed science rather than hallucinated by the language model. The core documents selected for this database include foundational studies on embryo scoring, modern updates to international consensus, and recent reviews on AI applications in IVF. Figure 6 illustrates the hybrid Neuro-Symbolic inference pipeline designed to generate explainable clinical reports. The process begins with the “Neuro Component,” where the Swin-Tiny model analyzes the raw microscopy image to output a discrete predicted label, acting as a symbolic key. This key triggers the “Symbolic RAG Component,” utilizing a vector database to retrieve specific medical knowledge and context relevant to the identified embryo stage. Finally, an LLM inference engine synthesizes the classification token with the retrieved guidelines to produce a standardized, text-based final protocol.
Key sources include the Istanbul Consensus Update [15], which provides the standardized terminology and assessment criteria used globally. To capture the nuances of early development, we incorporated detailed studies on pronuclear scoring [16], zygote evaluation [16], and specific morphological grading systems used in clinical settings like the Ottawa Fertility Centre [11]. For advanced insights into blastocyst potential, we included research utilizing AI for implantation prediction [7] and comprehensive reviews on machine learning in IVF [11]. Additionally, to enable the system to explain the relevance of time-lapse parameters, we integrated specific studies on morphokinetics [18]. For decision-making regarding embryo transfer limits, we included the official ASRM Committee Opinion [19]. Finally, to ensure the explanations are accessible to a broader audience, educational materials explaining embryo grading systems and online resources from reputable fertility centers were also vectorized [20].
These dense medical texts were then segmented into smaller, coherent chunks to preserve semantic meaning. Each chunk was embedded into a high-dimensional vector space using the nomic-embed-text model. This process converts text into numerical vectors where similar concepts are located close to each other. We validated the quality of this vector space using UMAP visualization, which confirmed that different developmental stages (e.g., “2-cell stage” vs. “blastocyst”) formed distinct, separable semantic clusters. These vectors were then stored in a ChromaDB vector store for efficient retrieval.
Generating the Clinical Report When the Swin Transformer predicts a class (e.g., “4-cell stage”), this prediction acts as a query for the RAG system. The system searches the ChromaDB store to retrieve the most relevant scientific context—for example, the specific ESHRE criteria defining a “good quality” 4-cell embryo. Finally, a Large Language Model (Mistral-7B) acts as the synthesizer. It combines the visual prediction from the Swin Transformer with the retrieved scientific text to generate a natural language explanation. This results in a comprehensive report that provides not just the diagnosis, but the clinical rationale behind it, effectively solving the “black box” problem of traditional AI.
3. Results
This section presents a comprehensive evaluation of the proposed soft sensor pipeline, spanning from low-level signal processing to high-level clinical decision-making. First, we quantify the performance of the multi-focal image fusion algorithms, analyzing their ability to recover 3D morphological details while maintaining the low latency required for real-time operation. Subsequently, we validate the diagnostic precision of the Swin transformer classification engine against established baselines and qualitatively assess the retrieval-augmented generation (RAG) module’s capacity to produce verifiable, guideline-compliant explanations.
3.1. Multi-Focus Fusion Quality
We assessed the sensor’s capacity to function as an “all-in-focus” instrument by comparing the classical Laplacian Pyramid (LP) with three deep learning architectures: UNet-DC, UNet-SC, and AFU-Net. The primary criteria for success were twofold: (1) visual fidelity—the preservation of distinct biological features (zona pellucida, blastomeres) without artifacts, and (2) computational latency—the speed at which the sensor can generate a result. The most critical test of any image fusion system is the visual quality evaluation of its output. Figure 7 presents a side-by-side comparison of the raw input data (Z-stack) versus the fused outputs. As illustrated in the figure, a single raw focal plane (e.g., ) often suffers from significant “Depth of Field” blur; while the equatorial region of the embryo is sharp, the upper and lower poles are obscured. The classical Laplacian pyramid method (LP) successfully merges these planes but introduces a characteristic “softness” or slight haziness around high-contrast edges like the zona pellucida. In contrast, the deep learning models produce noticeably sharper results. The UNet-SC, DC and AFU-Net outputs demonstrate superior edge definition. Specifically, the cell membranes of the blastomeres are rendered with high contrast, and fine details such as fragmentation are clearly visible and distinct from the background. This visual superiority suggests that the neural networks have learned to semantically prioritize biological structures over simple pixel intensity, effectively “cleaning” the image while fusing it.
Figure 8 presents a violin plot comparison of the average gradient (AG) values across four distinct image fusion methodologies to evaluate output sharpness. The vertical axis represents the AG score, where a higher numerical value directly correlates with increased edge definition and texture clarity. The leftmost plot illustrates the performance of the classical LP baseline, which exhibits the lowest distribution of gradient scores, clustered tightly below an AG value of 10. In sharp contrast, all three deep learning architectures (UNet-DC, UNet-SC, and AFU-Net) demonstrate a shift upward in the graph, indicating superior retention of high-frequency details . The UNet-DC model displays a consistent performance with a compact distribution density centered approximately around an AG value of 30. Similarly, the lightweight UNet-SC model achieves a comparable distribution range, proving that simplified architectures can effectively maintain image sharpness without heavy computation. The AFU-Net exhibits the widest distribution spread and reaches the highest peak values above 40, reflecting its advanced ability to capture fine textures through global attention mechanisms. The varying widths of the violin shapes represent the frequency density of the test images at specific sharpness levels. The significant vertical gap between the classical baseline and the neural models quantitatively confirms that the learning-based approaches avoid the “smoothing” artifacts typical of standard mathematical fusion.
This visualization supports the study’s finding that neural networks act as effective denoising filters, producing images that are biologically more distinct than the ground truth used for training. Overall, the plot validates the selection of deep learning models for the soft sensor, as they consistently deliver the high-fidelity inputs necessary for accurate downstream classification.
The signal processing latency was evaluated in the our research, where main results are shown in the Figure 9. It quantifies the computational efficiency of the different fusion algorithms by displaying the average processing time required to fuse a single seven-image Z-stack. The classical LP baseline serves as a reference point with a latency of approximately 30.02 ms, setting the threshold for standard processing speeds. The complex UNet-DC model proves to be the slowest architecture, requiring 39.26 ms, which exceeds the typical 33 ms limit for real-time video frame processing. Conversely, the proposed lightweight UNet-SC architecture demonstrates a efficiency advantage, achieving the lowest latency of just 7.11 ms. This performance is roughly four times faster than the classical baseline and significantly outperforms the attention-enhanced AFU-Net, which clocked in at 11.57 ms. Consequently, the UNet-SC is identified as the optimal engine for the sensor, providing the necessary speed for continuous, real-time clinical monitoring.
3.2. Classification Performance
Following the optimization of the image fusion module, the classification capabilities of the proposed model were evaluated on the independent test set (N=20,561 images). To verify the robustness of our proposed method, we benchmarked the Swin-Tiny model against two distinct architectural baselines, such as, a modernized CNN (ConvNeXt-Tiny) and a standard Vision transformer (ViT-Base). This specific selection allows us to isolate the effects of inductive bias and model capacity on embryo grading performance. Table 1 summarizes the performance metrics for the three evaluated models. The results demonstrate a clear trade-off between architectural complexity and diagnostic efficiency.
The standard Vision transformer (ViT-Base) achieved the highest test accuracy (96.55%) and F1-scores, particularly excelling in the difficult “3-cell” class (F1=0.83). While its raw latency (6.86 ms) on the high-performance RTX 5070 GPU is impressive, this metric is deceptive for edge deployment. The model’s massive parameter count (85.8 M) and high computational demand (16.87 G FLOPs) make it unsuitable for embedded systems in standard clinical microscopes, where power consumption and thermal dissipation are critical constraints. It serves as a theoretical “upper bound” for accuracy but is impractical for the target hardware. ConvNeXt-Tiny is efficiency leader, boasting the lowest FLOPs (1.46 G) and fastest latency (3.03 ms). However, its diagnostic performance lagged significantly behind the transformer-based models. It achieved the lowest accuracy (91.44%) and struggled with transitional developmental stages, evidenced by a poor F1-score of 0.637 for the 3-cell class. This confirms that purely convolutional architectures, even with modern optimizations, lack the global context awareness needed to reliably resolve ambiguous morphological features. The proposed Swin-Tiny model targets the ideal balance for the “Soft Sensor.” It achieved a robust accuracy of 94.12%, outperforming the CNN baseline by nearly 3%. While slightly slower than the CNN (7.38 ms vs 3.03 ms), it remains well within the real-time processing window (<33 ms for video). It offers a high reduction in computational weight compared to ViT-Base (4.51 G FLOPs vs 16.87 G), making it feasible for long-term operation on edge devices without overheating. The achievement of a strong F1-score of 0.73 on the elusive 3-cell category confirms that the architecture effectively unifies fine-grained detail with broader structural context.
A central hypothesis of this study was that single-plane microscopy is insufficient for automated grading. To quantify this, we trained the selected Swin-Tiny model on non-fused, single-plane images (Focus Plane )and compared the results to our fused pipeline.
The results shown in Table 2 indicate a positive performance increase. The fusion process increased diagnostic accuracy by 9.44%. Mechanistically, this improvement is driven by the recovery of “lost” features. In single-plane images, fragmentation located at the top of the embryo (plane ) was often invisible, leading the model to classify the embryo as “High Quality.” The fused image incorporated these defects, allowing the model to correctly downgrade the embryo to “Poor Quality,” thereby reducing false positives.
The robustness of the selected Swin-Tiny model is further evidenced by its training dynamics and per-class performance. The training and validation loss curves converged rapidly within the first 10 epochs and remained tightly coupled, indicating no significant overfitting despite the complexity of the task (see Figure 10). The error analysis (see Figure 11) reveals that the model’s mistakes are clinically benign. The vast majority of misclassifications occurred between immediately adjacent developmental stages (e.g., predicting “2-cell” when the ground truth was “early 3-cell”). “Catastrophic” errors—such as confusing a 1-cell Zygote with a Blastocyst—occurred in less than 0.1% of cases.
Figure 11 plots the per-class F1-score trajectories for the Swin-Tiny model over the course of 25 training epochs to monitor validation performance . The graph demonstrates exceptional sensitivity for distinct morphological milestones, with the “empty,” “1cell,” and “2cells” classes rapidly converging to near-perfect scores above 0.95 within the first five epochs. A significant performance divergence is observed for the “3cells” class (green line), which exhibits a much slower learning curve and eventually plateaus at a lower maximum value of approximately 0.72. This distinct lag quantitatively reflects the biological complexity of the 3-cell stage, which is a transient phase often difficult to distinguish from late 2-cell or early 4-cell stages. Despite this specific outlier, the weighted average metric (cyan line) stabilizes above 0.90, confirming that the model maintains high overall diagnostic reliability across the diverse dataset.
Figure 12 displays the normalized confusion matrix for the Swin-Tiny model evaluated on the independent test set, illustrating the alignment between predicted and true labels . The matrix reveals exceptional diagnostic precision for distinct morphological categories, with the “empty” and “Not defined” classes achieving near-perfect accuracy scores of 1.00 and 0.99, respectively. High performance is also maintained across the primary cleavage stages, where “1cell,” “2cells,” and “4cells” embryos are correctly classified in over 94% of cases. A notable deviation occurs in the “3cells” class, which shows a lower accuracy of 0.68, with a significant portion (0.28) being misclassified as “4cells.” This specific error pattern is concentrated among biologically adjacent stages, suggesting that misclassifications are driven by the natural ambiguity of transitional developmental phases rather than random model failure. Furthermore, the matrix demonstrates a high clinical safety profile, as “catastrophic” errors between disparate developmental points, such as, confusing a single-cell zygote with an advanced “more” stage embryo are virtually non-existent (0.00). The advanced “more” category, which encompasses morulae and blastocysts, achieves a robust true positive rate of 0.96, with the only notable confusion occurring with the immediately preceding 4-cell stage (0.04). Finally, the high precision of the “Not defined” class (0.99) ensures that the system effectively segregates artifacts and non-viable samples without accidentally discarding potentially viable embryos due to false negative classification.
3.3. RAG-Based Explainability
We conducted a qualitative assessment of the RAG framework to evaluate its potential to overcome the transparency limitations of standard deep learning. Opaque probability scores do not offer insight into underlying biological features, they impede clinical trust. Therefore, our evaluation focused on the system’s ability to generate the clear, interpretable rationales required to mitigate liability concerns. The potential of RAG lies in its ability to convert stochastic probabilities into deterministic, rule-based logic. By grounding the model’s output in the ESHRE Istanbul Consensus, the system effectively “shows its work.” Instead of generating text based solely on statistical patterns (which can lead to hallucinations in standard Large Language Models), the RAG architecture is constrained to retrieve and synthesize only verified clinical definitions.
The application of RAG in this domain offers a dual benefit of standardization and safety. Human embryologists often use subjective or variable terminology. The RAG system forces the output to strictly adhere to international consensus language, ensuring that every report uses the exact same definitions for “fragmentation” or “symmetry” regardless of the clinic. In our experiments, a standard “off-the-shelf” LLM (like a generic Mistral-7B without RAG) relies purely on its pre-trained internal weights to generate text. This can lead to “hallucinations,” where the model invents plausible-sounding but biologically incorrect features, such as describing an “inner cell mass” in a 2-cell embryo. By contrast, our RAG system first retrieves the specific medical document for “2-cell stage.” Since this retrieved text contains no mention of an inner cell mass, the model is effectively “constrained” by the facts, preventing it from generating biologically impossible descriptions. This “guardrail” mechanism is essential for the safe deployment of generative AI in healthcare.
We performed a qualitative validation of the semantic knowledge base to confirm the accuracy of the retrieval mechanism. As illustrated in Figure 13, the UMAP projection reveals that documents corresponding to different embryo stages naturally segregate into clearly defined groups. This semantic clustering proves that the embedding model effectively distinguishes between concepts like “2-cell” and “Blastocyst,” ensuring that the system accesses only the appropriate medical literature for a given diagnosis. Figure 13 presents a UMAP visualization of the semantic knowledge base, mapping N=3,195 vectorized text segments into a two-dimensional space clustered by K-means (k=10). Each distinct color represents a specific semantic cluster, corresponding to different embryo developmental stages or clinical concepts defined in the medical literature. The plot reveals a clear spatial separation between these groups, forming isolated “islands” rather than an overlapping cloud, which confirms that the embedding model has successfully encoded the distinct semantic boundaries between biological categories. This structural segregation is critical for the RAG system, as it ensures that queries for a specific stage (e.g., “4-cell”) retrieve only the relevant, cluster-specific medical guidelines without interference from unrelated concepts.
A successful example of this pipeline in action is presented in Figure 14, where the system overlays a generated explanation onto a 4-cell embryo image. The generated report follows a structured logic:
- Observation - Identifies the stage (“Detected features typical of cleavage stage”)
- Confidence - States the certainty level (“High confidence in cell count”).
- Consensus Alignment -Explicitly references the standard (“Aligns with consensus criteria for Day 2... blastomere symmetry”). This structured output demonstrates that the soft sensor successfully bridges the gap between raw pixel data and actionable clinical knowledge.
Figure 14 illustrates the final output of the soft sensor pipeline, pairing a visual snapshot of a 4-cell embryo with a comprehensive, AI-generated clinical report . The “VI-T Classification Summary” at the top verifies the diagnostic performance, explicitly matching the predicted grade of “4cells” to the ground truth with a specific confidence metric. Following this, the retrieval-augmented generation (RAG) module provides a structured “Morphological Assessment,” categorizing the embryo as Grade A based on standard cleavage stage criteria. A “Detailed Justification” section synthesizes specific biological observations, citing “perfect symmetry” and “minimal fragmentation” to explain the classification in natural language rather than simple probability scores. The report concludes with a clinical “Outcome & Prognosis,” translating the morphological data into a prediction of implantation potential, thus effectively bridging the gap between raw pixel analysis and actionable medical guidance.
4. Discussion
The development of the proposed “Soft Optical Sensor” addresses three critical challenges in modern reproductive medicine: the subjectivity of human grading, the inadequacy of 2D microscopy for 3D biological subjects, and the “black box” nature of AI diagnostics. By synthesizing multi-focal image fusion, transformer-based classification, and retrieval-augmented generation (RAG), this study demonstrates a viable pathway toward fully automated, objective, and transparent embryo evaluation.
Clinical Implications and Real-Practice Potential. The most immediate clinical benefit of this system is the standardization of care. Current manual grading is plagued by inter-observer variability, where the chance of an embryo being selected for transfer often depends on which embryologist is on duty. Our results show that the Swin-Tiny model achieves a consistent diagnostic accuracy of 94.12%, effectively acting as an “expert consensus” that never suffers from performance degradation. Furthermore, the integration of the RAG module allows this tool to function not just as a classifier, but as a digital assistant. By generating reports grounded in the ESHRE Istanbul Consensus, the system automates the documentation burden, potentially saving embryologists hours of administrative work per day. Ideally, this sensor would be integrated directly into time-lapse incubators, providing real-time quality control alerts without requiring the removal of embryos from their stable culture environment.
Limitations of the Research. Despite these promising results, several limitations must be acknowledged. First, the study relies on retrospective data. While the dataset is large (N=102,308) and multi-centric, retrospective validation cannot fully replicate the pressures of a live clinical workflow where real-time decisions affect patient outcomes. Second, the current model analyzes static images derived from Z-stacks. Although fusion recovers 3D spatial details, it misses the temporal “morphokinetic” parameters (e.g., the exact speed of cell division) which are known predictors of viability. Finally, a hardware constraint was identified in the explanation module. While visual classification runs in real-time (~7.4 ms), generating detailed text reports on standard edge hardware (CPUs) remains slow (~10 seconds/report). This latency currently necessitates a hybrid deployment where text generation is offloaded to a local server, preventing a fully standalone “all-in-one” microscope solution.
Future Work and Research Directions Future research will focus on overcoming these barriers. The next logical step is the development of a Video Swin Transformer capable of ingesting continuous 4D data (3D space + Time). This would allow the system to assess developmental trajectories, not just static states. Additionally, we aim to optimize the RAG component for edge deployment by investigating Neural Processing Units (NPUs) and highly quantized Small Language Models (SLMs). Reducing text generation latency to under 1 second would enable a truly autonomous device. Ultimately, the validation of this technology requires a prospective randomized controlled trial (RCT) to definitively prove that embryos selected by this soft sensor result in higher pregnancy rates than those selected by human grading alone.
4.1. The Regularization Effect in Deep Learning Fusion
A counter-intuitive finding of this study is that the deep learning models (UNet-SC and AFU-Net) achieved higher average gradient scores than the Laplacian Pyramid baseline they were trained to replicate (Figure 7). This result warrants specific technical explanation given that the models were optimized using MSE. We hypothesize that this “sharpening” effect is a result of the implicit regularization inherent in convolutional neural networks. The classical Laplacian Pyramid method operates on a strict pixel-wise maximization rule, selecting coefficients with the highest local energy. While this preserves detail, it also preserves high-frequency sensor noise and introduces “soft” halo artifacts around high-contrast transitions, such as the zona pellucida. In contrast, the U-Net architectures do not process pixels in isolation but learn hierarchical feature representations. During training, the network effectively functions as a denoising autoencoder; it learns to reconstruct the consistent biological structures (e.g., cell membranes, cleavage furrows) which represent the dominant signal, while failing to replicate the stochastic noise and fusion artifacts present in the Laplacian “Ground Truth.” By filtering out these inconsistencies, the UNet-SC produces a “cleaner” image where gradients are defined by biological boundaries rather than optical noise. This results in the observed higher average gradient scores and superior visual edge definition, suggesting that the AI model has successfully generalized the logic of fusion rather than merely memorizing the pixels of the baseline.
5. Conclusions
This study presents a completed design for a “Soft Optical Sensor” dedicated to human embryo quality evaluation. By moving beyond traditional single-plane microscopy, we have demonstrated that fusing multi-focal Z-stack images significantly enhances diagnostic precision. Specifically, our method increased classification accuracy by over 9.4% compared to standard approaches, achieving a final accuracy of 94.12%.
Crucially, this system operates in real-time on standard hardware, making it practical for clinical use. Beyond simple accuracy, the integration of the RAG (Retrieval-Augmented Generation) module solves the problem of “blind trust” in AI. By providing clear, text-based explanations grounded in official medical guidelines, the sensor acts as a transparent partner to the embryologist rather than a mysterious black box. This technology offers a scalable, standardized solution to reduce human error and improve outcomes in IVF laboratories worldwide.
Author Contributions
Conceptualization, R.V., J.D. and E.D.; methodology, A.K.G.; software, V.R.; validation, A.M., J.D.; formal analysis, A.S.; investigation, V.R.; resources, E.D. and A.K.G.; writ-ing—original draft preparation, J.D and V.R.; writing—review and editing, all authors; visualization, A.K.G.; supervision, E.D. All authors have read and agreed to the published version of the manuscript.
Funding
This research was co-funded by the European Union under Horizon Europe programme grant agreement No. 101059903; and by the European Union funds for the period 2021-2027 and the state budget of the Republic of Lithuania financial agreement Nr. 10-042-P-0001.
Institutional Review Board Statement
The study was approved by the Kaunas Regional Research Ethics Committee of Biomedicine, Lithuania (No. BE-2-51).
Data Availability Statement
The data presented in this study are available on request from the corresponding author.
Conflicts of Interest
The authors declare no conflict of interest.
Abbreviations
The following abbreviations are used in this manuscript:
| IVF | In Vitro Fertilization |
| RAG | Retrieval-Augmented Generation |
| ViT | Vision Transformer |
| CNN | Convolutional Neural Network |
| ROI | Region of Interest |
| MSE | Mean Squared Error |
| AG | Average Gradient |
| ESHRE | European Society of Human Reproduction and Embryology |
| FP | Focal Plane |
| GPU | Graphics Processing Unit |
| UMAP | Uniform Manifold Approximation and Projection |
| AI | Artificial Intelligence |
References
- World Health Organization. Infertility is a global public health issue; WHO: Geneva, Switzerland, 2023. [Google Scholar]
- Adamson, S.E.; de Mouzon, J.; Chambers, G.M.; Zegers-Hochschild, F.; Mansour, R.; Ishihara, O.; Banker, M.; Dyer, S. Systematic review of worldwide trends in assisted reproductive technology 2004–2013. Fertil. Steril. 2017, 107, 1–13. [Google Scholar]
- Alpha Scientists in Reproductive Medicine; ESHRE Special Interest Group of Embryology. The Istanbul consensus workshop on embryo assessment: Proceedings of an expert meeting. Hum. Reprod. 2011, 26, 1270–1283. [CrossRef] [PubMed]
- De Vos, A.; Van De Velde, H.; Joris, H.; Verheyen, G.; Devroey, P.; Van Steirteghem, A. Intra- and interobserver analysis in the morphological assessment of early stage embryos during an IVF procedure: A multicentre study. Reprod. Biol. Endocrinol. 2011, 9, 119. [Google Scholar] [CrossRef] [PubMed]
- Hansen, K.R.; Wilding, M. Quantitative In Vivo Imaging of Embryonic Development: Opportunities and Challenges. In Current Topics in Developmental Biology; Academic Press: Cambridge, MA, USA, 2012; Vol. 100, pp. 1–28. [Google Scholar]
- Kirby, J.; Meseguer, M.; Fernandez, J.; Humaidan, P. Time-lapse embryo imaging: How much information is clinically useful? Fertil. Steril. 2021, 116, 978–985. [Google Scholar]
- Khosravi, P.; Kazemi, E.; Zhan, Q.; Malmsten, J.E.; Toschi, M.; Zisimopoulos, P.; Sigaras, A.; Lavery, S.; Cooper, L.A.D.; Hickman, C.; et al. Deep learning enables robust assessment and selection of human blastocysts after in vitro fertilization. npj Digit. Med. 2019, 2, 21. [Google Scholar] [CrossRef] [PubMed]
- Tran, D.; Cooke, S.; Illingworth, P.J.; Gardner, D.K. A deep learning model for embryo viability assessment from static images. Sci. Rep. 2019, 9, 17799. [Google Scholar]
- Kragh, M.F.; Rimestad, J.; Berntsen, J.; Karstoft, H. Robust and generalizable embryo selection based on artificial intelligence and time-lapse image sequences. PLoS ONE 2022, 17, e0262661. [Google Scholar]
- Kim, J.; Lee, J.; Shin, J. Evaluation of the Clinical Efficacy and Trust in AI-Assisted Embryo Ranking: Survey-Based Prospective Study. J. Med. Internet Res. 2024, 26, e52637. [Google Scholar] [CrossRef] [PubMed]
- Vermilyea, M.; Hall, J.M.M.; Diakiw, S.M.; Johnston, A.; Nguyen, T.; Perugini, D.; Miller, A.; Picou, A.; Murphy, A.P.; Perugini, M. Development of an artificial intelligence-based assessment model for prediction of embryo viability using static images captured by optical light microscopy during IVF. Hum. Reprod. 2020, 35, 770–784. [Google Scholar] [CrossRef] [PubMed]
- Reichman, J.; Pereira, N.; Rosenwaks, Z. Human embryo live-imaging reveals nuclear DNA shedding during blastocyst expansion and biopsy. Nat. Commun. 2024, 15, 4880. [Google Scholar]
- Raudonis, V.; Paulauskaite-Taraseviciene, A.; Sutiene, K.; Jonaitis, D. Towards the automation of early-stage human embryo development detection. Biomed. Eng. Online 2019, 18, 120. [Google Scholar] [CrossRef] [PubMed]
- Liu, Z.; Lin, Y.; Cao, Y.; Hu, H.; Wei, Y.; Zhang, Z.; Lin, S.; Guo, B. Swin Transformer: Hierarchical Vision Transformer using Shifted Windows. In Proceedings of the IEEE/CVF International Conference on Computer Vision (ICCV), Montreal, BC, Canada, 11–17 October 2021; pp. 10012–10022. [Google Scholar]
- Scientists, Alpha; ESHRE. The Istanbul Consensus update: A revised ESHRE/ALPHA consensus on oocyte and embryo static and dynamic morphological assessment. Hum. Reprod. 2025, 40, 989–1035. [Google Scholar] [CrossRef] [PubMed]
- Tesarik, J.; Greco, E. The role of pronuclear morphology in the selection of zygotes for transfer. Hum. Reprod. 1999, 14, 2517–2520. [Google Scholar]
- Scott, L. Pronuclear scoring as a predictor of embryo development. Reprod. Biomed. Online 2003, 6, 201–214. [Google Scholar] [CrossRef] [PubMed]
- Storr, A.; Venetis, C.A.; Cooke, S.; Kilani, S.; Ledger, W. Morphokinetic parameters using time-lapse technology and day 5 embryo quality: A prospective cohort study. J. Assist. Reprod. Genet. 2015, 32, 1151–1160. [Google Scholar] [CrossRef] [PubMed]
- Practice Committee of the American Society for Reproductive Medicine. Guidance on the limits to the number of embryos to transfer: A committee opinion. Fertil. Steril. 2021, 116, 651–654. [Google Scholar] [CrossRef] [PubMed]
- Ottawa Fertility Centre. Embryo Grading. Available online: https://www.google.com/search?q=https://www.oceant.ca/embryo-grading/ (accessed on 20 June 2025).
Figure 1.
Functional block diagram of the proposed Soft Optical Sensor. The pipeline begins with the acquisition of a multi-focal Z-stack( FP(0-6)). The images are processed through a U-Net fusion module to generate a single composite image. This composite is then fed into a Vision Transformer (ViT) for classification. Finally, the classification token is used by the RAG module to retrieve relevant medical literature and generate a textual report.
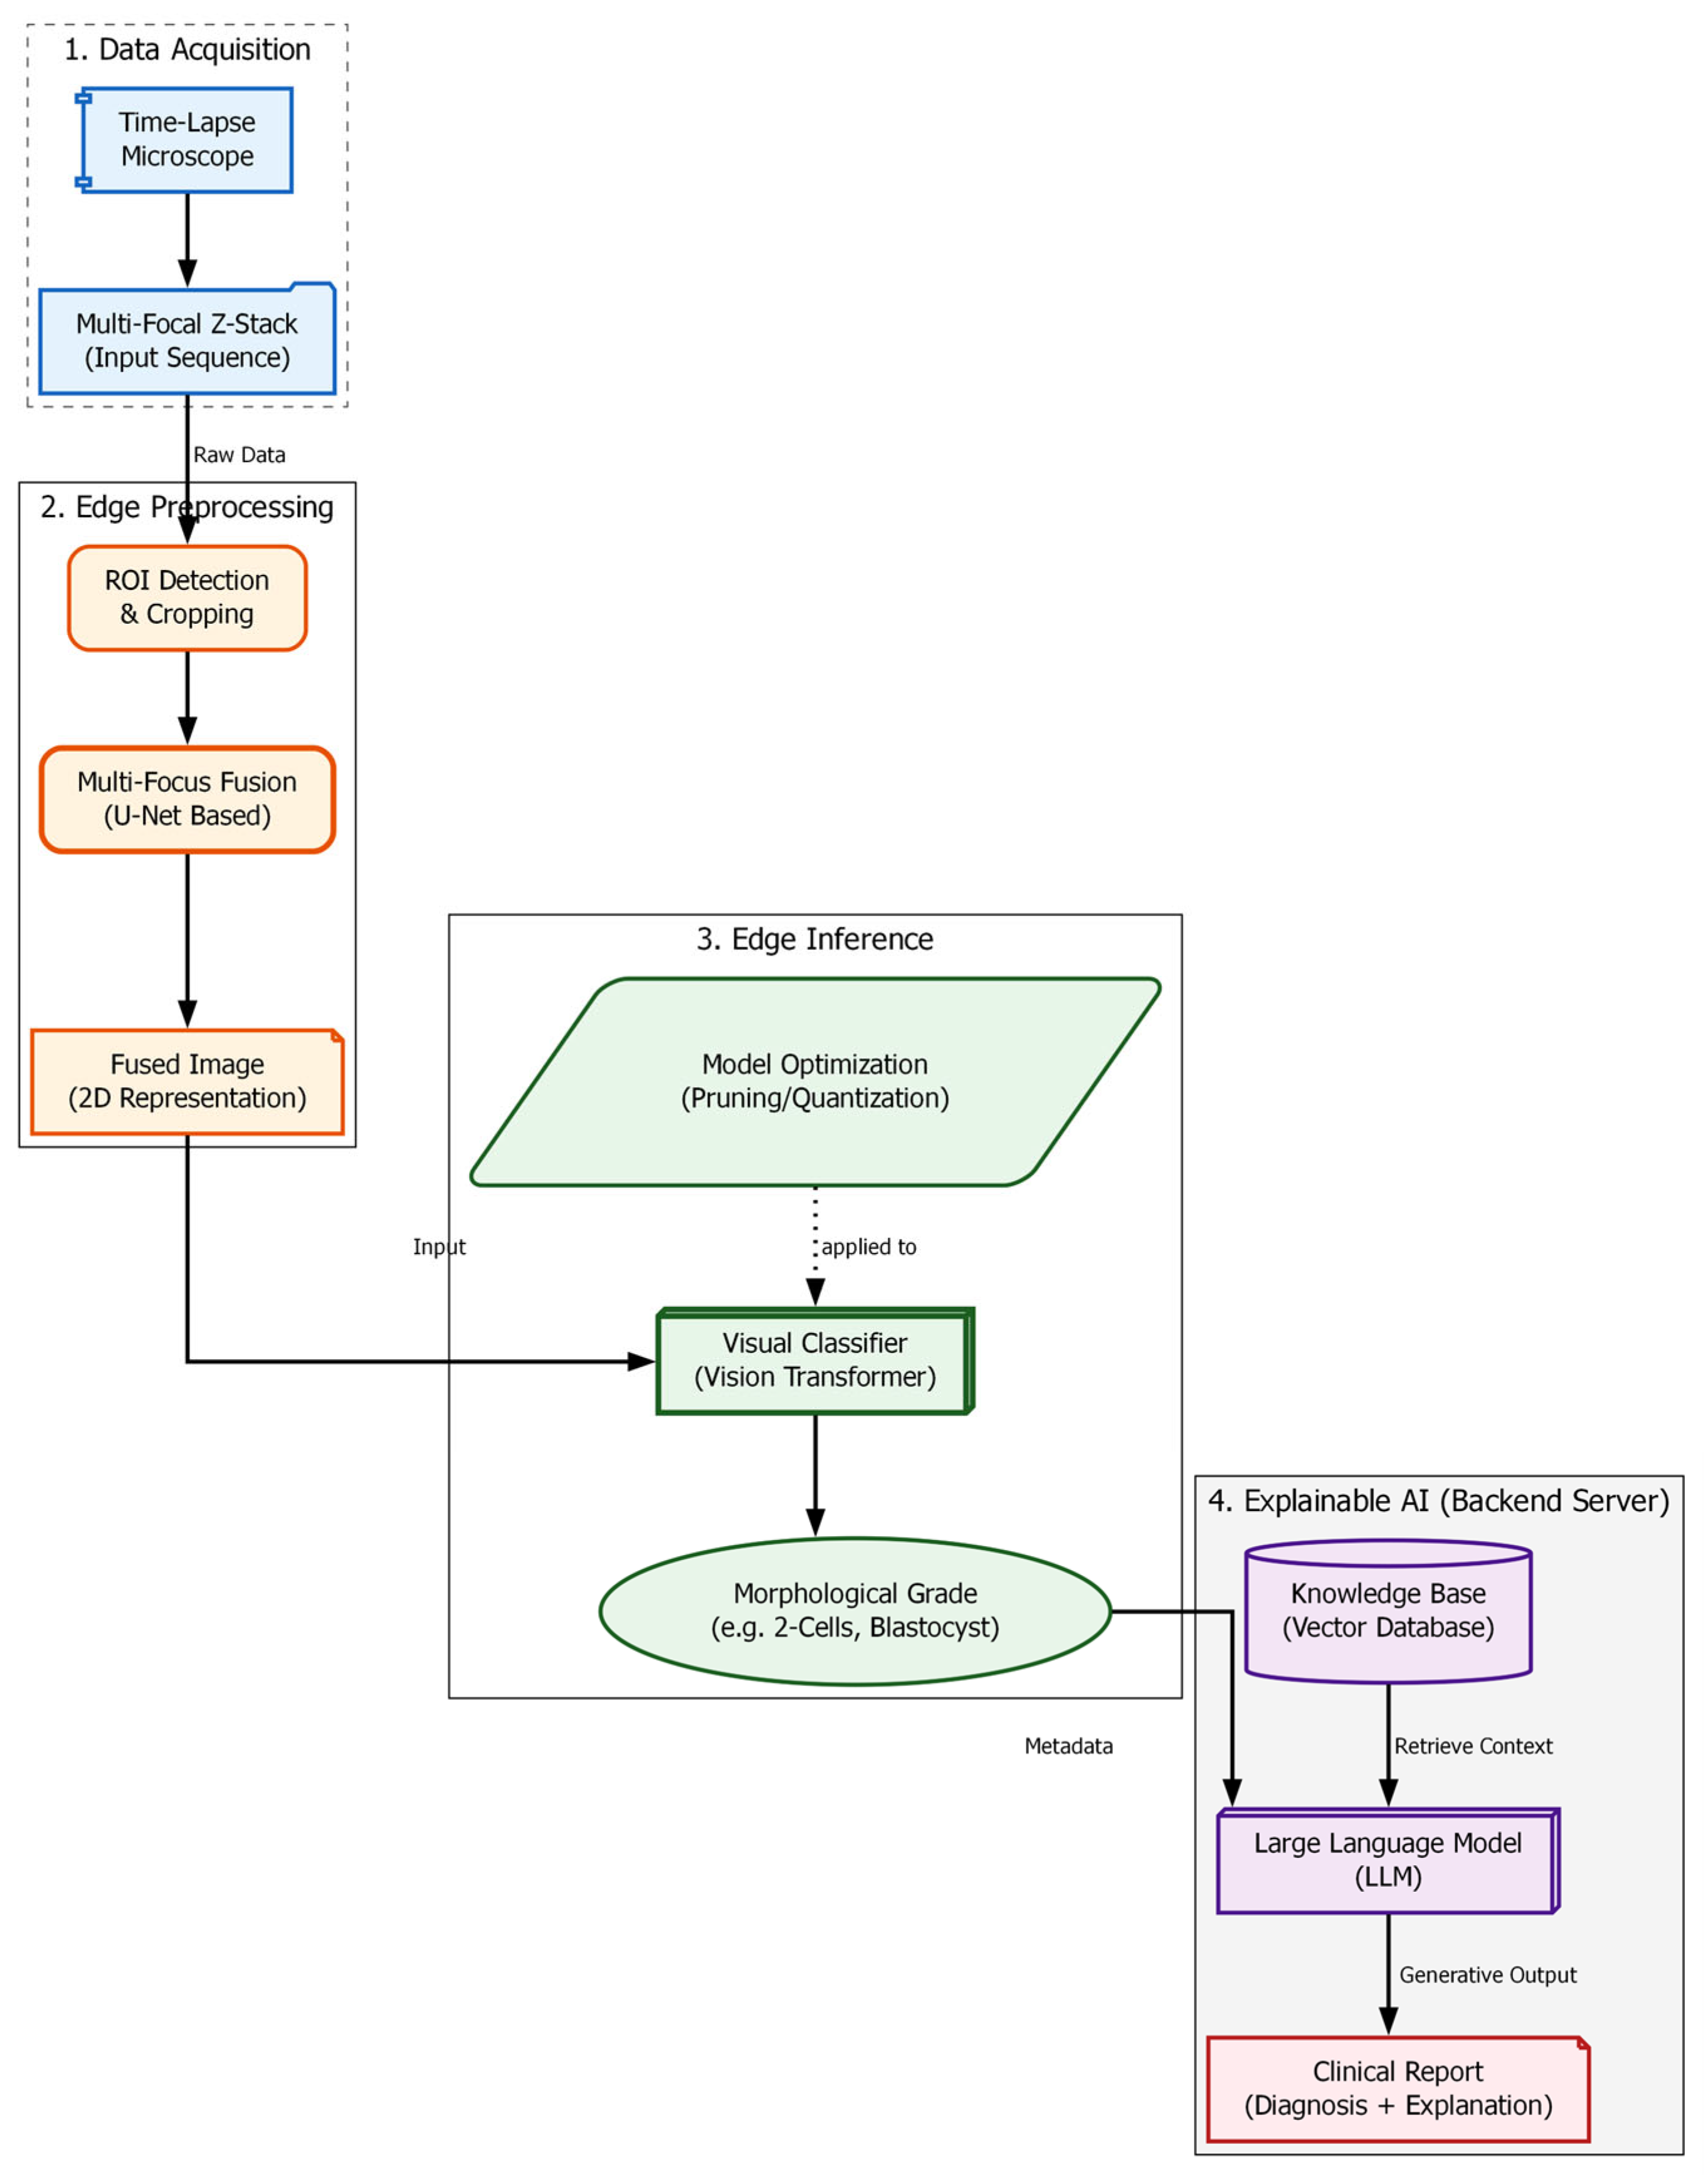
Figure 2.
Representative samples of the seven phenotypical classes within the dataset. The images illustrate the distinct morphological features used for classification, from simple cell division (1-4 cells) to complex compaction (Morula/Blastocyst) and anomalies (Empty/Not Defined).
Figure 2.
Representative samples of the seven phenotypical classes within the dataset. The images illustrate the distinct morphological features used for classification, from simple cell division (1-4 cells) to complex compaction (Morula/Blastocyst) and anomalies (Empty/Not Defined).
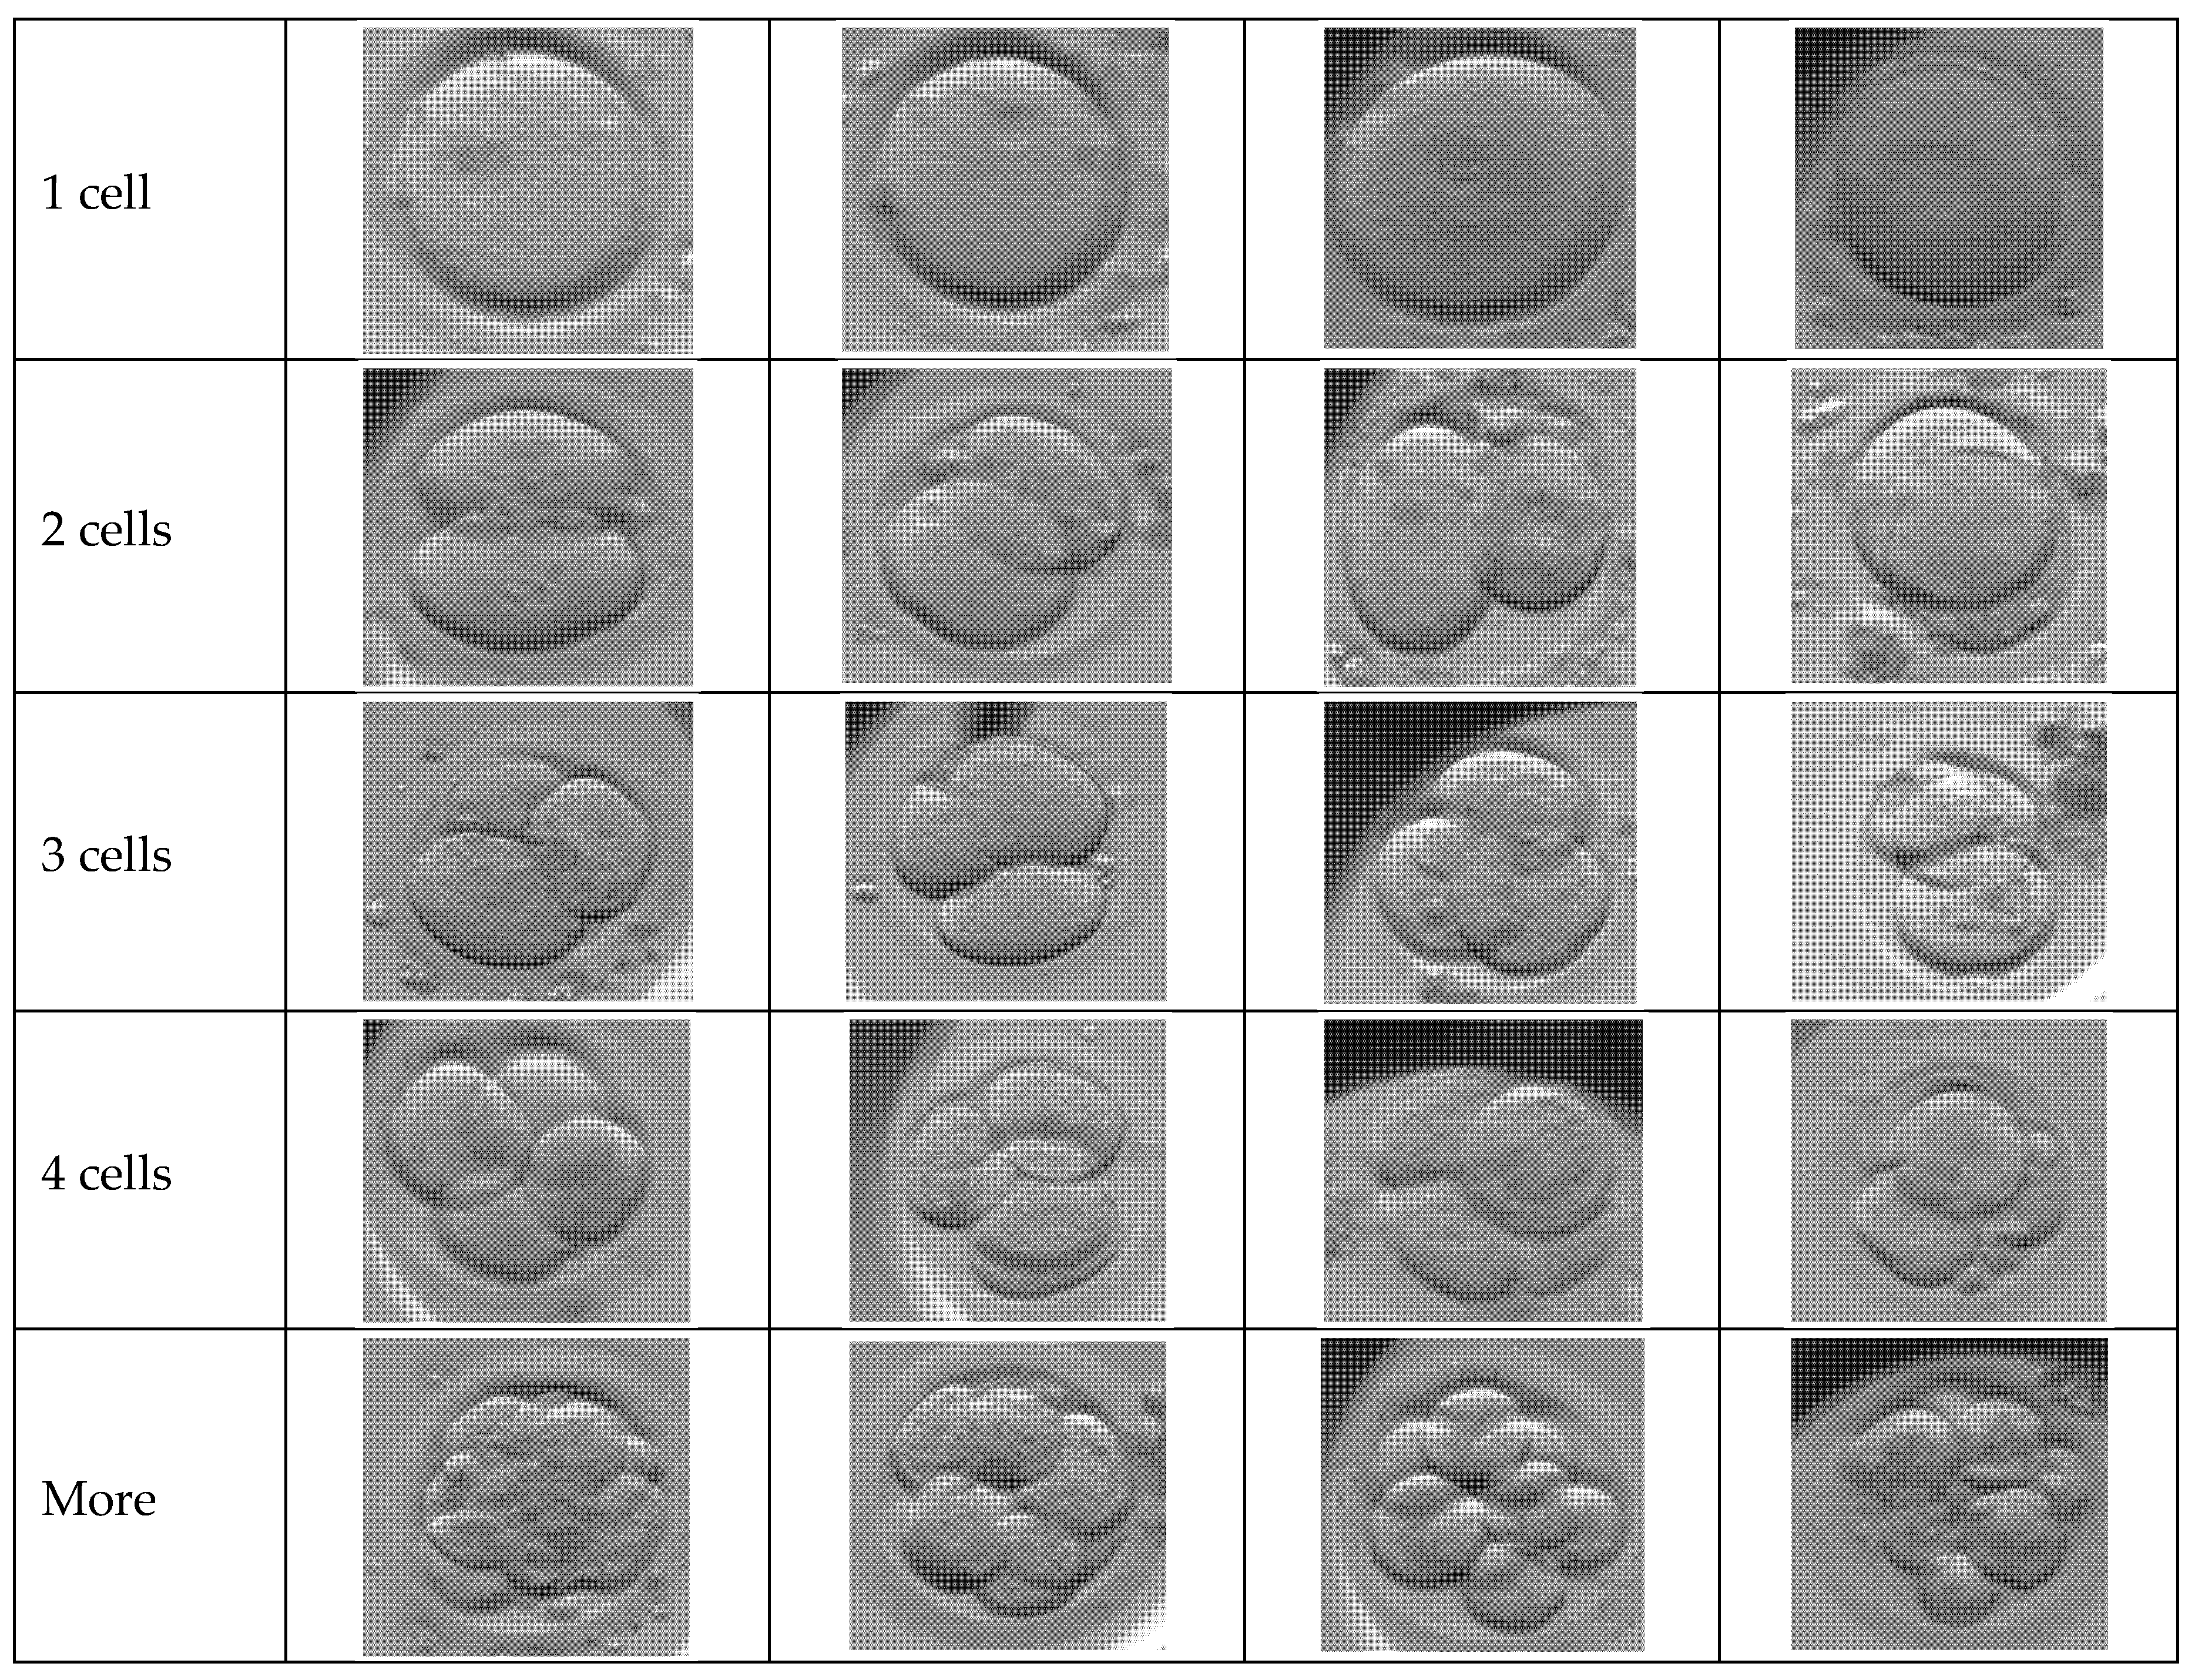
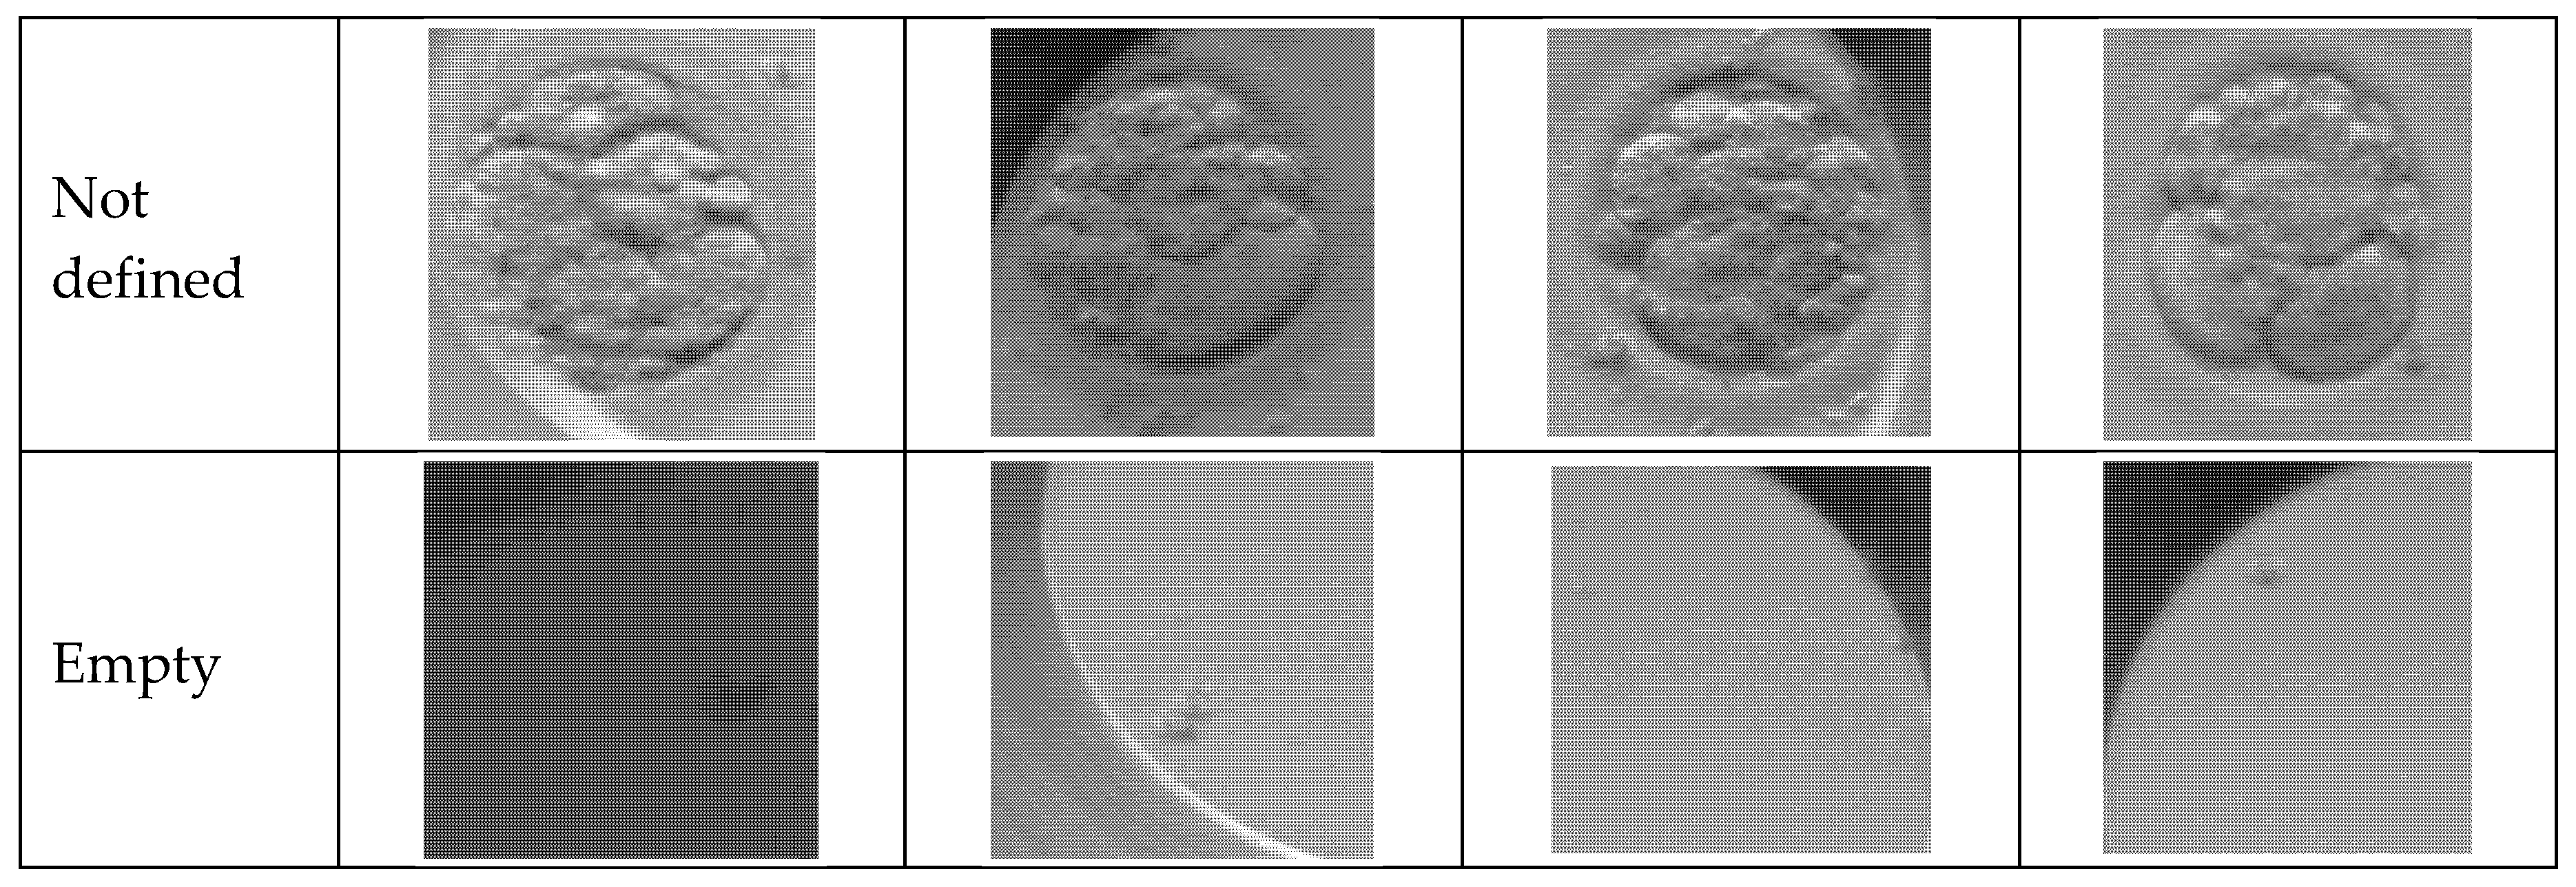
Figure 3.
Representative samples of seven focal planes of same early-stage embryo.
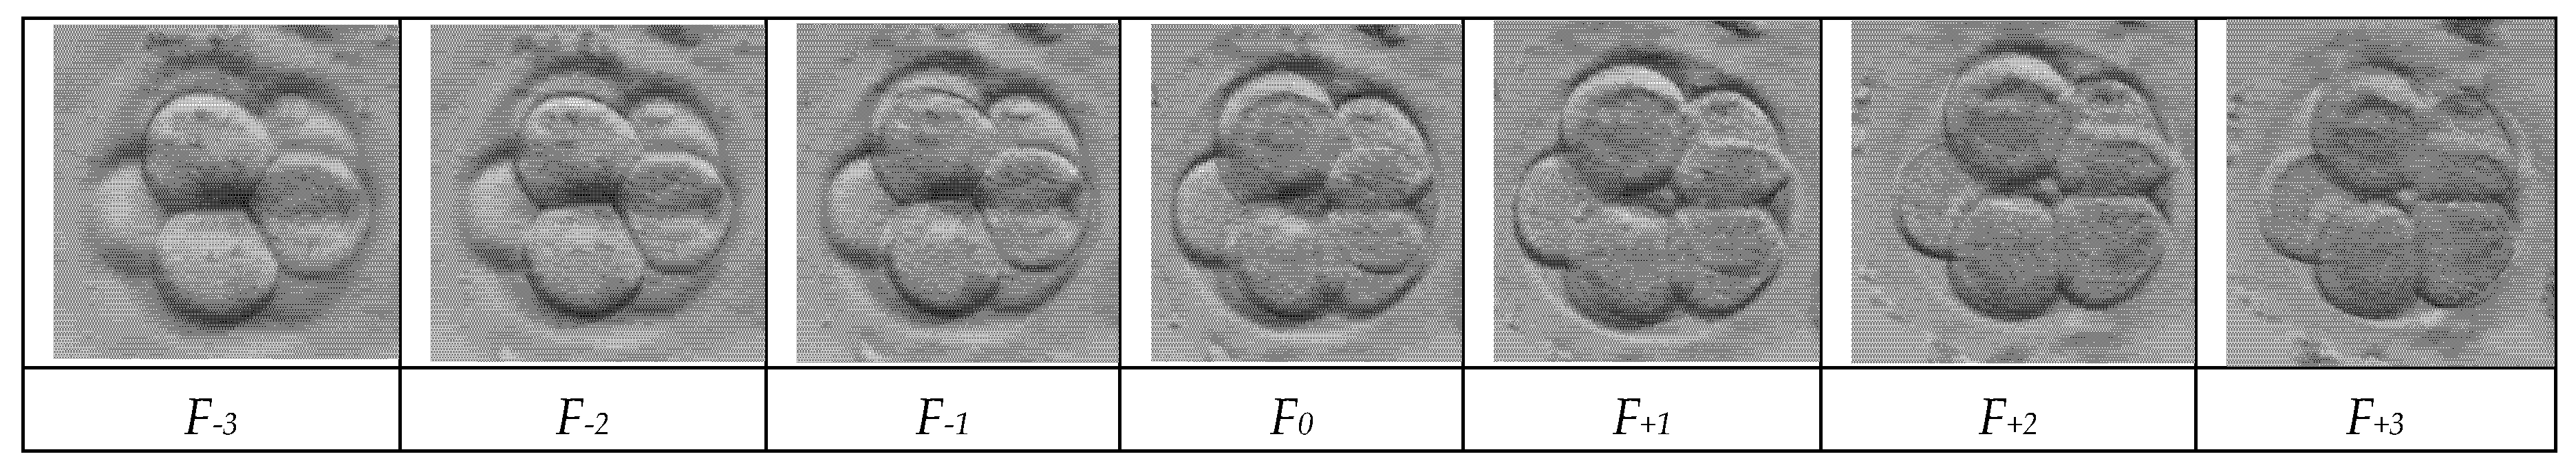
Figure 4.
Schematic of the Deep Learning Fusion process. The 7 focal planes are stacked channel-wise and fed into the U-Net encoder. The network learns to extract salient features at multiple scales and reconstructs a single-channel, high-fidelity fused image at the output.
Figure 4.
Schematic of the Deep Learning Fusion process. The 7 focal planes are stacked channel-wise and fed into the U-Net encoder. The network learns to extract salient features at multiple scales and reconstructs a single-channel, high-fidelity fused image at the output.
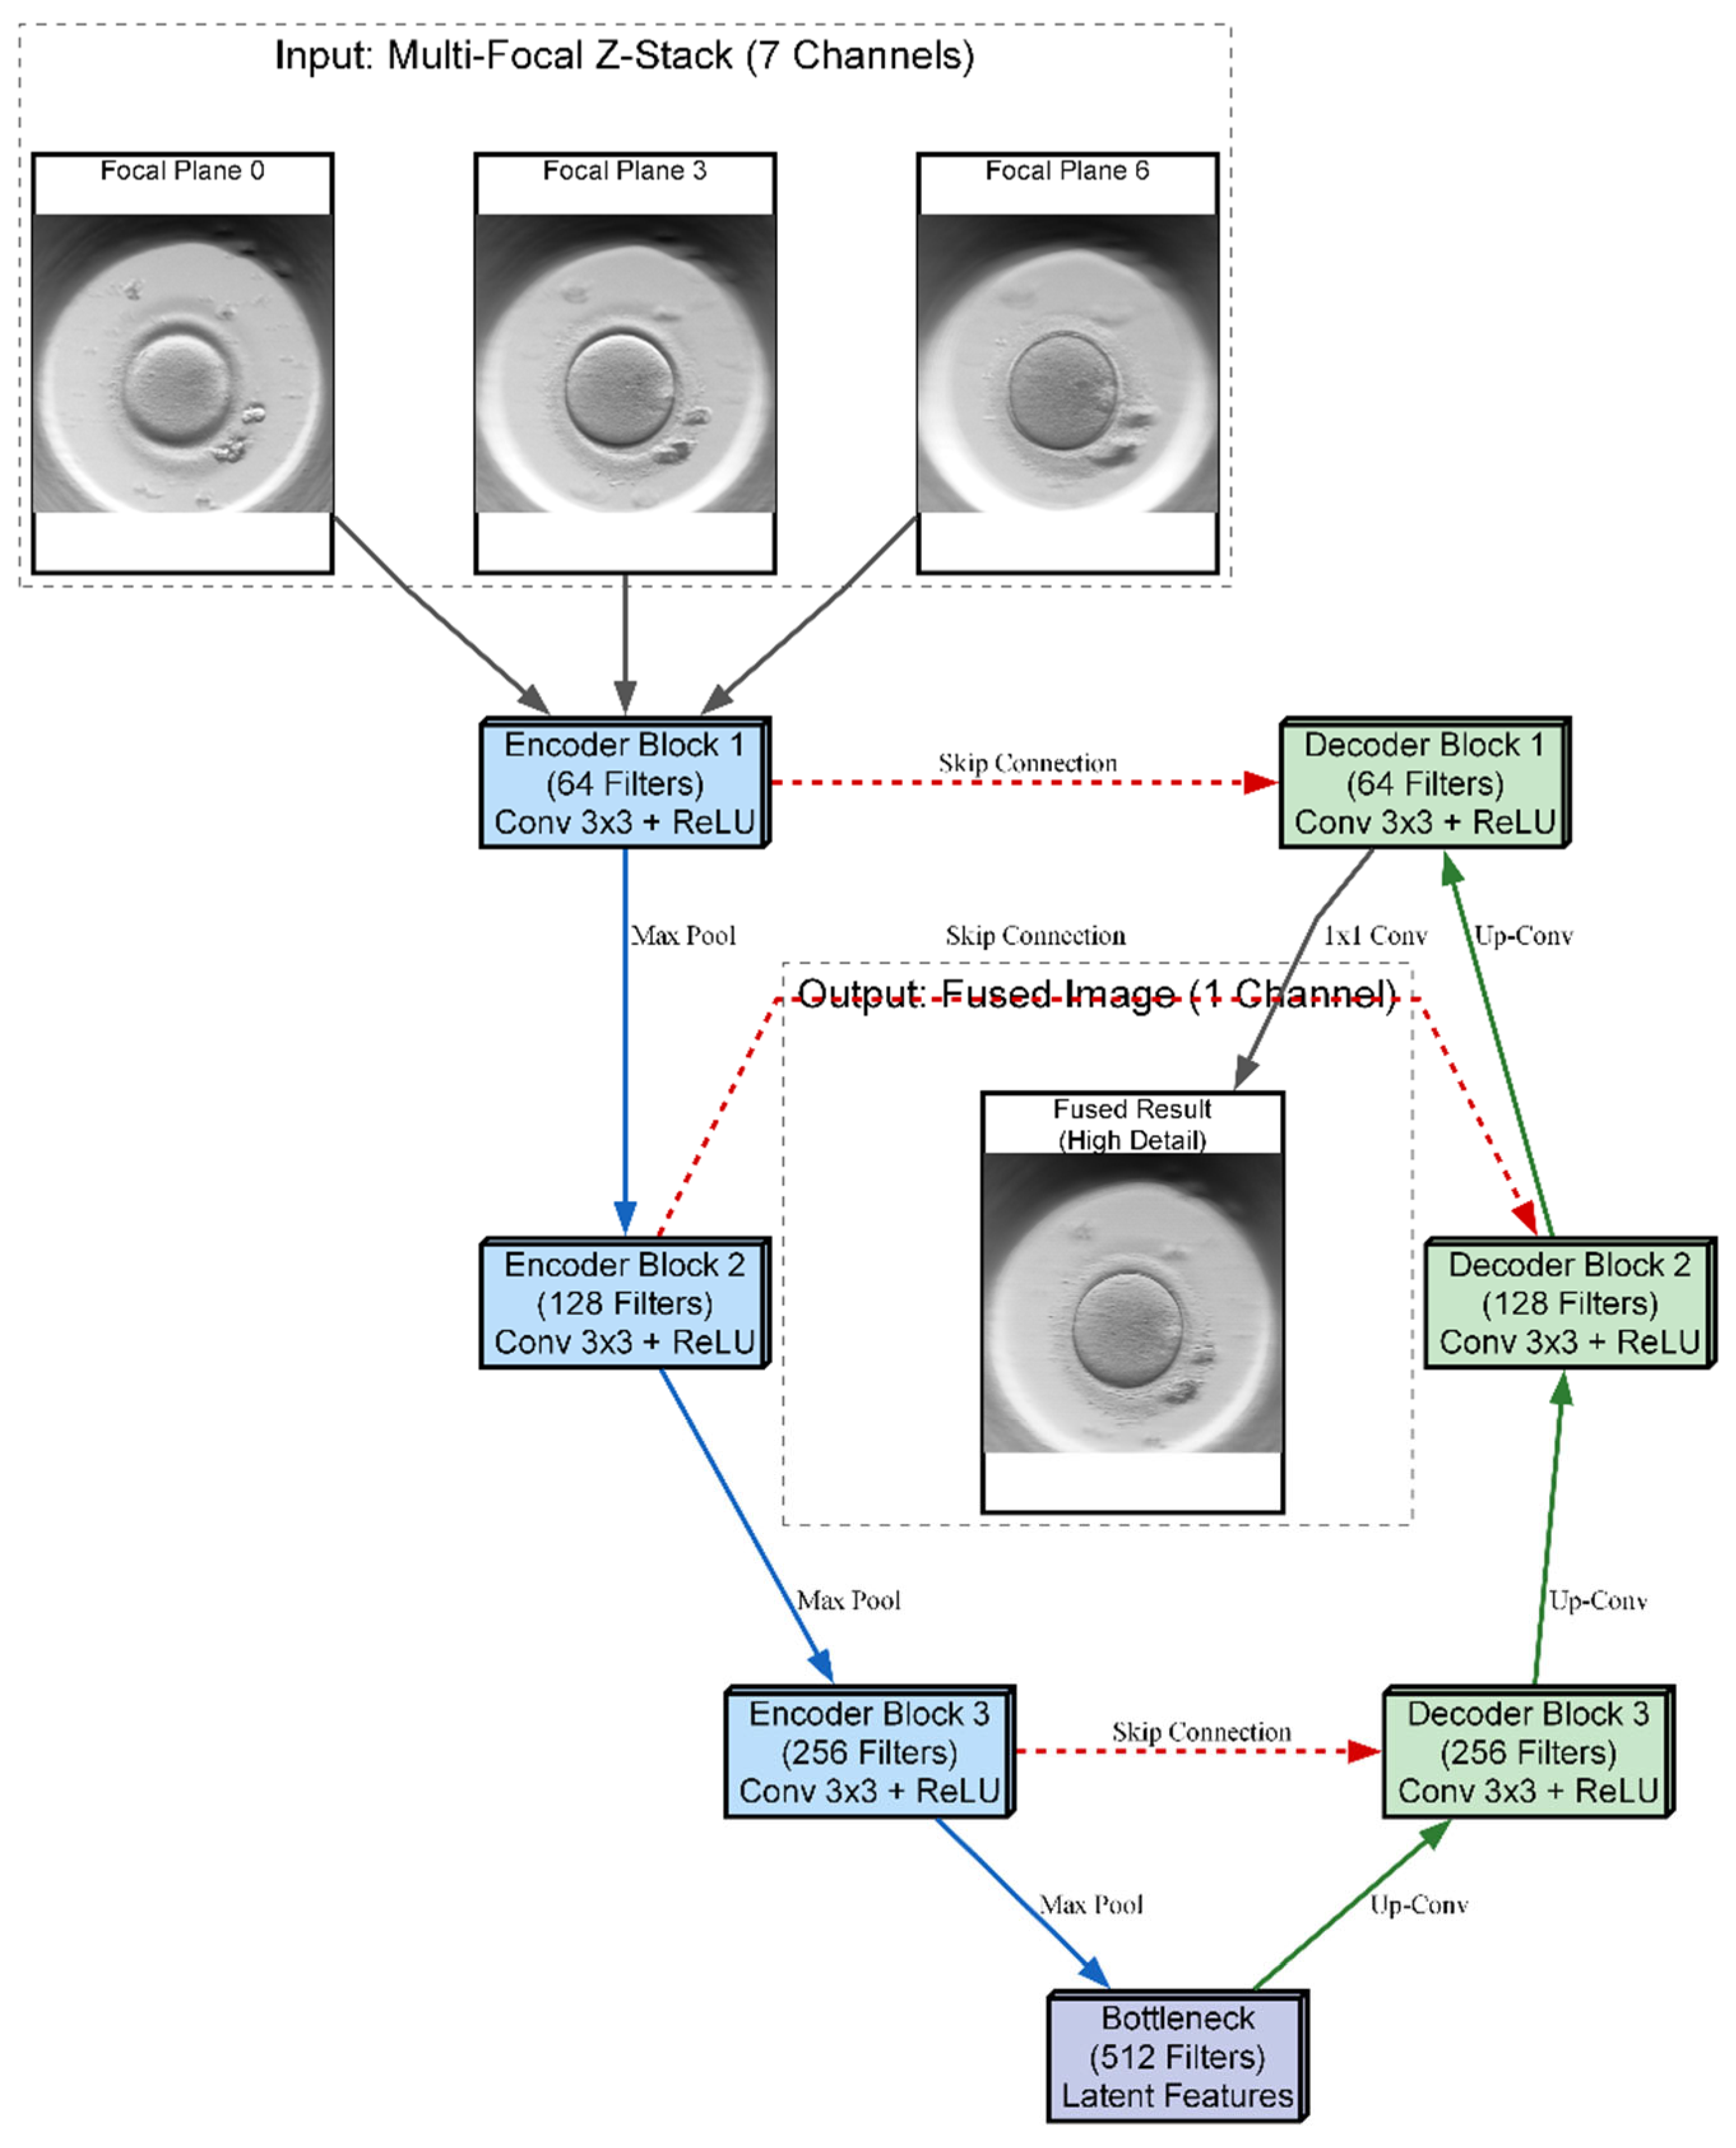
Figure 5.
Schematic of the Vision Transformer (ViT) architecture used for classification. The model divides the fused embryo image into patches, processes them through transformer blocks with self-attention, and outputs a classification token.
Figure 5.
Schematic of the Vision Transformer (ViT) architecture used for classification. The model divides the fused embryo image into patches, processes them through transformer blocks with self-attention, and outputs a classification token.
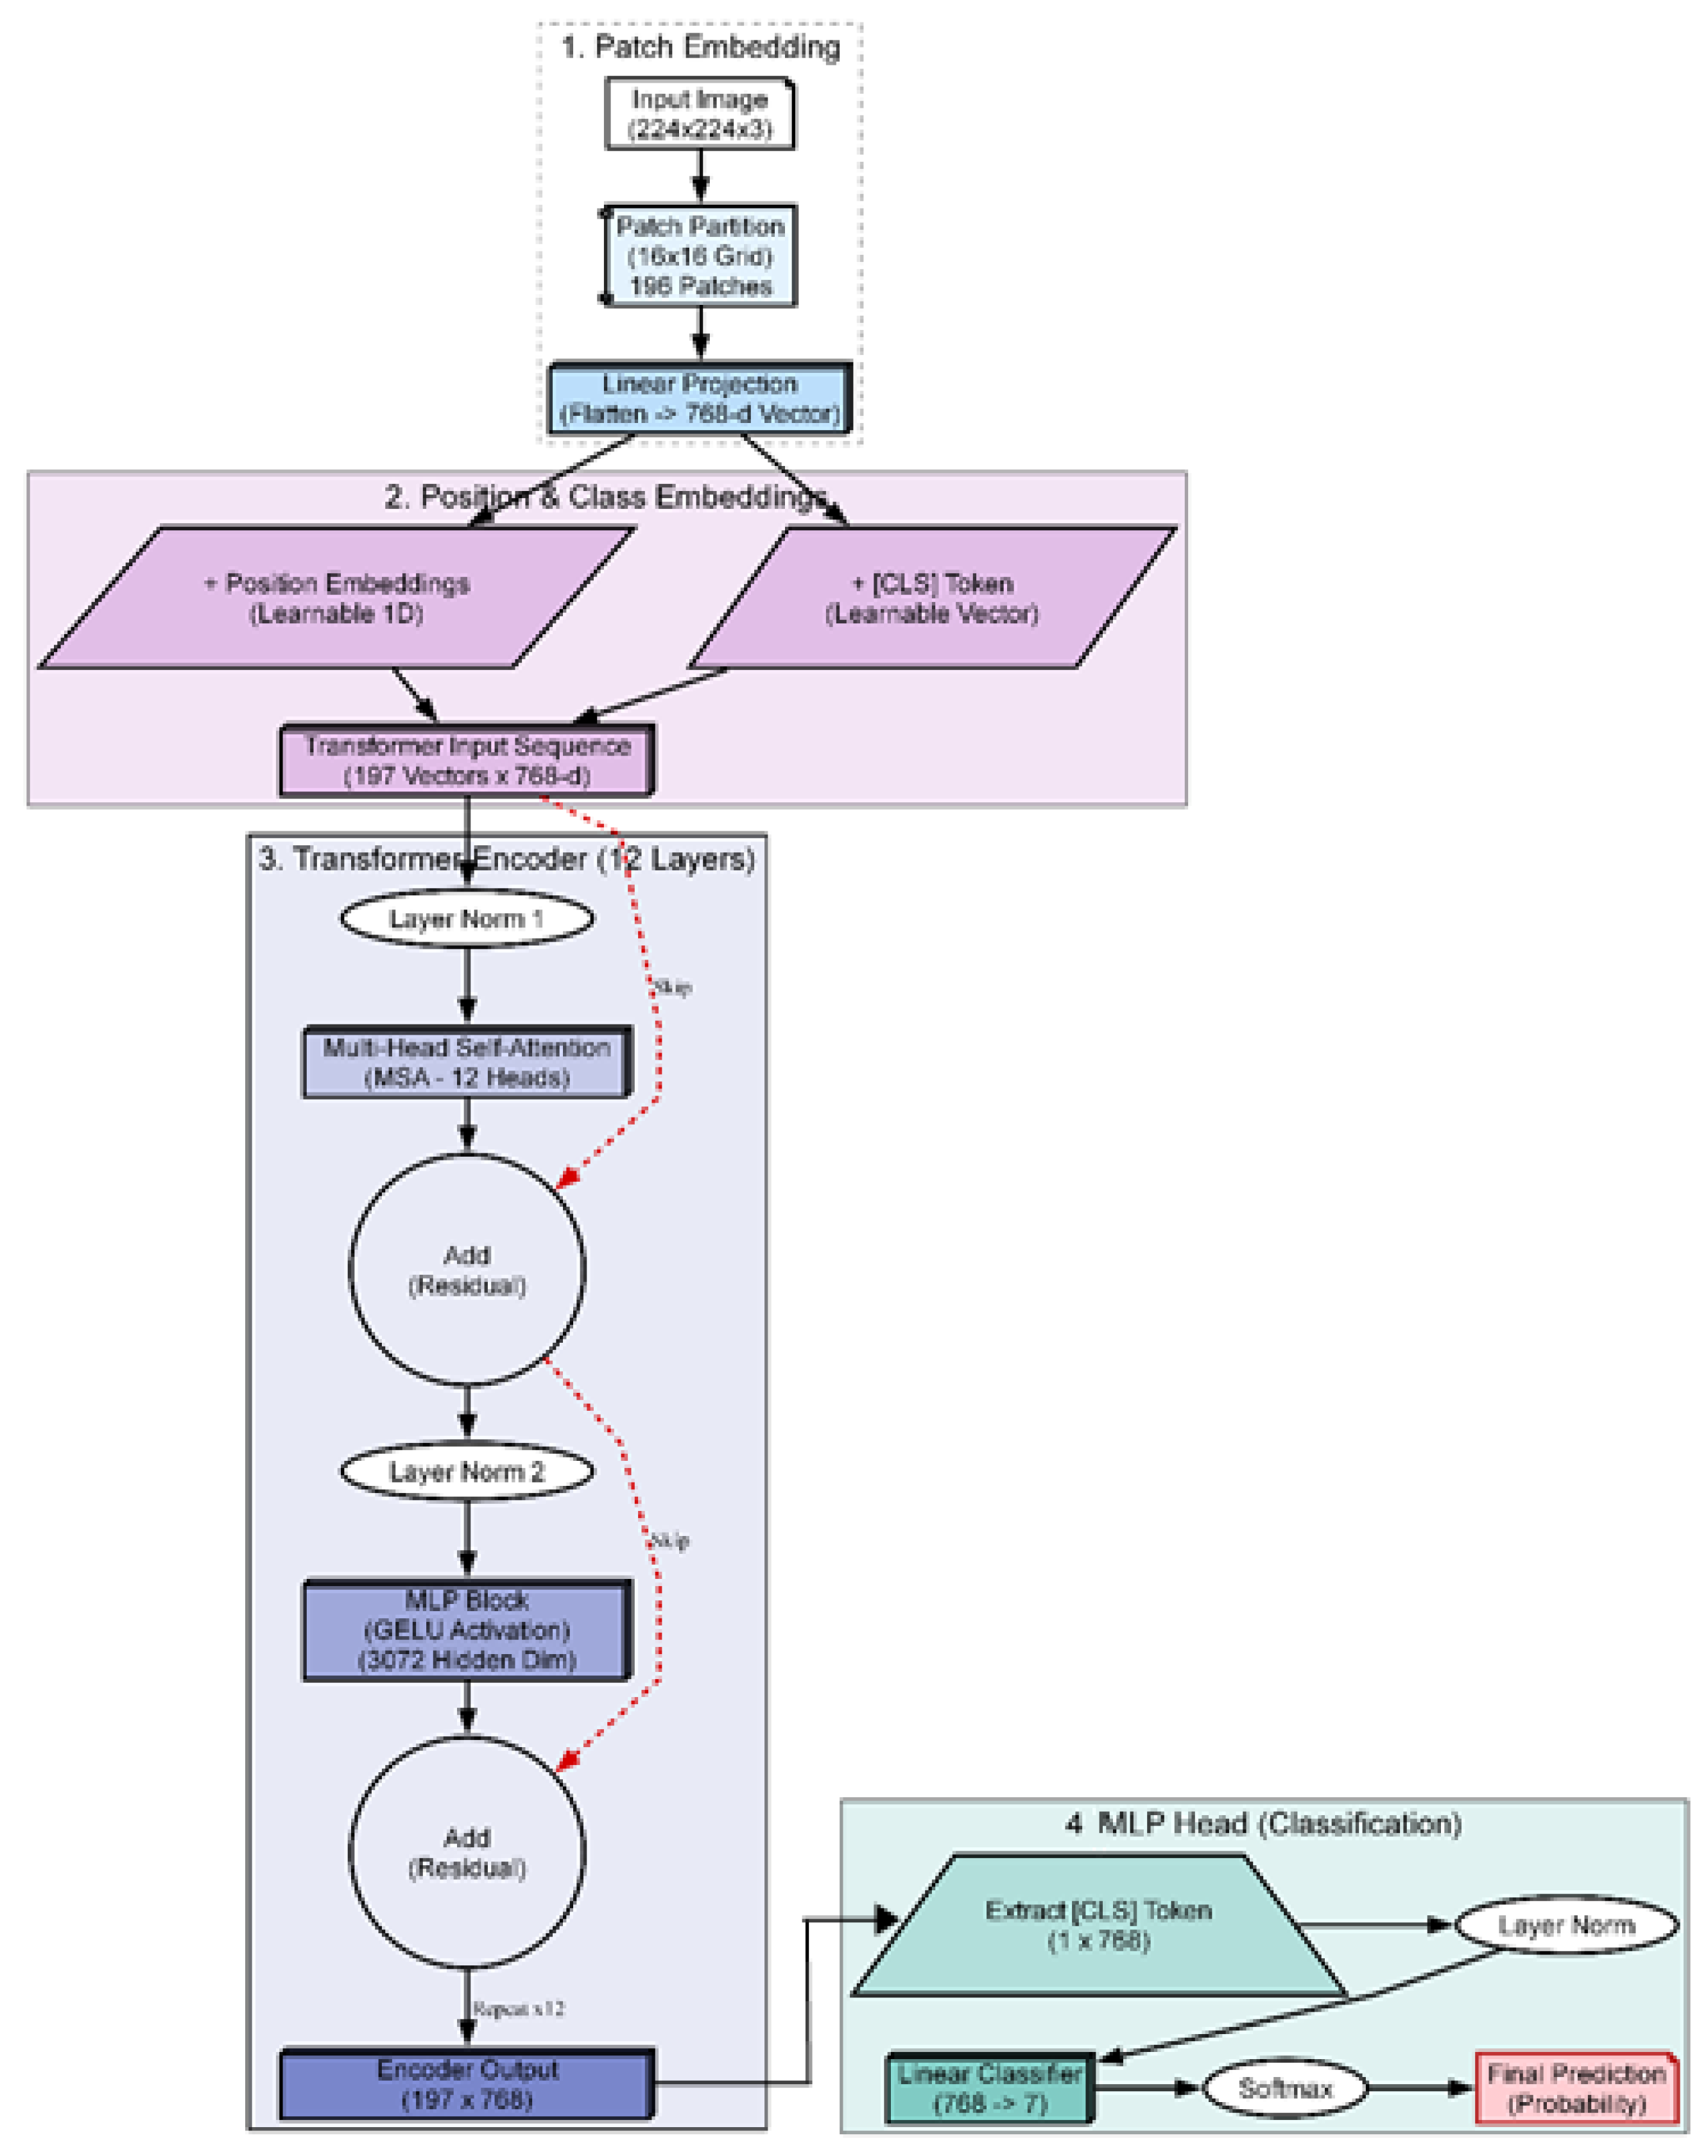
Figure 6.
The Hybrid Neuro-Symbolic Inference Pipeline (RAG). The predicted class label from the ViT acts as a query to retrieve relevant medical guidelines from a vector database, which are then synthesized by an LLM into a clinical report.
Figure 6.
The Hybrid Neuro-Symbolic Inference Pipeline (RAG). The predicted class label from the ViT acts as a query to retrieve relevant medical guidelines from a vector database, which are then synthesized by an LLM into a clinical report.
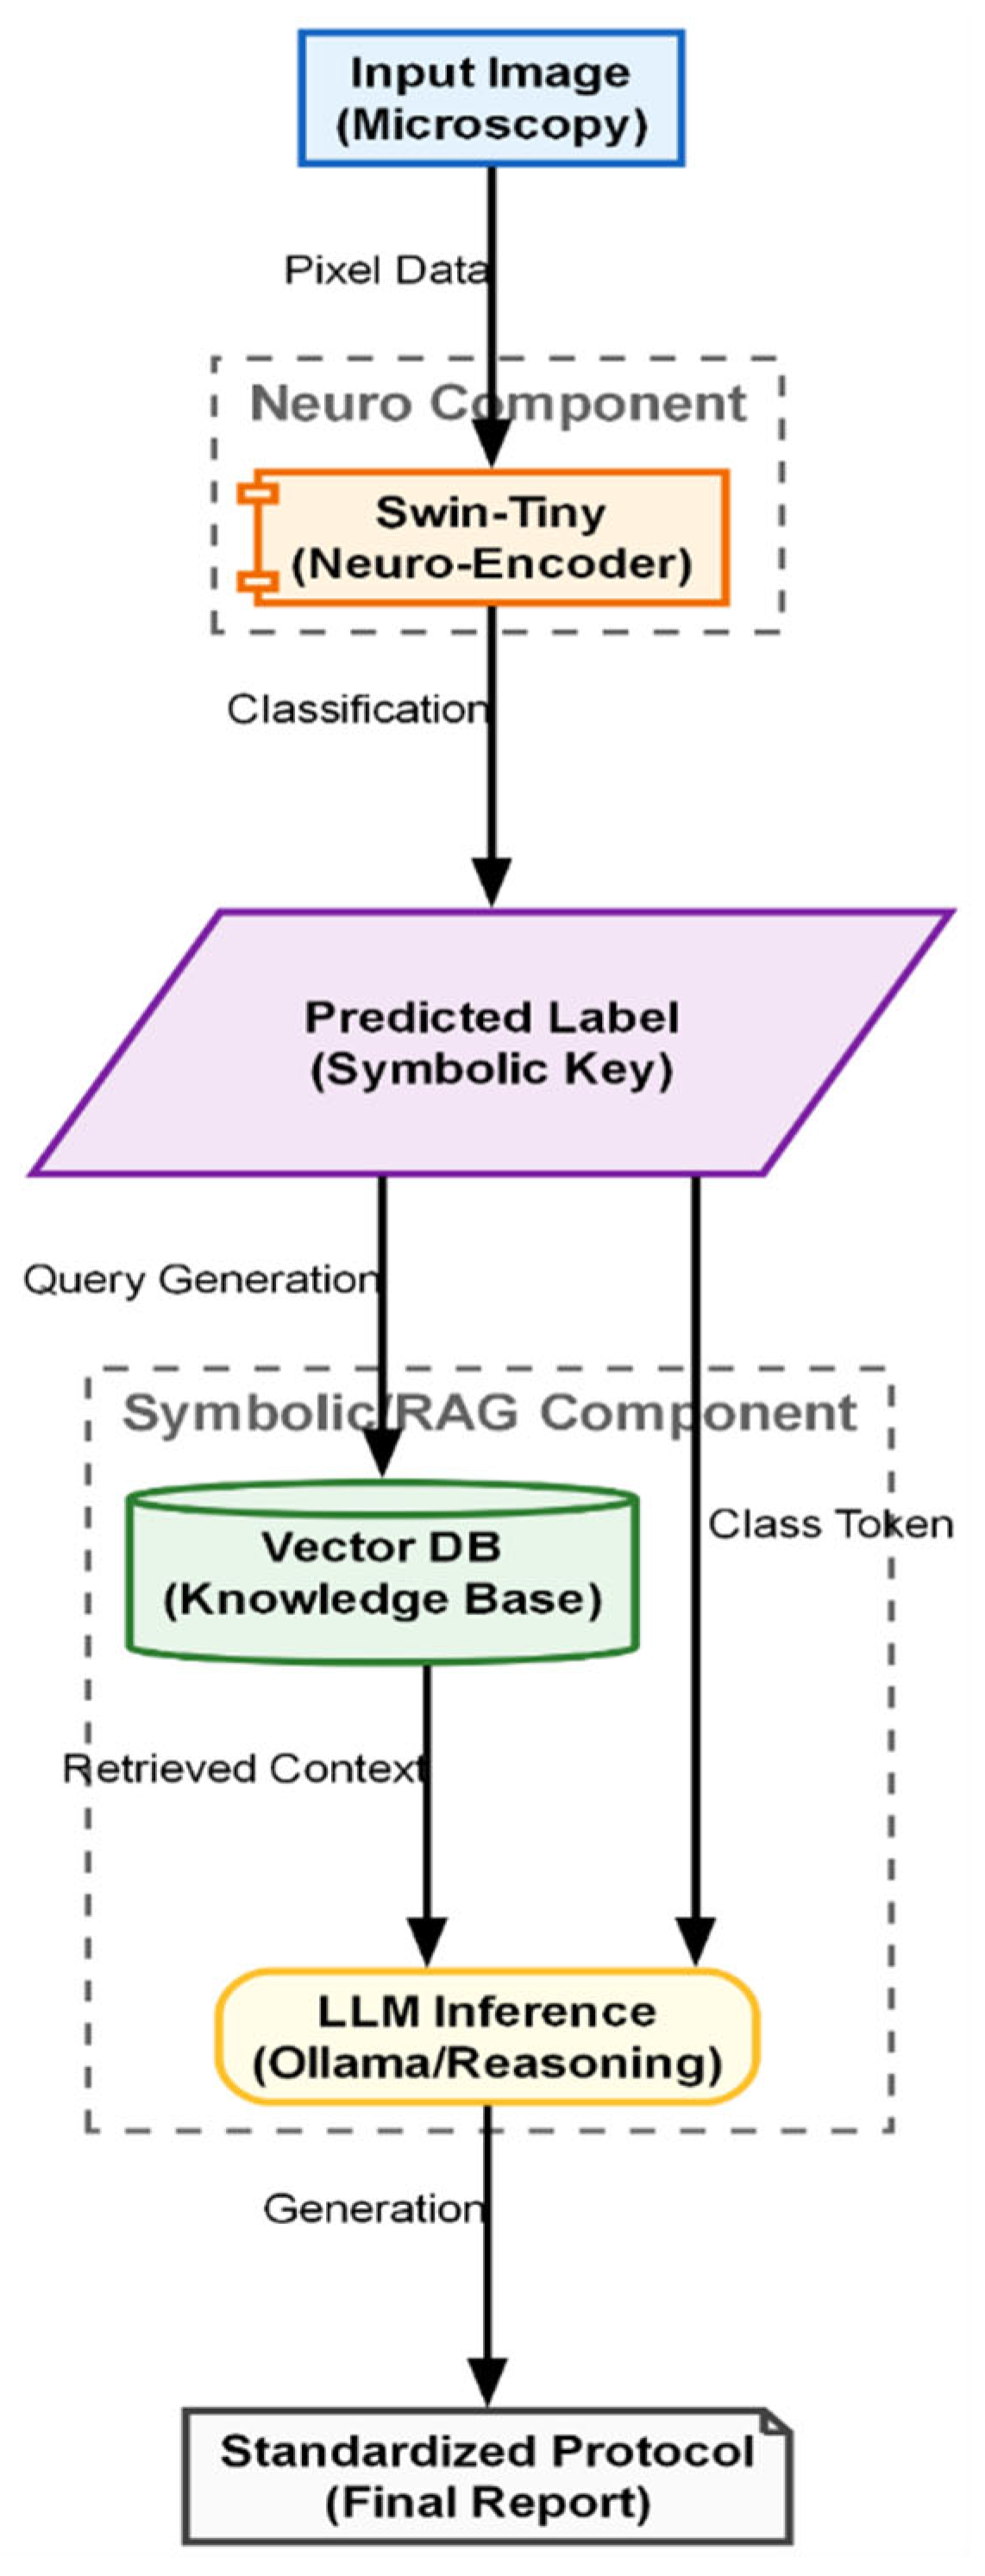
Figure 7.
Visual comparison of multi-focus fusion results. Top row: Seven representative raw input frames showing limited depth of field. Bottom row: Fused outputs from Laplacian Pyramid ,UNet- DC, UNet-SC and AFU-Net.
Figure 7.
Visual comparison of multi-focus fusion results. Top row: Seven representative raw input frames showing limited depth of field. Bottom row: Fused outputs from Laplacian Pyramid ,UNet- DC, UNet-SC and AFU-Net.
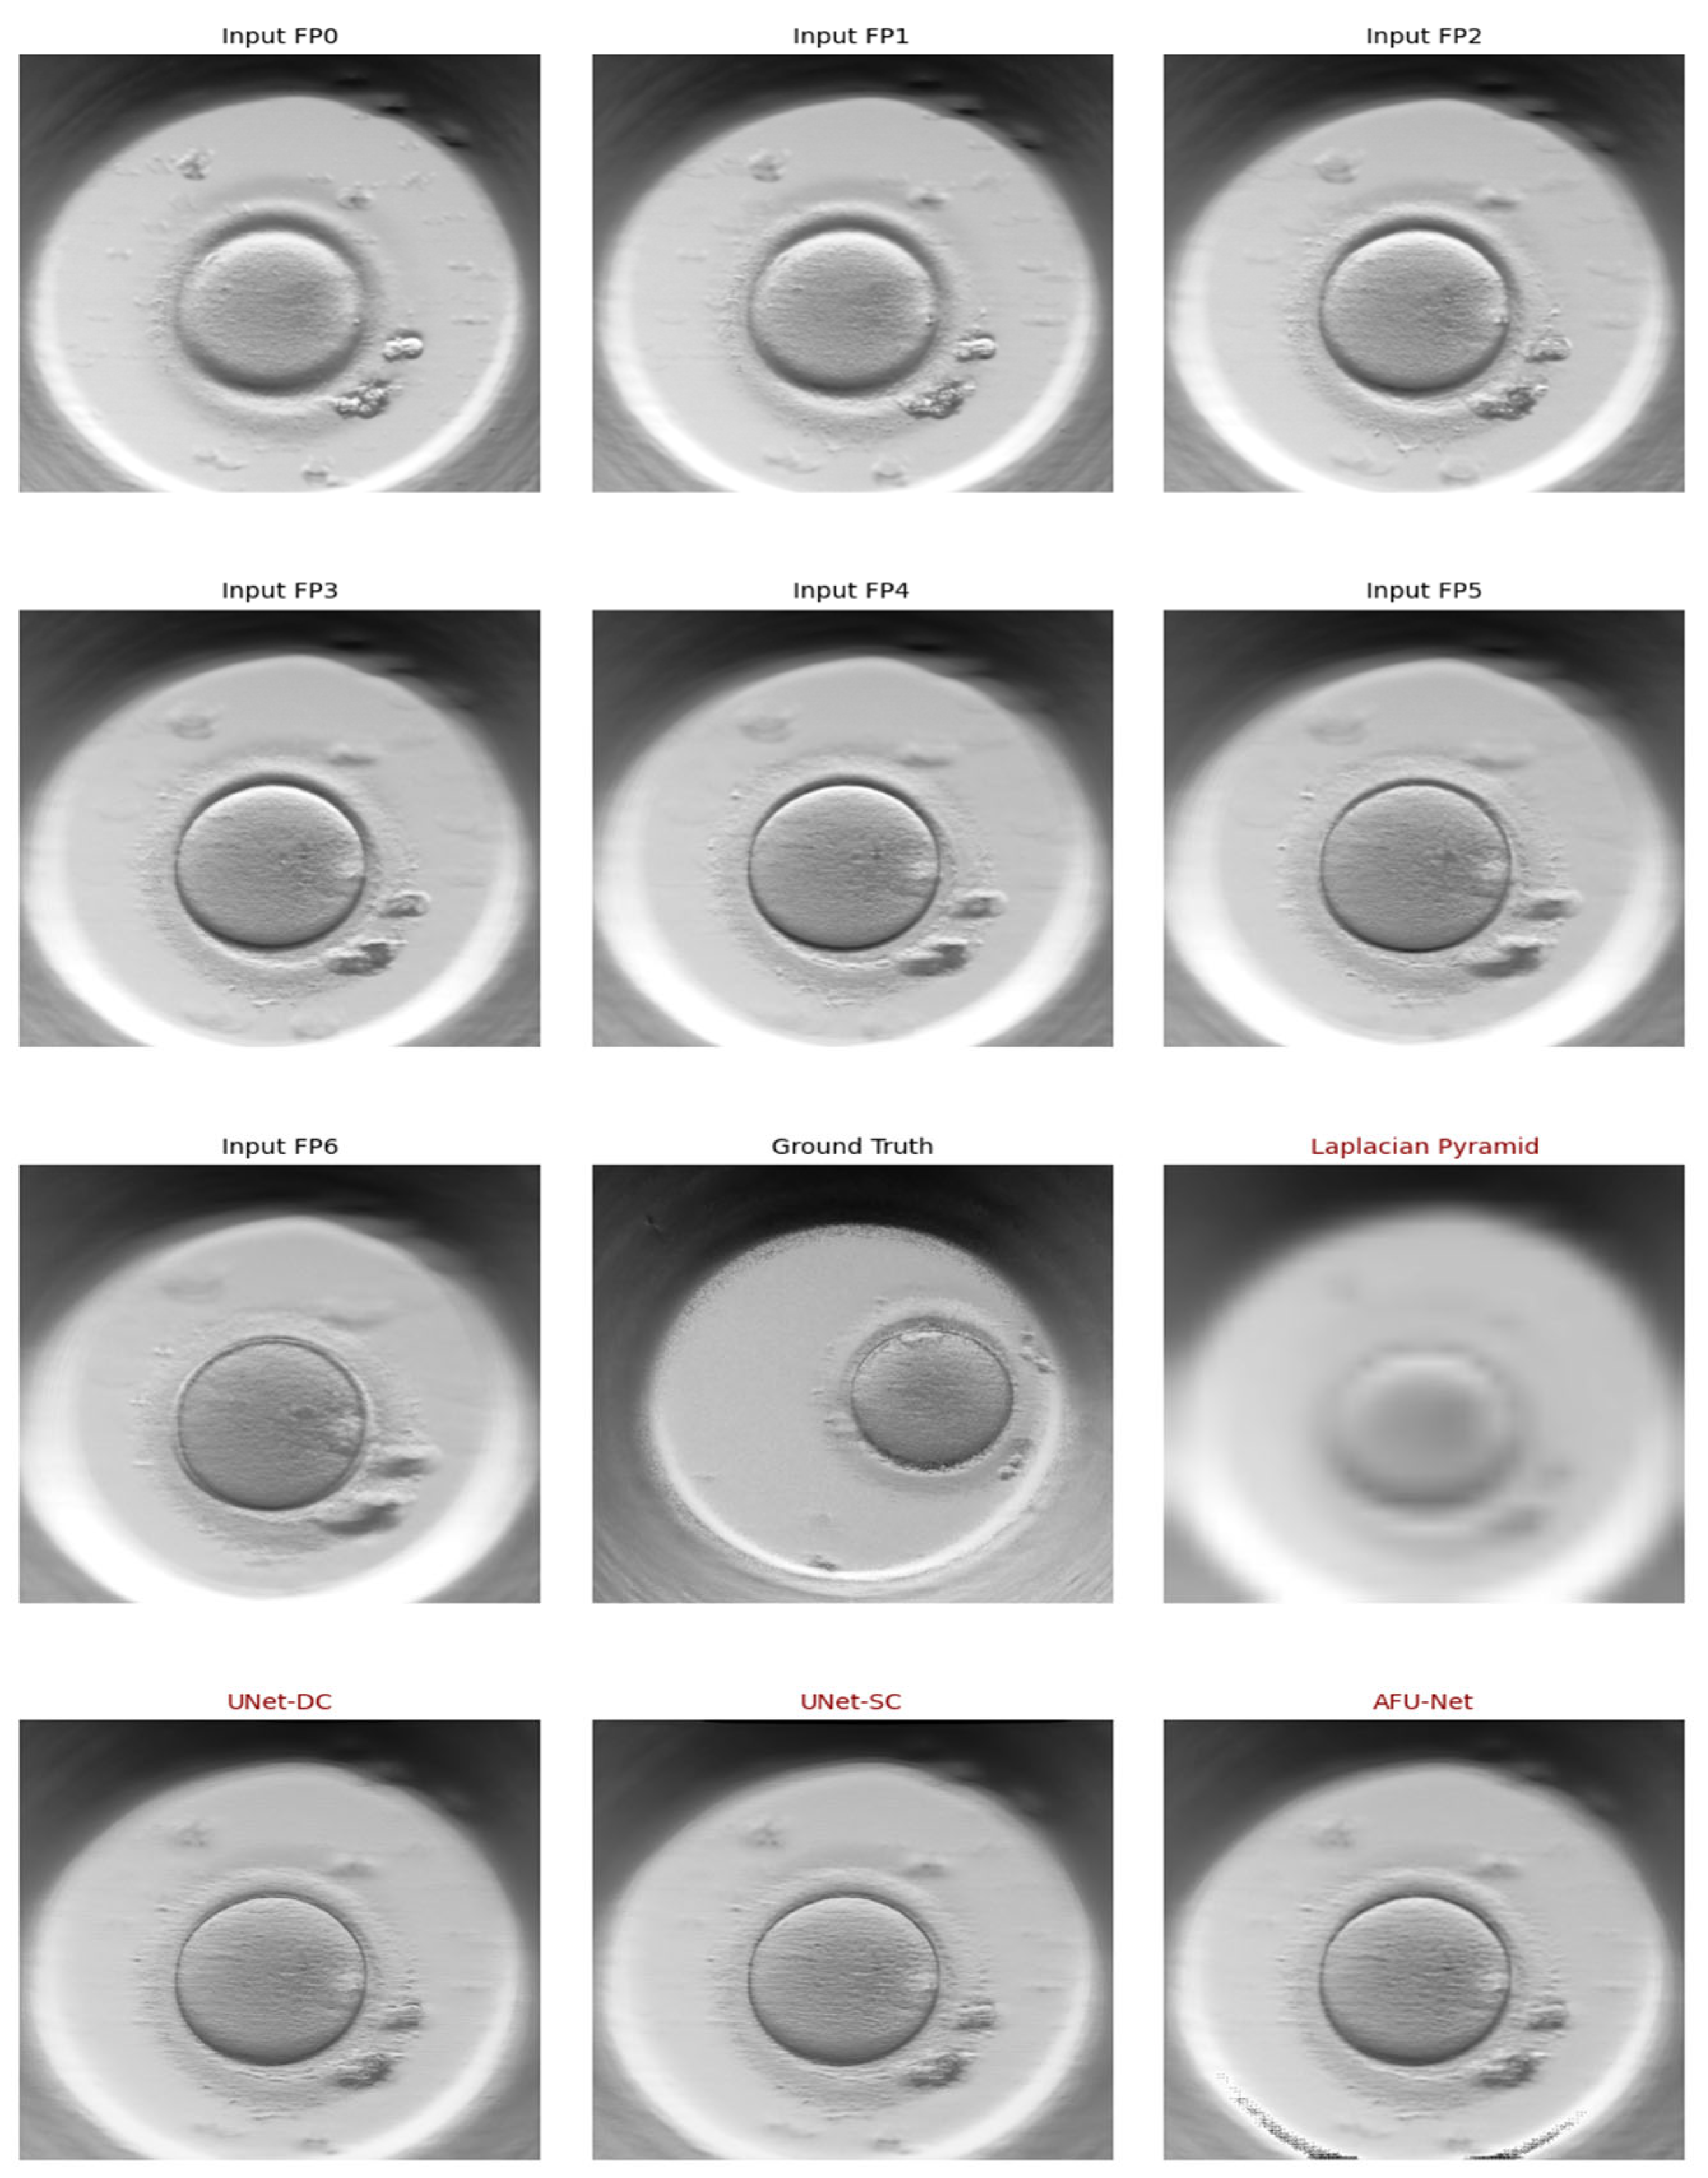
Figure 8.
Distribution of Average Gradient (AG) scores across fusion methodologies. Higher AG values indicate sharper edge definition. The Deep Learning models (UNet-DC, UNet-SC, AFU-Net) consistently outperform the classical Laplacian Pyramid baseline, effectively recovering critical morphological details from the Z-stack.
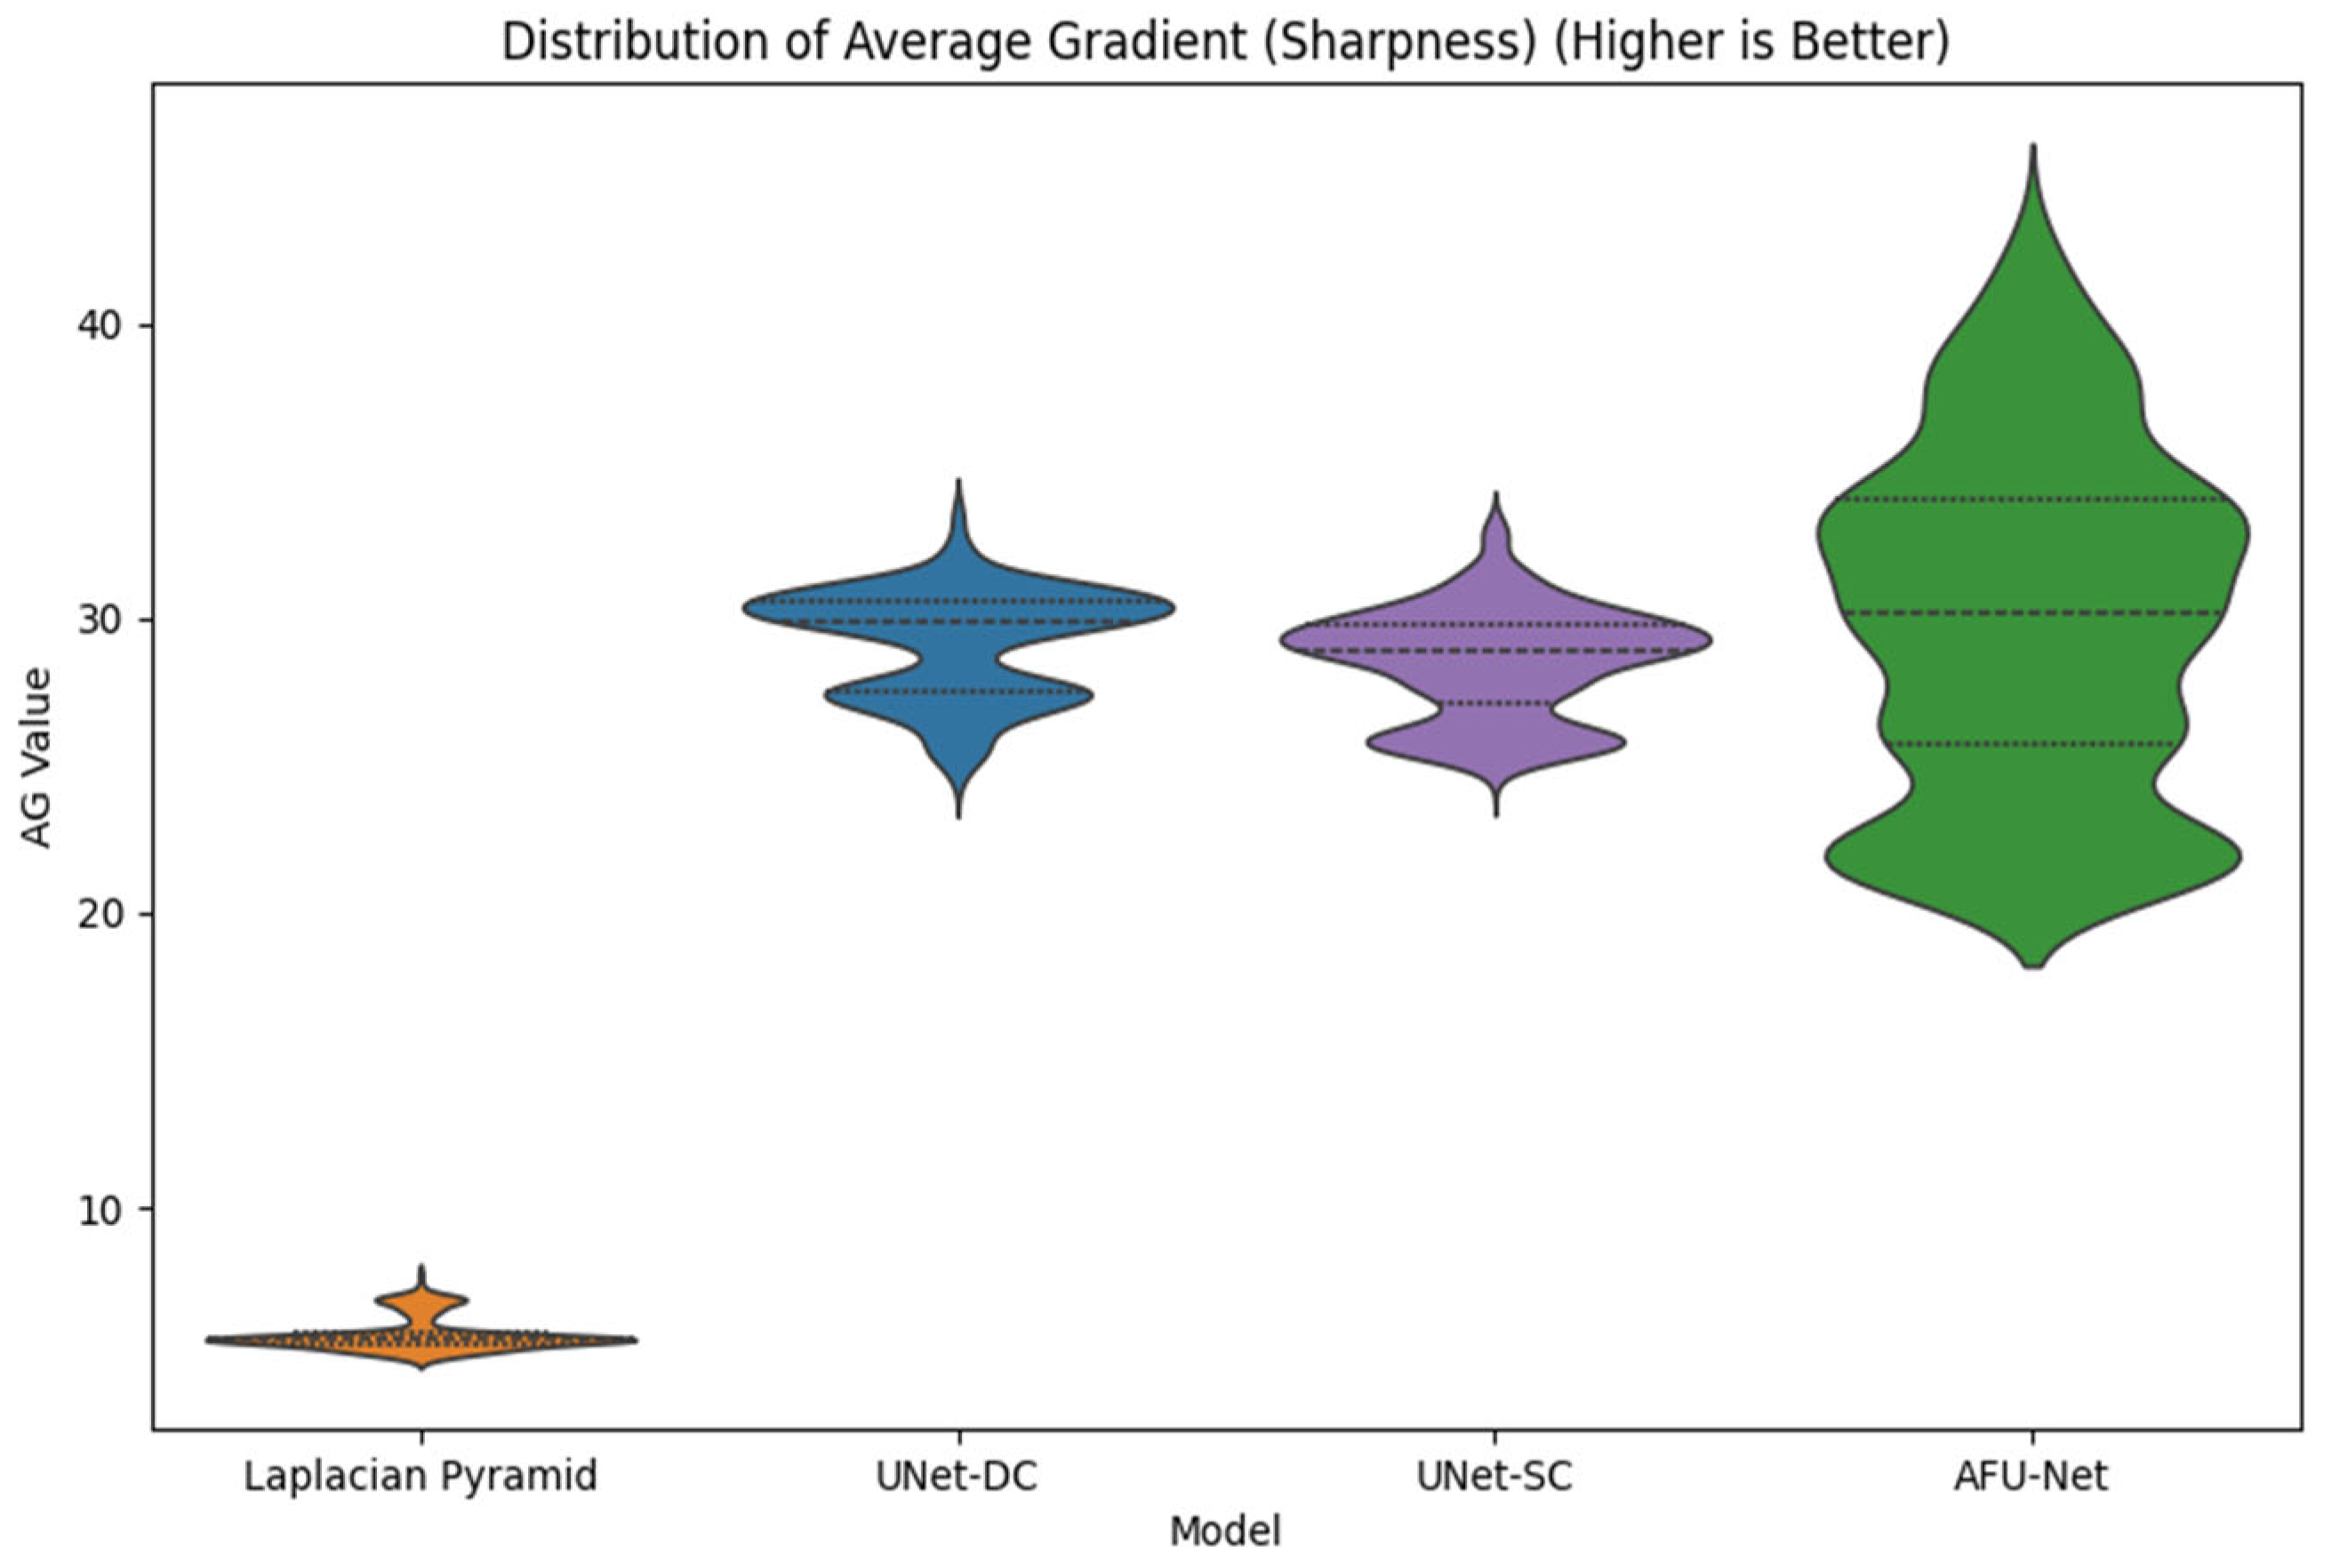
Figure 9.
Quantitative assessment of fusion image quality. While AFU-Net achieved the highest sharpness, the UNet-SC model offered the optimal balance, delivering a ~5x increase in sharpness compared to the baseline while maintaining an ultra-low latency of 7.1 ms. This speed is critical for real-time sensor operation.
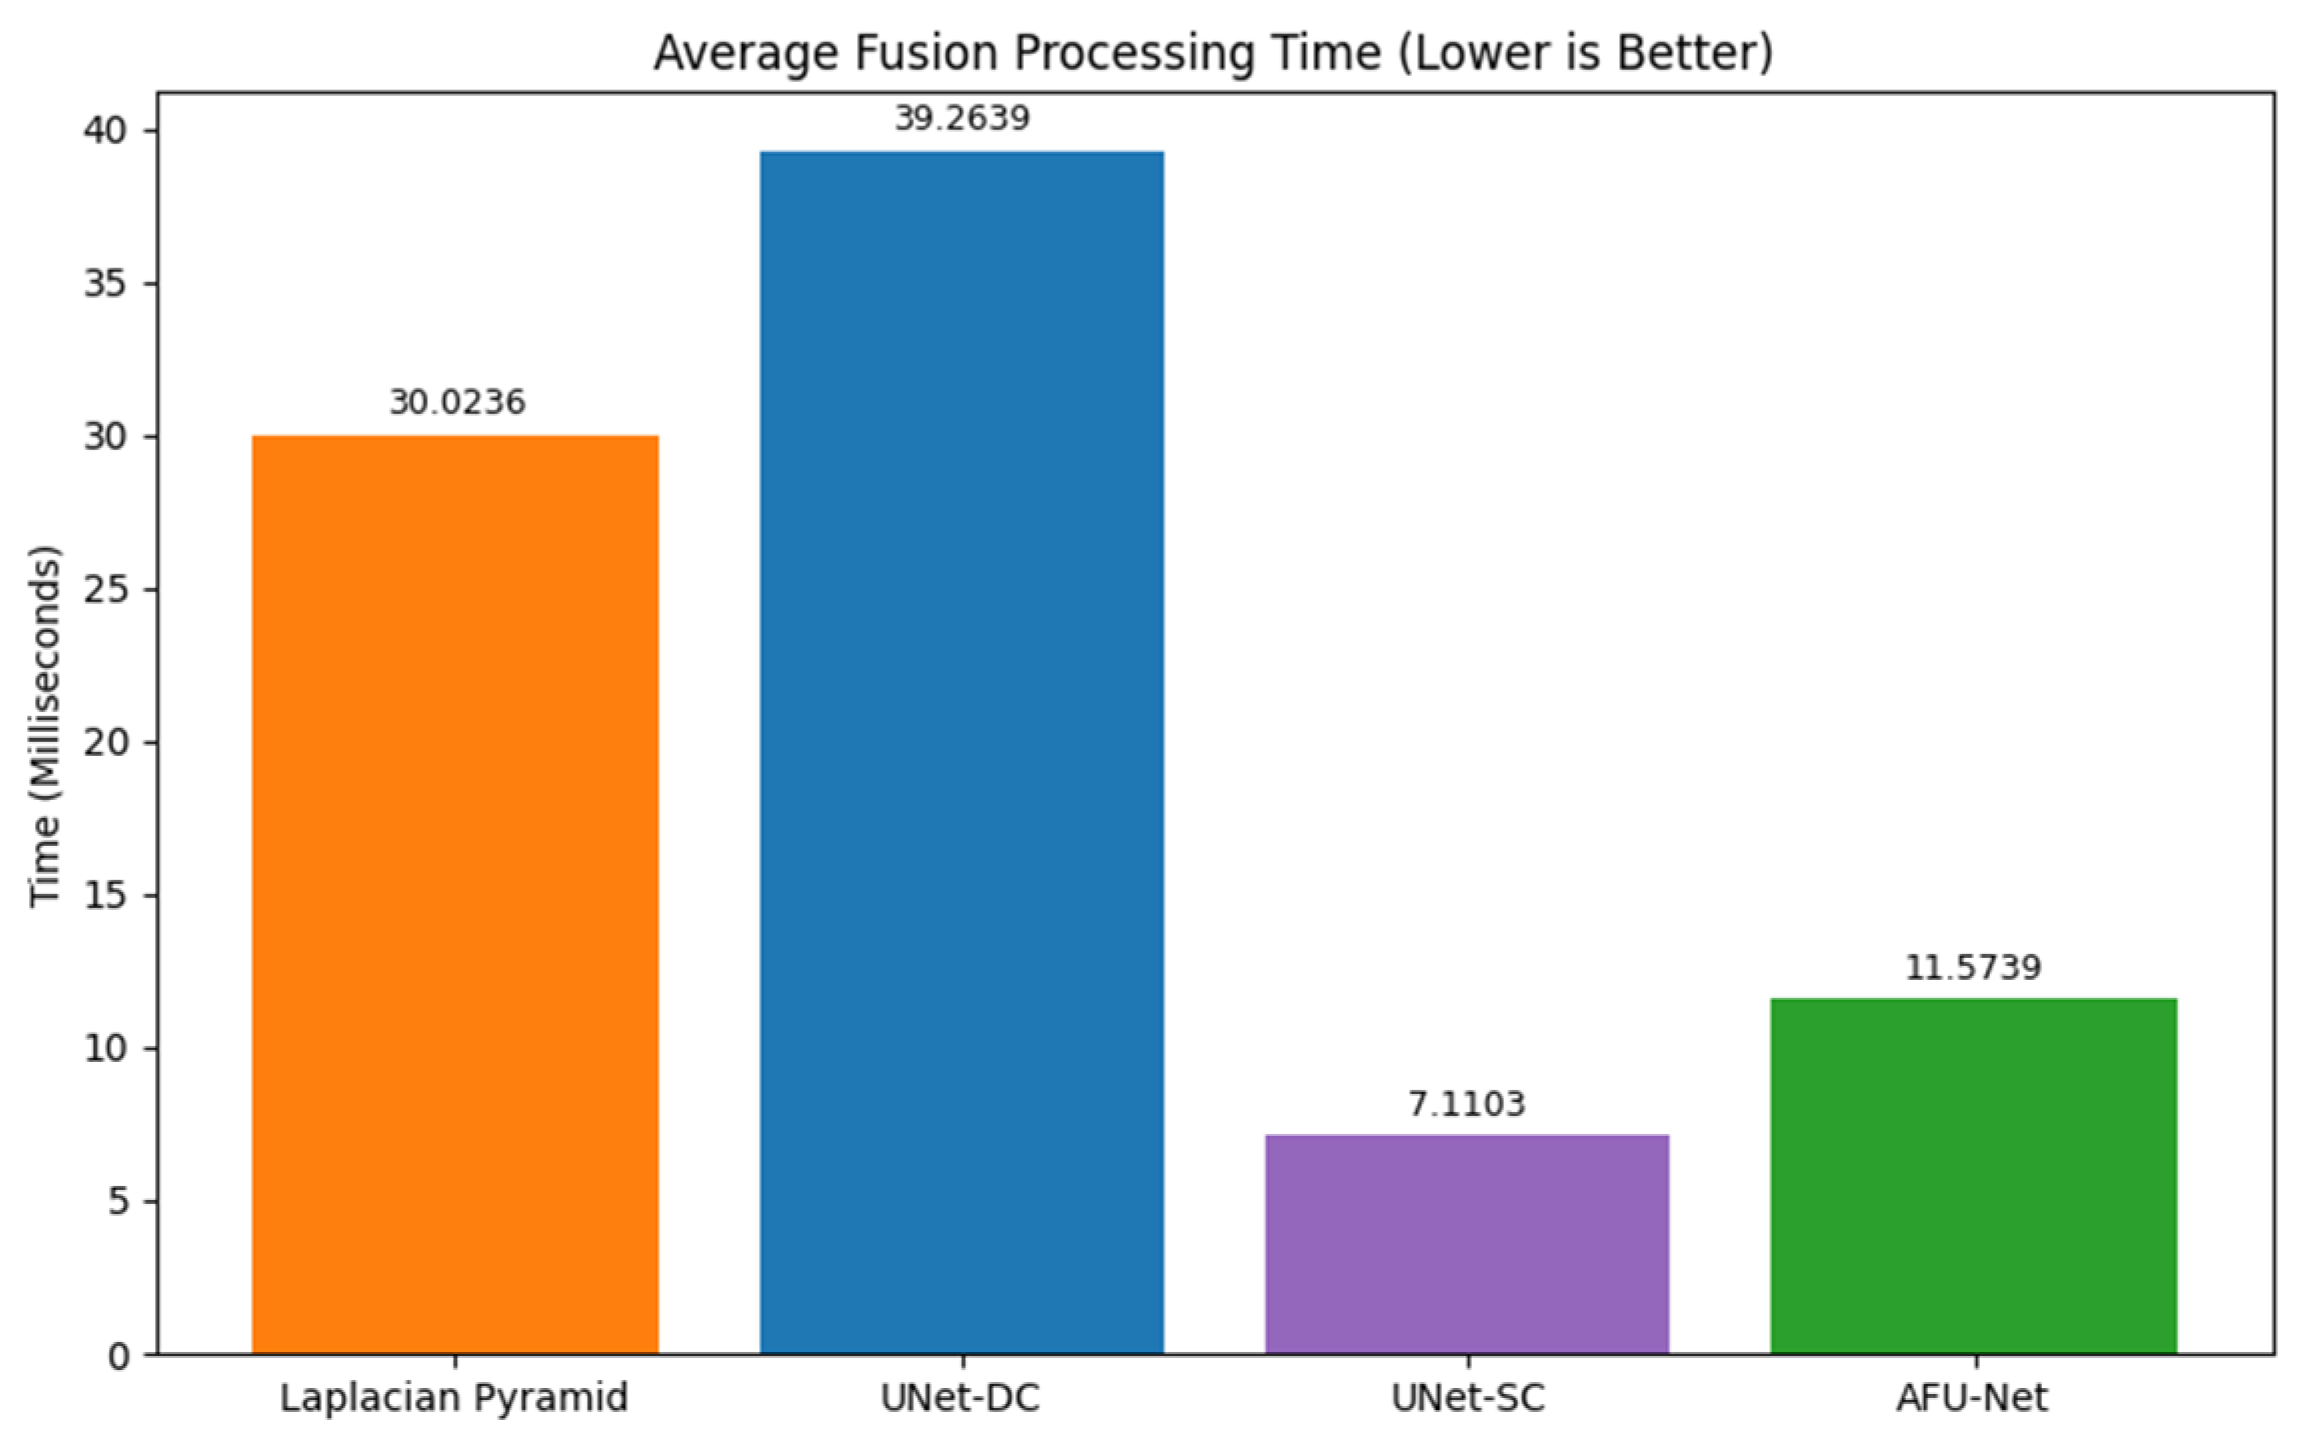
Figure 10.
Training and Validation Loss Curves for Swin-Tiny. The graph shows the Cross-Entropy Loss decreasing steadily over epochs, with no divergence between training and validation lines, indicating stable convergence without overfitting.
Figure 10.
Training and Validation Loss Curves for Swin-Tiny. The graph shows the Cross-Entropy Loss decreasing steadily over epochs, with no divergence between training and validation lines, indicating stable convergence without overfitting.
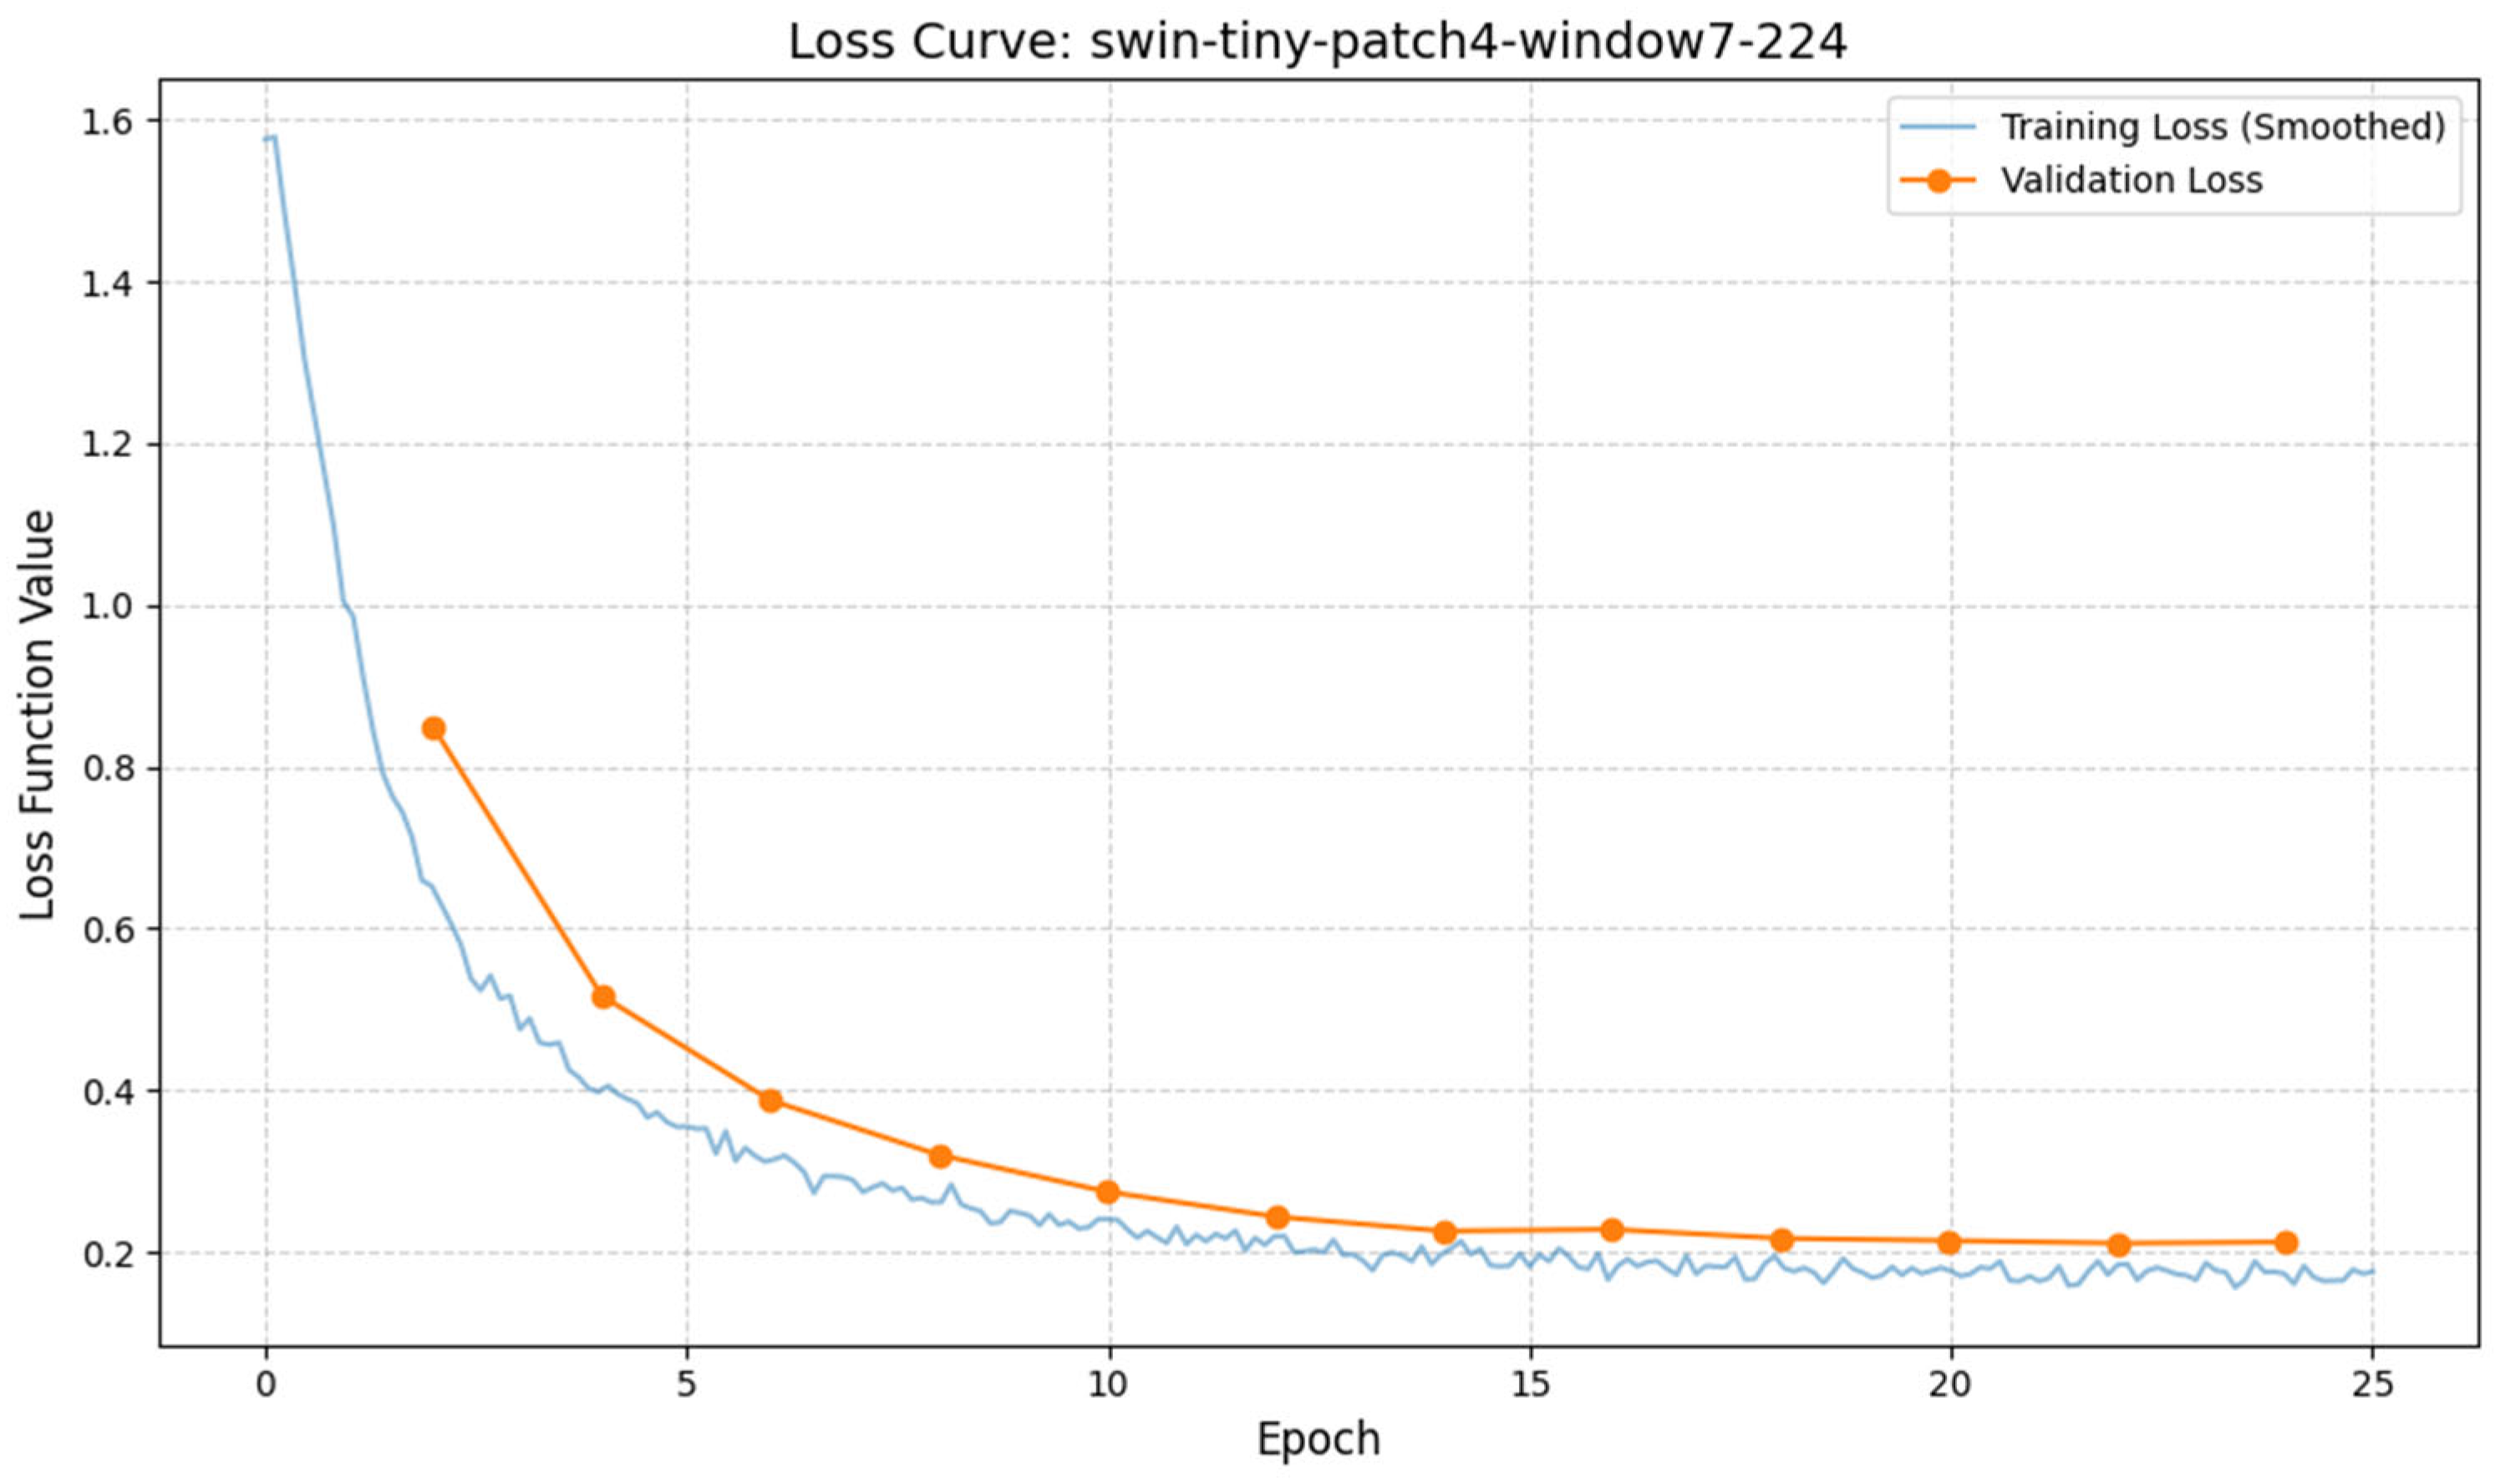
Figure 11.
Per-Class F1-Score for Swin-Tiny. The model demonstrates exceptional sensitivity (>97%) for distinct cleavage stages (e.g., 2-cell, 4-cell). A noted drop in performance is observed for the “3-cell” class (F1=0.73), which corresponds to a highly transient biological state often conflated with late 2-cell or early 4-cell stages.].
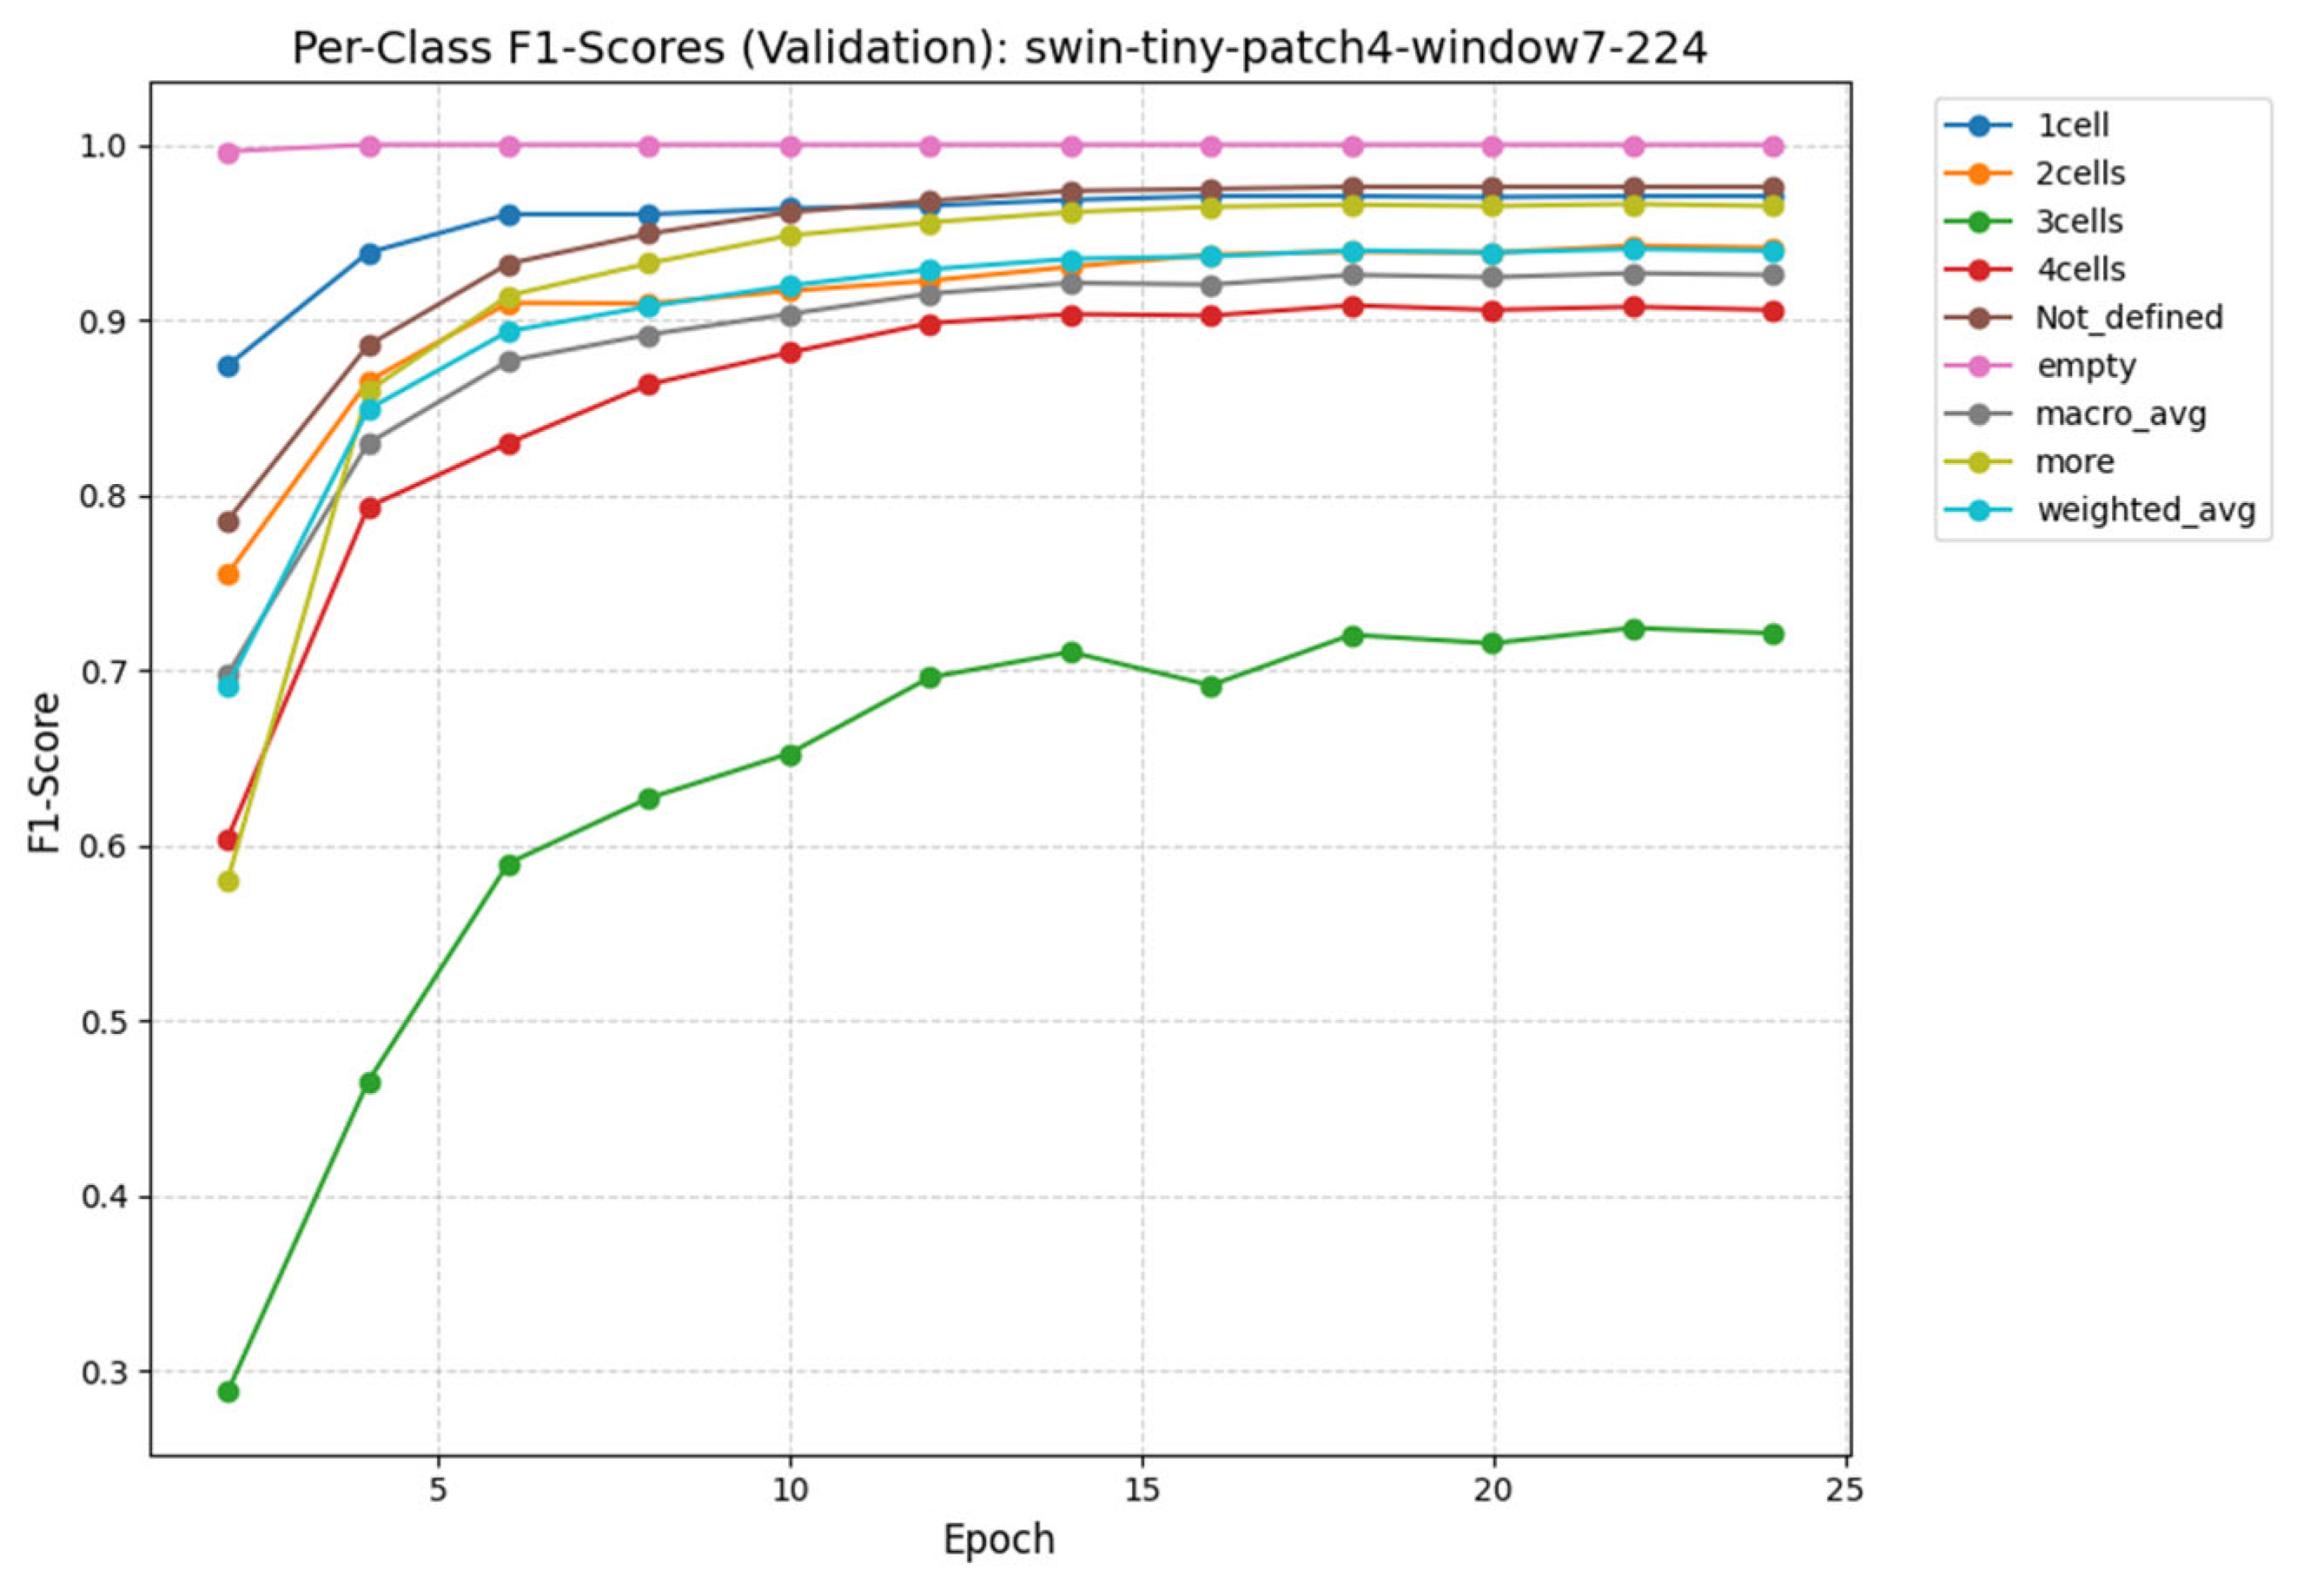
Figure 12.
Normalized Confusion Matrix for the Swin-Tiny model on the Test Set. The diagonal elements represent correct classifications. The high values on the diagonal (>0.94 for distinct cleavage stages) confirm the sensor’s robustness. Most misclassifications occur between adjacent developmental stages (e.g., 2-cell vs. 3-cell), which is clinically acceptable due to biological transition periods.
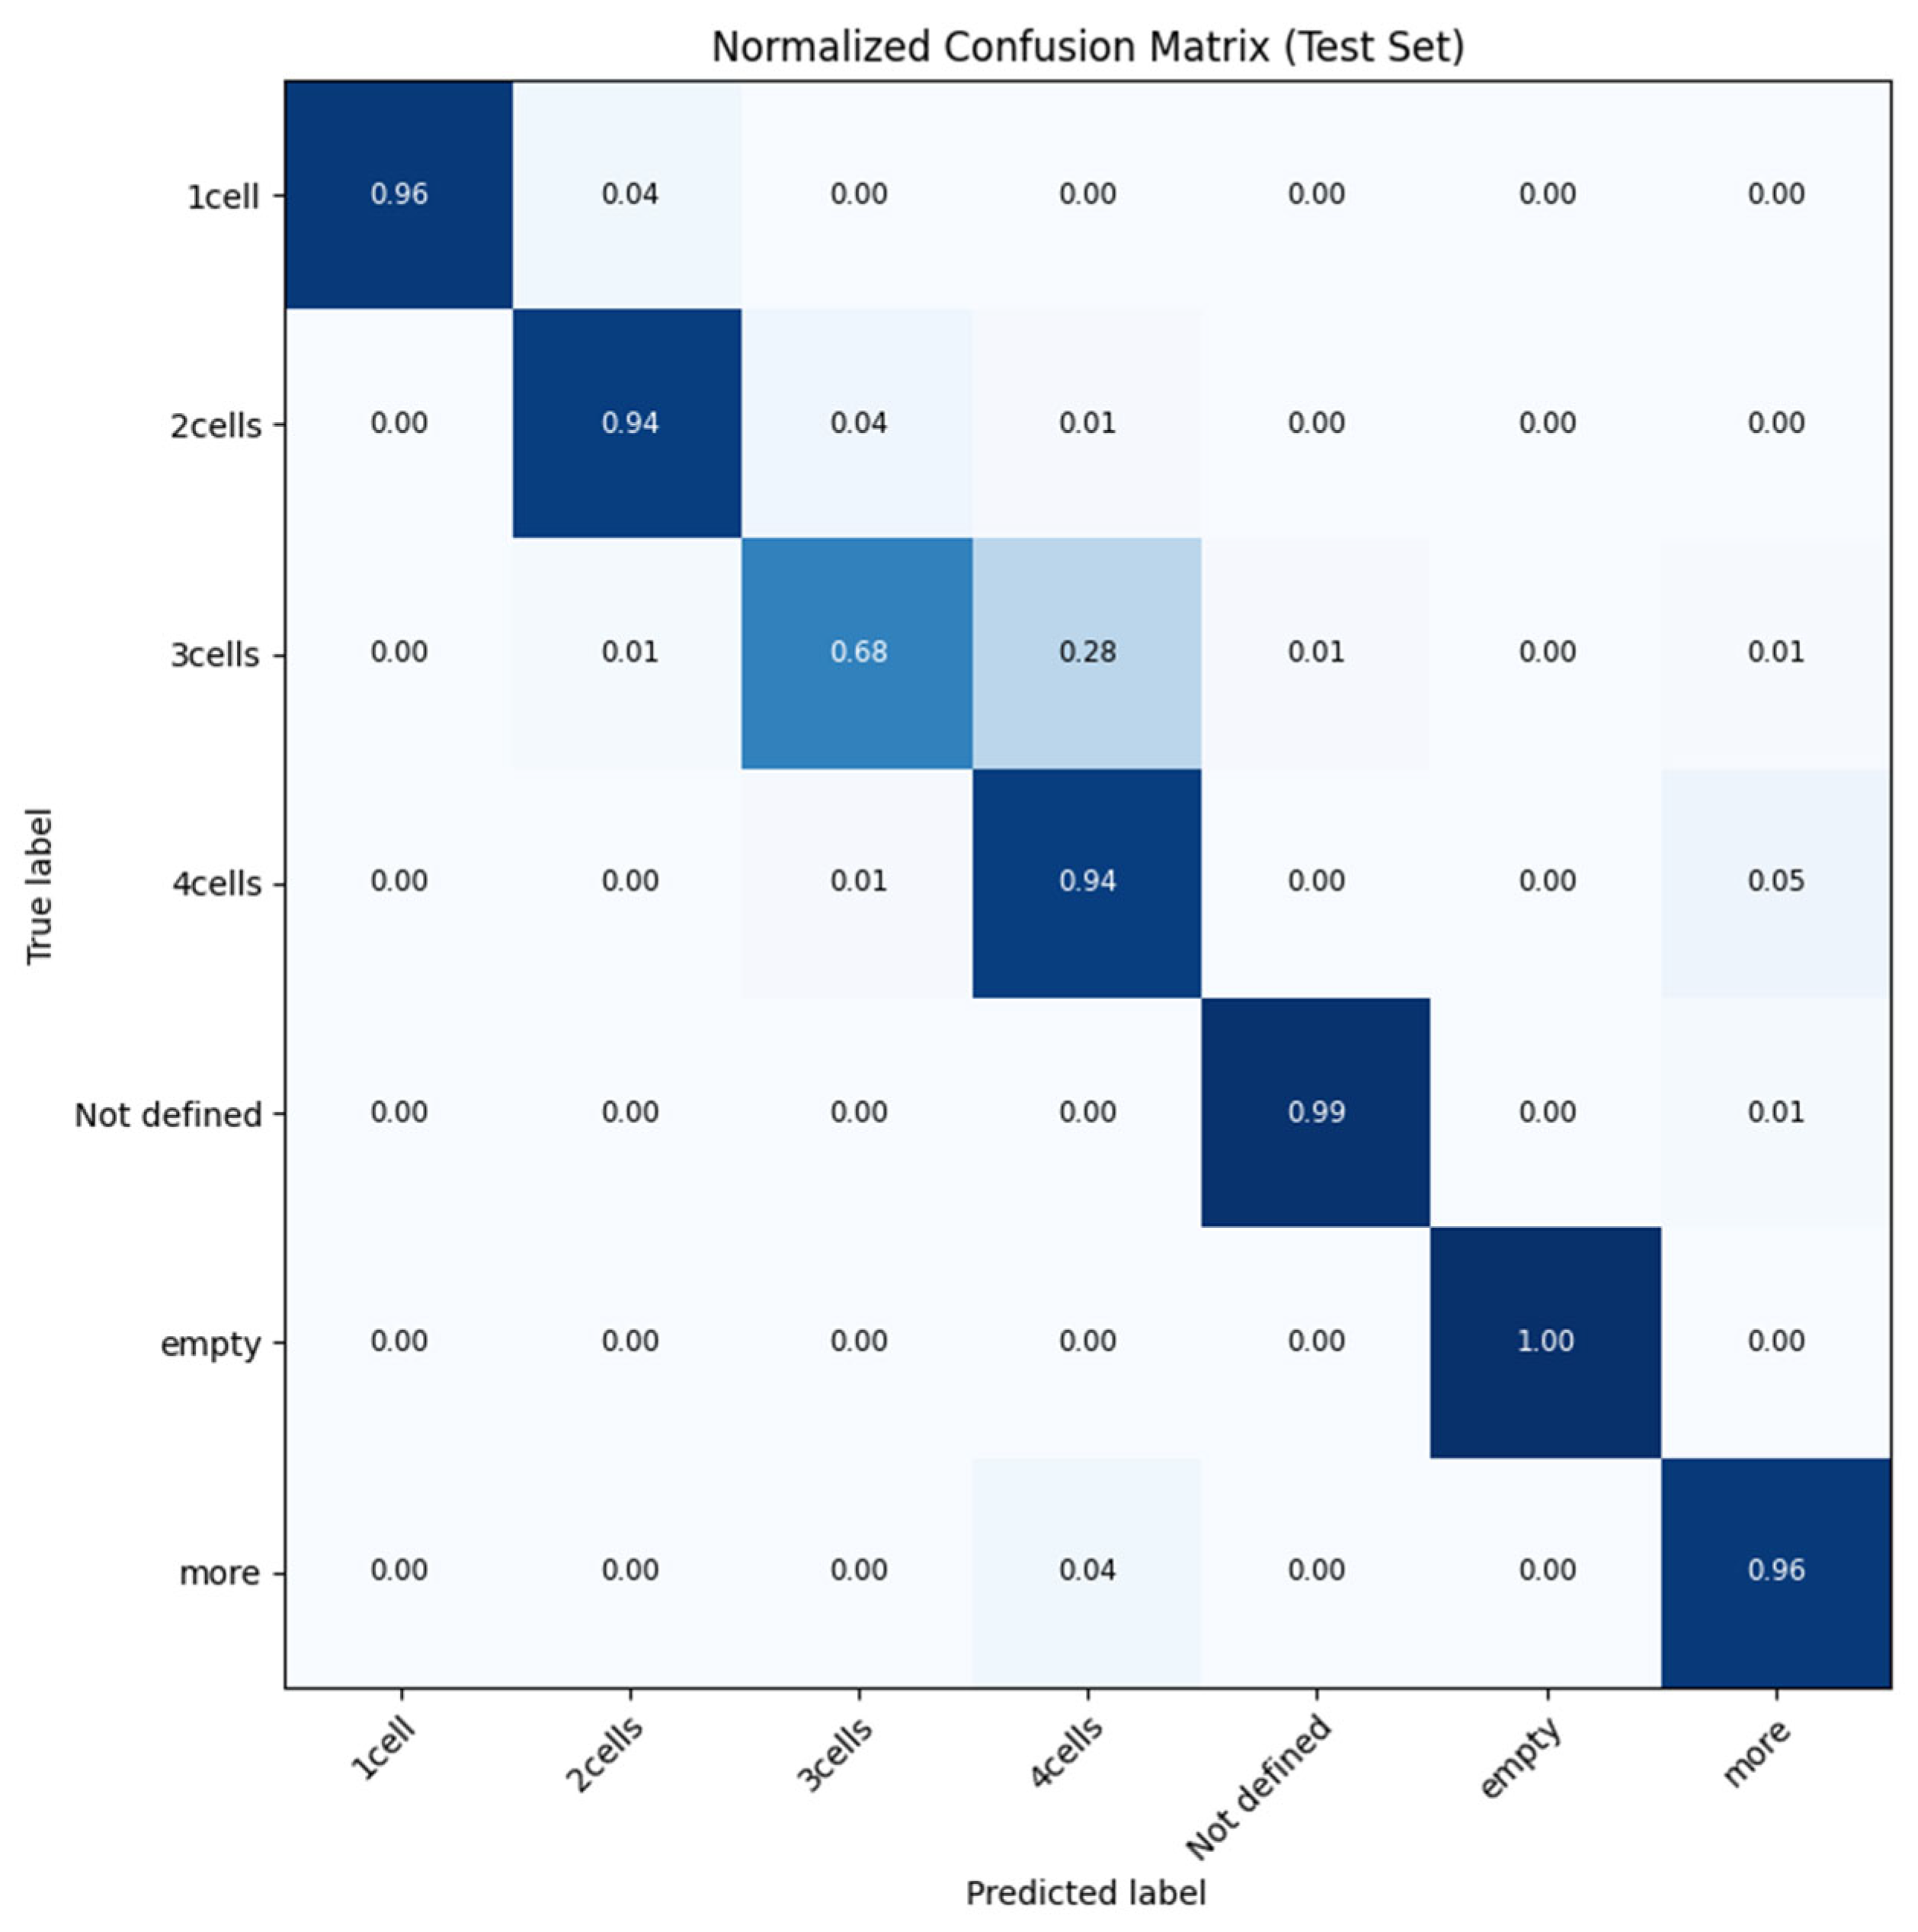
Figure 13.
UMAP Visualization by K-Means Cluster of the semantic knowledge base. The distinct separation of clusters confirms that the database can mathematically distinguish between different developmental stages, which is a prerequisite for accurate retrieval.
Figure 13.
UMAP Visualization by K-Means Cluster of the semantic knowledge base. The distinct separation of clusters confirms that the database can mathematically distinguish between different developmental stages, which is a prerequisite for accurate retrieval.
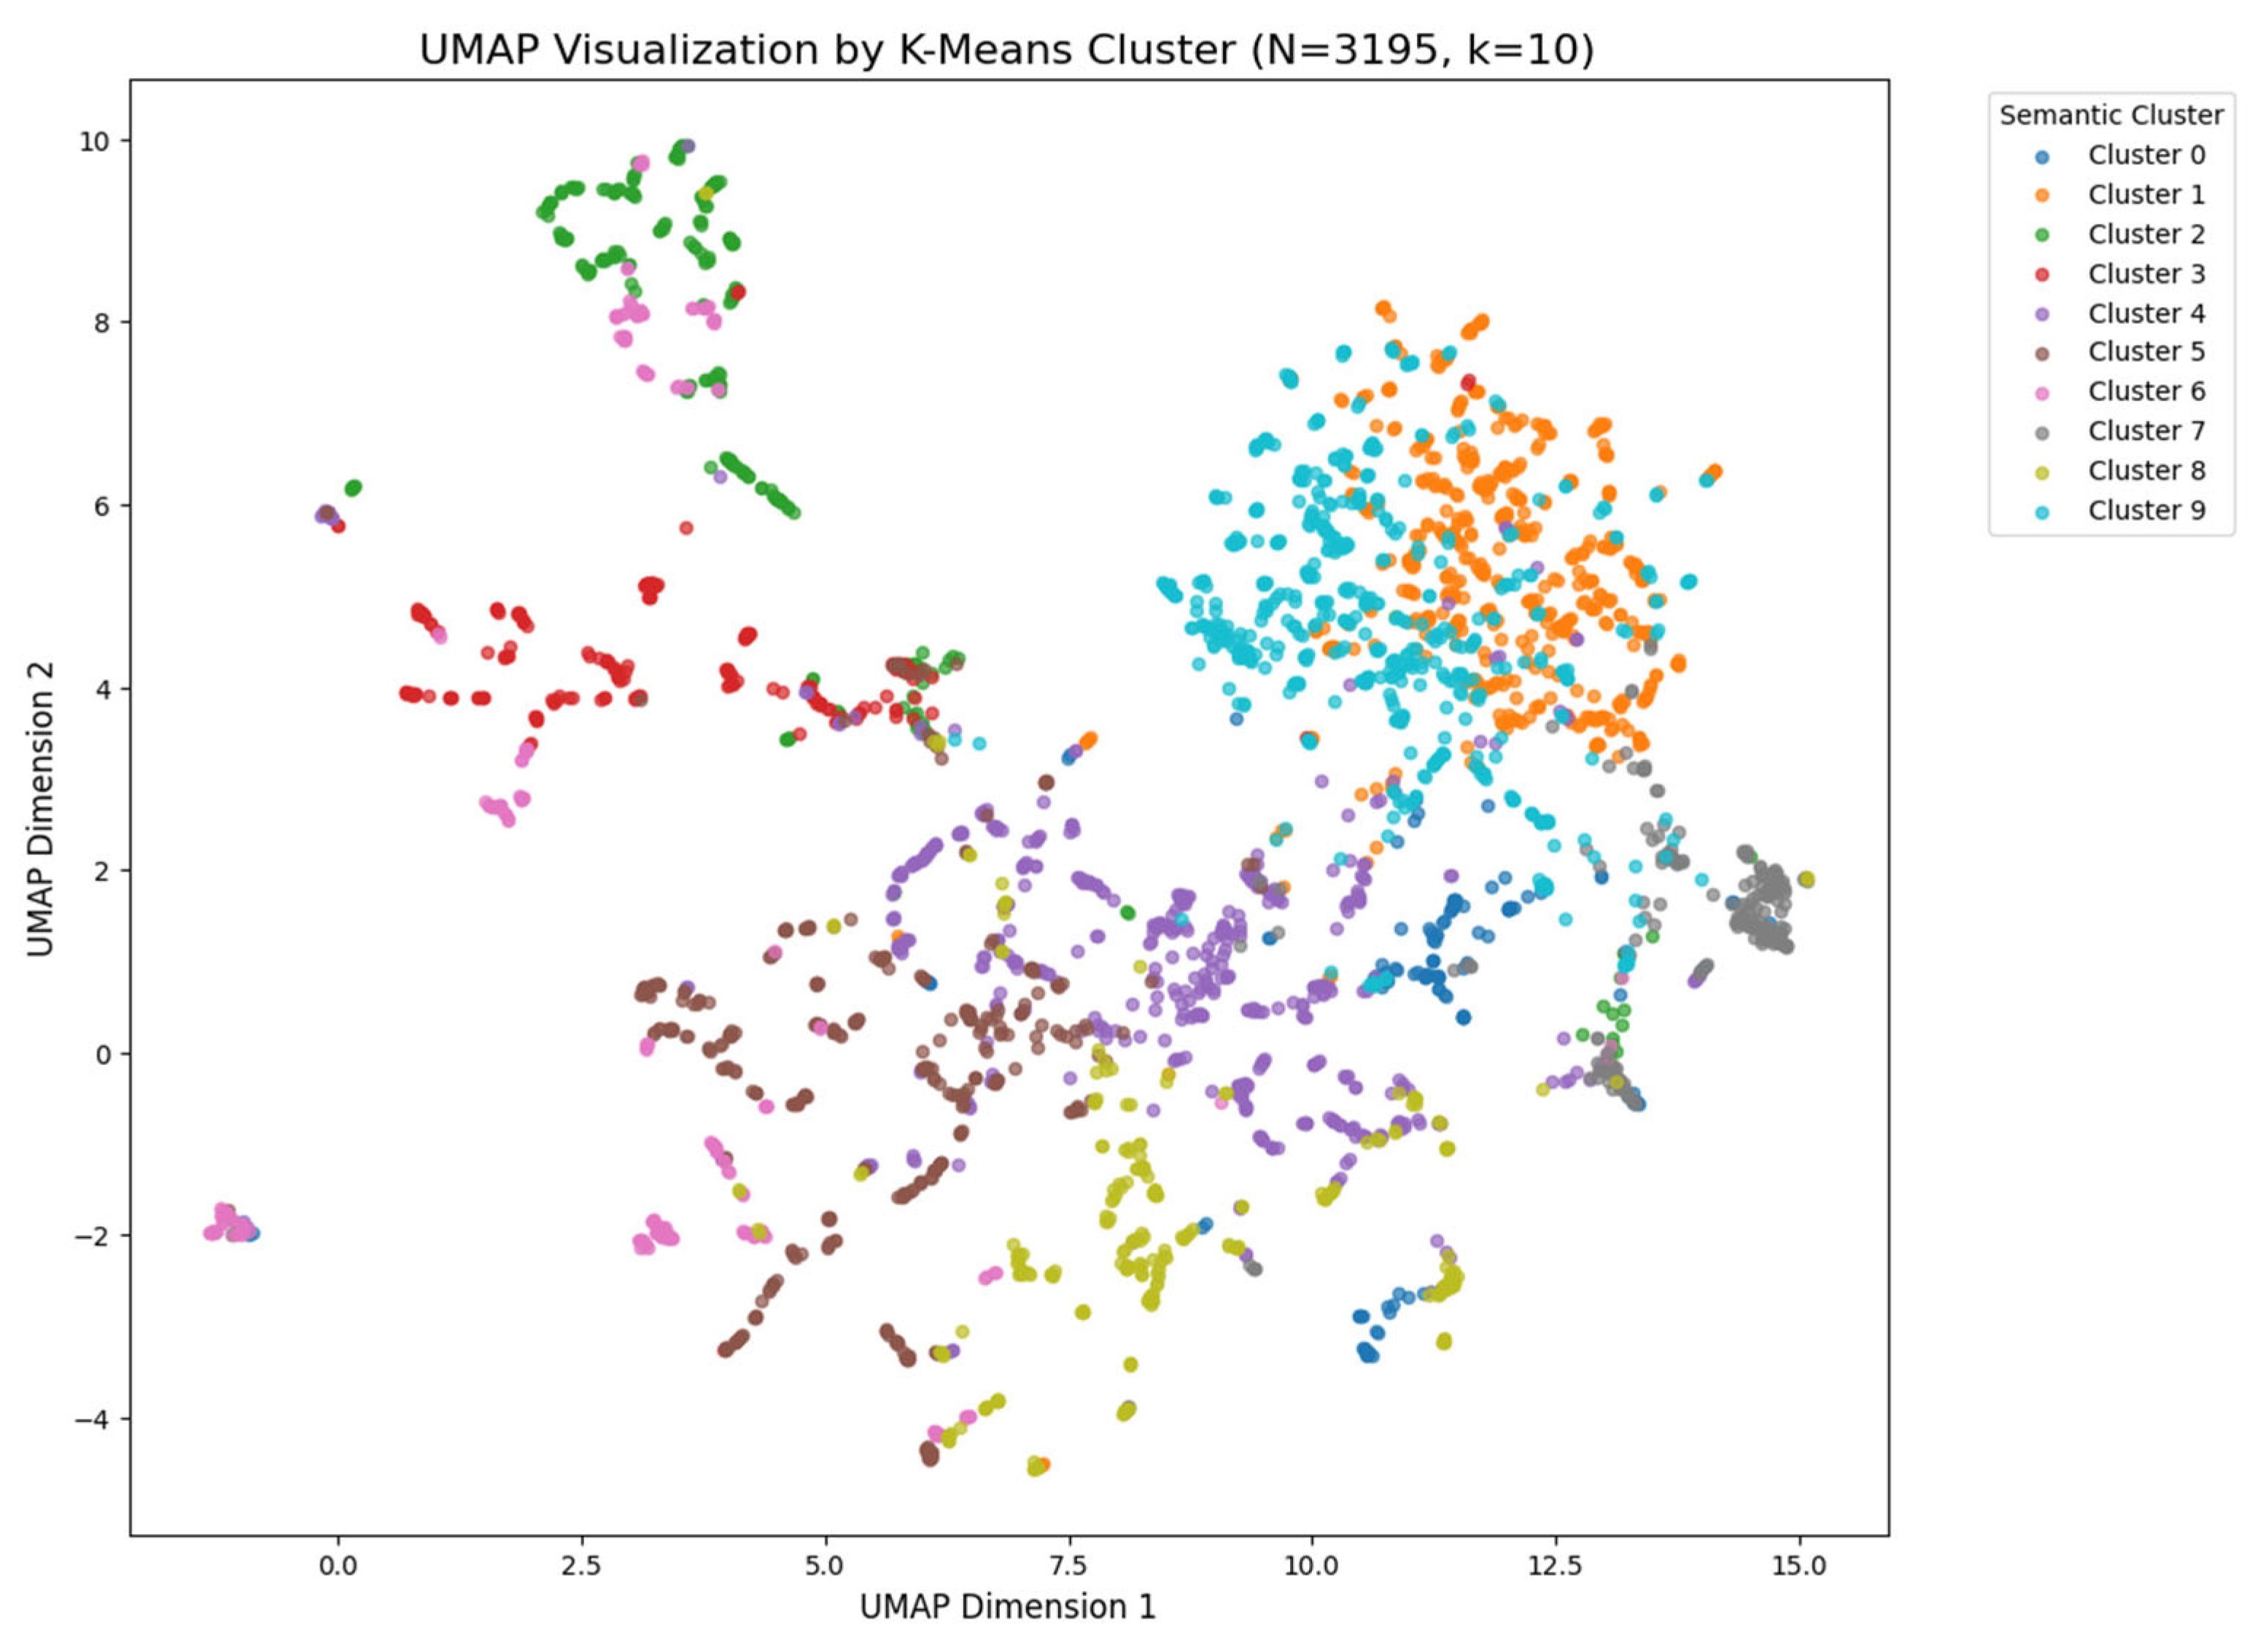
Figure 14.
Successful Annotation Example. An image overlaid with a detailed, biologically correct text explanation generated by the Mistral-7B model on the RTX 5070 Ti.
Figure 14.
Successful Annotation Example. An image overlaid with a detailed, biologically correct text explanation generated by the Mistral-7B model on the RTX 5070 Ti.
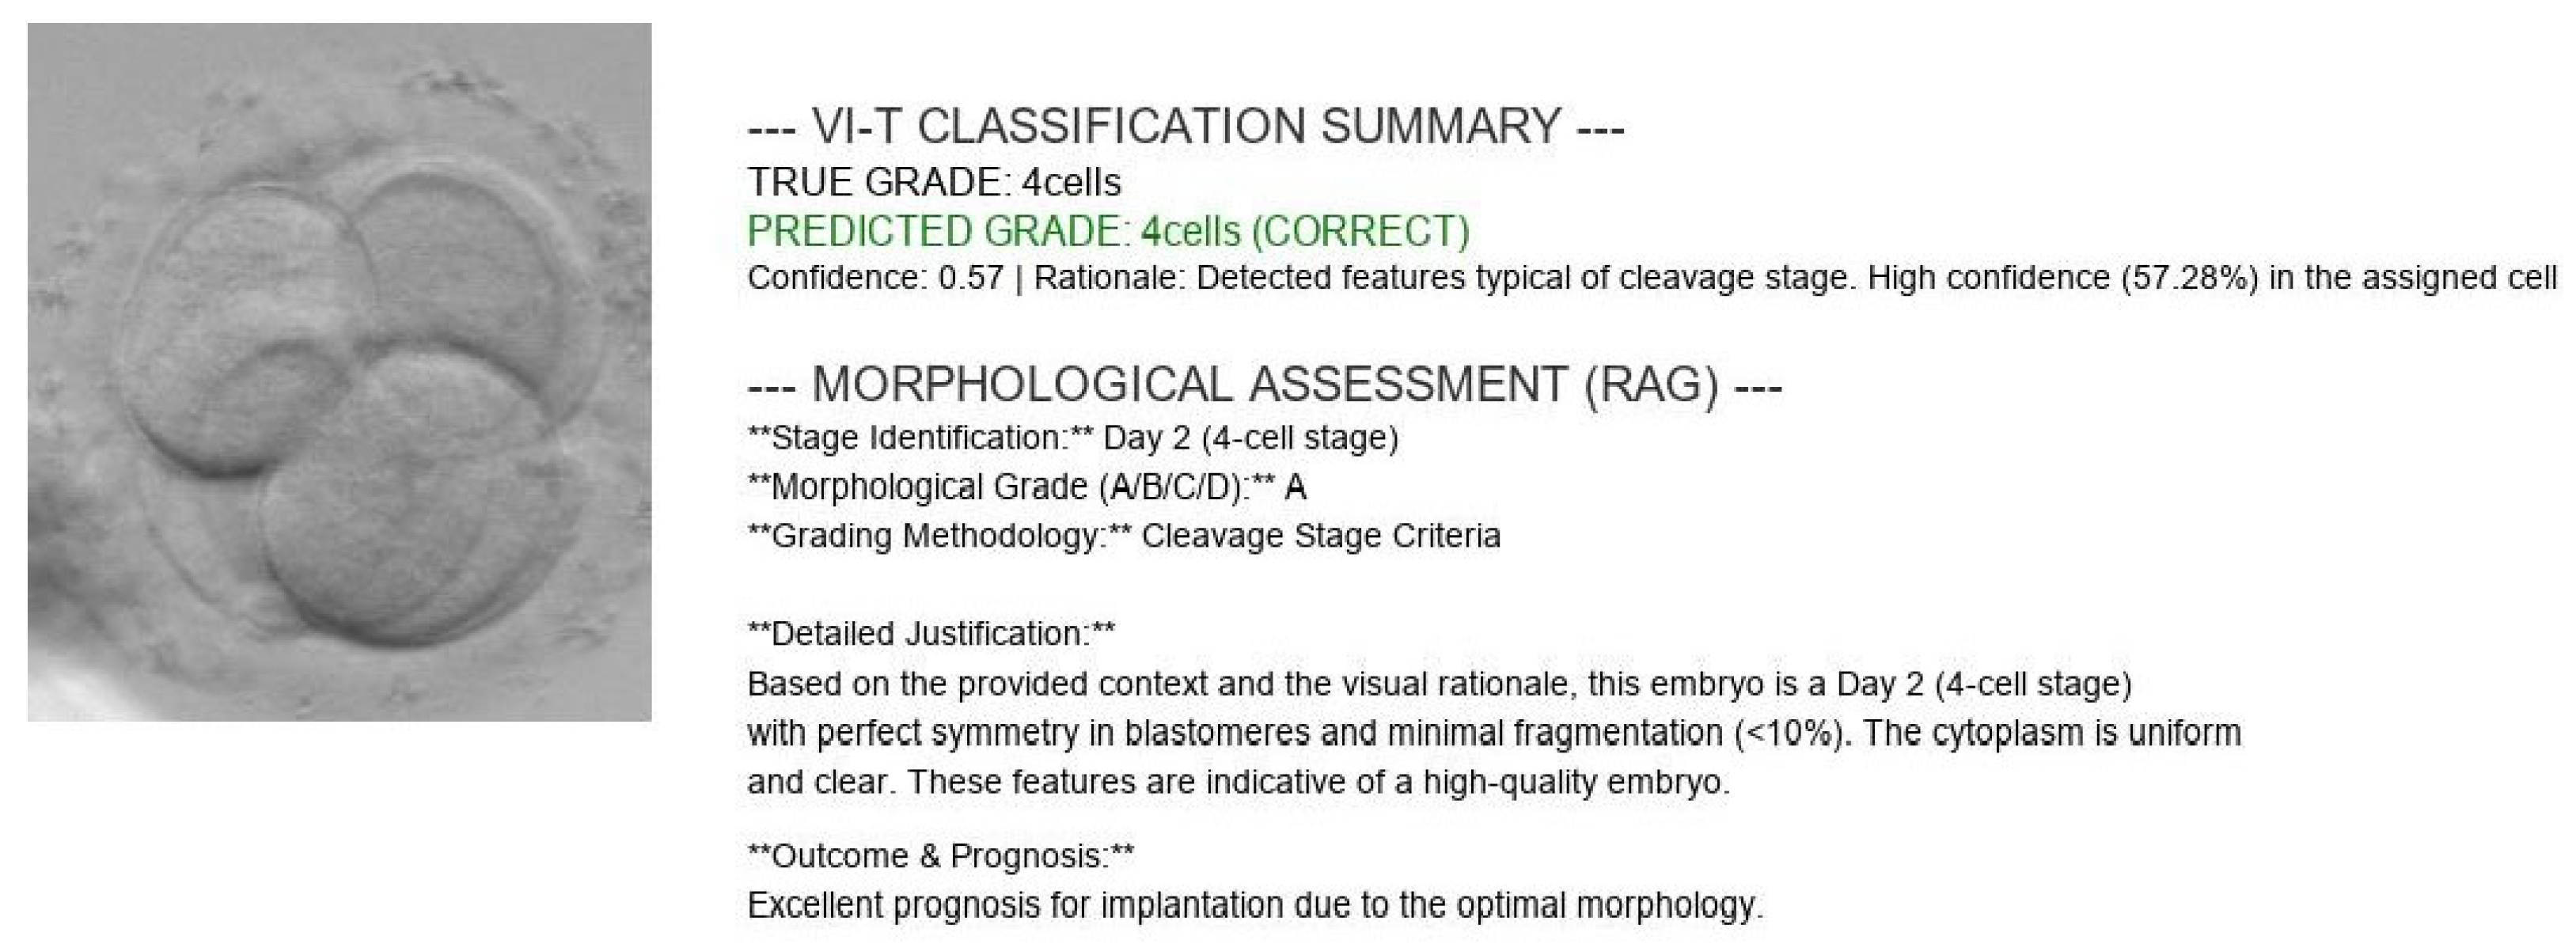

Table 1.
Comparative performance of the Soft Sensor.
| Model Architecture | Test accuracy | Inference FLOPs (G) | Latency (ms) | Parameters (M) | F1-Score (3-cells) | F1-Score (Macro) |
| ViT-Base | 0.965 | 16.87 | 6.86 | 85.80 | 0.831 | 0.956 |
| Swin-Tiny (Edge Selected) | 0.941 | 4.51 | 7.37 | 27.52 | 0.731 | 0.928 |
| ConvNeXt-Tiny | 0.914 | 1.46 | 3.02 | 27.82 | 0.637 | 0.894 |
Table 2.
Comparative performance of the Soft Sensor Swin tiny (Fused and just one focal plane).
| Input data modality | Accuracy | F1-Score (Macro) | Error Rate |
| Single-plane (FP0) | 84.68% | 0.823 | 15.32% |
| Multi-focus fused using (UNET-SC) | 94.12% | 0.928 | 5.88% |
Disclaimer/Publisher’s Note: The statements, opinions and data contained in all publications are solely those of the individual author(s) and contributor(s) and not of MDPI and/or the editor(s). MDPI and/or the editor(s) disclaim responsibility for any injury to people or property resulting from any ideas, methods, instructions or products referred to in the content. |
© 2026 by the authors. Licensee MDPI, Basel, Switzerland. This article is an open access article distributed under the terms and conditions of the Creative Commons Attribution (CC BY) license (http://creativecommons.org/licenses/by/4.0/).
Copyright: This open access article is published under a Creative Commons CC BY 4.0 license, which permit the free download, distribution, and reuse, provided that the author and preprint are cited in any reuse.


