Submitted:
27 January 2026
Posted:
28 January 2026
You are already at the latest version
Abstract
Urban last-mile logistics is increasingly served by light electric micro-mobility vehicles, whose high-variability duty cycles accelerate heterogeneous degradation and intermittent faults. This study presents a reproducible, data-centric workflow for predictive maintenance using public sensor datasets and addresses 3 complementary tasks: (i) battery ageing prognostics via State-of-Health (SoH) trajectory forecasting, (ii) multi-class fault diagnosis from propulsion/thermal telemetry, and (iii) tyre-pressure–aware energy-consumption modelling. Battery ageing was analysed using the NASA Prognostics Center of Excellence dataset of 4 Li-ion 18650 cells (B0005, B0006, B0007, B0018). After cleaning and smoothing charge-phase records, an LSTM model (50 hidden units, 35 epochs, batch size 256, shuffle=False) tracked measured capacity fade with stable convergence; removing normalization produced a small reported degradation (average error increase of 0.3%). A degree-2 polynomial regression baseline captured the global decay trend but generalized less effectively (test R² = 0.6861, test MAE = 0.0274). For fault diagnosis on the “New Energy Vehicles Diagnosis” dataset, Random Forest achieved the highest test performance (accuracy 0.899, macro-F1 0.900, macro-AUC 0.985), followed by SVM (RBF) and logistic regression. For energy consumption regression including tyre pressure, linear regression showed consistent generalization (test R² = 0.9474, test MSE = 0.2528) under nominal pressure conditions (≈ 28–35 psi). Overall, the results indicate that task-appropriate model selection and disciplined preprocessing can yield reliable, interpretable predictive signals for maintenance planning in micro-mobility contexts.
Keywords:
predictive maintenance
; electric vehicles
; micro-mobility
; battery degradation
; remaining useful life
; fault diagnosis
; energy consumption
; tyre pressure
; machine learning
; IoT sensing
1. Introduction
Urban last-mile logistics is undergoing a rapid electrification driven by decarbonization targets, local air-quality constraints, and the need to reduce congestion and noise. Light electric vehicles—ranging from e-bikes and cargo e-bikes to compact commercial platforms—are increasingly deployed for short, frequent delivery missions. However, these duty cycles are characterized by high variability in payload, stop-and-go operation, route topology, ambient conditions, and charging patterns. Such variability accelerates heterogeneous degradation mechanisms across key subsystems (battery pack, electric drive, power electronics, cooling, and mechanical transmission) and increases the probability of intermittent faults that are difficult to diagnose with scheduled maintenance alone. In this context, predictive maintenance has emerged as a data-driven paradigm to anticipate failures, reduce unplanned downtime, and optimize maintenance planning by transforming continuous monitoring into actionable health indicators and prognostics. This shift—from reactive and time-based maintenance to condition-based and predictive strategies—has been widely recognized as a core enabler of operational efficiency and reliability in complex electro-mechanical systems. [1,2]
The feasibility of predictive maintenance in light electric vehicles is tightly coupled to the availability of on-board sensing and connectivity. Modern platforms can provide multi-modal telemetry through IoT sensor suites, including voltage and current measurements, temperature probes, vibration signals, rotational speed, and contextual information (e.g., operating modes). When combined with machine learning, these data streams support three complementary capabilities: (i) real-time condition monitoring and anomaly detection, (ii) fault diagnosis (including fault-type identification), and (iii) prognostics, typically expressed as Remaining Useful Life (RUL) or Time To Failure (TTF). Battery-centric analytics is particularly critical because battery degradation directly impacts range, power availability, safety margins, and total cost of ownership. Recent literature highlights the growing role of machine learning for battery lifecycle management, spanning state estimation, health assessment, and long-horizon degradation modeling under realistic usage. [3] In parallel, application-specific constraints—such as e-bike charging practices and circuit-level characteristics—reinforce the need for models that remain robust under non-ideal, usage-driven variability. [4]
Despite significant progress, several challenges remain open, especially for light electric vehicles and e-bikes. First, degradation and fault signatures are often weakly separable and strongly confounded by operating conditions (temperature, load, riding style, and charging behavior). Second, datasets collected in the field are frequently scarce, noisy, partially labeled, or proprietary, limiting reproducibility and cross-study comparability. Third, high-performing models must be complemented by careful data engineering (synchronization, cleaning, scaling, leakage avoidance) and by evaluation protocols that reflect real deployment constraints. Within battery prognostics, both physics-informed and data-driven approaches have been explored. For example, adaptive filtering strategies have been used to update electrochemistry-based models under randomized use profiles, while online data-driven methods have been proposed to estimate battery RUL in streaming settings. [5,6] Low-complexity degradation models (e.g., nonlinear autoregressive formulations) can offer computational efficiency, whereas neural architectures that exploit structured charge profiles can improve capacity estimation and generalization across operating regimes. [7,8] More broadly, the selection of machine learning paradigms (supervised, unsupervised, semi-supervised, reinforcement learning) depends on label availability, fault prevalence, and deployment objectives. [9]
Motivated by these needs, this study develops and validates a reproducible, end-to-end research workflow for predictive diagnostics and prognostics in light electric vehicle subsystems using heterogeneous sensor data. The work targets three technically complementary tasks that reflect the core operational risks of last-mile electric platforms. The Battery RUL forecasting from time-series telemetry, focusing on capacity fade trajectories and end-of-life thresholds. The objective is to predict degradation trends early enough to support maintenance scheduling and battery replacement decisions. The Thermal and propulsion fault diagnosis as a multi-class classification problem, where the goal is not only to detect abnormal operation but also to discriminate among fault categories associated with key electro-mechanical components and the Energy consumption modeling with emphasis on tyre pressure effects, addressing the link between rolling resistance, efficiency, and safety by quantifying how pressure and other contextual variables contribute to real-time energy demand.
To ensure transparency and replicability, the analysis is grounded on publicly available datasets that represent common benchmarking scenarios in prognostics and vehicle diagnostics. Battery RUL modeling leverages Li-ion cycling data from the NASA Prognostics Center of Excellence repository, which provides standardized charge/discharge experiments for accelerated aging studies. [28] The State of Health (SoH) is defined in terms of capacity retention, consistent with widely adopted formulations in the battery-health literature. [29] For propulsion and thermal fault diagnosis, a labeled vehicle telemetry dataset is used to train supervised classifiers for fault-type discrimination. [30] Finally, energy consumption modeling relies on an EV energy-consumption dataset that includes tyre pressure alongside driving behavior and environmental factors, enabling the study of efficiency impacts under realistic contextual variability. [32]
Across all tasks, the methodology follows a coherent data-centric pipeline: data cleaning and denoising; outlier handling; feature selection/engineering; scaling and normalization when required; and strict separation of training and test procedures to minimize leakage. For time-series battery modeling, the temporal ordering of measurements is preserved to capture long-range dependencies, while performance is quantified using error metrics appropriate for regression and prognostics. For fault diagnosis, model performance is assessed with standard classification metrics (accuracy, precision, recall, F1-score) and threshold-independent measures (AUC), enabling robust comparisons across algorithms and class distributions. [26,27]
On the modeling side, the battery RUL task emphasizes sequence learning via recurrent architectures (LSTM) implemented in a modern deep-learning stack, reflecting the suitability of LSTM networks for long-horizon time dependencies in degradation signals. [15] The approach is complemented by simpler baselines (e.g., polynomial regression) to quantify the trade-off between model complexity and generalization under limited data. For fault diagnosis, multiple supervised learners are compared to balance predictive power and operational usability: ensemble tree methods (Random Forest), margin-based classifiers (SVM), and interpretable linear probabilistic models (logistic regression). These algorithmic families are widely used in engineering diagnostics and offer distinct advantages in handling nonlinearity, robustness, and interpretability. [18,19,21] For energy consumption estimation, linear regression is adopted as a first-principles, interpretable baseline to quantify feature contributions and establish a benchmark for future non-linear extensions. [22,23]
Overall, the contribution of this work is twofold: (i) a unified, reproducible methodology that maps heterogeneous IoT telemetry to actionable prognostics and diagnostics for multiple subsystems, and (ii) an experimental evaluation that clarifies when higher-capacity sequence models are justified versus when simpler, interpretable models provide competitive performance. This positioning is intended to support the development of deployable predictive maintenance modules for light electric vehicles operating in the highly variable conditions typical of urban logistics, where reliability, efficiency, and safety must be optimized simultaneously. [31]
2. Materials and Methods
2.1. Battery Ageing Dataset and RUL Modelling
Battery degradation was investigated using the NASA Prognostics Center of Excellence Data Repository dataset [28], which includes 4 lithium-ion 18650 cells tested under repeated charge–discharge–rest cycles at constant ambient temperature. Charging was performed using a CCCV protocol: constant current at 1.5 A until the cell voltage reached 4.2 V, followed by constant voltage until the current decreased to 20 mA. Discharge was performed at constant current (2 A) down to cell-specific cut-off voltages (2.7 V for battery 5, 2.5 V for batteries 6 and 18, 2.2 V for battery 7) until the measured capacity dropped by 30% (nominal capacity 1.4 Ah). Electrochemical impedance data available in the repository were not used in this work. To characterize battery health, the State of Health (SoH) was computed as in equation 1 where C0 is nominal capacity and Ck is the capacity at cycle k [29].
SoH(%) = (Ck/C0) × 100
End-of-life was defined at SoH < 70%, below which reliable performance cannot be guaranteed. Consistently with the rationale reported in the draft, only charging profiles were retained for modelling because they follow a pre-set protocol and provide more stable and interpretable signatures of ageing compared with discharge profiles.
Raw measurements may include noise, irregular sampling, missing data, and outliers; therefore, a pre-processing stage was applied before modelling. Records corresponding to discharge cycles were removed, and non-valid values and outliers were handled using multiple approaches (standard-deviation based rules and Pandas-based procedures such as quantile analysis and z-score). To reduce high-frequency oscillations and spike-like artefacts, a moving average filter was applied, improving the visibility of input patterns used for model training (as illustrated in the draft figures). Battery Remaining Useful Life (RUL) and degradation trajectory prediction were implemented in Python using Keras with TensorFlow back-end.
An LSTM-based model was defined as a Sequential network comprising a single LSTM layer with deep units, followed by Dropout(0.1) and a Dense(1) output neuron. The model was compiled with MAE loss and Adam optimizer, tracking RMSE, MSE, MAE, and MSLE during training. Training was performed with shuffle=False to preserve temporal ordering. Model selection was performed across the available batteries using a rotation strategy in which 3 batteries were used for training and 1 for testing, iteratively. The configuration reported in the draft corresponds to 50 LSTM hidden units, 35 epochs, and batch size 256. A robustness check was also performed by training/testing the LSTM on a non-pre-processed dataset (i.e., without normalization), observing a marginal degradation in performance as described in the draft. Finally, on the non-pre-processed dataset and considering one battery at a time, a simpler baseline was tested using polynomial regression (degree 2), evaluated through MSE, MAE, and R² on train and test splits (as reported in the draft table).
2.2. Thermal and Propulsion Diagnostics Dataset and Multi-Class Fault Classification
For vehicle diagnostics beyond battery ageing, a labelled dataset was retrieved from Kaggle, “New Energy Vehicles Diagnosis” [30], provided as a .csv file. The dataset includes sensor-based measurements of: temperature (°C), ambient temperature (°C), motor speed (RPM), vibration (g), voltage (V), and current (A), along with an operational label indicating either normal operation or a fault condition. Four target classes were used as diagnostic outcomes: class 0 (normal), class 1 (motor fault), class 2 (inverter fault), and class 3 (battery fault). Prior to modelling, features were standardized using StandardScaler from scikit-learn to mitigate scale imbalance across heterogeneous variables. The dataset was split into training and test sets, and scaling was applied after the split to prevent data leakage, fitting the scaler on training data and applying the learned parameters to both sets.
An exploratory analysis was carried out as reported in the draft, including computation of a correlation matrix and a pairplot to inspect feature distributions and class-dependent separability. Based on this exploratory phase and the engineering rationale described, the following subset of features was selected for subsequent modelling: temperature, voltage, current, and motor speed. The diagnostic task was formulated as multi-class classification. Three supervised models were implemented and compared on the same pre-processed dataset: Random Forest, Support Vector Machine (SVM) with RBF kernel, and Logistic Regression. Performance was assessed on the test set using confusion matrices and the metrics reported in the draft: Accuracy, Precision, Recall, F1-score, and AUC, as defined earlier in the manuscript.
2.3. Tyre Pressure Monitoring, Puncture-Related Anomalies, and Energy Consumption Regression
To investigate tyre pressure as a predictor of efficiency and to support puncture-related monitoring through pressure deviations, the EV Energy Consumption Dataset was used [32]. The dataset includes time-stamped records (vehicle ID and timestamp) combining driving behaviour (e.g., speed, acceleration, driving mode), road/traffic conditions (e.g., road type, slope, traffic level), weather factors (e.g., temperature, humidity, wind speed, weather conditions), and vehicle attributes including battery-related variables and tyre pressure. The target variable is energy consumption expressed in kWh per record. As described in the draft, the distribution of tyre pressure values was inspected using an histogram and boxplot, showing a stable range approximately between 28–35 psi without evident outliers in the analysed subset.
2.4. Data Standardization, Regression Model and Evaluation
Prior to model training, features were standardized using StandardScaler (scikit-learn).
A linear regression model was then trained to estimate energy consumption from the available predictors, using all 16 features reported in the dataset. Model performance was evaluated on train and test splits using MSE and R², as reported in the draft table. The model was further analysed through comparison of predicted versus measured consumption values on the test set (draft figure), and the tyre pressure variable was retained as a key feature of interest in the interpretation framework described in the manuscript.
3. Results
Battery ageing was first analysed using the NASA Prognostics Center of Excellence dataset of 4 Li-ion 18650 cells cycled under controlled charge–discharge–rest profiles. After data cleaning (removal of discharge records, handling invalid values and outliers) and smoothing via moving average, the charge signals (voltage, current, temperature) showed visibly reduced spikes and improved trend readability (Figure 1).
State of Health (SoH) was computed as SoH(%) = Ck/C0 × 100, and end-of-life was set at 70% of nominal capacity. An LSTM model implemented in Python (Keras/TensorFlow) was trained to forecast the capacity decay and thus estimate RUL. Model performance was assessed in a leave-one-battery-out setting (3 batteries for training, 1 for test, iterated across the 4 batteries used in the evaluation). With the tuned configuration reported in the text (LSTM units deep = 50, 35 epochs, batch size 256; shuffle=False to preserve temporal order), the predicted capacity trajectory closely tracked the measured decay (Figure 2), with stable convergence in the loss curves and consistent behaviour across reported evaluation metrics (Figure 3). When the same LSTM was tested on a non-preprocessed dataset, performance decreased slightly, with a marginal increase in average error of 0.3% and reduced prediction stability.
On the same battery task, simpler models were also tested on non-preprocessed data; among them, a degree-2 polynomial regression provided the best performance within this simplified family, capturing the overall decreasing trend while showing increasing discrepancy in later-life cycles. Quantitative results are summarised in Table 1.
Fault diagnosis for propulsion-related subsystems was then addressed using the “New Energy Vehicles Diagnosis” dataset (Kaggle), containing sensor measurements (temperature, ambient temperature, motor speed, vibration, voltage, current) labelled into 4 operational classes (0: normal, 1: motor fault, 2: inverter fault, 3: battery fault). After standardisation with StandardScaler, exploratory analysis highlighted non-negligible linear associations between selected variables and the target class, including a temperature–target correlation of 0.55 and a strong negative temperature–voltage correlation of −0.84 (Figure 4).
Three supervised classifiers were trained and evaluated on a held-out test set: Random Forest, SVM with RBF kernel, and Logistic Regression. Confusion matrices for each model are reported in Figure 5 while the metric comparison is shown in Figure 6. Overall performance is summarised in Table 2.
Finally, tyre-pressure–related monitoring was explored using the EV Energy Consumption Dataset. The tyre pressure distribution was stable within 28–35 psi (Figure 7), with the boxplot confirming the absence of marked outliers under the sampled conditions.
After standardisation, a linear regression model was trained to predict energy consumption (kWh) using all 16 dataset features, explicitly including tyre pressure among the predictors. The model achieved low and consistent error on training and test splits, with high explained variance (Table 3), and predictions aligned closely with measured values in the test set comparison (Figure 8).
4. Discussion
The results indicate that data-driven models can support three complementary predictive-maintenance objectives in light electric vehicles: battery ageing prognostics, component-level fault diagnosis from onboard sensor streams, and energy-consumption estimation with tyre pressure included among the predictors. Across these tasks, performance depends primarily on the structure of the data (temporal vs. non-temporal), the presence of ground-truth fault labels, and how close the predictor–target relationship is to linear.
For battery prognostics, the use of an LSTM is methodologically coherent with the problem because capacity fade is time-dependent and exhibits memory effects across cycles. The model reproduced the capacity-decay trajectory with low error and stable convergence under the preprocessing pipeline used. When the same approach was applied to non-pre-processed inputs, performance degraded slightly (reported average error increase of 0.3%) and training stability worsened, consistent with the sensitivity of gradient-based sequence models to heterogeneous scales and noise. The polynomial-regression baseline (degree 2) captured the global downward trend but generalized less effectively, especially in later-life regions where degradation tends to become less smooth; this is an expected limitation of low-order static curve fitting compared with sequence models that explicitly exploit temporal dependencies.
For fault diagnosis based on thermal and propulsion-related measurements, framing the problem as multiclass classification enabled direct mapping from sensor patterns to fault categories. Among the tested classifiers, Random Forest achieved the highest overall performance on the held-out test set, while SVM with an RBF kernel performed comparably, supporting the relevance of non-linear decision boundaries in this feature space. Logistic regression provided a simpler, more interpretable baseline with lower discriminative power. The residual misclassifications show that some operating states and fault signatures overlap when only temperature, voltage, current, and motor speed are used, suggesting that improved separability would likely require additional condition indicators, richer feature engineering, or higher-resolution signals.
For tyre-pressure monitoring and energy-consumption estimation, the pressure values were distributed in a narrow nominal range without evident outliers, which is compatible with a dataset dominated by regular operation rather than puncture or rapid-leak events. In this setting, linear regression achieved similar train and test errors and a high coefficient of determination, indicating that—within the operating envelope represented—energy consumption is reasonably approximated as an additive linear function of the available predictors. The remaining deviations are concentrated around sharper transients, where a strictly linear model may under-represent non-linear dynamics linked to rapid load changes, driving aggressiveness, or interaction effects among predictors.
Overall, the main takeaway is that matching model class to data structure matters more than increasing complexity. Sequence models are advantageous for time-dependent degradation, ensemble and kernel-based classifiers are effective for non-linear separations in multivariate sensor space, and simple regression can be sufficient when relationships are approximately linear within the sampled regime.
5. Conclusions
This work implemented and evaluated machine-learning workflows for predictive maintenance in electric micro-mobility using public datasets. Battery ageing was addressed through time-series modeling, where an LSTM-based approach tracked capacity fade accurately under preprocessing and showed a small reported degradation in accuracy (0.3% average error increase) when preprocessing was removed; a degree-2 polynomial regression baseline captured the overall trend but generalized less effectively. For multiclass fault diagnosis from thermal and propulsion-related variables, Random Forest delivered the best test-set performance, with SVM (RBF) as a close alternative and logistic regression as an interpretable baseline with lower discrimination. For energy-consumption estimation including tyre pressure, linear regression generalized well between train and test sets and reproduced consumption patterns under nominal pressure conditions, with the largest discrepancies occurring during rapid transients.
Within the limits of the available datasets, the results support the practicality of combining targeted preprocessing, task-appropriate model selection, and evaluation on held-out data to produce actionable signals for maintenance planning and operational monitoring in light electric vehicles.
Funding
This research was funded by PR FESR Abruzzo 2021–2027, Intervention 1.1.1.1, Project UNICA6DELIVERY, CUP: C29J24000090007.
Data Availability Statement
The data used in this study are publicly available. Battery ageing data were obtained from the NASA Prognostics Center of Excellence Data Repository. Vehicle fault diagnosis and energy consumption datasets were retrieved from Kaggle and are cited in the References section. No proprietary or restricted data were used.
Acknowledgments
The authors acknowledge financial support from the PR FESR Abruzzo 2021–2027 – Intervention 1.1.1.1, Project UNICA6DELIVERY (CUP: C29J24000090007). The authors also acknowledge the providers of the publicly available datasets used in this study, including the NASA Prognostics Center of Excellence and the contributors to the Kaggle datasets referenced in the manuscript.
References
- H. M. Hashemian e W. C. Bean, «State-of-the-Art Predictive Maintenance Techniques*», IEEE Trans. Instrum. Meas., vol. 60, fasc. 10, pp. 3480–3492, ott. 2011.
- M. Paolanti, L. Romeo, A. Felicetti, A. Mancini, E. Frontoni, e J. Loncarski, «Machine Learning approach for Predictive Maintenance in Industry 4.0», in 2018 14th IEEE/ASME International Conference on Mechatronic and Embedded Systems and Applications (MESA), Oulu, 2018, pp. 1–6.
- Q. Zhai et al., «Machine learning for full lifecycle management of lithium-ion batteries», Renewable and Sustainable Energy Reviews, vol. 202, p. 114647, set. 2024.
- F. Pellitteri, V. Boscaino, A. O. Di Tommaso, F. Genduso, e R. Miceli, «E-bike battery charging: Methods and circuits», in 2013 International Conference on Clean Electrical Power (ICCEP), Alghero, Italy, 2013, pp. 107–114.
- B. Bole, C. S. Kulkarni, e M. Daigle, «Adaptation of an Electrochemistry-based Li-Ion Battery Model to Account for Deterioration Observed Under Randomized Use», PHM_CONF, vol. 6, fasc. 1, set. 2014.
- J. Zhou, D. Liu, Y. Peng, e X. Peng, «Dynamic battery remaining useful life estimation: An on-line data-driven approach», in 2012 IEEE International Instrumentation and Measurement Technology Conference Proceedings, 2012, pp. 2196–2199.
- D. Liu, Y. Luo, Y. Peng, X. Peng, e M. Pecht, «Lithium-ion Battery Remaining Useful Life Estimation Based on Nonlinear AR Model Combined with Degradation Feature», Annual Conference of the PHM Society, vol. 4, fasc. 1, set. 2012.
- Y. Choi, S. Ryu, K. Park, e H. Kim, «Machine Learning-Based Lithium-Ion Battery Capacity Estimation Exploiting Multi-Channel Charging Profiles», IEEE Access, vol. 7, pp. 75143–75152, 2019.
- H. Sarker, «Machine Learning: Algorithms, Real-World Applications and Research Directions», SN COMPUT. SCI., vol. 2, fasc. 3, p. 160, mag. 2021.
- Dey, «Machine Learning Algorithms: A Review», vol. 7, 2016.
- M.-C. Popescu, V. E. Balas, L. Perescu-Popescu, e N. Mastorakis, «Multilayer Perceptron and Neural Networks».
- R. Eldan, R. Eldan, e W. A. Il, «The Power of Depth for Feedforward Neural Networks».
- M. Cilimkovic, «Neural Networks and Back Propagation Algorithm».
- Y. Lecun, Y. Bengio, e G. Hinton, «Deep learning», Nature, vol. 521, fasc. 7553, pp. 436–444, mag. 2015.
- Sherstinsky, «Fundamentals of Recurrent Neural Network (RNN) and Long Short-Term Memory (LSTM) Network», Physica D: Nonlinear Phenomena, vol. 404, p. 132306, mar. 2020.
- Pulver e S. Lyu, «LSTM with Working Memory». arXiv, 30-mar-2017.
- X. Wen e W. Li, «Time Series Prediction Based on LSTM-Attention-LSTM Model», IEEE Access, vol. 11, pp. 48322–48331, 2023.
- S. Salcedo-Sanz, J. L. Rojo-Álvarez, M. Martínez-Ramón, e G. Camps-Valls, «Support vector machines in engineering: an overview», WIREs Data Min & Knowl, vol. 4, fasc. 3, pp. 234–267, mag. 2014.
- W. S. Noble, «What is a support vector machine?», Nat Biotechnol, vol. 24, fasc. 12, pp. 1565–1567, dic. 2006.
- W.-Y. Loh, «Classification and Regression Trees».
- G. Biau e E. Scornet, «A Random Forest Guided Tour». arXiv, 18-nov-2015.
- O. Sykes, «An Introduction to Regression Analysis».
- D. Hsu, «Linear regression».
- E. Ostertagová, «Modelling using Polynomial Regression».
- «Practical Guide to Logistic Regression».
- D. Ballabio, F. Grisoni, e R. Todeschini, «Multivariate comparison of classification performance measures», Chemometrics and Intelligent Laboratory Systems, vol. 174, pp. 33–44, mar. 2018.
- L. Goncalves, «ROC CURVE ESTIMATION: AN OVERVIEW».
- «Prognostics Center of Excellence Data Set Repository - NASA». .
- Lin, A. Tang, e W. Wang, «A Review of SOH Estimation Methods in Lithium-ion Batteries for Electric Vehicle Applications», Energy Procedia, vol. 75, pp. 1920–1925, ago. 2015.
- «Fault Diagnosis in Electric Vehicles». [Online]. Disponibile su: https://kaggle.com/code/devraai/fault-diagnosis-in-electric-vehicles.
- Choudhary, S. Fatima, e B. K. Panigrahi, «State-of-the-Art Technologies in Fault Diagnosis of Electric Vehicles: A Component-Based Review», IEEE Transactions on Transportation Electrification, vol. 9, fasc. 2, pp. 2324–2347, giu. 2023.
- «EV Energy Consumption Dataset». [Online]. Disponibile su: https://www.kaggle.com/datasets/ziya07/ev-energy-consumption-dataset.
Figure 1.
Example of noise elimination on tested battery. (a) Unfiltered data, (b) data after filtering operations.
Figure 1.
Example of noise elimination on tested battery. (a) Unfiltered data, (b) data after filtering operations.
Figure 2.
Decay curve of battery capacity and prevision made through applied model.
Figure 3.
LSTM configuration and obtained results. Loss plot for one of the analysed batteries. Comparison among different evaluation metrics.
Figure 3.
LSTM configuration and obtained results. Loss plot for one of the analysed batteries. Comparison among different evaluation metrics.
Figure 4.
correlation matrix between dataset variables.
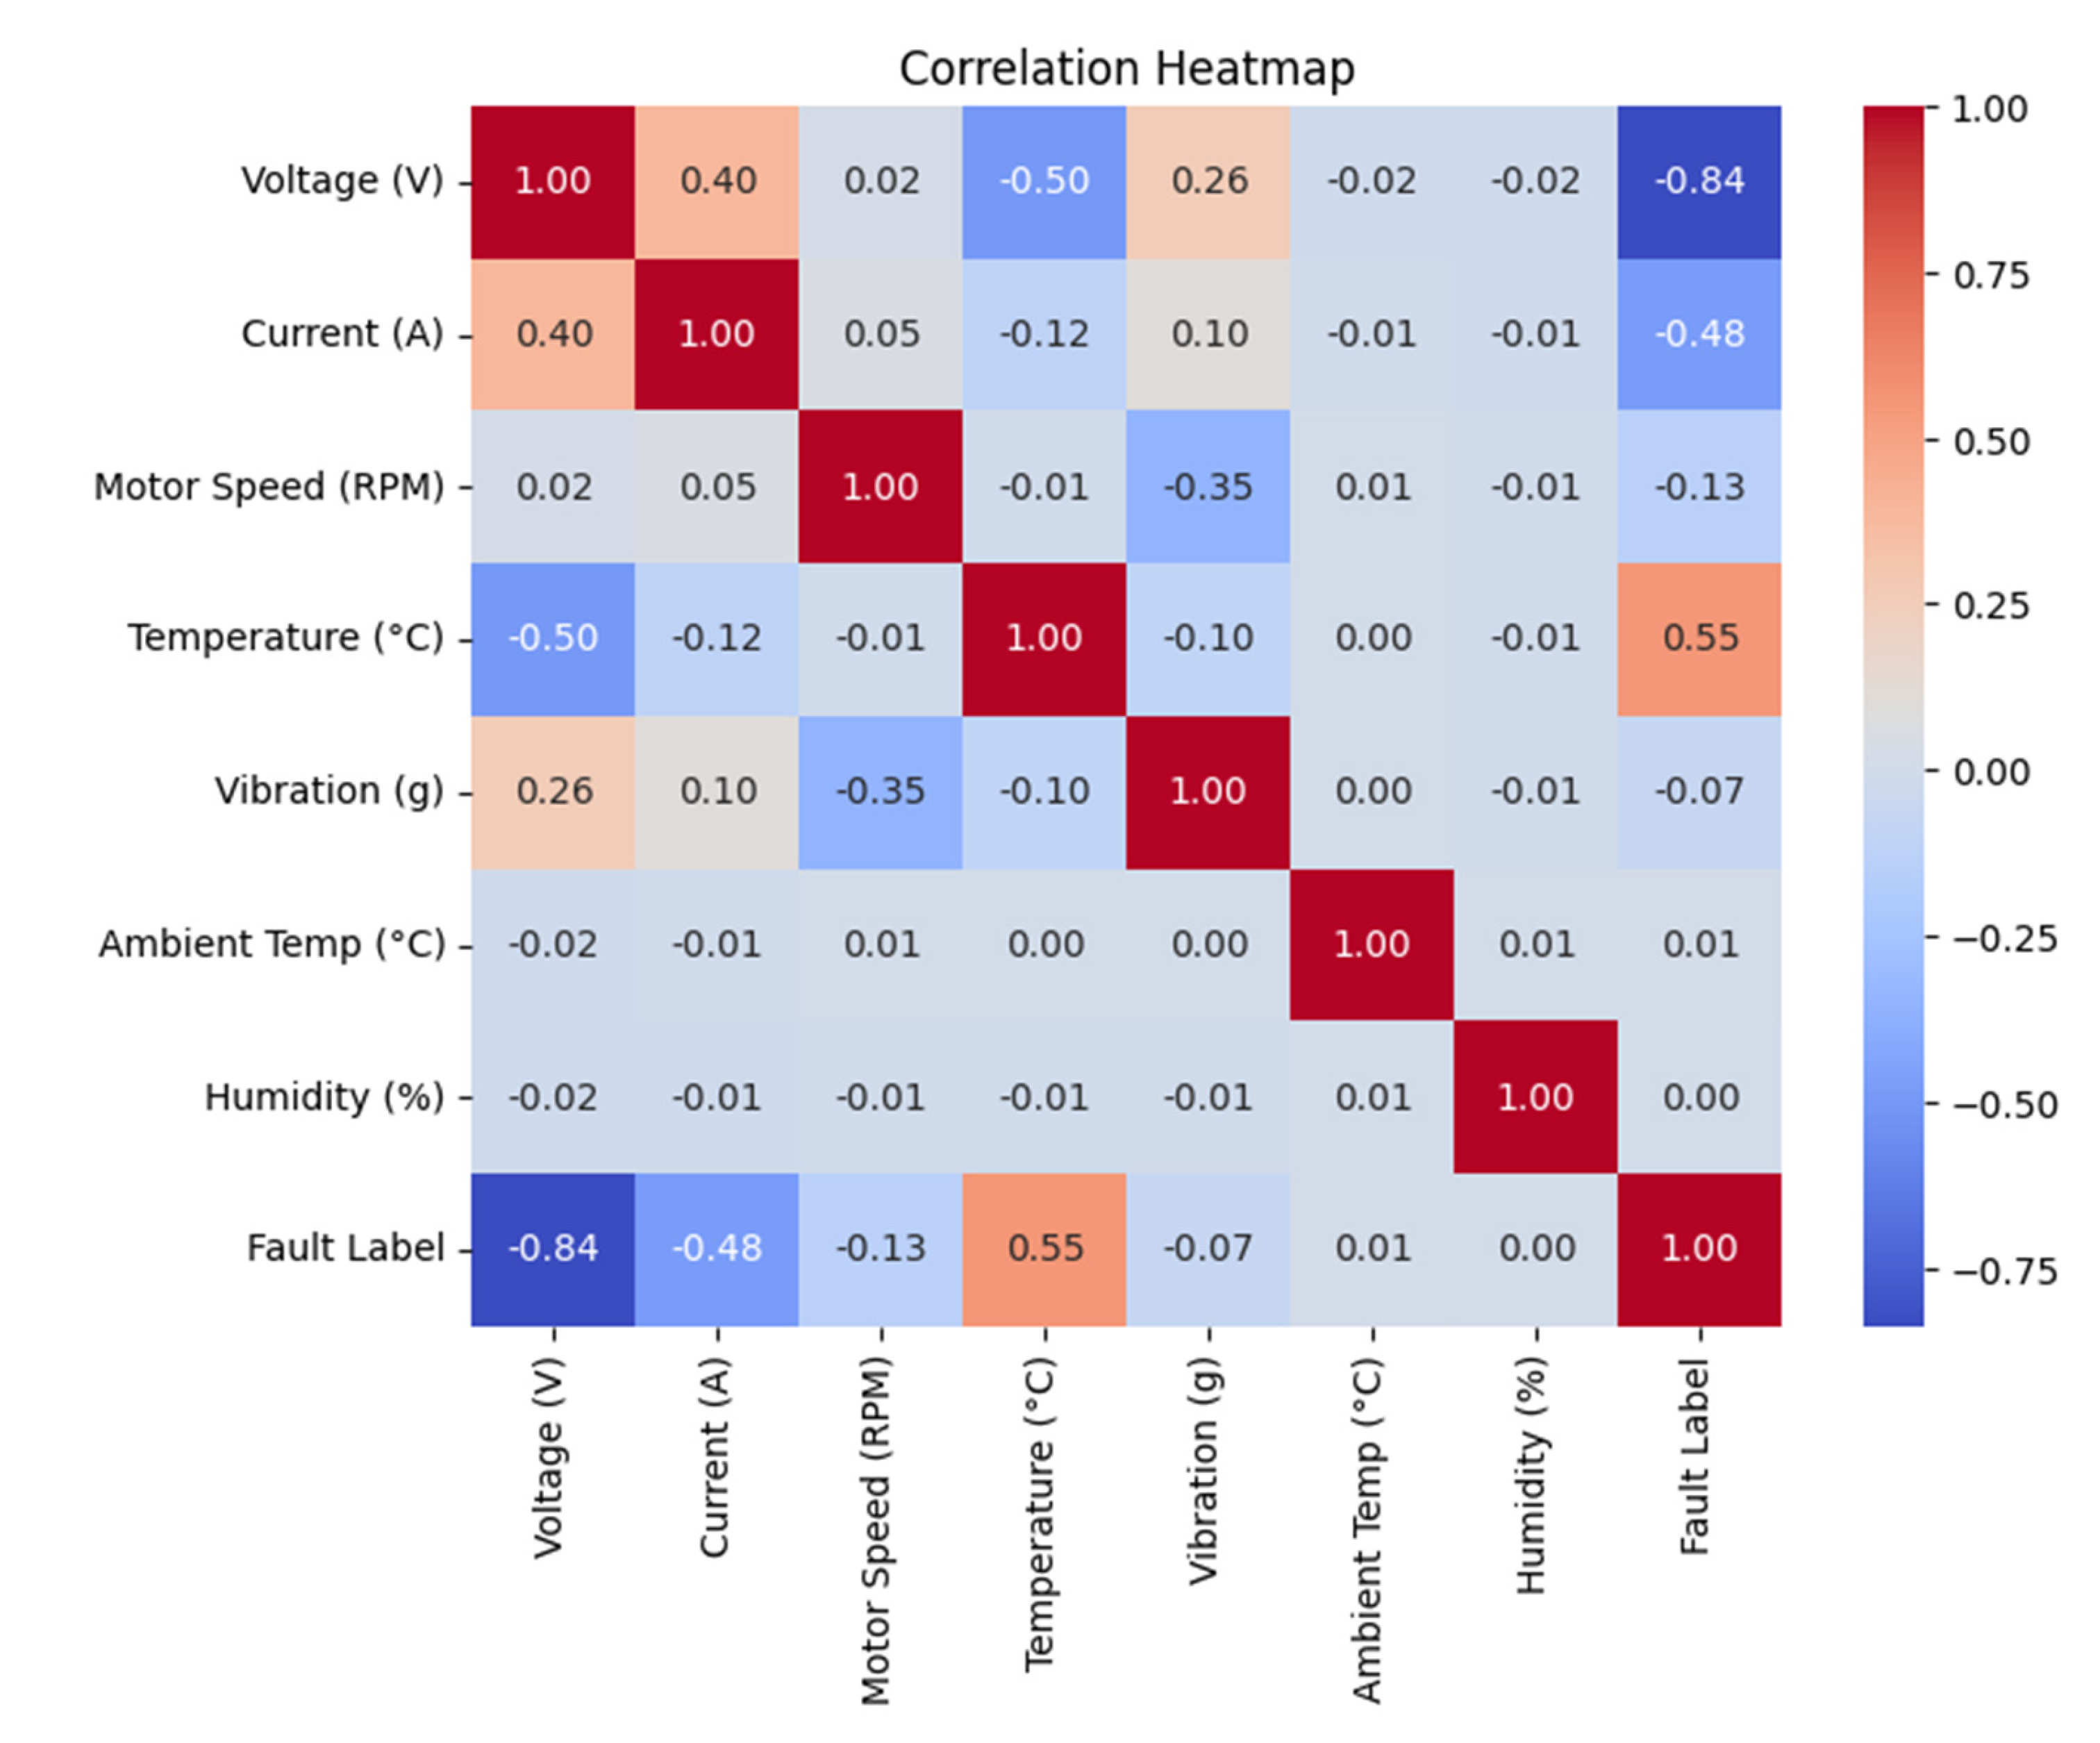
Figure 5.
Confusion matrices obtained on the test set for the 4-class NEV fault-diagnosis task using Random Forest (left), SVM with RBF kernel (center), and Logistic Regression (right). Rows indicate the true class and columns the predicted class (0: normal operation; 1: motor fault; 2: inverter fault; 3: battery fault). All three models show near-perfect discrimination between classes 2 and 3, while the main misclassifications occur between classes 0 and 1.
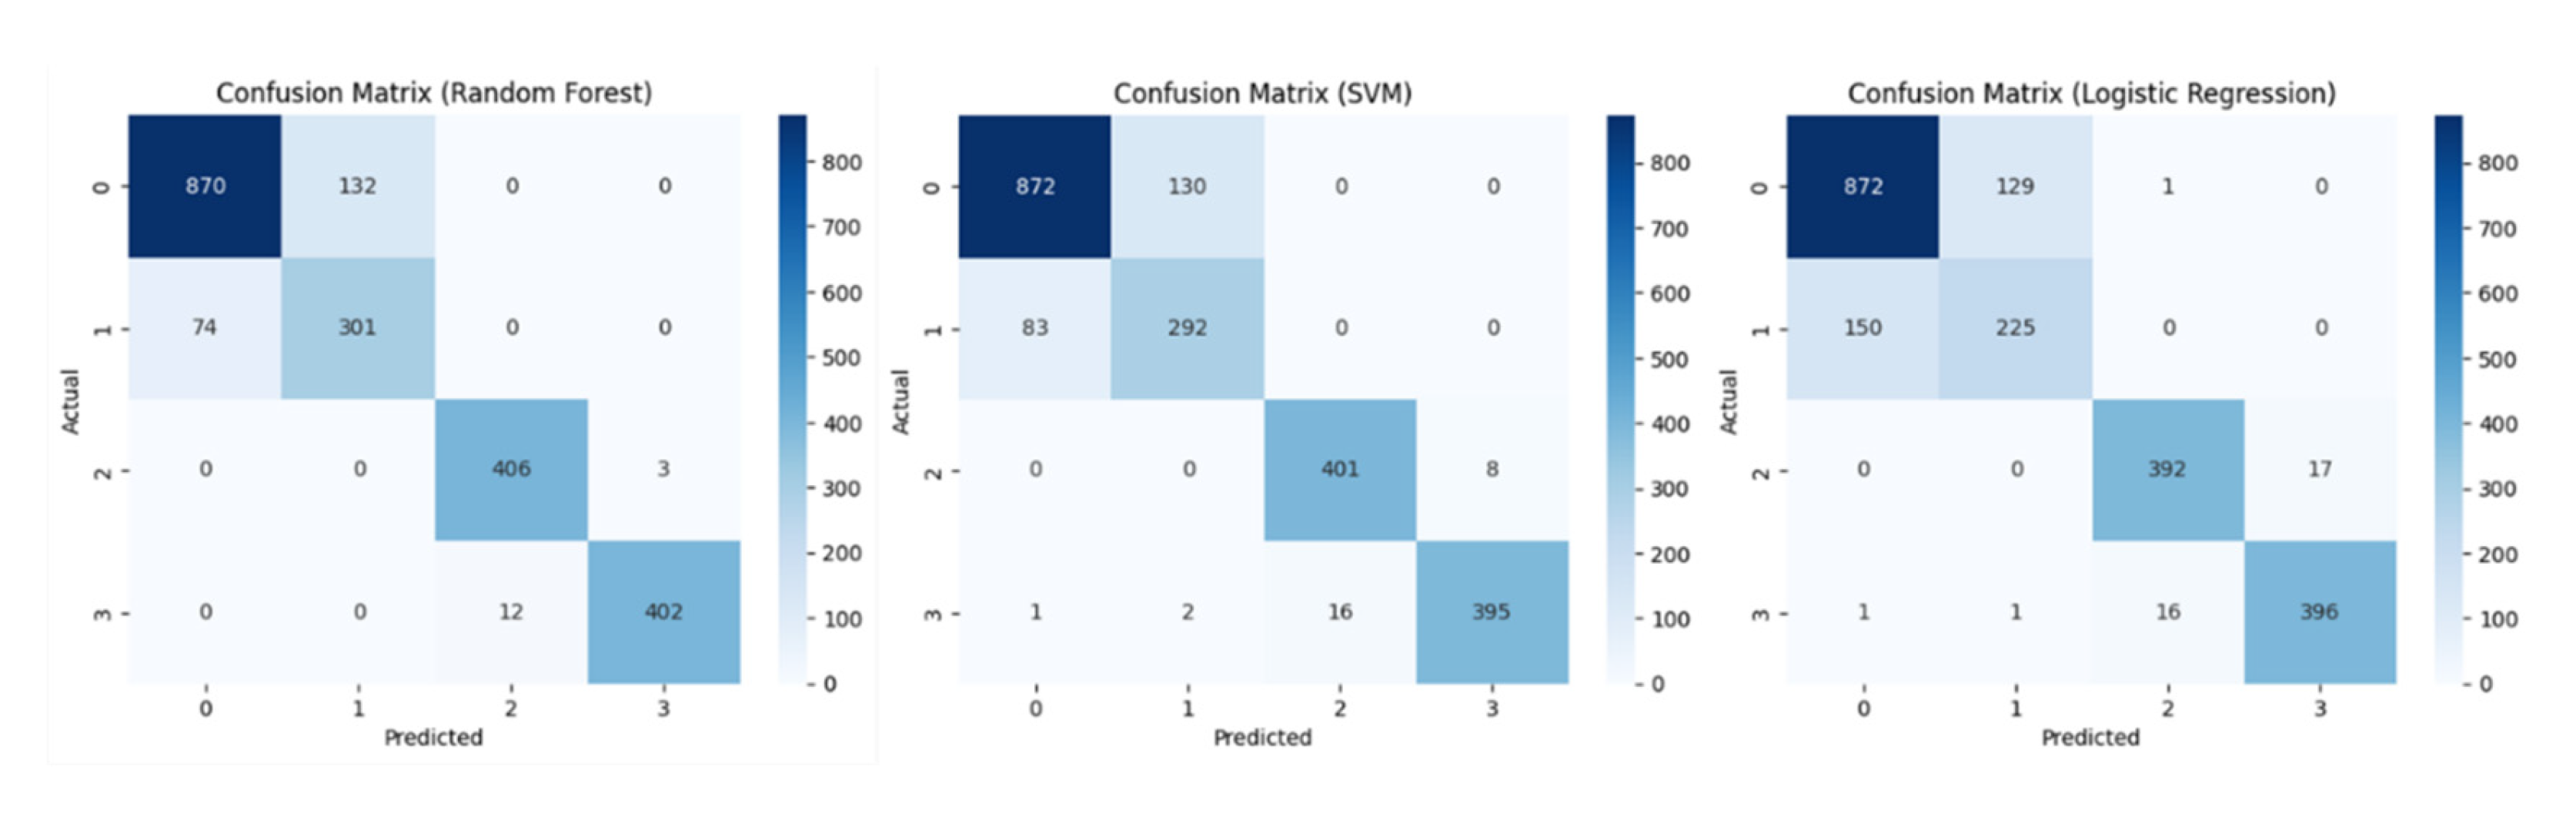
Figure 6.
Comparative performance of the three classifiers (SVM with RBF kernel, Logistic Regression, and Random Forest) on the NEV fault-diagnosis test set. Bars report Accuracy and macro-averaged Precision, Recall, F1-score, and AUC, highlighting the consistently high discriminative performance across models and the overall advantage of the Random Forest classifier.
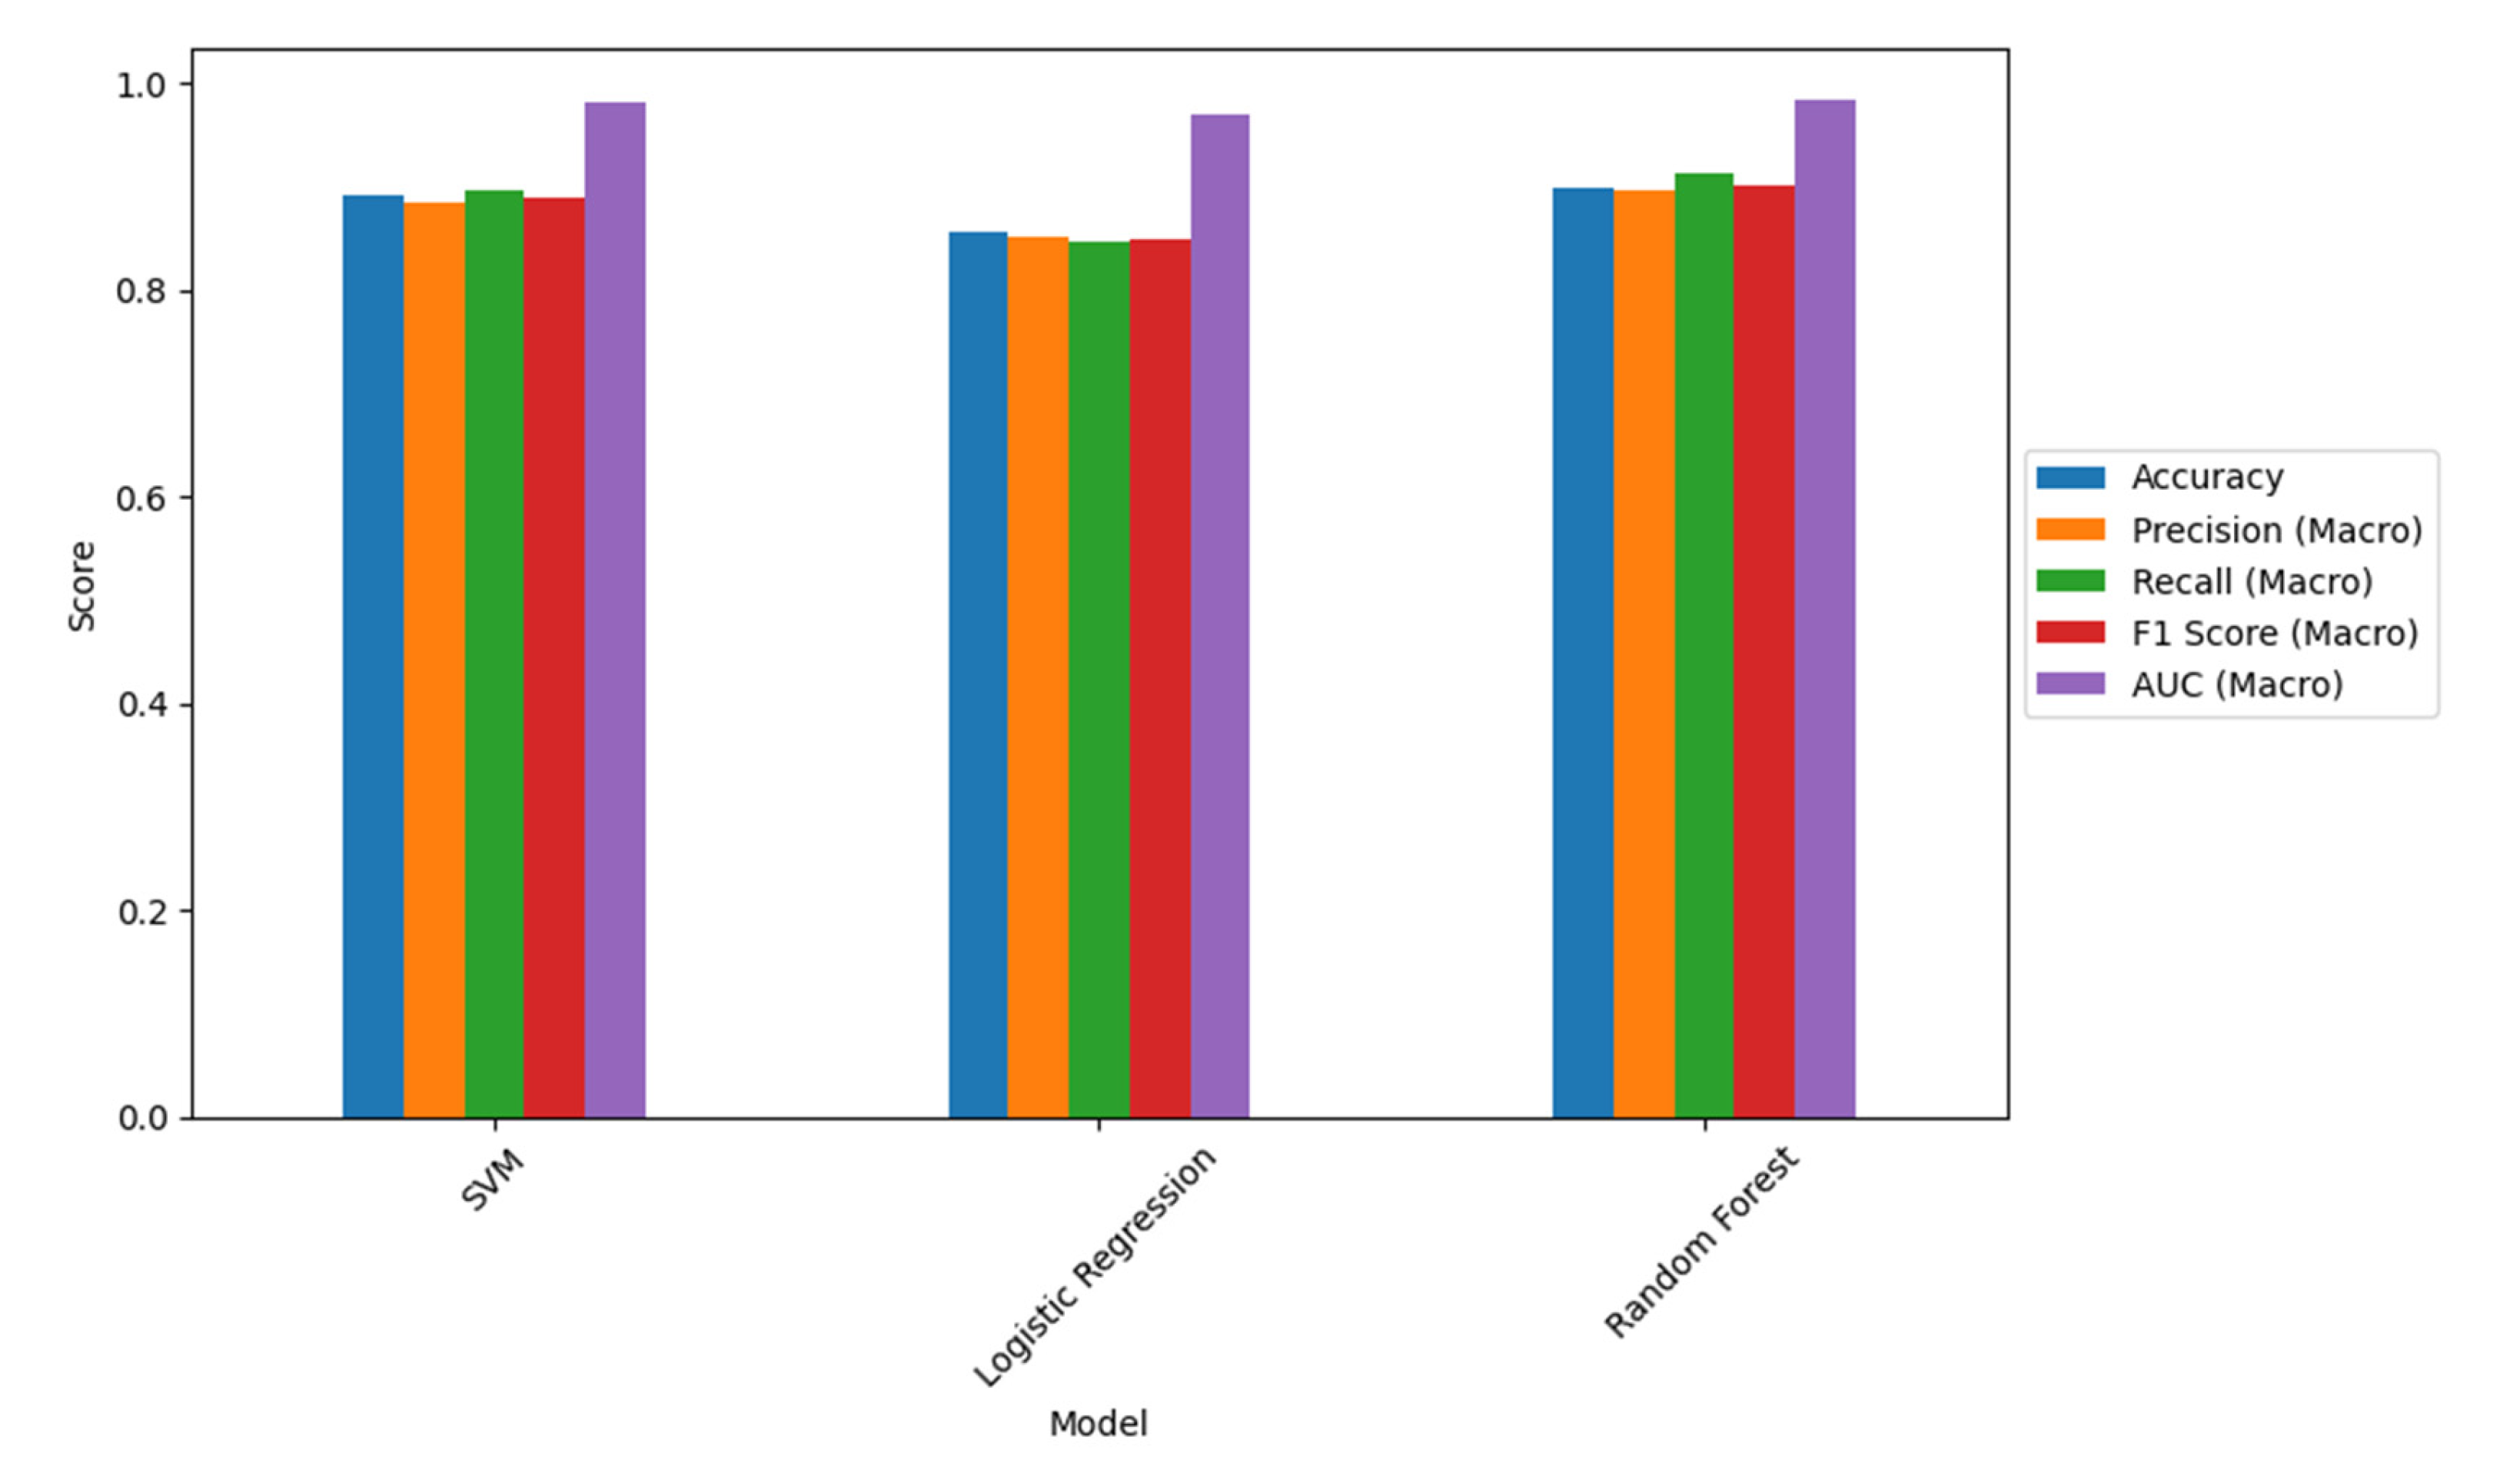
Figure 7.
Distribution of tyre-pressure measurements in the EV Energy Consumption dataset. The histogram (left) shows a broad, approximately uniform spread across the 28–35 psi range, while the boxplot (right) summarizes central tendency and dispersion with a median around 31–32 psi, an interquartile range of roughly 30–33 psi, and whiskers extending to about 28 and 35 psi, with no prominent outliers.
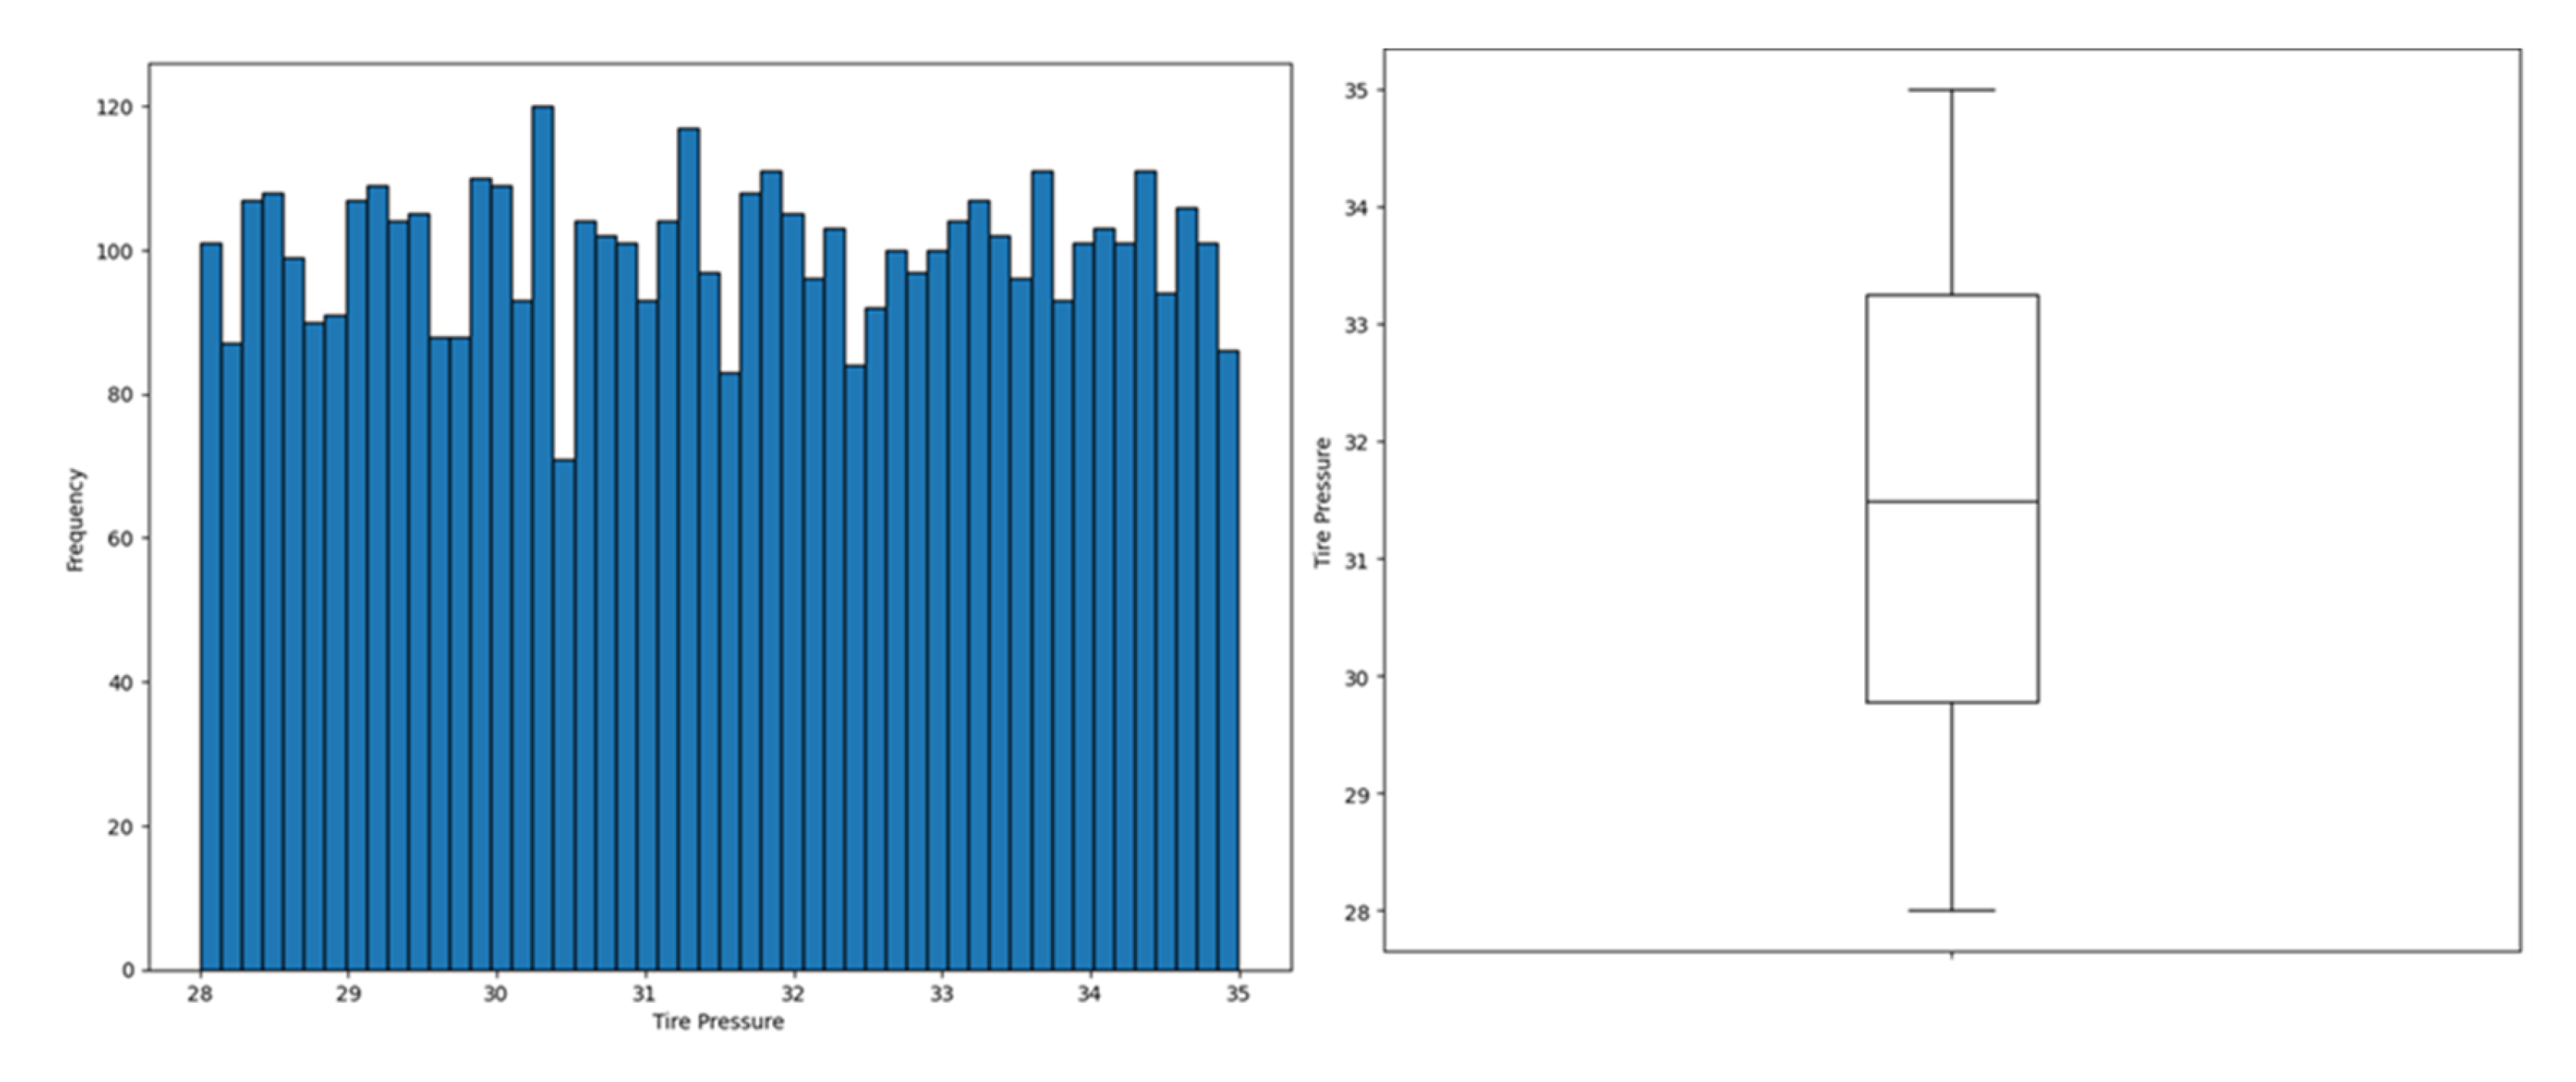
Figure 8.
Comparison between measured (blue) and predicted (orange) energy consumption on the test set. The two time-series largely overlap across the observation window, indicating that the linear regression model captures the main variability of the target, with small deviations mainly at sharper fluctuations and local peaks.
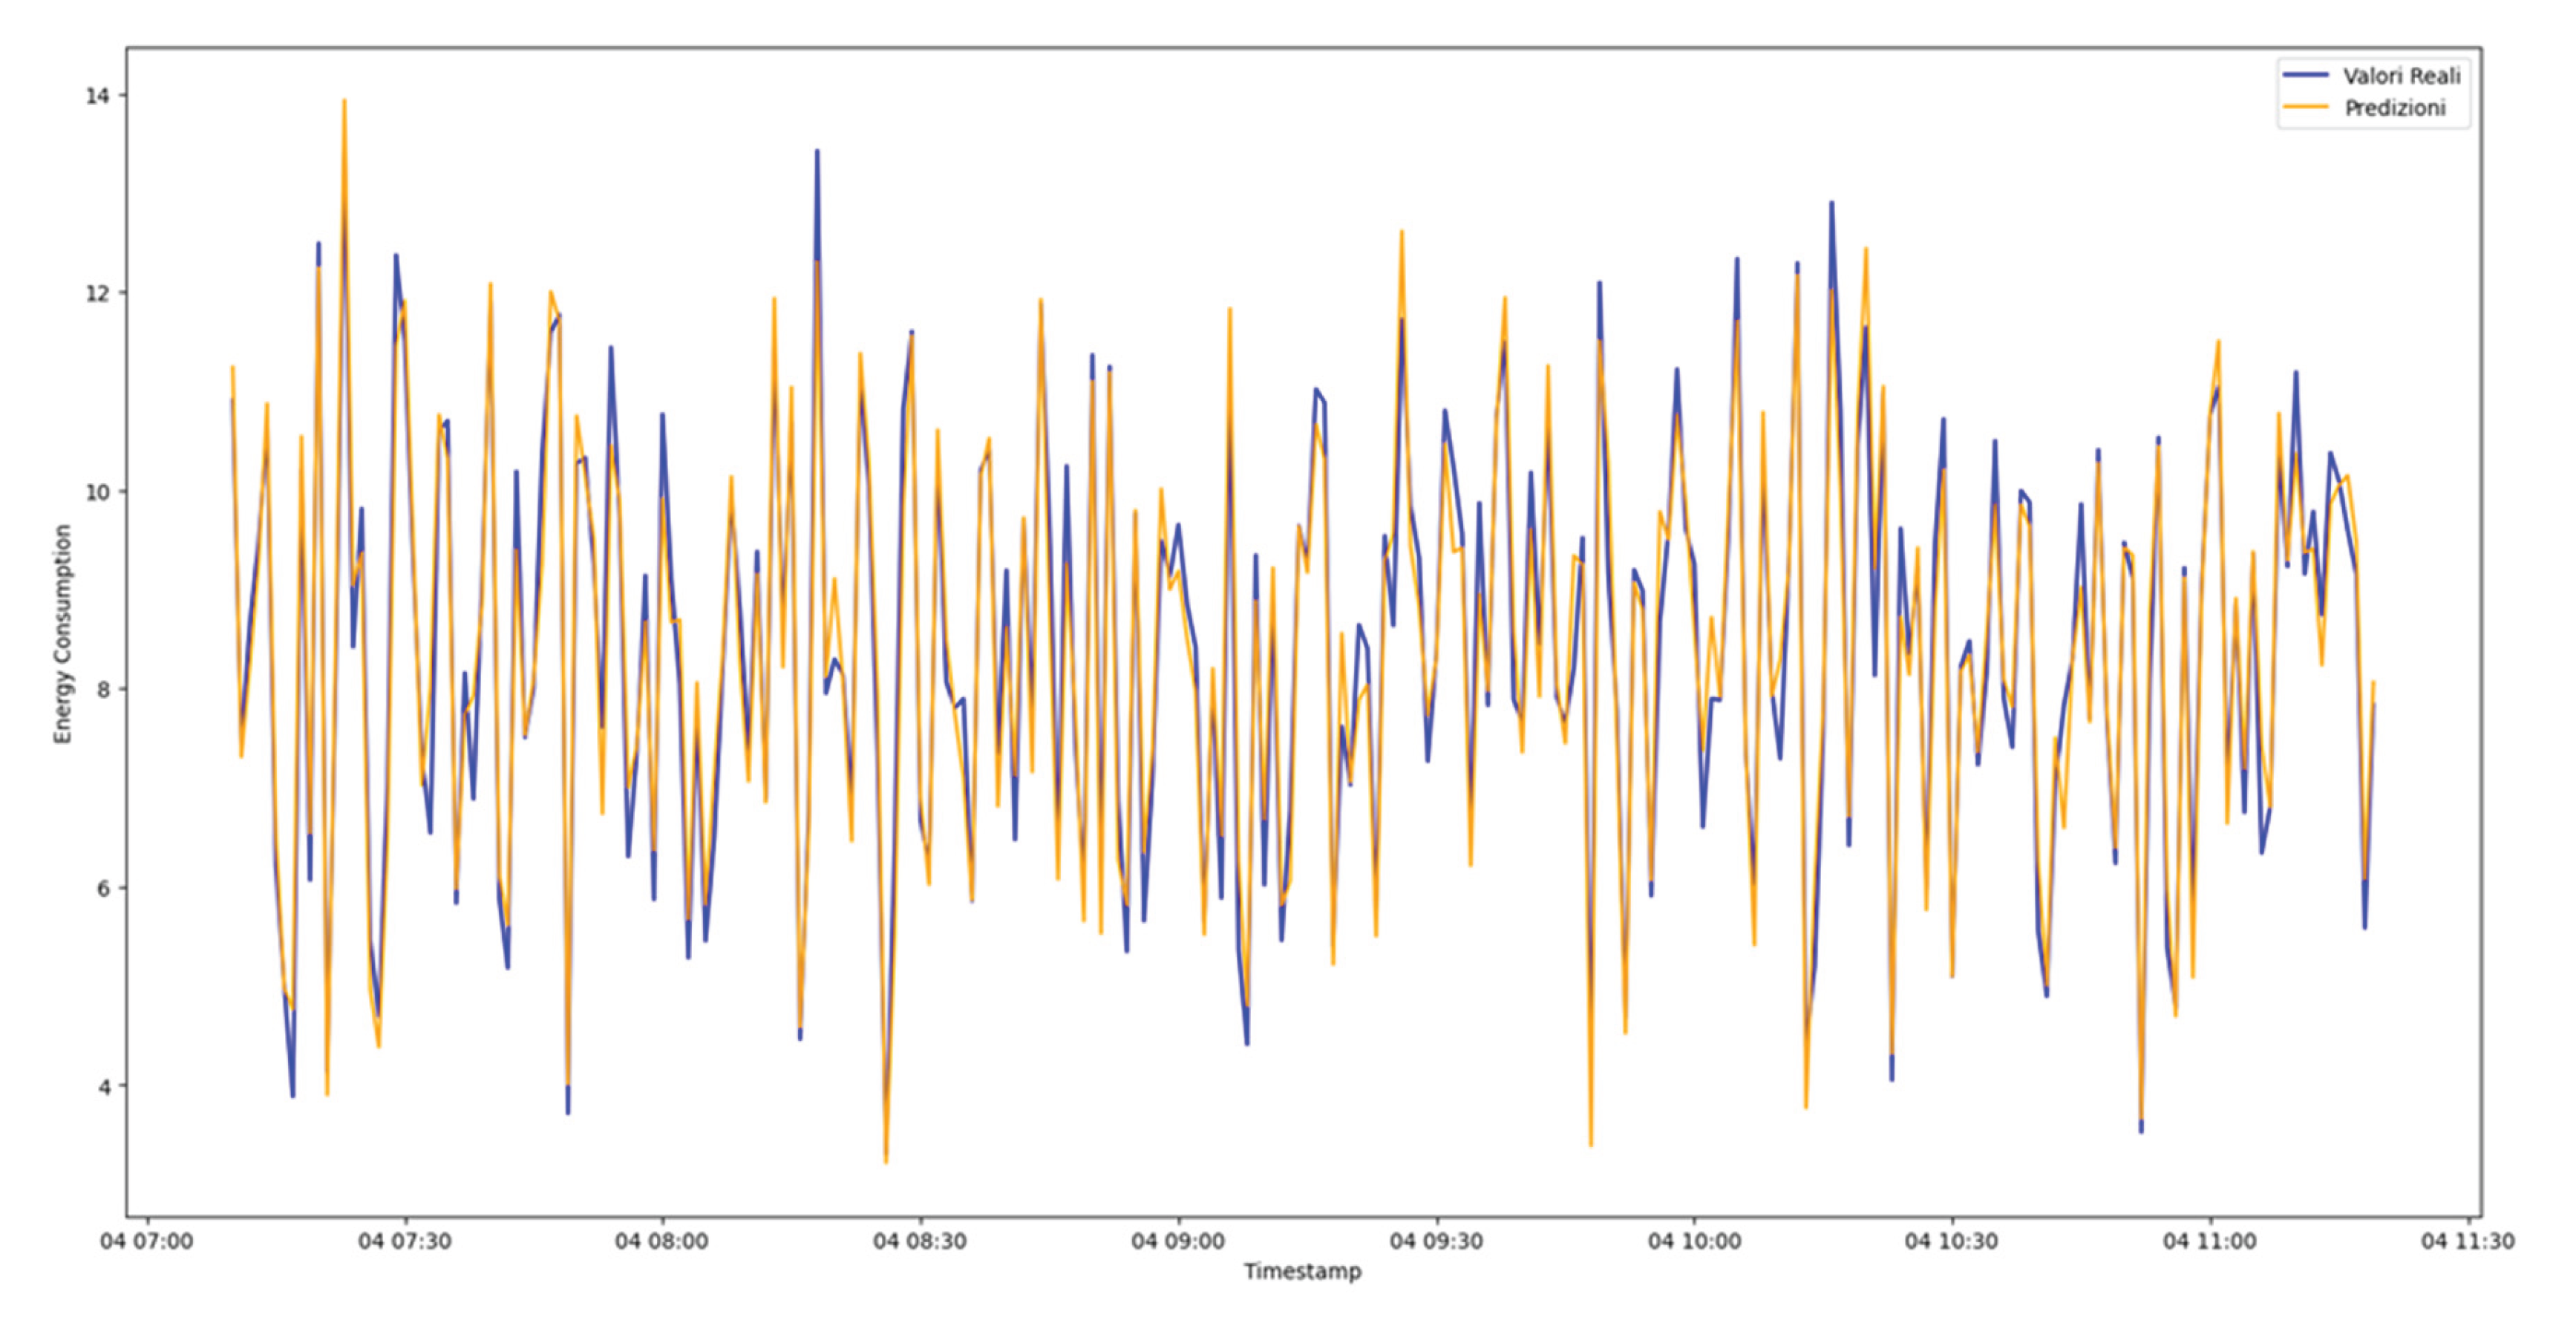

Table 1.
Polynomial regression (degree 2) performance for battery capacity decay modelling.
| Dataset Split | MSE | MAE | R² |
| Training set | 0.0003 | 0.0134 | 0.9776 |
| Test set | 0.0011 | 0.0274 | 0.6861 |
Table 2.
Test-set performance for multi-class fault diagnosis.
| Model | Accuracy | Precision | Recall | F1 Score | AUC |
| Random Forest | 0.899 | 0.894 | 0.909 | 0.900 | 0.985 |
| SVM (RBF) | 0.891 | 0.886 | 0.896 | 0.890 | 0.982 |
| Logistic Regression | 0.857 | 0.851 | 0.846 | 0.848 | 0.971 |
Table 3.
Linear regression performance for energy consumption prediction using all available features.
Table 3.
Linear regression performance for energy consumption prediction using all available features.
| Dataset Split | MSE | R² |
| Train set | 0.2612 | 0.9452 |
| Test set | 0.2528 | 0.9474 |
Disclaimer/Publisher’s Note: The statements, opinions and data contained in all publications are solely those of the individual author(s) and contributor(s) and not of MDPI and/or the editor(s). MDPI and/or the editor(s) disclaim responsibility for any injury to people or property resulting from any ideas, methods, instructions or products referred to in the content. |
© 2026 by the authors. Licensee MDPI, Basel, Switzerland. This article is an open access article distributed under the terms and conditions of the Creative Commons Attribution (CC BY) license (http://creativecommons.org/licenses/by/4.0/).
Copyright: This open access article is published under a Creative Commons CC BY 4.0 license, which permit the free download, distribution, and reuse, provided that the author and preprint are cited in any reuse.


