Preprint
Review

This version is not peer-reviewed.

Deep Learning Methods for Breast Cancer Classification and Segmentation Using MRI Scans: A Review

Submitted:

26 January 2026

Posted:

27 January 2026

You are already at the latest version

Abstract

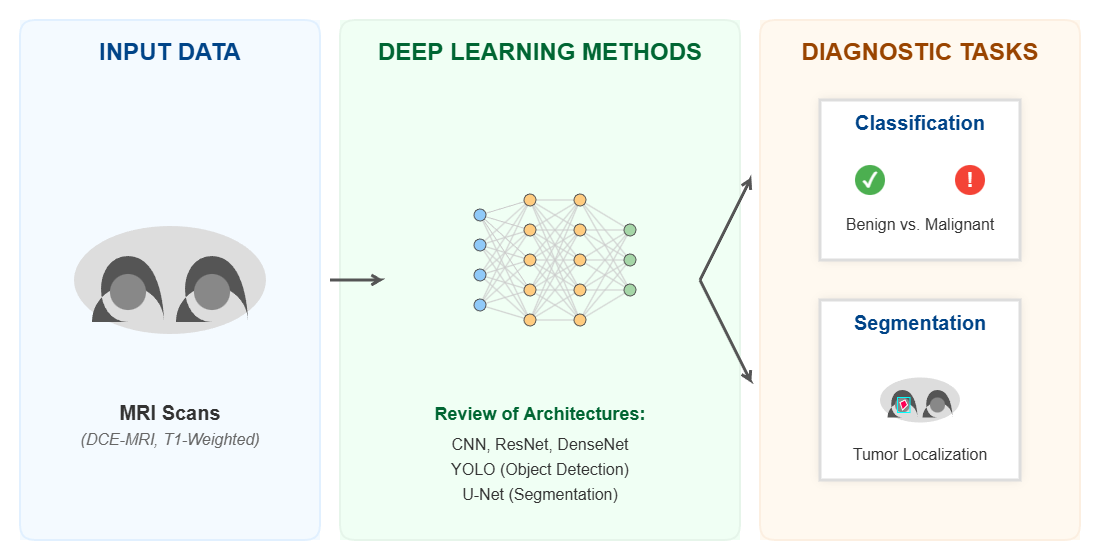
Worldwide, breast cancer affected women increasingly with its incidence influenced by a complex interplay of genetic, environmental, and lifestyle factors, resulting in mortalities and ruined lives after getting affected by this malicious disease especially in younger ages. At that point, researchers have developed tools to treat this disease and continued to enhance their tools to reduce the number of mortalities using imaging tools like mammography, x-rays, magnetic resonance imaging and more. They indicated that when it is earlier diagnosing breast cancer it is easier to handle way too better in a try to achieve their goal improving survival rates. This review provides to focus on recent peer-reviewed research within the last decade that used deep learning methods like convolutional neural networks for breast cancer prediction/classification or segmentation using magnetic resonance imaging scans, that’s due its ability to locate lesions/malignancies that usually escapes traditional imaging tools. By evaluating models’ architectures, datasets, preprocessing for each study, key findings of them revealed that using such deep learning techniques have demonstrated truly promising results achieving high performance metrics for breast cancer assessment. While several limitations still exist like data availability, data quality, and data generalizability. Having that in hands, this review assured the importance of keeping developing robust, interpretable and clinically applicable AI models using MRIs to aid radiologists eliminate tedious tasks and support them with decision-making process.

Keywords: 
;  ;  ;  ;  ;  

1. Introduction

According to the WHO, breast cancer alone caused around 670000 deaths worldwide, it is also the most common type of cancer in 85% of the countries in 2022[1]. BC imaging took the lead in reducing the number of mortalities significantly by setting up early diagnosis schemes to better managing the patients’ cases in women from different ages and all groups of density.[2] Mammogram, ultrasound, MRIs and biopsies considered the most well-known effective screening tools for monitoring and evaluating BC given the high incidences increase of BC. Since 1990, approximate of 30% decrease in mortalities was noticed due to the earlier detection using only mammographic screening [3]. Later, serious efforts have been made to increase that percentage via using different efficient screening tools considering the trade-off between complexity and beneficial of the patients based on the case history: Age, mutations, family history, tumor size…etc. another study emphasized the same outcome when using MRI for early screening in terms of reducing mortality rates among different ages [4].
Deep learning-based frameworks such as CNN and YOLO have played a transformative role in medical imaging analysis for breast cancer diagnosis. Identifying and localizing suspicious lesions in MRI scans not only accelerates the diagnosis workflow but also reduces the human errors that are not-rarely happening by handling this process by leveraging this process using efficient DL models [5].
A major advantage of using DL models is their capabilities to learn unique and discriminative features from raw images/data, eliminating the need for manual feature extraction/engineering. These models highlighted and segmented critical regions of interest, such as potential malignancies, through bounding boxes and probability scores. Grounded to the most relevant images information, automated localization ensures that the classification of benign and malignant cases is done based on that [6].
Recent advancements have also focused on enhancing models’ interpretability and robustness. Techniques like heatmap and visualization and model explainability frameworks have been integrated with YOLO outputs to help specialists understand which image region must influence the model predictions. This way, clinical trust is built while continued updates to the YOLO architecture boost detection accuracy and minimize unwanted diagnostic steps, making DL a very powerful tool for breast cancer MRI evaluation [7,8,9].
This review critically aims to assess the current state-of-the-art in DL-based classification and segmentation of breast cancer using MRI scans, further, to discuss challenges, and identify promising trends in future research.

Contribution and Novelty

Unlike previous broad surveys that mainly focused on CNNs across multiple modalities, this review offers a specialized critique and analysis of the 2015 – 2025 technological shift in breast MRI; including the YOLO-MRI intersection as this review is one of the few systematic syntheses evaluating the performance of YOLO models for real time localization and classification within MRI data. Moreover, this review went beyond black box CNNs to evaluate emerging swin transformers architectures providing better global contextual awareness for multi-focal lesions.

2. Materials and Methods

This review evaluates DL-based models for breast cancer diagnosis, classification, and segmentation using MRIs, the methodology was made to ensure comprehensive analysis of peer-reviewed published studies within the last decade involving selecting and searching the literature using the following keywords: “Breast Cancer”, “MRI”, “Deep Learning”, “YOLO”, “Imaging Modalities”, “Artificial Intelligence”. Inclusion and exclusion criteria focus on studies employing DL approaches only, while excluding non-MRI and non-DL techniques.
In terms of data extraction and analysis, key details from each study were extracted including the methods they used, datasets and their characteristics, preprocessing techniques and performance metrics, and finally, limitations across studies. Eventually, this review has the potential to provide transparent insights into the current state-of-the-art of DL-based methods using MRIs and guide future research directions in this field.
Protocol Registration
The protocol for this systematic review was registered prospectively on the Open Science Framework (OSF) and is publicly available at: https://doi.org/10.17605/OSF.IO/B398C
This systematic review was performed according to the Cochrane Handbook and the Preferred Reporting Items for Systematic Reviews and Meta-Analyses (PRISMA) guidelines. An priori registration was performed:

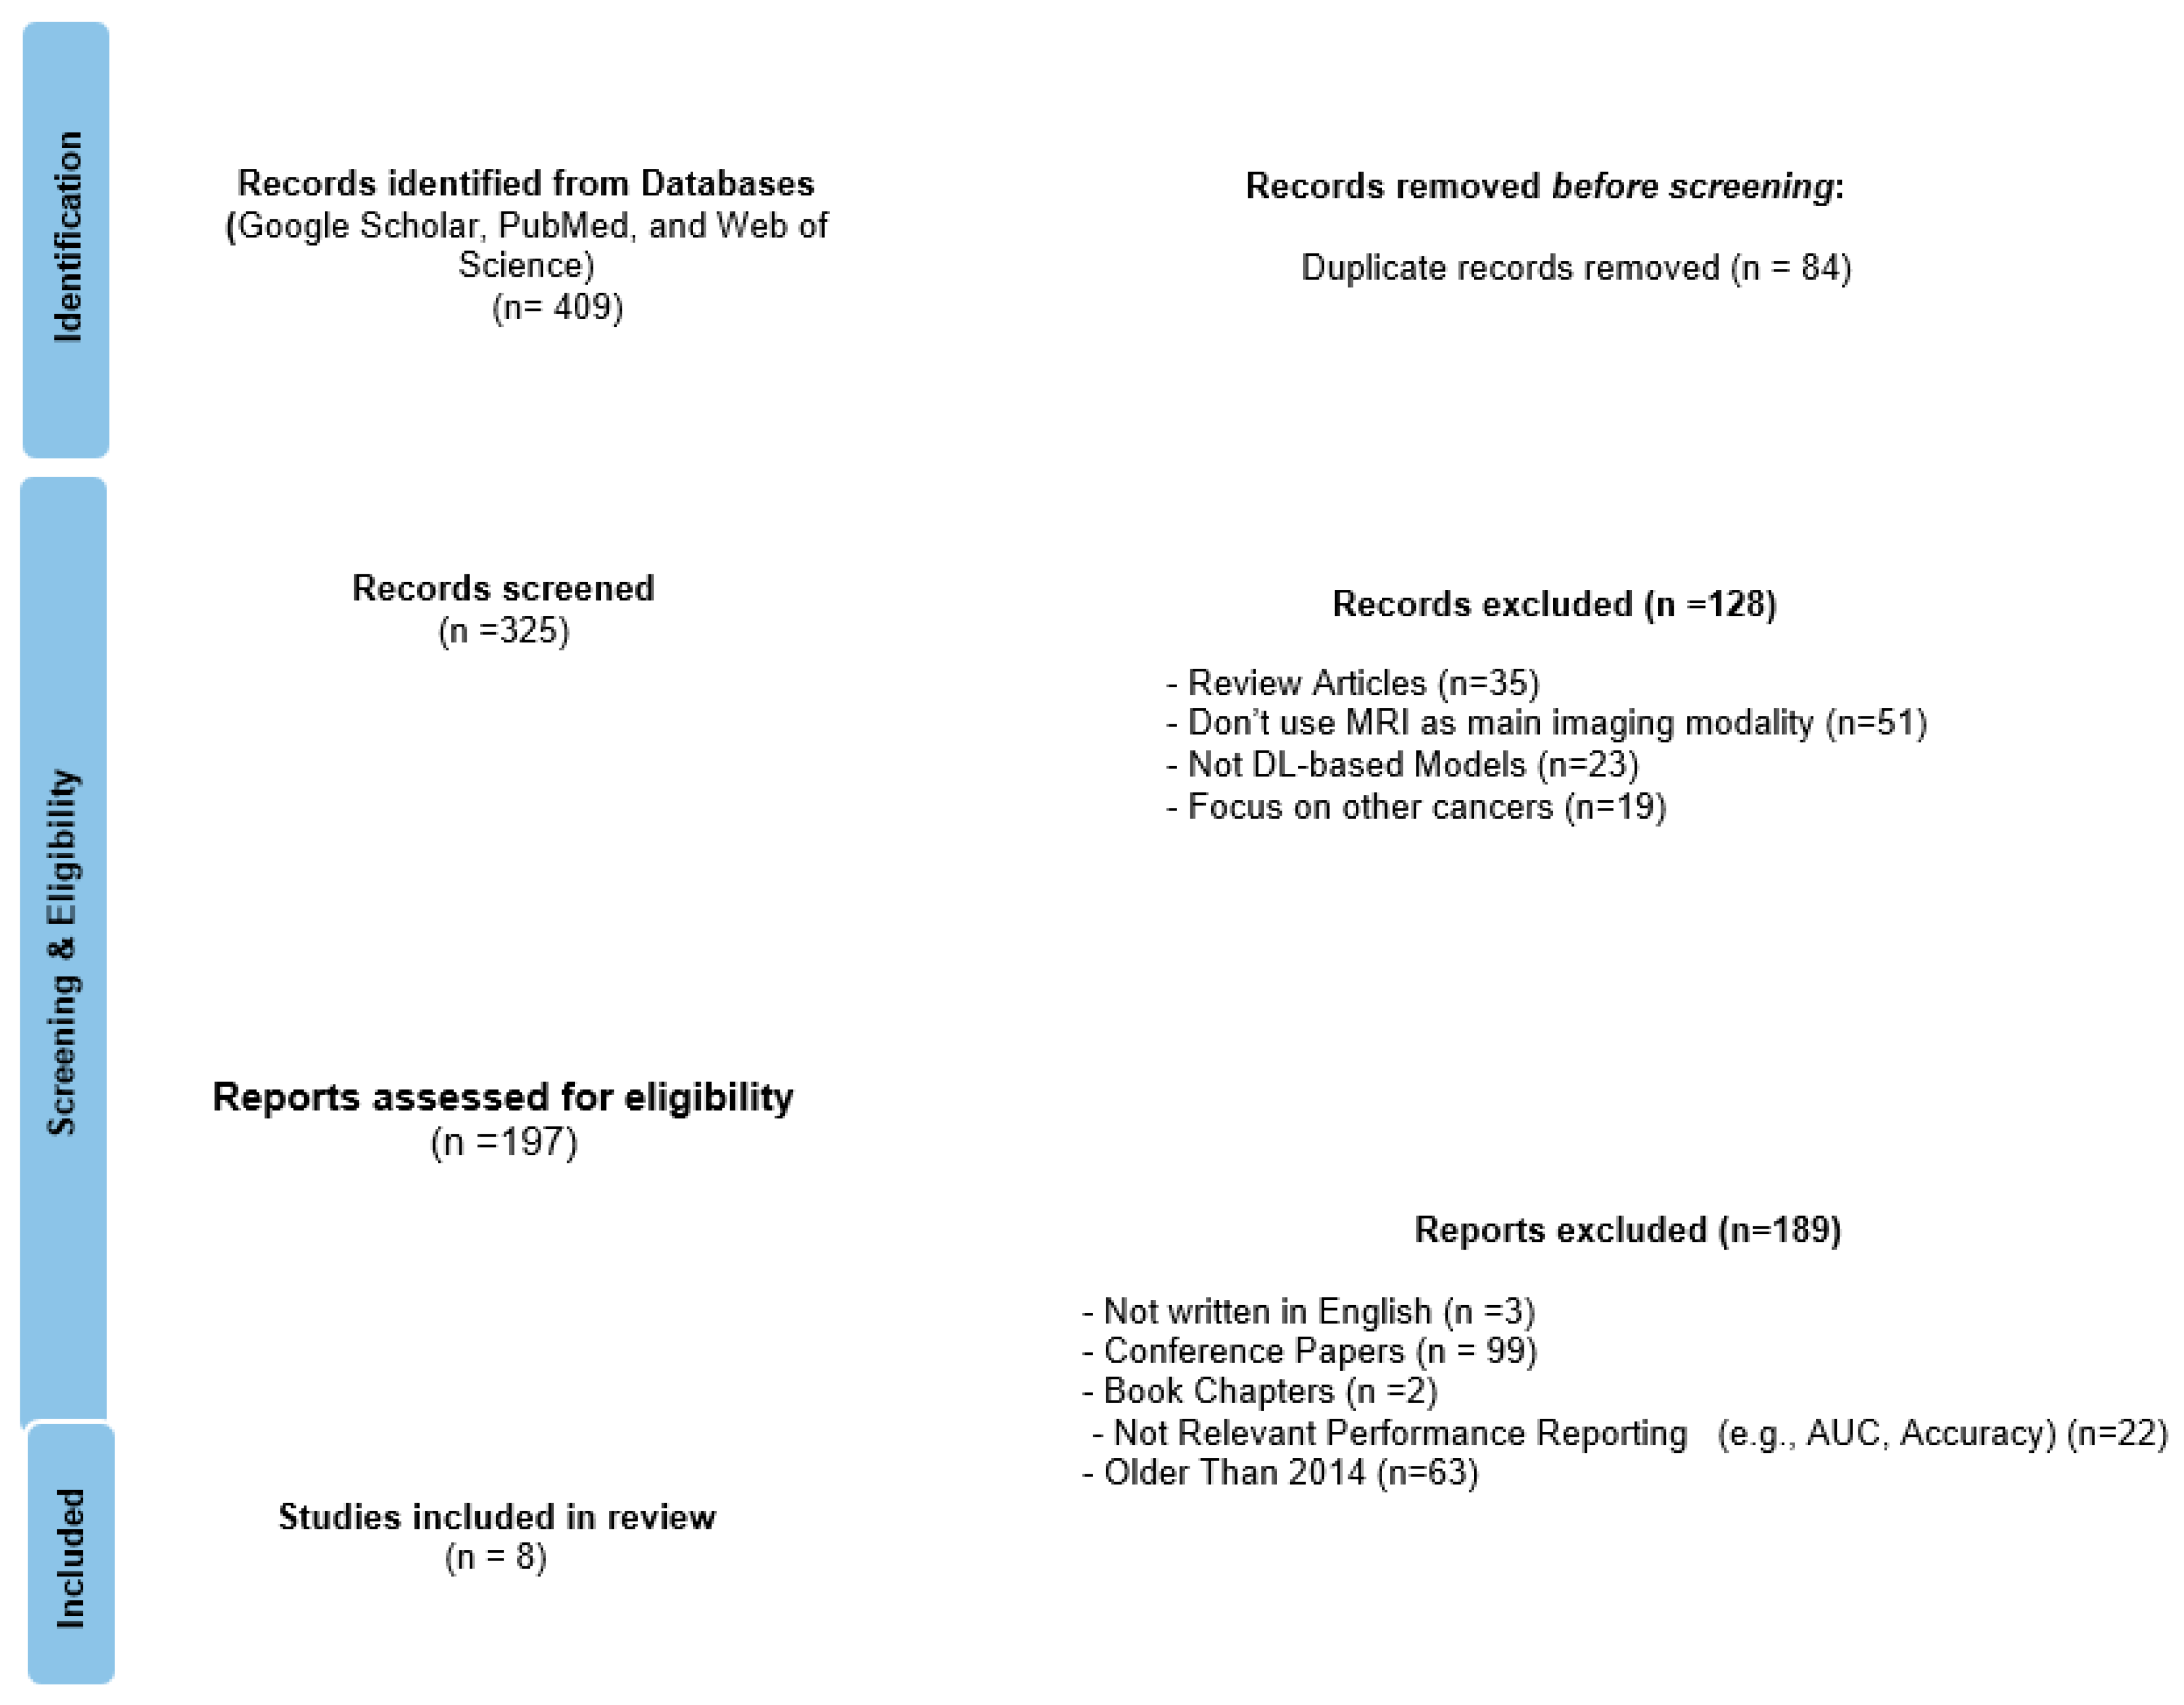
2.1. Search Strategy

The process of selecting studies in this review followed PRISMA 2020 framework, as shown in Figure 1 to ensure reproducibility, transparency, and methodological rigor in the identification, screening, and studies selection. A total of 409 records were taken initially, and they were retrieved from searching these databases: Google Scholar, Web of Science, PubMed. The search was conducted using explicit boolean strings for each database syntax: (“breast cancer” OR “breast tumour”) AND (“MRI” OR “magnetic resonance imaging”) AND (“deep learning” OR “convolutional neural network” OR “CNN” OR “YOLO”) AND (“classification” OR “segmentation” OR “detection”). In a restriction of the date of publication (2014-2025) as an exact time window to capture the rapid evolution of deep learning in medical imaging. Conference papers were excluded as journal papers typically provide more comprehensive experimental validation, dataset description and most importantly, peer-review rigor.
After eliminating 84 duplicated studies, remaining of 325 records were considered and were screened by their title and abstract. Among these, 128 articles were excluded due to irrelevance such as those which focused on other screening tools or applied non-DL methods. The remaining 197 articles were later evaluated in full text for further eligibility criteria:
The inclusion criteria were:
(1) studies applying deep learning (DL) models for breast cancer diagnosis or classification,
(2) the use of MRI-based imaging as the primary modality,
(3) evaluation using standard metrics (e.g., accuracy, AUC, sensitivity).
(4) availability of experimental design or dataset details.
(5) Written in English.
The exclusion criteria included:
(1) studies relying solely on machine learning (ML) without explicit comparison to or integration with DL models.
(2) imaging modalities other than MRI,
(3) papers lacking full methodological or evaluation details.
(4) studies focusing on other cancer types.
(5) Conference papers.
Following full text screening, 189 studies were excluded from the list, resulting in 8 eligible studies included in the qualitative synthesize. These studies were thoroughly analyzed in terms of DL algorithms used, datasets characteristics, preprocessing steps, and model performance.
Although the number of studies included is relatively small, this reflects the strict criteria applied, particularly the exclusive focus on MRI-based images that have been used to deploy only deep learning models to meet a high standard of clinical relevance and technical details. Secondly, the requirement for quantitative evaluation metrics emphasizes the clinically relevant tasks as classification, detection, and segmentation. These 8 studies represent the most robust and clinically relevant contributions within the defined scope and time window, allowing the high-quality analysis rather than a broad and superficial survey.

2.2. Performance Measures

To compare different DL models in terms of human’s standards, we use several metrics to do this task, accuracy, sensitivity, specificity, and AUC playing a crucial role in this task, each one come with an indication of a specific meaning for performance in the classification process. While in the segmentation phase (detection), another metric [10] can be used to evaluate the task has been assigned to be done.
True Positive (TP): the patients diagnosed positively and are indeed positive. True Negative (TN): the patients diagnosed negative and are indeed Negative, False Positive (FP): the patients diagnosed positive but are indeed negative, and False Negative (FN): the patients diagnosed Negative but are actual positive.[11]
Table 1. Confusion Matrix [12].
Predicted Positive Predicted Negative
Actual Positive True Positive (TP) False Negative (FN)
Actual Negative False Positive (FP) True Negative (TN)
The following metrics are the most used to evaluate the effectiveness of the DL model: [13,14,15,16]
Accuracy:
It is the proportion of correct predictions made by a model over the total predictions, telling how often the model is correct. However, this metric can be misleading if the data is unbalanced.
Accuracy = (TP+TN)/(TP+TN+FP+FN)
Recall:
Also known as Sensitivity or True Positive Rate – TPR, measures the ratio of true positive predictions (correctly identified positive instances) to the total actual positive instances.
Recall = (TP)/(TP +FN)
Precision:
Also known as Positive Predicted Value – PPV, is the ratio of true positive predictions to the total positive predictions made by the model.
Precision = (TP)/(TP+FP)
Specificity: Also known as True Negative Rate – TNR, determines what percentage of samples are correctly identified not to have a particular disease, and it is interpreted as:
Specificity = (TN)/(TN+FP)
F1_Score:
The F1 score is the harmonic mean of precision and recall, providing a balanced measure that considers both false positives and false negatives.
F1 = (2*Precision * Recall)/(Precision + Recall), and = (2TP)/(2TP + FP + FN)
These metrics are frequently selected because they provide a more thorough understanding of model performance, which is especially important in critical areas like medical diagnostics. By addressing potential issues such as class imbalance, they help prevent misleading results and contribute to building reliable models. Their application spans from the initial model selection through fine-tuning and ultimately enables clear communication of results backed by comprehensive evaluation.[11]

2.3. Quality Assessment and Risk Bias

The reliability of the included studies evaluated based on different standards: Data integrity: where verified ground truth was met by utilizing trusted publicly available datasets (e.g., Duke, QIN-Breast, TCGA-BRCA). Imbalance Handling: where a key risk of bias in BC detection is the prevalence of imbalanced data, here specific techniques like balanced patch sampling were used to mitigate this effect. Clinical Transparency: due to the black box nature of DL models which could be considered as a limitation, studies combined XAI or heatmaps visualization to provide higher clinical utility.
Most studies showed solid methodological design, especially those utilized large datasets or multi-modal inputs of MRIs, however some sources of bias couldn’t be exempted including lack of external confidential validation and limited dataset sizes.

3. Breast Imaging Tools and Data Resources

3.1. Imaging Modalities

The importance of having this section in the review is to have solid background information to be aware of why the focus will be on using MRIs rather other imaging modalities. Moreover, to understand the nature of data we are in front of in terms of clinical settings and complexity when it comes to finding a reliable data source with sufficient validation.
Several screening tools are being performed on the breast to manage breast tumors, mammography, MRI, and ultrasound are the most common due to their proven efficiency, each one with its own characteristics, pros and cons, and to be performed on patients in certain phases of the disease. For instance, when dealing with dense breasts, it is recommended to perform MRI [17] for its ability to show unseen features when using other imaging modalities [18].
Table 2. Summary of advantages and disadvantages of various imaging modalities.
Modality SpatialResolution KeyAdvantages Limitations Image
Example
Mammography Lower Spatial Resolution Cost-effective, good accuracy (in early detection), time-efficient Low sensitivity in dense tissues (usually appears in younger women)
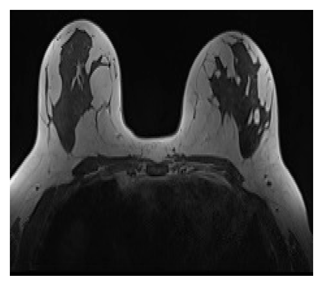
 Preprints 196154 i001
MRI High Spatial Resolution High sensitivity (detecting invasive cancer)
Identify undetected malignancies by mammography
Expensive, prone to false positives.
Requires validation. Low specificity
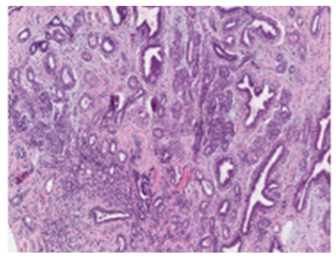
Preprints 196154 i002
Histopathology Very High Spatial Resolution Definitive diagnosis.
Crucial for staging and subtyping.
Time-consuming requires expertise for manual analysis
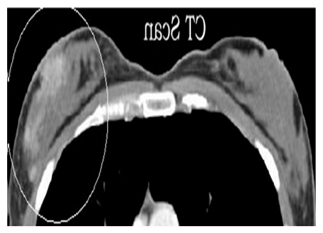
 Preprints 196154 i003
CT-Scans High Precise Can cause allergic reactions, comparably cost
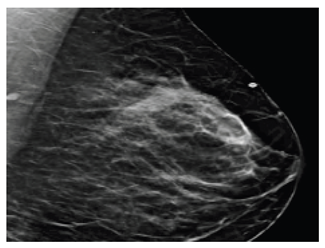
 Preprints 196154 i004
Ultrasound Moderate Less cost, uses sound waves Low specificity, not suitable for all tumor types Preprints 196154 i005
In this review, the focus will be on using MRIs despite the wide use of other imaging tools like mammography, due to the importance of using MRI, despite the limitations in cost and the need for complex infrastructure, and the time it takes to perform the screening. Its high sensitivity when screening high risk has the potential to detect small or unseen cancers which will improve the survival rate and reduce mortalities as a result[19].
MRI screening has significant advantages:
  • Detecting magnificence in higher rates: Comparing to mammography for example, MRI said to have a sensitivity rate of 90% comparing to 60% in the best case of MG, increasing the true detection rate in average of 16-30%.
  • Detecting malignancies in earlier stages:
  • Cancers with tiny sizes most of the time are not detected when using MG only, on the other hand using MRI significantly enhances the rates of detection at these stages.
  • Decreasing mortalities by increasing survival rates:
Due to the previous facts, better management of BC will lead to this conclusion [20].
On the other hand, MRI has some drawbacks:
  • The need for further investigation after performing MRI, like taking biopsies and developing a follow-up plan for the patients.
  • High cost [21]
  • Time needed to perform and time to interpret the report by the radiologist [22].

3.2. Data Resources

DL models are data hungry, luckily nowadays we are having various datasets can be utilized in order to develop robust and validated real-world systems that deal with BC and many other medical images. Yet this availability is prone to have several limitations in terms of data privacy, data quality, data variability (data heterogeneity), and the need for clinical validation for these models to be reliable and authentic in the decision-making process.
However, when having the potential by these models we must proceed for more improvement despite these challenges to go for the full clinical adoption of AI models in the field of medical images, thus reducing time, cost, and increasing the diagnosis accuracy.
MRI as other screening tools have many online publicly available datasets, these datasets considered a treasure to train AI models for the reason mentioned previously. Many studies have used these datasets to achieve distinguished outcomes thus enabling automated systems to be established and developed by means of real-world application[23].
As for BC, there are many publicly available MRI datasets that can be utilized for AI-based models [24,25,26,27,28,29,30]:
Table 3. List of publicly available breast MRI datasets.
Name No. of cases Imaging modality Resolution Tumor segmentation Enhanced contrast Best use case
Duke Breast Cancer MRI 922 patients MRI (DCE-MRI) Varies Yes Yes AI/ML, clinical studies
Advanced MRI Breast Lesions 632 MRI sessions MRI (1.5T) High Yes (radiologist-labelled) Yes Lesion characterization
MAMA-MIA Dataset 1,506 cases MRI (DCE-MRI) Varies Yes (expert) Yes Deep learning segmentation
QIN-Breast Multiple PET/CT, MRI Varies No Yes Multi-modal imaging analysis
Breast MRI NACT Pilot Multiple MRI (DCE-MRI) High Yes Yes Treatment response tracking
RIDER Breast MRI Multiple MRI (DWI, ADC) Varies No No Longitudinal tumor response
fastMRI Breast Large-scale MRI (k-space, DICOM) High No (case-level labels only) Yes MRI reconstruction research
Selecting the appropriate dataset is determined by the research objectives. Multi-modal datasets which integrate various screening techniques such as QIN-Breast can improve diagnostic accuracy, furthermore, combining different datasets increase data diversity contributing the robustness of models to be deployed, thus will have more benefits in terms of patients’ interests.

4. Literature Review

4.1. Deep Learning Approaches

Neural networks (NN) are the basic form of almost all modern DL methods, with it known architecture as said to have input, hidden layer, and output. And when having multiple hidden layers, then its typically deep learning model.[31]
Originally, ML-based CAD systems were widely adopted due to the fact of the input data and its nature (unstructured data), and the limited availability of the data which made the improvement diagnosing accuracy very hard[32]. Overcoming the tedious and time-consuming work for radiologists is the real value added by using DL models in the process of diagnosis, assessment and prediction for breast tumors. They even have the advantage over them in terms of accuracy despite the need for huge number of trainings for the model to be convenient, where the main task is to differentiate between benign and malignant tumors in the first phase[33].

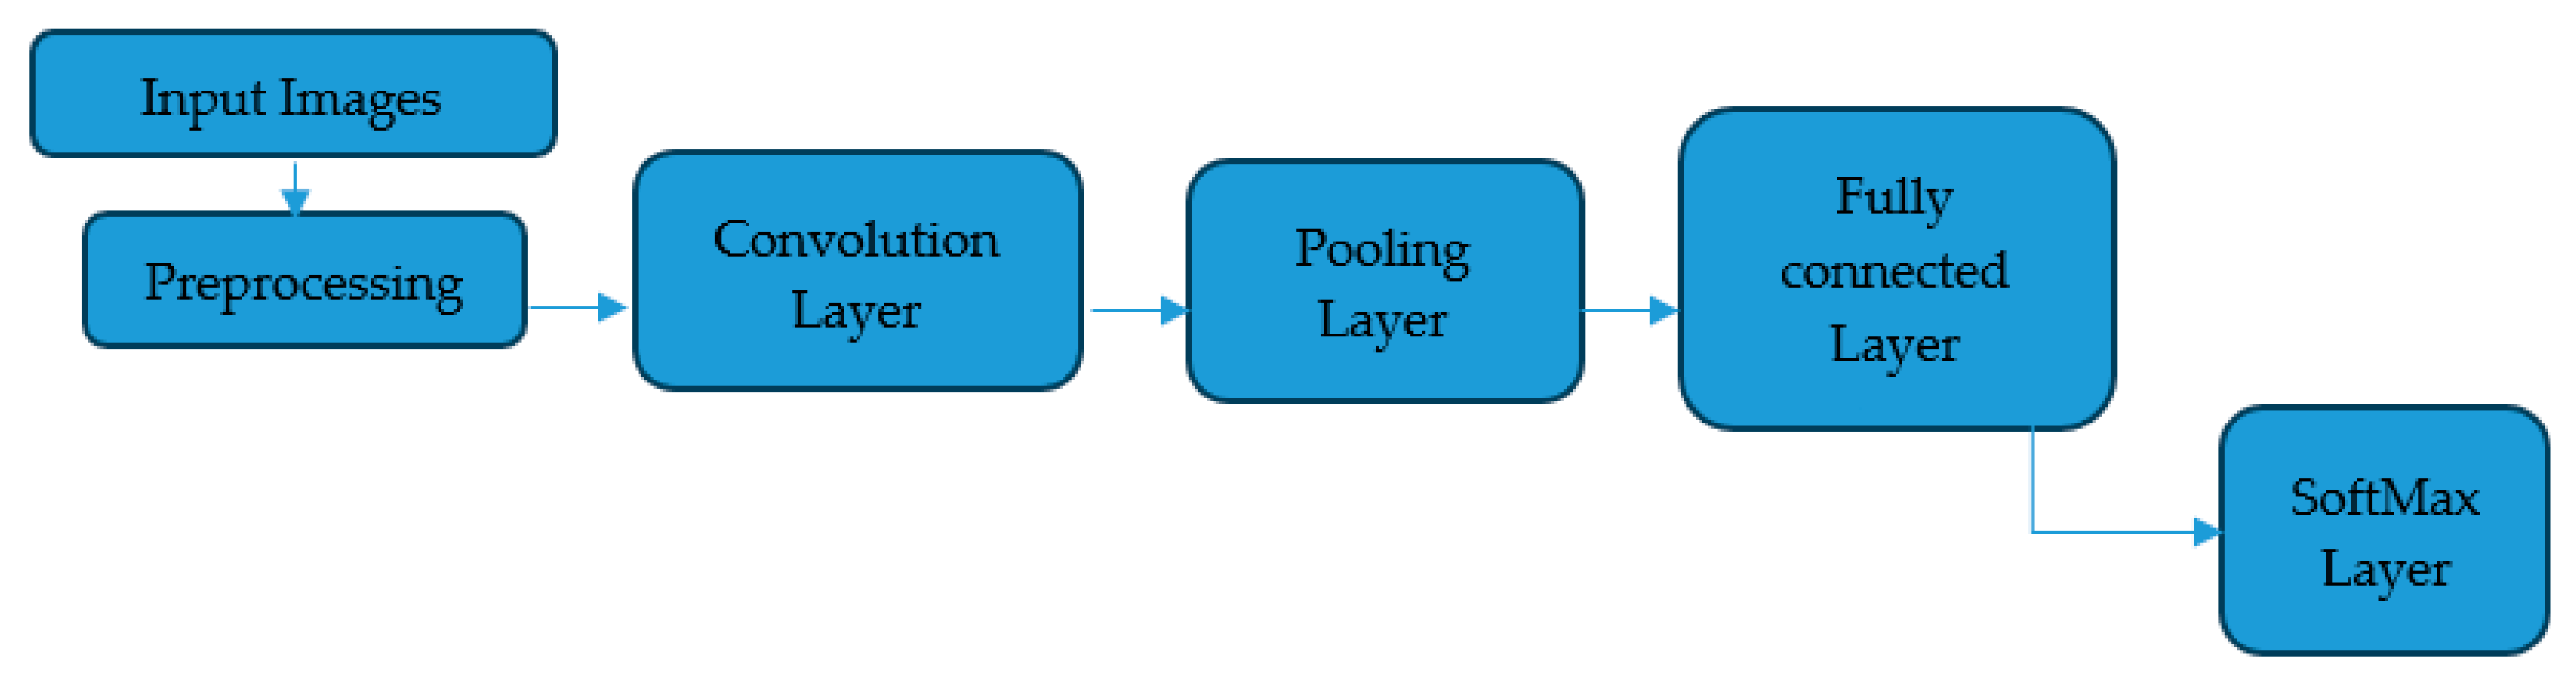
4.1.1. Convolutional Neural Networks (CNNs)

Among various DL approaches, CNN (which is a special type of DNN) proved its efficiency and has been used in different tasks such as medical images classification, by learning and extracting high level features outperforming the conventional or even other recent approaches. The convolutional layers are performing convolution operations to auto-extract features from the images, and then pooling layers said to be used to reduce the dimensionality of the features extracted, to finally enter the fully connected and SoftMax layers to perform the classification[34].
This review includes the state-of-the-art applications of DL approaches in breast MRIs, since many studies were developed in this realm showing significant advancements in several aspects: diagnosis, classification, and prediction of BC. While DL models have notably contributed to feature extraction and analyzing the medical images, leading to various clinical applications, the importance for further improvement arise[36].
Data preprocessing comes in the first place due to the nature of MRIs that are being collected with different setting resulting huge inconsistency, so that performing several preprocessing methods such as normalization, selecting ROIs, or cropping to the MRIs are essential to have a clean ground truth to build on, thus to have the potential for enabling more clinical applications adoption since a fully CAD detection system for breast tumors is still a challenge[37,38].
Having that said, the appearance of other organs in the breast image like heart or liver clearly exists, making the separation/segmentation for these organs a mandatory step for the correct analysis. And with the availability of huge number of images needed to be interpreted, the DL auto segmentation plays a crucial role in accelerating this process based on different methods[38,39].
The included studies are spotted in one of three main task categories:
  • Segmentation –focused studies: where the main goal is to accurately delineate breast tumors or lesions at the pixel level, supporting diagnosis, treatment planning.
Jiao et al. dealt with a dataset of 75 women with suspicious masses in the breast MRIs from the Sun Yat-sen University Cancer Centre to propose a DL model for mass auto-detection to aid the radiologists and improving the accuracy. Data augmentation was done to the images due to the small amount of them trying to reduce overfitting. The proposed method consisted of two phases: segmentation (implementing U-Net++ to separate other organs appeared in the images), and mass detection using Deep Convolutional neural networks (DCNNs).
To ensure more robustness, they applied 5-fols cross-validation approach, further, to assess the model, they used the Dice Similarity Coefficient (DSC), Jaccard Coefficient, and sensitivity of segmentation. The model achieved high accuracy, of DCS, JC, and sensitivity of 0.951, 0.908, and 0.948 respectively. While for the mass detection part, Faster R-CNN, the model used the segmented images and the performance was evaluated in terms of sensitivity and the number of false positive rate, demonstrating an average sensitivity of 87.4% with 3.4 false positives per case, thus confirming the system to be effective, highlighting the potential for further improvements despite the limitation of using a small dataset.[40]
Another study by Hirch et al. managed to develop a DL model to auto-segment BC MRI scans, with a 3D U-Net as a primary model beside a DeepMedic network using DCE-MRIs as input to the architecture. As a preprocessing they normalized the data to enhance performance, found that 3D U-Net outperformed the DeepMedic network as it has the ability to integrate volumetric features avoiding the sampling artifacts.
The dataset consisted of a total of 38229 MRIs, from 14475 patients, and 64063 breast scans collected from the radiology department at Memorial Sloan Kettering Cancer Centre. Hence, the models expected to perform well as they were trained on a large dataset, and it met expectations notably when comparing the results with prior studies reported the potential of developing a robust system that is capable to handle challenges in difficult cases such as small tumors’ size [41].
In their study, Akbar et al., presented a novel deep learning-based approach for high precise breast tumor segmentation in dynamic contrast enhanced magnetic resonance imaging (DCE-MRI). They aimed to improve the accuracy of segmentation of DCE-MRI scans which are critical for early detection and treatment planning for breast cancer patients.
Several challenges are there: variation in tumor size, shape, and intensity that harden the process of segmentation, in addition of existing methods often overlook edge details. With this, researchers developed a model with three main modules:
  • Contextual mapping module, using the swin transformer with reinforcement tokenization to extract features and improve training efficiency.
  • Edge analysis module: employ CNNs to enhance edge details for better boundary detection.
  • Feature integration module: combines the two modules using graph convolution for effective future fusion.
The model was tested on two publicly available datasets: QIN-BREAST DCE-MRI: which contained 20 samples from 10 patients. And Duke Breast Cancer Dataset: that includes 922 patients with DCE-MRI and T1-MRI images. As a result, this model outperformed the baseline methods in several metrics like Dice coefficient, Jaccard index, Precision, Sensitivity, and Specificity. For example, it achieved a score of 0.9389, 0.8336 in QIN dataset and Duke dataset respectively. Thus, the model demonstrated slod edge detection and segmentation accuracy, most importantly, efficient computational performance with fewer parameters and faster processing speed.[42]
In their paper, Khaled et al., discussed an automated method for breast lesion segmentation in DCE-MRIs using a modified U-Net architecture and ensemble methods to improve diagnostic accuracy in BC detection, aiming to reduce the workload for radiologists by accurately segmenting lesions.
After discussing the importance of utilizing DCE-MRIs and addressing the challenges ahead, the segmentation proposed methodology introduces an ensemble of three modified U-Net models, each utilizing different input combinations from DCE-MRI. Then the method incorporates a balanced patch sampling technique to address class imbalance and confounding organs that always appear in the scans. Using TCGA-BRCA dataset, 46 cases including complex and challenging lesions in terms of lesion size, shape, and intensity were adopted, and the modified U-Net with the ensemble approach seemed to outperform existing models achieving a Dice Similarity Coefficient (DSC) of 0.680.
As for many studies that have relied on small datasets, this one had the same limitation, meaning that the need for larger datasets to be utilized still needed to have a generalized model we can depend on in real time applications of DL on breast cancer using MRIs. This underscores a common theme in the field, where promising algorithmic advances are hindered by data scarcity, limiting clinical generalizability [43].
A novel approach designed by, Peng et al., was discussed deploying an inter-modality information interaction network (IMIIN) for 3D multi-modal breast tumors segmentation using deep learning to improve accuracy in clinical settings effectively, considering the segmentation process crucial for diagnosis and treatment improving patients survival rates whether it was done the traditional ways (Time-consuming) or using automatic segmentation methods which is better in this sense of patients’ interest.
After having many limitations in previous methods like struggling with small tumors and lack of efficient multi-modal information fusions, this DL method showed optimistic outcomes in terms of capturing tumors characteristics in multi-modal images. The process of segmentation was divided into two stages: coarse localization that should predict tumor location, and fine segmentation which main function is to refine the results from the first stage utilizing pseudo-Siamese network.
IMIIN was tested on a dataset of 590 samples of 3d MRI multi-modal breast tumors from the department of radiology, Sun Yat-Sen Memorial Hospital, China, all of them were scanned by a 1.5T scanner with manual labels verified by professional radiologists. In a later stage, data was split into 0.7 training, 0.1 validation, and 0.2 testing sets with normalization applied. IMIIN achieved segmentation sensitivity and Dice similarity coefficients of 93.08% and 90.49% respectively, showing better results than when using single modal segmentation offering a good generalization ability for multi-modal breast tumor segmentation [44].
2.
Classification and detection-focused studies: studies in this category primarily focus on distinguishing benign from malignant or localizing suspicious regions using bounding box detection technique.
Zhu et al. also aimed to develop a DL model to perform an automated lesion segmentation in multiparametric MRI (mpMRI: which is a screening approach that can show more details combining different methods like DWI and DCE). This objective was attempted by utilizing CNN models for the classification and segmentation to differentiate between benign and malignant lesions effectively. The study used a relatively large dataset of 5811 patients, divided into 2823 patients for segmentation tasks, and 3303 patients for the characterization task, those have 3607 confirmed lesions (1394 benign, 2213 malignant). The segmentation was done using VNet-model, and three ResNet models, one performed using DCE, one using DWI and a combined one using both.
The VNet model demonstrated a DSC of 0.86, precision of 0.867, and recall of 0.853, as mentioned this was for the segmentation part, while for the lesion characterization, the combined (multi-input of DWI & DCE) models achieved the best performance comparing to the single input DCE and single input DWI, of Accuracy sensitivity, specificity, and AUC of 84.6%, 83.1%, 87.4%, 92.7% respectively. The study proved a favorable use of this CAD system as a tool to be adopted in clinical practice as it achieved similar accuracy to the radiologist[45].
They have implemented a DCNN model to improve the process of diagnosing BC using MRIs, introducing a strongly supervised DL system consisting of three parts:
a-
Extraction of ROI of the input MRIs with lesion annotation.
b-
Evaluate the model using five DCNN models: ResNet50, DenseNet, VGG16, GoogLeNet, and AlexNet as for training and prediction.
c-
Diagnosing the lesion.
The dataset is from 337 patients, including a total of 487 confirmed lesions (267 benign, 220 malignant), the DCE-MRI scans were collected at Sun Yat-Sen University Cancer Centre, and have been split into 0.7 for training, 0.18 for validation, and 0.12 for testing. Despite the limitations presented including the dependence on full labelled data by radiologists, a distinguished outcomes were gained where the DenseNet model delivered the highest performance among all tested models with 0.925 accuracy, 0.95 sensitivity, 0.9 specificity, and AUC of 0.958 when applying the smallest bounding box of the lesion ROI (SBBL-ROI)[45].
Yang et al. explores the application of YOLOv8 for the auto detection and classification of BC employing an anchor-free head, CSP, and C2f modules for feature extraction, and utilizing 2894 MRI scans collected from 135 patients, alongside with other YOLO versions for comparing purposes, to finally validate the effectiveness in the BC diagnosing process. The tumors in this study were annotated into four types (HER-2(0): 318 images, HER-2(1+): 855 images, HER-2(2+): 931 images, HER-2(3+): 790 images) with the assistance of expert radiologists and then the dataset was divided into subsets of training, validation, and testing of (8:1:1) respectively.
YOLOv5, YOLOv7, Faster R-CNN, SSD, and YOLOv9, have been deployed also as mentioned to be compared, however, the YOLOv8 has demonstrated the highest accuracy among all with 96.1% recall rate, and 96.4% precision rate, proving the suitability of using it as the most appropriate model. On the other hand, several limitations arise as having a small dataset and having dense tissues and irregular shapes of lesions[46].
Another study carried out by Akgül et al. proposed a hybrid DL model for BC detection using YOLOv3 for region detection, combined with Incption-v3, EfficientNet-B3, and DenseNet-201 separately to be used for classification. The dataset contained 73522 MRI scans from 64 patients (32 benign, 32 malignant) each scan with multi sequences in DICOM format, these were labelled and pre-processed after converting them to JPG in a size of 192*96 pixels, preserving the same categories of normal and cancerous. These scans were collected from University Mengücek Gazi Education and Research Hospital specialist physicians, in Turky.
Among the performed models, YOLOv3 + DenseNet-201 achieved the best performance in terms of accuracy, sensitivity, specificity, and loss of 92.41%, 92.44%, 92.44%, and 0.5936 respectively, after been trained for 30 epochs using Adamax optimizer and sigmoid activation, one of the most important contributions of this study is that they proved the potential to reduce the use of contrast materials in MRI routine. Despite the limitations of using a small size of data, and the computational cost related to using hybrid models[47].
3.
Multimodal and hybrid approaches: several studies have integrated multiple MRI sequences or combined detection and classification models to enhance diagnostic performance.
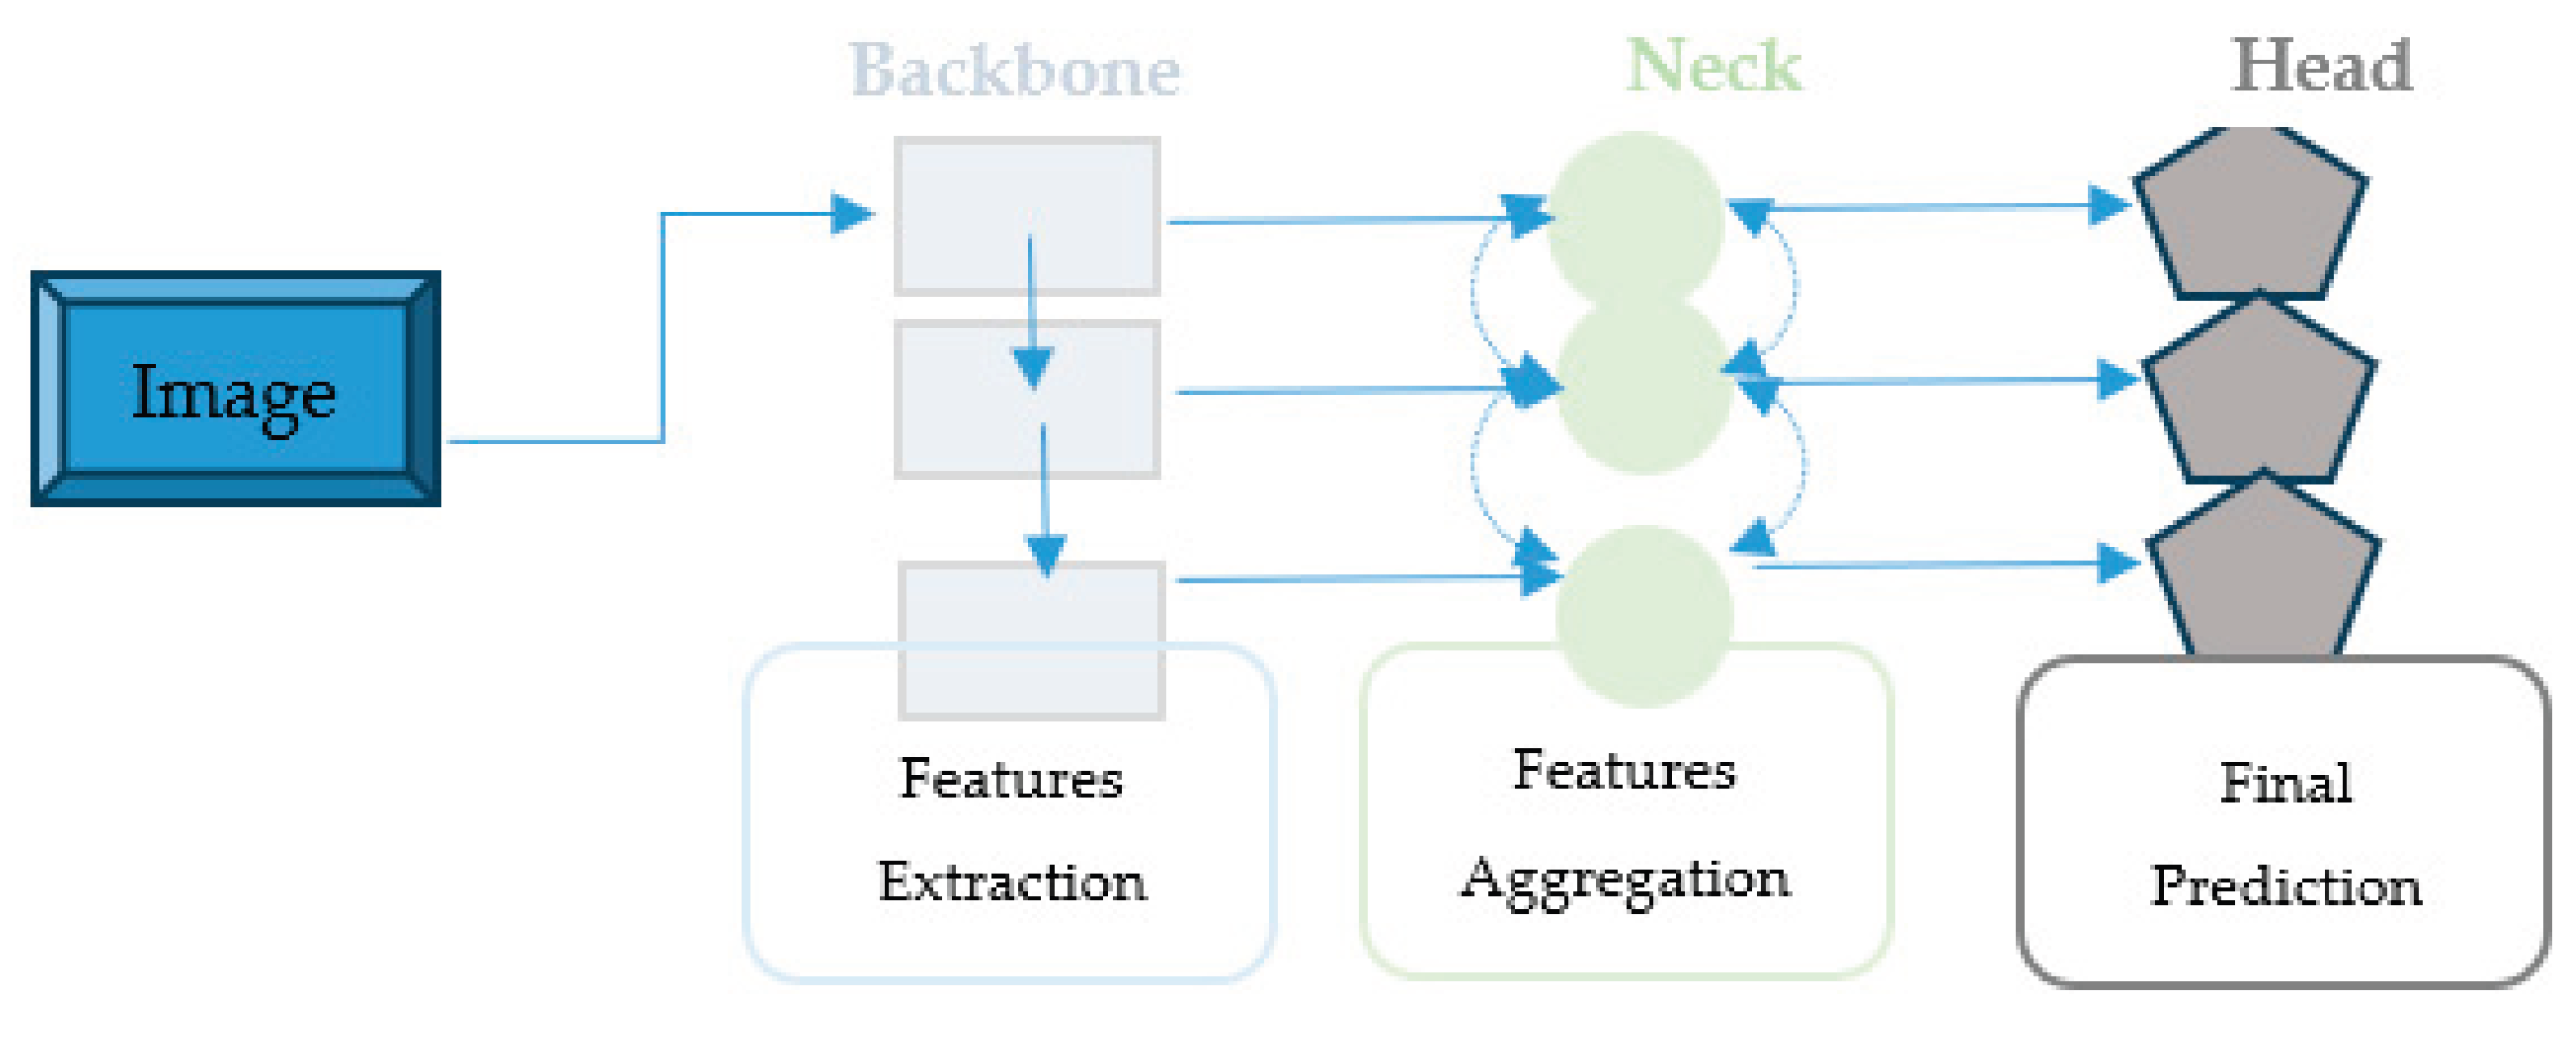
Across selected studies, multimodal and hybrid architectures consistently outperformed single-input models, underscoring the importance of complementary imaging information for robust feature learning. Clear examples of the multimodal approaches are shown in: Zhu et al. (DCE + DWI), Peng et al. (T1 & T1c), Akgül et al. (YOLO + CNN classifiers).

4.1.2. YOLO Methods

YOLO is a widely used DL algorithm for real-time object detection and classification, in a context of breast MRI imaging, YOLO is a potential way to identify and localize suspicious lesions by automatically by drawing bounding boxes directly on MRI scans. This approach might facilitate rapid and accurate detection of benign and malignant abnormalities in the breast finally to help clinical to make faster decisions and accurate at the same time. Different versions of YOLO such as YOLOv5, YOLOv9, achieved reliable performance in lesion detection and highlighted images regions to support clinical interpretation. [48,49,50]
Complex nature of medical images made the continuous improvement to investigate them in many aspects a must, from diagnosis to object detection, and classification[51]. YOLO (You Only Look Once) is relatively recent approach to dealing with object detection in various medical fields. Indicating high efficiency in this realm showing a significant improved performance compared to other methods [52]. The conventional way to annotate and segment manually is likely to have mistakes and it is time-consuming, YOLO as a real-time DL-based object detection method proved a measurable performance in this manner[53], utilizing CNN approach to act as a quick and precise object detection system, as other methods always had a trade-off between speed and accuracy [54].
The basic concept to make up a YOLO architecture is to have three elements[53,54,55,56]:
-
Backbone: where the main task is to extract useful features from images using CNN architectures, such as ResNet50, or VGG16.
-
Neck: Acts as a mediator between the backbone and the head, with a functionality of merging feature maps from different backbone layers and send them for further processing.
-
Head: here a process of utilizing features from the neck is being done to make predictions.
Utilizing all what have been mentioned, YOLO demonstrated a state-of-the-art real-time object detection technique, as for it can detect all objects in the image very fact and very accurate[57], thus it is considered as the best method to fit time-sensitive medical decision-making procedures.--------, from the very first version to the last one (v1: 2015 – v11 : 2024)[58]. Figure 2 is demonstrating the YOLO general architecture:
As an example of Yolo-based approaches demonstrated strong real-time detection capabilities, with [46] reporting high recall and precision using YOLOv8, highlighting the suitability of one-stage detectors for time sensitive clinical applications.
Figure 3. General YOLO Architecture (Backbone, Nech, and Head varies in different Versions) [58].
Preprints 196154 g003

4.2. Summary of Included Studies

Table 4. Summary of Included Studies on BC DL-Based Classification & Prediction Using MRI.
Authors Year Modality Primary Task Method Performance
(Jiao et al.,) 2020 DCE-MRI Segmentation U-Net (Segmentation)
Faster RCNN (Detection)
ResNet-101 (Backbone)
DSC: 0.951
Jaccard Coefficient: 0.908
Sensitivity: 0.948
FRCNN Sensitivity: 0.874
(Zhu et al.,) 2022 Multiparametric MRI Multimodal V-Net (Segmentation)
ResNet (Characterization)
DSC: 0.860
AUC: 0.927
Accuracy: 0.846
Sensitivity: 0.831
(Hirsch et al.,) 2022 DCE-MRI Segmentation 3D U-Net DSC: 0.77
(Yang et al.,) 2024 MRI Classification/Detection YOLOv8 Recall: 0.961
Precision: 0.964
mAP: 0.971
(Akbar et al.,) 2025 DCE-MRI Segmentation Swin Tranformer, CNN, and Graph Convolution QIN DATASET:
DSC: 0.9389
Specificity: 0.9992
DUKE DATASET:
DSC: 0.8336
Specificity: 0.9995
(Khaled et al.,) 2022 DCE-MRI Segmentation U-Net Ensemble DSC: 0.680
(Peng et al.,) 2022 3D Multimodal MRI (T1 & T1c) Segmentation IMIIN using Dense-Net T1c MODAL:
DSC: 0.9049
Sensitivity: 0.9308
T1 MODAL:
DSC: 0.8507
Sensitivity: 0.8923
(Akgül et al.,) 2024 DCE-MRI Classification/Detection YOLOv3 (Region Detection)
DenseNet-201 (Classification)
Accuracy: 0.9241
Sensitivity: 0.9244
Specificity: 0.9244

5. Discussion

Using ML and DL with BC research using MRIs turned out to be essential if we are into improving patients’ lives. While ML methods are more accessible due to need for lower computational costs to be adopted in the real-world applications. DL is being widely used with its ability to engineer features automatically and efficiently such as CNN, U-Net, and YOLO. This review showed that despite the need for enormous amounts of data to get the most from DL models, they turned out to be more applicable if we are considering the complexity of clinical settings and the details in this field.
While studies reviewed reported strong performance metrics for DL-based analysis using MRIs, a critical examination reveals several methodological limitations that will be considered as an obstacle in real-world adoption.

5.1. Sample Size Limitation

A remaining limitation across many studies in the review is the small sample size when it comes to deploying DL models, especially in segmentation tasks. Number of studies relied on datasets fewer than 100 patients, which increases the risk of overfitting and inflates performance metrics. Although architectural innovations such as U-Net and transformers-based model demonstrated technical sophistication, limited data diversity restricts the statistical robustness of these findings.
On the other hand, studies leveraging bigger samples size as in Hirsch et al., showed more stable and clinically crediblr performance, highlighting datasets scale as a key determinant of reliability rather than model complexity alone.

5.2. Reuse of Public Datasets

The frequent use of a small dataset from public datasets is another concern, while they are essential for benchmarking and reproducibility, repeated evaluation of the same data raises the risk of bias and over optimistic generalization claims. The frequent reliance on single or homogeneous datasets limits the exposure to scanner vendors variations, imaging protocols, and patients demographics, all of which are known to alter the MRI appearance.

5.3. Lack of External Validation and Domain Shift

Vast majority of the studies evaluated model performance using train-test splits or cross validation, with very few using external validation on independent samples. This lack of external testing makes it difficult to assess robustness under domain shift, such as changes in scanner field, contrast protocols, or institutional imaging standards. Domian shift remains one of the most barriers to clinical deployment, as models trained on predefined datasets may experience substantial performance decaying when applied in new clinical environment.

5.4. Explainable AI (XAI)

The black box nature of DL models is still a major barrier to clinical trust despite the high reported accuracy. Only few studies incorporated explainability mechanisms, such as heatmaps or visualizations. Without robust interpretability frameworks, radiologists may be resistant to rely on automated predictions, particularly in high-risk cases. Thus, future work must integrate XAI not as an optional feature, but as a core design requirement aligned with clinical decision-making process.

5.5. Barriers to Integration into Radiology Workflows

In the reviewed literature, practical implementation challenges are rarely discussed or addressed in a way. They include high computational costs, long inference time for MRI data, and dependency on contrast enhanced sequences. Moreover, few studies assessed how DL models would function as decision-support tools, rather than standalone diagnostic stations. Successful clinical integration requires seamless workflow alignment, minimal workload on radiologists, and the awareness of the human-AI boundaries and responsibilities.
Taking all of that together, these findings suggest that future research should move toward generalizability, interpretability instead of marginal performance alone. Because this will evaluate the real-world impact on diagnostic accuracy, efficiency, and most importantly patients’ outcomes, because high diagnostic performance alone is not enough for clinical translation to establish trust in AI-assisted tools in this manner.

6. Conclusions

This review synthesized findings from 8 studies focusing on advanced DL architectures for breast MRI. Among the reviewed studies, hybrid and multi-modal models consistently outperformed single-modal, and YOLO-based detectors demonstrated higher real-time localization abilities. While diagnostic accuracy shown to remain above 90%, the evidence base remains geographically and institutionally narrow due to many reasons.
In terms of addressed challenges for the transition of these models into clinical routines, most studies relied on limited set of publicly available datasets (e.g. Duke, QIN Breast), suggesting that while the architecture is good, the evidence base still needed and validation is still required for clinical standards. Moreover, the high computational costs remain as a barrier to adopting real-world deployment, which raises the need for something like a lightweight model that can be integrated into existing radiology workstations. Furthermore, the transparency issue in AI-Assisted decision-making tools needs a collaborative effort to utilize high quality, annotated, and diverse MRI data to ensure generalizability and validated frameworks.
In conclusion, DL is showing great promise for transforming breast MRI analysis from early detection and segmentation to personalized treatment planning. The combination of data diversity, explainable models, and clinical settings will shape the next era of computer-aided BC diagnosis, ultimately reduce human tedious workload and improve patient outcomes, while considering the limitations and challenges addressed previously.

Conflicts of Interest

The authors declare no conflicts of interest.

Abbreviations

The following abbreviations are used in this manuscript:
MRI Magnetic Resonance Imaging
DL Deep Learning
YOLO You Only Look Once
BC Breast Cancer
CNN Convolutional Neural Network
ML Machine Learning
TP True Positive
TN True Negative
FP False Positive
FN False Negative
NN Neural Network
CAD Computer Aided Diagnosis
DSC Dice Similarity Coefficient
JC Jaccard Coefficient
mpMRI Multiparametric MRI
DCE-MRI Dynamic Contrast Enhanced MRI
ROI Regions of Interest
IMIIN Inter-modality Information Interaction Network
XAI Explainable AI

References

  1. WHO. Breast cancer deaths. [PubMed]
  2. Michaelson, J. S. Gauging the Impact of Breast Carcinoma Screening in Terms of Tumor Size and Death Rate. Cancer 2003, vol. 98(no. 10), 2114–2124. [Google Scholar] [CrossRef] [PubMed]
  3. Lee, C. H. Breast Cancer Screening With Imaging: Recommendations From the Society of Breast Imaging and the ACR on the Use of Mammography, Breast MRI, Breast Ultrasound, and Other Technologies for the Detection of Clinically Occult Breast Cancer. Journal of the American College of Radiology 2010, vol. 7(no. 1), 18–27. [Google Scholar] [CrossRef] [PubMed]
  4. Hodgson, D. C.; Cotton, C.; Crystal, P.; Nathan, P. C. Impact of early breast cancer screening on mortality among young survivors of childhood Hodgkin’s lymphoma. J. Natl. Cancer Inst. 2016, vol. 108(no. 7). [Google Scholar] [CrossRef]
  5. Chen, J. A deep learning-based multimodal medical imaging model for breast cancer screening. Sci. Rep. 2025, vol. 15(no. 1). [Google Scholar] [CrossRef]
  6. Ahmad, J. Deep learning empowered breast cancer diagnosis: Advancements in detection and classification. PLoS One 2024, vol. 19. [Google Scholar] [CrossRef]
  7. Ahmad, J. Deep learning empowered breast cancer diagnosis: Advancements in detection and classification. PLoS One 2024, vol. 19. [Google Scholar] [CrossRef]
  8. Su, Y.; Liu, Q.; Xie, W.; Hu, P. YOLO-LOGO: A transformer-based YOLO segmentation model for breast mass detection and segmentation in digital mammograms. Comput. Methods Programs Biomed. 2022, vol. 221. [Google Scholar] [CrossRef]
  9. E. Mahoro and M. A. Akhloufi, “Applying Deep Learning for Breast Cancer Detection in Radiology,” Nov. 01, 2022, MDPI. [CrossRef]
  10. B. J. Erickson and F. Kitamura, “Magician’s corner: 9. performance metrics for machine learning models,” May 01, 2021, Radiological Society of North America Inc. 01 May. [CrossRef]
  11. Vujović, Ž. Classification Model Evaluation Metrics. International Journal of Advanced Computer Science and Applications 2021, vol. 12(no. 6), 599–606. [Google Scholar] [CrossRef]
  12. Sokolova, M.; Lapalme, G. A systematic analysis of performance measures for classification tasks. Inf. Process. Manag. 2009, vol. 45(no. 4), 427–437. [Google Scholar] [CrossRef]
  13. Sokolova, M.; Lapalme, G. A systematic analysis of performance measures for classification tasks. Inf. Process. Manag. 2009, vol. 45(no. 4), 427–437. [Google Scholar] [CrossRef]
  14. Saito, T.; Rehmsmeier, M. The precision-recall plot is more informative than the ROC plot when evaluating binary classifiers on imbalanced datasets. PLoS One 2015, vol. 10(no. 3). [Google Scholar] [CrossRef]
  15. Y. Jiao and P. Du, “Performance measures in evaluating machine learning based bioinformatics predictors for classifications,” Dec. 01, 2016, Higher Education Press. [CrossRef]
  16. B. J. Erickson and F. Kitamura, “Magician’s corner: 9. performance metrics for machine learning models,” May 01, 2021, Radiological Society of North America Inc. 01 May. [CrossRef]
  17. Pinker, K. Diffusion-Weighted Imaging With Apparent Diffusion Coefficient Mapping for Breast Cancer Detection as a Stand-Alone Parameter Comparison With Dynamic Contrast-Enhanced and Multiparametric Magnetic Resonance Imaging. Invest. Radiol. 2018, vol. 53(no. 10), 587–595. [Google Scholar] [CrossRef] [PubMed]
  18. H. Hussein et al., “Supplemental Breast Cancer Screening in Women with Dense Breasts and Negative Mammography: A Systematic Review and Meta-Analysis,” Mar. 01, 2023, Radiological Society of North America Inc. [CrossRef]
  19. Roca, S. Alonso; Delgado Laguna, A. B.; Lexarreta, J. Arantzeta; Campo, B. Cajal; Jareño, S. Santamaría. Screening in patients with increased risk of breast cancer (part 1): pros and cons of MRI screening. Radiologia 2020, vol. 62(no. 4), 252–265. [Google Scholar] [CrossRef]
  20. Gareth, E. D. MRI breast screening in high-risk women: Cancer detection and survival analysis. Breast Cancer Res. Treat. 2014, vol. 145(no. 3), 663–672. [Google Scholar] [CrossRef] [PubMed]
  21. Pataky, R. Cost-effectiveness of MRI for breast cancer screening in BRCA1/2 mutation carriers. BMC Cancer 2013, vol. 13. [Google Scholar] [CrossRef]
  22. F. J. Gilbert and A. Selamoglu, “Personalised screening: is this the way forward?,” Apr. 01, 2018, W.B. Saunders Ltd. [CrossRef]
  23. K. A. Dishner et al., “A Survey of Publicly Available MRI Datasets for Potential Use in Artificial Intelligence Research,” Feb. 01, 2024, John Wiley and Sons Inc. [CrossRef]
  24. Huang, W. Variations of dynamic contrast-enhanced magnetic resonance imaging in evaluation of breast cancer therapy response: A multicenter data analysis challenge. Transl. Oncol. 2014, vol. 7(no. 1), 153–166. [Google Scholar] [CrossRef]
  25. Solomon, E. FastMRI Breast: A Publicly Available Radial k-Space Dataset of Breast Dynamic Contrast-enhanced MRI. Radiol. Artif. Intell. 2025, vol. 7(no. 1). [Google Scholar] [CrossRef]
  26. C. Panico et al., “Staging Breast Cancer with MRI, the T. A Key Role in the Neoadjuvant Setting,” Dec. 01, 2022, MDPI. [CrossRef]
  27. D. Anaby, D. Shavin, G. Zimmerman-Moreno, N. Nissan, E. Friedman, and M. Sklair-Levy, “‘Earlier than Early’ Detection of Breast Cancer in Israeli BRCA Mutation Carriers Applying AI-Based Analysis to Consecutive MRI Scans,” Cancers (Basel)., vol. 15, no. 12, Jun. 2023. [CrossRef]
  28. Saha. A machine learning approach to radiogenomics of breast cancer: A study of 922 subjects and 529 dce-mri features. Br. J. Cancer 2018, vol. 119(no. 4), 508–516. [Google Scholar] [CrossRef]
  29. L. Garrucho et al., “A large-scale multicenter breast cancer DCE-MRI benchmark dataset with expert segmentations,” Jun. 2024, [Online]. Available: http://arxiv.org/abs/2406.13844.
  30. D. Newitt and N. Hylton, “The Cancer Imaging Archive.”.
  31. G. Litjens et al., “A survey on deep learning in medical image analysis,” Dec. 01, 2017, Elsevier B.V. [CrossRef]
  32. M. P. R. D. W. M. D. S. M. B. P. et al Constance D. Lehman. Diagnostic accuracy of digital screening mammography with and without computer-aided detection. JAMA Inter Med 2015, vol. 175(11), 1828–1837. [Google Scholar] [CrossRef]
  33. L. Balkenende, J. Teuwen, and R. M. Mann, “Application of Deep Learning in Breast Cancer Imaging,” Sep. 01, 2022, W.B. Saunders. [CrossRef]
  34. D. Albashish, R. Al-Sayyed, A. Abdullah, M. H. Ryalat, and N. Ahmad Almansour, “Deep CNN Model based on VGG16 for Breast Cancer Classification,” in 2021 International Conference on Information Technology, ICIT 2021 - Proceedings, Institute of Electrical and Electronics Engineers Inc., Jul. 2021, pp. 805–810. [CrossRef]
  35. Chugh, G.; Kumar, S.; Singh, N. Survey on Machine Learning and Deep Learning Applications in Breast Cancer Diagnosis. Cognit. Comput. 2021, vol. 13(no. 6), 1451–1470. [Google Scholar] [CrossRef]
  36. M. Farkhadov, A. Eliseev, and N. Petukhova, “Explained Artificial Intelligence Helps to Integrate Artificial and Human Intelligence into Medical Diagnostic Systems: Analytical Review of Publications,” in 14th IEEE International Conference on Application of Information and Communication Technologies, AICT 2020 - Proceedings, Institute of Electrical and Electronics Engineers Inc., Oct. 2020. [CrossRef]
  37. Xue Zhao, Jing-Wen Bai, Qiu Guo, Ken Ren, and Guo-Jun Zhang, “22-Clinical applications of deep learning in breast MRI,” BBA - Review on Cancer, 2023.
  38. Gubern-Mérida. Automated localization of breast cancer in DCE-MRI. Med. Image Anal. 2015, vol. 20(no. 1), 265–274. [Google Scholar] [CrossRef]
  39. Thakran, S.; Chatterjee, S.; Singhal, M.; Gupta, R. K.; Singh, A. Automatic outer and inner breast tissue segmentation using multi-parametric MRI images of breast tumor patients. PLoS One 2018, vol. 13(no. 1). [Google Scholar] [CrossRef] [PubMed]
  40. Jiao, H.; Jiang, X.; Pang, Z.; Lin, X.; Huang, Y.; Li, L. Deep Convolutional Neural Networks-Based Automatic Breast Segmentation and Mass Detection in DCE-MRI. Comput. Math. Methods Med. vol. 2020, 2020. [CrossRef] [PubMed]
  41. L. Hirsch et al., “Radiologist-level Performance by Using Deep Learning for Segmentation of Breast Cancers on MRI Scans,” Radiol. Artif. Intell., vol. 4, no. 1, Jan. 2022. [CrossRef]
  42. Akbar. Reinforcement tokenization and graph convolution for high-precision breast tumor segmentation in DCE-MRI. Biomed. Signal Process. Control 2025, vol. 100. [Google Scholar] [CrossRef]
  43. Khaled, R.; Vidal, J.; Vilanova, J. C.; Martí, R. A U-Net Ensemble for breast lesion segmentation in DCE MRI. Comput. Biol. Med. 2022, vol. 140. [Google Scholar] [CrossRef] [PubMed]
  44. Peng, C. IMIIN: An inter-modality information interaction network for 3D multi-modal breast tumor segmentation. Computerized Medical Imaging and Graphics 2022, vol. 95. [Google Scholar] [CrossRef]
  45. Zhu, J. Development and validation of a deep learning model for breast lesion segmentation and characterization in multiparametric MRI. Front. Oncol. 2022, vol. 12. [Google Scholar] [CrossRef]
  46. Y. Yang, H. Zhou, J. Wu, and M. Zhang, “Analysis of Breast MRI Images Using YOLOv8x Approach,” in 2024 9th International Conference on Image, Vision and Computing, ICIVC 2024, Institute of Electrical and Electronics Engineers Inc., 2024, pp. 410–415. [CrossRef]
  47. Akgül; Kaya, V.; Karavaş, E.; Aydin, S.; Baran, A. A novel artificial intelligence-based hybrid system to improve breast cancer detection using DCE-MRI. Bulletin of the Polish Academy of Sciences: Technical Sciences 2024, vol. 72(no. 3). [Google Scholar] [CrossRef]
  48. Ariyametkul; Paing, M. P. Analyzing explainability of YOLO-based breast cancer detection using heat map visualizations. Quant. Imaging Med. Surg. 2025, vol. 15(no. 7), 6252–6271. [Google Scholar] [CrossRef]
  49. Abd El-Hafeez, T.; Tarek, M.; Sayed, A. Optimizing YOLOv11 for automated classification of breast cancer in medical images. Sci. Rep. 2025, vol. 15(no. 1). [Google Scholar] [CrossRef]
  50. Meng, M.; Zhang, M.; Shen, D.; He, G.; Guo, Y. Detection and classification of breast lesions with You Only Look Once version 5. Future Oncology 2022, vol. 18(no. 39), 4361–4370. [Google Scholar] [CrossRef]
  51. Esteva et al., “Deep learning-enabled medical computer vision,” Dec. 01, 2021, Nature Research. 01 Dec. [CrossRef]
  52. Li, Z.; Dong, M.; Wen, S.; Hu, X.; Zhou, P.; Zeng, Z. CLU-CNNs: Object detection for medical images. Neurocomputing 2019, vol. 350, 53–59. [Google Scholar] [CrossRef]
  53. Diwan, T.; Anirudh, G.; Tembhurne, J. V. Object detection using YOLO: challenges, architectural successors, datasets and applications. Multimed. Tools Appl. 2023, vol. 82(no. 6), 9243–9275. [Google Scholar] [CrossRef]
  54. C. Chen et al., “YOLO-Based UAV Technology: A Review of the Research and Its Applications,” Mar. 01, 2023, Multidisciplinary Digital Publishing Institute (MDPI). [CrossRef]
  55. M. Hussain, “YOLO-v1 to YOLO-v8, the Rise of YOLO and Its Complementary Nature toward Digital Manufacturing and Industrial Defect Detection,” Jul. 01, 2023, Multidisciplinary Digital Publishing Institute (MDPI). [CrossRef]
  56. Soni and A. Rai, “YOLO for Medical Object Detection (2018–2024),” Institute of Electrical and Electronics Engineers (IEEE), Sep. 2024, pp. 1–7. [CrossRef]
  57. P. Jiang, D. Ergu, F. Liu, Y. Cai, and B. Ma, “A Review of Yolo Algorithm Developments,” in Procedia Computer Science, Elsevier B.V., 2021, pp. 1066–1073. [CrossRef]
  58. Ragab, M. G. A Comprehensive Systematic Review of YOLO for Medical Object Detection (2018 to 2023). IEEE Access 2024, vol. 12, 57815–57836. [Google Scholar] [CrossRef]
Figure 1. Flowchart summarizing search strategy and study selection.
Preprints 196154 g001
Figure 2. DL (CNN) stages for CAD system [35].
Preprints 196154 g002
Disclaimer/Publisher’s Note: The statements, opinions and data contained in all publications are solely those of the individual author(s) and contributor(s) and not of MDPI and/or the editor(s). MDPI and/or the editor(s) disclaim responsibility for any injury to people or property resulting from any ideas, methods, instructions or products referred to in the content.
Copyright: This open access article is published under a Creative Commons CC BY 4.0 license, which permit the free download, distribution, and reuse, provided that the author and preprint are cited in any reuse.
Prerpints.org logo

Preprints.org is a free preprint server supported by MDPI in Basel, Switzerland.

Subscribe

Disclaimer

Terms of Use

Privacy Policy

Privacy Settings

© 2026 MDPI (Basel, Switzerland) unless otherwise stated