
Submitted:
26 January 2026
Posted:
28 January 2026
You are already at the latest version
Abstract
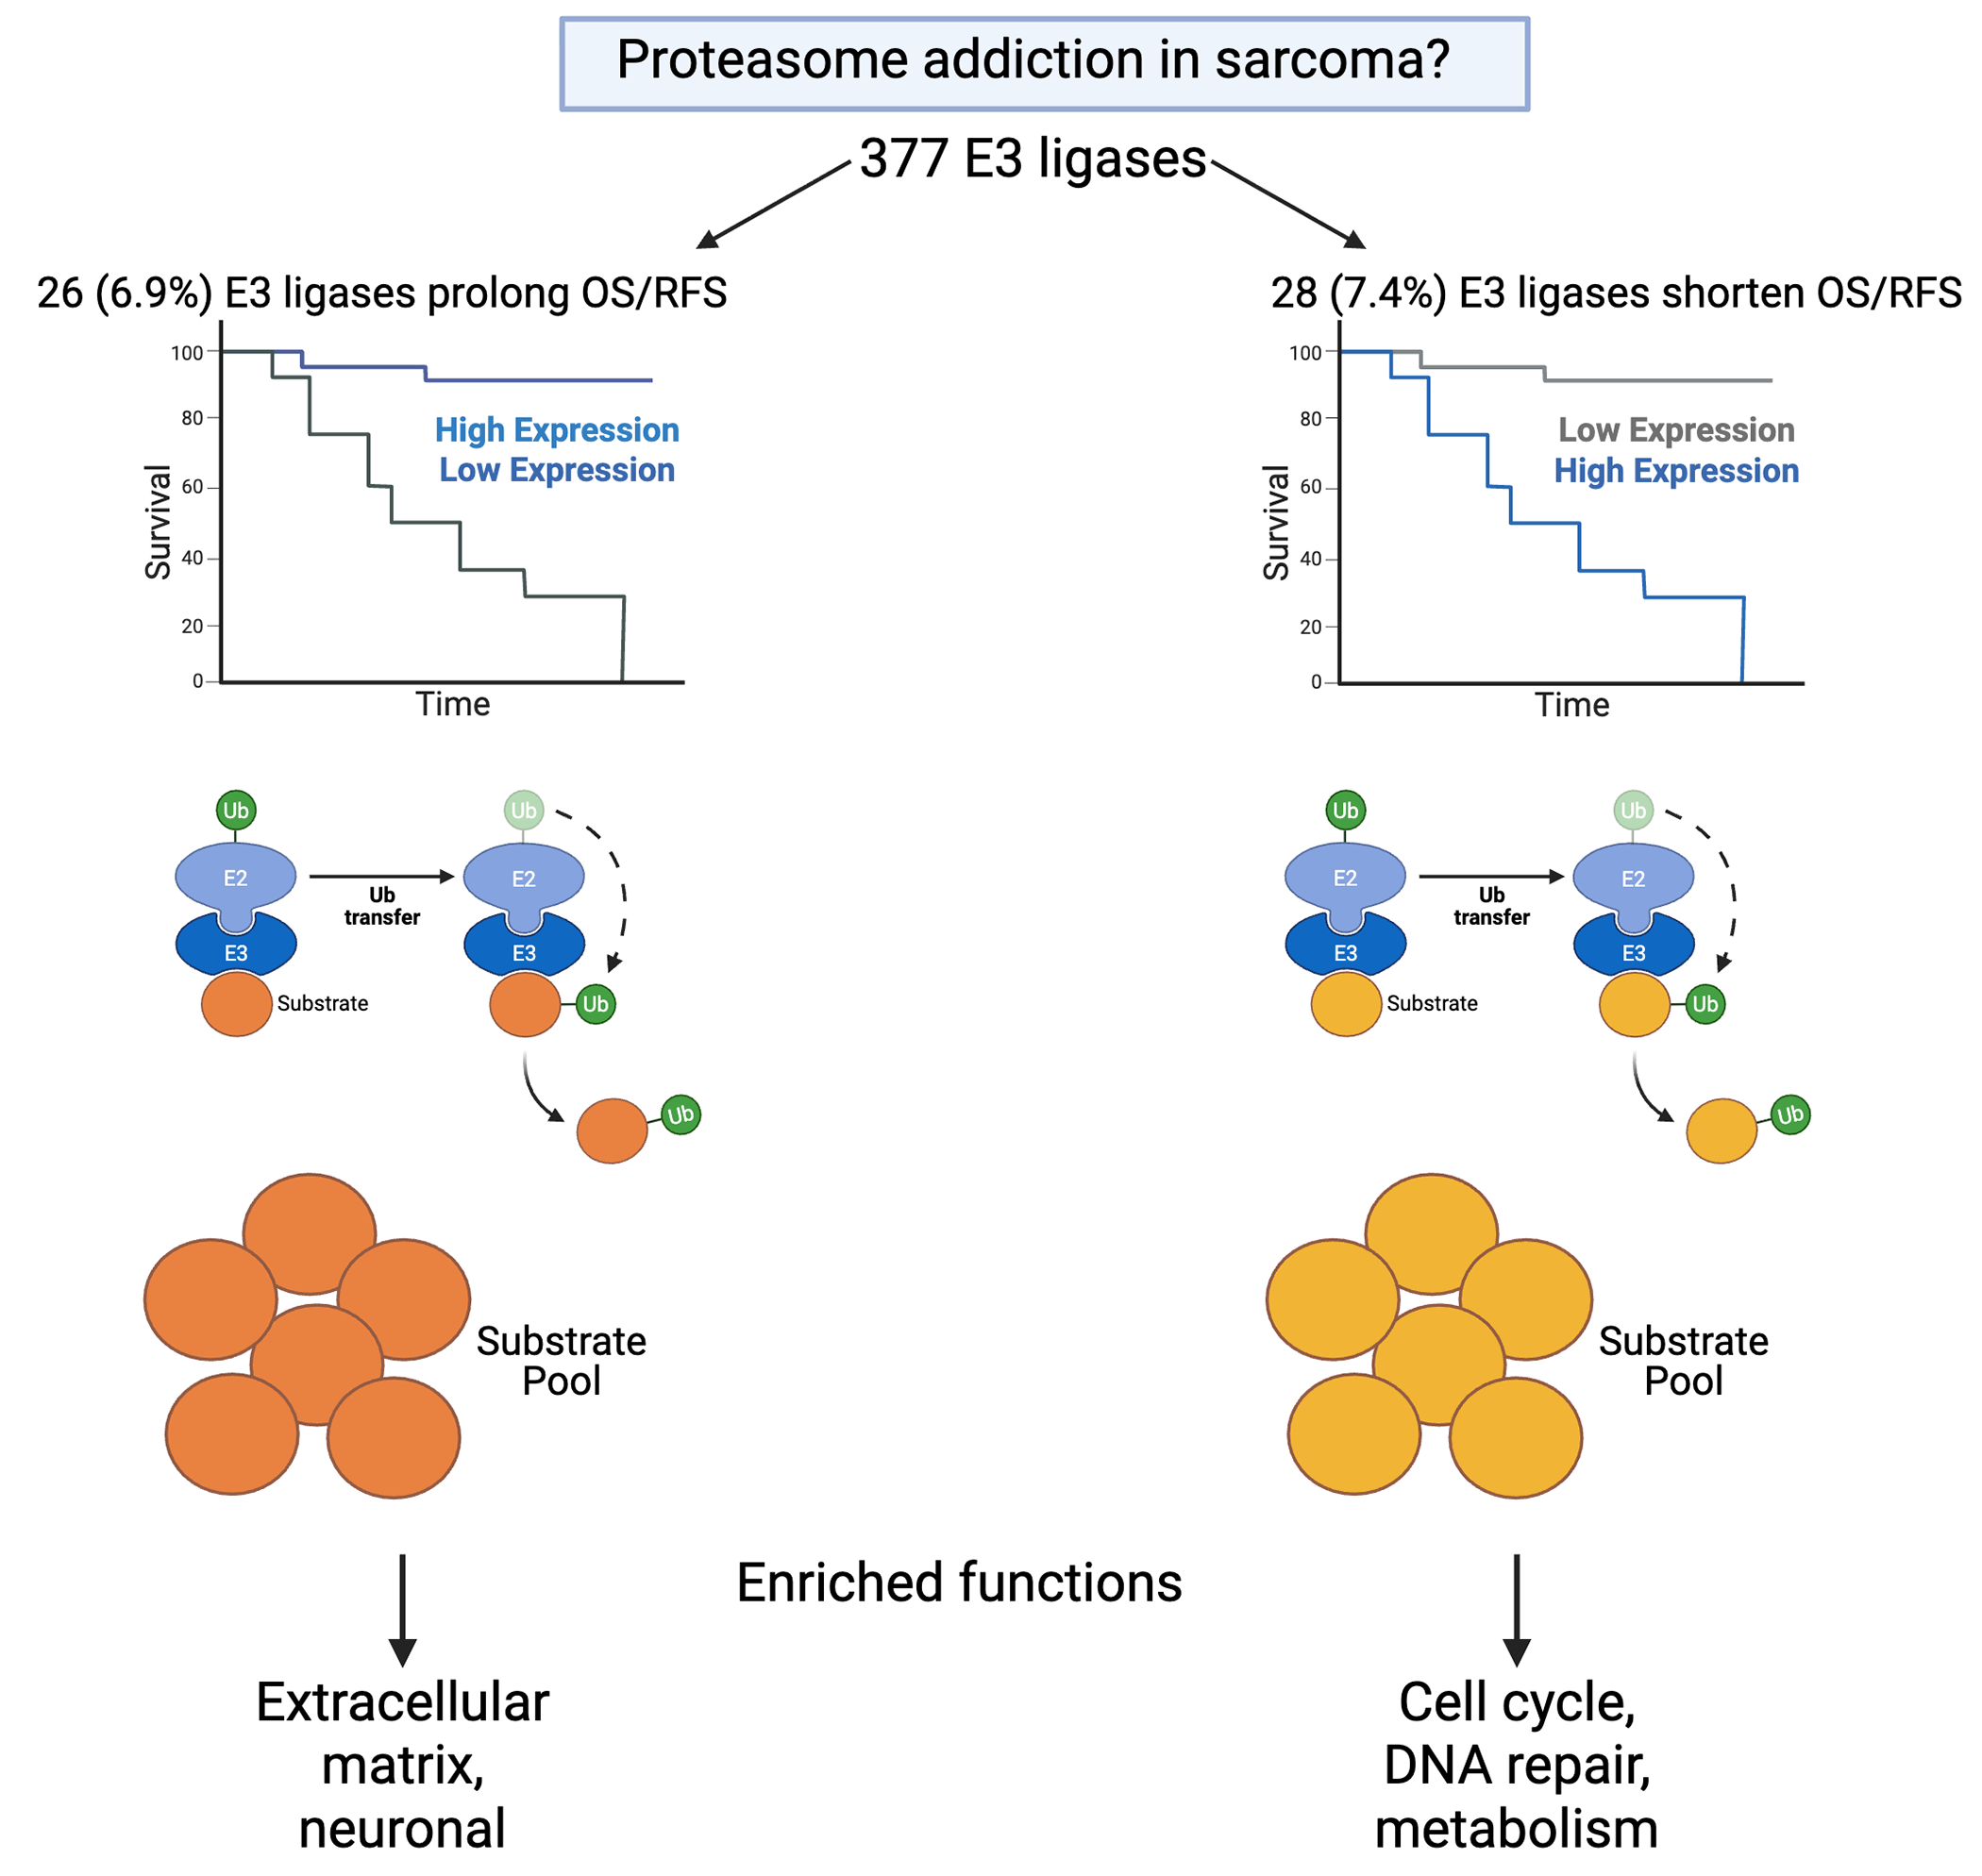
Background/Objectives Proteasome inhibitors are approved to treat multiple myeloma and mantle cell lymphoma, and their efficacy in various solid tumors is under investigation. Recent reports suggest proteasome addiction in Ewing, osteo- and some soft tissue sarcomas. Mechanistic explanations generally cite proteotoxic stress. We aimed to clarify mechanism and investigate potentially safer therapeutic avenues. Methods We performed Kaplan Meier analyses of the impacts of expression level of each of the 377 human E3 ubiquitin ligases on overall survival (OS) and recurrence free survival (RFS) of sarcoma patients, identified known and predicted substrates of those E3 ligases with the most significant and robust effects, and performed enrichment analyses of these substrates. Results High level expression of 102 E3 ligases is associated with shortened OS, suggesting that they mediate proteasome addiction. Thirteen of these shorten OS by >40 months. Nineteen of these 102 E3 ligases also show correlation between increased expression and reduced RFS. Overexpression of 73 E3 ligases significantly extended OS, with 18 of these extending OS by >40 months. Elevated expression of 21 of these E3 ligases significantly extends RFS. Enrichment analyses of known and putative substrates unique to the 13 E3 ligases whose elevated expression shortens OS by >40 months and the 18 E3 ligases whose elevated expression extends OS by >40 months revealed largely non-overlapping functions. Conclusions The E3 ligases whose elevated expression shorten OS uniquely targeted cell cycle, cell-cell communication, disease, cellular responses to stimuli, DNA repair, metabolism of proteins, chromatin organization, DNA replication, reproduction, developmental biology, and gene expression functions. The E3 ligases whose elevated expression extend OS uniquely targeted extracellular matrix organization and neuronal system functions. Functions uniquely targeted by each set of ligases could reveal therapeutic targets with greater therapeutic index than the proteasome.
Keywords:
E3 ubiquitin ligase
; vesicle mediated transport
; extracellular matrix organization
; gene expression
1. Introduction
Sarcomas are a broad group of over 70 types of neoplasm originating in mesenchymal tissues derived from embryonic mesoderm layer cells.[1,2] Approximately 80% of sarcomas originate in soft tissues including connective tissues, blood vessels, fat, and smooth and skeletal muscle. The remaining 20% arise in bone or cartilage.[3] Age of onset varies with sarcoma type, but cases are most prevalent in children, adolescents, and young adults under 30 years of age.[4,5] Roughly 15% of all cancers in children are sarcomas.[6] Roughly 17,000 new cases of sarcoma were diagnosed in the United States in 2023, with approximately 13,460 of these being soft tissue sarcomas.[7] Approximately 7,280 deaths occurred in the United States in 2023 due to all types of sarcomas.[8] First line treatment for sarcomas is typically surgery with or without chemotherapy and/or radiation therapy.[9] In gastrointestinal stromal tumors, imatinib (which inhibits c-KIT) is the first line treatment option.[9] On a case-by-case basis, for locally advanced or metastatic sarcomas, targeted therapeutics or immunotherapies may be administered as first line treatment.[10,11] Five-year survival rates for soft tissue sarcoma are 81% for localized, and 56% and 16%, respectively, for regional and distant metastatic. Definitive diagnosis is often slow due to the rarity of these cancers, subtle slowly progressive symptoms, and symptoms being similar to those of less serious conditions.[12] Delays in diagnosis result in low rates of treatment at localized stage, reflected in the 65% overall 5-year survival rate, making sarcomas among the deadliest of rare cancers and illustrating the need for effective new therapy options.
The proteasome inhibitor bortezomib received FDA approval for treatment of multiple myeloma in 2003 and for treatment of mantle cell lymphoma in 2006. Investigations, including clinical trials, are underway to characterize the efficacy of proteasome inhibition in non-small cell lung carcinoma, breast, prostate, and ovarian cancer, and various other solid tumor types. A recent Ewing sarcoma cell-based screen for small molecules that could inhibit proliferation revealed a class of benzyl-4-piperidone compounds that can selectively inhibit proliferation of multiple Ewing sarcoma cell lines. These compounds were shown to inhibit 19S proteasome function by inhibiting its integral deubiquitinating enzymes USP14 and UCHL5.[13] A genome-wide gene knockdown screen using shRNA also indicated specific proteasome dependence in Ewing sarcoma. Treatment of osteosarcoma cells with bortezomib inhibits cell proliferation and induces apoptosis via a mechanism involving upregulation of the osteoblastic differentiation factor Runx2.[14] Proteasome activator complex subunit 2 (PSME2) inhibits osteosarcoma cell proliferation, migration, and invasion, suggesting another mechanism of proteasome addiction.[15] Some evidence also exists for proteasome addiction in soft tissue sarcomas. The proteasome inhibitor MG132 dose dependently increases apoptosis and antagonizes proliferation in 3 uterine leiomyosarcoma cell lines and induces G2/M phase arrest in 2 of these cell lines,.[16] and high nuclear expression of proteasome activator complex subunit 1 (PSME1) is associated with poor survival in soft tissue leiomyosarcoma patients.[17]
To better understand mechanism(s) of proteasome addiction in soft tissue sarcomas, we investigated the impact of each of the 377 ubiquitin ligases in the list curated by the Epithelial Systems Biology Laboratory of the National Heart Lung and Blood Institute [18] on overall survival among a cohort of soft tissue sarcoma patients (259 samples from 206 patients) using data from the cancer genome atlas (TCGA). This cohort includes 80 leiomyosarcoma (53 soft tissue and 27 uterine), 50 dedifferentiated liposarcoma, 44 undifferentiated pleomorphic sarcoma, 17 myxofibrosarcoma, 10 synovial sarcoma, and 5 malignant peripheral nerve sheath tumor patients.[19] For those E3 ligases whose expression level correlated significantly with overall survival and altered survival by >40 months, we identified sets of known and predicted substrates using Ubibrowser 2.0[20] and performed enrichment analyses to learn what cellular functions are potentially modulated by proteasomal activity guided by relevant E3 ligases. These analyses were limited to E3 ligases with both significant correlation with survival impact and altered survival by >40 months to focus narrowly on E3 ligases with both significant and robust effects.
2. Materials and Methods
2.1. Kaplan-Meier Overall Survival Analysis
To identify E3 ubiquitin ligases that influence patient survival, we used Kaplan-Meier Plotter[21,22] to produce survival curves for sarcoma patients with high or low expression of each E3 human ubiquitin ligase on the list curated by the epithelial systems biology laboratory (ESBL) in the National Heart Lung and Blood Institute (See supplemental document 1).[18] Kaplan Meier Plotter curates patient data from GEO, EGA, and TCGA databases, including TCGA-housed data from a study of 259 soft tissue sarcoma samples[19]. Cutoffs were empirically determined by assessing all cutoffs between top and bottom quartiles and selecting that cutoff with the highest significance. Patient data includes mRNA-seq based gene expression data, relapse free survival, and overall survival. As a validation study, we performed independent Kaplan Meier analyses of the impact of each E3 ubiquitin ligase found to significantly increase or decrease OS or RFS by >40 months using overall and relapse-free survival data for the 206 patients studied in Abehouse et. al[19]. Median transcripts per million (TPM) values for each assessed E3 ligase were set as cutoff to split tumor samples into “High” and “Low” expressing groups. The R package “survminer”[23] was used to generate Kaplan Meier plots. P-values were generated using log-rank tests. Validated E3 ligases are indicated with asterisks in column 1 of tables 1-4 (* P≤0.05, ** P≤0.01, *** P≤0.001).
2.2. Violin Plot Analyses
To determine whether high and low E3 ligase expression was segregating sarcoma types, we performed violin plot analyses to visualize expression of each E3 ligase in each patient with patients grouped in columns by sarcoma type (DDLPS = dedifferentiated liposarcoma; MFS = myxofibrosarcoma; MPNST = Malignant Peripheral Neural Sheath Tumor; SS = Synovial Sarcoma; STLMS = Soft tissue Leiomyosarcoma; ULMS = Uterine Leiomyosarcoma; UPS = Undifferentiated Pleomorphic Sarcoma).
2.3. Identification of Known and Predicted E3 Ligase Substrates
We employed UbiBrowser 2.0[20] to identify known and putative substrates of each E3 ubiquitin ligase whose up or downregulation was found to correlate significantly with an increased overall survival of greater than 40 months. We then manually filtered out duplicates and substrates found in both datasets.
2.4. Pathway Enrichment Analyses
Two sets of proteins were generated using UbiBrowser 2.0 that represent potential substrates uniquely associated with E3 ubiquitin ligases for which upregulated expression correlates with increased overall patient survival, and E3 ubiquitin ligases for which upregulated expression correlates with decreased overall patient survival. Each set of proteins was manually filtered to remove shared genes and subjected to enrichment analysis using Reactome.[25,26] Reactome curates 15,886 reactions that function within 2803 human pathways. The pathways are hierarchically organized under 29 broad pathway categories. These categories are autophagy, cell cycle, cell-cell communication, cellular responses to stimuli, chromatin organization, circadian clock, developmental biology, digestion and absorption, disease, DNA repair, DNA replication, drug ADME, extracellular matrix organization, gene expression, hemostasis, immune system, metabolism, metabolism of proteins, metabolism of RNA, muscle contraction, neuronal system, organelle biosynthesis and maintenance, programmed cell death, protein localization, reproduction, sensory perception, signal transduction, transport of small molecules, and vesicle mediated transport.
2.5. Statistical Analyses
Kaplan-Meier plotter uses a PostgreSQL server to integrate gene expression and clinical data. For any given gene of interest, the relevant set of patient records is split into high and low expression groups. A Kaplan-Meier survival plot is then created and a hazard ratio using 95% confidence intervals and logrank P value are calculated. In enrichment analyses using Reactome, p-values associated with enriched functions are calculated using Fisher’s exact test.
3. Results
3.1. Impacts of E3 Ubiquitin Ligases on Patient Overall Survival
We identified subsets of ubiquitin ligases for which high level expression was significantly associated with extended and shortened overall survival (OS). Representative Kaplan Meier plots for TTC3 and VPS18 (the ubiquitin ligases with the largest negative and positive respective impacts on OS) are presented in Figure 1 A and B. Among the 377 human E3 ubiquitin ligases analyzed, 102 (27%) ligases revealed significant association between high expression and reduced OS, with p values ranging from 0.05 to 5.2 X 10⁻⁸, and impacts on survival ranging from 6.2 to 50.6 months (median 31.6 ± 9.2). Thirteen of these (see Table 1) shorten OS by >40 months. Eight of these 13 were validated as still significant when using median TPM as cutoff. Violin plot analysis of these 13 E3 ligases indicates that in most cases, each sarcoma histology type would contribute patients to both high and low expression groups (Figure 2). Two exceptions are 1) relatively high CCNB1IP1 expression in all synovial sarcoma patients, and 2) relatively low PCGF3 expression in all myxofibrosarcoma patients. Violin plotting also reveals very low expression of TRIM71 and MARCHF10 in all patients, with median TPM below 2 in both cases. Another 73 (19.4%) revealed significant association between high expression and extended OS, with p values ranging from 0.049 to 9.4 X 10⁻⁶, and impacts on survival ranging from 3.1 to 50.8 months (median 32.4 ± 9.1). Eighteen of these (see Table 2) extend OS by >40 months. Only two of these (RMND5B and TRIM21) were validated as still significant when using median TPM as cutoff. Violin plot analysis of these 18 E3 ligases indicates that in most cases, each sarcoma histology type would contribute patients to both high and low expression groups (Figure 3). Eight of these 18 E3 ligases display uniformly low expression in synovial sarcoma, and SYVN1 displays uniformly high expression in MPNST.
3.2. Impacts of E3 Ubiquitin Ligases on Patient Recurrence Free Survival
In total, 102 E3 ligases displayed a positive correlation between elevated expression and diminished OS, and 73 E3 ligases displayed a positive correlation between elevated expression and enhanced OS. We assessed each of these E3 ligases for the impact of its expression level on recurrence free survival (RFS). Among the E3 ligases whose elevated expression correlates with diminished OS, 15 (15%) also significantly correlate with diminished RFS (see Table 3). Among these, nine reduce median RFS by 56-75 months, and 6 reduce median survival by 3-10 months. Three of the nine E3 ligases with large survival impacts (RNF26, TRAF4, and UHRF1) were validated as still significant when using median TPM as cutoff. Violin plots indicate that in most cases, each sarcoma histology type would contribute patients to both high and low expression groups (Figure 4). RAD18 is uniformly low in synovial sarcoma, and MEX3C and MKRN2 are uniformly high in MPNST. Among the E3 ligases whose elevated expression correlates with enhanced OS, 12 (16%) also significantly correlate with enhanced RFS (see Table 4). Among these, 11 extend median RFS by 48.8-72.1 months (TRIM8 extends RFS by 1.9 months). Only one of the eleven E3 ligases with large survival impacts (RMND5B) was validated as still significant when using median TPM as cutoff. Violin plots indicate that in most cases, each sarcoma histology type would contribute patients to both high and low expression groups (Figure 5). RNF130 expression is skewed high in MPNST, and TRIM8 expression is skewed low in synovial sarcoma. Representative Kaplan Meier plots for MNAT1 and TRIM10 (the ubiquitin ligases with the largest negative and positive respective impacts on RFS) are presented in Figure 1 C and D.
3.3. Putative Substrate Pools of E3 Ligases That Significantly Impact Overall Survival
For each of the 13 E3 ligases whose expression is significantly associated with shortened OS and that truncate survival by >40 months, known and predicted substrates were identified using Ubibrowser 2.0. Duplicate proteins were eliminated, resulting in a pool of 1636 plausible substrates (82 known and 1554 predicted). For each of the 18 E3 ligases whose elevated expression is significantly associated with extended OS and that extend survival by >40 months, known and predicted substrates were identified using Ubibrowser 2.0. Duplicate proteins were eliminated, resulting in a pool of 4339 plausible substrates (118 known and 4221 predicted). To see functions uniquely enriched in each pool of substrates, we filtered each pool to remove substrates present in common, resulting in a pool of 393 substrates unique to those E3 ligases whose elevated expression is associated with shortened OS, and 3238 substrates unique to the E3 ligases whose elevated expression is associated with extended OS (supplemental tables 1 and 2). Removal of substrates of TRIM71 and MARCHF10 due to their very low expression in all patients reduces the pool of substrates unique to those E3 ligases whose elevated expression is associated with shortened OS from 393 to 275.
3.4. Enriched Functions Associated with E3 Ligases Whose Elevated Expression Is Associated with Diminished OS
Elevated expression of the E3 ubiquitin ligases PCGF3, CCNB1IP1, MSL2, RNF2, MARCHF5, ZBTB12, MEX3D TRIM71, UBE4B, RNF8, MEX3A, MARCHF10, and TTC3 (see Table 1) is associated with significantly (p = 0.029 to 5.2 X 10⁻⁸; HR = 1.64-2.78) shortened OS (40.1 to 50.6 months), suggesting that these E3 ligases make a proportionately large contribution to proteasome addiction in Ewing Sarcoma. UbiBrowser 2.0 identified or predicted a pool of 393 substrates of these E3 ligases that are not substrates of the 18 E3 ligases whose elevated expression is associated with increased OS. Excluding functions related to infectious disease, 118 enriched functions had p values ≤1 X 10⁻⁸. Among the 118 enriched functions with p values ≤1 X 10⁻⁸, the most highly represented pathway category at the top of the Reactome hierarchy is gene expression (31 enriched functions), followed by immune system (20 enriched functions), DNA repair (16 enriched functions), signal transduction (11 enriched functions), developmental biology (6 enriched functions), chromatin organization (5 enriched functions), cellular responses to stimuli, disease, DNA replication, and metabolism of proteins (4 enriched functions each), and reproduction and vesicle mediated transport (1 enriched function each). This data is represented in pie chart form in Figure 6A. The 25 most significant results of enrichment analysis using Reactome (from all hierarchical levels) are presented in Table 5. Enrichment analysis of the 275 putative E3 ligase substrates excluding those of TRIM71 and MARCHF10 yielded the same top 13 enriched functions in the same order. Another 10 of the top 25 enriched functions in the 393-substrate set remain present with slightly altered rankings in the 275-substrate set. The two functions unique to the 393-substrate set are “Activation of anterior HOX genes in hindbrain development during early embryogenesis” (#14), and “Activation of HOX genes during differentiation” (#15). The two functions unique to the 275-substrate set are “Chromatin modifying enzymes” (#14) and “Chromatin organization” (#22).
Enriched gene sets associated with E3 ligases whose elevated expression is associated with increased OS
Elevated expression of the E3 ubiquitin ligases RNF144B, DTX3L, RNF25, SYVN1, MARCHF1, MARCHF8, MARCHF2, ZNRF2, BIRC3, RNF135, PCGF5, TMEM129, RMND5B, TRIM69, TRIM22, HERC6, TRIM21, and VPS18 (see Table 2) is associated with significantly (p = 0.03 to 9.4 X 10⁻⁶; HR = 0.65-0.43) lengthened OS (40.1 to 50.9 months), suggesting that these E3 ligases target substrates that support tumor progression. UbiBrowser 2.0 identified or predicted a pool of 3238 substrates of these E3 ligases that are not substrates of the 13 E3 ligases whose elevated expression is associated with diminished OS. Because this pool of substrates is 6.9 times larger than that of the E3 ligases associated with diminished OS, enriched functions don’t reach the same levels of significance. Only 3 enriched functions have p values ≤1 X 10⁻⁸. The 20 most significantly enriched functions identified using Reactome are presented in Table 6, and false discovery rate (FDR) values are also presented to aid in assessment of their potential pathophysiological impact. The most highly represented pathway category at the top of the Reactome hierarchy is vesicle mediated transport (8 uniquely enriched functions), followed by extracellular matrix organization (6 enriched functions), and neuronal system (2 functions). This data is represented in pie chart form in Figure 6B.
4. Discussion
4.1. Substrates of E3 Ligases Whose Upregulation Shortens OS Are Enriched in Tumor Suppressor Functions.
Among the 80 most significantly enriched functions associated with substrates of the E3 ligases whose elevated expression diminished OS, suggesting that they play key roles in proteasome addiction, 30 fall under overarching categories (chromatin organization, cell cycle, DNA repair and DNA replication) known to harbor tumor suppressors. Twenty-five functions fall under gene expression. These include 10 functions related to rRNA transcription by RNA polymerase I. Functional ribosomes are crucial for rapid growth and cell proliferation in Ewing and osteosarcomas. RNA polymerase I is considered a potential therapeutic target in some sarcomas, with the RNA pol 1 inhibitor CX-5461 inducing an antiproliferative effect in SK-UT-1 leiomyosarcoma cells via G2 cell cycle arrest [27]. Five functions relate to epigenetic regulation of gene expression by mechanisms including DNA and histone methylation and MLL3 and MLL4 complex activity. Loss of function alterations in epigenetic modulators are common in mesenchymal cancers and have been found in sarcomas including synovial, epithelioid, and Ewing [28]. The methyltransferases MLL3 and MLL4 are known to play protective roles against sarcomas by maintaining methylation patterns in the promoter regions of various potential oncogenes [29,30]. Another two gene expression functions involve RUNX1, which can act as an oncogene or tumor suppressor depending on context. In the blood, it plays a role in proper differentiation of stem cells, and its loss or participation in a fusion protein is seen in various blood and gastrointestinal cancers [31,32,33]. Six functions fall under developmental biology. These functions can be grouped by their correlation with maternal to zygotic transition (MZT) or HOX gene activation. Proteins involved in MZT include epigenetic regulators involved in establishing totipotency in zygotes that can later function as tumor suppressors [34,35]. HOX genes can act as tumor suppressors in context specific cancers. For instance, HOXA5 has been shown to function as a tumor suppressor in osteosarcoma [36]. Finally, four functions fall under cellular responses to stimuli, all of which relate to cellular senescence. Senescence in cancer cells can halt tumor progression [37] although the senescence associated secretory phenotype can create a microenvironment that can foster cancer growth and progression [38]. Only 10-20% of soft tissue sarcoma patients exhibit an objective response. The presence of MARCHF5 among the E3 ligases whose upregulation shortens OS may be contributory to this limitation. MARCHF5 substrates identified by UbiBrowser 2.0 include 100 human leucocyte antigens and 18 immunoglobulins, and enrichment analysis of these substrates alone yields “immunoregulatory interactions between a lymphoid and non-lymphoid cell”, “adaptive immune system”, “immune system”, “cytokine signaling in immune system”, “interferon gamma signaling” and “interferon signaling” as the top 6 most significantly enriched functions. A recent report by Wang and Zou describe attenuation of antigen presentation via PD-L1 upregulating MARCHF5-mediated lysosomal degradation of IL2Rγc [39]. IL2 sensitivity is thus attenuated by reduced receptor levels. These observations provide a mechanism explaining the known synergistic efficacy of coadministration of PD-1/PD-L1 blockade with IL2.
4.2. Substrates of E3 Ligases Whose Upregulation Extends OS Are Enriched in Oncogenic Functions.
Because this pool of E3 ligase substrates is 6.9-fold larger (3171 vs 459) than that of the substrates associated with decreased OS, the significance of enriched functions is correspondingly reduced and only the most significantly enriched 20 functions are listed in Table 6. These functions fall under five overarching categories, two of which (immune system and signal transduction are also enriched among the substrates of E3 ligases associated with decreased OS. The remaining three are neuronal system, extracellular matrix (ECM) organization, and vesicle mediated transport. The two functions under neuronal system both relate to AMPA receptors. While AMPA receptor function has not to date been associated with sarcomas, it is associated with glutamate signaling dependent tumor growth, invasion, and migration in other cancers, notably including glioma, and lung, breast, and prostate carcinomas [40,41,42]. The functions under ECM organization include integrin and non-integrin ECM cell membrane interactions (including laminin interactions). Some sarcomas rely on integrins and discoidin domain receptors to sense mechanical changes in the surrounding ECM to drive proliferation, invasion, metastasis, and resistance to therapeutics [43,44]. ECM organization functions also include ECM organization and degradation, with degradation being an essential process for invasion and metastasis in solid tumors in general. In this light, matrix metalloprotein 14 (MMP14) has been shown to be highly expressed in most sarcomas and to promote invasion and metastasis [45]. Enriched functions under vesicle mediated transport include functions related to anterograde and retrograde protein transport and cargo concentration in the ER. Anterograde transport could be important for secretion of MMPs and transport of important membrane proteins, and retrograde transport is often hijacked by cancers to alter localization of proteins such as sortilin and glucose transporters, impacting cell metabolism and tumor growth [46].
4.3. Adverse Events Associated with Proteasome Inhibitor Therapy
Real world data associates proteasome inhibitor therapy with cardiovascular adverse events including heart failure, hypertension, arrhythmias, and ischemic heart disease including acute coronary syndrome and angina. It can also negatively impact blood cell counts and cause gastrointestinal symptoms including nausea, vomiting, diarrhea, and constipation.[47] Rates of serious adverse events can be substantial and vary with proteasome inhibitor. For instance, respective cardiovascular adverse event frequencies associated with carfilzomib, bortezomib, and ixazomib are 7-27%, 0.6-4.1%, and 1.3%.[48] A growing body of evidence indicates that a functional circadian clock exerts potent tumor suppressive activity, impacting immune functions, metabolism, cell cycle control, and DNA repair.[48] While proteasome function is not specific to the circadian clock, it is essential for circadian clock function. The proteasome degrades core clock proteins including period and cryptochrome proteins at specific times within the circadian period, allowing the clock to reset. Thus the proteasome is essential for persistence of the circadian clock over multiple cycles, and impacts the length of a circadian period. It is thus possible that proteasome inhibitor therapy could exert oncogenic effects that counterbalance its therapeutic effects in cancer patients.
5. Conclusions
The known and potential adverse events associated with proteasome inhibition suggest that a better understanding of proteasome addiction through upstream analysis of key ubiquitin ligases and their target proteins and processes could be of value in identifying novel targets with similar efficacy but fewer or milder side effects. Our results indicate that only 3.4% (13/377) of the human repertoire of E3 ubiquitin ligases, and 4.9% (393/8047) of known and predicted substrates of the 31 E3 ubiquitin ligases that significantly increase or decrease OS by >40 months impactfully contribute to proteasome addiction mechanisms. Among the 118 most significantly enriched functions among the substrates of the 13 proteasome addiction-associated E3 ligases, 57% are considered tumor suppressive, and 90% of the 20 most significantly enriched functions among substrates of the 18 E3 ligases whose elevated expression extends OS are considered cancer promoting, supporting the conclusion that proteasome addiction mechanisms are more fine-tuned and specific than proteotoxic stress.
Supplementary Materials
Results of all Kaplan Meier analyses, and complete lists of identified E3 ligase substrates are provided in supplemental document 1 (Excel spreadsheet).
Author Contributions
ZB collected and analyzed data, prepared tables and figures, and drafted the manuscript. HB performed violin plot and validation analyses and contributed to writing and editing the manuscript. PL provided clinical and literature expertise, contributed to figures, tables, and final draft of the manuscript. GSC conceived the question, designed study methods, and edited the manuscript. This manuscript has been read and approved by all authors. The requirements for authorship stated above have been met, and each author believes that the manuscript represents honest work.
Funding
No grant funding was utilized in the performance of these studies.
Institutional review board statement
Ethical review and approval were not required for this study because the clinical data used is already anonymized and publicly available.
Informed consent statement
All clinical data is anonymized and publicly available. It was accessed either directly from the cancer genome atlas (TCGA) or indirectly through Kaplan Meier plotter. The Cancer Genome Atlas (TCGA) ensures that all tissue samples are collected with informed consent, approval from Institutional Review Boards (IRBs), and adherence to policies protecting human subjects.
Data availability statement
Any data not provided in the manuscript and supplementary material will be made available upon request.
Acknowledgments
The authors thank Shahnoza Saburhojayeva and Julia Southwell for critical reading of the manuscript.
Conflicts of interest
The authors declare no conflicts of interest.
References
- Damerell, V.; Pepper, M.S.; Prince, S. Molecular mechanisms underpinning sarcomas and implications for current and future therapy. Sig Transduct Target Ther 2021, 6, 246. [Google Scholar] [CrossRef]
- Mohseny, AB; Hogendoorn, PC. Concise review: mesenchymal tumors: when stem cells go mad. Stem Cells 2011, 29(3), 397–403. [Google Scholar] [CrossRef] [PubMed]
- Bleloch, JS; Ballim, RD; Kimani, S; Parkes, J; Panieri, E; Willmer, T; Prince, S. Managing sarcoma: where have we come from and where are we going? Ther Adv Med Oncol 2017, 9(10), 637–659. [Google Scholar] [CrossRef] [PubMed] [PubMed Central]
- Ferrari, A; Sultan, I; Huang, TT; Rodriguez-Galindo, C; Shehadeh, A; Meazza, C; Ness, KK; Casanova, M; Spunt, SL. Soft tissue sarcoma across the age spectrum: a population-based study from the Surveillance Epidemiology and End Results database. Pediatr Blood Cancer 2011, 57(6), 943–9. [Google Scholar] [CrossRef] [PubMed] [PubMed Central]
- Lee Kwan Min, Victor et al. Clinical Management of Bone and Soft Tissue Tumors. 1st ed. 2025. Singapore: Springer Nature Singapore, 2025. Web. Accessed 8/27/2025.
- National Foundation for Cancer Research. About sarcoma. https://www.nfcr.org/cancer-types/cancer-types- sarcoma/. Accessed November 2025.
- What makes immunotherapy for sarcoma a promising treatment? Reviewed by Corrie Painter. Cancer Research Institute. Available online: https://www.cancerresearch.org/immunotherapy-by-cancer-type/sarcoma (accessed on November 2025).
- 2023 Sarcoma Statistics. Sarcoma Foundation of America. Available online: https://curesarcoma.org/sarcoma-education/2023-sarcoma-statistics/ (accessed on November 2025).
- Gounder, MM. Soft tissue sarcoma treatment protocols. Medscape. 2022. Available online: https://emedicine.medscape.com/article/2007168-overview (accessed on November 2025).
- Li, T; Dong, Y; Wei, Y; Wang, S; Liu, Y; Chen, J; Xiong, W; Lin, N; Huang, X; Liu, M; Yan, X; Ye, Z; Li, B. First-Line Anlotinib Treatment for Soft-Tissue Sarcoma in Chemotherapy-Ineligible Patients: An Open-Label, Single-Arm, Phase 2 Clinical Trial. Clin Cancer Res. 2024, 30(19), 4310–4317. [Google Scholar] [CrossRef] [PubMed] [PubMed Central]
- Le, X; Ferrarotto, R; Wise-Draper, T; Gillison, M. Evolving Role of Immunotherapy in Recurrent Metastatic Head and Neck Cancer. J Natl Compr Canc Netw. 2020, 18(7), 899–906. [Google Scholar] [CrossRef] [PubMed]
- American Cancer Society. Survival rates for soft tissue sarcoma. Available online: https://www.cancer.org/cancer/types/soft-tissue-sarcoma/detection-diagnosis-staging/survival-rates.html#:~:text=For%20example%2C%20if%20the%205%2Dyear%20relative%20survival,means%20that%20people%20who%20have%20that%20cancer (accessed on November 2025).
- Shukla, N; Somwar, R; Smith, RS; Ambati, S; Munoz, S; Merchant, M.; et al. Proteasome addiction defined in Ewing sarcoma is effectively targeted by a novel class of 19S proteasome inhibitors. Cancer Res. 2016, 76(15), 4525–4534. [Google Scholar] [CrossRef] [PubMed]
- Shapovalov, Y; Benavidez, D; Zuch, D; Eliseev, RA. Proteasome inhibition with bortezomib suppresses growth and induces apoptosis in osteosarcoma. Int J Cancer 2010, 127(1), 67–76. [Google Scholar] [CrossRef] [PubMed]
- Li, R; Yan, L; Jiu, J; Liu, H; Li, D; Li, X; Zhang, J; Li, S; Fan, Z; Lv, Z; Zhu, Y; Wang, B. PSME2 offers value as a biomarker of M1 macrophage infiltration in pan-cancer and inhibits osteosarcoma malignant phenotypes. Int J Biol Sci. 2024, 20(4), 1452–1470. [Google Scholar] [CrossRef] [PubMed] [PubMed Central]
- Joung, H; Seo, S; Liu, H. MG132 induces cell type-specific anticancer effects in uterine leiomyosarcoma cell lines. Mol Med Rep. 2025, 31(6), 159. [Google Scholar] [CrossRef] [PubMed] [PubMed Central]
- Lou, S; Cleven, AH; Balluff, B; de Graaff, M; Kostine, M; Briaire-de Bruijn, I; McDonnell, LA; Bovée, JV. High nuclear expression of proteasome activator complex subunit 1 predicts poor survival in soft tissue leiomyosarcomas. Clin Sarcoma Res 2016, 6, 17. [Google Scholar] [CrossRef] [PubMed] [PubMed Central]
- National heart lung and blood institute. Epithelial systems biology laboratory (ESBL). Medvar B, PisitkunT, Sarkar A, Knepper MA. Human E3 ubiquitin ligases. Accessed at https://esbl.nhlbi.nih.gov/Databases/KSBP2/Targets/Lists/E3-ligases/ on May 22, 2025.
- Cancer Genome Atlas Research Network. Electronic address: elizabeth.demicco@sinaihealthsystem.ca; Cancer Genome Atlas Research Network. Comprehensive and Integrated Genomic Characterization of Adult Soft Tissue Sarcomas. Cell. 2017, 171(4), 950–965.e28. [Google Scholar] [CrossRef] [PubMed] [PubMed Central]
- Wang, X; Li, Y; He, M; Kong, X; Jiang, P; Liu, X; et al. UbiBrowser 2.0: a comprehensive resource for proteome-wide ubiquitin ligase/deubiquitinase-substrate interactions in eukaryotic species. Nucleic Acids Research. 2022, 50, D719–D728. [Google Scholar] [CrossRef]
- Győrffy, B. Survival analysis across the entire transcriptome identifies biomarkers with the highest prognostic power in breast cancer. Comput Struct Biotechnol J 2021, 19, 4101–4109. [Google Scholar] [CrossRef]
- Győrffy B: Integrated Analysis of Public Datasets for the Discovery and Validation of Survival-Associated Genes in Solid Tumors. The Innovation 2024. [CrossRef]
- Kassambara, A; Kosinski, M; Biecek, P. survminer: Drawing Survival Curves using ‘ggplot2’. R package version 0.5.1. 2025. Available online: https://rpkgs.datanovia.com/survminer/index.html.
- Wickham, H. ggplot2: Elegant Graphics for Data Analysis; Springer-Verlag New York, 2016. [Google Scholar]
- Milacic, M; Beavers, D; Conley, P; Gong, C; Gillespie, M; Griss, J; et al. The Reactome Pathway Knowledgebase 2024. Nucleic Acids Res. 2024, 52(D1), D672–D678. [Google Scholar] [CrossRef]
- Wu, G; Haw, R. Functional Interaction Network Construction and Analysis for Disease Discovery. Methods Mol Biol. 2017, 1558, 235–253. [Google Scholar] [PubMed]
- Kang, CW; Hannan, KM; Blackburn, AC; Loh, AHP; Hong, KC; Yuan, GJ; Hein, N; Drygin, D; Hannan, RD; Coupland, LA. The therapeutic potential of RNA Polymerase I transcription inhibitor, CX-5461, in uterine leiomyosarcoma. Invest New Drugs 2022, 40(3), 529–536. [Google Scholar] [CrossRef] [PubMed] [PubMed Central]
- Nacev, BA; Jones, KB; Intlekofer, AM; Yu, JSE; Allis, CD; Tap, WD; Ladanyi, M; Nielsen, TO. The epigenomics of sarcoma. Nat Rev Cancer 2020, 20(10), 608–623. [Google Scholar] [CrossRef] [PubMed] [PubMed Central]
- Chiappetta, C; Carletti, R; Della Rocca, C; Di Cristofano, C. KMT2C modulates migration and invasion processes in osteosarcoma cell lines. Pathol Res Pract. 2019, 215(10), 152534. [Google Scholar] [CrossRef] [PubMed]
- O’Meara, E; Stack, D; Phelan, S; McDonagh, N; Kelly, L; Sciot, R; Debiec-Rychter, M; Morris, T; Cochrane, D; Sorensen, P; O’Sullivan, MJ. Identification of an MLL4-GPS2 fusion as an oncogenic driver of undifferentiated spindle cell sarcoma in a child. Genes Chromosomes Cancer 2014, 53(12), 991–8. [Google Scholar] [CrossRef] [PubMed]
- Hong, D; Fritz, AJ; Gordon, JA; Tye, CE; Boyd, JR; Tracy, KM; Frietze, SE; Carr, FE; Nickerson, JA; Van Wijnen, AJ; Imbalzano, AN; Zaidi, SK; Lian, JB; Stein, JL; Stein, GS. RUNX1-dependent mechanisms in biological control and dysregulation in cancer. J Cell Physiol. 2019, 234(6), 8597–8609. [Google Scholar] [CrossRef] [PubMed] [PubMed Central]
- Fijneman, RJ; Anderson, RA; Richards, E; Liu, J; Tijssen, M; Meijer, GA; Anderson, J; Rod, A; O’Sullivan, MG; Scott, PM; Cormier, RT. Runx1 is a tumor suppressor gene in the mouse gastrointestinal tract. Cancer Sci. 2012, 103(3), 593–9. [Google Scholar] [CrossRef] [PubMed] [PubMed Central]
- Kulkarni, M; Tan, TZ; Syed Sulaiman, NB; Lamar, JM; Bansal, P; Cui, J; Qiao, Y; Ito, Y. RUNX1 and RUNX3 protect against YAP-mediated EMT, stem-ness and shorter survival outcomes in breast cancer. Oncotarget 2018, 9(18), 14175–14192. [Google Scholar] [CrossRef] [PubMed] [PubMed Central]
- Wu, YK; Fan, HY. Revisiting ZAR proteins: the understudied regulator of female fertility and beyond. Cell Mol Life Sci. 2022, 79(2), 92. [Google Scholar] [CrossRef] [PubMed] [PubMed Central]
- Zhang, N; Jiang, T; Wang, Y; Wang, S; Hu, L; Bu, Y. BTG4 is A Novel p53 Target Gene That Inhibits Cell Growth and Induces Apoptosis. Genes (Basel) 2020, 11(2), 217. [Google Scholar] [CrossRef] [PubMed] [PubMed Central]
- Fan, F; Mo, H; Zhang, H; Dai, Z; Wang, Z; Qu, C; Liu, F; Zhang, L; Luo, P; Zhang, J; Liu, Z; Cheng, Q; Ding, F. HOXA5: A crucial transcriptional factor in cancer and a potential therapeutic target. Biomed Pharmacother 2022, 155, 113800. [Google Scholar] [CrossRef] [PubMed]
- Ohtani, N; Mann, DJ; Hara, E. Cellular senescence: its role in tumor suppression and aging. Cancer Sci 2009, 100(5), 792–7. [Google Scholar] [CrossRef] [PubMed] [PubMed Central]
- ang J, Liu M, Hong D, Zeng M, Zhang X. The Paradoxical Role of Cellular Senescence in Cancer. Front Cell Dev Biol. 2021 Aug 12;9:722205. doi: 10.3389/fcell.2021.722205. Erratum in: Front Cell Dev Biol. 2021 Sep 23;9:759761. [CrossRef] [PubMed] [PubMed Central]
- Wang, X.; Zou, W. Caught in the middle: MARCH5 mediates PD-1-induced IL-2R degradation. Cell Res 2024, 34, 3–4. [Google Scholar] [CrossRef] [PubMed]
- Piao, Y; Lu, L; de Groot, J. AMPA receptors promote perivascular glioma invasion via beta1 integrin-dependent adhesion to the extracellular matrix. Neuro Oncol 2009, 11(3), 260–73. [Google Scholar] [CrossRef] [PubMed] [PubMed Central]
- Zhang, W; Li, Z; Zhang, Y; Wang, S; Jiang, X; Ma, Y; Hu, C; Ma, Z; Wang, X. Expression and role of CNIH2 in prostate cancer. Sci Rep. 2024, 14(1), 24701. [Google Scholar] [CrossRef] [PubMed] [PubMed Central]
- Masumoto, N; Kato, S; Aichi, M; Hasegawa, S; Sahara, K; Suyama, K; Sano, A; Miyazaki, T; Okudela, K; Kaneko, T; Takahashi, T. AMPAR receptor inhibitors suppress proliferation of human small cell lung cancer cell lines. Thorac Cancer 2023, 14(29), 2897–2908. [Google Scholar] [CrossRef] [PubMed] [PubMed Central]
- Pankova, V; Thway, K; Jones, RL; Huang, PH. The Extracellular Matrix in Soft Tissue Sarcomas: Pathobiology and Cellular Signalling. Front Cell Dev Biol. 2021, 9, 763640. [Google Scholar] [CrossRef] [PubMed] [PubMed Central]
- Prakash, J; Shaked, Y. The Interplay between Extracellular Matrix Remodeling and Cancer Therapeutics. Cancer Discov. 2024, 14(8), 1375–1388. [Google Scholar] [CrossRef] [PubMed] [PubMed Central]
- Gonzalez-Molina, J; Gramolelli, S; Liao, Z; Carlson, JW; Ojala, PM; Lehti, K. MMP14 in Sarcoma: A Regulator of Tumor Microenvironment Communication in Connective Tissues. Cells 2019, 8(9), 991. [Google Scholar] [CrossRef] [PubMed] [PubMed Central]
- Evergren, E; Mills, IG; Kennedy, G. Adaptations of membrane trafficking in cancer and tumorigenesis. J Cell Sci. 2024, 137(10), jcs260943. [Google Scholar] [CrossRef] [PubMed] [PubMed Central]
- Huang, J.; Zhang, M.; Lin, J.; et al. Safety assessment of proteasome inhibitors real world adverse event analysis from the FAERS database. Sci Rep 2025, 15, 11628. [Google Scholar] [CrossRef] [PubMed]
- Georgiopoulos, G; Makris, N; Laina, A; Theodorakakou, F; Briasoulis, A; Trougakos, IP; Dimopoulos, MA; Kastritis, E; Stamatelopoulos, K. Cardiovascular Toxicity of Proteasome Inhibitors: Underlying Mechanisms and Management Strategies: JACC: CardioOncology State-of-the-Art Review. JACC CardioOncol 2023, 5(1), 1–21. [Google Scholar] [CrossRef] [PubMed] [PubMed Central]
- Fortin, BM; Mahieu, AL; Fellows, RC; Kang, Y; Lewis, AN; Ead, AS; Lamia, KA; Cao, Y; Pannunzio, NR; Masri, S. The diverse roles of the circadian clock in cancer. Nat Cancer 2025, 6(5), 753–767. [Google Scholar] [CrossRef] [PubMed] [PubMed Central]
Figure 1.
Representative Kaplan Meier plots of the E3 ubiquitin ligases with the largest impacts on overall survival (A and B) and recurrence free survival (C and D). A) High expression of TTC3 shortens median OS by 50.63 months. B) High expression of VPS18 extends median OS by 50.86 months. C) High expression of MNAT1 shortens median RFS by 75.03 months. D) High expression of TRIM10 extends median RFS by 72.10 months.
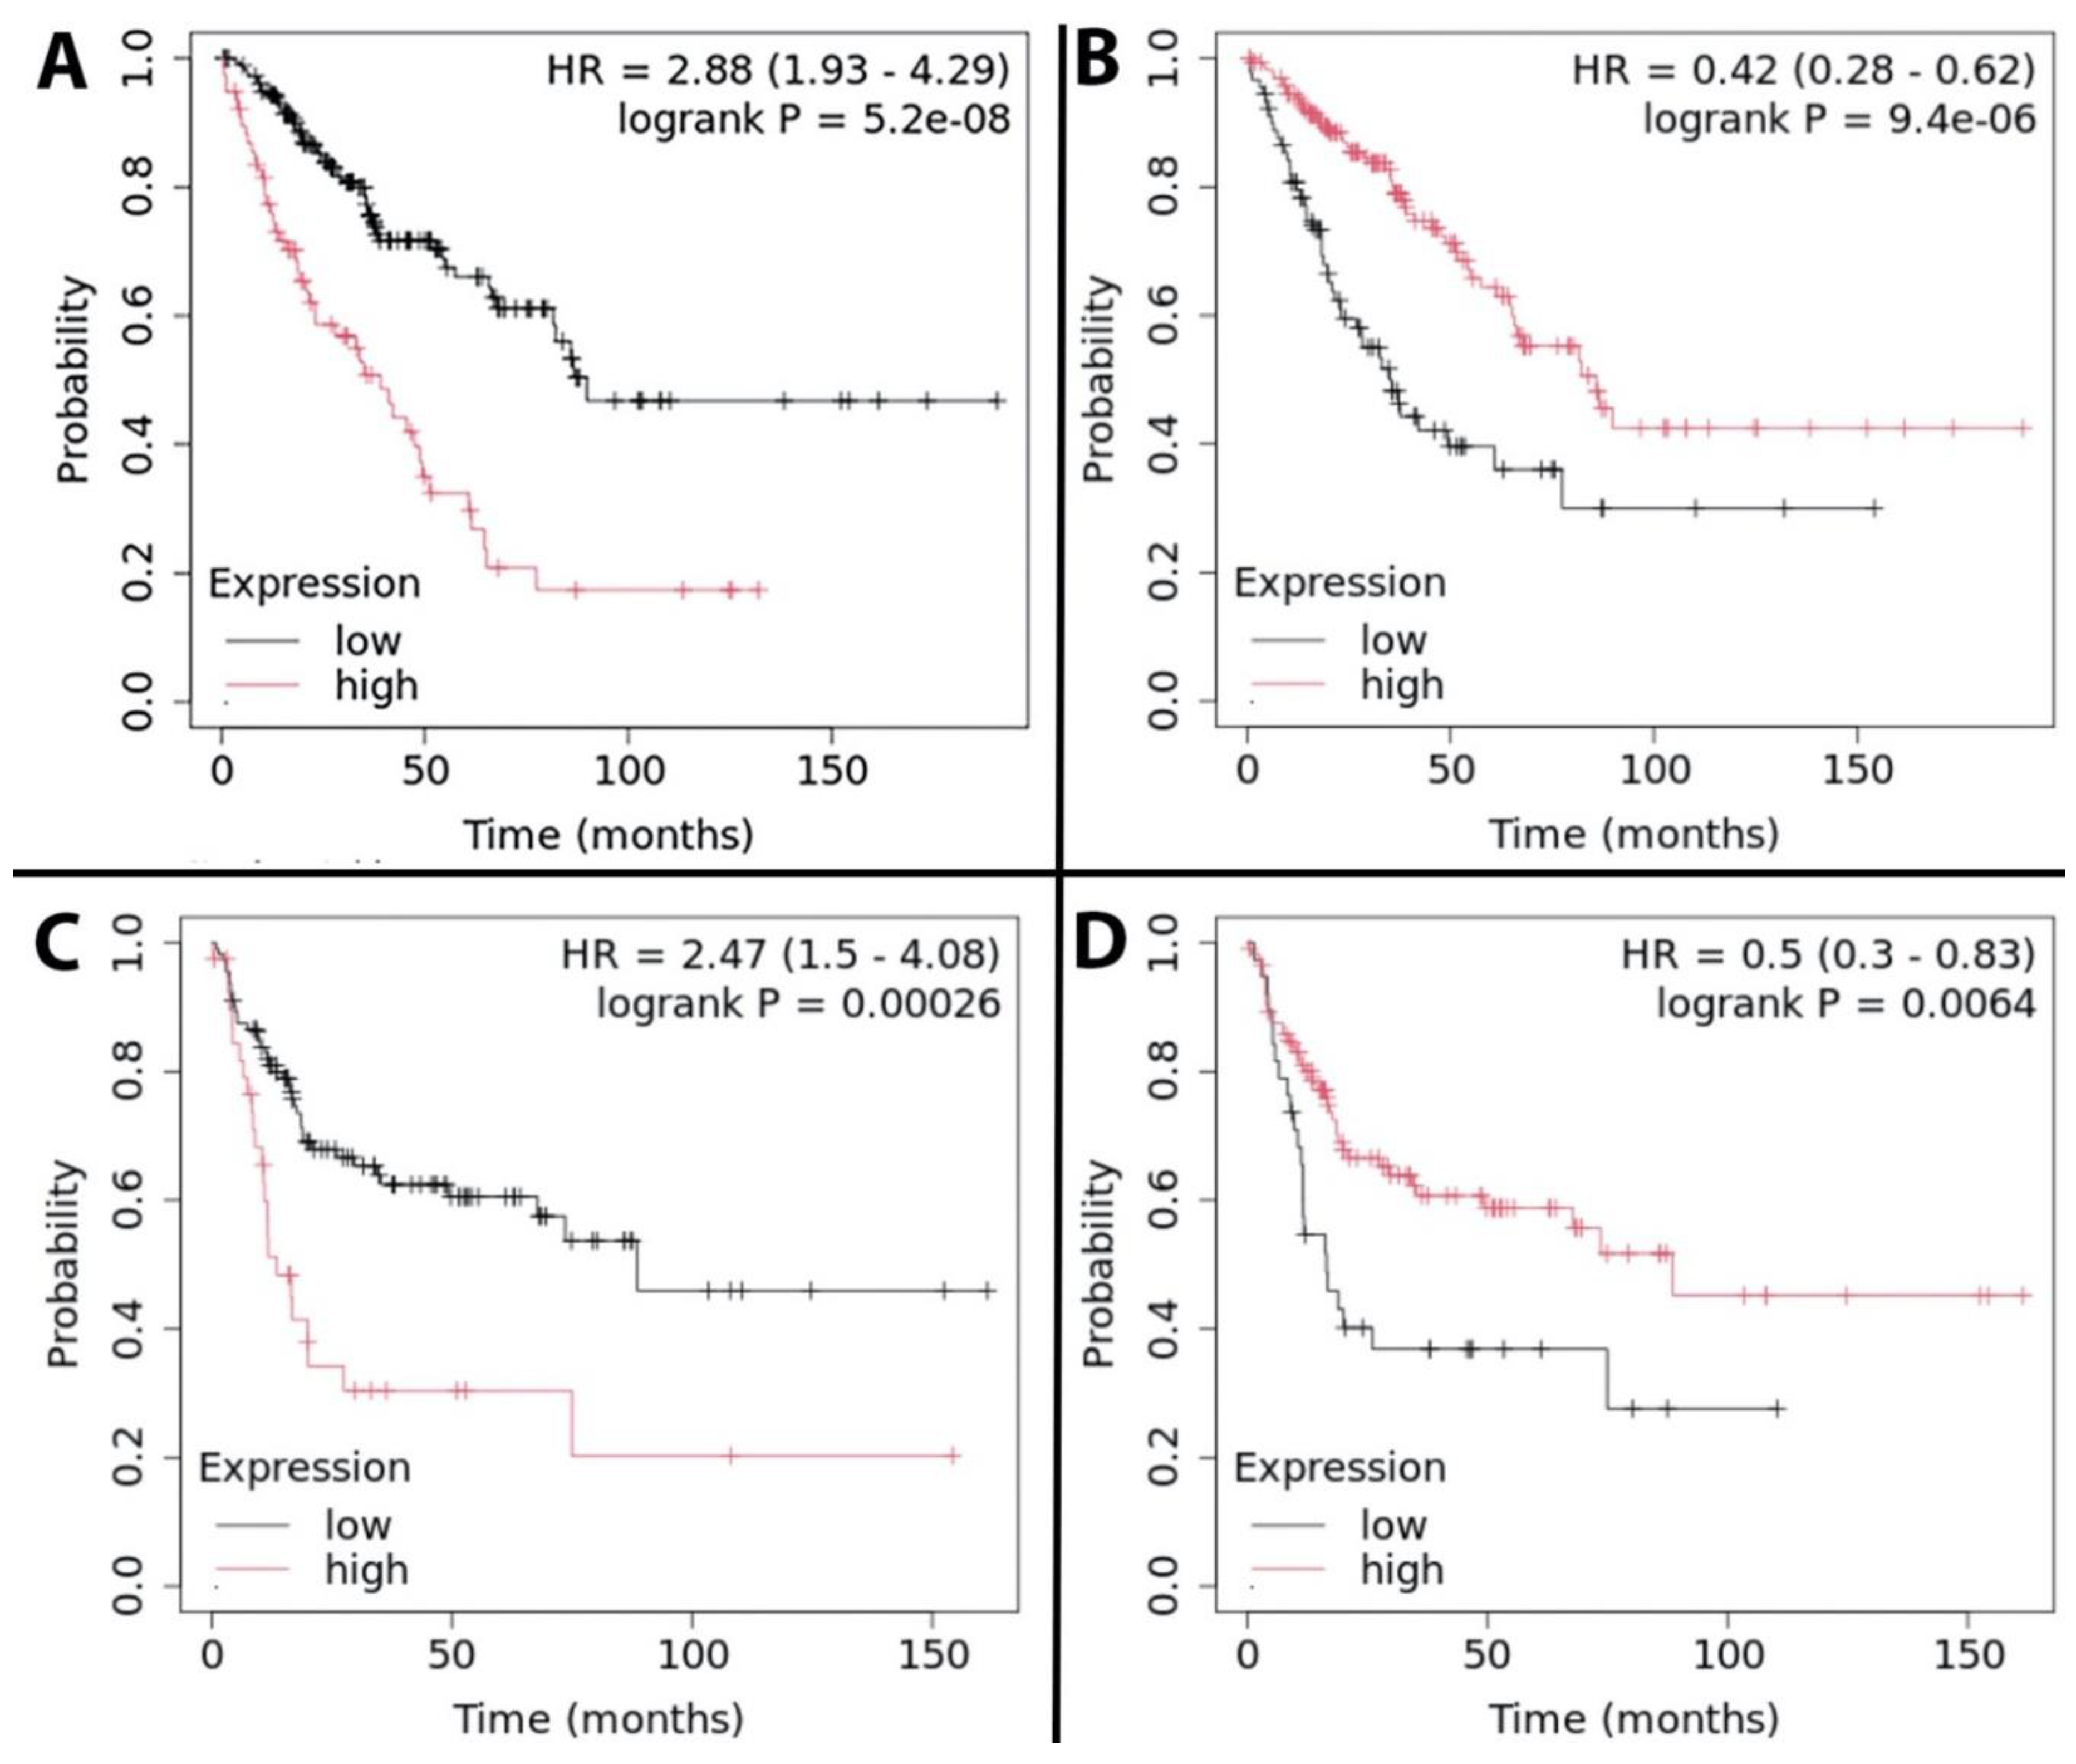
Figure 2.
Violin plots of TPM values (Y-axis) for E3 ubiquitin ligases whose up regulation diminished overall survival among sarcoma patients by >40 months (Table 1). DDLPS = dedifferentiated liposarcoma; MFS = myxofibrosarcoma; MPNST = Malignant Peripheral Neural Sheath Tumor; SS = Synovial Sarcoma; STLMS = Soft tissue Leiomyosarcoma; ULMS = Uterine Leiomyosarcoma; UPS = Undifferentiated Pleomorphic Sarcoma.

Figure 3.
Violin plots of TPM values (Y-axis) for E3 ubiquitin ligases whose upregulation increases overall survival among sarcoma patients by >40 months (Table 2).
Figure 3.
Violin plots of TPM values (Y-axis) for E3 ubiquitin ligases whose upregulation increases overall survival among sarcoma patients by >40 months (Table 2).
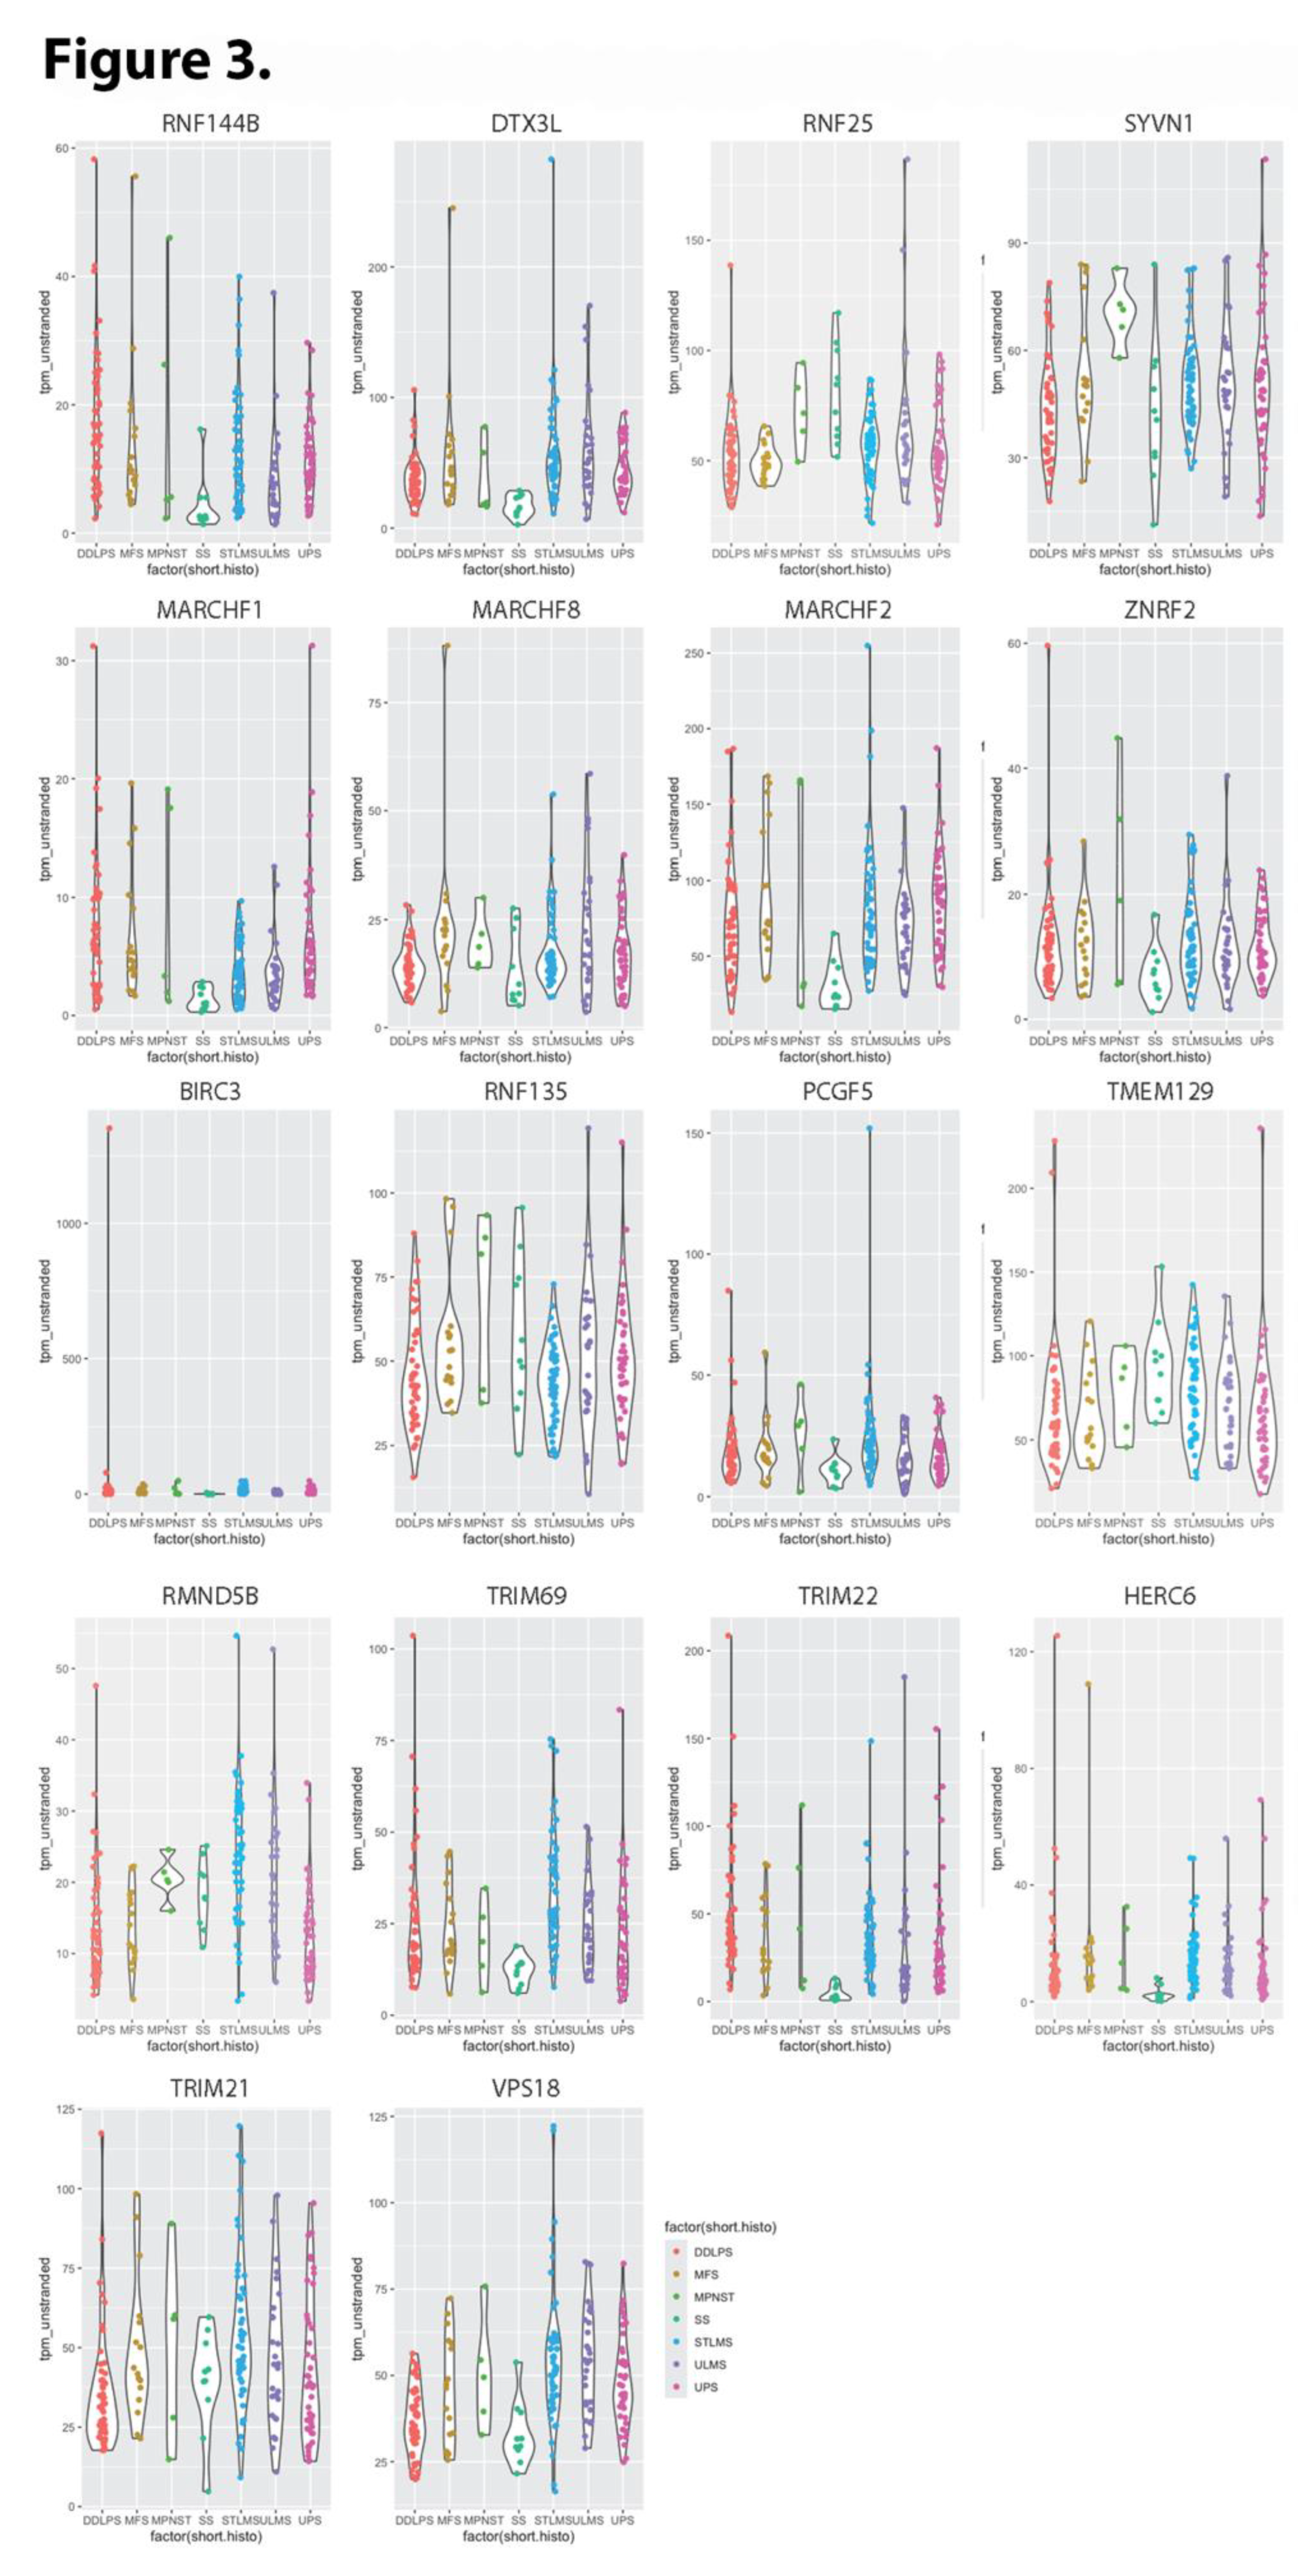
Figure 4.
Violin plots of TPM values (Y-axis) for E3 ubiquitin ligases whose upregulation diminishes recurrence free survival among sarcoma patients (Table 3).
Figure 4.
Violin plots of TPM values (Y-axis) for E3 ubiquitin ligases whose upregulation diminishes recurrence free survival among sarcoma patients (Table 3).
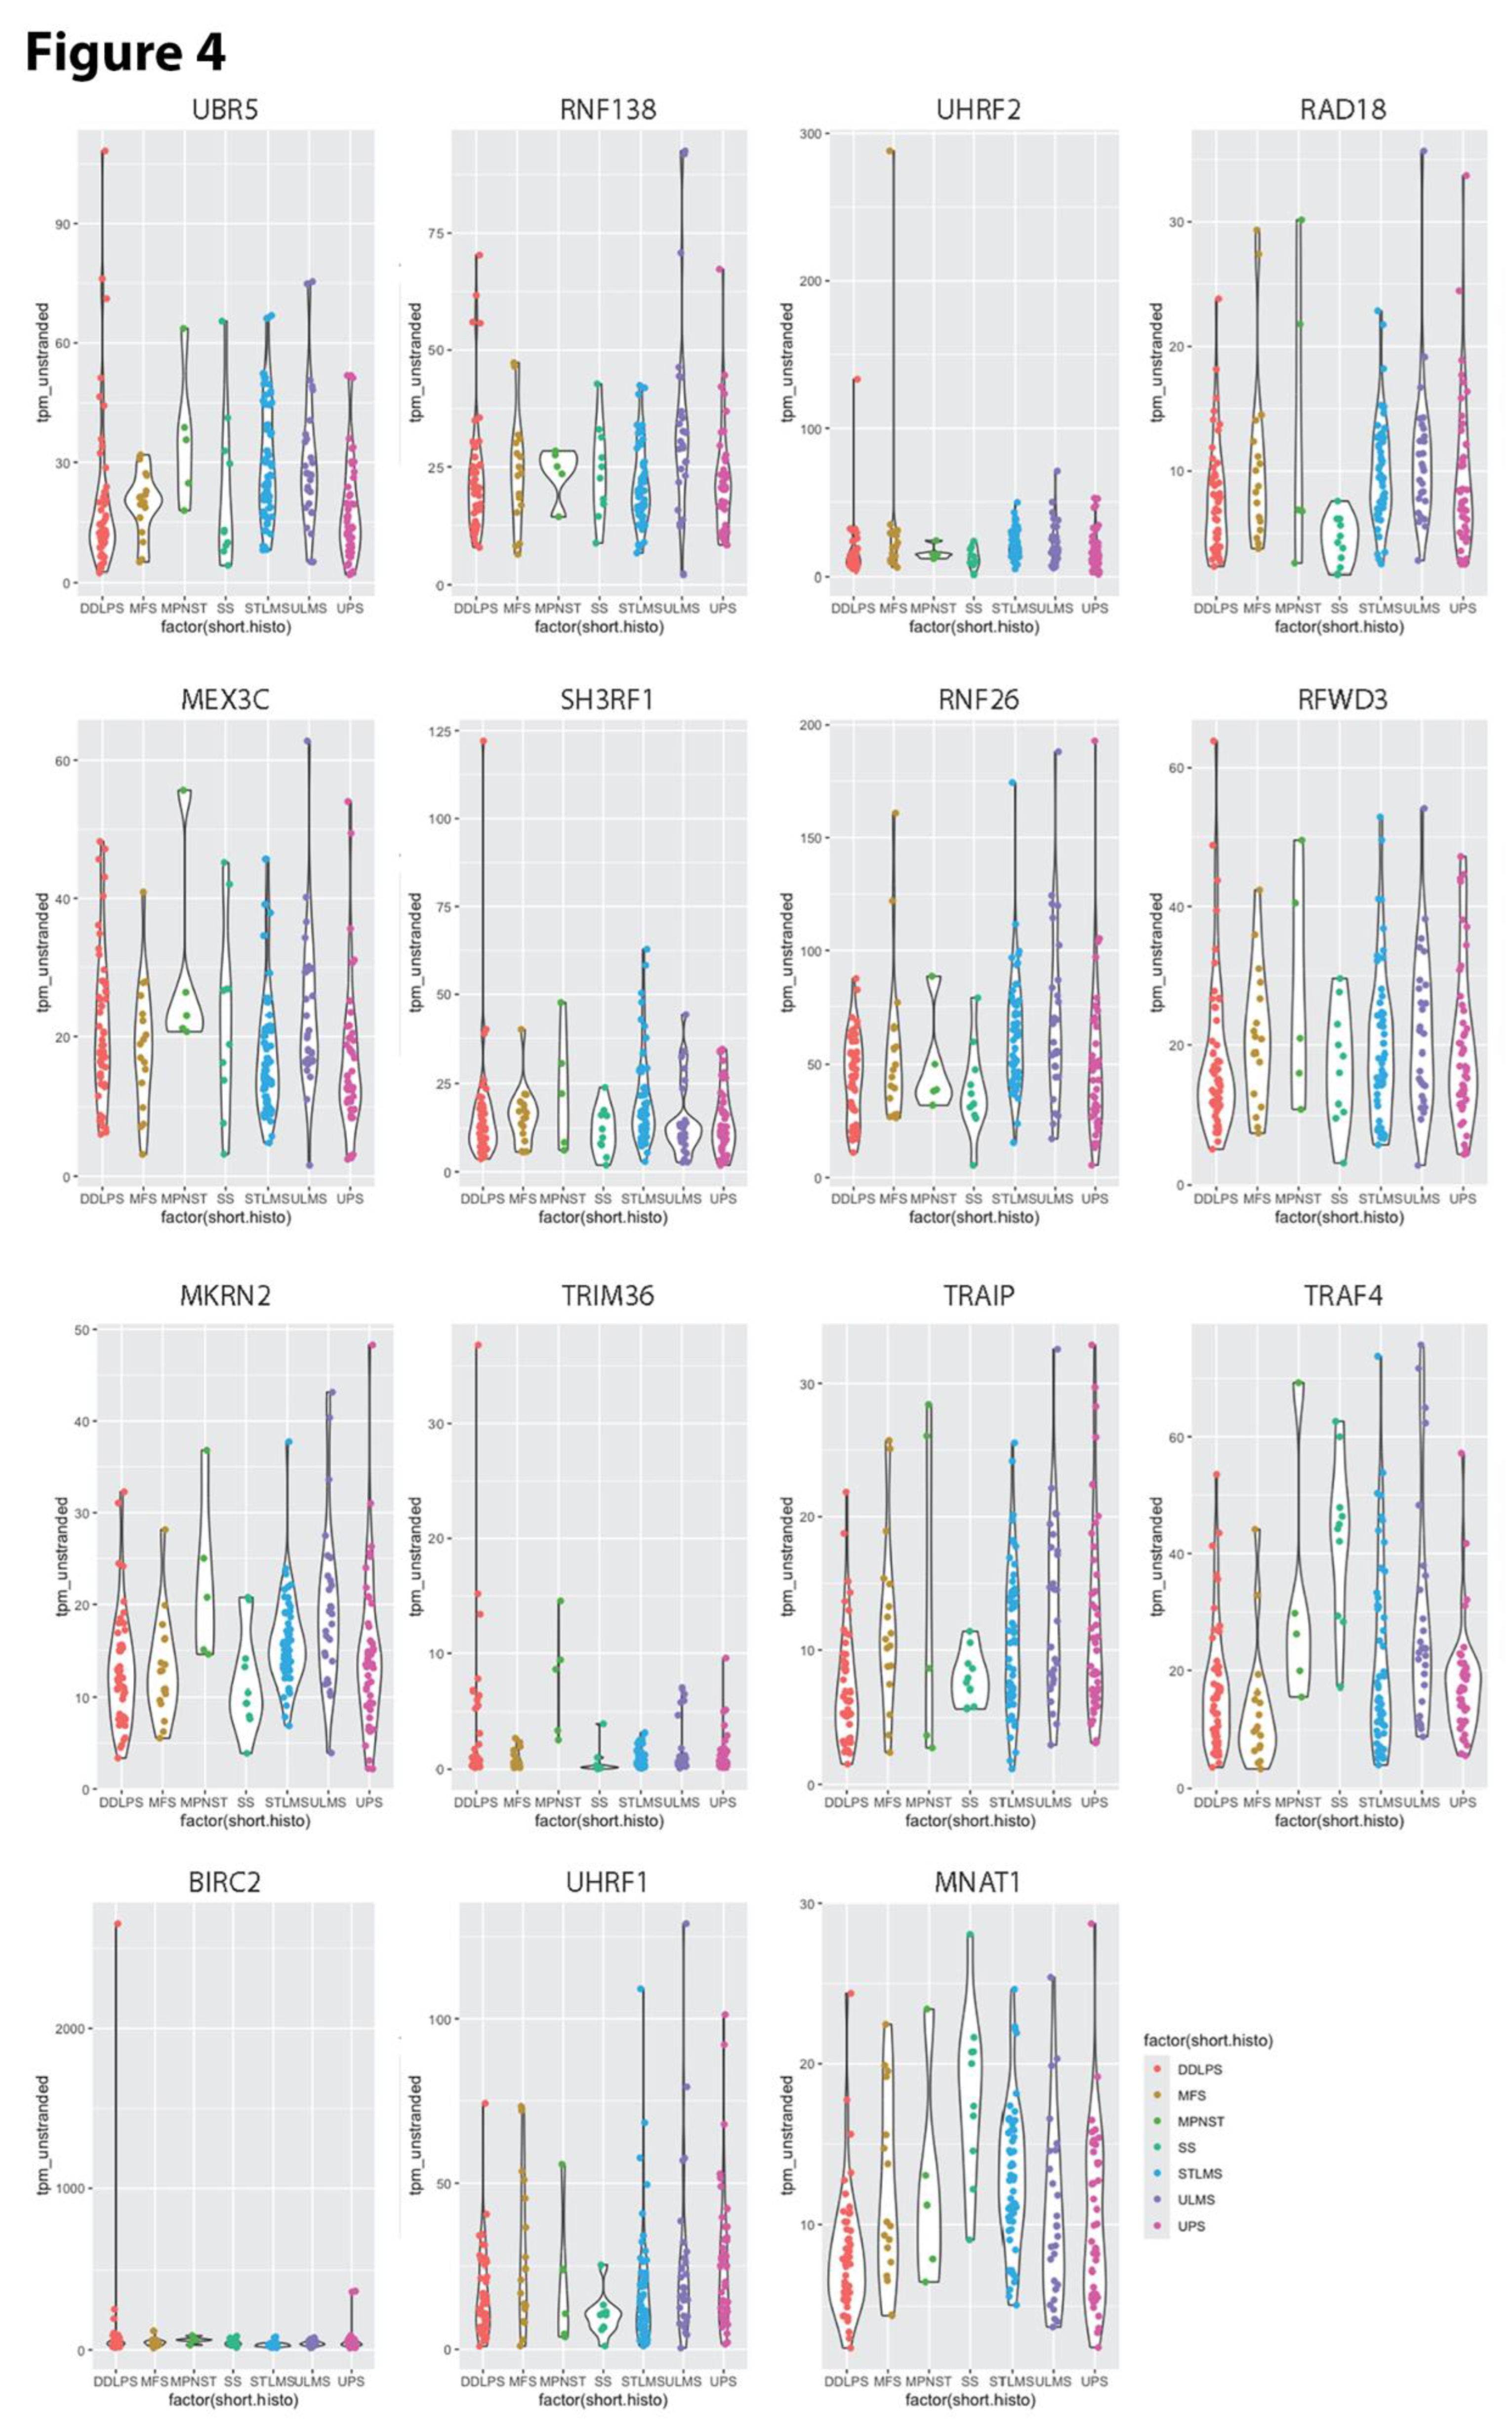
Figure 5.
Violin plots of TPM values (Y-axis) for E3 ubiquitin ligases whose upregulation increases recurrence free survival among sarcoma patients (Table 3). .
Figure 5.
Violin plots of TPM values (Y-axis) for E3 ubiquitin ligases whose upregulation increases recurrence free survival among sarcoma patients (Table 3). .
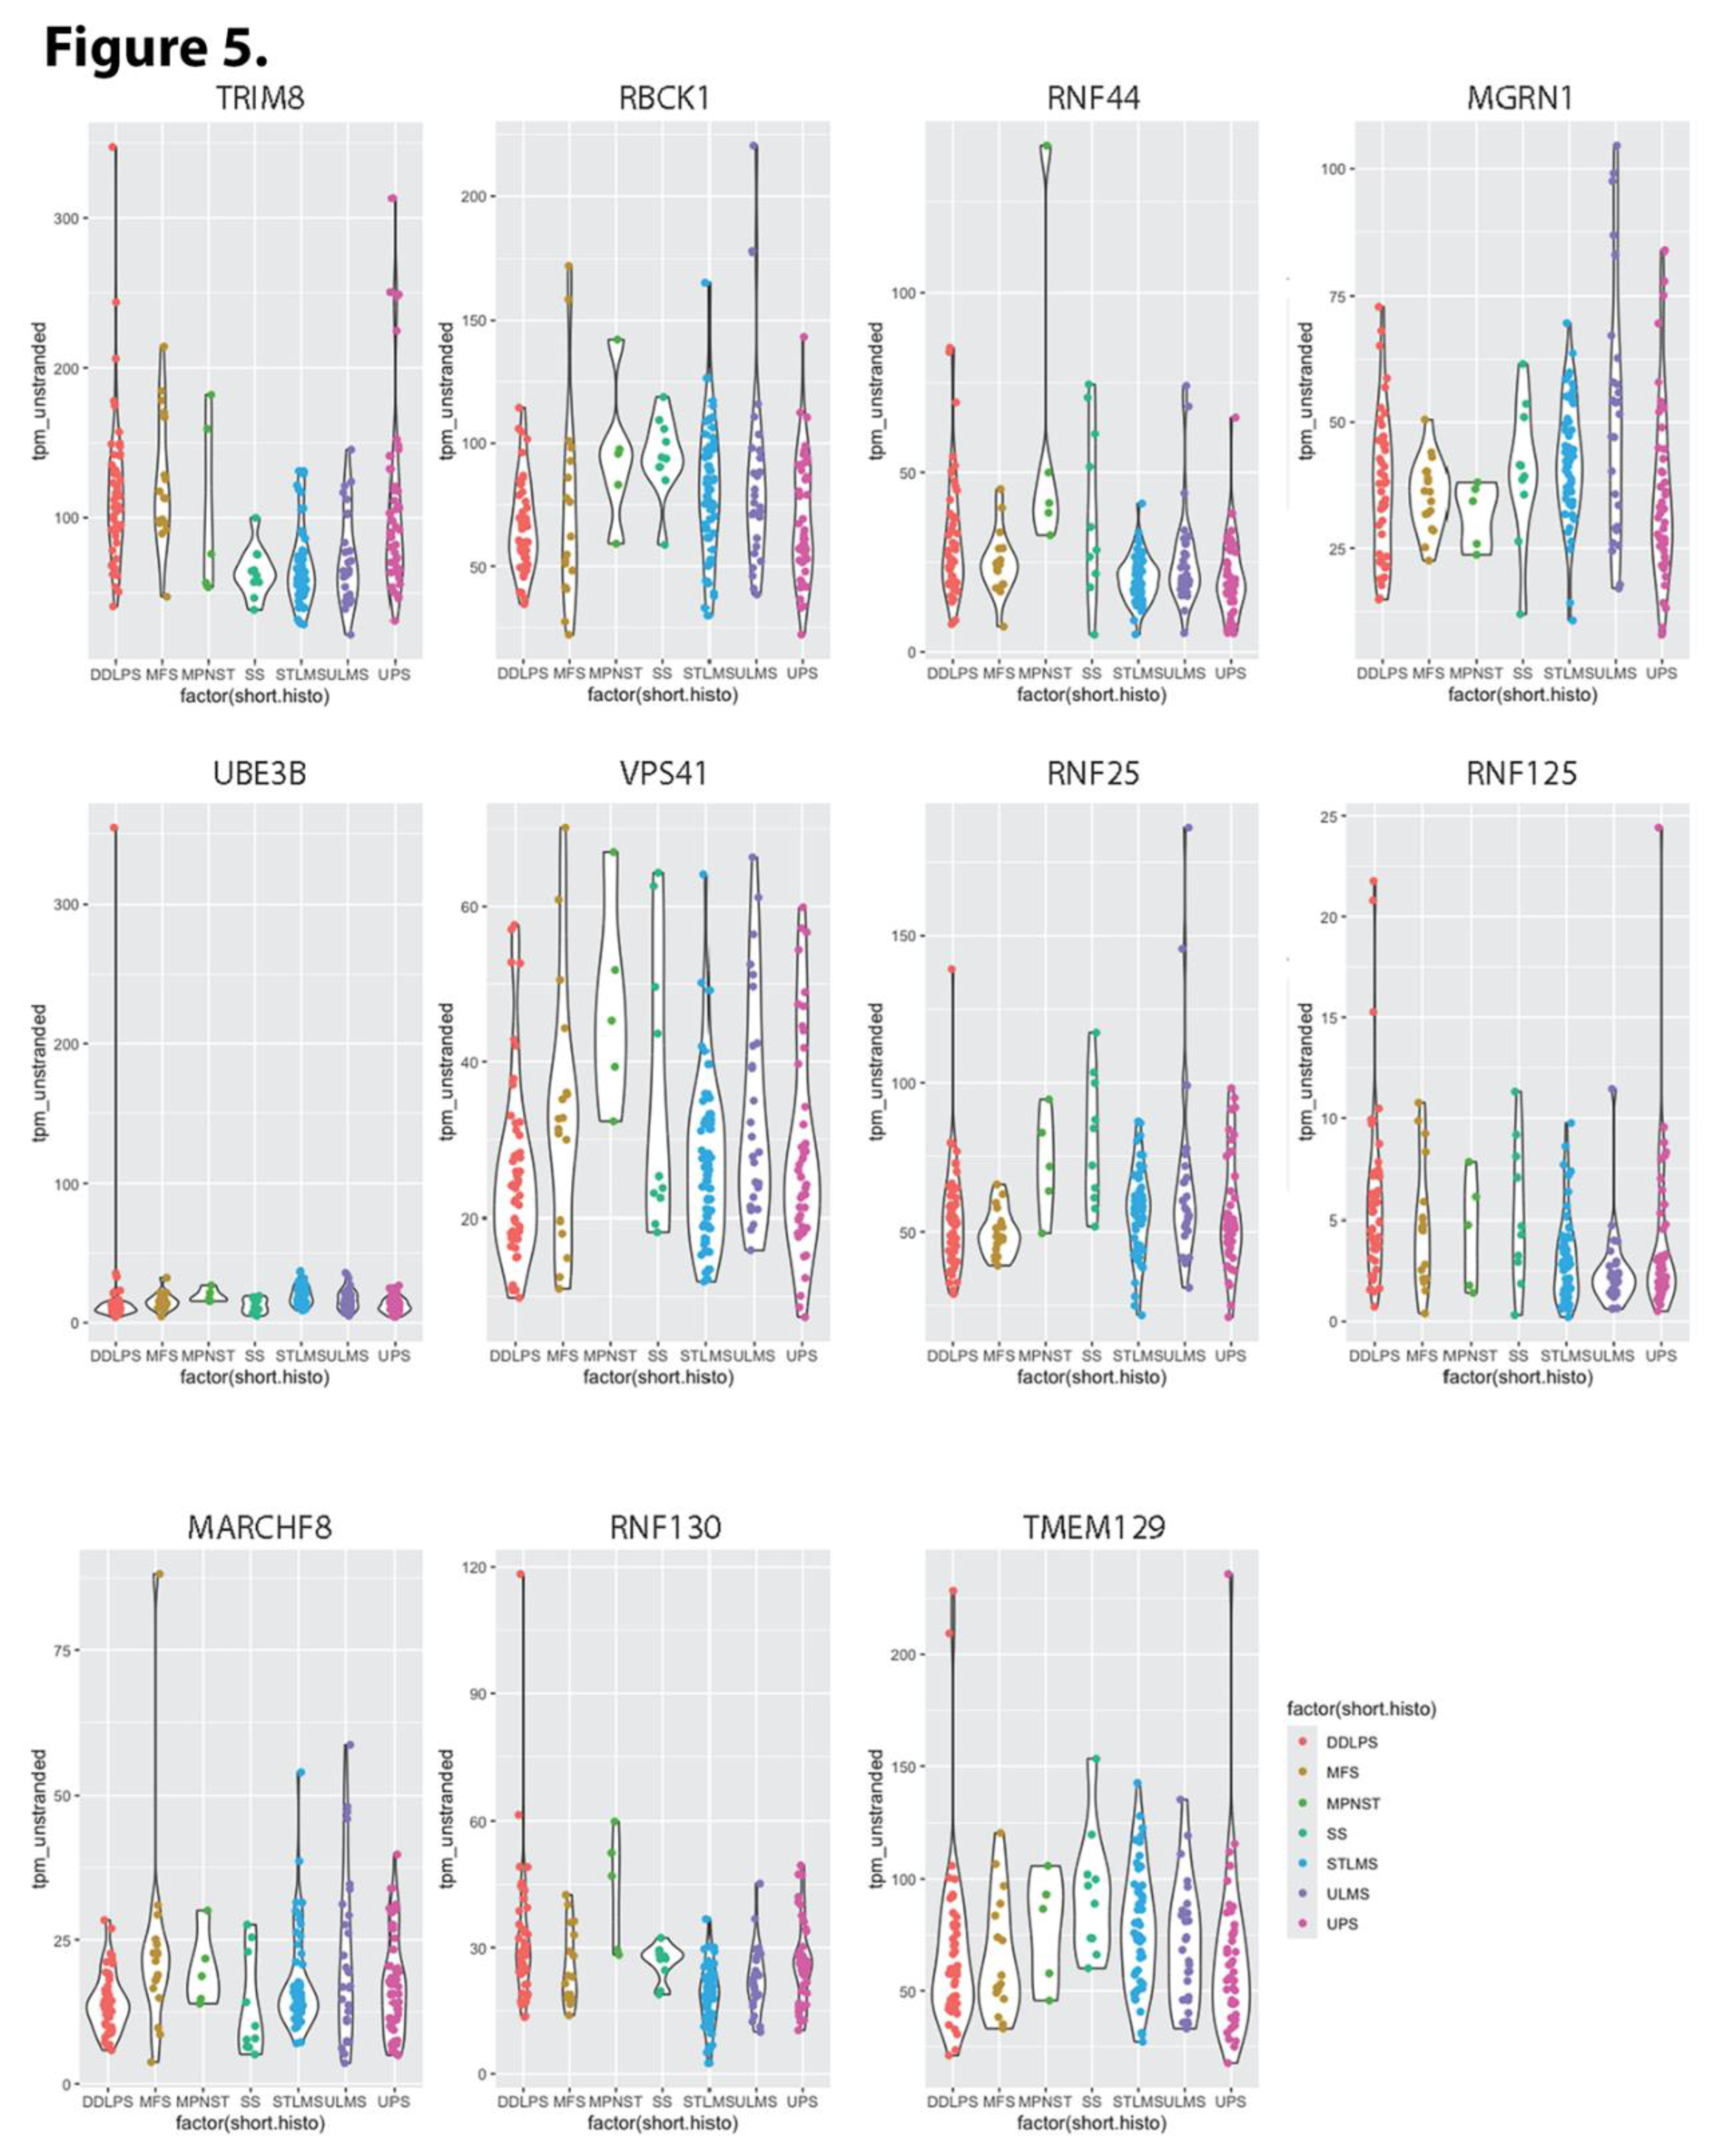
Figure 6.
Figure 6. Highest hierarchical level categories of enriched functions found in Reactome associated with E3 ubiquitin ligases that impact overall survival of sarcoma patients. A) enriched function categories associated with substrates of E3 ligases whose overexpression significantly diminishes sarcoma patient OS; Categories unique to substrates of E3 ligases associated with diminished OS are represented in shades of red. B) enriched function categories associated with substrates of E3 ligases whose overexpression significantly extends sarcoma patient OS; Categories unique to substrates of E3 ligases associated with extended OS are represented in shades of blue. Categories shared by both sets of substrates are represented in shades of purple.
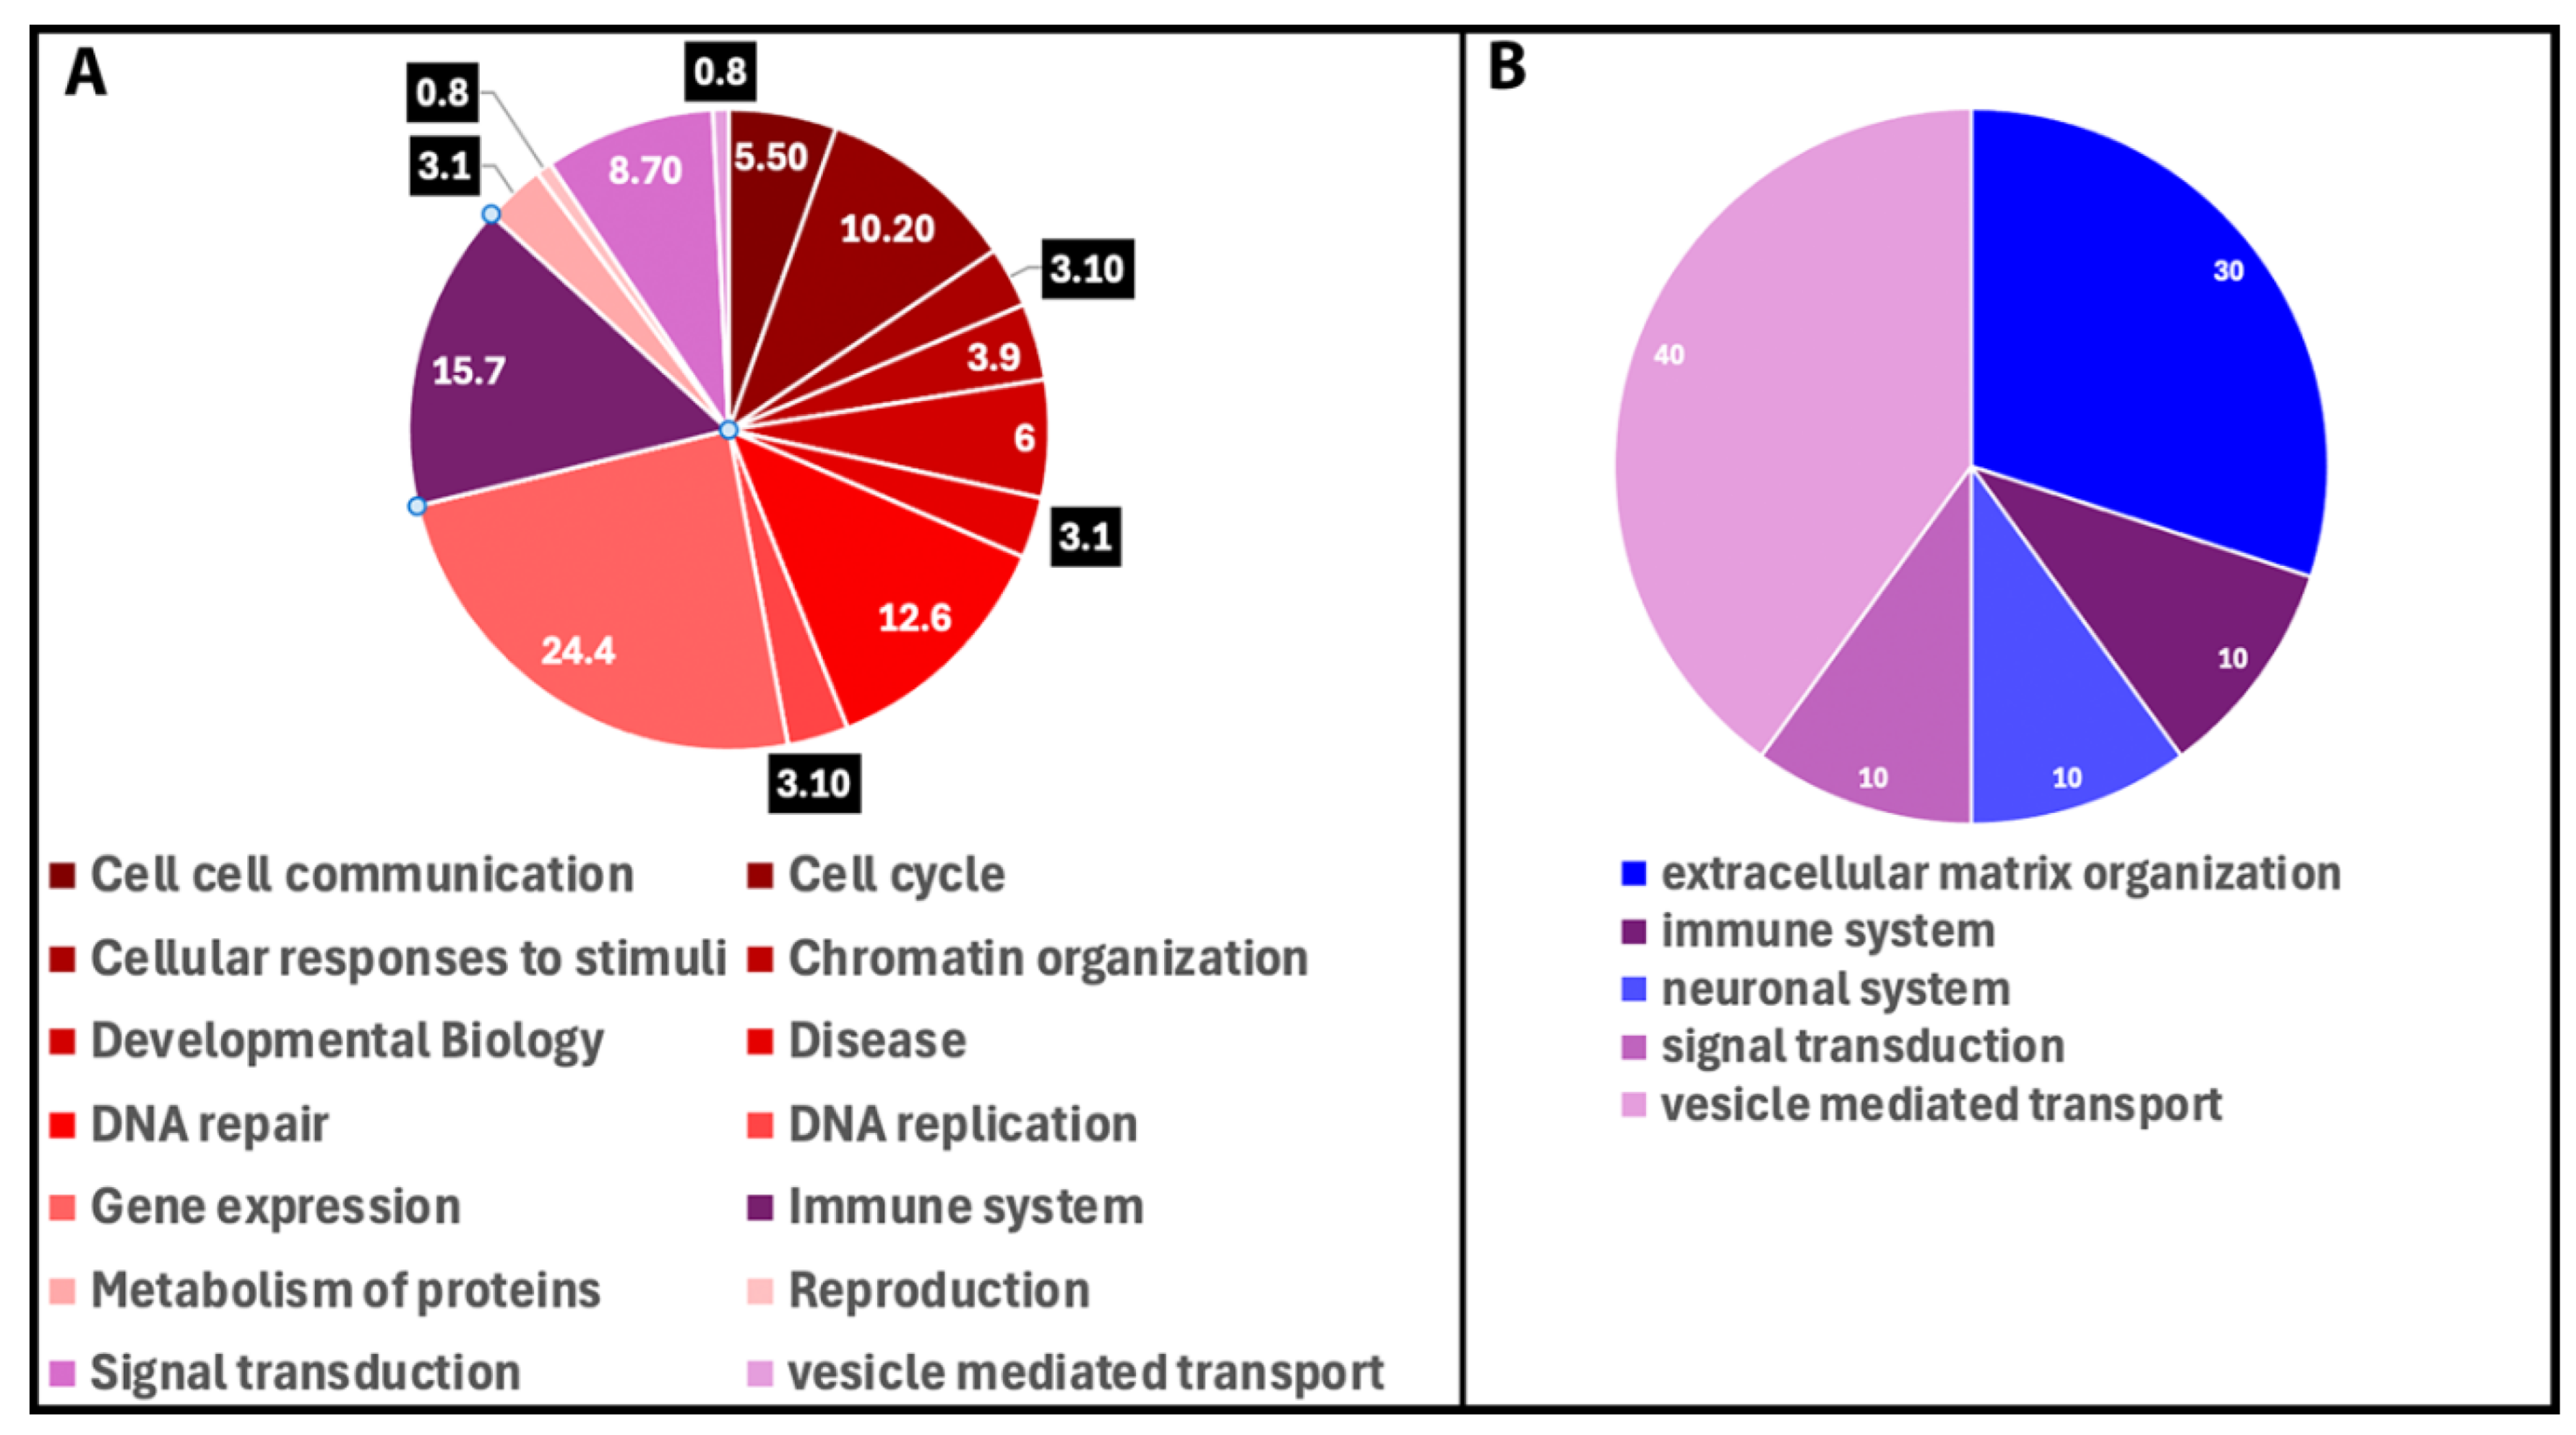

Table 1.
E3 ubiquitin ligases whose upregulation diminishes overall survival among sarcoma patients by ≥40 months.
Table 1.
E3 ubiquitin ligases whose upregulation diminishes overall survival among sarcoma patients by ≥40 months.
| E3 ubiquitin ligase | P value | Hazard Ratio | N low/N high | Difference in overall survival (months) |
|---|---|---|---|---|
| PCGF3* | 0.011 | 1.66 | 181/78 | 44.66 |
| CCNB1IP1 | 0.01 | 1.64 | 189/70 | 40.43 |
| MSL2* | 0.0087 | 1.67 | 194/65 | 43.76 |
| RNF2 | 0.0072 | 1.68 | 162/97 | 40.3 |
| MARCHF5** | 0.005 | 1.69 | 158/101 | 44.66 |
| ZBTB12 | 0.002 | 1.94 | 194/65 | 43.97 |
| MEX3D* | 0.0016 | 1.86 | 116/143 | 40.93 |
| TRIM71 | 0.00087 | 1.80 | 190/69 | 47.03 |
| UBE4B** | 0.00013 | 2.20 | 194/65 | 40.27 |
| RNF8*** | 0.000045 | 2.46 | 195/64 | 44.93 |
| MEX3A** | 0.000023 | 2.26 | 133/126 | 45.46 |
| MARCHF10 | 0.00001 | 1.96 | 160/99 | 48.63 |
| TTC3** | 5.2 X 10⁻⁸ | 2.78 | 183/76 | 50.63 |
Table 2.
E3 ubiquitin ligases whose upregulation is associated with increased overall survival among sarcoma patients by ≥40 months.
Table 2.
E3 ubiquitin ligases whose upregulation is associated with increased overall survival among sarcoma patients by ≥40 months.
| E3 ubiquitin ligase | P value | Hazard Ratio | N high/N low | Difference in overall survival (months) |
|---|---|---|---|---|
| RNF144B | 0.03 | 0.65 | 194/65 | 40.43 |
| DTX3L | 0.007 | 0.59 | 190/69 | 42.43 |
| RNF25 | 0.0066 | 0.61 | 169/90 | 40.3 |
| SYVN1 | 0.0054 | 0.56 | 193/66 | 44.66 |
| MARCHF1 | 0.0039 | 0.59 | 174/85 | 40.43 |
| MARCHF8 | 0.0034 | 0.54 | 194/65 | 44.5 |
| MARCHF2 | 0.003 | 0.55 | 194/65 | 40.43 |
| ZNRF2 | 0.0028 | 0.55 | 179/80 | 40.06 |
| BIRC3 | 0.0023 | 0.54 | 192/67 | 45.83 |
| RNF135 | 0.0016 | 0.53 | 170/89 | 44.4 |
| PCGF5 | 0.0013 | 0.53 | 185/74 | 44.66 |
| TMEM129 | 0.0008 | 0.51 | 177/82 | 44.5 |
| RMND5B** | 0.00036 | 0.49 | 112/147 | 40.53 |
| TRIM69 | 0.00011 | 0.47 | 188/71 | 44.4 |
| TRIM22 | 0.000062 | 0.45 | 194/65 | 46.76 |
| HERC6 | 0.000027 | 0.45 | 179/80 | 46.03 |
| TRIM21*** | 0.000011 | 0.42 | 135/124 | 50.63 |
| VPS18 | 9.4 X 10⁻⁶ | 0.43 | 167/92 | 50.86 |
Table 3.
E3 ubiquitin ligases whose upregulation diminishes recurrence free survival among sarcoma patients.
Table 3.
E3 ubiquitin ligases whose upregulation diminishes recurrence free survival among sarcoma patients.
| E3 ubiquitin Ligase | P value | Hazard Ratio | N low/N high | Difference in recurrence free survival (months) |
|---|---|---|---|---|
| UBR5 | 0.041 | 1.76 | 55/97 | 3.07 |
| RNF138 | 0.034 | 1.85 | 51/101 | 4.70 |
| UHRF2 | 0.0066 | 1.96 | 81/71 | 5.8 |
| RAD18 | 0.0077 | 1.95 | 77/75 | 6.77 |
| MEX3C | 0.015 | 2.05 | 46/106 | 7.67 |
| SH3RF1 | 0.0035 | 2.04 | 89/63 | 7.80 |
| RNF26** | 0.039 | 1.68 | 104/48 | 56.37 |
| RFWD3 | 0.0055 | 2.31 | 50/102 | 57.00 |
| MKRN2 | 0.047 | 1.64 | 77/75 | 61.10 |
| TRIM36 | 0.045 | 1.63 | 88/64 | 61.10 |
| TRAIP | 0.0027 | 2.26 | 61/91 | 68.53 |
| TRAF4* | 0.041 | 1.65 | 87/65 | 68.66 |
| BIRC2 | 0.012 | 1.88 | 105/47 | 69.70 |
| UHRF1*** | 0.00027 | 2.48 | 113/39 | 72.30 |
| MNAT1 | 0.00046 | 2.40 | 113/39 | 75.03 |
Table 4.
E3 ubiquitin ligases whose upregulation increases recurrence free survival among sarcoma patients.
Table 4.
E3 ubiquitin ligases whose upregulation increases recurrence free survival among sarcoma patients.
| E3 ubiquitin Ligase | P value | Hazard Ratio | N high/N low | Difference in recurrence free survival (months) |
|---|---|---|---|---|
| TRIM8 | 0.037 | 0.59 | 111/41 | 1.87 |
| RBCK1 | 0.046 | 0.61 | 107/45 | 48.84 |
| RNF44 | 0.043 | 0.58 | 114/38 | 56.37 |
| MGRN1 | 0.0088 | 0.52 | 103/49 | 57.20 |
| UBE3B | 0.0197 | 0.56 | 103/49 | 57.20 |
| VPS41 | 0.011 | 0.54 | 94/58 | 57.20 |
| RNF25 | 0.027 | 0.56 | 112/40 | 57.77 |
| RMND5B* | 0.01 | 0.53 | 104/48 | 58.64 |
| RNF125 | 0.03 | 0.58 | 71/81 | 58.83 |
| MARCHF8 | 0.03 | 0.56 | 114/38 | 69.70 |
| RNF130 | 0.0041 | 0.49 | 83/69 | 70.03 |
| TMEM129 | 0.00048 | 0.43 | 91/61 | 72.10 |
Table 5.
Most significantly enriched functions among known and predicted substrates of E3 ubiquitin ligases whose upregulation decreases overall survival among sarcoma patients.
Table 5.
Most significantly enriched functions among known and predicted substrates of E3 ubiquitin ligases whose upregulation decreases overall survival among sarcoma patients.
| Enrichment term | Impact on cancer | # of proteins (%) | p-value |
|---|---|---|---|
| Packaging Of Telomere Ends | Tumor suppressing | 25(75.8) | 1.11X10⁻¹⁶ |
| DNA methylation | Cancer promoting | 26(74.3) | 1.11X10⁻¹⁶ |
| PRC2 methylates histones and DNA | Cancer promoting | 26(60.5) | 1.11X10⁻¹⁶ |
| RNA Polymerase I Promoter Escape | Cancer promoting | 28(46.7) | 1.11X10⁻¹⁶ |
| B-WICH complex positively regulates rRNA expression | Cancer promoting | 27(44.3) | 1.11X10⁻¹⁶ |
| Formation of the b-catenin:TCF transactivating complex | Cancer promoting | 29(43.9) | 1.11X10⁻¹⁶ |
| Regulation of endogenous retroelements by Piwi-interacting RNAs (piRNAs) | Tumor suppressing | 28(41.2) | 1.11X10⁻¹⁶ |
| Regulation of endogenous retroelements by KRAB-ZFP proteins | Tumor suppressing | 26(33.3) | 1.11X10⁻¹⁶ |
| Chromatin modifications during the maternal to zygotic transition (MZT) | Cancer promoting | 26(54.2) | 1.11X10⁻¹⁶ |
| SIRT1 negatively regulates rRNA expression | Cancer promoting | 27(61.4) | 1.11X10⁻¹⁶ |
| Condensation of Prophase Chromosomes | Tumor suppressing | 29(53.7) | 1.11X10⁻¹⁶ |
| HDACs deacetylate histones | Cancer promoting | 27(42.9) | 1.11X10⁻¹⁶ |
| HATs acetylate histones | Tumor suppressing | 32(29.1) | 1.11X10⁻¹⁶ |
| Activation of anterior HOX genes in hindbrain development during early embryogenesis | Effect uncertain | 33(28.4) | 1.11X10⁻¹⁶ |
| Activation of HOX genes during differentiation | Effect uncertain | 33(28.4) | 1.11X10⁻¹⁶ |
| Inhibition of DNA recombination at telomere | Cancer promoting | 26(55.3) | 1.11X10⁻¹⁶ |
| Negative epigenetic regulation of rRNA expression | Tumor suppressing | 29(33.0) | 1.11X10⁻¹⁶ |
| Activated PKN1 stimulates transcription of androgen receptor regulated genes KLK2 and KLK3 | Cancer promoting | 26(54.2) | 1.11X10⁻¹⁶ |
| NoRC negatively regulates rRNA expression | Tumor suppressing | 29(36.7) | 1.11X10⁻¹⁶ |
| Positive epigenetic regulation of rRNA expression | Cancer promoting | 27(34.2) | 1.11X10⁻¹⁶ |
| RNA Polymerase I Transcription | Cancer promoting | 28(32.6) | 1.11X10⁻¹⁶ |
| RNA Polymerase I Promoter Clearance | Cancer promoting | 28(33.3) | 1.11X10⁻¹⁶ |
| RUNX1 regulates genes involved in megakaryocyte differentiation and platelet function | Effect uncertain | 29(38.2) | 1.11X10⁻¹⁶ |
| Meiotic synapsis | Effect uncertain | 26(42.6) | 1.11X10⁻¹⁶ |
| Regulation of endogenous retroelements by the Human Silencing Hub (HUSH) complex | Tumor suppressing | 26(63.4) | 1.11X10⁻¹⁶ |
Table 6.
Most significantly enriched functions among known and predicted substrates of E3 ubiquitin ligases whose upregulation increases overall survival among sarcoma patients.
Table 6.
Most significantly enriched functions among known and predicted substrates of E3 ubiquitin ligases whose upregulation increases overall survival among sarcoma patients.
| Enrichment term | Impact on cancer | # of proteins (%) | p-value | FDR |
|---|---|---|---|---|
| Neutrophil degranulation | Effect uncertain | 193 (40.4) | 5.00X10⁻¹³ | 1.26X10⁻⁹ |
| Membrane Trafficking | Cancer promoting | 237 (35.4) | 3.01X10⁻¹⁰ | 3.79X10⁻⁷ |
| Extracellular matrix organization | Cancer promoting | 142 (40.5) | 5.37X10⁻¹⁰ | 4.50X10⁻⁷ |
| ER to Golgi Anterograde Transport | Cancer promoting | 74 (44.8) | 1.80X10⁻⁷ | 7.53X10⁻⁵ |
| Intra-Golgi and retrograde Golgi-to-ER traffic | Cancer promoting | 91 (41.6) | 2.11X10⁻⁷ | 7.58X10⁻⁵ |
| Laminin interactions | Cancer promoting | 24 (77.4) | 6.19X10⁻⁷ | 1.94X10⁻⁴ |
| Vesicle-mediated transport | Cancer promoting | 261 (31.5) | 8.66X10⁻⁷ | 2.42X10⁻⁴ |
| Programmed Cell Death | Cancer promoting | 90 (40.0) | 1.14X10⁻⁶ | 2.87X10⁻⁴ |
| Transport to the Golgi and subsequent modification | Cancer promoting | 88 (39.8) | 1.77X10⁻⁶ | 3.97X10⁻⁴ |
| Degradation of the extracellular matrix | Cancer promoting | 65 (43.9) | 1.90X10⁻⁶ | 3.97X10⁻⁴ |
| PCP/CE pathway | Cancer promoting | 44 (51.2) | 2.22X10⁻⁶ | 4.28X10⁻⁴ |
| TNFR2 non-canonical NF-kB pathway | Cancer promoting | 44 (48.4) | 8.78X10⁻⁶ | 1.57X10⁻³ |
| Beta-catenin independent WNT signaling | Cancer promoting | 64 (41.8) | 1.01X10⁻⁵ | 1.68X10⁻³ |
| Integrin cell surface interactions | Cancer promoting | 42 (48.8) | 1.10X10⁻⁵ | 1.73X10⁻³ |
| ECM proteoglycans | Cancer promoting | 39 (49.4) | 1.76X10⁻⁵ | 2.58X10⁻³ |
| Trafficking of AMPA receptors | Cancer promoting | 23 (62.2) | 3.33X10⁻⁵ | 4.63X10⁻³ |
| Apoptosis | Effect uncertain | 70 (38.9) | 3.89X10⁻⁵ | 5.14X10⁻³ |
| COPI-mediated anterograde transport | Effect uncertain | 47 (43.9) | 4.60X10⁻⁵ | 5.48X10⁻³ |
| Intra-Golgi traffic | Cancer promoting | 27 (55.1) | 5.16X10⁻⁵ | 6.40X10⁻³ |
| Glutamate binding, activation of AMPA receptors and synaptic plasticity | Cancer promoting | 23 (59.0) | 7.24X10⁻⁵ | 7.89X10⁻³ |
Disclaimer/Publisher’s Note: The statements, opinions and data contained in all publications are solely those of the individual author(s) and contributor(s) and not of MDPI and/or the editor(s). MDPI and/or the editor(s) disclaim responsibility for any injury to people or property resulting from any ideas, methods, instructions or products referred to in the content. |
© 2026 by the authors. Licensee MDPI, Basel, Switzerland. This article is an open access article distributed under the terms and conditions of the Creative Commons Attribution (CC BY) license.
Copyright: This open access article is published under a Creative Commons CC BY 4.0 license, which permit the free download, distribution, and reuse, provided that the author and preprint are cited in any reuse.


