Submitted:
26 January 2026
Posted:
27 January 2026
You are already at the latest version
Abstract
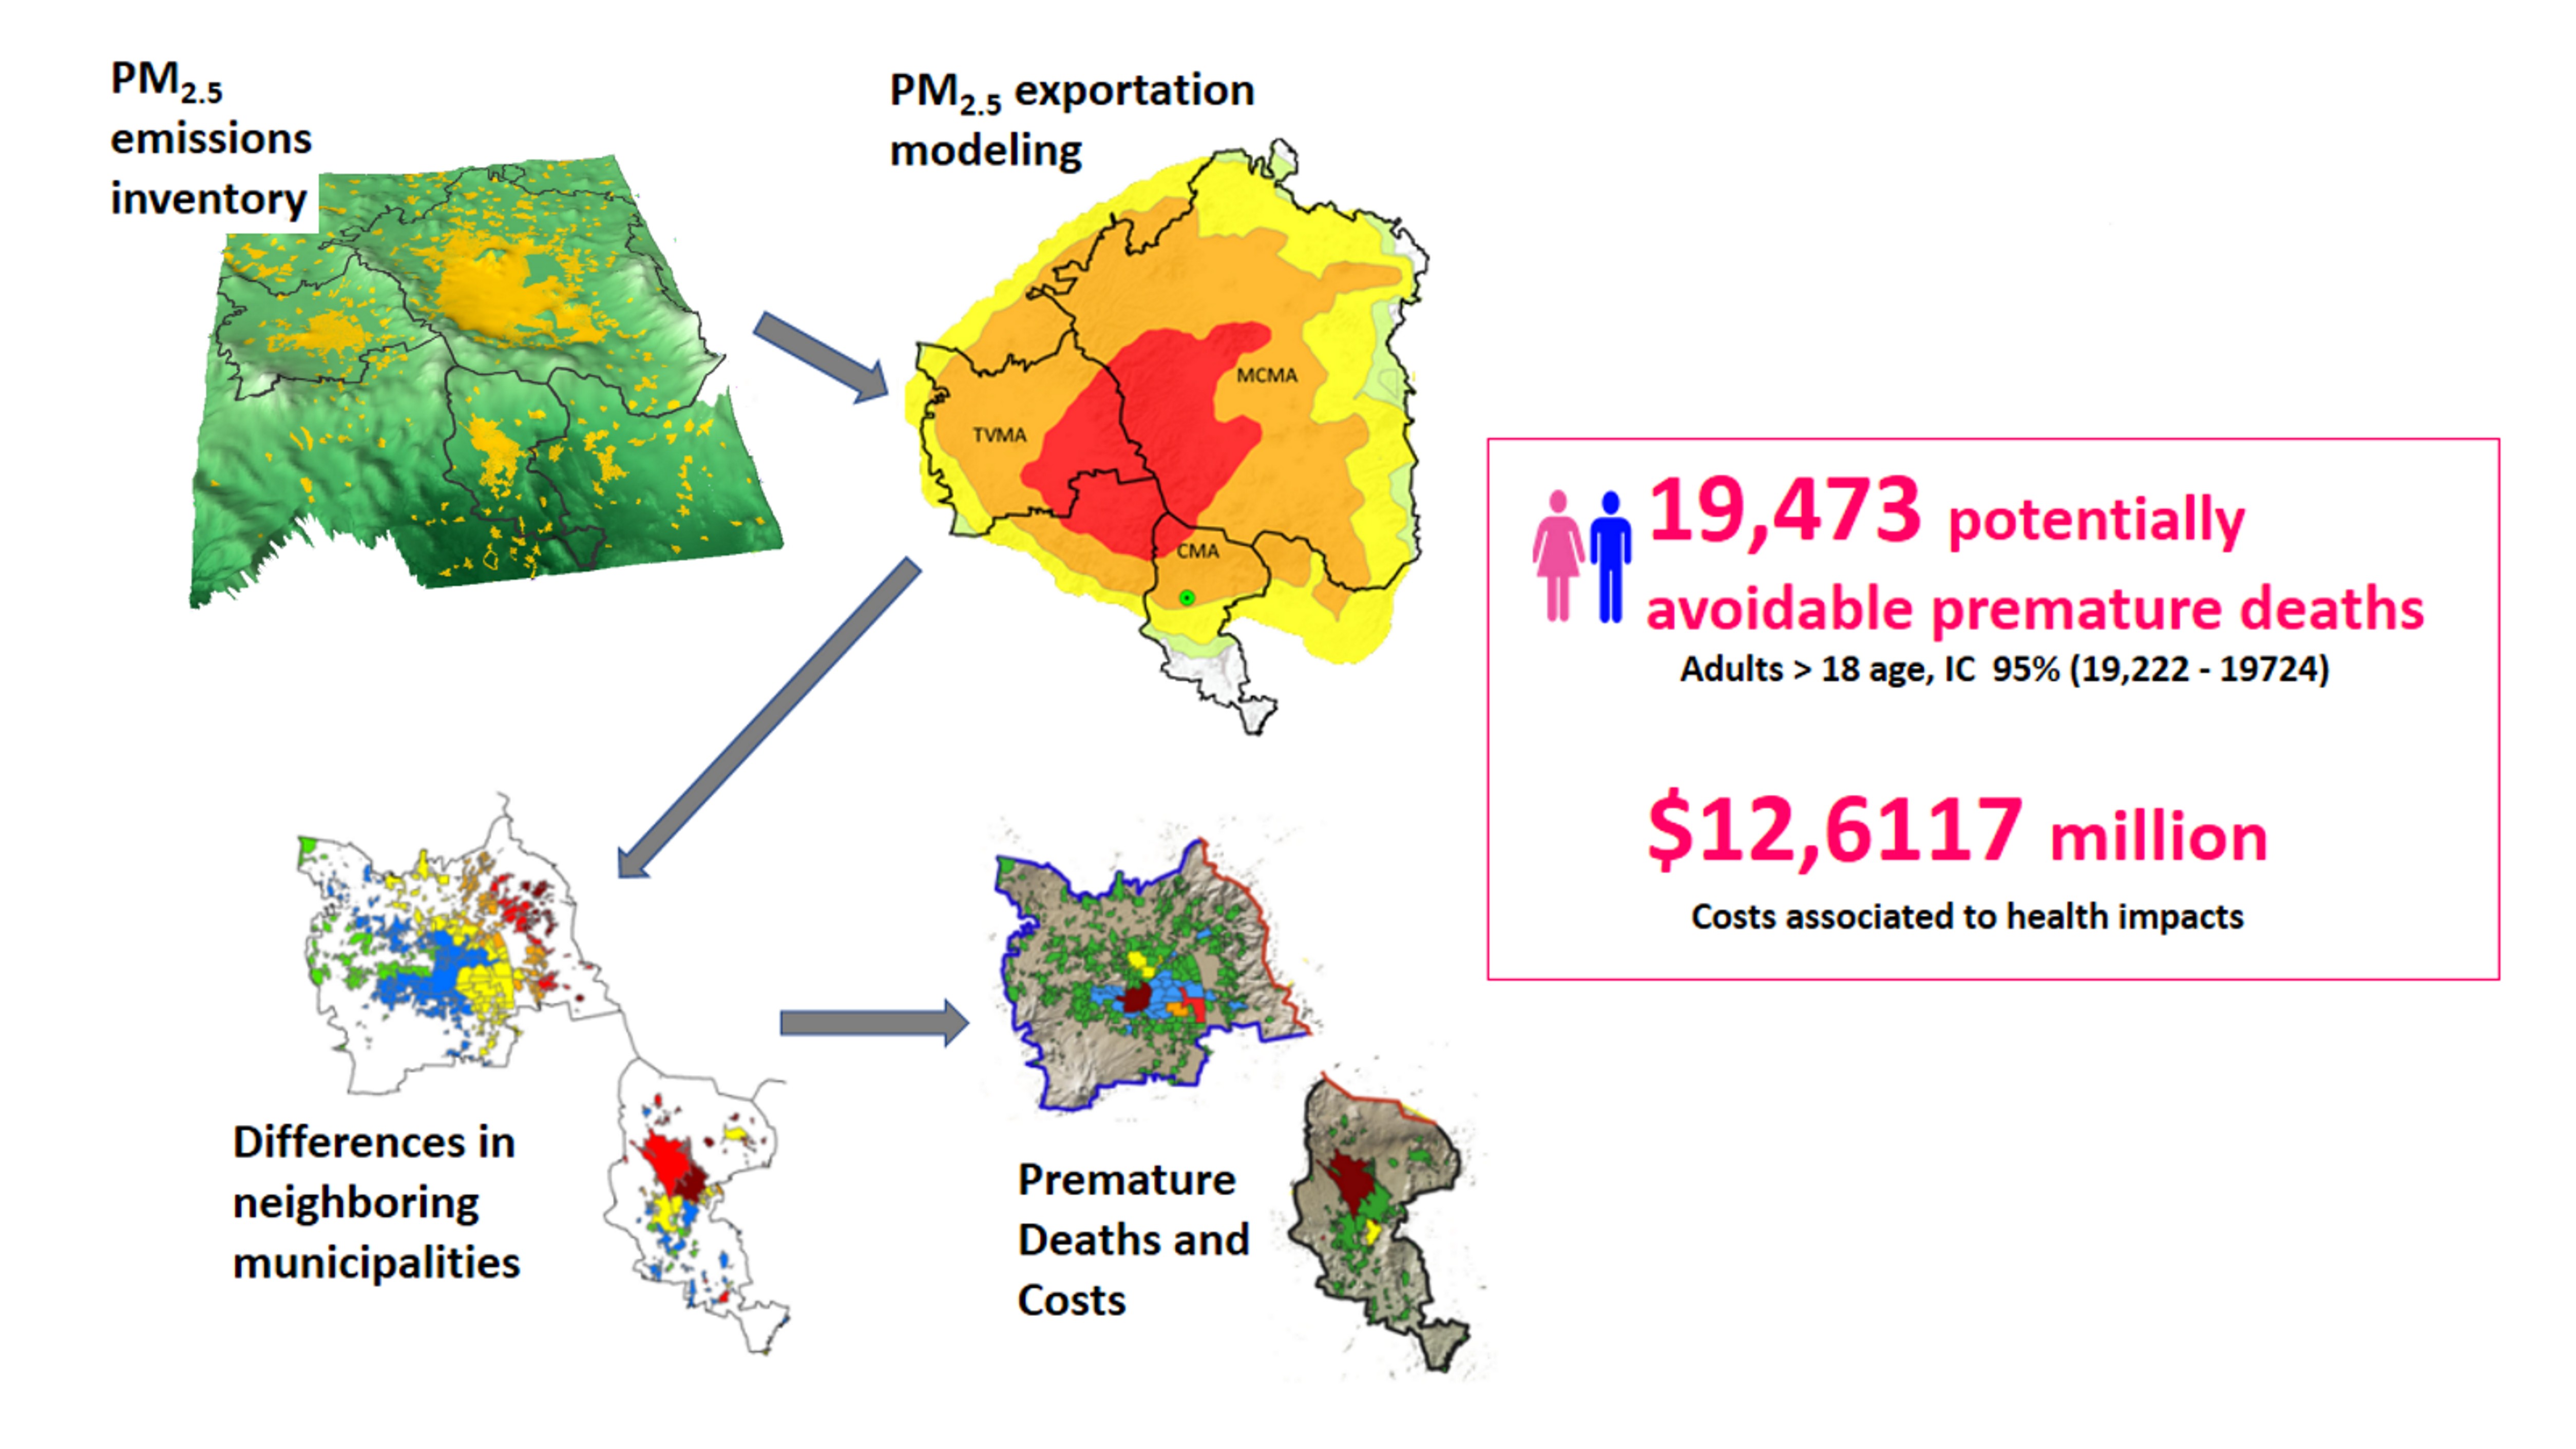
Previous studies have shown that the mass exchange of atmospheric pollutants between airsheds significantly alters the air quality of regions surrounding large urban metropolises. This study presents estimates of potentially avoidable premature mortality and the annual cost that pollutant exchange may impose on receiving areas. The Hysplit model was used to model the exchange of pollutants for the year 2018 among three Mexican metropolitan areas: the México City metropolitan area, as the main exporter of pollutants, and the metropolitan areas of Toluca and Cuernavaca, as recipient areas. The modeling results were processed in ArcGIS®, and the estimated avoidable premature deaths and costs associated with imported PM2.5 were calculated using BenMap. The main results indicate that the export of PM2.5 from the Mexico City Metropolitan Area in 2018 could have resulted in 19,473 potentially avoidable premature deaths in the two recipient metropoli-tan areas. The impact could represent an annual cost of $12,1977 million for the Toluca Valley metropolitan area and $4,140 million for the Cuernavaca metropolitan area.
Keywords:
premature deaths
; PM2.5 particles
; Mexico City
; air pollution exportation
; Toluca
; Cuernavaca
1. Introduction
Airsheds or atmospheric basins are regions with local climatic characteristics. Their formation is related to the orographic features, usually whole valleys among high mountains [1,2,3,4]. Air pollutants are temporally confined in airsheds where air masses exchange between one airshed and the surroundings mainly occurs through orographic channels (mountain passes) [5,6]. Within airsheds there frequently occur the accumulation of atmospheric pollutants due to cyclonic and anticyclonic wind recirculation [7], and subsequently, air flows carry air pollutant masses to open regions or other airsheds. The half-life of particles PM2.5 is estimated between three to fifteen days in the troposphere [8]; consequently, this pollutant can be transported over long distances before being removed by dry or wet deposition [9]. Thus, such export events are more relevant when the emitter atmospheric basin contains a densely urbanized metropolitan area with high pollutant emission rates, because high pollutant loads are carried to other cities, polluting the receiving airshed and worsening the air quality for other populations [10,11]. This impact increases premature mortality in the recipient cities [12], and their health institutions and inhabitants internalize the associated costs.
The export of air pollutants is more relevant when the receiving airshed is densely populated, therefore, the health of many inhabitants could be affected. In the Mexico City Metropolitan Area (MCMA), the main sources of PM2.5 are open burning of waste (2,484 tons year-1), automotive activity (6,224 tons year-1), and industrial combustion (2,169 tons year-1) [13]. PM2.5 is a fine inhalable fraction of suspended particles that can reach the alveolar zone of the lungs, and its toxic compounds can enter the bloodstream [14,15]. The PM2.5 are composed by several harmful substances, such as toxic metals (cadmium, lead), metalloids (arsenic), and hydrocarbon aromatic polycyclic (anthracene, benzo[a]pyrene) [16,17,18,19,20,21,22]. Among the recognized health effects of the PM2.5 are lung cancer, chronic obstructive pulmonary disease, lower respiratory infections, asthma, cerebrovascular and cardiovascular diseases, ischemic heart disease [15,23,24,25,26,27,28].
Researchers and environmental managers use a few metrics to quantify the impact of atmospheric pollution on population health. One of the most useful for comparative purposes are estimates of potentially avoidable premature deaths (PAPDs), and costs based on the value per statistical life (VSL). In agreement with the National Institute Cancer, one premature death is “a death that occurs before the average age of death in a certain population” [29,30]. Analogy, the potentially avoidable premature deaths occur due to avoidable causes, like exposure to environmental pollution. In economic terms, the concept of value per statistical life (VSL) reflects the willingness of a given population to pay for reducing a risk [31,32]. The U.S. Environmental Protection Agency (U.S. EPA) has developed the Environmental Benefits Mapping and Analysis Program (BenMap) [33] for health impact assessment purposes. The BenMap program is indeed used to estimate the PAPDs and the yearly cost associated with air pollution scenarios. BenMap estimates premature mortality using exposure-response functions from the literature. Moreover, the program calculates the costs using the VSL. This program has been used in many studies and is widely accepted worldwide for strategic assessment of air quality policies [34,35,36,37,38].
Users BenMap could prepare scenarios for calculations by applying interpolations of averaged concentrations, or, for greater accuracy, by using dispersion modelling scenarios. The Hybrid Single Particle Lagrangian Integrated Trajectory (Hysplit) can model the dispersion scenarios [39,40]. Hysplit is a widely used model for simulating the transport of atmospheric pollutants [41,42,43,44,45,46]. The Hysplit application for estimation of pollutant interchange between atmospheric basins was demonstrated in a first study authored by this group [10]. The advantage of Hysplit use in these types of studies is its ability to generate output files in formats suitable for post-processing in geographic information systems and, with some geoprocessing algorithms, to automatically process multiple files to produce more detailed estimates of particulate mass exchange.
For the purpose of estimating the yearly impacts associated with atmospheric pollutant mass that receive one population from another densely urbanized airshed, this manuscript displays the results of PM2.5 mass interchange modelling, and potentially avoidable premature deaths and associated costs calculations, using the Hysplit model and the BenMap software, complemented with geoprocesing in ArcMap®, for two metropolitan areas neighboring highly urbanized metropolitan area, particularly neighboring Mexico City Metropolitan Area.
2. Materials and Methods
The Mexico City Metropolitan Area (MCMA) is the biggest urban zone in the Mexico megalopolis, located in the central region of Mexico. This metropolitan area is within an airshed. In the surrounding area, it borders other airsheds containing metropolitan areas, such as the Toluca Valley Metropolitan Area (TVMA) in the Estado de México to the east, and the Cuernavaca Metropolitan Area (CMA) in the Morelos state to the south. The MCMA is the most populated (21 million inhabitants), the most motorized (6.24 million vehicles), and one of the most polluted (14,939 tons year-1 of PM2.5) [13,47]. High levels of atmospheric pollutants are exported from the MCMA to surrounding areas and added to local emissions in other airsheds. For this study, the annual exchange of PM2.5 mass between the MCMA, the TVMA, and the CMA was quantified along with their impacts in terms of PAPD and associated costs.
This study considered point, mobile, and area sources; though natural sources were not so. The hourly emissions rate calculated by Hernández-Moreno et. al. (2023): 860.6 kg hr-1 for the MCMA, 203.8 Kg hr-1 for the TVMA, and 114.2 Kg hr-1 for the CMA. The 2008 PM2.5 emissions inventory was integrated in cells (5x5 km) of a mesh (Figure 1). The reader can consult the PM2.5 emissions values for each cell in the data repository linked to Dataset #1 (see Data Availability Statement section).
The Hysplit model (user account #182) was used to simulate PM2.5 transport across atmospheric basins. Hourly intervals were modeled for each one of the 24 hours of the 30 days of the twelve months of 2018. The meteorological files from the NCEP/NCAR Global Reanalysis Data and the Global Data Assimilation System were downloaded from the National Oceanic and Atmospheric Administration repositories [48]. The output files were post-processed in ArcMap® geographic information system, using our own tools to automatically process large number of output files from Hysplit. The particle mass was calculated applying Eq. 1.

Where, by every i-polygon, M is the mass of PM2.5 in grams [g] dispersed inside one metropolitan area. Ci is the PM2.5 concentration in grams per cubic meter [g m-3]. Ai is the area of the polygon with the Ci concentration, and H is the modeling height in meters [m].
The potentially avoidable premature deaths and their associated costs were calculated using the BenMap program. The scenarios compared were: Alternative (scenery without imports of PM2.5 from MCMA), and Baseline (scenery with PM2.5 imports). This study applied the Krewski health impact function to calculate the premature deaths, assuming that the concentration-response function is log-linear for health impact assessment. This function relates the annual average PM2.5 concentration and the risk estimator (called the beta coefficient, β) according to the following the equation (1) [49]. The associated costs were calculated using the most recent local VSL published by Becerra-Pérez et al. (2024): $0.9 million for the Estado de México, and $0.7 million for Morelos.

Where ∆Y is the change in mortality, Y0 is the baseline mortality rate (incidence), and β is the unit risk coefficient. Figure 2 is a flow diagram that summarizes the processes of modelling and calculus.
3. Results
The modelling results for mass interchange between the MCMA and the TVMA indicate that, in 2018, the PM2.5 mass hourly average in the TVMA originally emitted in the MCMA was equivalent to 565 kg. Figure 3 shows that the particle mass frequently reaches approximately 4,000 kg in the TVMA and 2,000 kg in the CMA. This fact could be related to the airshed area size. The winds blow the neighboring airshed, and their pollutants could be either deposited within the basin or could be blown out. In this atmospheric dynamic, the area of the airshed limits amount of PM2.5 mass present. Moreover, was observed that high quantities occasionally impact the receiving airshed, as the peaks of 10,564 kg and 8,918 kg in the TVMA in May. These exportation peaks could lead to peaks of PM2.5 concentrations in the receiver airshed [10].
January, November, and December were the months when the greatest exportation of particles from MCMA to neighboring airsheds (Figure 4). The characteristic north winds’ in the winter season cause this trend. In the CMA case, the hourly average presence of PM2.5 emitted originally in the MCMA was 284 k. However, an enormous mass of PM2.5 was observed in the summer too. The main difference between impacts between impacts in the TVMA and CMA are related to flow restrictions imposed by the mountain chain between the MCMA and the CMA. These restrictions are more penetrable during the intense summer winds and high temperatures. Strong winds broke the anticyclonic recirculation and crossed the mountain passes.
PM2.5 particulate imports where integrated in grids for modeling in BenMap. Data is available in the repository linked to Dataset #2 (see Data Availability Statement section). Figure 5 displays the results of mortality calculations for PAPD attributable to the increase in PM2.5 mass from the MCMA. The most populated and polluted municipalities are those with the highest incidence of PAPD. The impact of arriving foreign PM2.5 is greatest in regions with high local emission rates of because the health risks do not have a linear behavior (Krewski et al., 2009). The exponential function implies that small increases can have significant impacts. In total, the TVMA and the CMA were estimated at 13,553 PAPD and 5,915 PAPD, respectively. Data is available in the repository linked to Dataset #3 (see Data Availability Statement section).
The three more impacted municipalities of the TVMA are: Toluca de Lerdo (the capital of the Estado de México) with an incidence of 1,354 PAPD (total population of 223,876 inhabitants), San Mateo Atenco with an incidence of 540 PAPD (total population of 88,734 inhabitants), and San Salvador Tizatlalli with an incidence of 425 PAPD (total population of 70,013 inhabitants). It is worth highlighting the level of incidence in Toluca de Lerdo, despite the long distance from the border with MCMA and the considerable distance between these two metropolitan areas.
In the CMA, the municipalities with the highest incidence are Cuernavaca, Calera Chica, and San Agustín Tetlama (2,062, 1,048, and 587 PAPD, respectively). In contrast to the TVMA, the CMA is a predominantly rural region. The total PAPD in the Cuernavaca municipality is higher than in Toluca de Lerdo due to a larger Baseline-Alternative difference.
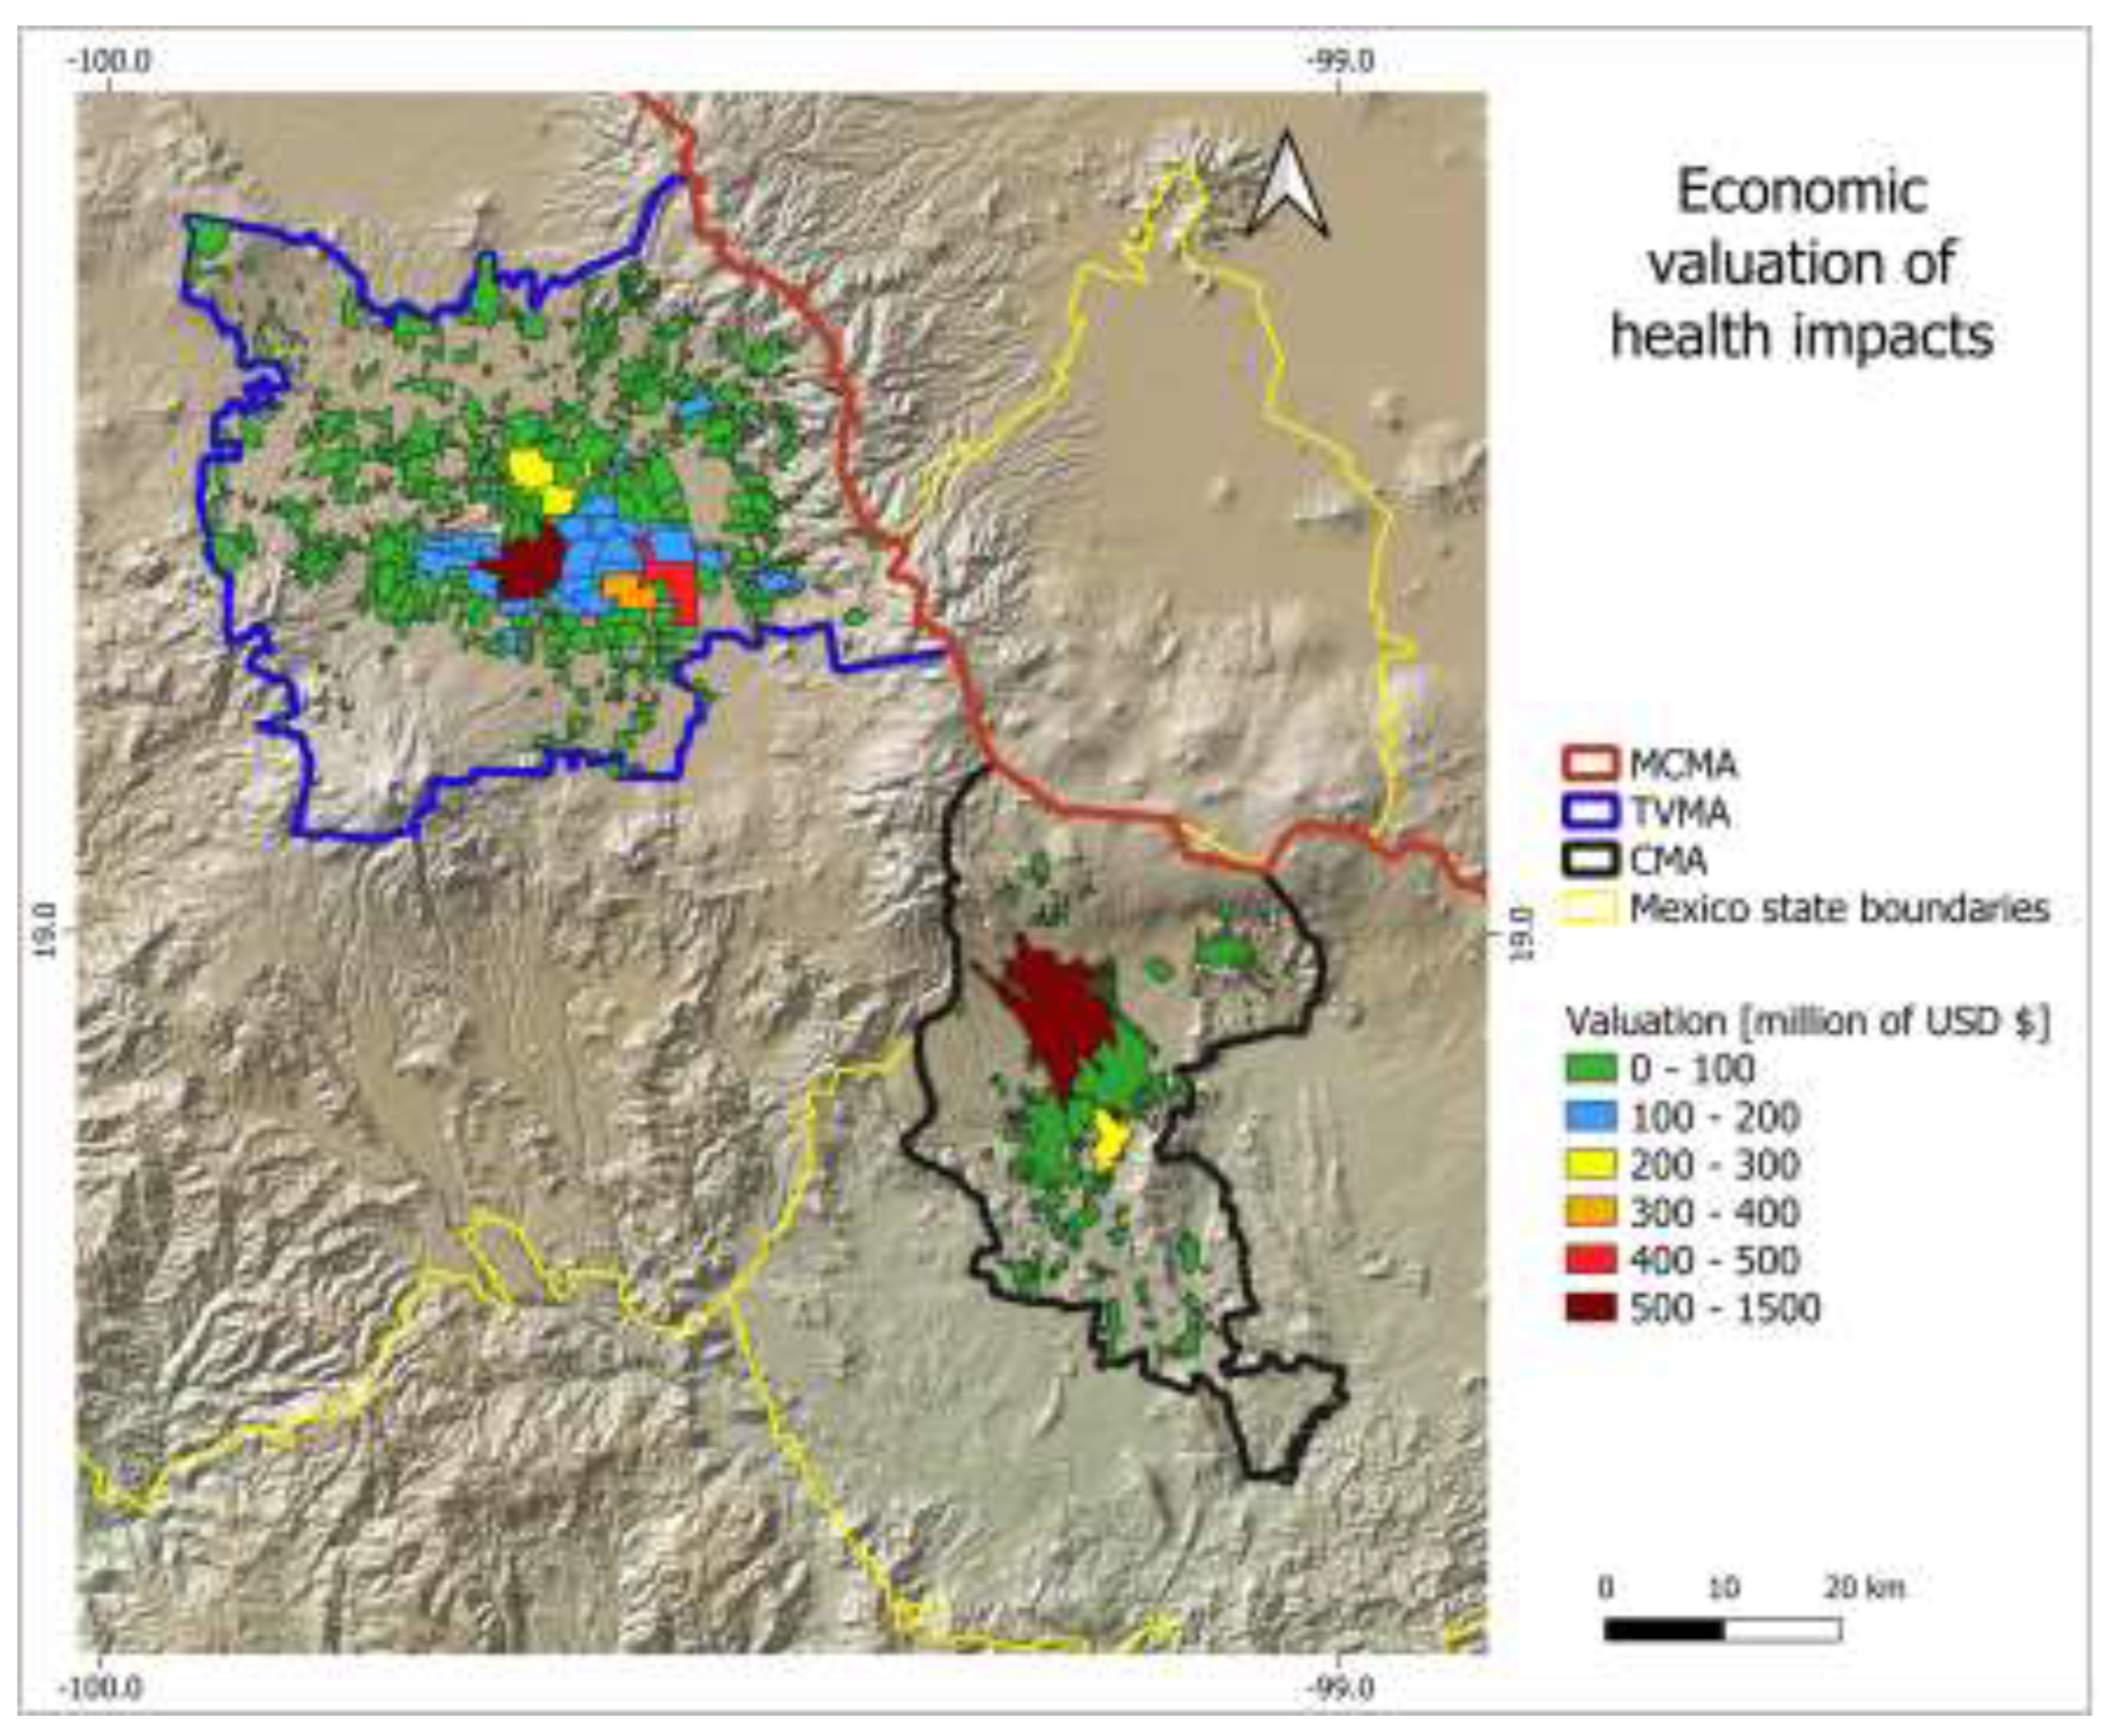
The results of the impact valuation are directly proportional to incidence. Figure 6 shows the georeferenced costs by municipality. The detailed data are available in the Annex 3. The health impacts calculus valued at $12,197.75 million for the TVMA and $4,140.71 million for the CMA. It is important to remember that there the VSL applied to each metropolitan area is different.
4. Discussion
The exchange of atmospheric pollutants has been a subject of growing concern for two decades, and this study demonstrates the relevance of these impacts on mortality and costs. The results of this study indicate that the export of atmospheric pollutants is responsible for thousands of premature deaths and millions of dollars in costs. But the costs are being internalized by the affected populations and states. Each receiver airshed suffers particular impacts, and its orographic characteristics are factors to consider. The TVMA is at 2600 m AMSL (400 meters above the MCMA). This geographic aspect, combined with the dry-cold season, thermal inversions, and increased importation of PM2.5 from the MCMA, could have severe impacts on the health of the population of Toluca. In striking contrast, the CMA is at 1500 m AMSL (700 m below the MCMA). The CMA receives high quantities of PM2.5 mass in the summer and winter seasons. The foreign pollutants are rapidly dispersed southward. However, because the emissions rates are lower, the differences are more significant. Consequently, the impacts are more important.
5. Conclusions
The interchange of atmospheric compounds between airsheds is natural and inevitable. However, the relevance of impacts reveals critically that air policy management should take into account impacts beyond administrative limits. When a government office makes wrong decisions, neighboring populations are negatively affected. It is therefore necessary the conduction of more comprehensive assessments to support decision-making, even for policies applied within a single municipality. Even the policies applied inside just one municipality.
Neighbor populations usually benefit from the economic activity in big cities. However, neighboring health institutions and the population internalize the costs of the pollutants arriving from highly urbanized cities.
The differences in air quality caused by unfavorable policies in neighboring metropolitan areas have a significant impact on surrounding areas. Especially when the receiver area is an airshed, and its pollutant emissions rate is high. How do the neighboring populations internalize the costs of health impacts caused by the pollution coming from one metropolis? What management mechanisms could be implemented to ensure that air quality management policies do not have adverse impacts on the neighboring populations? These are two questions that can be raised from this study for future research.
Author Contributions
Formal analysis, methodology, investigation and writing-original draft preparation, Hernández-Moreno Adolfo. Project administration, resources, writing-review and editing, Mugica-Álvarez Violeta.
Funding
“The author would like to thank to the National Humanities, Science and Technology Council (Conahcyt) for project 316642 funding”.
Data Availability Statement
The original data presented in the study are openly available in. Dataset #1: https://data.4tu.nl/private_datasets/bbqqKnTkLLq7I4E5YHt4YxJDeHg2Vv2Qwx6wT2SD57U Dataset #2: https://data.4tu.nl/private_datasets/3NTtvoIKJXn__qnetLFgh1vYyh97BlfSkv-rfJYdi20 Dataset #3 https://data.4tu.nl/private_datasets/idH7p_sc1FJ-uEE0abGR5nZPEpjksqeS_2Zuc5wIIKM
Acknowledgments
The author would like to thank to the National Humanities, Science and Technology Council (CoNaHCyT) for project 316642 funding.
Conflicts of Interest
The authors declare no conflicts of interest.
Use of Artificial Intelligence
“AI or AI-assisted tools were not used in drafting any aspect of this manuscript”.
Abbreviations
The following abbreviations are used in this manuscript:
| AMSL | Above meters sea leavel |
| BenMap | Environmental Benefits Mapping and Analysis Program |
| CMA | Cuernavaca Metropolitan Area |
| Hysplit | Hybrid Single Particle Lagrangian Integrated Trajectory |
| MCMA | Mexico City Metropolitan Area |
| PAPD | Potentially Avoidable Premature Deaths |
| PM2.5 | Particulate matter with aerodynamic diameters equal to 2.5 micrometers and smaller |
| TVMA | Toluca Valley Metropolitan Area |
| VSL | Value of a Statistical Life |
References
- Khan, A.A.; Kumar, P.; Gulia, S.; Khare, M. A Critical Review of Managing Air Pollution through Airshed Approach. Sustain. Horizons 2024, 9, 100090. [CrossRef]
- Sparling, D.W. Community-Level and Ecosystem-Level Effects of Environmental Chemicals. Ecotoxicol. Essentials 2016, 337–359. [CrossRef]
- Jones, L.; Reis, S.; Hutchins, M.; Miller, J.; He, B.; Seifert-Dähnn, I.; Xu, C.Y.; Hagen-Zanker, A.; Yu, J.; Lin, T.; et al. Airsheds, Watersheds and More – The Flows That Drive Intra-Extra-Urban Connections, and Their Implications for Nature-Based Solutions (NBS). Nature-Based Solut. 2022, 2, 100040. [CrossRef]
- Magaña, V.; Caetano, E. Identificación de Cuencas Atmosféricas En México; Ciudad de México, 2007;
- De Foy, B.; Fast, J.D.; Paech, S.J.; Phillips, D.; Walters, J.T.; Coulter, R.L.; Martin, T.J.; Pekour, M.S.; Shaw, W.J.; Kastendeuch, P.P.; et al. Basin-Scale Wind Transport during the MILAGRO Field Campaign and Comparison to Climatology Using Cluster Analysis. Atmos. Chem. Phys. 2008, 8, 1209–1224. [CrossRef]
- Jazcilevich, A.D.; García, A.R.; Ruíz-Suárez, L.G. A Study of Air Flow Patterns Affecting Pollutant Concentrations in the Central Region of Mexico. Atmos. Environ. 2003, 37, 183–193. [CrossRef]
- Díaz-Esteban, Y.; Barrett, B.S.; Raga, G.B. Circulation Patterns Influencing the Concentration of Pollutants in Central Mexico. Atmos. Environ. 2022, 274, 118976. [CrossRef]
- Seinfeld, J.H.; Pandis, S.N. Atmospheric Chemistry and Physics: From Air Pollution to Climate Change; 2006; ISBN 9780471720188.
- Emmons, L.K.; Apel, E.C.; Lamarque, J.-F.; Hess, P.G.; Avery, M.; Blake, D.; Brune, W.; Campos, T.; Crawford, J.; DeCarlo, P.F.; et al. Impact of Mexico City Emissions on Regional Air Quality from MOZART-4 Simulations. Atmos. Chem. Phys. 2010, 10, 6195–6212, 2010. [CrossRef]
- Hernández-Moreno, A.; Trujillo-Páez, F.I.; Mugica-Álvarez, V. Quantification of Primary PM2.5 Mass Exchange in Three Mexican Megalopolis Metropolitan Areas. Urban Clim. 2023, 51, 101608. [CrossRef]
- CCA-UNAM Diagnóstico Sobre La Calidad Del Aire En Cuencas Atmosféricas de México; Mexico City, 2016;
- Dedoussi, I.C.; Eastham, S.D.; Monier, E.; Barrett, S.R.H. Premature Mortality Related to United States Cross-State Air Pollution. Nature 2020, 578, 261–265. [CrossRef]
- Secretaría del Medio Ambiente de la Ciudad de México (SEDEMA) Inventario de Emisiones de La Zona Metropolitana Del Valle de México 2020; Gobierno de la Ciudad de México: Mexico City, 2023;
- USEPA How Can the Air Quality Index Help? Pollutants. What Is Particle Pollution?
- Sicard, P.; Khaniabadi, Y.O.; Perez, S.; Gualtieri, M.; De Marco, A. Effect of O3, PM10 and PM2.5 on Cardiovascular and Respiratory Diseases in Cities of France, Iran and Italy. Environ. Sci. Pollut. Res. Int. 2019, 26, 32645–32665. [CrossRef]
- Bandowe, B.A.M.; Meusel, H. Nitrated Polycyclic Aromatic Hydrocarbons (Nitro-PAHs) in the Environment – A Review. Sci. Total Environ. 2017, 581–582, 237–257. [CrossRef]
- Ronderos-Lara, J.G.; Millán-Vázquez, F.; Murillo-Tovar, M.A.; Saldarriaga-Noreña, H.A.; Valle-Hernández, B.L.; López-Velázquez, K.; Mugica-Álvarez, V. Atmospheric Estrogenic Semi-Volatile Compounds and PAH in PM2.5 in Mexico City. Atmosphere (Basel). 2025, 16, 178. [CrossRef]
- Valle-Hernández, B.L.; Amador-Muñoz, O.; Jazcilevich-Diamant, A.; Hernández-López, A.E.; Villalobos-Pietrini, R.; González-Oropeza, R. Polycyclic Aromatic Hydrocarbons in Particulate Matter Emitted by the Combustion of Diesel and Biodiesel. Combust. Sci. Technol. 2013, 185, 420–434. [CrossRef]
- Vega, E.; Ruiz, H.; Escalona, S.; Cervantes, A.; Lopez-Veneroni, D.; Gonzalez-Avalos, E.; Sanchez-Reyna, G. Chemical Composition of Fine Particles in Mexico City during 2003-2004. Atmos. Pollut. Res. 2011, 2, 477–483. [CrossRef]
- Venkatraman, G.; Giribabu, N.; Mohan, P.S.; Muttiah, B.; Govindarajan, V.K.; Alagiri, M.; Abdul Rahman, P.S.; Karsani, S.A. Environmental Impact and Human Health Effects of Polycyclic Aromatic Hydrocarbons and Remedial Strategies: A Detailed Review. Chemosphere 2024, 351, 141227. [CrossRef]
- Ventura, L.M.B.; Mateus, V.L.; de Almeida, A.C.S.L.; Wanderley, K.B.; Taira, F.T.; Saint’Pierre, T.D.; Gioda, A. Chemical Composition of Fine Particles (PM2.5): Water-Soluble Organic Fraction and Trace Metals. Air Qual. Atmos. Heal. 2017, 10, 845–852. [CrossRef]
- Park, M.; Wang, Y.; Chong, J.; Lee, H.; Jang, J.; Song, H.; Kwak, N.; Borlaza, L.J.S.; Maeng, H.; Cosep, E.M.R.; et al. Simultaneous Measurements of Chemical Compositions of Fine Particles during Winter Haze Period in Urban Sites in China and Korea. Atmos. 2020, Vol. 11, Page 292 2020, 11, 292. [CrossRef]
- Chen, C.Y.; Huang, K.Y.; Chen, C.C.; Chang, Y.H.; Li, H.J.; Wang, T.H.; Yang, P.C. The Role of PM2.5 Exposure in Lung Cancer: Mechanisms, Genetic Factors, and Clinical Implications. EMBO Mol. Med. 2025, 17, 31–40. [CrossRef]
- Cohen, A.J.; Brauer, M.; Burnett, R.; Anderson, H.R.; Frostad, J.; Estep, K.; Balakrishnan, K.; Brunekreef, B.; Dandona, L.; Dandona, R.; et al. Estimates and 25-Year Trends of the Global Burden of Disease Attributable to Ambient Air Pollution: An Analysis of Data from the Global Burden of Diseases Study 2015. Lancet 2017, 389, 1907–1918. [CrossRef]
- Correia, A.W.; Pope, C.A.; Dockery, D.W.; Wang, Y.; Ezzati, M.; Dominici, F. Effect of Air Pollution Control on Life Expectancy in the United States. Epidemiology 2013, 24, 23–31. [CrossRef]
- Pope, C.A.; Ezzati, M.; Dockery, D.W. Fine-Particulate Air Pollution and Life Expectancy in the United States. N. Engl. J. Med. 2009, 360, 376–386. [CrossRef]
- Wesley, E.J.; Brunsell, N.A.; Rahn, D.R.; Onge, J.M. Saint; Kane, N.J.; Kennedy, K.F.; Wesley, E.J.; Brunsell, N.A.; Rahn, D.R.; Onge, J.M. Saint; et al. Neighborhood Effects on Acute Pediatric Asthma: Race, Greenspace, and PM2.5. Urban Sci. 2024, Vol. 8, 2024, 8. [CrossRef]
- Héluain, V.; Molinier, L.; Mazières, J. Air Pollution and Lung Cancer: A Comprehensive Review. J. Epidemiol. Popul. Heal. 2025, 73, 203152. [CrossRef]
- NCI (National Cancer Institute) NCI Dictionary of Cancer Terms.
- Smith, K.R.; Hanson, H.A. Early Life Influences on Health and Mortality in Adulthood. Int. Encycl. Soc. Behav. Sci. Second Ed. 2015, 752–758. [CrossRef]
- Becerra-Pérez, L.A.; Ramos-Alvarez, R.A.; DelaCruz, J.J.; García-Páez, B. Value per Statistical Life at the Sub-National Level as a Tool for Assessing Public Health and Environmental Problems. Inq. J. Heal. Care 2024, 61, 1–11. [CrossRef]
- USEPA Mortality Risk Valuation.
- Abt Associates Inc BenMAP: Environmental Benefits and Mapping Analysis Program. Prepared for the US EPA Office of Air Quality Planning and Standards.
- He, K.; Lei, Y.; Pan, X.; Zhang, Y.; Zhang, Q.; Chen, D. Co-Benefits from Energy Policies in China. Energy 2010, 35, 4265–4272. [CrossRef]
- Von Stackelberg, K.; Buonocore, J.; Bhave, P. V.; Schwartz, J.A. Public Health Impacts of Secondary Particulate Formation from Aromatic Hydrocarbons in Gasoline. Environ. Heal. A Glob. Access Sci. Source 2013, 12, 1–13. [CrossRef]
- Sacks, J.D.; Lloyd, J.M.; Zhu, Y.; Anderton, J.; Jang, C.J.; Hubbell, B.; Fann, N. The Environmental Benefits Mapping and Analysis Program – Community Edition (BenMAP–CE): A Tool to Estimate the Health and Economic Benefits of Reducing Air Pollution. Environ. Model. Softw. 2018, 104, 118–129. [CrossRef]
- Coffman, E.; Rappold, A.G.; Nethery, R.C.; Anderton, J.; Amend, M.; Jackson, M.A.; Roman, H.; Fann, N.; Baker, K.R.; Sacks, J.D. Quantifying Multipollutant Health Impacts Using the Environmental Benefits Mapping and Analysis Program–Community Edition (BenMAP-CE): A Case Study in Atlanta, Georgia. Environ. Health Perspect. 2024, 132. [CrossRef]
- Getachew, M.; Mekonnen, A.; Fitsum, D. Health and Economic Impact Estimation of Ambient Air Particulate Matter (PM2.5) Pollution in Addis Ababa Using BenMAP-CE Model. Environ. Health Insights 2025, 19. [CrossRef]
- Draxler, R.R.; Hess, G.D. Description of the HYSPLIT_4 Modeling System. NOAA Tech. Memo. ERL ARL-224; NOAA Air Resources Laboratory: Silver Spring, 1997;
- Draxler, R.R.; Hess, G.D. An Overview of the HYSPLIT_4 Modeling System for Trajectories , Dispersion , and Deposition. Aust. Meteorol. Mag. 1998, 47, 295–308.
- Chen, Y.; Luo, Y. Analysis of Paths and Sources of Moisture for the South China Rainfall during the Presummer Rainy Season of 1979–2014. J. Meteorol. Res. 2018, 32, 744–757. [CrossRef]
- Chen, B.; Stein, A.F.; Maldonado, P.G.; Sanchez de la Campa, A.M.; Gonzalez-Castanedo, Y.; Castell, N.; de la Rosa, J.D. Size Distribution and Concentrations of Heavy Metals in Atmospheric Aerosols Originating from Industrial Emissions as Predicted by the HYSPLIT Model. Atmos. Environ. 2013, 71, 234–244. [CrossRef]
- Chatoutsidou, S.E.; Kordonouri, I.; Lazaridis, M. An Air-Quality-Based Analysis of NO, NO2, and O3 at a Suburban Mediterranean Site. Atmos. 2026, Vol. 17, Page 7 2025, 17, 7. [CrossRef]
- Karl, M.; Liu, X.; Liu, Z.; Pei, W.; Zhang, X.; Jie, X.; Yang, Z.; Liu, L.; Gao, Y.; Hu, R.; et al. Source-Specific PM2.5 Exposure and Associated Health Risks During Beijing Winter. Toxics 2025, Vol. 13, Page 1081 2025, 13, 1081. [CrossRef]
- Molozhnikova, Y.; Shikhovtsev, M.; Khodzher, T. Results of a Comprehensive Study on Atmospheric Pollution at the Tankhoi Observation Point (Southeastern Coast of Lake Baikal, Russia): Temporal Variability and Identification of Sources. Environ. 2025, Vol. 12, Page 462 2025, 12, 462. [CrossRef]
- Li, Y.; He, Y.; Wang, Y.; Li, G.; Zhang, X.; Niu, H.; Zhang, Y.; Wang, L. Identification of Local and Transboundary Sources and Mechanisms of PM2.5 and O3 Pollution on the Tibetan Plateau: Implications for Sustainable Air Quality Governance. Sustain. 2025, Vol. 17, Page 10853 2025, 17, 10853. [CrossRef]
- Comisión Ambienal de la Megalópolis [CAMe] Programa de Gestión Federal Para Mejorar La Calidad Del Aire de La Megalópolis 2017 - 2030; Ciudad de México, 2018;
- NOAA PSL Physical Sciences Laboratory Available online: https://psl.noaa.gov/.
- Krewski, D.; Jerrett, M.; Burnett, R.T.; Renjun, M.; Hughes, E.; Shi, Y.; Turner, M.C.; Pope, C.A.; Thurston, G.; Calle, E.E.; et al. Extended Follow-Up and Spatial Analysis of the American Cancer Society Study Linking Particulate Air Pollution and Mortality; Health Effects Institute: Boston, Mass., U.S.A., 2009;
Figure 1.
Metropolitan areas and the mesh of PM2.5 emissions inventory associated with square cells.
Figure 1.
Metropolitan areas and the mesh of PM2.5 emissions inventory associated with square cells.
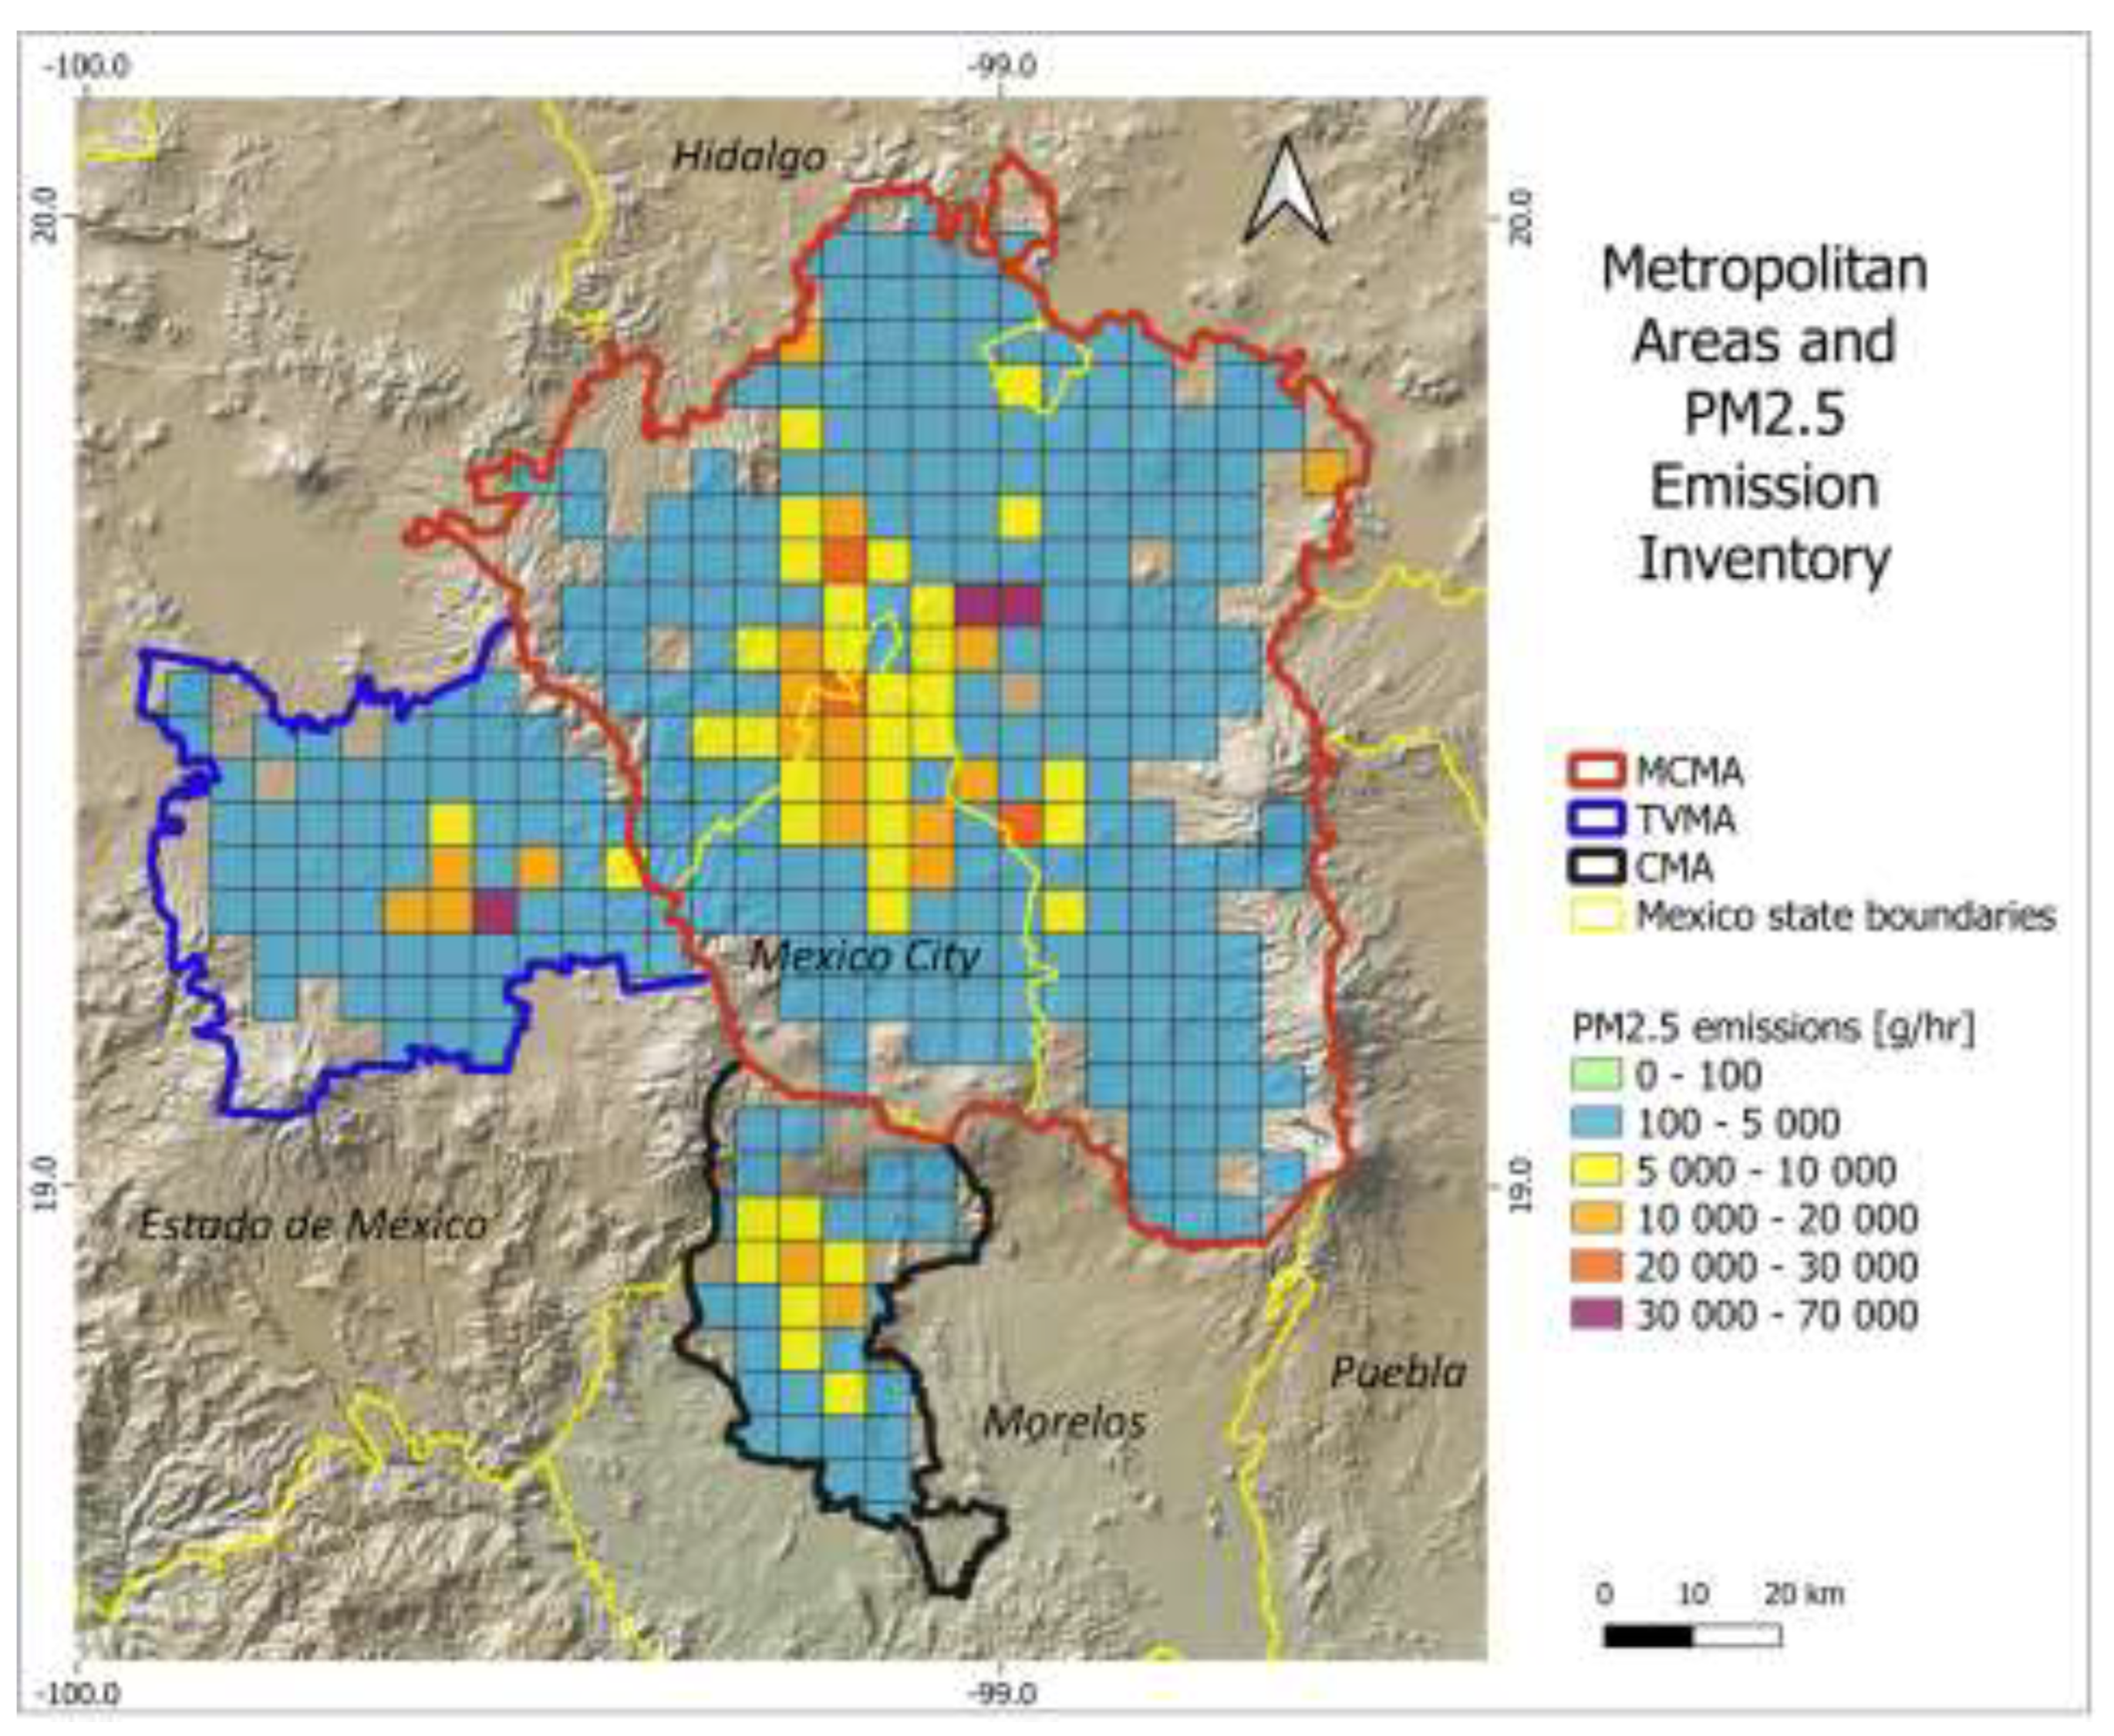
Figure 2.
Flow diagram for impacts modeling process.
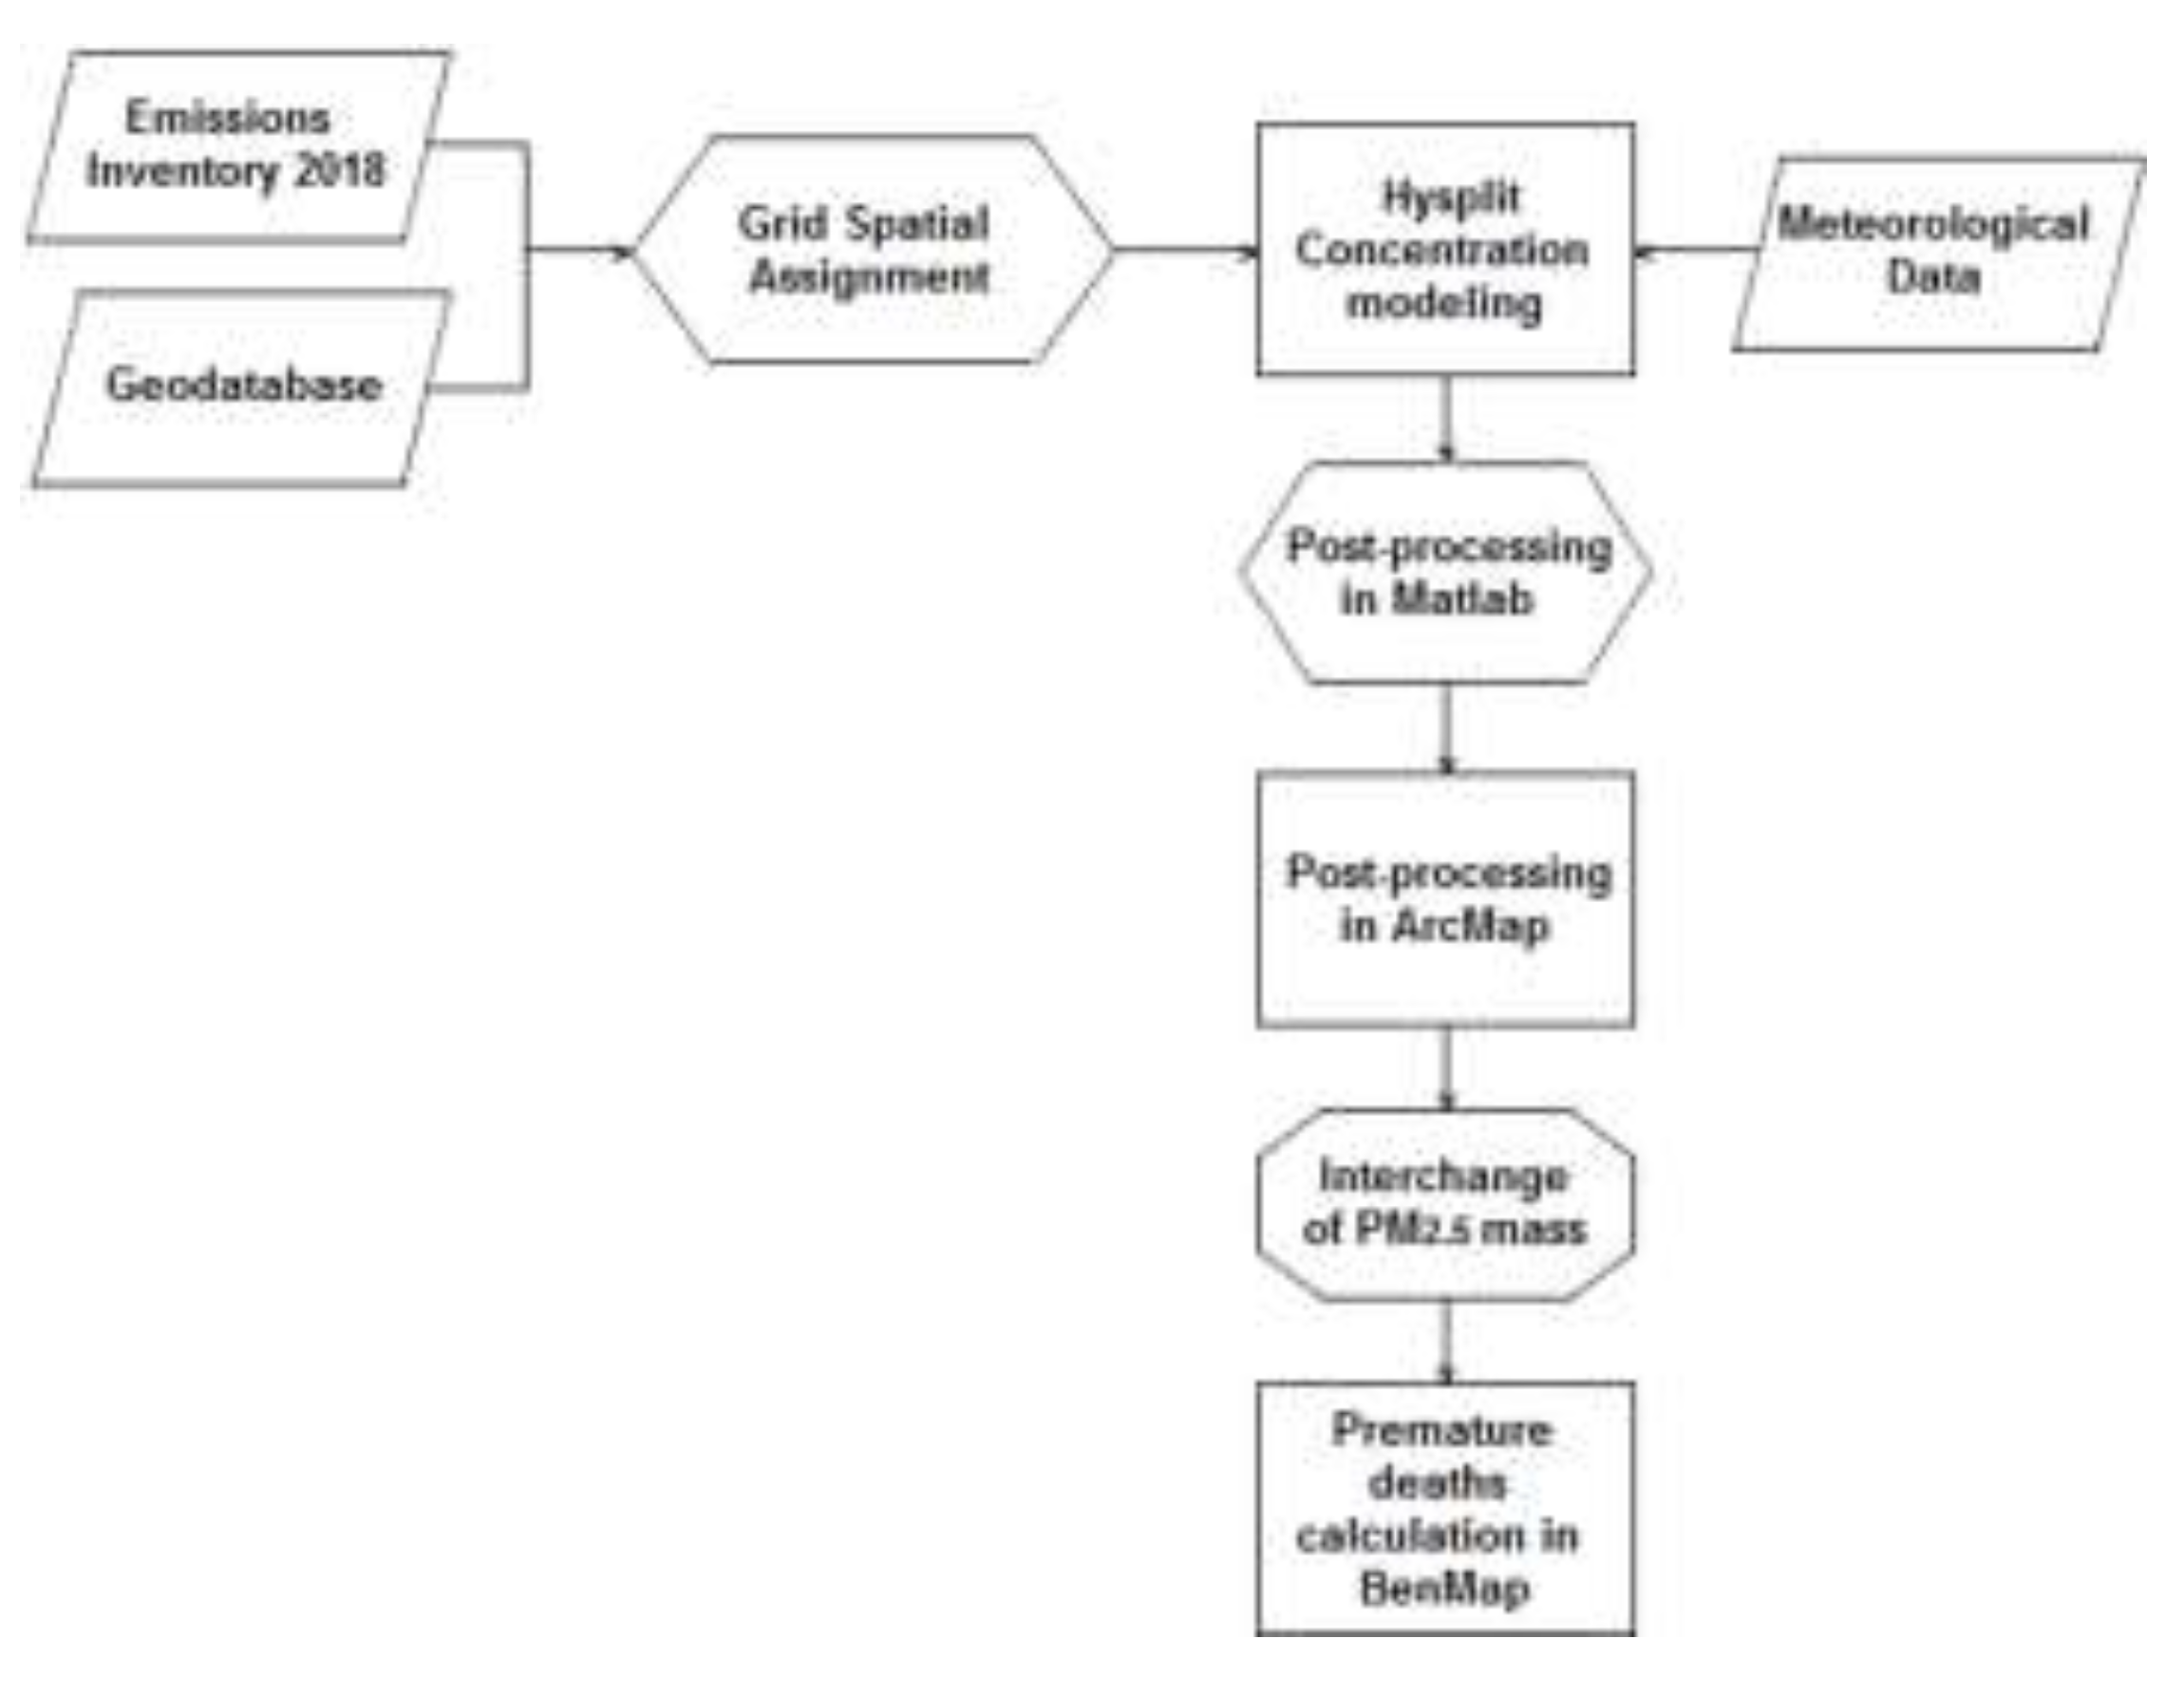
Figure 3.
Hourly PM2.5 mass exports. (a) Particles PM2.5 exported from MCMA to TVMA. Particles PM2.5 exported from MCMA to CMA.
Figure 3.
Hourly PM2.5 mass exports. (a) Particles PM2.5 exported from MCMA to TVMA. Particles PM2.5 exported from MCMA to CMA.
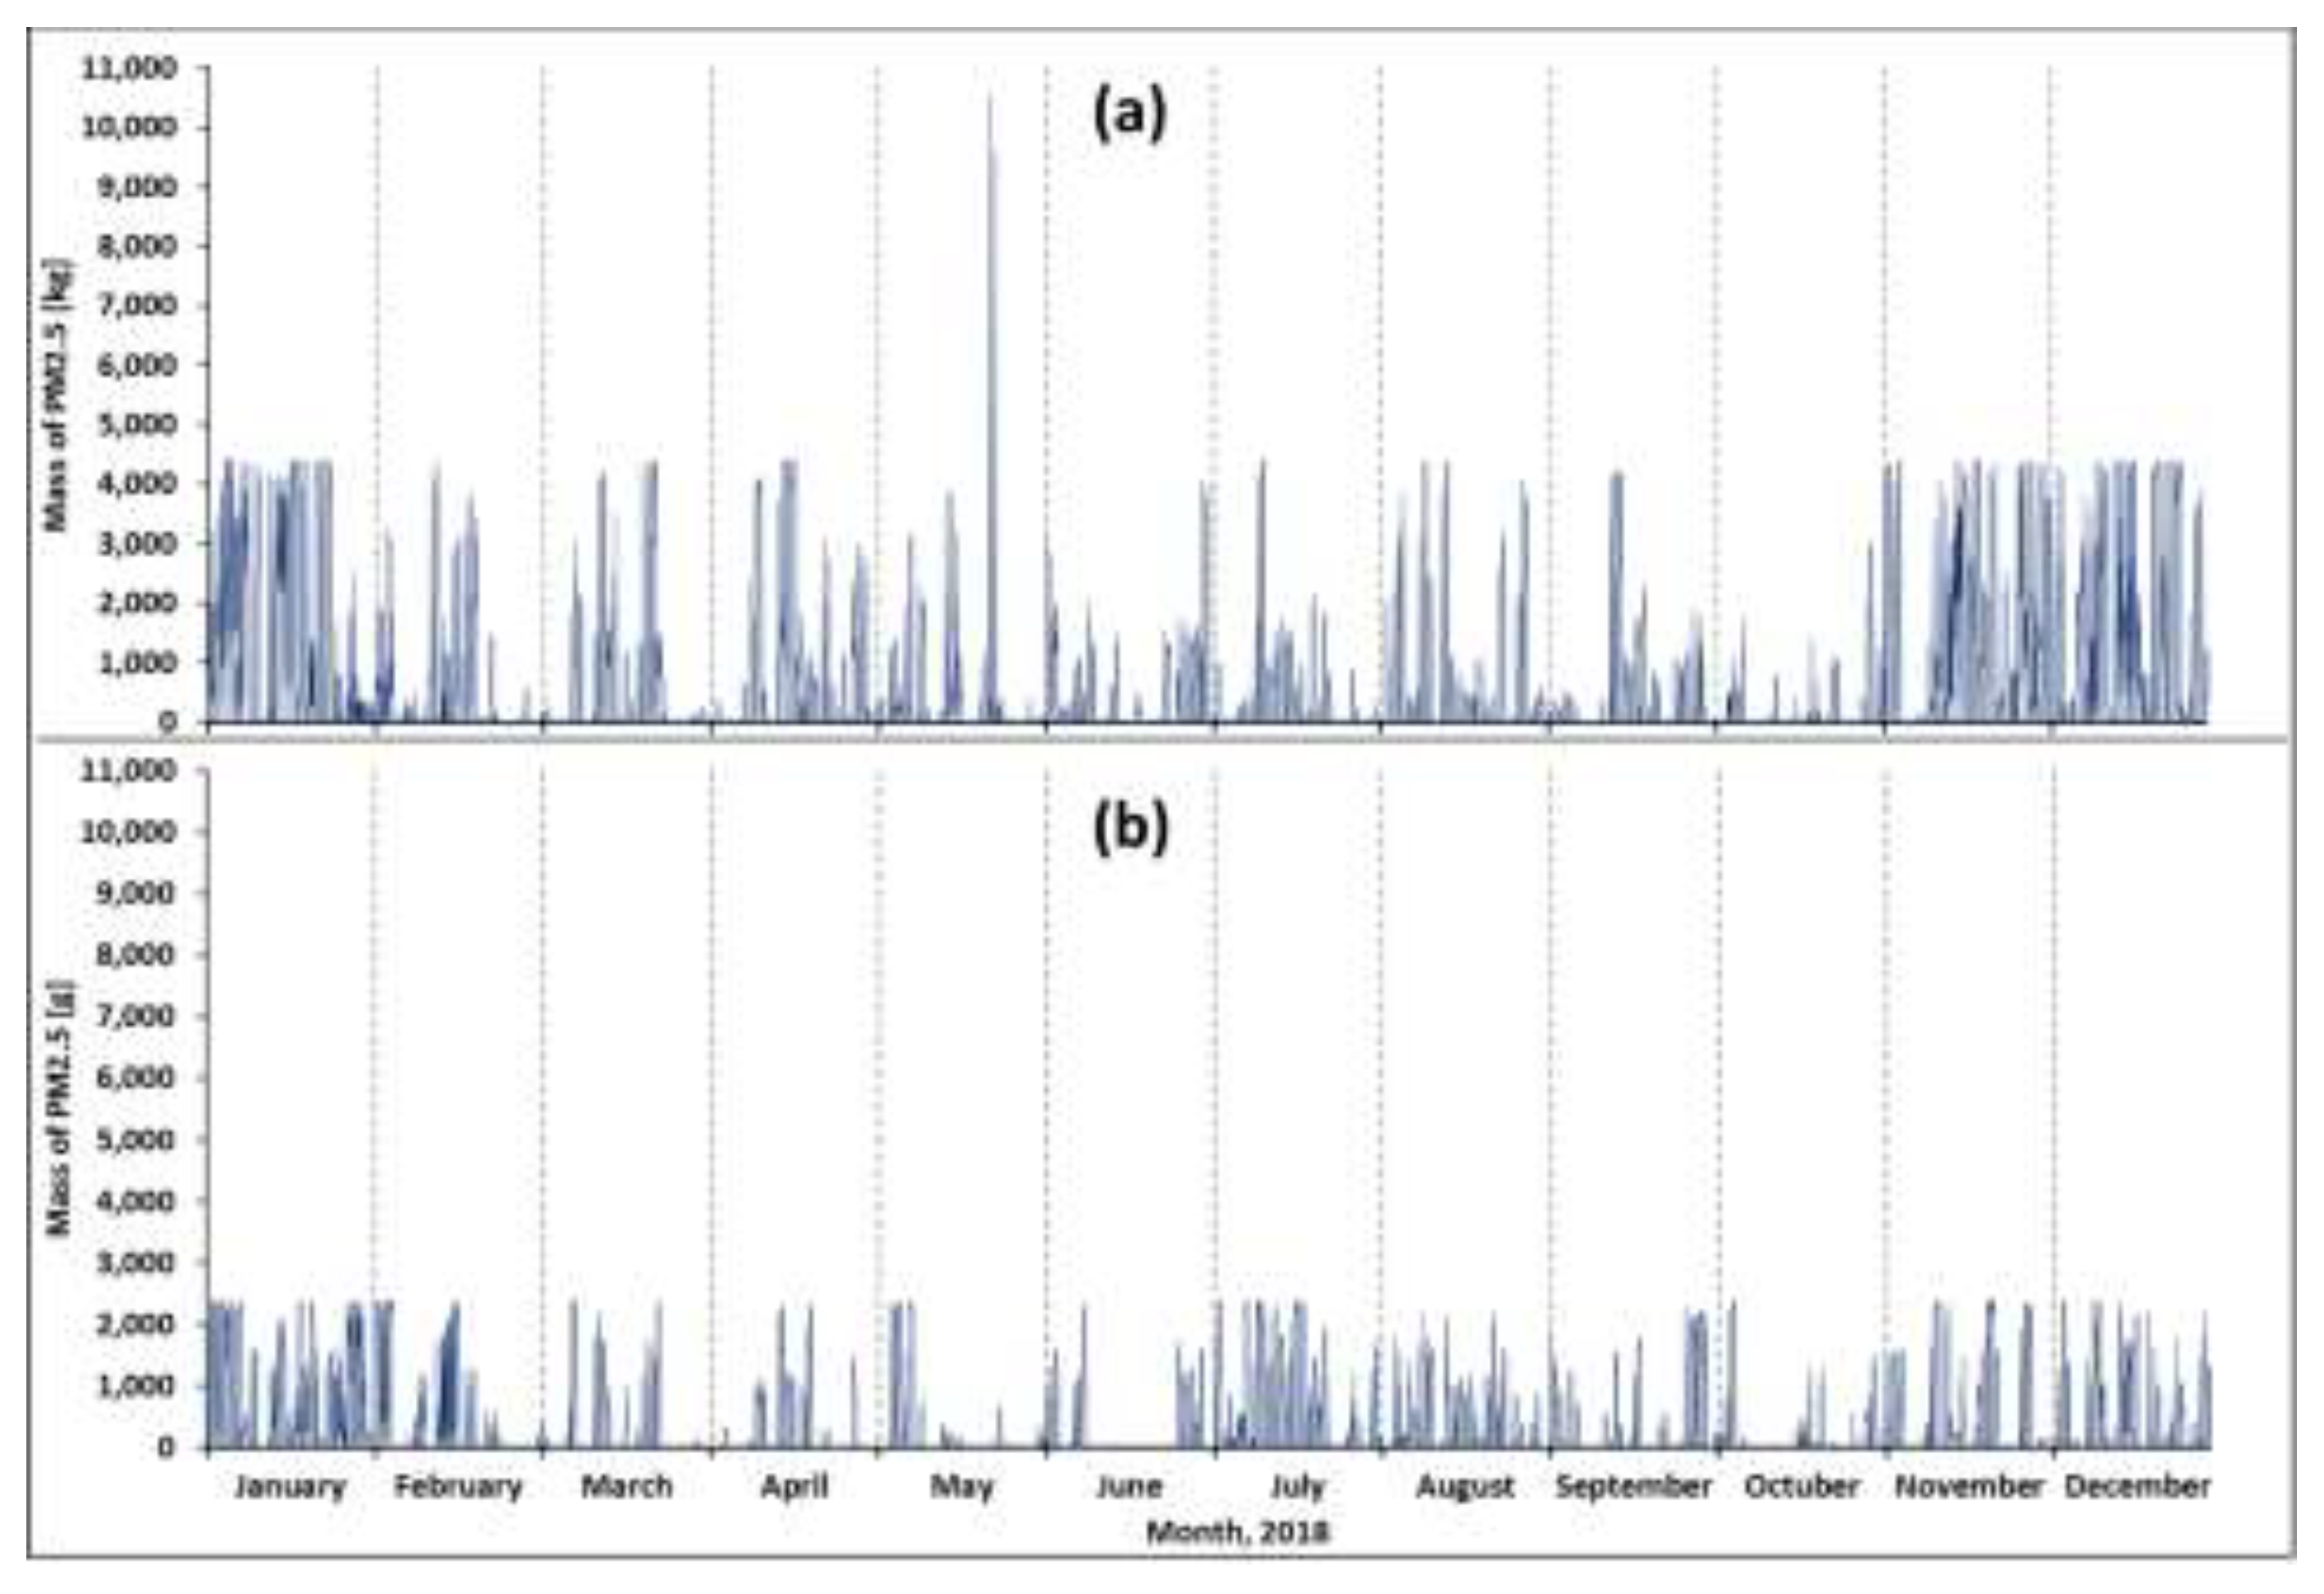
Figure 4.
Monthly distribution of imported PM2.5 mass. (a) Toluca Valley metropolitan area. (b) Cuernavaca metropolitan area.
Figure 4.
Monthly distribution of imported PM2.5 mass. (a) Toluca Valley metropolitan area. (b) Cuernavaca metropolitan area.
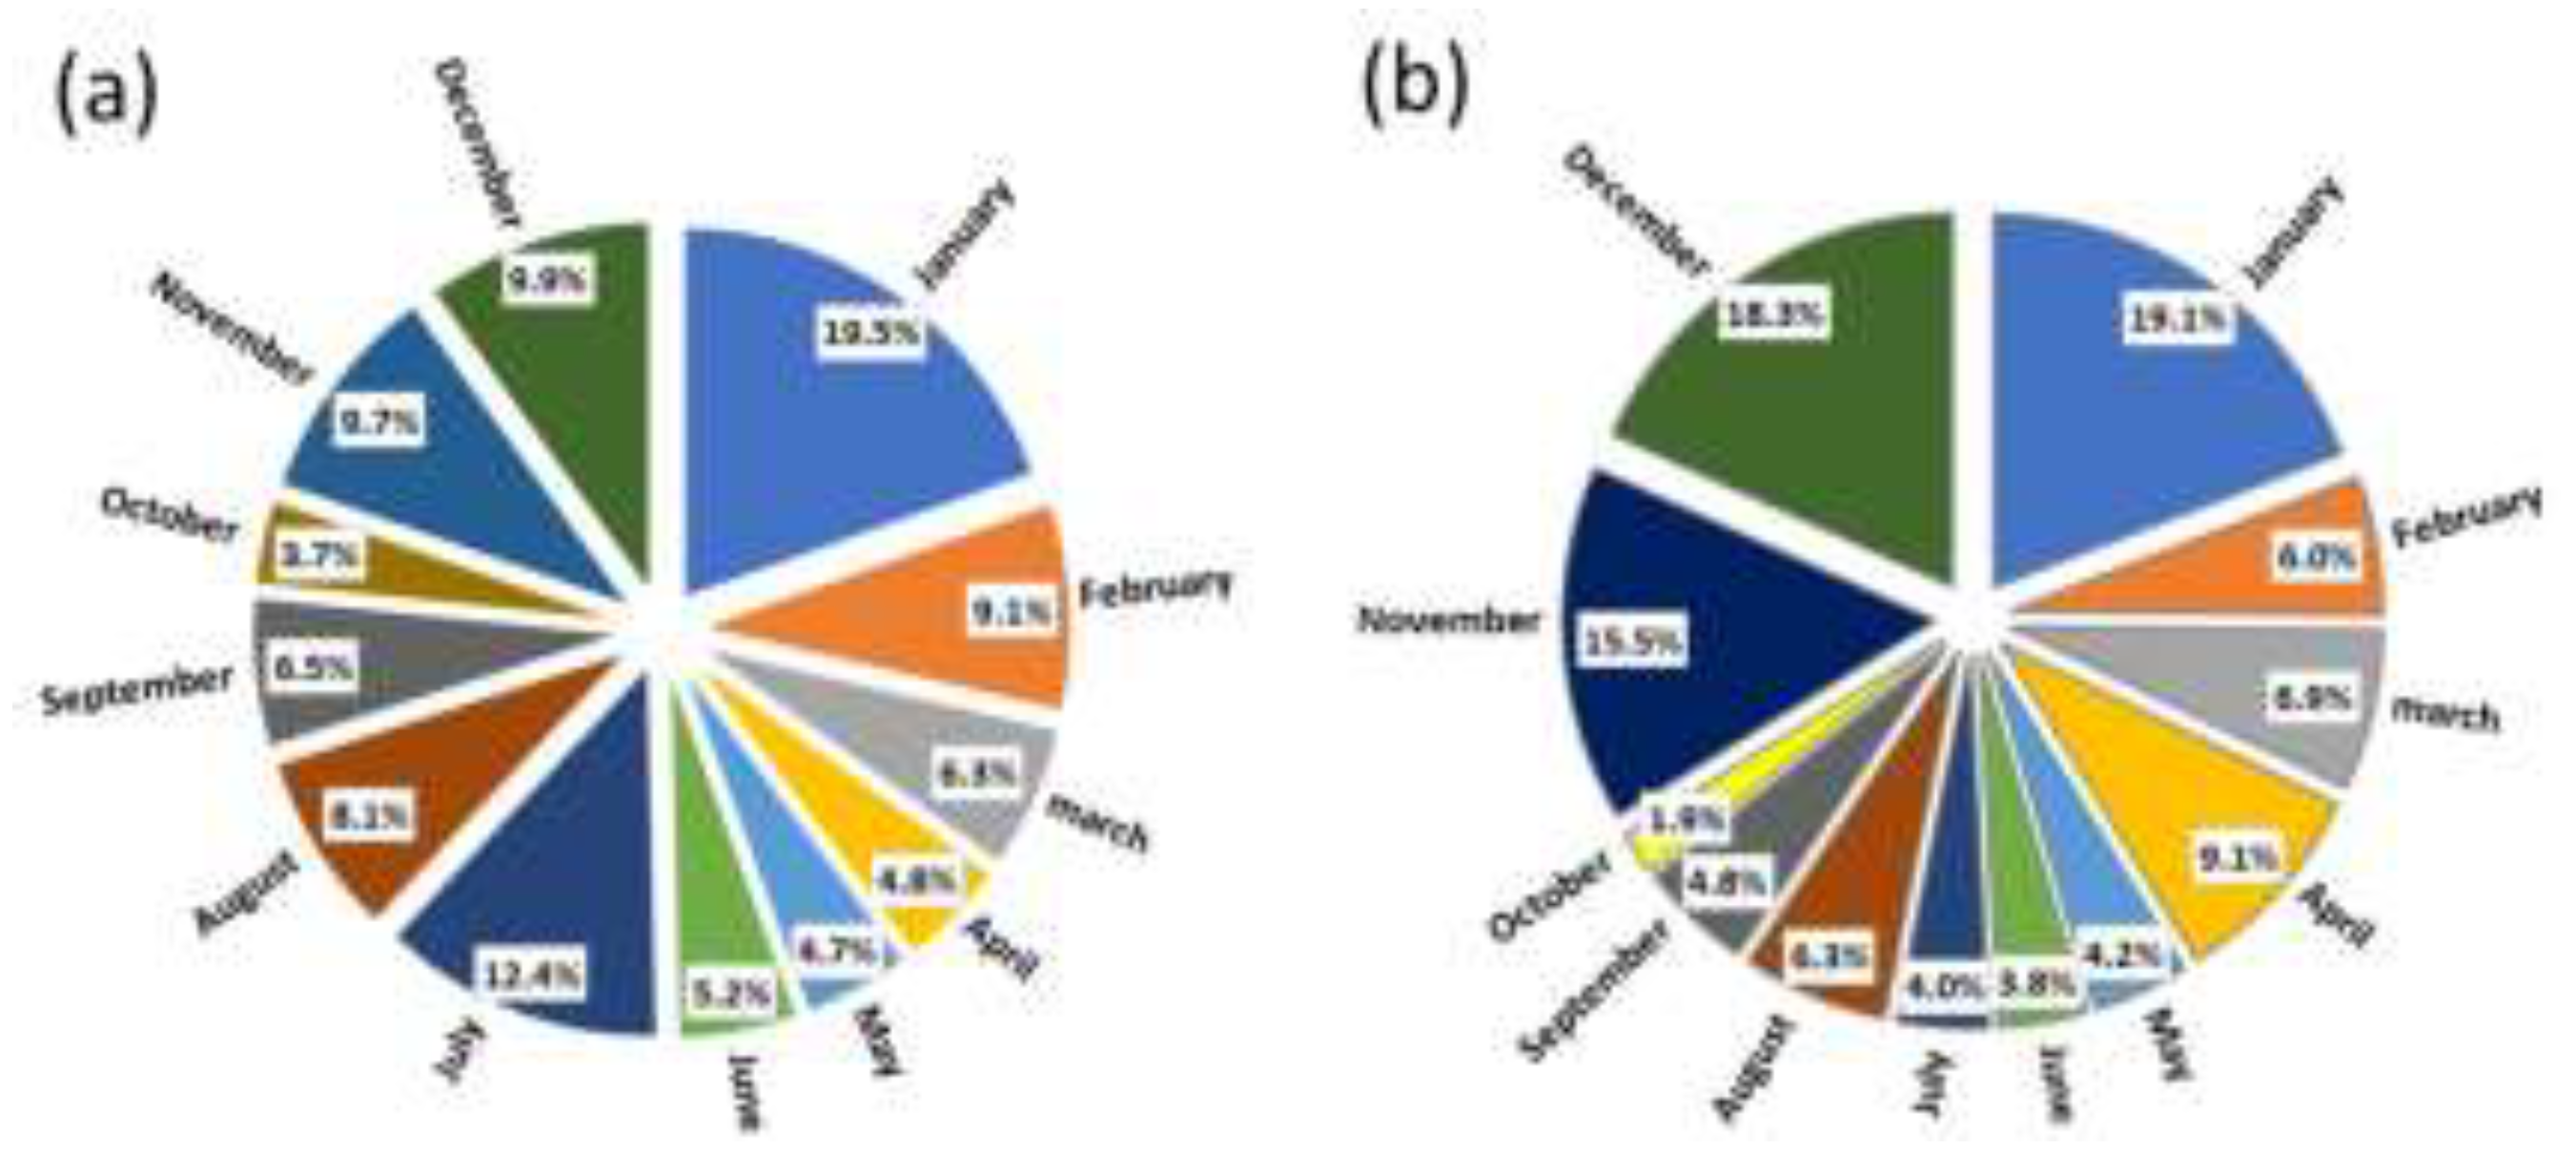
Figure 5.
Estimate of the incidence of PAPD in the TVMA and in the CMA due to MCMA PM2.5 exports.
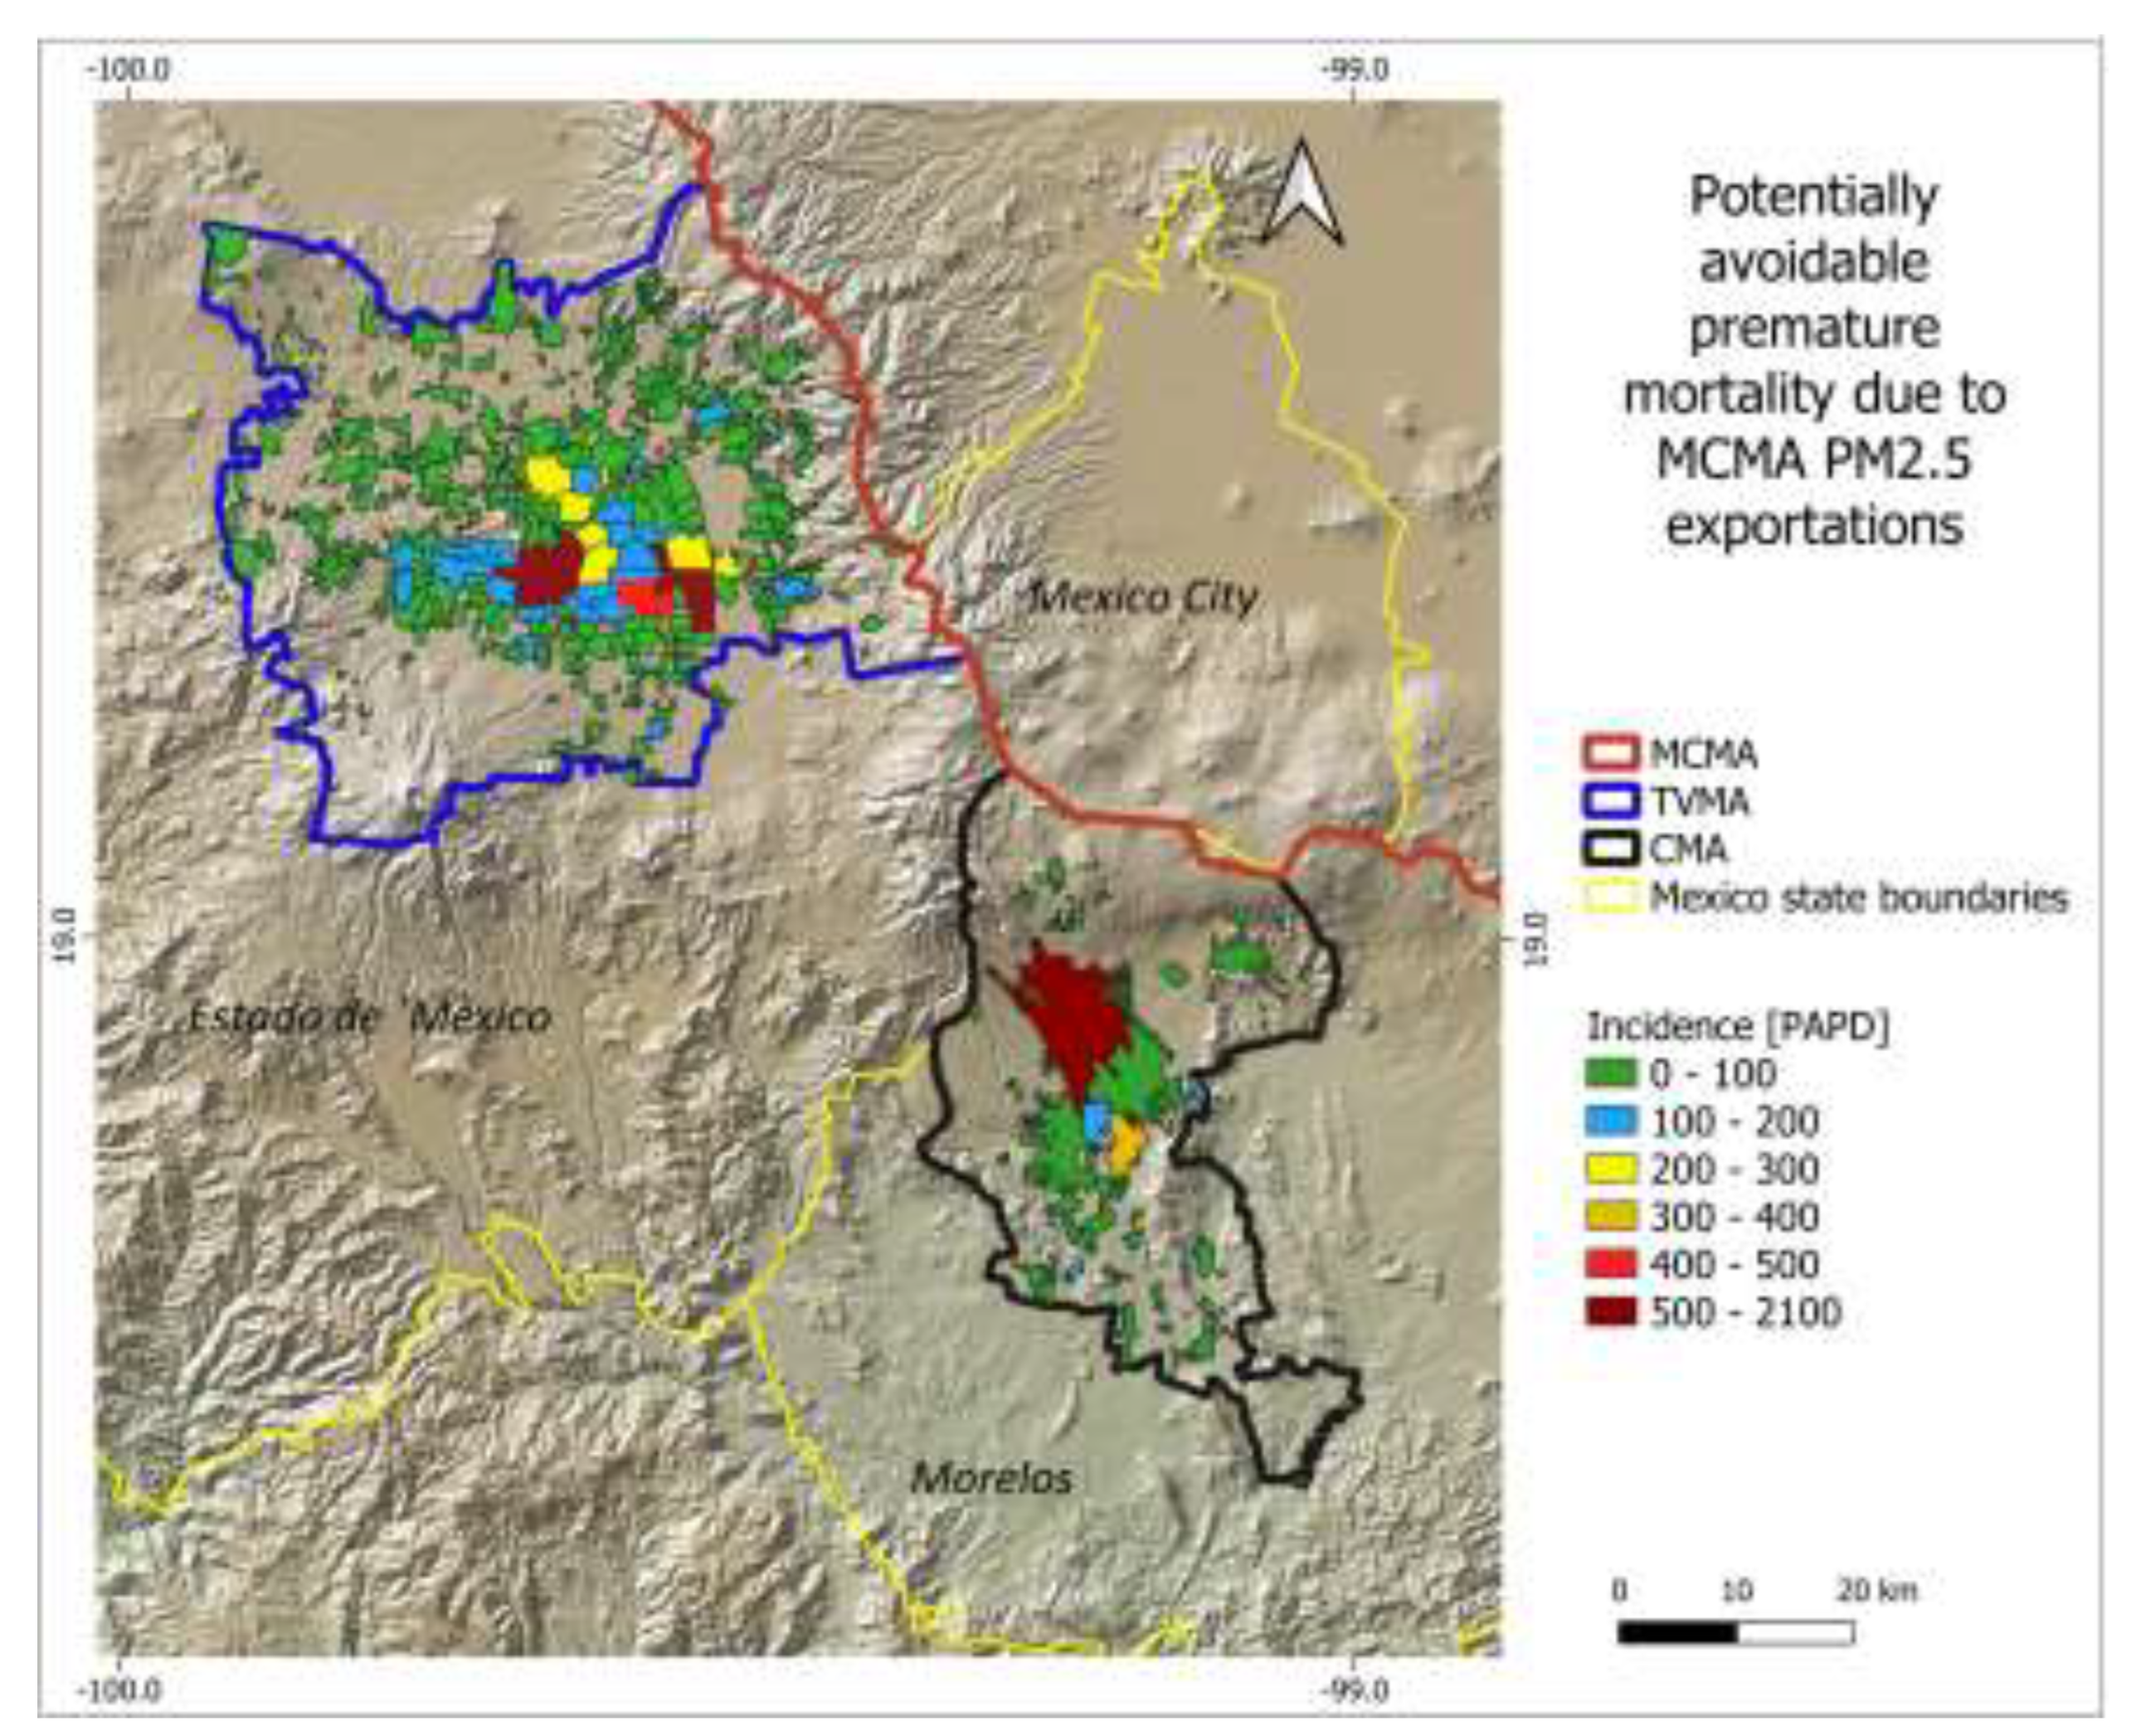
Figure 6.
Economic valuation of health impacts applying the current specific VSL.
Disclaimer/Publisher’s Note: The statements, opinions and data contained in all publications are solely those of the individual author(s) and contributor(s) and not of MDPI and/or the editor(s). MDPI and/or the editor(s) disclaim responsibility for any injury to people or property resulting from any ideas, methods, instructions or products referred to in the content. |
© 2026 by the authors. Licensee MDPI, Basel, Switzerland. This article is an open access article distributed under the terms and conditions of the Creative Commons Attribution (CC BY) license (http://creativecommons.org/licenses/by/4.0/).
Copyright: This open access article is published under a Creative Commons CC BY 4.0 license, which permit the free download, distribution, and reuse, provided that the author and preprint are cited in any reuse.


