Submitted:
26 January 2026
Posted:
28 January 2026
You are already at the latest version
Abstract
Sub-Saharan Africa continues to shoulder the heaviest burden of malaria. The 2024 World Health Organisation (WHO) malaria report highlighted that Africa contributed an alarming 94% of the global cases and 95% of the deaths. In the WHO African region, progress towards elimination and management of malaria is hindered by weak health systems and a lack of traditional diagnostic methods such as microscopy and malaria Rapid Diagnostic Tests (mRDTs). The primary aim of this paper is to develop a machine learning (ML) ensemble model for malaria diagnosis using clinical and demographic data, tailored for resource-limited settings. A retrospective study was conducted using 637 patient records from Gutu Mission Hospital and Gweru Provincial Hospital in Zimbabwe. Clinical symptoms (fever, chills, abdominal pain, headache and diarrhea) and demographic features (age, gender, residence and travel history) were analysed. Data preprocessing included handling class imbalance using the Synthetic Minority Oversampling Technique (SMOTE) and feature selection using Recursive Feature Elimination (RFE). Seven individual ML models, including Logistic regression (LR), Random Forest (RF), Decision Trees (DT), Gradient Boosting (GB), K-Nearest Neighbour (KNN), Naive Bayes (NB) and XGBoost were trained and evaluated on the malaria dataset. The individual models were further combined to build, train and evaluate ensemble models such as Bagging, Stacking, Soft Voting and AdaBoost. Model performance was assessed using accuracy, precision, confusion matrices, recall, F1 score, and AUC-ROC metrics. Clinical symptoms (chills: p-value=0.001, fever: p=0.003, diarrhea: p=0.01, abdominal pain: p< 0.001) were statistically significant predictors of malaria. Of the demographic factors, only travel history (p=0.02) showed a significant association with malaria. Among the seven individual ML models, GB achieved the highest predictive performance (Accuracy =0.94), followed by RF (Accuracy =0.94) and XGBoost (Accuracy =0.93). The stacking ensemble model outperformed all individual ML models and other ensemble models (bagging, soft voting and AdaBoost), achieving accuracy =0.96, precision =0.95, recall =0.98, F1 score =0.96 and AUC-ROC =0.98. This study demonstrates that ML, particularly ensemble models, can be used to improve malaria diagnosis significantly. The integration of these models into a web-based application could provide a scalable and accessible diagnostic tool for healthcare workers in resource-limited settings.
Keywords:
malaria diagnosis
; machine learning
; ensemble models
; resource-limited settings
1. Introduction
More than half of the world population is affected by malaria, a parasitic disease that remains a major public health problem [1]. The 2024 World Health Organisation (WHO) malaria report estimates that 263 million cases with 597000 deaths occurred in 2023. The malaria report also highlights that the WHO African regions, especially Sub-Saharan Africa, continues to shoulder the heaviest burden, contributing of the cases and of the deaths globally [2]. Malaria disproportionately affects the rural areas, especially poor communities with limited to no access to healthcare [3,4]. Annually, over five million people are at risk of contracting malaria in Zimbabwe. Zimbabwe malaria statistical reports indicated 16794 cases and 32 deaths in the first half of 2024 [5]. Of those cases, 199 were children under five years of age, an indication of the persistent burden of malaria within the country. Many at-risk groups continue to miss out on needed services to prevent, diagnose and treat malaria [2].
Malaria is an infectious disease caused by the Plasmodium parasite [6,7]. The most severe malaria cases are caused by the Plasmodium falciparum species [7,8]. Traditional parasitology diagnostic methods, such as malaria Rapid Diagnostic Tests (mRDTs) and microscopy, are widely used for malaria diagnosis [9]. Microscopy is the gold standard for malaria diagnosis since the early 20th century, but it is time-intensive, requires skilled personnel, and is prone to variability in accuracy depending on operator expertise [10,11]. Similarly, mRDTs are one of the most efficient tools used to accurately determine a patient’s malaria status. Still, their sensitivity is reduced at low parasite densities, producing false-negative or false-positive results [11,12]. Resource-limited settings are usually affected by the absence of a definitive diagnosis, which is a serious obstacle to treatment compliance, efficacy, and clinical care of severe malaria cases [8,13].
Traditional statistical methods, such as logistic regression (LR) and time series analysis, have been used in malaria research to identify risk factors and model malaria prevalence [14]. However, they have been found to depend on data assumptions, focus on explanation over prediction, and struggle with high-dimensional clinical data, but are very useful in understanding malaria trends [14,15]. Machine Learning (ML), a subfield of Artificial Intelligence (AI) that focuses on developing the algorithms that can learn patterns and relationships from data without being explicitly programmed, offers an alternative to supporting malaria diagnosis in resource-limited settings [16,17,18].
A study focusing on ML for malaria prediction using clinical and demographic features was carried out in Uganda [3]. Individual classifiers such as Random Forest (RF), Support Vector Machines (SVM), Gradient Boosting (GB), Decision Trees (DT), Naive Bayes (NB) and K-Nearest Neighbors (KNN) were used to build models using the clinical and demographic features [3]. The individual ML model performance was evaluated using metrics such as accuracy, precision and recall, and they all achieved a good performance [3]. Ensemble models such as bagging, AdaBoost, soft and hard voting and stacking were created from the individual models. The ensemble models outperformed the individual classifiers, achieving over 0.98 across the same metrics [3].
In Yumman Province, China, a study compared the performance of traditional time series models and deep learning algorithms for malaria prediction [8]. The autoregressive integrated moving average (ARIMA), seasonal and trend decomposition using Loess (STL+ARIMA), back propagation artificial neural network (BP-ANN), and long short-term memory (LSTM) network models were applied separately in simulations using malaria data and meteorological data [8]. GB regression trees were used to combine the four models (ARIMA, STL+ARIMA, BP-ANN and LSTM) through stacking [8]. The findings reported that predictive performance of the stacking ensemble model was superior to that of the individual models, indicating that stacking may have significant implications for malaria disease prediction [8].
Despite the increasing volume of research utilising ML methods for malaria prediction and diagnosis, several significant gaps persist. First, numerous current studies depend on laboratory-based data [19,20] or microscopy images [21,22], that are frequently inaccessible in resource-limited environments. Second, although individual ML models have demonstrated encouraging outcomes in malaria predictions [23], there has been insufficient focus on the systematic assessment of ensemble learning approaches for malaria diagnosis utilising routine clinical and demographic information. Third, the majority of existing research is geographically concentrated outside of Southern Africa [24,25,26,27,28,29], which restricts the contextual relevance and generalizability of their results to nations like Zimbabwe, where malaria continues to be endemic, and healthcare resources are limited [5,30,31].
In addressing these challenges, this paper aims to bridge the existing gap by developing and evaluating an ensemble ML framework for malaria diagnosis, utilising readily available clinical symptoms and demographic characteristics. By leveraging retrospective patient data from Gutu Mission Hospital and Gweru Provincial Hospital in Zimbabwe, this research systematically compares the performance of several individual machine learning classifiers with ensemble learning techniques, including bagging, voting, and stacking. A particular focus is placed on assessing whether ensemble models can significantly enhance diagnostic accuracy, robustness, and generalizability compared to individual classifiers.
2. Materials and Methods
2.1. Study Design and Data Collection
This paper followed the methodology described in Figure 1. A retrospective quantitative study was conducted using anonymised patient records from Gweru Provincial Hospital (urban setting) and Gutu Mission Hospital (rural setting) in Zimbabwe, selected to represent high and low malaria transmission areas.
2.2. Inclusion and Exclusion Criteria
Patient records from January 2022 to December 2024 with a confirmed malaria diagnosis (positive/negative) either through microscopy or mRDTs, with comprehensive clinical and demographic data, were included in this study. However, records with missing key variables, such as malaria test results, cases with co-infections such as typhoid, or ambiguous diagnostic outcomes, were excluded from the study.
2.3. Sample Size and Sampling Procedure
This paper used the entire dataset of eligible records, 637 participants tested for malaria with complete details from Gutu Mission Hospital and Gweru Provincial Hospital. The dataset consisted of participants who tested either positive or negative for malaria using microscopy or mRDTs.
2.4. Dependent and Independent Variables
The outcome variable for this study, referred to as malaria status, is a binary variable that captures whether the patient was positive or negative for malaria. The predictors included clinical symptoms (fever, chills, headache, abdominal pain, diarrhea (binary variables)) and demographic features (age, gender, residence and travel history).
2.5. Data Preprocessing
A Microsoft Excel file was created for the malaria dataset to facilitate data pre-processing in R version 4.5.1. Data pre-processing in this paper comprised data cleaning, feature selection, class-imbalance handling, data encoding, and data splitting.
2.6. Data Cleaning
Data entry typos, wrong numerical values and incorrect data formats were identified by comparing the paper-based medical records and the computed spreadsheet, and they were corrected to align with the original dataset. Duplicate records were checked for by verifying key identifiers such as patient ID and test date, and were removed to avoid redundant data from skewing the ML models. The dataset was then checked for outliers to make sure no extreme values might affect predictive accuracy. Data points with extreme values were capped, which means replacing extreme values with upper and lower threshold values.
2.7. Feature Selection
Variance inflation factor (VIF) and Pairwise Pearson correlation coefficients () were used to study the relationships between the variables. Recursive Feature Elimination (RFE) guided by RF was used for feature selection, choosing the most effective features for model building.
2.8. Handling Class Imbalance
An imbalanced dataset is when one class outnumbers the other [32]. This imbalance can lead to biases towards the majority class [33]. The majority of the malaria diagnosis results from the collected data were negative (562) compared to the 75 positive cases, very underrepresented in a study comprising 637 participants. Synthetic Minority Oversampling Technique (SMOTE) was used to address data imbalance using the SMOTE function in R. This was done through creating synthetic samples for the minority class by interpolating between existing minority class [34,35].
2.9. Data Encoding
One-Hot encoding was used to change categorical variables into numerical representations to make them compatible with ML algorithms. Age was grouped into categorical bins (0-5 years, 6-15 years, 16-30 years, 31-45 years, 46-60 and 61+ years) (Table 1). The decision to categorise age was based on clinical and epidemiological literature, which has successfully proven that working with age bins for malaria-related studies takes into consideration that malaria incidence and severity vary non-linearly across age groups and effectively improves model performance [36,37,38].
2.10. Data Splitting
The dataset was split using stratified sampling into training, evaluation and testing sets at a ratio of 70:20:10, respectively. The 70% for training allows for sufficient model training, and the 20% for evaluation ensures there is enough data for hyperparameter tuning and evaluation of model performance. The for testing was used for the final evaluation of model performance and was strictly unseen during training and hyperparameter tuning to provide an unbiased estimate for the model’s performance on unseen data.
2.11. Individual Model Selection and Training
Seven individual ML classification algorithms were selected and trained to evaluate their contributions to specific ensemble methods. The models included LR, GB, KNN, XGBoost, RF, DT, and NB. Model selection was guided by a comprehensive review of the literature on malaria status prediction [3,16,39]. All seven models were trained using 70% of both the balanced and unbalanced datasets to compare their predictive performance.
2.12. Hyperparameter Tuning
Optimisation of model performance was done by tuning hyperparameters relevant to specific ML classifiers. Lasso regression was used to prevent overfitting and improve the generalisation of LR. LR was also trained on 5 fold cross-validation to improve performance.
RF and XGBoost were tuned using Grid Search. The hyperparameter mtry in RF was tested for values and 10-fold cross-validation was applied to verify for favourable parameter settings. For XGBoost, the hyperparameters tuned included the number of trees, learning rate and maximum depth. 5 cross-fold validation was used to evaluate the most favourable hyperparameters for XGBoost.
Cross-validation-based pruning was used for DT. It was applied to optimise the tree’s complexity and prevent overfitting using the rpart function in R. Random search was used for tuning hyperparameters for KNN, where tune length was set to 10 to allow KNN to explore a range of values for k. For GB, Bayesian optimisation was used to tune the hyperparameters such as the number of trees, learning rate and tree dept. Cross-validation was used for NB, and tuneLength was set to 10.
2.13. Ensemble Model Selection and Building
Using ensemble techniques through the integration of various ML classification algorithms has proven to achieve greater precision performance compared to utilising a solitary technique [40,41]. The study employed bagging, stacking, soft voting and adaboost.
Bagging works by reducing variance and preventing overfitting by training multiple models on different subsets of the training data and averaging their predictions [42,43]. RF was preferred for the bagging method as it uses multiple decision trees during training [44]. Training of the bagging model was done using the randomForest function in R.
Stacking uses basic-level meta classifiers and amalgamates them with meta-learner classifiers [43,45]. The base learners used for stacking are and XGBoost and LR as the base classifier. Prediction models were first obtained from each of the base models. A new dataset (predictions_stacked) was created, and it contained all base learners and the actual target variable (Diagnosis).
Soft Voting used LR, RF, DT, KNN, GB, NB and XGBoost as base models. These base models were averaged, and the predicted probabilities were combined [46]. AdaBoost used the ada package in R, with 100 iterations per iteration. AdaBoost adjusts the weights of misclassified instances to improve the performance of weak learners [45,47].
2.14. Individual and Ensemble Model Performance Evaluation
The individual and ensemble models were evaluated on their performance in malaria prediction using metrics such as accuracy, recall, precision, confusion matrix, F1 score and AUC-ROC. Predictions and predicted probabilities were generated for each model, and the performance metrics were calculated and compared. For ensemble models, the same metrics were used to assess the effectiveness. Model performance was also compared between individual and ensemble models.
2.15. Ethical Review
Ethical approval was obtained from Gweru Provincial Hospital’s Research Ethics Committee and Gutu Rural District Hospital’s Research Ethics Committee. Measures were implemented to ensure any ethical issues relating to the study were addressed. All patient identifiers, such as names, national identification numbers, and contact details, were removed during data collection. For issues related to data security, the dataset was kept secure and accessible to authorised people only.
3. Results
3.1. Analysis of Demographic and Clinical Variables Associated with Malaria Diagnosis
A total of 637 participants with an age range of 1 to 90 years were included in this paper. The mean age was 30.7 years, indicating a wide variation in participant ages. Out of the 637 participants were from Gweru Provincial Hospital while were from Gutu Mission Hospital. The distribution of gender was similar between groups, with no significant difference observed in their diagnosis results (, Table 2).
However, participants who tested positive were significantly more likely to report fever ( vs. 0.002), chills ( vs. ), diarrhea ( vs. ), and abdominal pain ( vs. ) compared to those who tested negative (Table 2). A higher proportion of positive cases had a recent travel history ( vs. ) and resided in rural areas ( vs. ). No significant differences were observed in the distribution of headache or age groups between the two diagnosis categories (Table 2).
3.2. Feature Selection
A correlation analysis of selected numeric and binary-encoded variables (age, gender, headache, fever, abdominal pain, diarrhoea, chills and travel history) confirmed that the predictors are relatively independent of each other. The pairwise Pearson correlation coefficients () (Figure 2) show that most of the correlations are close to zero, indicating weak linear relationships between variables. The highest observed correlation was between chills and fever, with a coefficient of -0.40. Travel history showed weak to negligible correlations with all other features, except a moderate negative correlation with age ().
VIF values for the predictors were all below 5, indicating no significant collinearity among predictors (Table 3). The highest VIF was 1.35 for chills, and the lowest VIF was 1.01 for gender. Findings align with the weak correlations observed in the correlation matrix (Figure 2).
Using RFE, the top five variables identified (Figure 3) were chills, fever, diarrhea, travel history, and abdominal pain. All variables demonstrated statistical significance based on chi-square tests (Table 2), with p-values of 0.0019 for chills, 0.003 for fever, 0.01 for diarrhea, 0.02 for travel history, and 0.0004 for abdominal pain.
SMOTE successfully addressed the data imbalance issue to improve model performance [Figure 4].
3.3. Machine Learning
The performance of the seven ML individual classifiers (LR, RF, DT, GB, KNN, NB and XGBoost) were evaluated using six metrics. XGBoost got the highest accuracy (0.95). GB and RF both got an accuracy of 0.94. DT achieved an accuracy of 0.89, while LR had 0.83 and NB had 0.82, showing lower but comparable performance. KNN had the lowest accuracy of 0.69. XGBoost achieved the highest precision (0.93). RF and GB had precision values of 0.91 and 0.92, respectively. DT (0.87) and LR (0.85) achieved moderate precision values. KNN had the lowest precision of 0.68. Recall was strongest for RF at 0.99. XGBoost and GB both got a recall of 0.98. DT obtained 0.93, showing a good recall performance. LR (0.82) and NB (0.77) demonstrated more limited sensitivity. KNN achieved 0.79 recall, performing better in this metric than in others.(Figure 5).
The AUC-ROC values, indicating overall classification ability across all thresholds, were strongest for XGBoost and GB (both 0.99). RF achieved 0.98, DT (0.95), and NB (0.90), while LR achieved 0.89. KNN (0.75) had the lowest AUC-ROC performance (Figure 6).
Confusion matrices were used to evaluate the models, where each matrix shows the number of actual malaria cases (positives) and non-cases (negatives) correctly or incorrectly predicted by the model (Figure 7). LR correctly classified true positives and true negatives , then misclassified of actual positives as false negatives (FN) and 9.3% of actual negatives as false positives (FP). XGBoost achieved strong performance, with and . Impressively, it recorded and , making it the model with the lowest error. GB correctly identified of TP and of TN. It had minimal misclassifications of and only .
Comparative performance analysis of models between the test and evaluation sets showed consistent patterns in predictive accuracy and reliability. XGBoost showed superior performance across all metrics, achieving the highest accuracy (0.95 test, 0.93 eval), F1-score (0.96 test, 0.93 eval), AUC-ROC (0.99), precision (0.93) and recall (0.98). RF and GB models had a nearly similar performance to XGBoost. DT showed moderate performance with accuracy and F1-scores around 0.89 (Figure 8).
The Stacking model demonstrated the highest overall performance across all evaluation metrics. Stacking has an accuracy of while Soft Voting, Bagging and AdaBoost classifiers achieved an accuracy score of . Soft Voting had a slightly higher precision (93%). Stacking had the highest precision of 95% (Figure 9).
The ROC curves showed exceptional discriminative performance across all ensemble models. Soft Voting and Bagging achieved a high classification capability (AUC ). AdaBoost and Stacking had AUC values of 0.98. All ensemble models maintained high sensitivity with their curves hugging the top-left corner of the plot, a nature only high-quality classifiers take. The clustering of AUC scores between 0.98 and 0.99 confirms that all ensemble methods provide clinically reliable diagnostic performance (Figure 10).
Confusion matrices for the four ensemble models show distinct performance quality in malaria classification (Figure 11). Soft Voting correctly identified 48 TP cases (44.9%) and 53 TN (49.1%), with error rates 4 FN (3.7%) and 3 FP (2.8%). Bagging had stronger specificity, with only 1 FP and 55 TN, with 6 FN at 5.6%. AdaBoost demonstrated the best sensitivity among all ensemble models, with 3 FN (2.8%) and 49 TP (45.4%) and only 1 FP. Stacking matched AdaBoost’s sensitivity with 3 FN at 2.8%, 49 TP at 45.4%, but with more FP. All models maintained FP rates below 3%.
4. Discussion
The findings of this research demonstrate the potential impact of ML ensemble models in enhancing malaria diagnosis, particularly in developing countries where there is poor accessibility and insufficient diagnostic tools for malaria. Our results show that the Stacking ensemble model outperformed all individual models, obtaining an accuracy of , precision , recall , F1 score and AUC-ROC .
Of the 637 participants from Gweru Provincial Hospital (49.9%) and Gutu Mission Hospital (50.1%), a proportion of 50.9 were males and were females. The age of the participants had a mean of years. A total of
75 cases were positive, with of the 75 cases being males and females showing a slightly higher prevalence in males, although the difference did not attribute any statistical significance ( ). Clinical symptoms such as chills, fever, abdominal pain and diarrhea were significant predictors of malaria ( ), highlighting the dependence of clinical symptoms as diagnostic markers for malaria. While most demographic features were not statistically significant predictors of malaria, travel history proved to have a significant effect towards malaria incidence, as individuals who travel may have different risk exposure and prevention behaviours. These results align with existing literature, which emphasises how physical clinical symptoms of malaria can be relied on for diagnosis, especially in malaria endemic areas [48]. Some studies argue that demographic factors are as important as clinical symptoms, reporting gender and age as having a huge impact on malaria incidence [49,50]. Other literature reports that while demographics are found to be related to malaria incidence, different geographical and socio-economic conditions impact their significance to malaria epidemiology [51,52]. Early diagnosis of malaria through timely identification of clinical symptoms can potentially improve malaria management and control in endemic localities [49,53].
The performance evaluation of the ML models, measured by considering all the metrics, showed that ensemble models outperform individual ML models. XGBoost achieved an accuracy of 0.95 while RF and GB got 0.94, indicating strong generalizability. A comparison of the individual models’ performance on the evaluation and test datasets (Figure 8) showed consistent performance, proving that there was minimal overfitting due to effective hyperparameter tuning. Models such as KNN and NB, which demonstrated moderate model performance, could suggest their applicability for specific scenarios with fewer complexities.
While all the ML ensemble models achieved high diagnostic performance (Figure 9), the Stacking ensemble model outperformed the other ensemble models, obtaining a high malaria diagnostic performance across all metrics. Bagging, Stacking and AdaBoost achieved 0.98 recall, and Soft Voting got 0.95. High recall in malaria diagnosis means reliable identification of positive cases, reducing the risk of severe complications. Mahajan et al. [54] and Rajab et al. [55] obtained very high precision scores for Bagging, Stacking and AdaBoost, emphasising that ensemble models are reliable in boosting sensitivity in malaria diagnosis. F1 scores for the ensemble models were high, with Stacking and AdaBoost at 0.96. Soft Voting and Bagging got 0.94, indicating a strong overall performance. The paper’s results for the F1 score of the ensemble model performance highlight the potential of the ensemble models at balancing precision and recall. Ensemble models demonstrated exceptional reliability in making predictions with minimal errors (Figure 11). The top-performing individual models in our study were XGBoost, GB and RF, while the top-performing ensemble model was stacking.
5. Conclusion
The investigation demonstrated that the use of clinical and demographic data for malaria diagnosis with ensemble ML models is viable. These ensemble models provide a scalable and cost-effective alternative, or complementary tool, to traditional malaria diagnostic methods in resource-limited settings. Clinical symptoms such as chills, fever, and abdominal pain exhibited strong predictive power, underscoring their importance and suitability for symptom-based screening tools. These findings may support malaria control programs in high-burden areas.
Notably, limitations such as sample size, data diversity, model complexity and possible deployment issues were acknowledged. Integrating these stacking ensemble models into a user-friendly digital platform can help health workers gain access to reliable diagnostic support, reducing the burden on health systems. Validating the proposed models in real-time clinical workflows should be adopted to assess their clinical applicability. Model integration should be piloted into hospital systems or mobile health platforms to assess clinical acceptance and usability.
This paper contributes to the growing evidence supporting the use of AI in global health. By demonstrating the feasibility of ML-driven malaria prediction, this study lays a foundation for scalable and tailored data-informed diagnostic tools that can be used to support infectious disease management in resource-limited settings. It also adds to the countless efforts of developing nations towards the achievement of sustainable development in the healthcare sector under the SDG-3 pillar of the United Nations.
Future research includes focusing on large-scale validation and real-world implementation to ensure the model’s effectiveness in clinical settings. To further advance the performance of ensemble models, focus more on investigating the impact of more than base models within ensemble models and combining ensemble models to explore their impact.
Funding
This research received no specific grant from any funding agency in the public, commercial, or not-for-profit sectors.
Informed Consent Statement
Not applicable.
Data Availability Statement
The datasets used and/or analyzed during the current study are available from the corresponding author on reasonable request.
Acknowledgments
We acknowledge Gweru Provincial Hospital and Gutu Mission Hospital for approving and allowing us to carry out this study using the patient data collected from their medical records.
Conflicts of Interest
The authors declare no competing interests.
Abbreviations
The following abbreviations are used in this manuscript:
| ML | Machine Learning |
| AI | Artificial Intelligence |
| LR | Logistic Regression |
| RF | Random Forest |
| DT | Decision Trees |
| GB | Gradient Boosting |
| KNN | K-Nearest Neighbors |
| NB | Naive Bayes |
| AUC-ROC | Area Under the Receiver Operating Characteristic Curve |
| SMOTE | Synthetic Minority Oversampling Technique |
| mRDTs | malaria Rapid Diagnostic Tests |
| ARIMA | Autoregressive Integrated Moving Average |
| STL+ARIMA | Seasonal and Trend Decomposition using Loess |
| BP-ANN | Back Propagation Artificial Neural Network |
| LSTM | Long Short-Term Memory |
References
- Hamid, M.M.A.; Mohamed, A.O.; Mohammed, F.O.; Elaagip, A.; Mustafa, S.A.; Elfaki, T.; Jebreel, W.M.; Albsheer, M.M.; Dittrich, S.; Owusu, E.D.; et al. Diagnostic accuracy of an automated microscope solution (miLab™) in detecting malaria parasites in symptomatic patients at point-of-care in Sudan: a case–control study. Malaria Journal 2024, 23, 200. [CrossRef]
- Organization, W.H.; et al. WHO guidelines for malaria, 13 august 2025 2025.
- Rajab, S.; Nakibuule, R.; Marvin, G. Interpretable Ensemble Model-Agonistc Approaches for Malaria Prediction. In Proceedings of the Proceedings of the 2024 Sixteenth International Conference on Contemporary Computing, 2024, pp. 451–459.
- Kagaba Amina, G. Socio-Economic Determinants and Malaria Risk: Assessing the Impact of Poverty, Housing Conditions, and Healthcare Accessibility in High-Incidence Regions. SCIENCES (NIJRMS) 2024, 5, 120–4.
- Moyo-Ndlovu, T. Malaria claims three more lives in Zimbabwe, total deaths rise to 32. https://www.heraldonline.co.zw/malaria-claims-three-more-lives-in-zimbabwe-total-deaths-rise-to-32/, 2024. Accessed: 12 January 2025.
- Kabalu Tshiongo, J.; Zola Matuvanga, T.; Mitashi, P.; Maketa, V.; Schallig, H.D.; Mens, P.F.; Muhindo Mavoko, H.; Matangila Rika, J. Prevention of malaria in pregnant women and its effects on maternal and child health, the case of centre hospitalier de Kingasani II in the Democratic Republic of the congo. Tropical Medicine and Infectious Disease 2024, 9, 92. [CrossRef]
- Sato, S. Plasmodium—a brief introduction to the parasites causing human malaria and their basic biology. Journal of physiological anthropology 2021, 40, 1. [CrossRef]
- Wang, M.; Wang, H.; Wang, J.; Liu, H.; Lu, R.; Duan, T.; Gong, X.; Feng, S.; Liu, Y.; Cui, Z.; et al. A novel model for malaria prediction based on ensemble algorithms. PloS one 2019, 14, e0226910. [CrossRef]
- Mfuh, K.O.; Achonduh-Atijegbe, O.A.; Bekindaka, O.N.; Esemu, L.F.; Mbakop, C.D.; Gandhi, K.; Leke, R.G.; Taylor, D.W.; Nerurkar, V.R. A comparison of thick-film microscopy, rapid diagnostic test, and polymerase chain reaction for accurate diagnosis of Plasmodium falciparum malaria. Malaria journal 2019, 18, 73. [CrossRef]
- Varo, R.; Balanza, N.; Mayor, A.; Bassat, Q. Diagnosis of clinical malaria in endemic settings. Expert Review of Anti-infective Therapy 2021, 19, 79–92. [CrossRef]
- Wongsrichanalai, C.; Barcus, M.J.; Muth, S.; Sutamihardja, A.; Wernsdorfer, W.H. A review of malaria diagnostic tools: microscopy and rapid diagnostic test (RDT). Defining and Defeating the Intolerable Burden of Malaria III: Progress and Perspectives: Supplement to Volume 77 (6) of American Journal of Tropical Medicine and Hygiene 2007. [CrossRef]
- Ojeniyi, F.D.; Ayoola, A.O.; Ibitoye, O.; Opaleye, O.O.; Olowe, O.A.; Ehigie, L.O.; Thomas, B.N.; Ojurongbe, O. Performance and challenges of malaria rapid diagnostic tests in endemic regions of Africa. Scientific Reports 2025. [CrossRef]
- Maitland, K. Management of severe paediatric malaria in resource-limited settings. BMC medicine 2015, 13, 42. [CrossRef]
- Ayoka, T.O.; Nnadi, C.O. Application of machine learning models in predicting malaria prevalence in nigeria: an analysis of the 2015–2020 demographic and health surveys. Journal of Parasitic Diseases 2025, pp. 1–13. [CrossRef]
- Stephen, A.; Akomolafe, P.O.; Ogundoyin, K.I. A model for predicting malaria outbreak using machine learning technique. Annals Computer Science Series 2021, 19.
- Muriithi, D.; Lumumba, V.; Okongo, M. A Machine Learning-Based Prediction of Malaria Occurrence in Kenya. American Journal of Theoretical and Applied Statistics 2024, 13, 65–72. [CrossRef]
- Mariki, M. Machine learning model for prediction of malaria in low and high endemic areas of Tanzania. PhD thesis, NM-AIST, 2023.
- SAHU, P.; Priyadarshini, P.; Tripathy, S.; Das, Y.; Pradhan, S. Machine learning strategies for malaria risk prediction based on text-based clinical information 2023. [CrossRef]
- for Africa Network, D.D. The potential of digital molecular diagnostics for infectious diseases in sub-Saharan Africa. PLOS Digital Health 2022, 1, e0000064.
- Cunnington, A. The Digital Diagnostics for Africa Network (2022) The potential of digital molecular diagnostics for infectious diseases in sub-Saharan Africa. PLOS Digit Health 1 (6): e0000064, 2022.
- Devi, S.S.; Solanki, V.K.; Laskar, R.H. Recent advances on big data analysis for malaria prediction and various diagnosis methodologies. Handbook of data science approaches for biomedical engineering 2020, pp. 153–184.
- Cho, S.; Kim, S.; Kim, Y.; Park, Y. Optical imaging techniques for the study of malaria. Trends in biotechnology 2012, 30, 71–79. [CrossRef]
- Awe, O.O.; Mwangi, P.N.; Goudoungou, S.K.; Esho, R.V.; Oyejide, O.S. Explainable AI for enhanced accuracy in malaria diagnosis using ensemble machine learning models. BMC Medical Informatics and Decision Making 2025, 25, 162. [CrossRef]
- Muhammad, B.; Varol, A. A symptom-based machine learning model for malaria diagnosis in Nigeria. In Proceedings of the 2021 9th International Symposium on Digital Forensics and Security (ISDFS). IEEE, 2021, pp. 1–6.
- Mbunge, E.; Milham, R.C.; Sibiya, M.N.; Takavarasha Jr, S. Machine learning techniques for predicting malaria: Unpacking emerging challenges and opportunities for tackling malaria in sub-saharan Africa. In Proceedings of the Computer Science On-line Conference. Springer, 2023, pp. 327–344.
- Khan, O.; Ajadi, J.O.; Hossain, M.P. Predicting malaria outbreak in The Gambia using machine learning techniques. PLoS One 2024, 19, e0299386. [CrossRef]
- Ly, A.Y.; Allaya, M.M.; Loum, M.A.; Gning, L.D.; Sy, O.; Bakhoum, L.N.; Ndiaye, K.; Ndiop, M.; Sall, F.B.; Ndiaye, J.L.A.; et al. Forecasting malaria incidence in the Southeast districts of Senegal using a machine learning approach. BMC Artificial Intelligence 2025, 1, 9. [CrossRef]
- Brown, B.J.; Manescu, P.; Przybylski, A.A.; Caccioli, F.; Oyinloye, G.; Elmi, M.; Shaw, M.J.; Pawar, V.; Claveau, R.; Shawe-Taylor, J.; et al. Data-driven malaria prevalence prediction in large densely populated urban holoendemic sub-Saharan West Africa. Scientific Reports 2020, 10, 15918. [CrossRef]
- Rubuga, F.K.; Ahmed, A.; Siddig, E.; Sera, F.; Moirano, G.; Aimable, M.; Albert, T.; Gallican, N.R.; Nebié, E.I.; Kitema, G.F.; et al. Potential impact of climatic factors on malaria in Rwanda between 2012 and 2021: a time-series analysis. Malaria Journal 2024, 23, 274. [CrossRef]
- Gavi, S.; Tapera, O.; Mberikunashe, J.; Kanyangarara, M. Malaria incidence and mortality in Zimbabwe during the COVID-19 pandemic: analysis of routine surveillance data. Malaria journal 2021, 20, 233. [CrossRef]
- Chivasa, T.; Nunu, W.N.; Dhlamini, M.; Maviza, A.; Ndagurwa, G.N. Impact of Climate Change on Malaria Transmission and Management in Zimbabwe: A Scoping Review of the Literature. Health Services Insights 2025, 18, 11786329251374245. [CrossRef]
- Lakshmi, T.J.; Prasad, C.S.R. A study on classifying imbalanced datasets. In Proceedings of the 2014 First international conference on networks & soft computing (ICNSC2014). IEEE, 2014, pp. 141–145.
- Sameh, B.; Khodadadi, N.; Khodadadi, E.; Eid, M.; El-kenawy, E.S. Advancements and Future Directions in Machine Learning for Medical Diagnostics: A Comprehensive Review 2024. 7, 18–31. [CrossRef]
- Rahman, M.M.; Davis, D.N. Addressing the class imbalance problem in medical datasets. International Journal of Machine Learning and Computing 2013, 3, 224. [CrossRef]
- Chawla, N.V.; Bowyer, K.W.; Hall, L.O.; Kegelmeyer, W.P. SMOTE: synthetic minority over-sampling technique. Journal of artificial intelligence research 2002, 16, 321–357. [CrossRef]
- Ranjha, R.; Singh, K.; Mohan, M.; Anvikar, A. Age-specific Malaria Vulnerability and Transmission Reservoir among Children. Global Pediatrics 2023, 6, 100085. [CrossRef]
- Khagayi, S.; Desai, M.; Amek, N.; Were, V.; Onyango, E.; Otieno, K.; Bigogo, G.; Munga, S.; Odhiambo, F.; Hamel, M.; et al. Modelling the relationship between malaria prevalence as a measure of transmission and mortality across age groups. Malaria Journal 2019, 18. [CrossRef]
- Carneiro, I.; Roca-Feltrer, A.; Griffin, J.; Smith, L.; Tanner, M.; Schellenberg, J.; Greenwood, B.; Schellenberg, D. Age-Patterns of Malaria Vary with Severity, Transmission Intensity and Seasonality in Sub-Saharan Africa: A Systematic Review and Pooled Analysis. PloS one 2010, 5, e8988. [CrossRef]
- Yadav, S.S.; Kadam, V.J.; Jadhav, S.M.; Jagtap, S.; Pathak, P.R. Machine learning based malaria prediction using clinical findings. In Proceedings of the 2021 International Conference on Emerging Smart Computing and Informatics (ESCI). IEEE, 2021, pp. 216–222.
- Mienye, I.D.; Sun, Y. A survey of ensemble learning: Concepts, algorithms, applications, and prospects. Ieee Access 2022, 10, 99129–99149. [CrossRef]
- Shaikh, T.A.; Rasool, T.; Verma, P.; Mir, W.A. A fundamental overview of ensemble deep learning models and applications: systematic literature and state of the art. Annals of Operations Research 2024, pp. 1–77. [CrossRef]
- Grandvalet, Y. Bagging equalizes influence. Machine Learning 2004, 55, 251–270. [CrossRef]
- Sarmah, U.; Borah, P.; Bhattacharyya, D.K. Ensemble learning methods: An empirical study. SN Computer Science 2024, 5, 924. [CrossRef]
- Altman, N.; Krzywinski, M. Ensemble methods: bagging and random forests. Nature Methods 2017, 14, 933–935. [CrossRef]
- Kumar, M.; Singhal, S.; Shekhar, S.; Sharma, B.; Srivastava, G. Optimized stacking ensemble learning model for breast cancer detection and classification using machine learning. Sustainability 2022, 14, 13998. [CrossRef]
- Javed, D. MULTI-ENSEMBLE ARCHITECTURE FOR NETWORK INTRUSION DETECTION: A STACKING, VOTING, AND HYBRID ADABOOST-RANDOM FOREST APPROACH ON CIC-IDS2024. Spectrum of Engineering Sciences 2025, pp. 967–981.
- Li, X.; Wang, L.; Sung, E. A study of AdaBoost with SVM based weak learners. In Proceedings of the Proceedings. 2005 IEEE International Joint Conference on Neural Networks, 2005. IEEE, 2005, Vol. 1, pp. 196–201.
- Atukunda, A.; Deogratius, M.A.; Arinaitwe, E.; Orishaba, P.; Kamya, M.R.; Nankabirwa, J.I. Do clinicians in areas of declining malaria transmission adhere to malaria diagnosis guidelines? A cross-sectional study from Kampala, Uganda. Malaria Journal 2021, 20, 187. [CrossRef]
- Doreswamy, S.; Al Sudani, H. Malaria Falciparum: Relapse After a Decade. Cureus 2022, 14. [CrossRef]
- Lynch, C.A.; Bruce, J.; Bhasin, A.; Roper, C.; Cox, J.; Abeku, T.A. Association between recent internal travel and malaria in Ugandan highland and highland fringe areas. Tropical medicine & international health 2015, 20, 773–780.
- Brungard, C.W.; Boettinger, J.L.; Duniway, M.C.; Wills, S.A.; Edwards Jr, T.C. Machine learning for predicting soil classes in three semi-arid landscapes. Geoderma 2015, 239, 68–83. [CrossRef]
- Ekusai-Sebatta, D.; Arinaitwe, E.; Mpimbaza, A.; Nankabirwa, J.I.; Drakeley, C.; Rosenthal, P.J.; Staedke, S.G.; Muyinda, H. Challenges and opportunities for use of long-lasting insecticidal nets to prevent malaria during overnight travel in Uganda: a qualitative study. Malaria journal 2021, 20, 283. [CrossRef]
- Arinaitwe, E.; Dorsey, G.; Nankabirwa, J.I.; Kigozi, S.P.; Katureebe, A.; Kakande, E.; Rek, J.; Rosenthal, P.J.; Drakeley, C.; Kamya, M.R.; et al. Association between recent overnight travel and risk of malaria: a prospective cohort study at 3 sites in Uganda. Clinical Infectious Diseases 2019, 68, 313–320. [CrossRef]
- Mahajan, M.; Kalra, A.S.; Bansal, A.; Bhattacherjee, A.; Jain, E.; et al. Automated Malaria Detection Using Deep Learning: A Convolutional Neural Network Approach for Microscopic Cell Image Analysis. In Proceedings of the 2024 International Conference on Decision Aid Sciences and Applications (DASA). IEEE, 2024, pp. 1–6.
- Rajab, S.; Nakatumba-Nabende, J.; Marvin, G. Interpretable Machine Learning Models for Predicting Malaria. 04 2023, pp. 1–6. [CrossRef]
Figure 1.
Methodology framework summarising the various steps of the study from data acquisition up to model evaluation.
Figure 1.
Methodology framework summarising the various steps of the study from data acquisition up to model evaluation.
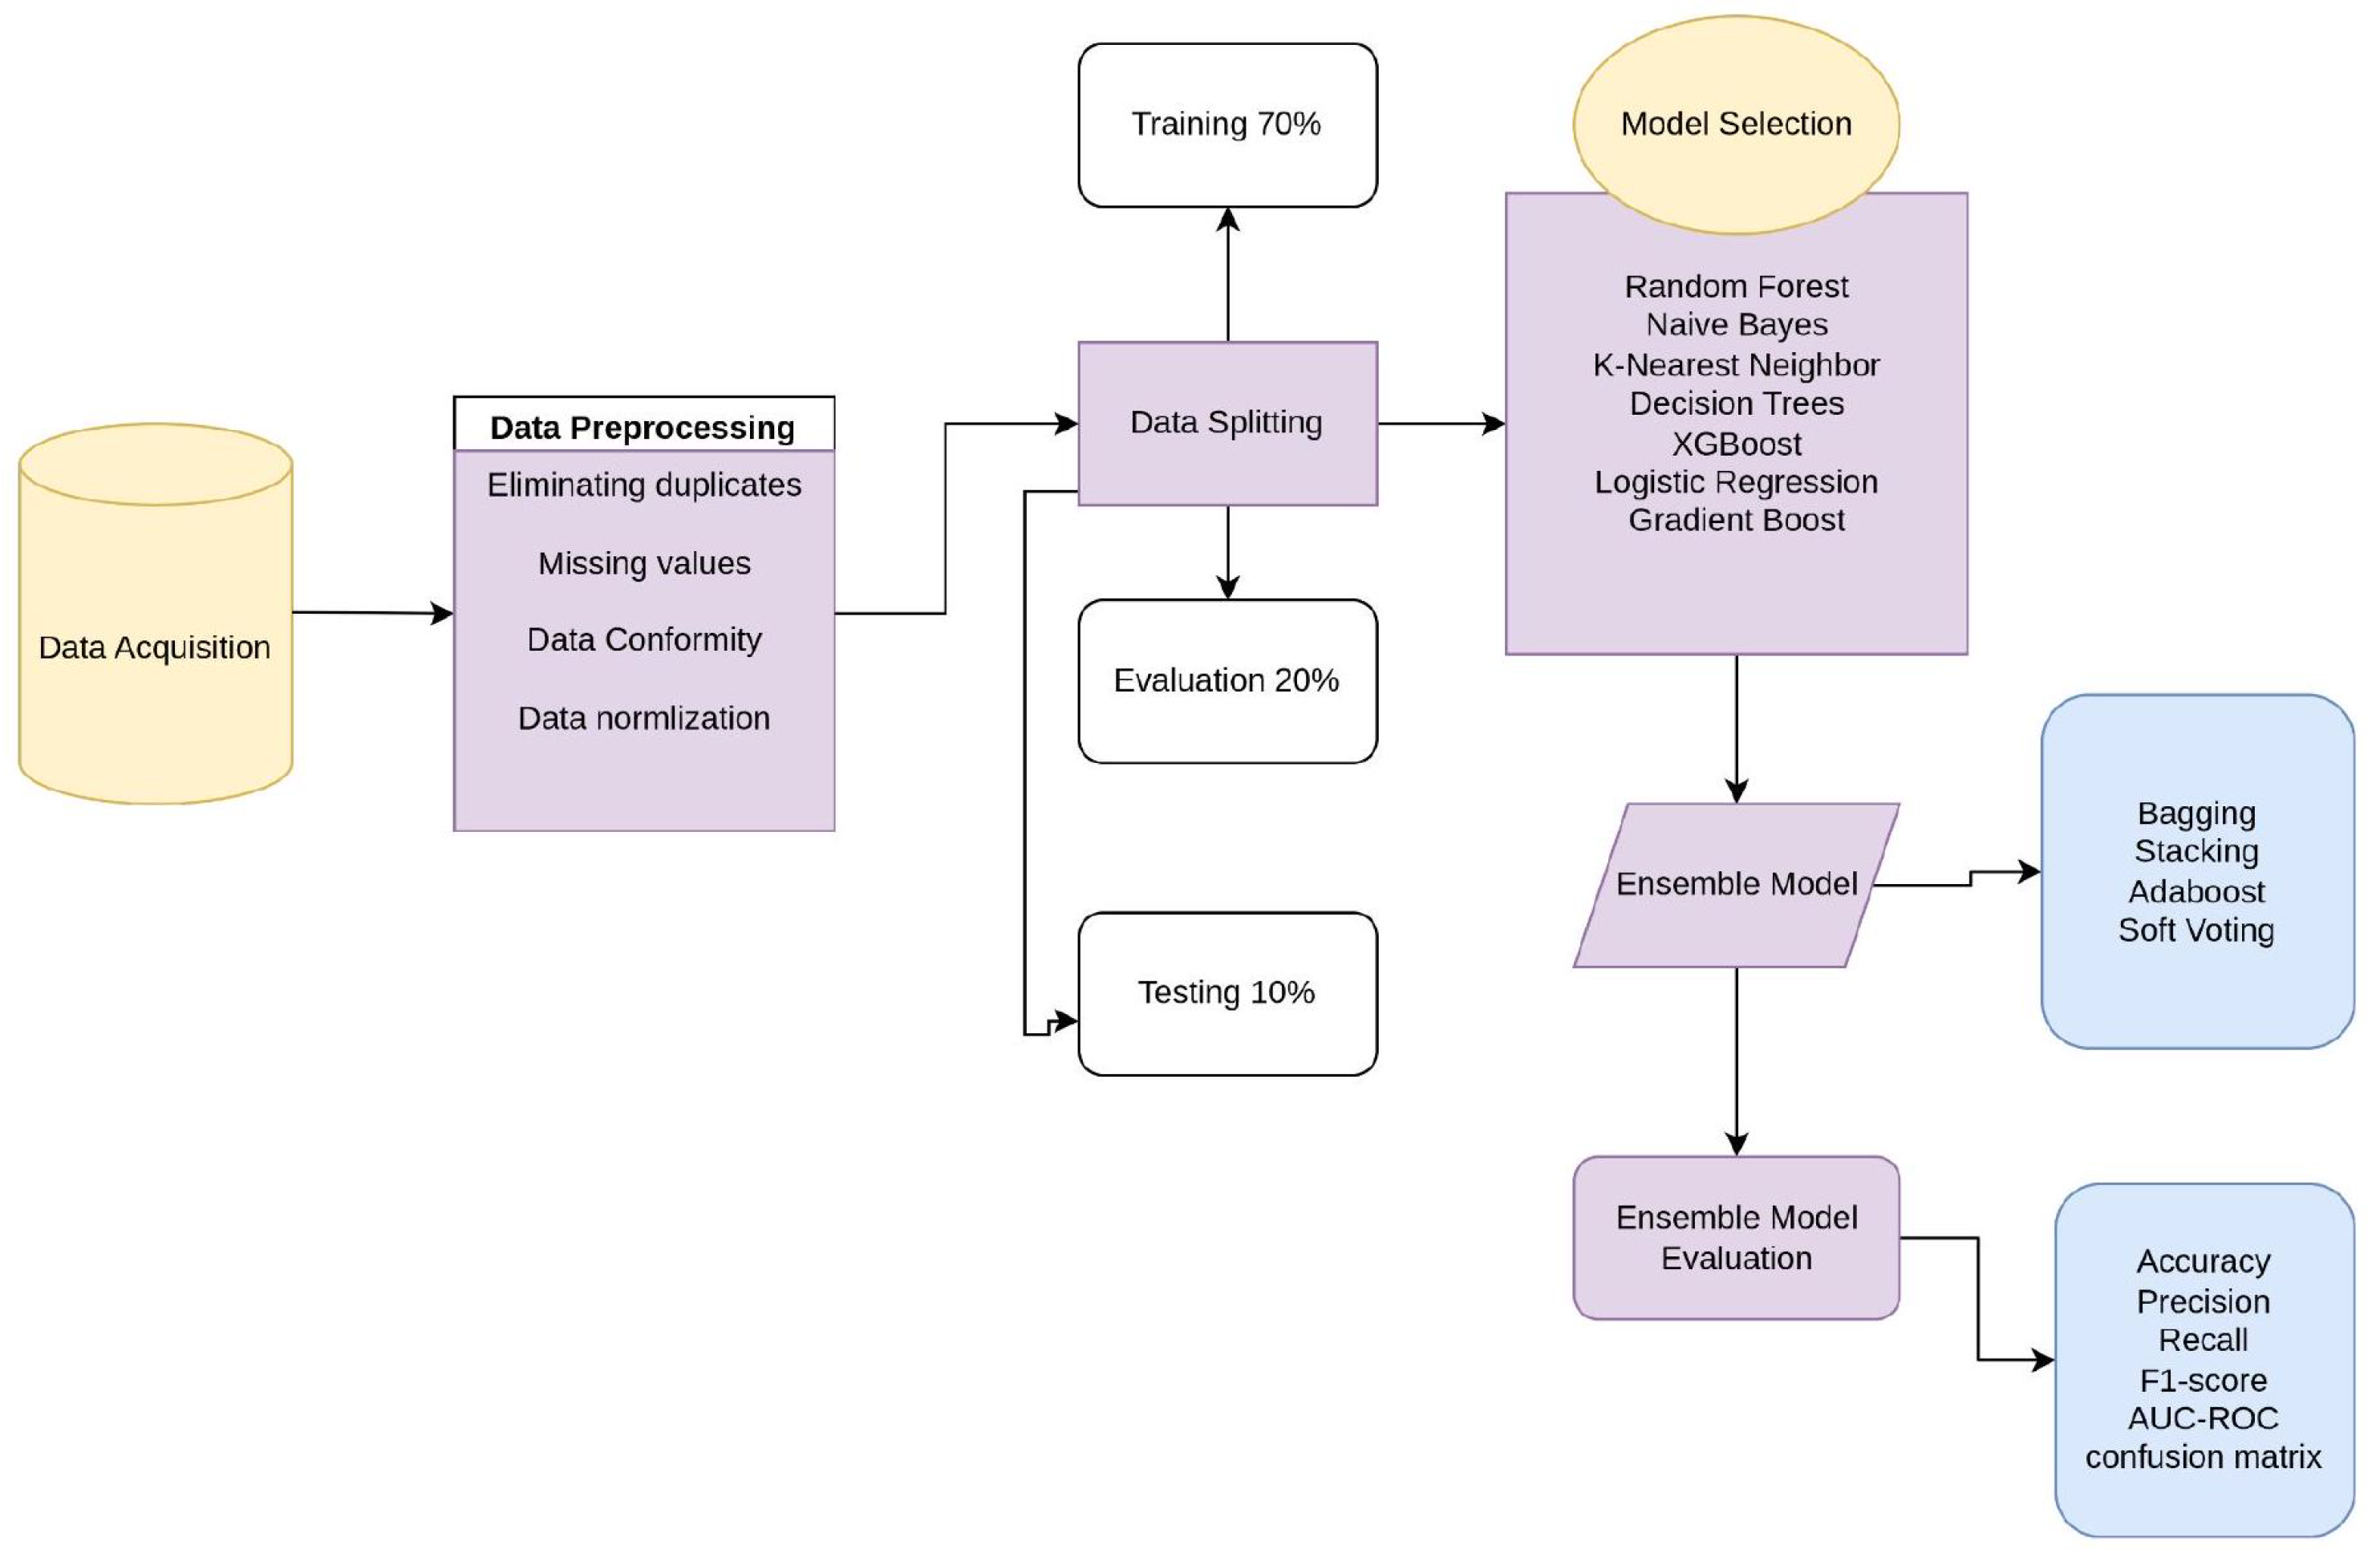
Figure 2.
Feature Correlation Matrix for Malaria Predictors.
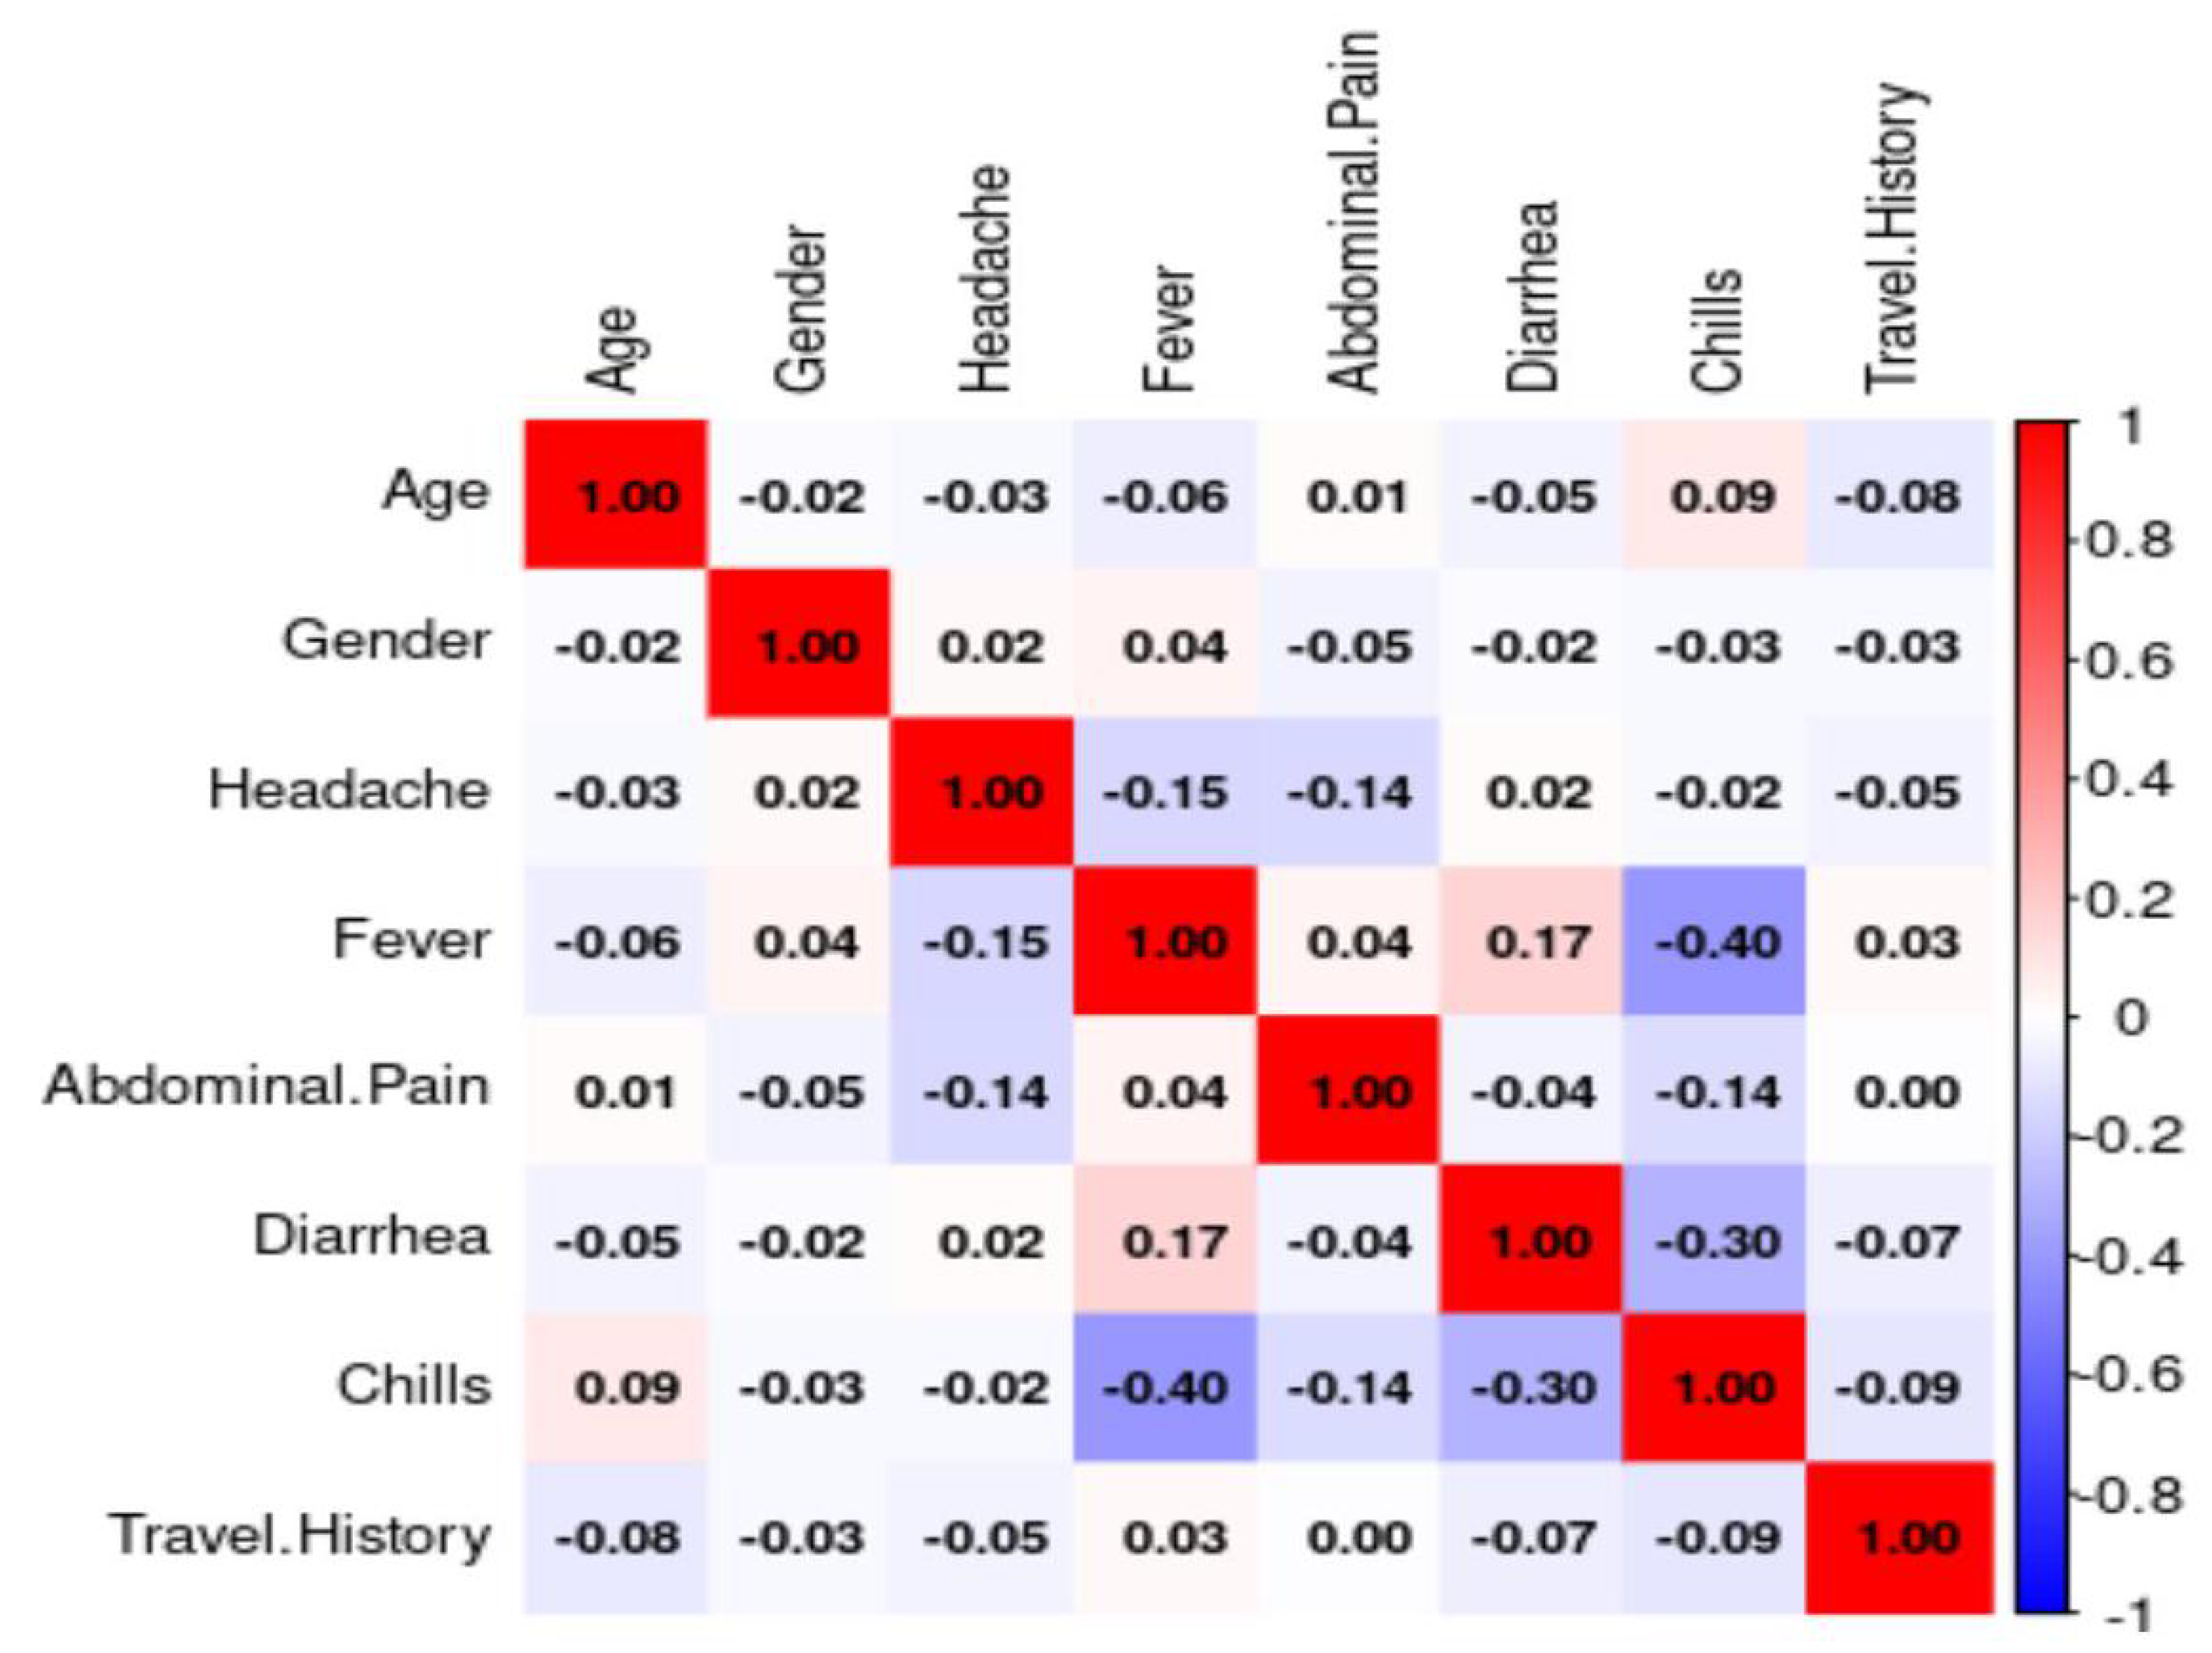
Figure 3.
Feature Importance Analysis with Recursive Feature Elimination.
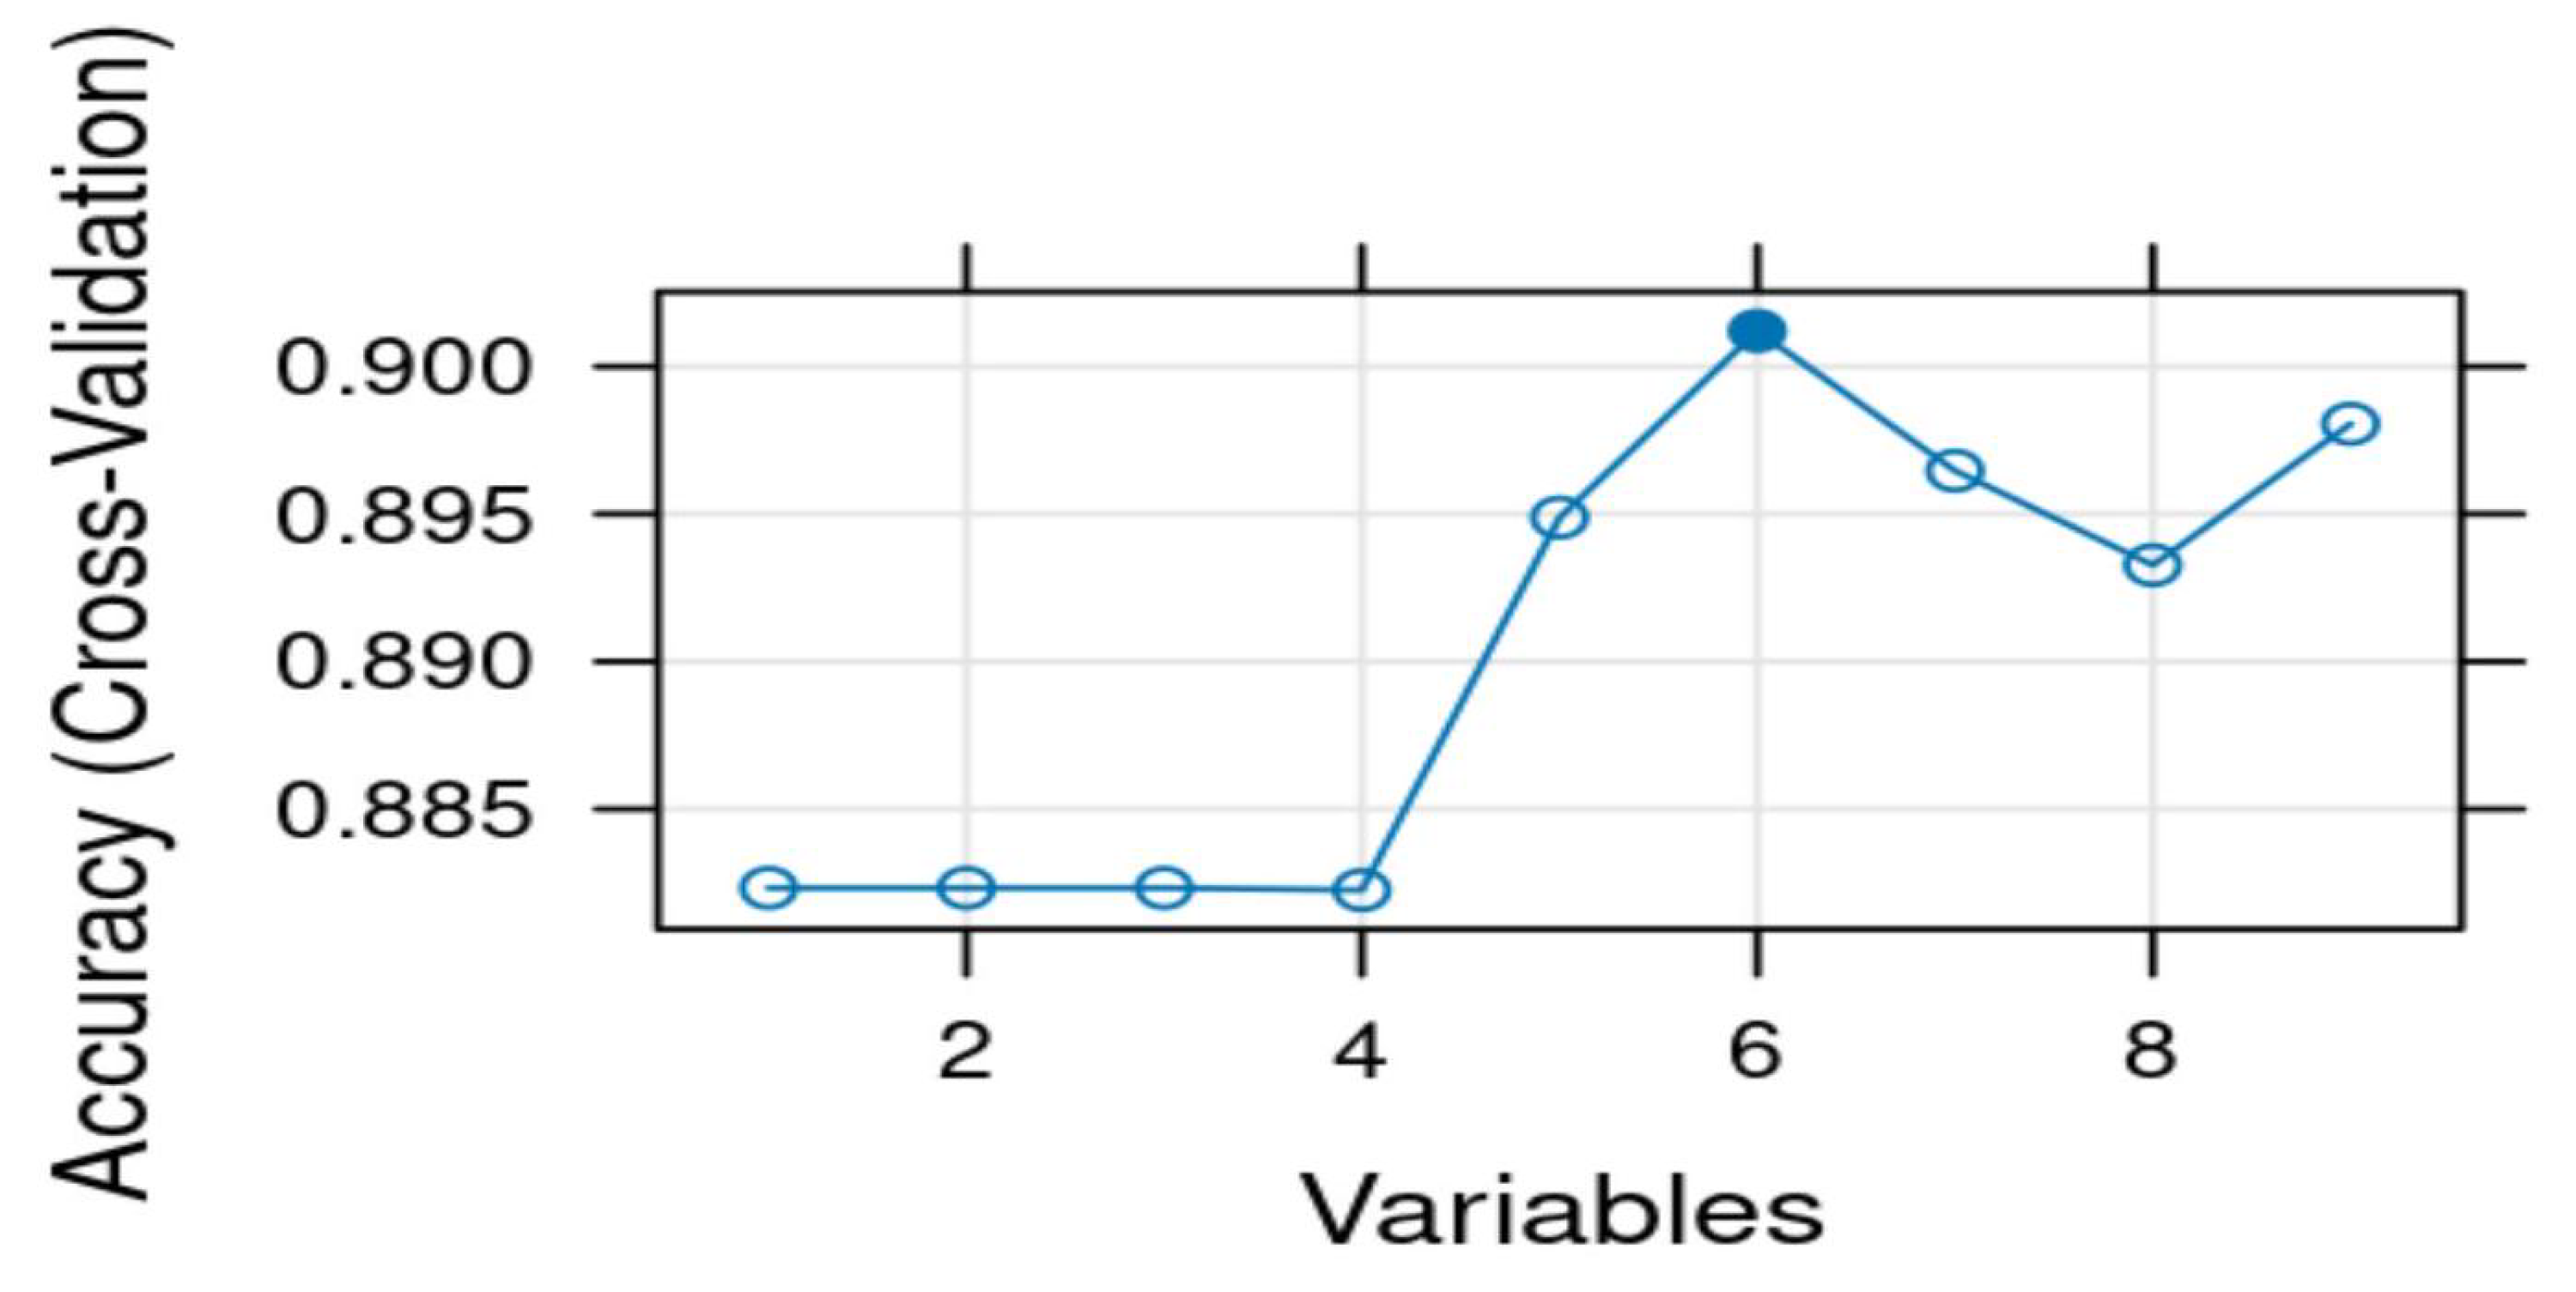
Figure 4.
Class distribution before and after balancing with SMOTE.
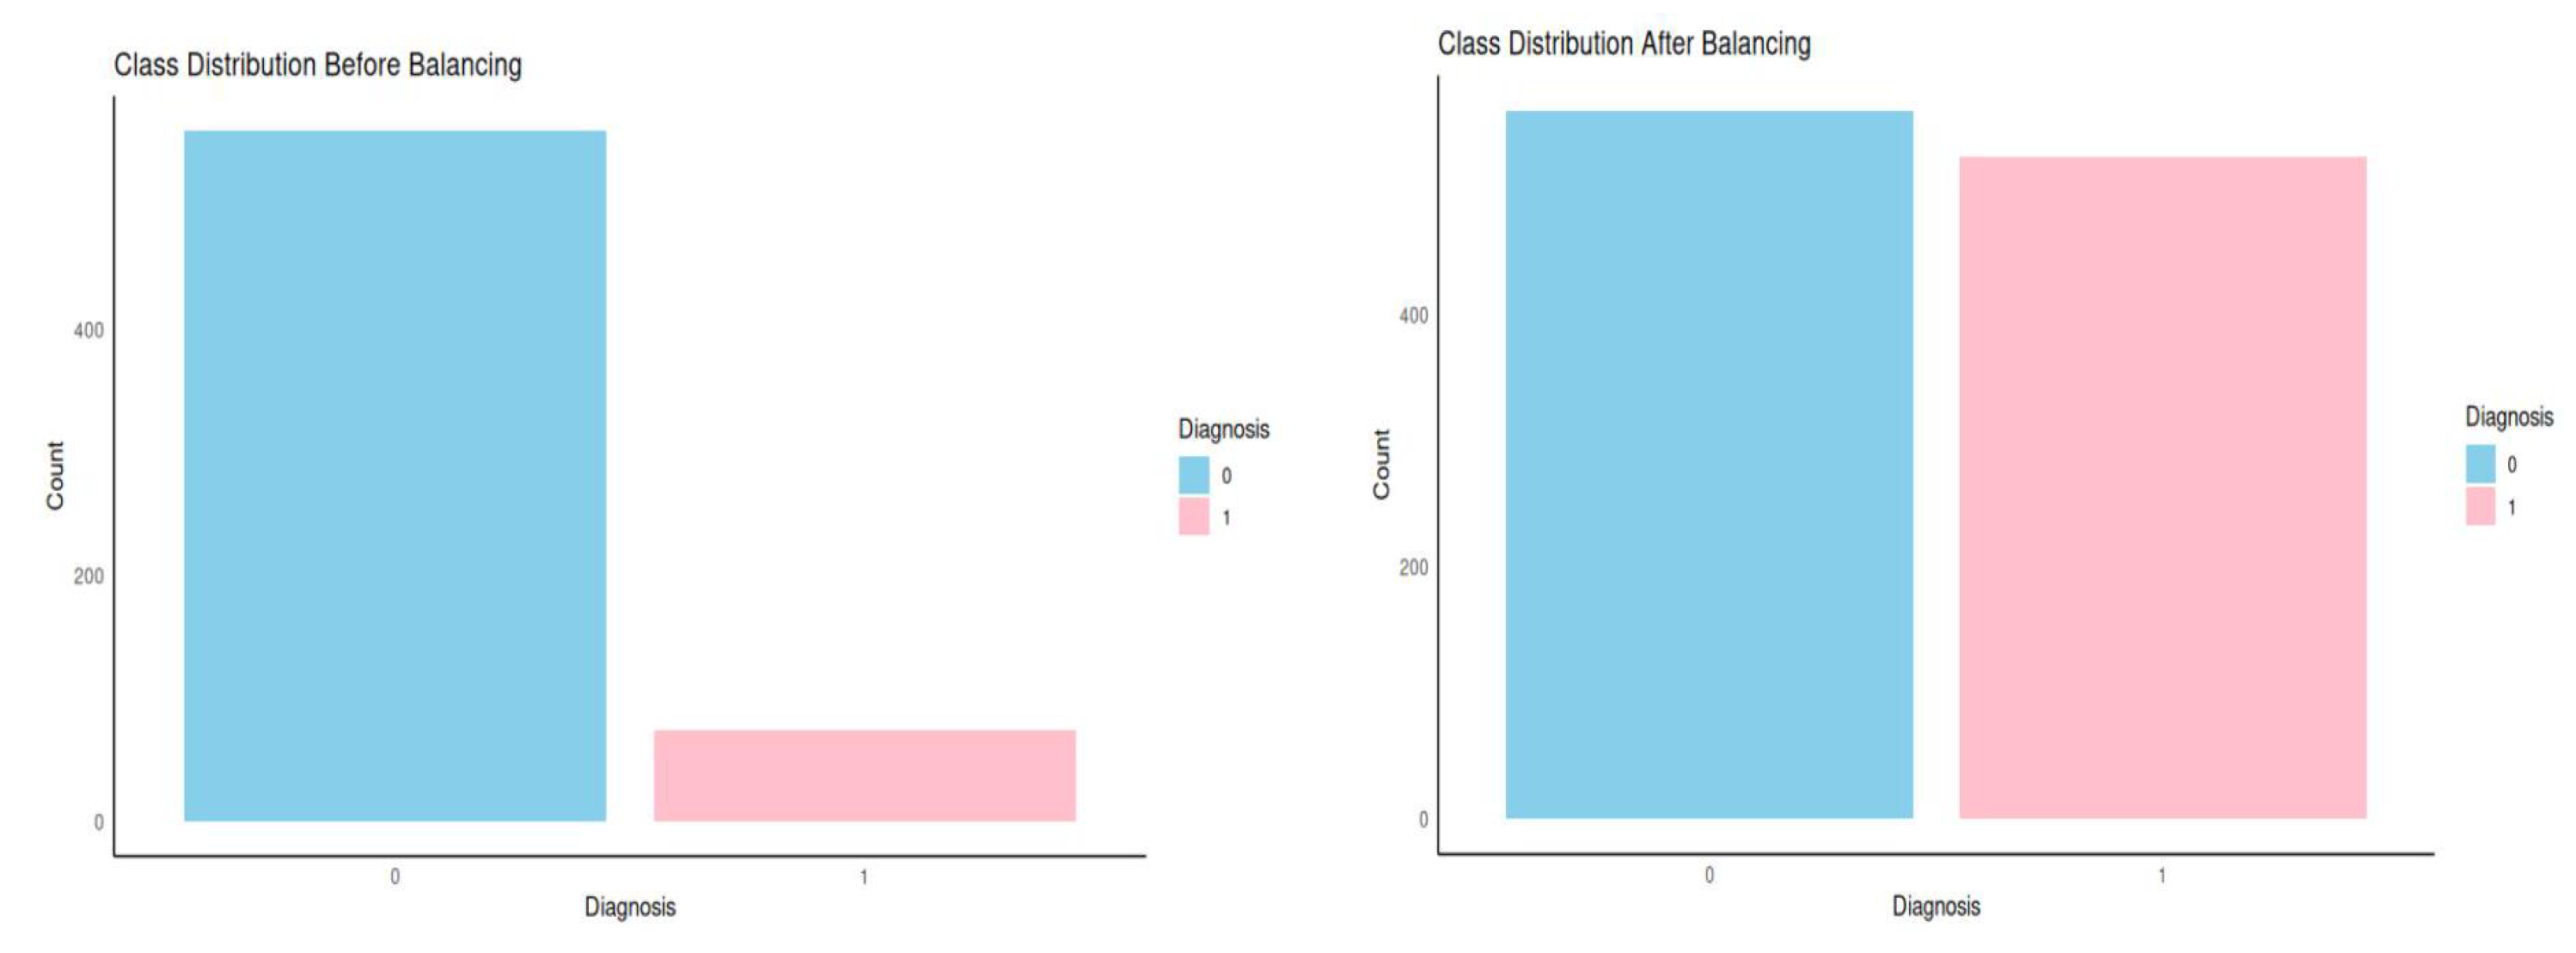
Figure 5.
Model Performance Evaluation on Test set.
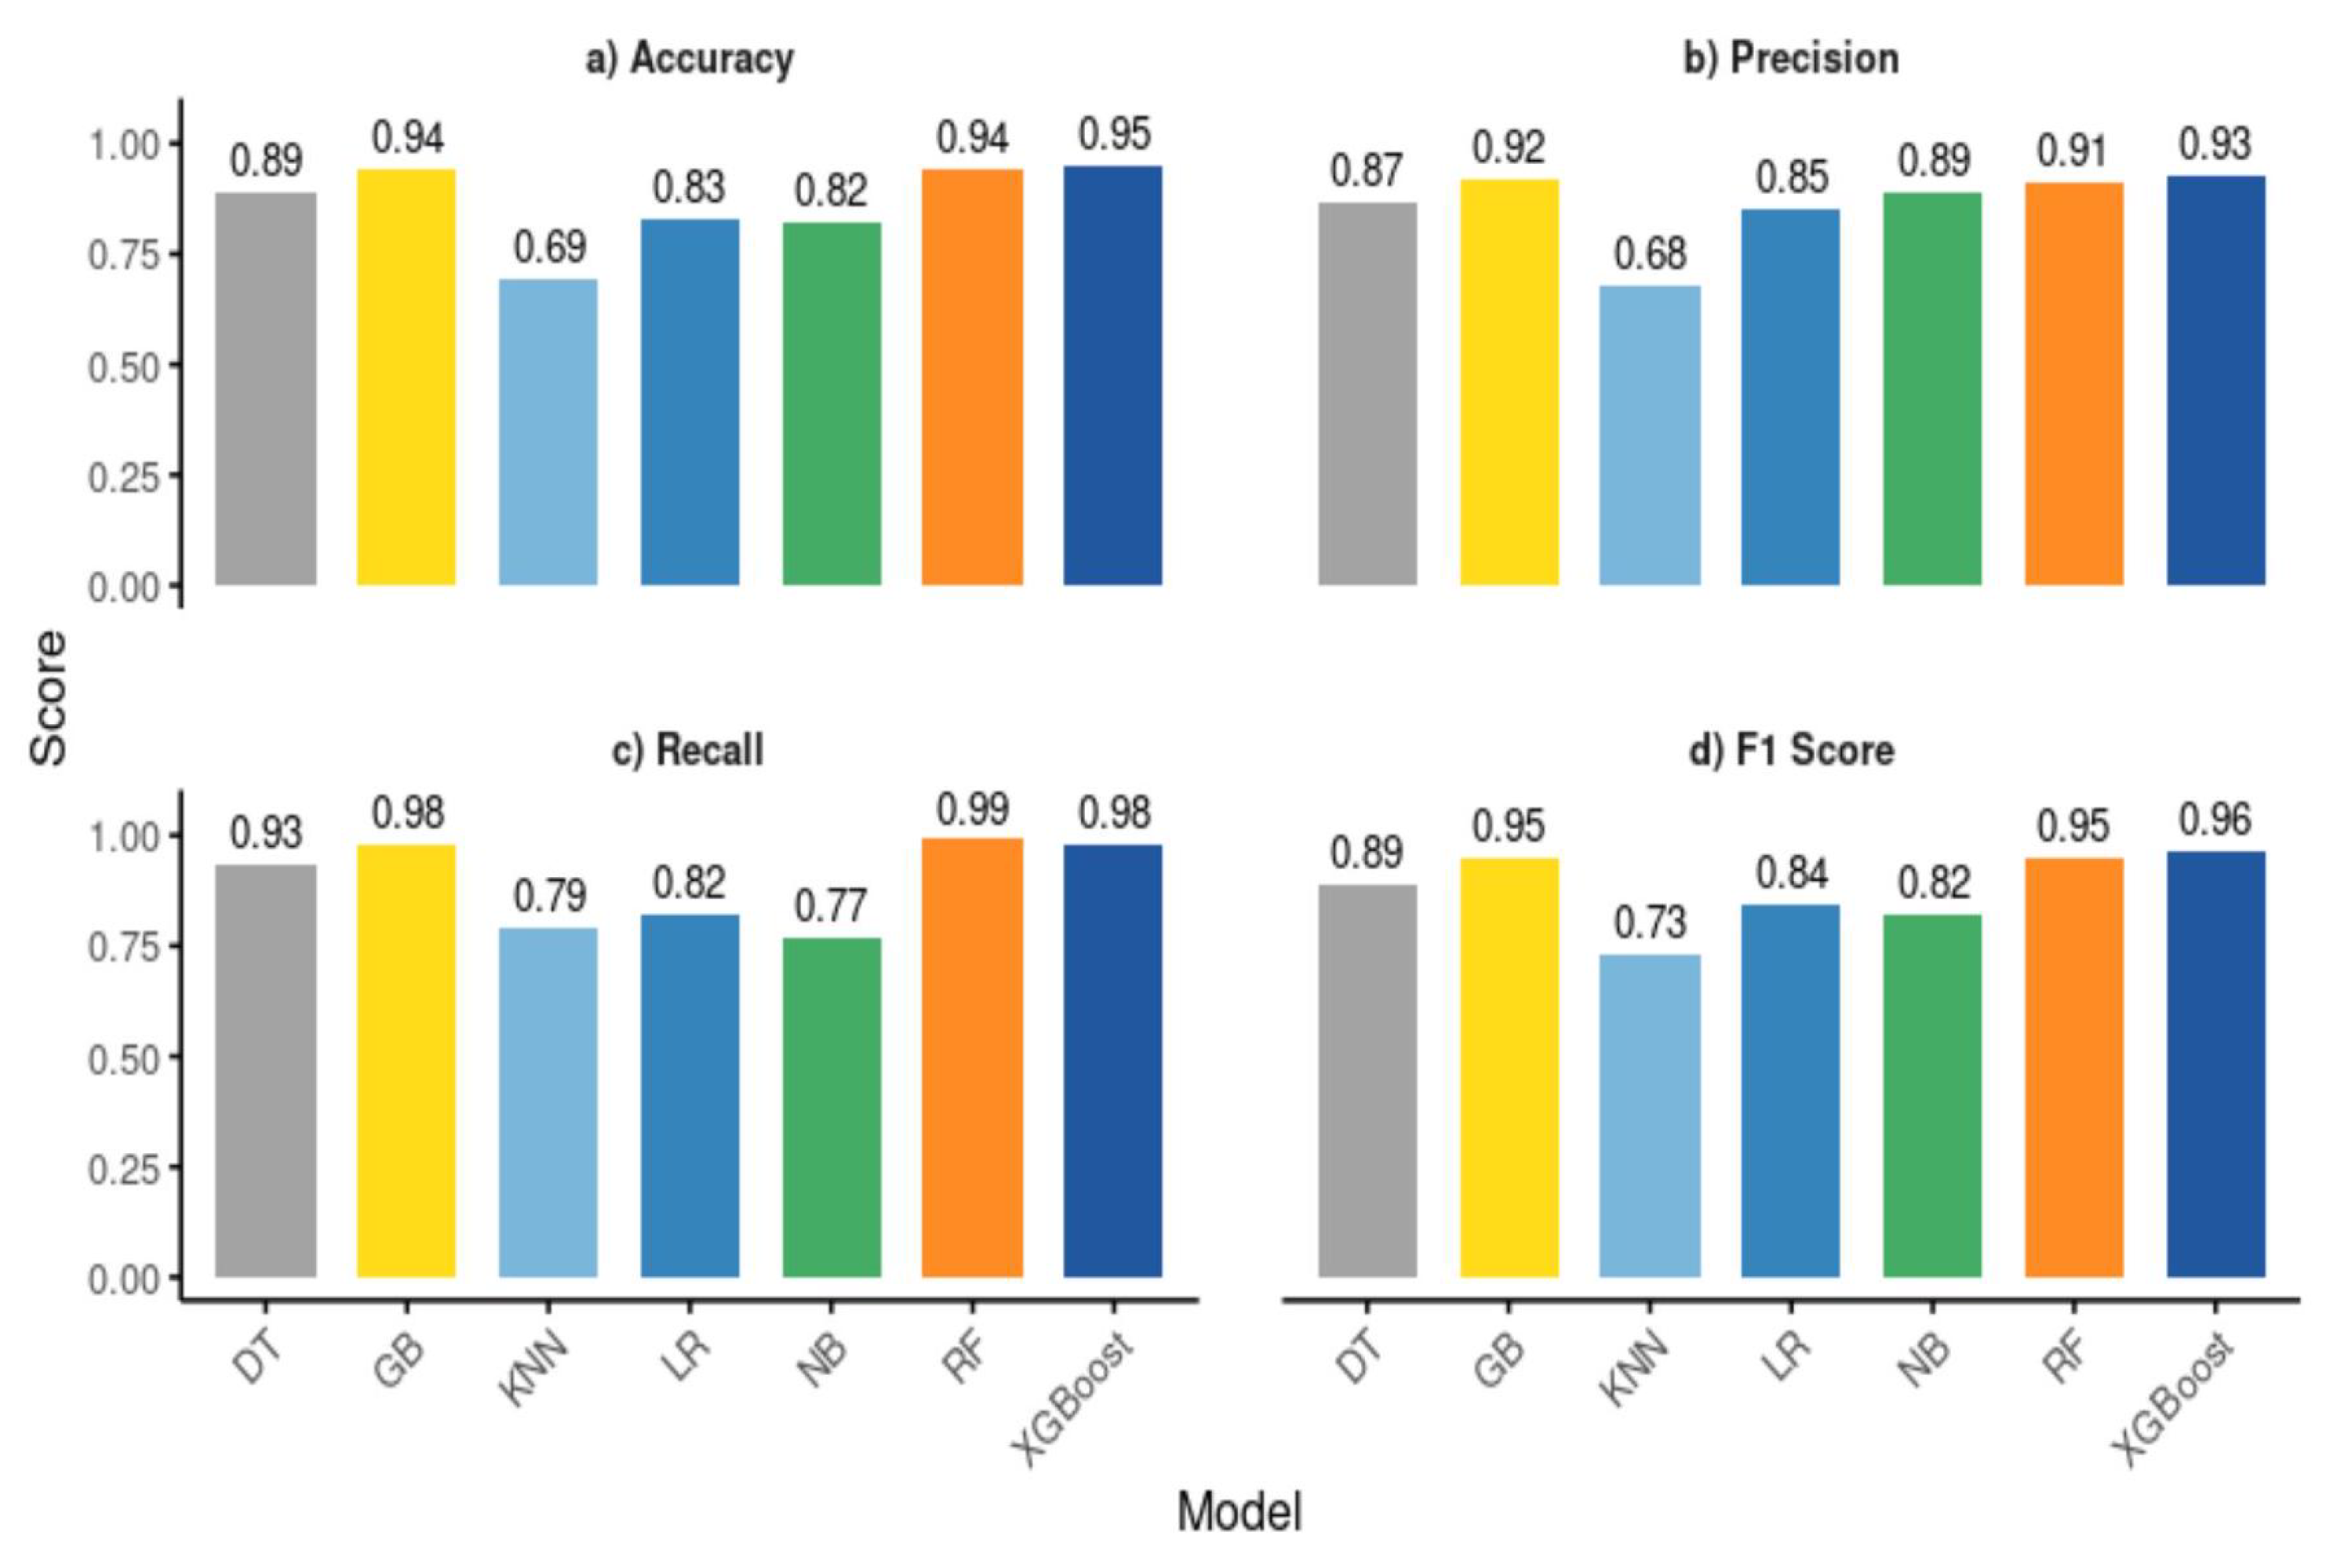
Figure 6.
Receiver Operating Characteristic Curve Analysis on test set Performance.
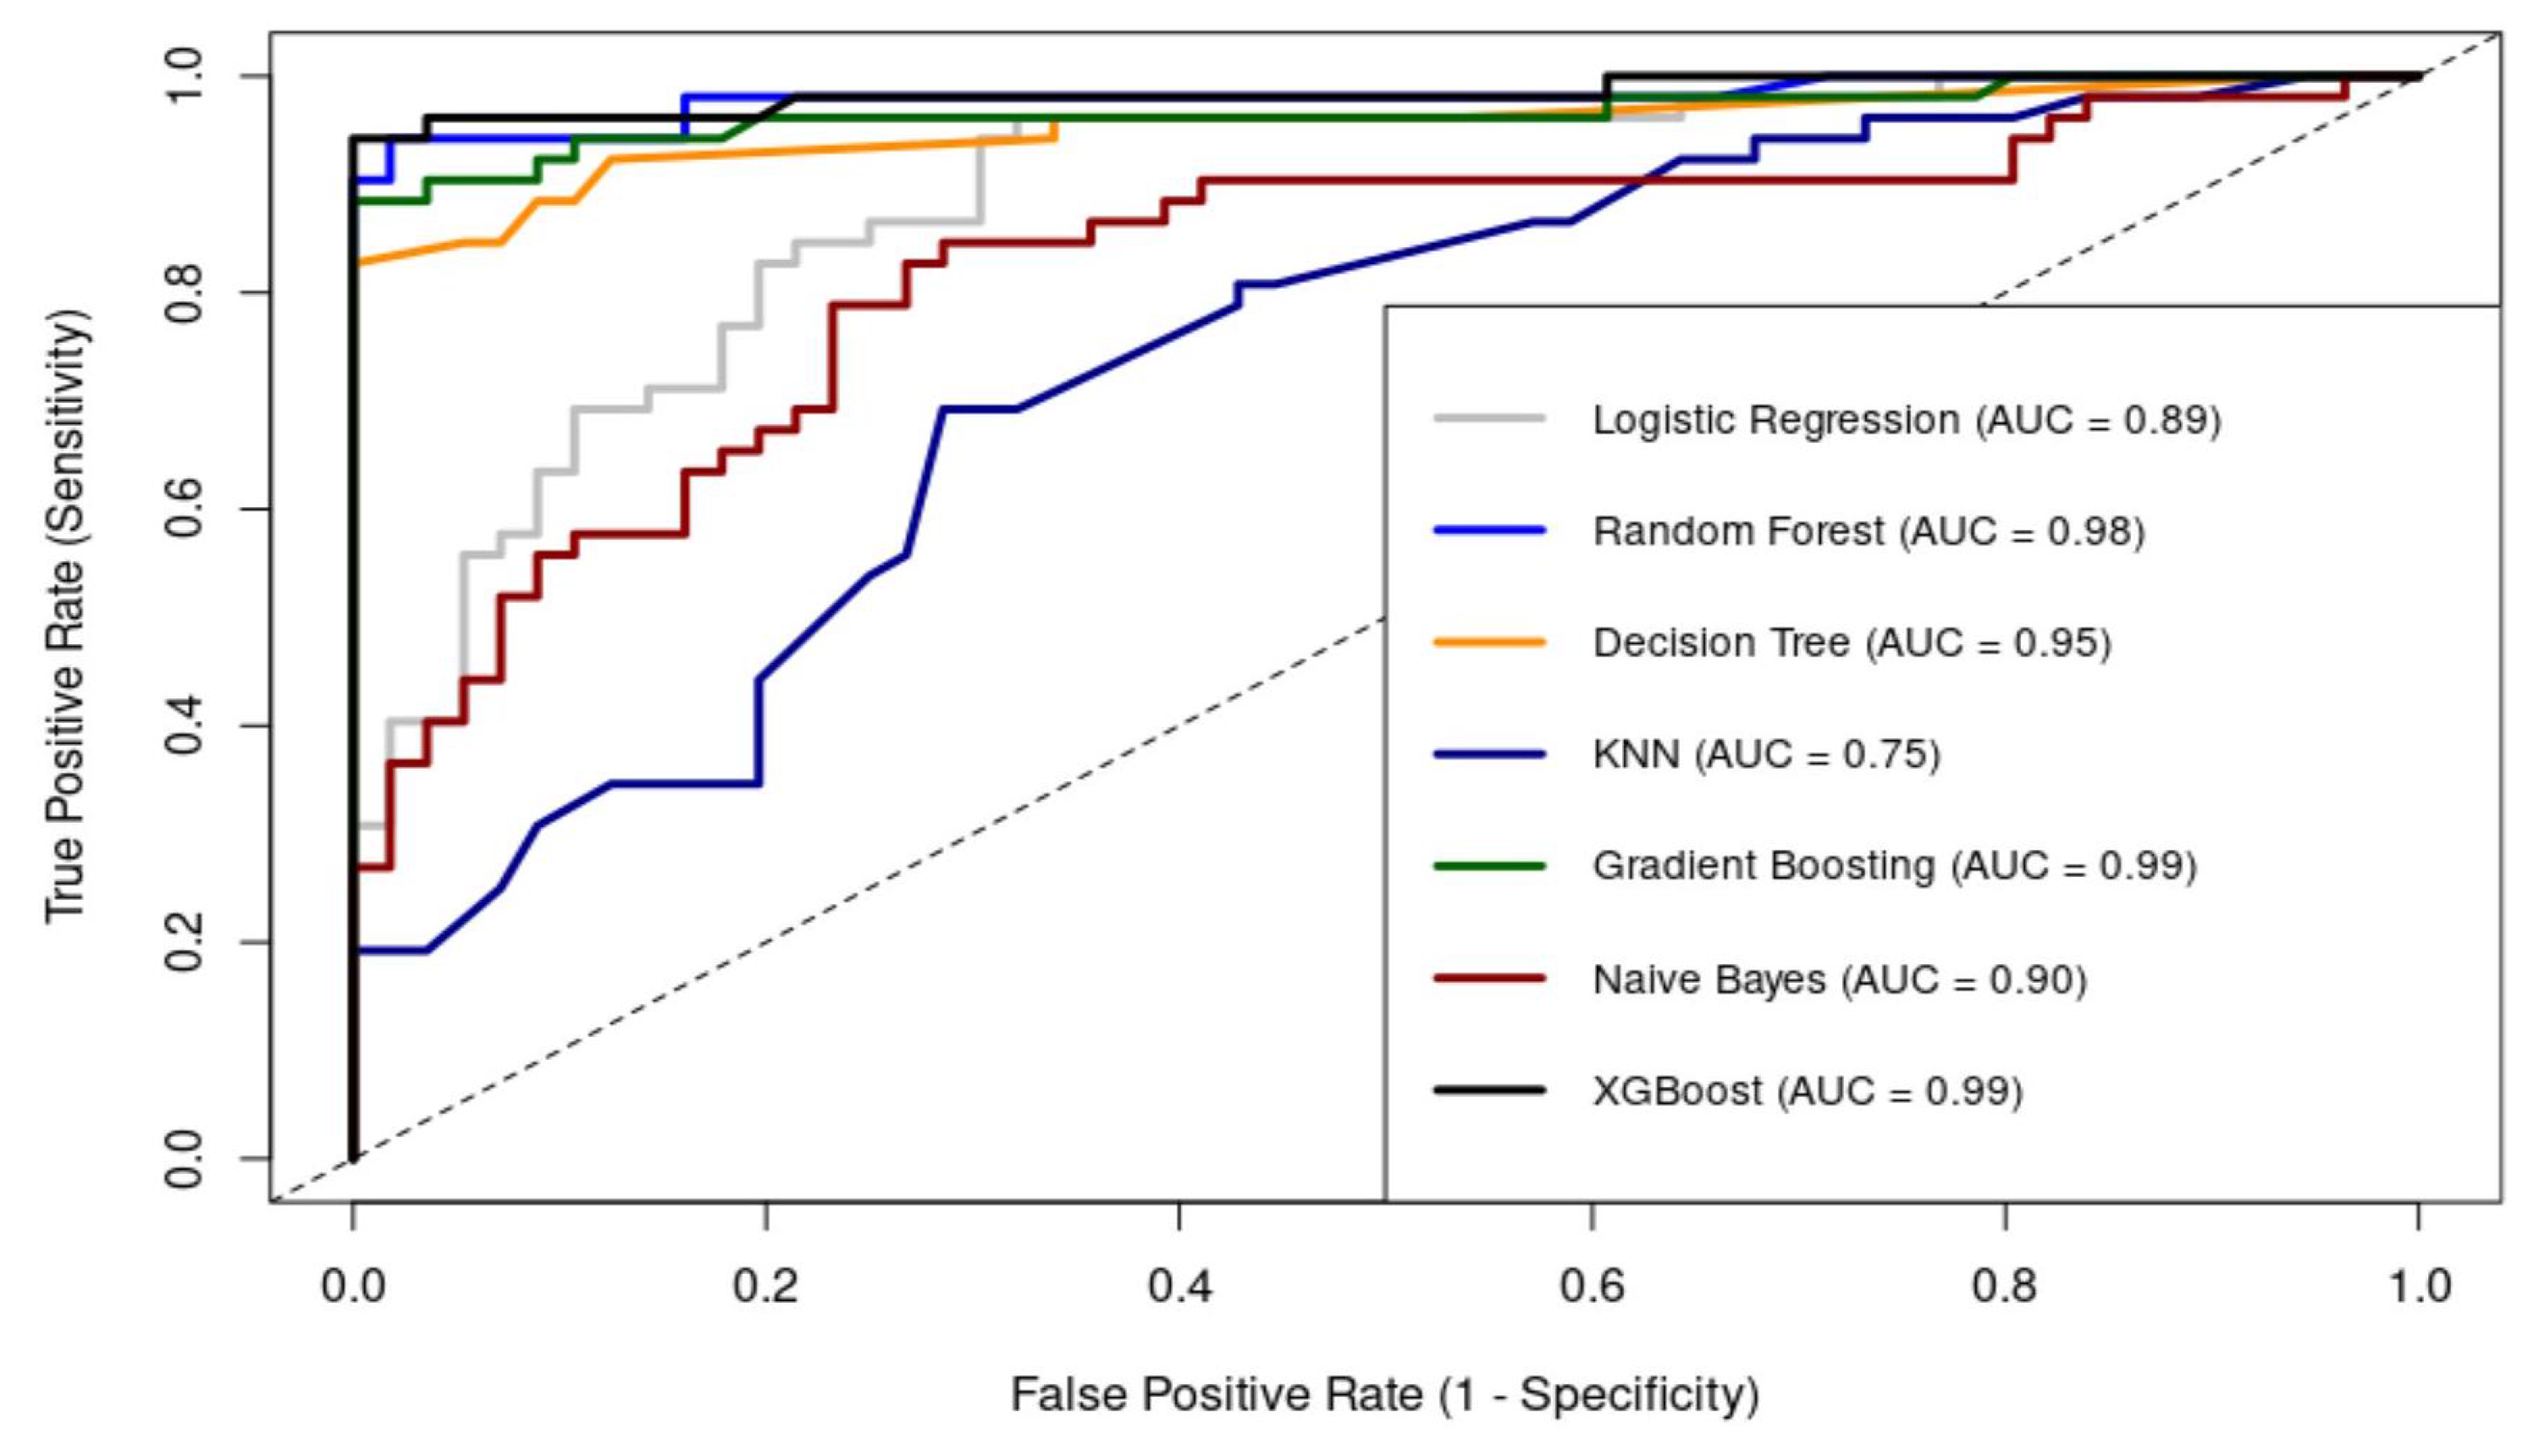
Figure 7.
Confusion Matrix Performance for Models on Test set ( (1 = positive class, 0 = negative class).
Figure 7.
Confusion Matrix Performance for Models on Test set ( (1 = positive class, 0 = negative class).
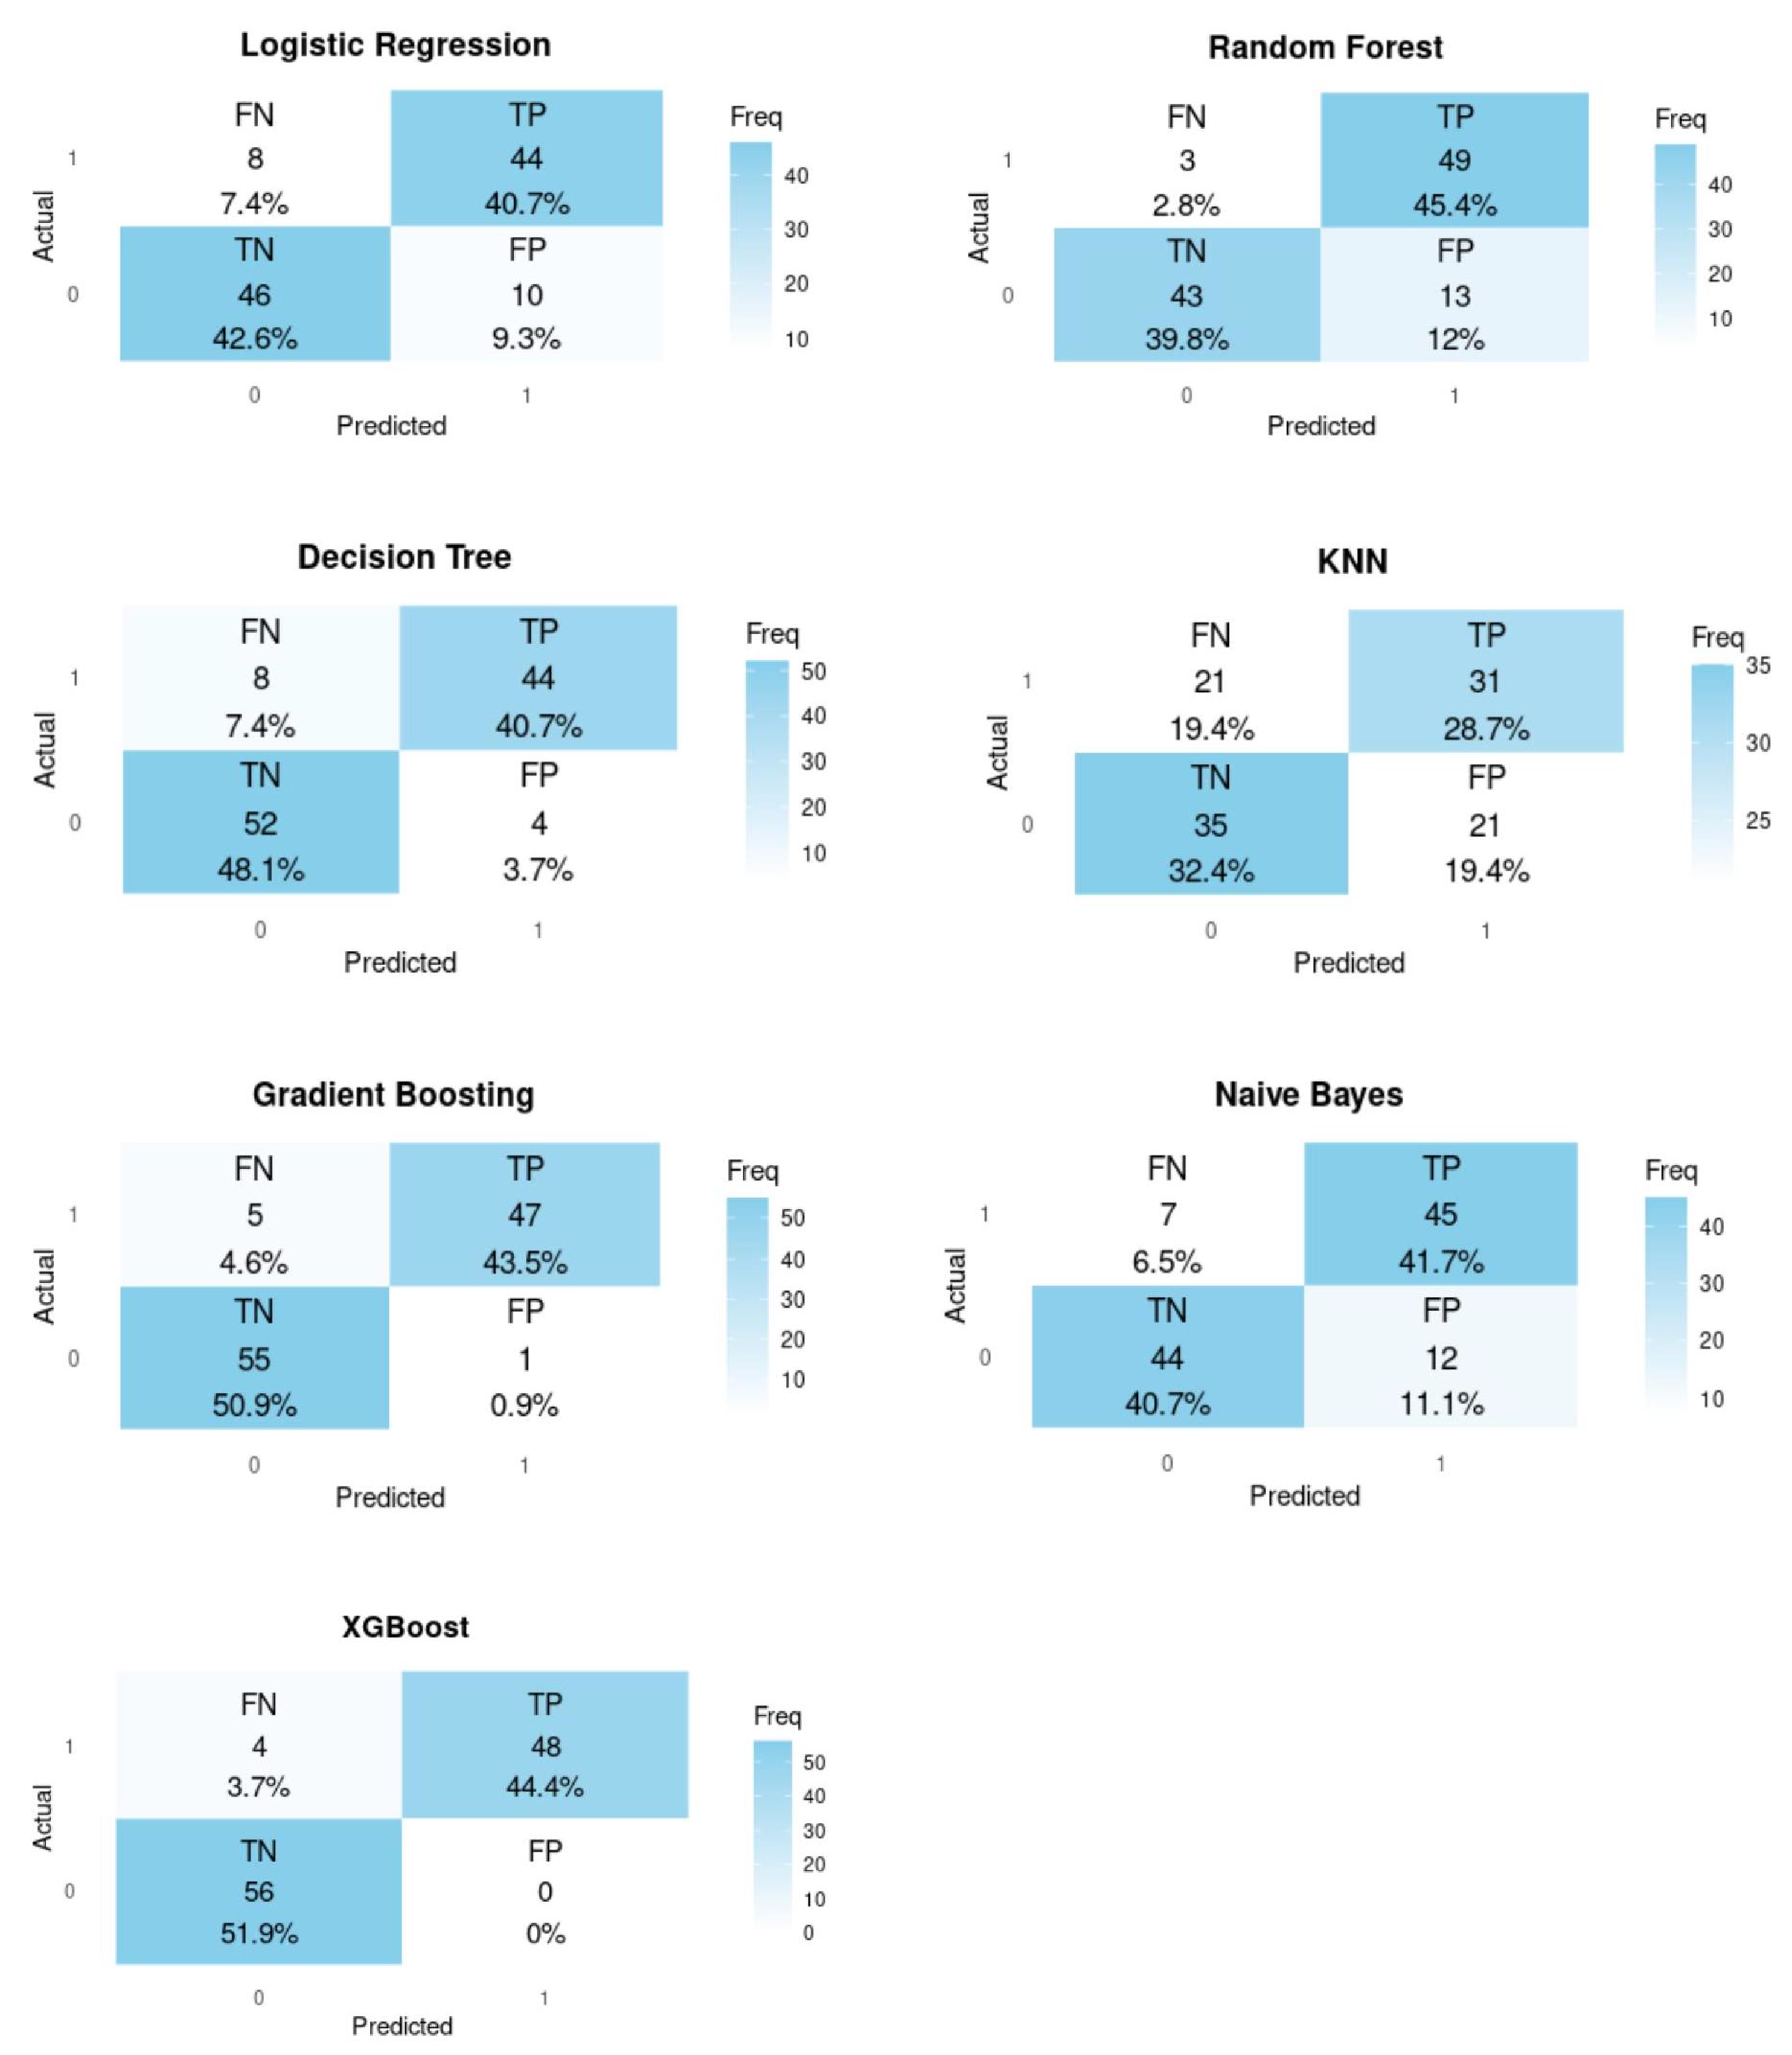
Figure 8.
Comparison of Model Performance on Evaluation and Test Sets.
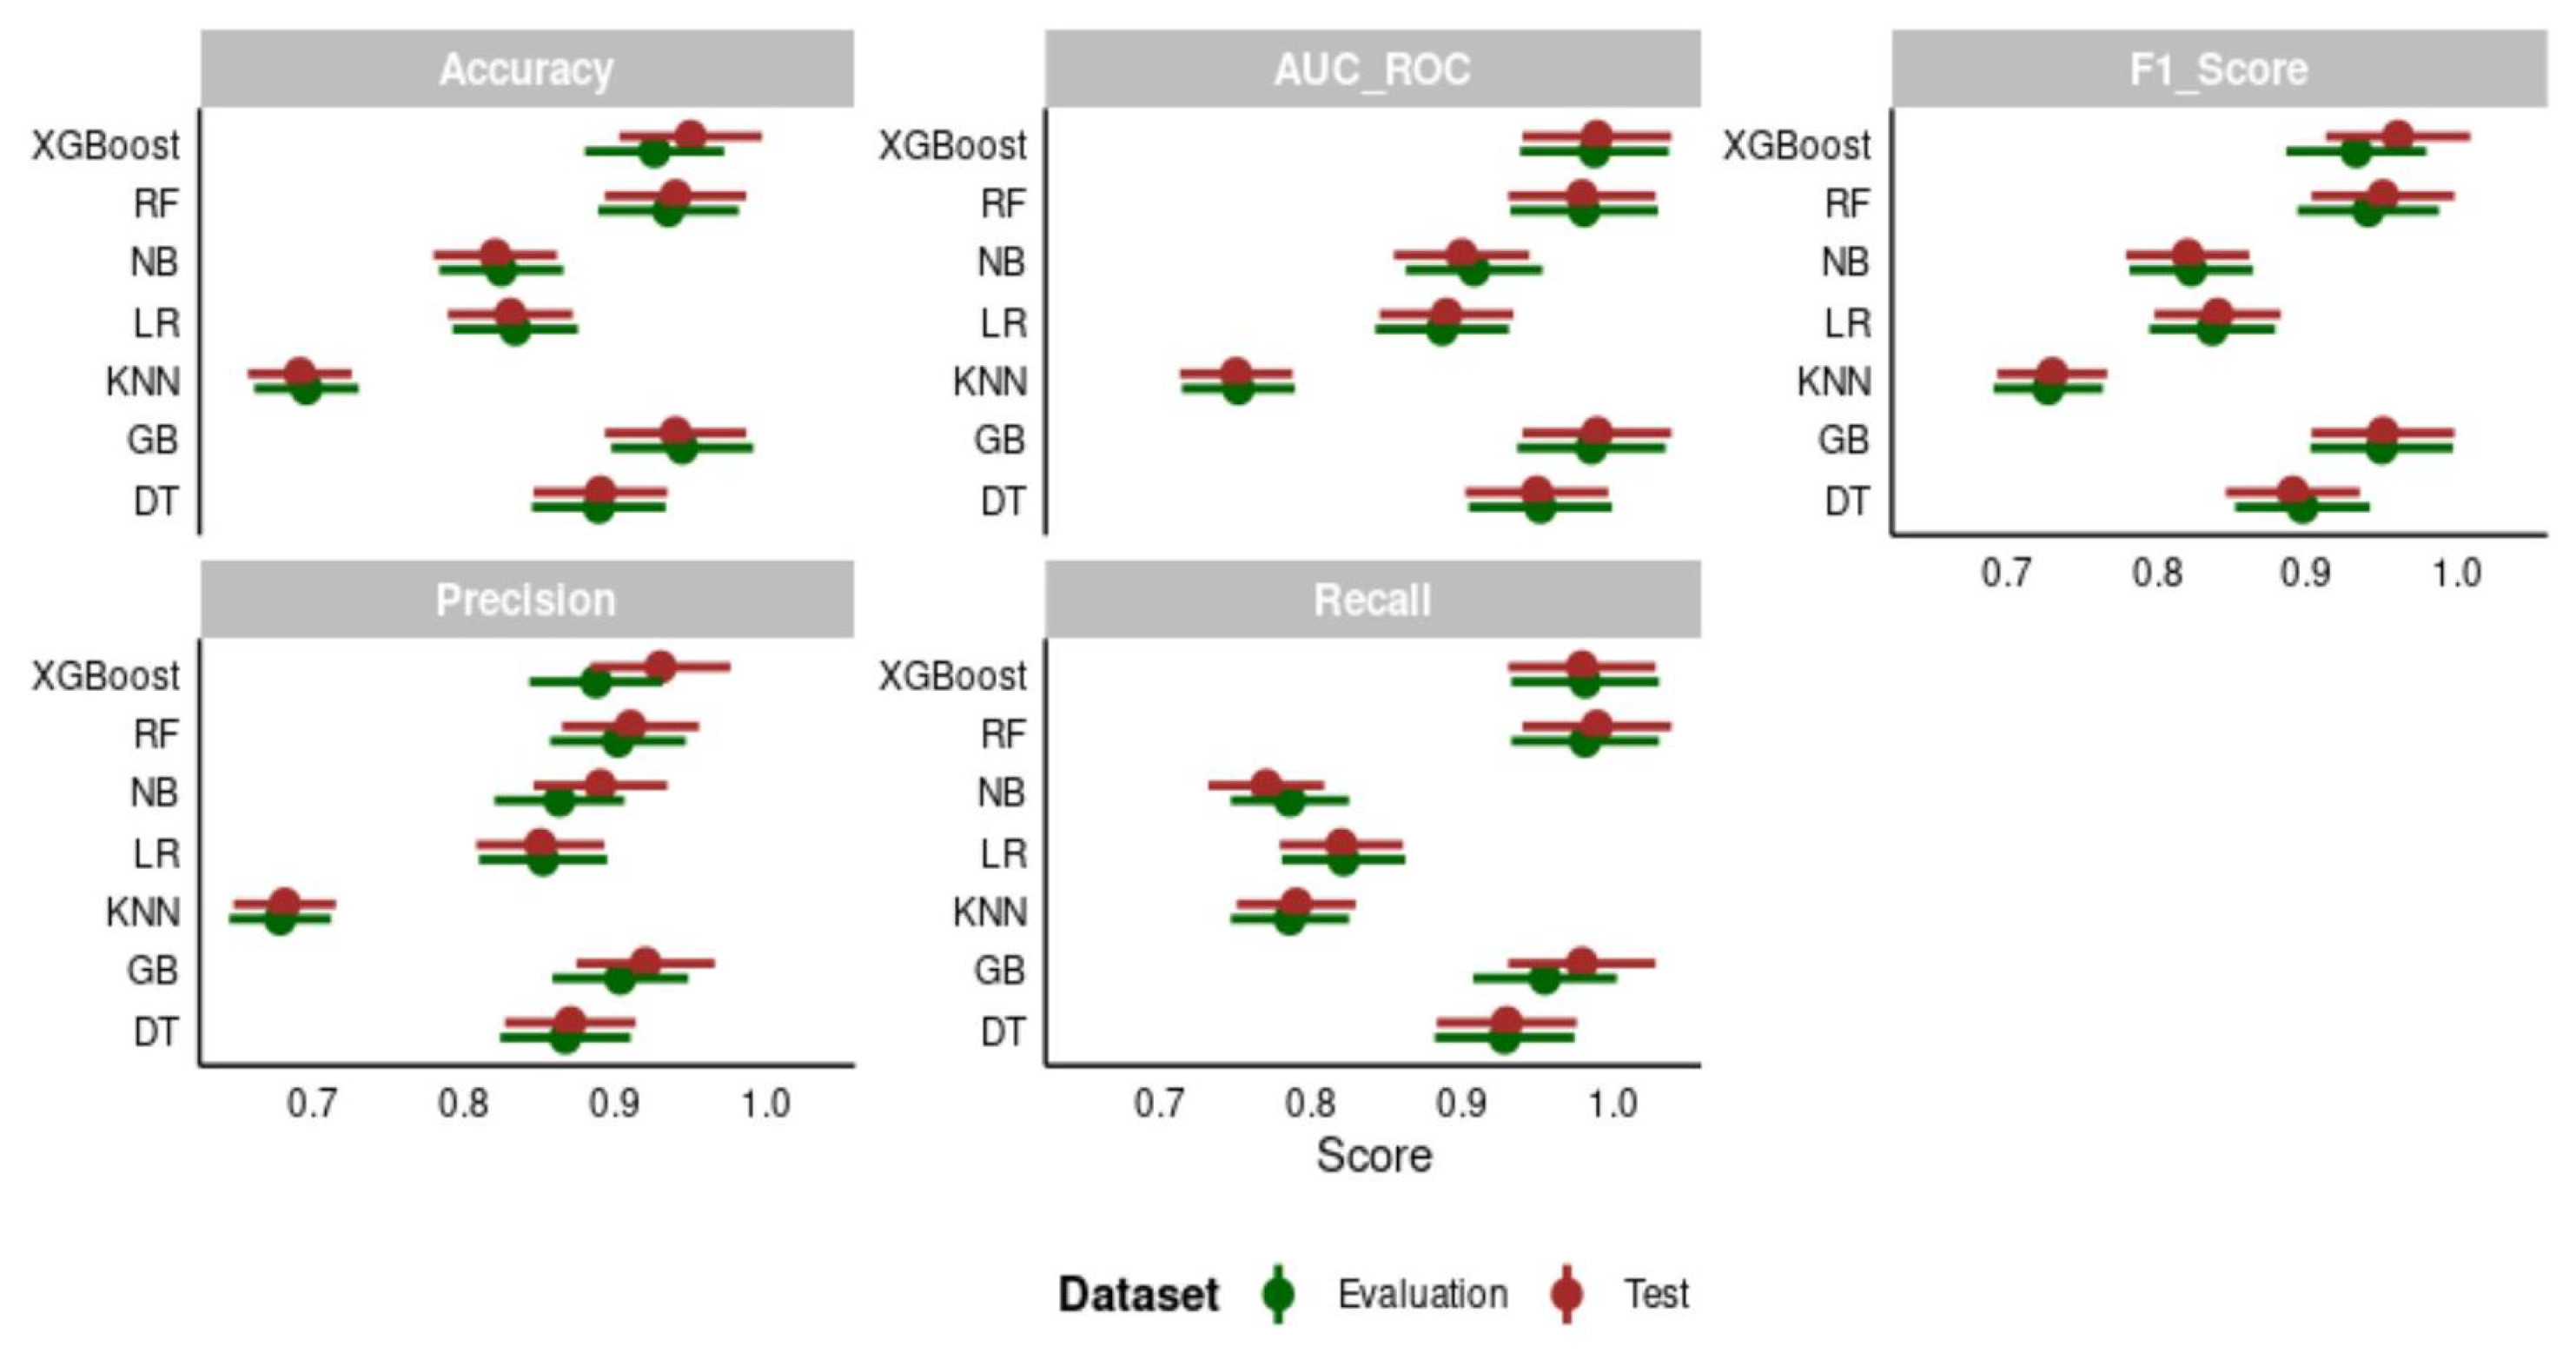
Figure 9.
Ensemble Model Performance on test set.
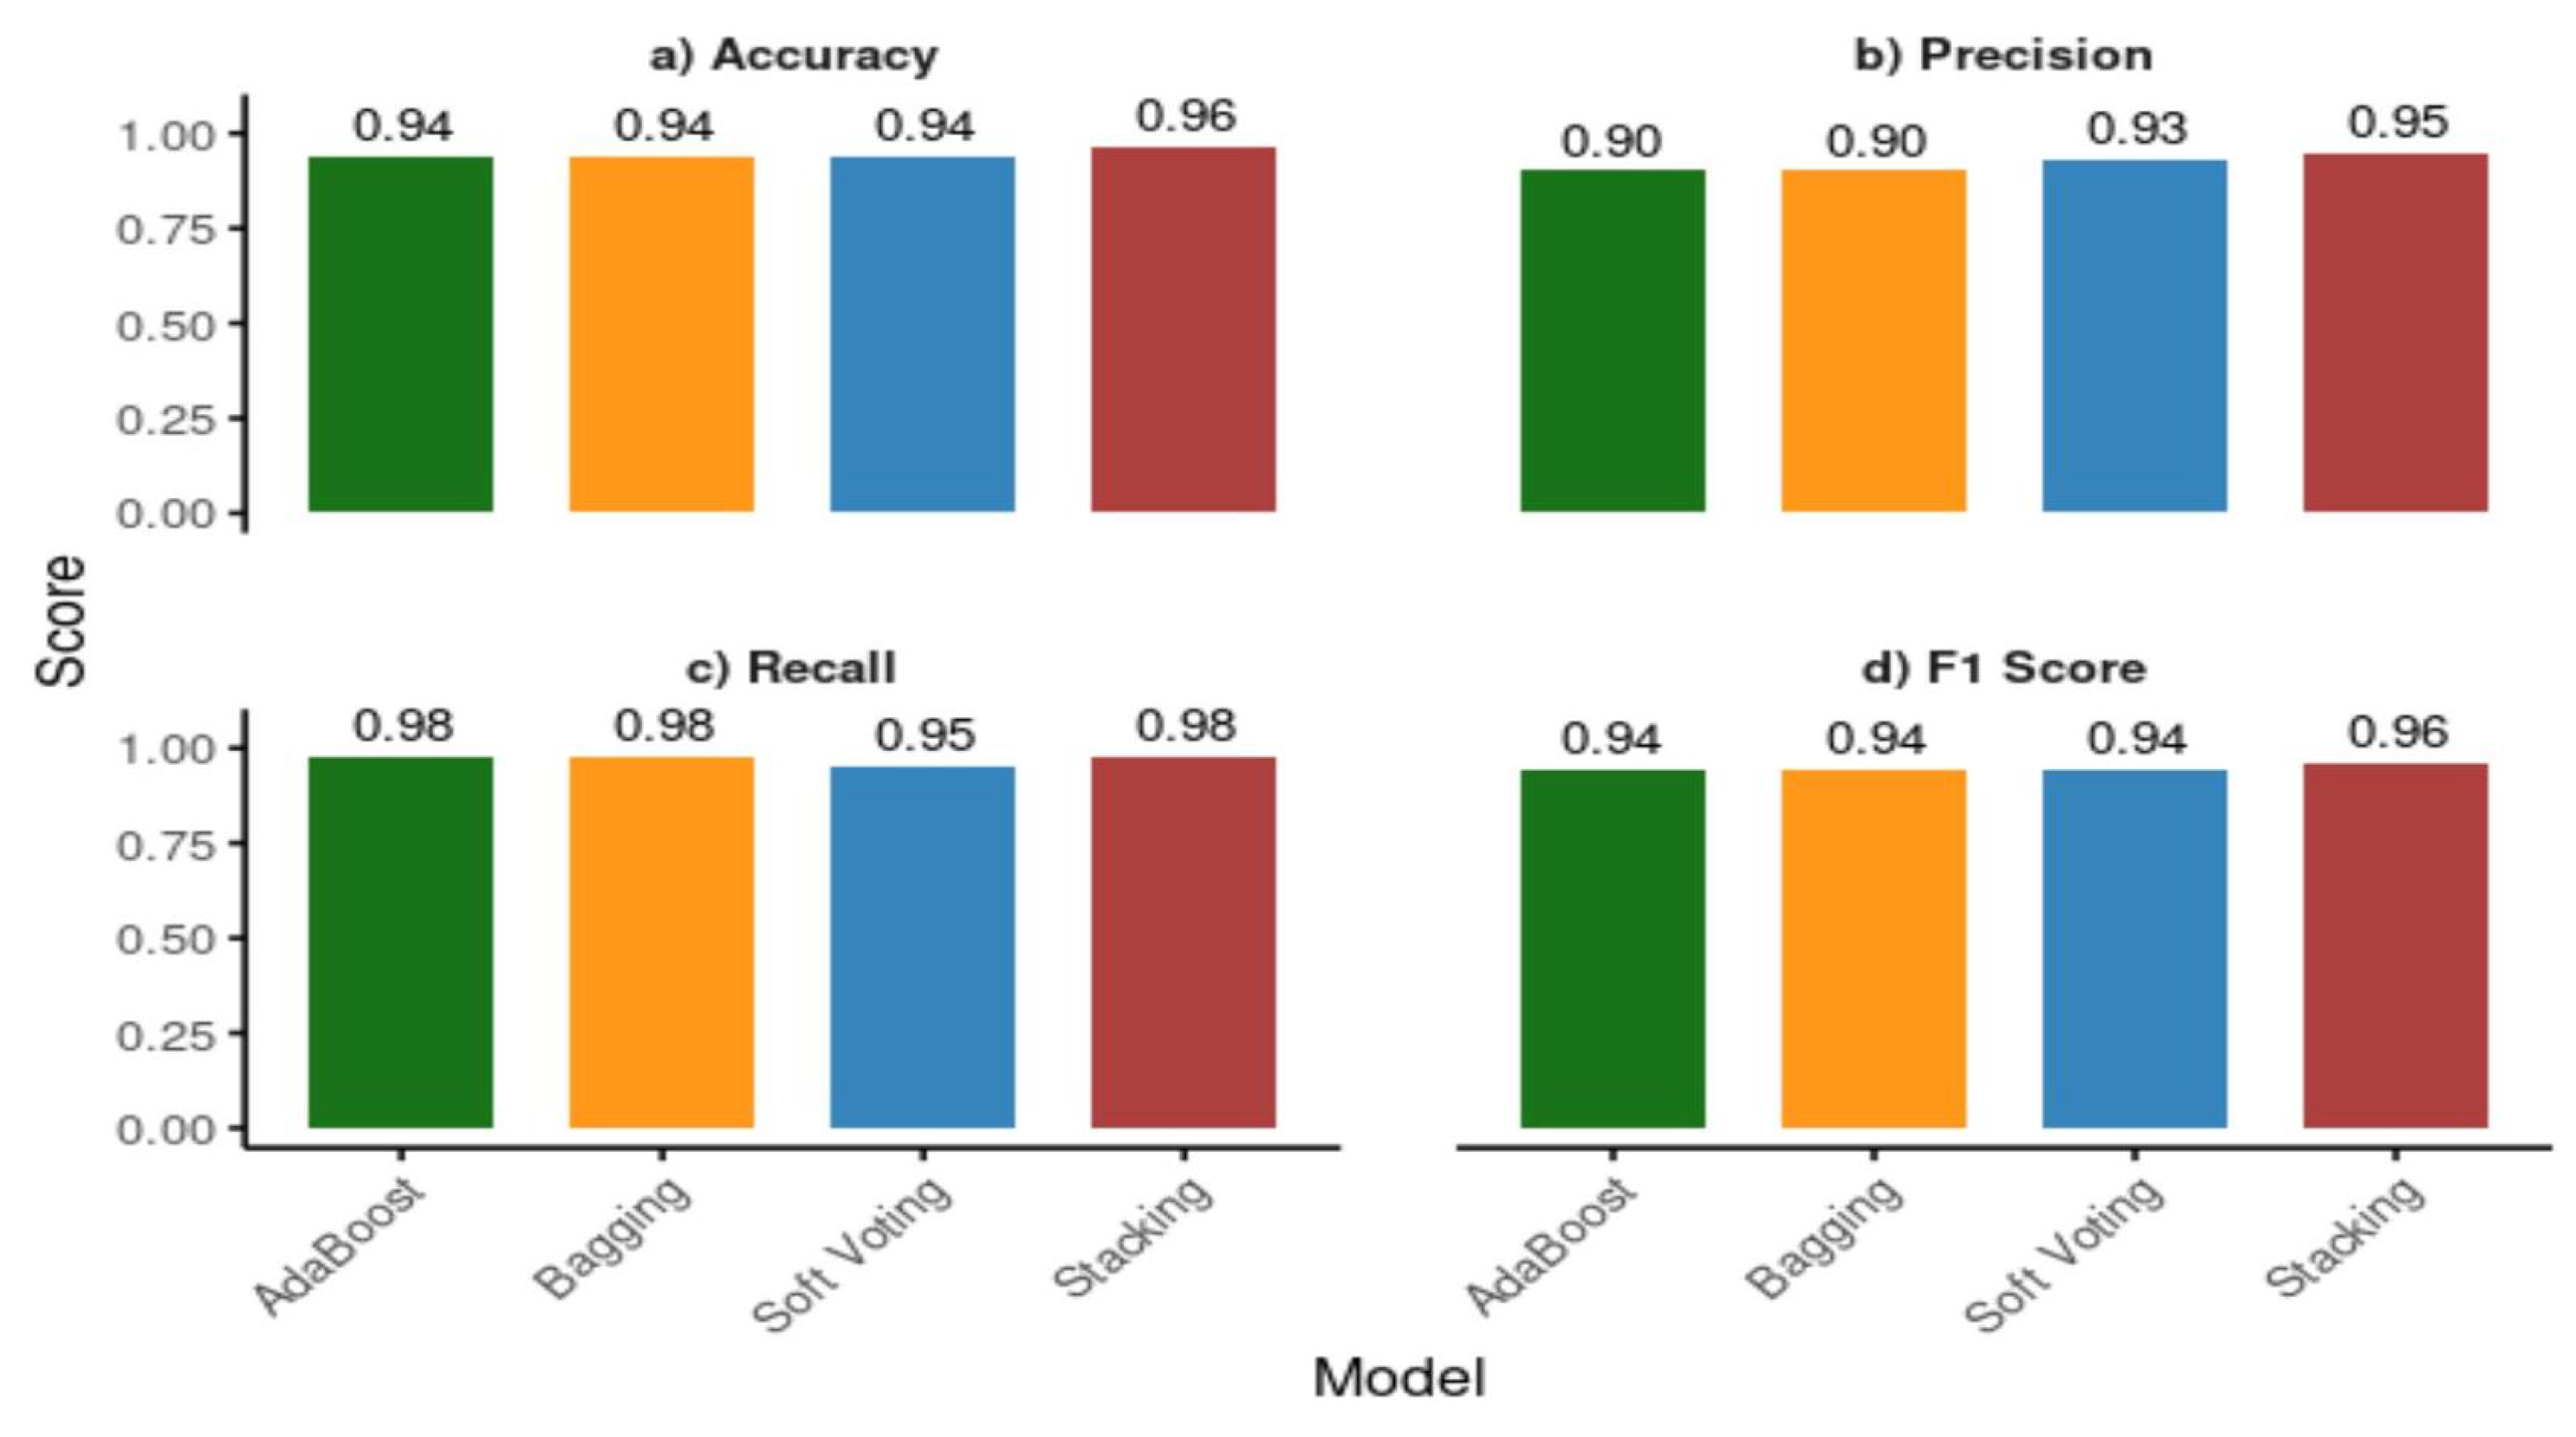
Figure 10.
ROC Curve Analysis on test set Performance for Ensemble Models.
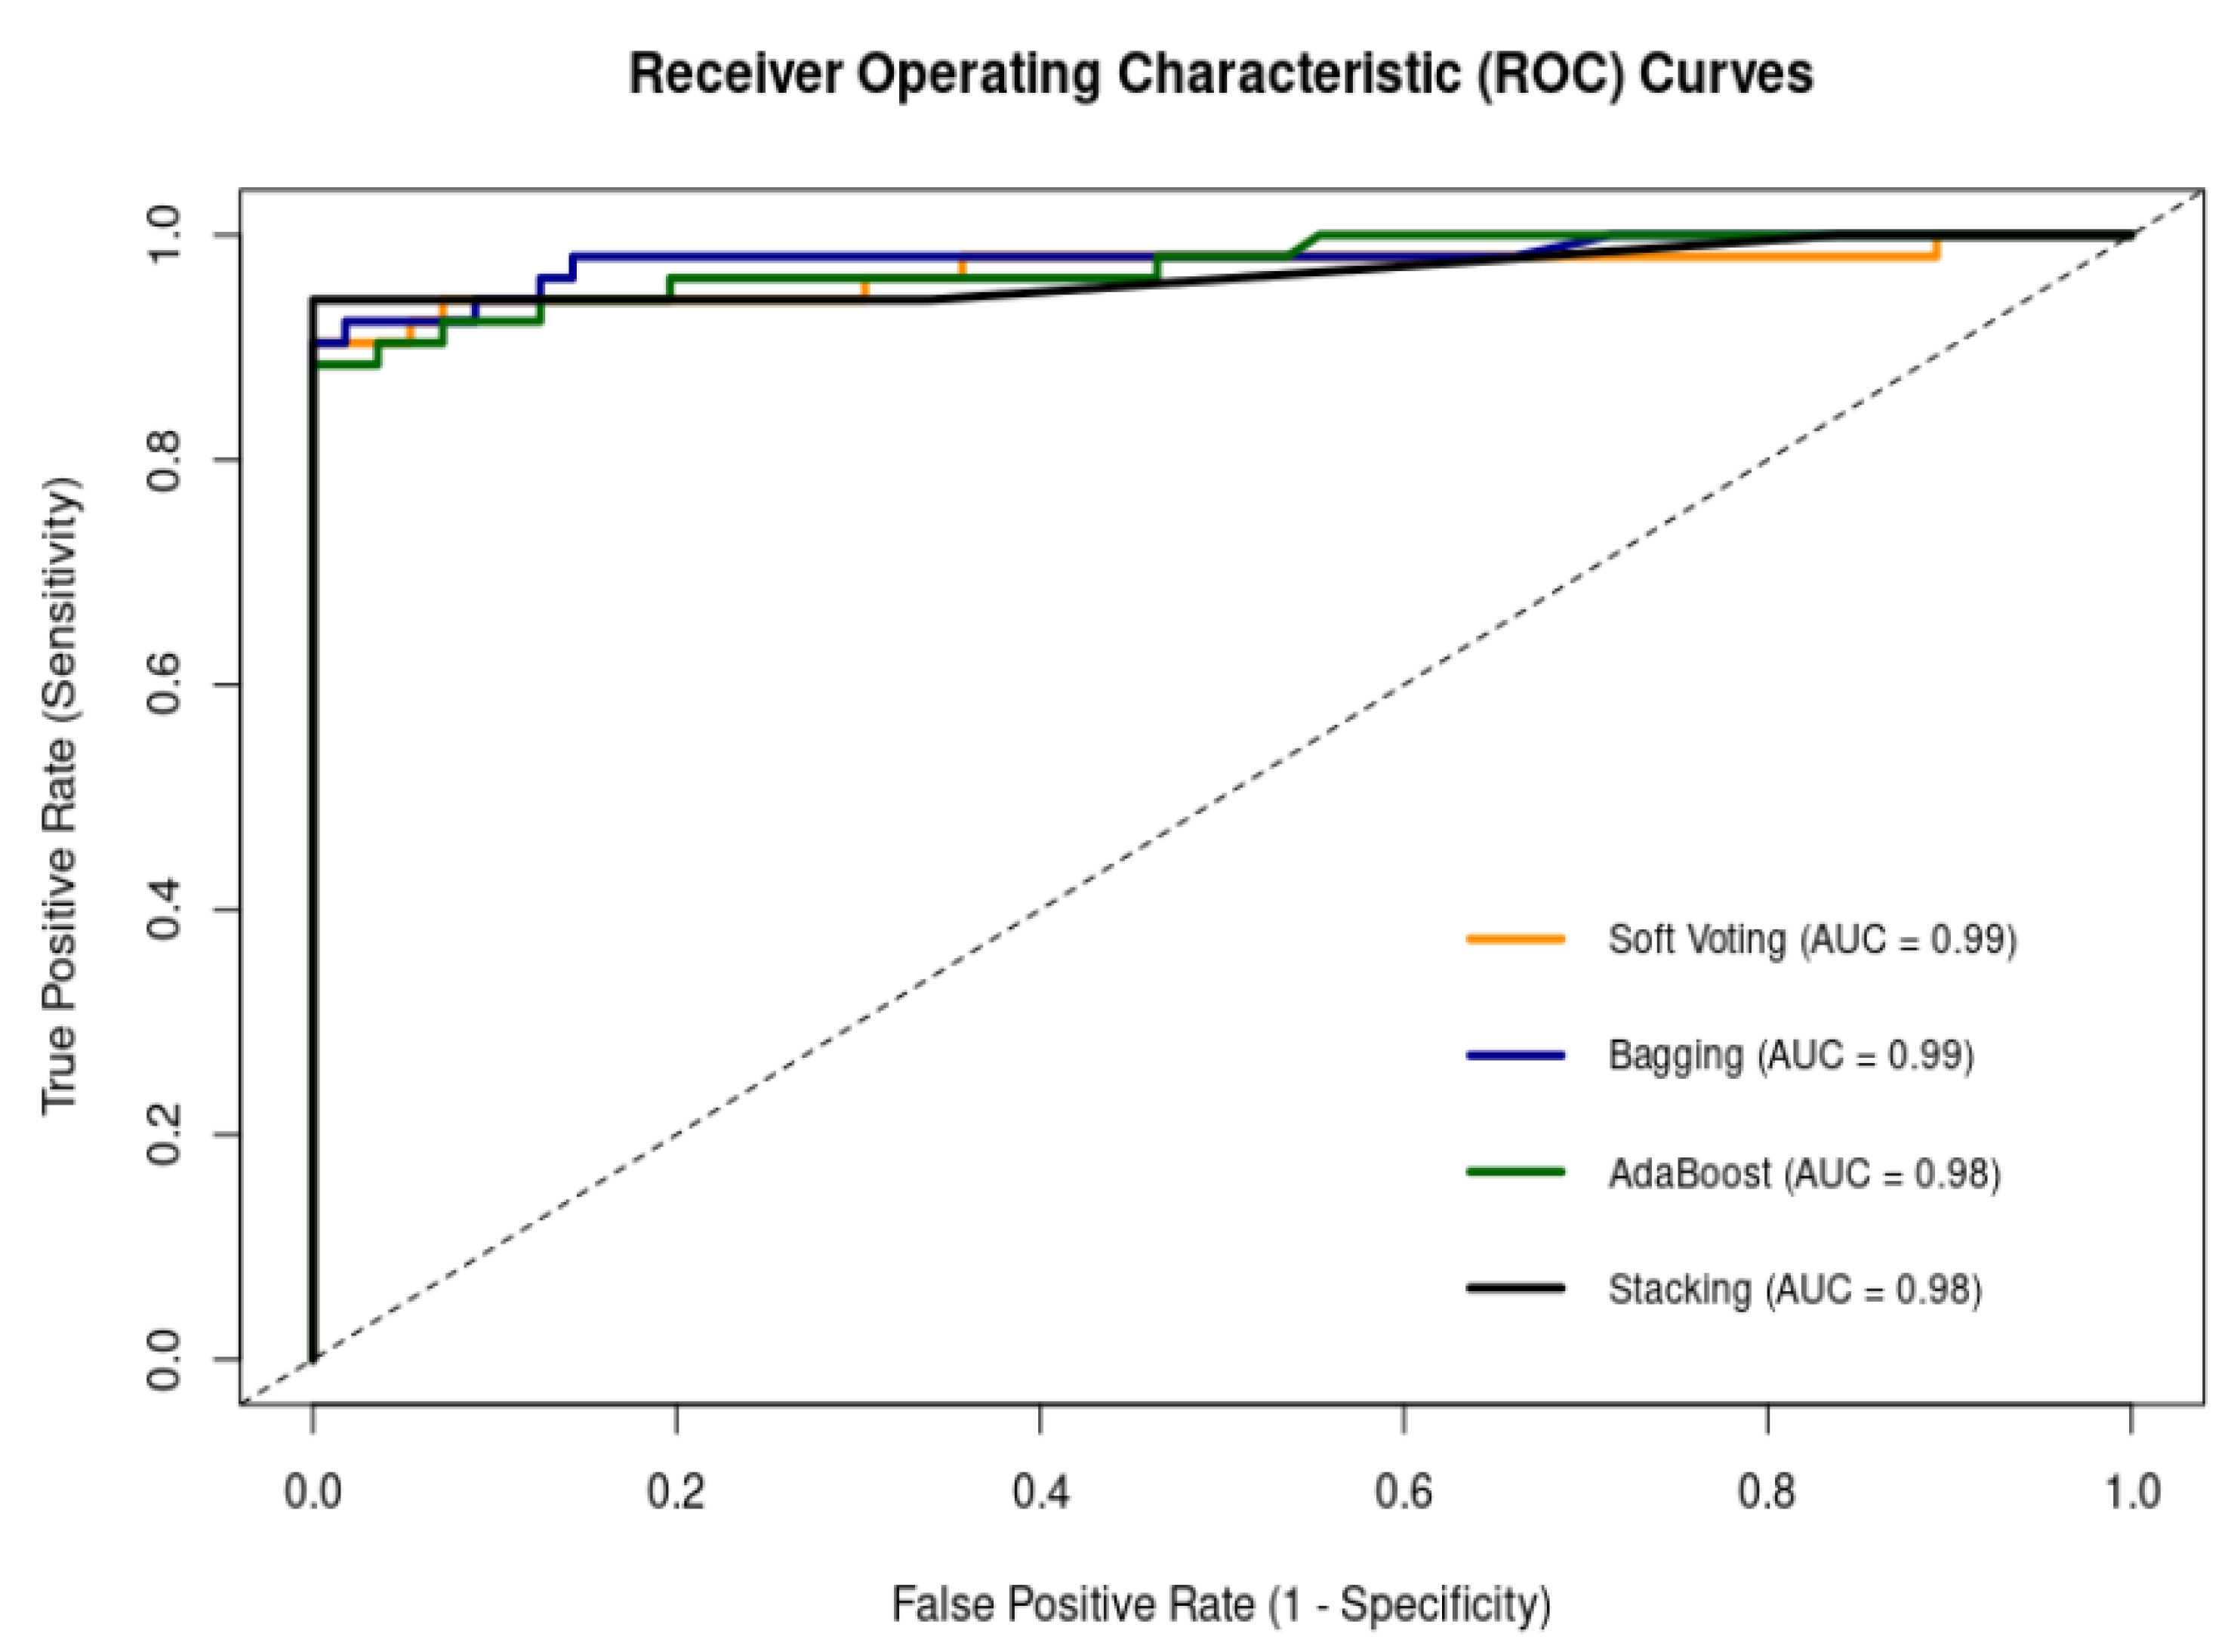
Figure 11.
Confusion matrix performance of ensemble models on the test set (1 = positive class, 0 = negative class).
Figure 11.
Confusion matrix performance of ensemble models on the test set (1 = positive class, 0 = negative class).
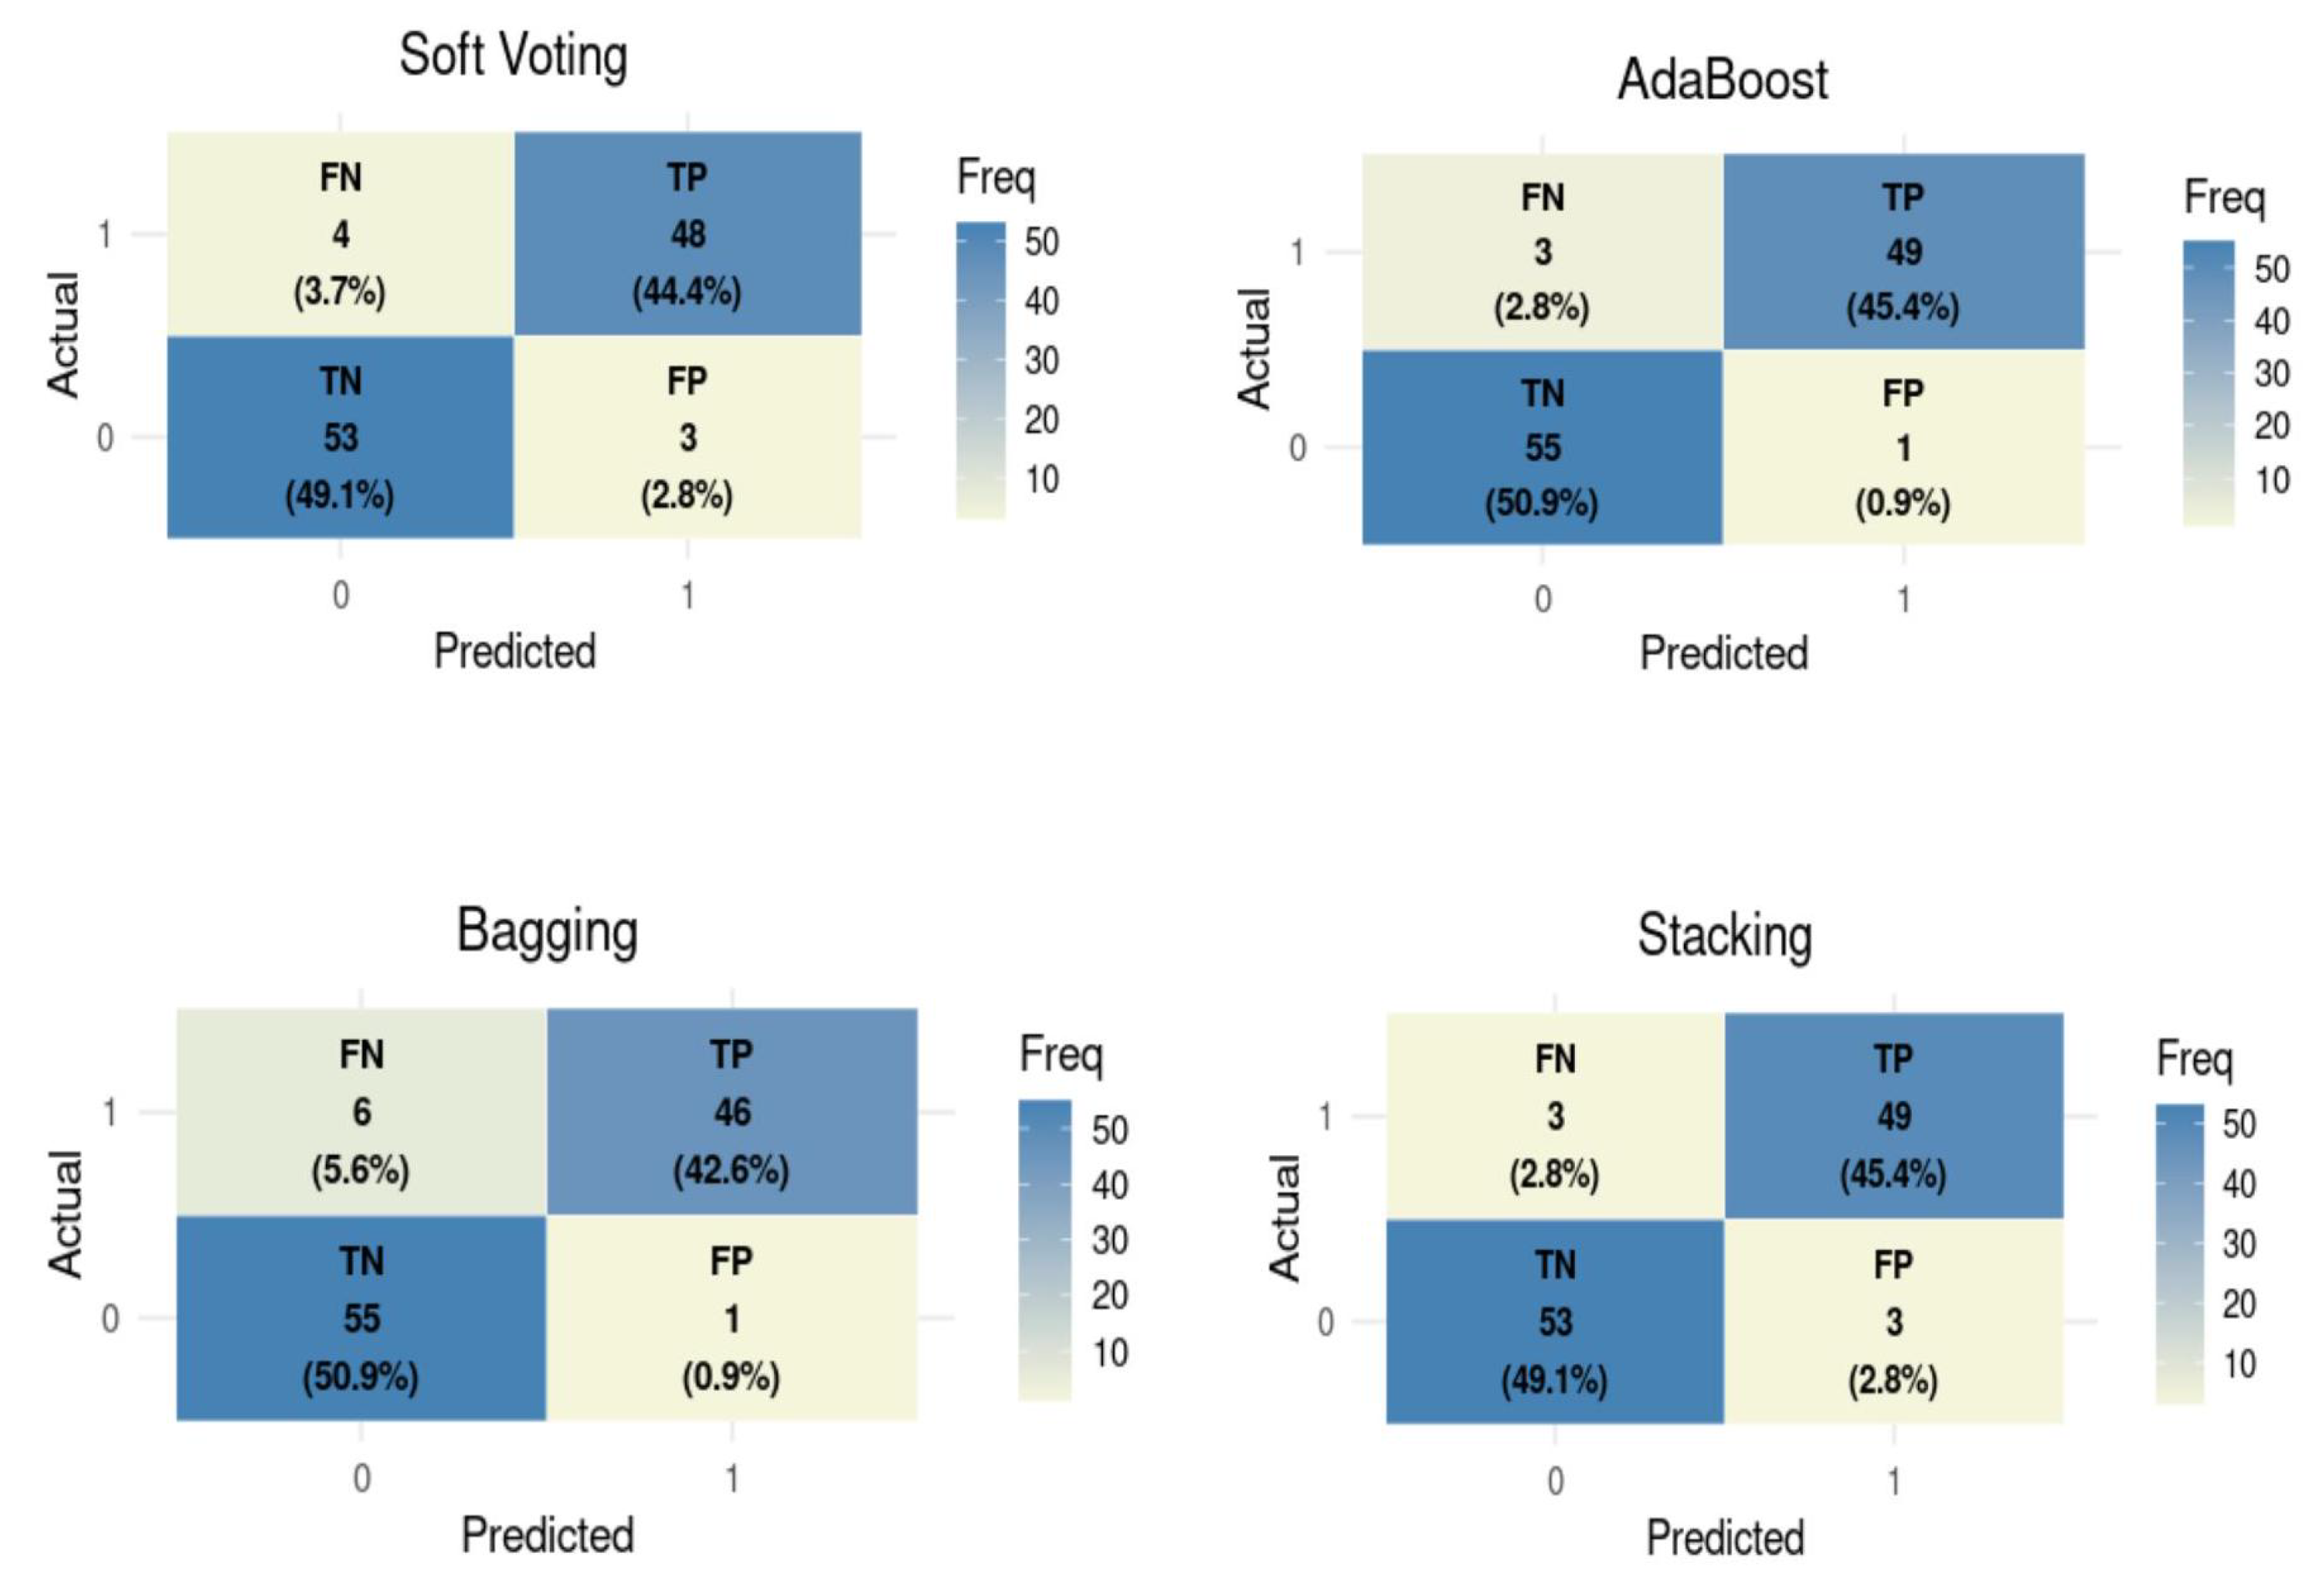

Table 1.
Data Coding Description.
| Feature Name | Feature Description | DataType | Levels | Encoding |
|---|---|---|---|---|
| Residence | Living Environment | Categorical | Gutu = 1, Gweru = 2 | 1,2 |
| Age | Patient’s age in years | Integer | 0 to 95 | Continuous (Binning) |
| Gender | Biological sex of a patient | Categorical | Male , Female | 1,0 |
| Headache | Presence of headache symptom | Binary Integer | Yes , No | 1,0 |
| Fever | Presence of fever symptom | Binary Integer | Yes , No | 1,0 |
| Abdominal Pain | Presence of abdominal Pain symptom | Binary Integer | Yes , No | 1,0 |
| Diarrhea | Presence of diarrhea symptom | Binary Integer | Yes , No | 1,0 |
| Chills | Sudden cold sensations | Binary Integer | Yes , No | 1,0 |
| Travel History | Recent travel to malaria-endemic areas | Binary Integer | Yes , No | 1,0 |
| Diagnosis | Malaria diagnosis outcome | Categorical | Positive , Negative | 1,0 |
Table 2.
Baseline characteristics for all the participants in this study.
| Variable | Category | Negative () | Positive () | Total () | p-value |
|---|---|---|---|---|---|
| Gender | Male | 283 (50.4%) | 41 (54.7%) | 324 (50.9%) | 0.483 |
| Female | 279 (49.6%) | 34 (45.3%) | 313 (49.1%) | ||
| Fever | Yes | 371 (66.0%) | 63 (84.0%) | 434 (68.1%) | 0.002 ** |
| No | 191 (34.0%) | 12 (16.0%) | 203 (31.9%) | ||
| Chills | Yes | 350 (62.3%) | 61 (81.3%) | 411 (64.5%) | 0.001 ** |
| No | 212 (37.7%) | 14 (18.7%) | 226 (35.5%) | ||
| Headache | Yes | 521 (92.7%) | 69 (92.0%) | 590 (92.6%) | 0.826 |
| No | 41 (7.3%) | 6 (8.0%) | 47 (7.4%) | ||
| Diarrhea | Yes | 149 (26.5%) | 31 (41.3%) | 180 (28.3%) | 0.007 ** |
| No | 413 (73.5%) | 44 (58.7%) | 457 (71.7%) | ||
| Abdominal Pain | Yes | 166 (29.5%) | 38 (50.7%) | 204 (32.0%) | <0.001 ** |
| No | 396 (70.5%) | 37 (49.3%) | 433 (68.0%) | ||
| Travel History | Yes | 198 (35.2%) | 37 (49.3%) | 235 (36.9%) | 0.017 * |
| No | 364 (64.8%) | 38 (50.7%) | 402 (63.1%) | ||
| Location | Rural | 287 (51.1%) | 49 (65.3%) | 336 (52.7%) | 0.020 * |
| Urban | 275 (48.9%) | 26 (34.7%) | 301 (47.3%) | ||
| Age Group | 0-5 | 92 (16.4%) | 8 (10.7%) | 100 (15.7%) | 0.298 |
| 6-15 | 62 (11.0%) | 6 (8.0%) | 68 (10.7%) | ||
| 16-30 | 160 (28.5%) | 19 (25.3%) | 179 (28.1%) | ||
| 31-45 | 104 (18.5%) | 21 (28.0%) | 125 (19.6%) | ||
| 46-60 | 89 (15.8%) | 11 (14.7%) | 100 (15.7%) | ||
| >60 | 55 (9.8%) | 10 (13.3%) | 65 (10.2%) |
* Percentages shown are column percentages (within diagnosis groups). Significant p-values are indicated by * (), ** ().
Table 3.
VIF analysis output for correlation analysis.
| Variable | VIF Value |
|---|---|
| Chills | 1.35 |
| Fever | 1.24 |
| Diarrhoea | 1.12 |
| Headache | 1.06 |
| Abdominal Pain | 1.06 |
| Residence | 1.04 |
| Travel History | 1.04 |
| Age | 1.03 |
| Gender | 1.01 |
Disclaimer/Publisher’s Note: The statements, opinions and data contained in all publications are solely those of the individual author(s) and contributor(s) and not of MDPI and/or the editor(s). MDPI and/or the editor(s) disclaim responsibility for any injury to people or property resulting from any ideas, methods, instructions or products referred to in the content. |
© 2026 by the authors. Licensee MDPI, Basel, Switzerland. This article is an open access article distributed under the terms and conditions of the Creative Commons Attribution (CC BY) license (http://creativecommons.org/licenses/by/4.0/).
Copyright: This open access article is published under a Creative Commons CC BY 4.0 license, which permit the free download, distribution, and reuse, provided that the author and preprint are cited in any reuse.


