Submitted:
26 January 2026
Posted:
27 January 2026
You are already at the latest version
Abstract
The concentrations of PTEs and Fe₂O₃ increase from the sand fraction to the silt fraction, although the magnitude of this increase is not uniform (Zn > Cu > As > Pb), while SiO₂ content is not affected by particle size. In general, PTE concentrations are lower in wet samples than in dry samples. The ratio of the element concentration in the wet sample to that in the air-dried sample, together with the gravimetric moisture content (%), were plotted in central scatter plots, which allowed the identification of outliers. The inverse relationship observed between the concentration of certain elements and moisture content may be explained by the geochemical characteristics of the sample.
Moisture in both manually and mechanically ground samples influences analytical ac-curacy, even when the processing time is identical. Triplicate samples indicate small-scale heterogeneity driven by post-depositional alteration of the tailings, as well as element associations (e.g., Fe₂O₃–As) dictated by the mineralogical composition of the source material (e.g., arsenopyrite).
Keywords:
sample preparation
; sediments
; tailing pond
; potentially toxic elements
; X-ray fluorescence
1. Introduction
An inventory of scientific articles based on the keywords “X-ray fluorescence (pXRF)–methods” in the Web of Science database for the period 2003–2025 indicates a slight increase in the number of publications, from 42 to 58. When applying subject area filters such as Environment, Geology, Chemistry, and Archaeology, the number of articles addressing sample preparation methods decreases to fewer than five, while studies specifically referring to samples from mine waste dumps are even fewer [1,2,3]. Furthermore, the keyword combination “pXRF sample preparation” yielded an even smaller number of scientific publications (6–14) over the same time interval [4,5].
Field-portable X-ray fluorescence (pXRF) analyzers have advanced rapidly in recent years, allowing for increasingly sensitive and rapid measurements. As a result, they are widely applied in environmental monitoring and geological research [6], whith implications for the rapid monitoring of abandoned mine sites.
The performance of pXRF technology ranges from very good for certain trace elements (Cu, Pb, As) to good for others [7], and the elements analyzed in this study fall within these categories. Many studies have focused on the variability of XRF measurements, which results from both the heterogeneity of soils and sediments and sample preparation methods. Moisture content reduces the apparent concentration due to dilution effects and increased scattering; however, pXRF measurements are generally considered acceptable when moisture levels remain below 20% [8,9].
Texture is a key factor controlling the retention and release of trace elements, with coarse-textured materials exhibiting lower sorption capacity compared to fine fractions [10]. Studies conducted in sulfide deposits have reported a positive correlation between trace element concentrations and the proportion of particles <63 µm [11], whereas in soil samples with particle sizes <2 mm, sample heterogeneity and matrix effects may be considered negligible [12]. When higher analytical precision is required, pulverization of the samples is recommended in order to minimize grain-size effects [13].
The post-mining evolution of waste material (hydration–dehydration, oxidation, etc.) and the deposition of materials with distinct geochemical characteristics at the edges of the waste pile, as observed at Horse Creek, can accentuate geochemical variability over very small spatial scales. The formation of surface crusts on tailing ponds results from the precipitation of secondary minerals [14] which leads to increased concentrations of certain potentially toxic elements (PTEs), such as As, Cu, Pb, and Zn, within the uppermost centimeters of the deposit [15].
Crystals or localized enrichments of oxides and trace elements frequently occur in unhomogenized samples, whether of natural or anthropogenic origin, thereby increasing analytical uncertainty due to the nugget effect [16,17]. If sieving is not possible, the uncertainty in the measurements of these elements can be reduced by performing multiple measurements of a single sample [16]. Nugget effects can also be mitigated and uncertainty reduced by averaging multiple measurements [8].
This study aims to assess the variability in concentrations of selected PTEs and oxides within the surface layer of the Horse Creek tailing pond (Romania) as a function of sample preparation method.
2. Materials and Methods
2.1. Study Area and Physiography
The Horse Creek tailing pond is situated in the northeastern sector of the Eastern Carpathians at 47º32’37” N latitude and 25º26’37” E longitude (Figure 1a). It was constructed within the riverbed of the stream of the same name, although the watercourse is protected by a system of pipes. The tailing pond covers an area of 7.5 hectares and comprises of nine terraces on its southern side, which are affected by deep erosion, whereas the lower terraces have been stabilized with planted vegetation (Figure 1b). The nearest settlement, Fundu Moldovei, lies 1.4 km to the southwest, and the closest urban center, Câmpulung Moldovenesc, is located 4 km to the west.
The south-east mountain slope promotes the accumulation of precipitation-derived runoff in the western sector of the tailing pond, where a small gully has formed and drains water in the opposite direction. At the contact between the slope and the pond, excavated material (metamorphic rocks, limestone, and dolomite) from a nearby quarry was deposited in 2023 and 2024 (Figure 1c). Subsequently, precipitation mobilized the fine fraction of this material, which was redeposited on the tailings surface as a band, 2-5 m wide and millimeter thick, extended along the thalweg.
This sulfide-rich tailing pond contains elevated concentrations of harmful metals, and the oxidation of sulfides has led to the formation of acid mine drainage [18], preventing natural revegetation of the pond surface. However, the allochthonous material, combined with increased moisture availability, created locally favorable conditions for herbaceous vegetation along the thalweg (Figure 1c). Pine and birch trees have been planted on the lower terraces of the tailings pond, but deep erosion has led to the development of rills along which the material is transported downstream, contributing to the expansion of the tailings pond surface.
2.2. Geochemical Characteristics
The tailing pond is located in an area dominated by sedimentary rocks (conglomerates, dolomites, sands, and clays); however, the waste stored in the Horse Creek tailing pond originates from the Crystalline–Mesozoic Zone of the Eastern Carpathians, specifically from the district characterized by polymetallic and manganese mineralization associated with epimetamorphic rocks of the Tulgheș Lithogroup [19]. The metamorphic formations of the Tulgheș unit host massive polymetallic sulfide mineralizations in the Fundu Moldovei area. Within this complex, the Tulghes 3 (Tg3) lithostratigraphic unit represents a metasedimentary rhyolitic formation associated with polymetallic ore deposits [20].
The ore deposits consist of sulfide minerals dominated by Cu-rich pyrite and chalcopyrite, associated with sphalerite and galena, and subordinately with arsenopyrite, pyrrhotite, tetrahedrite, bournonite, and ilmenite [21]. Consequently, the relatively high concentrations of Al, Fe, Mg, and K in the tailings are primarily linked to the presence of chlorite, sericite, biotite, and pyrite [22]. The Horse Creek tailing pond was constructed using waste generated by the Fundu Moldovei processing plant, which extracted Cu from polymetallic ores until 2004 [23,24]. After processing, the material was transported through a pipeline and deposited in the Horse Creek riverbed as a tailing pond with a decantation basin. Following the closure of mining operations in 2004, the tailing pond was abandoned and placed under passive conservation without subsequent remediation measures.
2.3. Soil Sampling and Preparation
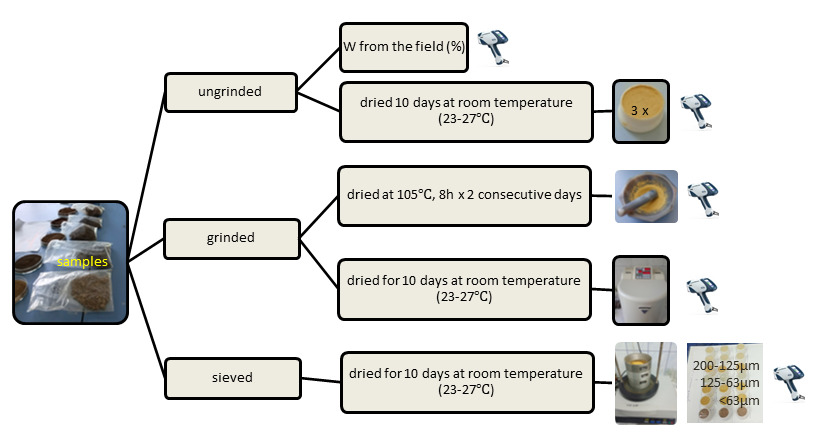
Six samples were collected from the surface of the spoil heap: four from its peripheral zones (S2.1–S2.4) and two from the central area (S2.5 and S2.6) (Figure 1b). The seventh sample (S2.7) was collected from the area covered by allochthonous material, where the layer reached its maximum thickness (5–7 cm) near the contact with the slope. The dominant grain-size fractions within the spoil heap, sample moisture content, the degree of comminution, and analytical variability were identified as key parameters influencing the observed fluctuations in major oxide and trace element concentrations. Fieldwork was conducted over a single day (24 June 2025). Approximately 500 g of sediment was collected from each sampling location and stored in high-density polyethylene zip-seal bags [25]. After each sampling, the knife blade was rinsed with distilled water.
The first set of sample capsules was prepared using unprocessed (unmilled) sediments at their in situ moisture content, and pXRF scanning was performed the following day. After homogenization, the sediment samples were packed into plastic cups with a diameter of 32 mm, sealed with a 6 μm Mylar film, and subsequently analyzed using the pXRF instrument [26]. This procedure was designed to minimize the influence of temperature and moisture variability at the spoil heap surface, which could otherwise affect measurement accuracy. Following the initial analysis, the protective film was carefully removed, and the samples were left to air-dry at room temperature for ten days (23–27 °C). After this period, pXRF measurements were repeated.
The mass of each cup was recorded before and after drying with a precision of 0.01 g, and moisture content (%) was calculated based solely on the sediment mass, excluding the container [27].
The samples stored in bags were transferred into Petri dishes and allowed to dry for ten days at room temperature, under environmental conditions comparable to those used for the capsules. After drying, visually identifiable organic debris (e.g., leaf fragments) was manually removed with tweezers.
Five samples (S2.1–S2.4 and S2.6) were selected to assess the variation in PTEs as a function of particle size. The mineral material was sieved into the following grain-size fractions: 200-125 µm, 125-63 µm and ≤63 µm, using the AS200 vibratory sieve shaker (Retch GmbH, Germany) for 3 min at an amplitude of 1.5 [28]. Previous studies have indicated that the waste pile is predominantly composed of medium and fine sand (>61%)[22], followed by silt (35.3%)[24], without significant contribution from particles larger than 2 mm. Therefore, the fine sand, very fine sand, and silt fractions represent the most relevant components for determining the concentration of PTEs. Samples S2.5 and S2.6 were collected from a proximity to each other (approximately 5 m apart); therefore, grain-size fractionation was performed only for the latter. Sample S2.7 was excluded from granulometric analysis, as it does not fully represent the waste heap material due to the presence of allochthonous deposits.
Reducing the sample size by grinding increases sample homogeneity and considerably improves the quality of the pXRF analysis results. Two aliquots of each composite sample were prepared under different conditions. The first aliquot was oven-dried at 105 °C for 8 h over two consecutive days and subsequently ground manually using an agate mortar and pestle [29]. The second aliquot was air-dried at room temperature and then ground using a Pulverisette 6 planetary ball mill (Fritsch GmbH, Germany).
To minimize atmospheric exposure after removal from the oven, the capsules were immediately sealed with a glass lid and ground only after reaching room temperature. The agate mortar and pestle, the 250 mL milling bowl, and the grinding balls were thoroughly rinsed with deionized water between samples to prevent cross-contamination [30]. Sample preparation followed the “one-third rule” recommended for dry milling in planetary ball mills [31].
Mechanical grinding was carried out in a stainless-steel grinding jar using nine new tempered steel balls with a diameter of 20 mm [32]. An amount of sediment equivalent to twice the volume of a capsule (approximately 20 g) was milled at a rotational speed of 300 rpm for 3 minutes. After milling, each capsule was gently tapped on the laboratory bench to resettle the particles and obtain a leveled surface.
2.4. pXRF Measurements and Quality Control
Major element oxides and potentially toxic elements (PTEs) were determined using a portable S1 Titan 800 X-ray fluorescence (pXRF) analyzer equipped with a 50 kV X-ray tube (Bruker, Kennewick, WA, USA). Measurements were performed for 90 s using the GeoExploration application and the Oxide3phase method. The resulting spectra and analytical data were processed and visualized using Bruker Data Stream software [33].
Based on the mineralization characteristics of the Tg3 lithostratigraphic unit, copper (Cu), zinc (Zn), lead (Pb), and arsenic (As) were selected as target PTEs, together with two major oxides (SiO₂ and Fe₂O₃), to evaluate concentration variability as a function of sample preparation method. The pXRF data were converted to oxide values using standard conversion factors for SiO2 and Fe2O3 and reported as percentages [34]. Comparability between datasets was ensured by accounting for variability within paired analyses (e.g., hand-ground versus ball-milled samples).
Hand-ground samples were scanned in triplicate by rotating each cup between measurements [12]. The mean value and standard deviation were used for comparative analysis with the results obtained using other preparation methods.
Quality control was performed by comparing the concentrations of selected elements in the seven samples with those previously determined by energy-dispersive X-ray fluorescence (EDXRF) using an Epsylon 5 XRF instrument for 30 samples from the same site [35]. In that study, samples were dried at 50 °C for 24 h and subsequently sieved through meshes of varying sizes. Therefore, the results can be directly compared with the present data obtained from samples dried at room temperature. The mean values measured by pXRF, with the exception of Cu, closely correspond to the previous research for Pb (1204 mg kg⁻¹), Zn (222 mg kg⁻¹), and As (155 mg kg⁻¹) [35](see Section 3.1). These discrepancies are interpreted as reflecting post-depositional changes in the material rather than analytical uncertainty.
In the present study, relative standard deviation was employed to assess the reproducibility of results obtained from triplicate samples, which were dried at 105 °C and manually ground, for both analyte groups: oxides and PTEs [36].
2.5. Data Analysis
Descriptive statistics for the pXRF measurements were generated using SPSS 27 (International Business Machines Corporation, IBM) and OriginPro 2025 (OriginLab Corporation, Northampton, MA, USA), including measures such as the mean, minimum, maximum, standard deviation, and skewness. Nonparametric statistical approaches are well-suited for small datasets, with the Wilcoxon signed-rank test effectively mitigating the influence of extreme outliers in skewed distributions [37]. Mine waste materials, including tailing ponds, typically produce datasets that deviate from normal distribution patterns, particularly for PTEs and specific oxides. In cases where continuous variables exhibit non-normal distributions, the median is regarded as a more reliable measure of central tendency compared to the mean [38]. However, some authors suggest that normality constraints may be relaxed for small sample sizes [39]. The Shapiro–Wilk test remains the most statistically robust method for assessing normality under such conditions [40].
In this study, the gravimetric moisture content (%) and the ratio between the elemental concentration in the wet sample and that in the air-dried sample (Cw/Cd), visualized using a central scatter plot, were used as diagnostic indicators to identify potential anomalies, which were characterized by higher concentrations in the wet sample relative to those in the dry sample.
The null hypothesis (H₀) of the Wilcoxon signed-rank test asserts that the median difference between sample pairs ground manually (in triplicate) and those processed using a mechanical mill is zero. Under the assumption that the material in the tailing was relatively homogeneous after flotation, additional grinding does not provide new information regarding concentration. In contrast, the alternative hypothesis (H₁) posits that the median difference between the two datasets deviates significantly from zero.
In the second analytical framework, the null hypothesis (H₀) assumes significant differences between mechanically milled and unmilled samples dried at room temperature. Because both datasets present comparable moisture contents, the alternative hypothesis (H₁) reduces the role of textural variability as a factor influencing concentration differences.
3. Results
3.1. Statistical Approach
The SiO₂ content remained relatively constant across the three selected grain-size fractions. This behavior may be attributed to the high hardness of SiO₂, ranked 7 out of 10 on the Mohs scale, which preserves this oxide at higher concentrations within the coarse fractions. Conversely, this high hardness may also limit the mechanical breakdown of quartz, resulting in a lower SiO₂ abundance within the finer fractions. In contrast, the Fe₂O₃ content increased as the particle size decreased. The Fe₂O₃ value recorded in the very fine sand fraction was comparable to those observed in both grinded and ungrinded samples, indicating a distribution closer to normal (Table 1).
The mean concentrations of PTEs showed notably higher values for Pb (1391 mg kg⁻¹), Cu (505.1 mg kg⁻¹), and As (149.4 mg kg⁻¹) in the three analyzed grain-size fractions (not shown) compared with the mean concentrations in both the ground and unground samples (Table 1). Without exception, PTE concentrations progressively increase from medium sand (200–125 µm) to silt (≤63 µm). In the grounded and ungrinded samples, no consistent trend can be identified, except for Zn, which shows higher mean concentration in the ground samples.
Both major oxides and PTEs displayed a symmetrical distribution in the 200–125 µm fraction, with the exception of Fe₂O₃ and As. However, in the remaining two granulometric fractions, the skewness values indicate asymmetric data distributions (Table 1). The datasets for Cu and Zn in both grinded and ungrinded samples are characterized by pronounced skewness, while Fe₂O₃ shows a distribution around the mean, contrasting with the pattern observed for the other elements.
3.2. The Effect of Sample Heterogeneity on pXRF Measurements
The concentration of PTEs across the three granulometric fractions showed a general increasing trend from medium and fine sand toward silt (Table 1). A detailed examination of the dataset for each sample indicates a decrease in PTE concentration in sample S2.3 between the medium- and fine-sand fractions, followed by an increase toward the finer fraction (Figure 2).
The increase in concentration from medium to fine sand was moderate for Pb (×1.4), As (×1.7), and Cu (×1.8), but more pronounced for Zn (×2.3). A similar trend was observed between the fine sand and silt fractions. When comparing the largest and smallest particle-size classes, concentrations increased by approximately five- to sixfold for the first three PTEs, whereas Zn exhibited a particularly substantial increase (×20) (Figure 2).
The results further show that SiO₂ represents the highest compositional proportion of the waste material, with an average value of 61.6% and a variation range between 48.4% and 75.5% across the analyzed samples. The average Fe₂O₃ concentration is 6.15% and increased progressively from coarse to fine particles by a factor of approximately 1.3–1.4 (Table 1).
Surface micromorphology and the presence of allochthonous sediments are key factors influencing moisture variability in certain areas of the tailings dump. After drying at room temperature, the sediment level in several containers dropped below the rim, which may have led to measurement inaccuracies. To remedy this problem, after sealing the container with the film, it was gently tapped on the work surface to ensure full contact between the sediment and the foil.
Unmoistened samples generally exhibited gravimetric moisture contents below 20% (ranging from 7.3% to 18.6%), with the exception of sample S2.6. This sample, collected from the temporary stream channel, show a substantially higher moisture content of 66.3%. Of the 72 pXRF measurements performed on unmoistened samples, most wet samples displayed lower concentrations than their corresponding air-dried samples at room temperature, for both oxides and potentially toxic elements (PTEs). However, five measurements did not follow this overall trend.
To further assess these discrepancies, the ratio between the element concentration in the wet sample and that in the air-dried sample (Cw/Cd), plotted against gravimetric moisture (%) in a central scatter representation, was employed. A ratio of Cw/Cd = 1 indicates no difference between wet and dry sample concentrations, while a ratio greater than one may reflect analytical bias or specific physical-chemical properties of the sample.
The highest supra-unitary Cw/Cd ratios were observed for Fe₂O₃ (1.36) and As (2.27) in sample S2.2, which had a gravimetric moisture content of 15.4%. The red-brown coloration of the material reflects geochemical heterogeneity associated with Fe₂O₃ enrichment. Notably, several samples with relatively low moisture contents (<10%), including S2.7 (8.7%) and S2.3 (7.3%), also displayed supra-unitary Cw/Cd ratios for Cu, As, and Pb (1.08, 1.14, and 1.19, respectively). In contrast, the sample with the highest moisture content (S2.6) showed Cw/Cd values below unity (Figure 3).
These findings suggest that, at low moisture levels (<20%), geochemical heterogeneity can lead to artificially elevated concentrations of certain elements in wet measurements relative to air-dried samples, most likely as a result of the nugget effect. In addition, physical changes during drying—such as sample contraction, crust formation, and the development of microfractures (e.g., in samples S2.4 and S2.6)—may introduce further analytical uncertainties (Figure 3).
The results of the Wilcoxon signed-rank test for paired samples indicate no statistically significant differences in the concentrations of PTEs and Fe₂O₃ between mechanical and manual grinding methods, with one exception. The null hypothesis—assuming no concentration differences between the two sample preparation techniques—was rejected only for SiO₂ (Table 2).
Both mechanically ground and unground samples share the characteristic of having been dried at room temperature, implying that residual moisture was not completely removed—unlike the samples dried at 105 °C and subsequently manually ground. Accordingly, the alternative hypothesis is supported. The Wilcoxon signed-rank test applied to these two sample sets confirms that the median difference between ball-milled and unground air-dried samples is not statistically different from zero (Table 2).
In the manually ground triplicate samples, the median values and the upper and lower whiskers show greater variability for oxides, while the variability of certain PTEs is markedly lower. This pattern reflects the intrinsic heterogeneity of the tailings pond material. The narrow whisker range observed for Cu—except in sample S2.4—further indicates low variability among triplicate measurements and relatively stable concentration levels associated with ore processing (Figure 4).
The box plot reveals a clear pattern in elemental concentrations across the triplicate samples, allowing two compositional clusters to be distinguished: one comprising Cu, Pb, and Zn, and a second characterized by Fe₂O₃ and As (Figure 4). The strong Spearman correlation coefficients between Cu and Pb (0.83) and between Fe₂O₃ and As (0.81) indicate common mineralogical sources, such as bournonite and arsenopyrite. In contrast, although the correlation between Pb and Zn is relatively high (0.68), it is noticeably weaker by comparison.
4. Discussion
Particle-size distribution controls the retention and mobilization of various elements in sediments. Numerous studies on PTE-contaminated sediments indicate that decreasing particle size is commonly associated with increasing trace-element concentrations (grain-size effect) [41](Figure 2). In contrast, coarse-grained materials typically exhibit a lower sorption capacity for PTEs compared to fine-grained fractions [10]. This relationship is also observed in the Horse Creek tailings pond sediments.
The similarity between mean and median values reflects the central tendency of trace-element concentrations in soils originating from different geographical regions and exhibiting variable textural characteristics along the soil profile [42]. In the present study, mean and median values are comparable only for major oxides (SiO₂ and Fe₂O₃), whereas pronounced differences are observed for PTEs, with the exception of Zn in the 125–200 µm fraction (58 and 59 mg kg⁻¹, respectively). These results indicate that, unlike soils, PTE concentrations in the tailings pond show substantial variability both within each of the three particle-size fractions and among individual samples. Consequently, evaluating PTE concentrations solely on the basis of particle-size distribution is not appropriate for this type of environment. Nevertheless, when contamination in adjacent soils is also considered, this approach may represent the most appropriate methodological option.
Fine sand exhibits intermediate PTE concentrations relative to medium sand and silt, a pattern that is concistent with other environments, such as fluvial sediments [43]. In none of the three fractions are the PTE concentrations identical to those obtained from samples prepared using the other methods; however, the mean concentrations of Pb and As in the very fine sand fraction are very similar to those measured in unground samples dried at room temperature (Table 1).
Dedicated pXRF analytical protocols, supported by numerous published studies, indicate that increasing sample moisture generally results in lower measured concentrations of certain PTEs and associated compounds [9,30]. Dedicated pXRF analytical protocols, supported by numerous published studies, indicate that increasing sample moisture generally results in lower measured concentrations of certain PTEs and associated compounds (Table 1).
Although no formal minimum moisture threshold is required for reliable PTE analysis, a moisture range of 5–20% is generally considered optimal for minimizing analytical uncertainty. Air-drying samples can increase pXRF-measured concentrations; however, the magnitude of this effect depends on soil texture and mineralogical composition [26,44].
Previous studies have reported no significant differences between air-dried soil samples and those with moisture contents of approximately 10% [45]. In the present dataset, one sample (S2.4) with a moisture content below 10% (7.35%) exhibits greater variability in PTE concentrations compared with other samples below the same threshold, as well as those within the 10–20% moisture interval (Figure 3). This sample was not homogenized by grinding, and the observed deviation may therefore reflect a nugget effect. Nevertheless, the particle size of the waste material (<2 mm), originating from primary ore processing, provides a degree of homogeneity that is generally adequate for pXRF analysis.
The ratio between the concentration of an element measured at maximum water content and its concentration in the dry certified reference materialwas employed to estimate the attenuation coefficient [46,47]. The simple Cw/Cd ratio, together with gravimetric moisture content (%), enables the visualization and identification of elements exhibiting supra-unitary values. Arsenic exhibits supra-unitary ratios in two samples (S2.2 and S2.7), occurring at distinct moisture contents of 15.4% and 8.7%, respectively (Figure 3).
Several authors have reported that, at a moisture content of 20%, As concentrations decrease by approximately 37% relative to dry samples [48]. When the Cw/Cd ratio for As obtained for sample S2.7 is compared with those of samples exhibiting similar moisture contents (e.g., S2.3 = 7.31% and S2.4 = 7.35%), the latter display sub-unitary ratios. Although pXRF measurements may be affected by Pb–As interference [26], this effect cannot explain the present observations, as the supra-unitary Cw/Cd values for As (S2.2 and S2.7) do not correspond to the sample characterized by elevated Pb concentrations (S2.3). Since pXRF measurements cannot be conducted at the exact same location within the sample cup under both moisture conditions, it is plausible that an additional factor contributed to the result obtained for sample S2.4.
Silicon oxide is more strongly affected by moisture, a trend also reported for other environmental matrices, including marine sediments and tropical soils [49,50]. In contrast, the Cw/Cd values for Fe₂O₃ are closer to unity than those observed for SiO₂, indicating a lower variability between the two moisture conditions. Reliability reflects the proportion of “true” information in measurements, with higher values indicating greater consistency [51]. A two-way random-effects intraclass correlation analysis yielded a lower mean reliability for SiO₂ (0.83) than for Fe₂O₃ (0.96), consistent with the patterns indicated by the Cw/Cd ratios. The performance of pXRF analysis on wet samples is generally reduced for light elements such as Si [49], whereas it is improved for heavier elements including Fe, Cu, Pb, Zn, and As [9,46,47]. Nevertheless, these effects are highly dependent on the type of sample.
The quantification error in powder samples is primarily attributable to grain-size effects, while the impact of heterogeneity can be mitigated through grinding [13]. Allocating the same preparation time (3 minutes) for both manual and mechanical grinding does not result in significantly different pXRF measurements. A Wilcoxon signed-rank test performed on paired samples subjected to manual and mechanical grinding revealed no significant concentration differences for PTEs; however, for oxides, the null hypothesis was rejected in the case of SiO₂ (Table 1 and Table 2).
Geochemical and environmental datasets are often spatially dependent, and their processing commonly involves transformations, such as the natural logarithm [52]. After applying an ln-transformation to SiO₂, the data for mechanically ground samples remain non-normally distributed (p = 0.019). In sample S2.7, the SiO₂ content decreases from 49% in the manually ground sample to 39.1% in the mechanically ground sample, both values being lower than the mean of the other samples (S2.1–S2.6), which are 69.1% and 55.9%, respectively. Examination of other oxide concentrations in S2.7 revealed a two- to threefold increase in CaCO₃ (7.9% and 8.9% in the mechanically and manually ground samples, respectively) compared with the remaining samples. A slight spatial variation is observed for MgCO₃ (2.9% and 2.3%), with values comparable only to those of samples S2.5 and S2.6, likely reflecting material transport from the recently deposited waste toward the central part of the dump (Figure 1c).
The deposition of new materials along the margins of the waste dump, originating from the overburden of the nearby limestone quarry, has resulted in an unintended form of ecological rehabilitation. The newly deposited material exhibits distinct geochemical properties and a finer texture compared to that of the Horse Creek waste dump, which promotes water retention and facilitates the establishment of vegetation along the temporary watercourse.
5. Conclusions
The analysis of sediments using pXRF provides a significant advantage for assessing the geochemical characteristics of tailing ponds; however, sample preparation methods may yield divergent results. The concentration of potentially toxic elements (PTEs) increases inversely with particle size, although in the case of oxides this trend persisted only for Fe₂O₃, while the SiO₂ content was not affected by particle-size variation. The magnitude of concentration increases among different particle-size fractions is not uniform across all PTEs.
After samples were air-dried at room temperature, pXRF measurements for both PTEs and oxides yielded higher values compared to those obtained under field-moist conditions. Central scatter analysis indicates that some PTEs and oxides exhibited higher values in the moist samples than in the dried ones, a phenomenon likely attributable to geochemical heterogeneity within the sample. Moreover, SiO₂ content is more strongly influenced by moisture compared to Fe₂O₃.
For an equivalent working time, pXRF measurements on samples ground in a ball mill and subsequently homogenized in an agate mortar showed comparable results, with the exception of SiO₂. Pre-treatment—specifically, the drying method and spatial variability resulting from the post-depositional evolution of the tailing deposit induces small-scale variations in oxide content and PTE concentrations.
pXRF results obtained from manually ground triplicate samples demonstrate both the spatial variability of the dominant compound (SiO₂) and the co-occurrence of certain PTEs (e.g., Cu–Pb), which reflect the source minerals within the deposit.
Author Contributions
Conceptualization, S.C.V. and L.C.D.; methodology, S.C.V. and L.C.D.; software, S.C.V.; sample preparation, S.C.V.; pXRF measurements L.C.D.; writing—original draft preparation, S.C.V. All authors have read and agreed to the published version of the manuscript.”
Funding
This research was funded by the Department of Geography, Faculty of Geography & Geology, “Alexandru Ioan Cuza” University of Iasi (Internal Research Program).
Data Availability Statement
The data presented in this study are available on request from the corresponding author.
Acknowledgments
Acknowledgement is given to the Operational Program Competitiveness 2014–2020, Axis 1, under POC/448/1/1 research infrastructure projects for public R&D institutions/ Sections F 2018 through the Research Center with Integrated Techniques for Atmospheric Aerosol Investigation in Romania (RECENT AIR) project under grant agreement MySMIS No. 127324.
Conflicts of Interest
“The authors declare no conflicts of interest.” “The funders had no role in the design of the study; in the collection, analyses, or interpretation of data; in the writing of the manuscript; or in the decision to publish the results”.
References
- Juutinen, M.; Seitsaari, M.; Oulu mining school, University of Oulu, Finland; Sarala, P.; Oulu Mining School, University of Oulu, Finland Geochemical and Mineralogical Characterization of Mine Tailings at the Rautuvaara Mine Site and Aspects to Environmental Conditions and Resource Potential. Bull Geol Soc Finland 2023, 95, 59–78. [CrossRef]
- Dos Santos, D.S.; Ribeiro, P.G.; Andrade, R.; Silva, S.H.G.; Gastauer, M.; Caldeira, C.F.; Guedes, R.S.; Dias, Y.N.; Souza Filho, P.W.M.; Ramos, S.J. Clean and Accurate Soil Quality Monitoring in Mining Areas under Environmental Rehabilitation in the Eastern Brazilian Amazon. Environ Monit Assess 2024, 196, 385. [Google Scholar] [CrossRef] [PubMed]
- De Oliveira, D.; Silva, T.; Morais, I.; Fernandes, J. Chemical and Mineralogical Characterization of Waste from Abandoned Copper and Manganese Mines in the Iberian Pyrite Belt, Portugal: A First Step Towards the Waste-to-Value Recycling Process. Minerals 2025, 15, 58. [Google Scholar] [CrossRef]
- Maciel, G.P.; Ribeiro, P.G.; Pavão, Q.S.; Fernandes, A.R.; Gastauer, M.; Caldeira, C.F.; Guimarães, J.T.F.; Andrade, R.; Silva, S.H.G.; Ramos, S.J. Green Tech Soil Analysis: A Comparison of Potentially Toxic Element Contents among Urban, Agricultural, and Gold Mining Areas in the Eastern Brazilian Amazon. Environ Geochem Health 2024, 46, 448. [Google Scholar] [CrossRef]
- Magiera, T.; Szuszkiewicz, M. Combination of Portable X-Ray Fluorescence With Soil Magnetometry as an Effective Tool for Distinguish Different Pollution Sources. Land Degrad Dev 2025, 36, 2543–2556. [Google Scholar] [CrossRef]
- Palmer, P.T.; Jacobs, R.; Baker, P.E.; Ferguson, K.; Webber, S. Use of Field-Portable XRF Analyzers for Rapid Screening of Toxic Elements in FDA-Regulated Products. J. Agric. Food Chem. 2009, 57, 2605–2613. [Google Scholar] [CrossRef]
- Hall, G.E.M.; Bonham-Carter, G.F.; Buchar, A. Evaluation of Portable X-Ray Fluorescence (pXRF) in Exploration and Mining: Phase 1, Control Reference Materials. GEEA 2014, 14, 99–123. [Google Scholar] [CrossRef]
- Ravansari, R.; Wilson, S.C.; Tighe, M. Portable X-Ray Fluorescence for Environmental Assessment of Soils: Not Just a Point and Shoot Method. Environment International 2020, 134, 105250. [Google Scholar] [CrossRef]
- Laperche, V.; Metayer, C.; Gaschaud, J.; Wavrer, P.; Quiniou, T. On the Influence and Correction of Water Content on pXRF Analysis of Lateritic Nickel Ore Deposits in the Context of Open Pit Mines of New-Caledonia. Minerals 2022, 12, 415. [Google Scholar] [CrossRef]
- Kabata-Pendias, A. Trace Elements in Soils and Plants, 0 ed.; CRC Press, 2010; ISBN 978-0-429-19203-6. [Google Scholar]
- Bhattacharya, A.; Routh, J.; Jacks, G.; Bhattacharya, P.; Mörth, M. Environmental Assessment of Abandoned Mine Tailings in Adak, Västerbotten District (Northern Sweden). Applied Geochemistry 2006, 21, 1760–1780. [Google Scholar] [CrossRef]
- Tavares, T.R.; Nunes, L.C.; Alves, E.E.N.; Almeida, E.D.; Maldaner, L.F.; Krug, F.J.; Carvalho, H.W.P.D.; Molin, J.P. Simplifying Sample Preparation for Soil Fertility Analysis by X-Ray Fluorescence Spectrometry. Sensors 2019, 19, 5066. [Google Scholar] [CrossRef]
- Morikawa. A Sample Preparation for X-Ray Fluorescence Analysis II. Pulverizing Methods of Powder Samples. 2014, 30, 23–27. [Google Scholar]
- Stumbea, D. Preliminaries on Pollution Risk Factors Related to Mining and Ore Processing in the Cu-Rich Pollymetallic Belt of Eastern Carpathians, Romania. Environ Sci Pollut Res 2013, 20, 7643–7655. [Google Scholar] [CrossRef] [PubMed]
- López-Pamo, E.; Barettino, D.; Antón-Pacheco, C.; Ortiz, G.; Arránz, J.C.; Gumiel, J.C.; Martı́nez-Pledel, B.; Aparicio, M.; Montouto, O. The Extent of the Aznalcóllar Pyritic Sludge Spill and Its Effects on Soils. Science of The Total Environment 1999, 242, 57–88. [Google Scholar] [CrossRef] [PubMed]
- Steiner, A.E.; Conrey, R.M.; Wolff, J.A. PXRF Calibrations for Volcanic Rocks and the Application of In-Field Analysis to the Geosciences. Chemical Geology 2017, 453, 35–54. [Google Scholar] [CrossRef]
- Marsay, N.H.; Wagland, S.T.; Campo, P.; Alamar, M.C. Development and Optimisation of Ex Situ Portable X-Ray Fluorescence Spectroscopy for Heterogenous Post-Metallurgical Sites. Environ Geochem Health 2025, 47, 298. [Google Scholar] [CrossRef]
- Martín-Crespo, T.; Gómez-Ortiz, D.; Martín-Velázquez, S.; Martínez-Pagán, P.; De Ignacio, C.; Lillo, J.; Faz, Á. Geoenvironmental Characterization of Unstable Abandoned Mine Tailings Combining Geophysical and Geochemical Methods (Cartagena-La Union District, Spain). Engineering Geology 2018, 232, 135–146. [Google Scholar] [CrossRef]
- Popescu, Gh C. Metalogenie aplicată și prognoză geologică; Edit. Universității București: București, 1986; Vol. 3. [Google Scholar]
- Damian, G.; Apopei, A.I.; Buzatu, A.; Maftei, A.E.; Damian, F. New Mineral Occurrences in Massive Sulfide Deposits from Mănăilă, Eastern Carpathians, Romania. Minerals 2023, 13, 111. [Google Scholar] [CrossRef]
- Kräutner, HG. Syngenetic Models for the Pyrite and Polymetallic Sulphide Ore Province of the East Carpathian. In Syngenesis and Epigenesis in the Formation of the Mineral Deposits; Springer: Berlin, 1984; pp. 537–552. [Google Scholar]
- Stumbea, D; Pavel, E. Geochemistry of Waste from the Tailings Pond of Pârâul Cailor, Fundu Moldovei Metallogenic Field, Romania. Carpathian Journal of Earth and Environmental Sciences 2014, 9, 157–166. [Google Scholar]
- Stumbea, D. The Flanks of the Dealul Negru Tailings Pond (Fundu Moldovei) – Pollution Risk Factors. Carpathian Journal of Earth and Environmental Sciences 2013, 8, 103–112. [Google Scholar]
- Radu, M. Research on the geochemistry of the environment in the perimeters of the tailing ponds in the northern part of the metalogenetic province of the Eastern Carpathians; University of Bucharest: Bucharest, 2018. [Google Scholar]
- Simmons, K. Sediment Sampling. Sediment Sampling 2025. [Google Scholar]
- USEPA Field Portable X-Ray Fluorescence Spectrometry for the Determination of Elemental Concentrations in Soil and Sediment, Part of Test Methods for Evaluating Solid Waste. Physical/Chemical Methods 2007.
- ASTM D2216 Standard Test Methods for Laboratory Determination of Water; 1998.
- Gee, G; Or, D. Particle-Size Analysis. In Methods of Soil Analysis; Soil Science Society of America: Madison, 2002; Vol. 4, pp. 255–293. [Google Scholar]
- ISO 13196 International Organization for Standardization. Soil Quality—Screening Soils for Selected Elements by Energy-Dispersive X-Ray Fluorescence Spectrometry Using a Handheld or Portable Instrument; 2013.
- Williams, R.; Taylor, G.; Orr, C. pXRF Method Development for Elemental Analysis of Archaeological Soil. Archaeometry 2020, 62, 1145–1163. [Google Scholar] [CrossRef]
- www.retsch.com Three Rules for the Optimum Ball Mill Setup 2025.
- www.fritsch.de Planetary Mono Mill Pulverisette 6 Operating Instructions 2025.
- https://www.bruker.com/ S1 Titan/Tracer 5/CTX 2025.
- Goff, K.; Schaetzl, R.J.; Chakraborty, S.; Weindorf, D.C.; Kasmerchak, C.; Bettis, E.A. Impact of Sample Preparation Methods for Characterizing the Geochemistry of Soils and Sediments by Portable X-ray Fluorescence. Soil Science Soc of Amer J 2020, 84, 131–143. [Google Scholar] [CrossRef]
- Stumbea, D; Chicoș, M. Common and Specific Properties of Waste from the Tailings Ponds of Fundu Moldovei–Leșu Ursului Mine District. Romanian Journal of Mineral Deposits 2016, 89, 13–18. [Google Scholar]
- De Winter, N.J.; Sinnesael, M.; Makarona, C.; Vansteenberge, S.; Claeys, P. Trace Element Analyses of Carbonates Using Portable and Micro-X-Ray Fluorescence: Performance and Optimization of Measurement Parameters and Strategies. J. Anal. At. Spectrom. 2017, 32, 1211–1223. [Google Scholar] [CrossRef]
- Midway, S.; Robertson, M.; Flinn, S.; Kaller, M. Comparing Multiple Comparisons: Practical Guidance for Choosing the Best Multiple Comparisons Test. PeerJ 2020, 8, e10387. [Google Scholar] [CrossRef]
- Mishra, P.; Pandey, C.; Singh, U.; Keshri, A.; Sabaretnam, M. Selection of Appropriate Statistical Methods for Data Analysis. Ann Card Anaesth 2019, 22, 297. [Google Scholar] [CrossRef]
- Zygmont, C.S. Managing the Assumption of Normality within the General Linear Model with Small Samples: Guidelines for Researchers Regarding If, When and How. TQMP 2023, 19, 302–332. [Google Scholar] [CrossRef]
- Oztuna, D; Eltan, A; Tuccar, E. Investigation of Four Different Normality Tests in Terms of Type 1 Error Rate and Power under Different Distributions. Turkish Journal of Medical Sciences 2006, 171–176. [Google Scholar]
- Horowitz, A.J.; Elrick, K.A. The Relation of Stream Sediment Surface Area, Grain Size and Composition to Trace Element Chemistry. Applied Geochemistry 1987, 2, 437–451. [Google Scholar] [CrossRef]
- Zhu, Y.; Weindorf, D.C.; Zhang, W. Characterizing Soils Using a Portable X-Ray Fluorescence Spectrometer: 1. Soil Texture. Geoderma 2011, 167–168, 167–177. [Google Scholar] [CrossRef]
- Cox, S; Curran, C; Spanjer, A; Opatz, C; Tekesue, R; Bell, J. Element Concentrations and Grain Size of Sediment from the Similkameen River above Enloe Dam (Enloe Reservoir) near Oroville, Washington; U.S. Geological Survey data release: Washington, 2021; p. 47. [Google Scholar]
- Stockmann, U.; Jang, H.J.; Minasny, B.; McBratney, A.B. The Effect of Soil Moisture and Texture on Fe Concentration Using Portable X-Ray Fluorescence Spectrometers. In Digital Soil Morphometrics;Progress in Soil Science; Hartemink, A.E., Minasny, B., Eds.; Springer International Publishing: Cham, 2016; pp. 63–71. ISBN 978-3-319-28294-7. [Google Scholar]
- Li, S.; Shen, J.; Bishop, T.F.A.; Viscarra Rossel, R.A. Assessment of the Effect of Soil Sample Preparation, Water Content and Excitation Time on Proximal X-Ray Fluorescence Sensing. Sensors 2022, 22, 4572. [Google Scholar] [CrossRef] [PubMed]
- Ge, L.; Lai, W.; Lin, Y. Influence of and Correction for Moisture in Rocks, Soils and Sediments on in Situ XRF Analysis. X-Ray Spectrometry 2005, 34, 28–34. [Google Scholar] [CrossRef]
- Santana, M.L.T.; Carvalho, G.S.; Guilherme, L.R.G.; Curi, N.; Ribeiro, B.T. Elemental Concentration via Portable X-Ray Fluorescence Spectrometry: Assessing the Impact of Water Content. Ciênc. agrotec. 2019, 43, e029218. [Google Scholar] [CrossRef]
- Parsons, C.; Margui Grabulosa, E.; Pili, E.; Floor, G.H.; Roman-Ross, G.; Charlet, L. Quantification of Trace Arsenic in Soils by Field-Portable X-Ray Fluorescence Spectrometry: Considerations for Sample Preparation and Measurement Conditions. Journal of Hazardous Materials 2013, 262, 1213–1222. [Google Scholar] [CrossRef]
- Tjallingii, R.; Röhl, U.; Kölling, M.; Bickert, T. Influence of the Water Content on X-ray Fluorescence Core-scanning Measurements in Soft Marine Sediments. Geochem Geophys Geosyst 2007, 8, 2006GC001393. [Google Scholar] [CrossRef]
- Ribeiro, B.T.; Weindorf, D.C.; Silva, B.M.; Tassinari, D.; Amarante, L.C.; Curi, N.; Guimarães Guilherme, L.R. The Influence of Soil Moisture on Oxide Determination in Tropical Soils via Portable X-ray Fluorescence. Soil Science Soc of Amer J 2018, 82, 632–644. [Google Scholar] [CrossRef]
- Landers, R. Old Dominion University Computing Intraclass Correlations (ICC) as Estimates of Interrater Reliability in SPSS.
- Reimann, C.; Filzmoser, P. Normal and Lognormal Data Distribution in Geochemistry: Death of a Myth. Consequences for the Statistical Treatment of Geochemical and Environmental Data. Environmental Geology 2000, 39, 1001–1014. [Google Scholar] [CrossRef]
Figure 1.
The location of the Horse Creek tailings pond (a), the positioning of the samples on the dump (b), and new deposit (c).
Figure 1.
The location of the Horse Creek tailings pond (a), the positioning of the samples on the dump (b), and new deposit (c).

Figure 2.
Concentration of PTEs in three particle size fractions.

Figure 3.
Relationship between Cw/Cd and gravimetric moisture (%).

Figure 4.
Boxplot representation of triplicate samples for oxides and PTEs.


Table 1.
Statistical indicators for major oxides and PTEs for three sample preparation methods.
| Texturea(µm) | Grinded samplesb | Ungrided samples | ||||||
| 200-125 | 125-63 | ≤63 | Ball mill | Mortar & Pestlec | Wet | Dry | ||
| Mean | SiO2 | 62.5 | 62 | 60.4 | 56 | 62.5 | 40.2 | 51.5 |
| Fe2O3 | 4.4 | 5.7 | 8.2 | 6.8 | 7 | 5.4 | 5.9 | |
| Cu | 284.6 | 658 | 927.6 | 354.8 | 333.1 | 220 | 332.2 | |
| Pb | 740 | 1102.2 | 2331.2 | 943.1 | 844.6 | 930.8 | 1070.4 | |
| Zn | 58 | 141.8 | 462.4 | 125.4 | 126.2 | 211.7 | 289.7 | |
| As | 94 | 131.2 | 223.2 | 127 | 127.7 | 117.2 | 128.5 | |
| Min. | SiO2 | 48.4 | 57 | 55.5 | 39.1 | 46 | 27.6 | 37.3 |
| Fe2O3 | 2.1 | 3.6 | 6.1 | 3.3 | 3.4 | 2.2 | 2.3 | |
| Cu | 42 | 56 | 92 | 55 | 59 | 50 | 56 | |
| Pb | 74 | 122 | 261 | 65 | 72.6 | 52 | 54 | |
| Zn | 27 | 60 | 88 | 48 | 49 | 53 | 64 | |
| As | 34 | 40 | 95 | 23 | 17.3 | 28 | 22 | |
| Max. | SiO2 | 75.1 | 75.5 | 68.2 | 77 | 77.3 | 52.8 | 63.7 |
| Fe2O3 | 9.4 | 7.3 | 11.9 | 10 | 10.4 | 8.9 | 8.9 | |
| Cu | 621 | 2278 | 3103 | 1496 | 1521.3 | 696 | 1179 | |
| Pb | 1499 | 3492 | 7983 | 2465 | 2430 | 1931 | 2398 | |
| Zn | 92 | 427 | 1686 | 278 | 314.6 | 960 | 1263 | |
| As | 224 | 286 | 408.5 | 238 | 236 | 218 | 251 | |
| StDev | SiO2 | 10.2 | 7.6 | 4.91 | 11.2 | 10.1 | 8.8 | 10.3 |
| Fe2O3 | 2.9 | 1.3 | 2.24 | 2.7 | 2.1 | 2.3 | 2.2 | |
| Cu | 287 | 947.4 | 1276.2 | 512.3 | 527.6 | 223.2 | 395.8 | |
| Pb | 552 | 1356.9 | 3184.5 | 795.9 | 773.3 | 634.7 | 794.2 | |
| Zn | 29.3 | 159.8 | 685.8 | 72.1 | 85.8 | 330.5 | 435.8 | |
| As | 74.4 | 92.8 | 120.2 | 78.4 | 66.9 | 68.2 | 82.9 | |
| Skewness | SiO2 | -0.2 | 2.1 | 1.1 | 0.7 | -0.1 | -0.1 | -1.6 |
| Fe2O3 | 1.6 | -0.8 | 1.4 | 0.4 | 0.4 | 0 | -0.4 | |
| Cu | 0.6 | 1.8 | 1.7 | 2.4 | 2.5 | 2 | 2.1 | |
| Pb | 0.3 | 2 | 2.1 | 1.1 | 1.6 | 0.4 | 0.8 | |
| Zn | 0 | 2 | 2.2 | 1.8 | 2.2 | 2.6 | 2.4 | |
| As | 1.9 | 1.5 | 0.9 | -0.3 | 0.4 | -0.6 | 0.4 | |
Note: aResults for 5 samplesa, bresults for 7 samplesb, caverage for triplicate samplesc.
Table 2.
Wilcoxon signed-rank values for paired samples.
| Ball mill vs. Mortar & Pestle | Ball mill vs. Ungrided dry samples | |
| Significance level vs. decision | ||
| SiO2 | 0.01* | 0.49 |
| Fe2O3 | 0.49 | 0.17 |
| Cu | 0.23 | 0.23 |
| Pb | 0.06 | 0.23 |
| Zn | 1 | 0.49 |
| As | 0.17 | 1 |
Note: The significance level was set at 0.05, *reject null hypothesis.
Disclaimer/Publisher’s Note: The statements, opinions and data contained in all publications are solely those of the individual author(s) and contributor(s) and not of MDPI and/or the editor(s). MDPI and/or the editor(s) disclaim responsibility for any injury to people or property resulting from any ideas, methods, instructions or products referred to in the content. |
© 2026 by the authors. Licensee MDPI, Basel, Switzerland. This article is an open access article distributed under the terms and conditions of the Creative Commons Attribution (CC BY) license (http://creativecommons.org/licenses/by/4.0/).
Copyright: This open access article is published under a Creative Commons CC BY 4.0 license, which permit the free download, distribution, and reuse, provided that the author and preprint are cited in any reuse.


