
Submitted:
26 January 2026
Posted:
27 January 2026
You are already at the latest version
Abstract
Online reputation systems display aggregated ratings derived from numerical scores and textual reviews of real consumer experiences. These ratings serve as operational estimates of a product or service's value and are used by consumers and organizations as a direct reference for decision-making. However, when suspicious review patterns emerge, such as repetition, extreme ratings, temporal concentration, or low diversity, the perceived value is systematically altered, and the aggregated score no longer reflects the practical evaluation used by users. This perceptual dimension of reputational value has not been modeled in conventional reputation indices. This paper proposes a soft-computing-based reputation adjustment model that quantifies this perceptual change. The model does not replace or reorder the original reputation index (ORI); instead, it introduces a continuous correction layer operating on the displayed rating, modeling the mapping between the aggregated score and the value internalized by users through entropy-weighted indicators of informational disorder. Experimental validation was conducted on 60 participants' product evaluations across eight products. Results show that the conventional rating exhibits a systematic upward bias relative to perceived trust (mean absolute error = 1.27), whereas the adjusted index significantly reduces this bias (mean absolute error = 0.12; paired t-test, p < 0.001). The proposed model corrects perceptual overestimation while preserving the original reputation signal, improving alignment between displayed ratings and effective user trust.
Keywords:
online reputation indices
; reputation adjustment
; trust perception
; perceptual bias
; entropy-based adjustment
; informational disorder
1. Introduction
Reviews play a fundamental role in consumer decision-making, significantly influencing purchasing behavior in digital environments [1,2,3]. According to various studies, nearly 95% of users consult online reviews before making a purchase, making them a crucial source of information for informed decisions[4,5,6]. These reviews are perceived as authentic accounts of quality, reliability, and the overall product or service experience because they are based on other consumers' personal experiences. As a result, reviews have become a central driver of consumer trust, often exerting more influence than traditional advertising [7,8]. Online Reputation Indices (ORI/ORS) are typically constructed by aggregating numerical ratings and textual reviews into a single score, thereby summarizing the collective evaluation of real consumers.
Systematic monitoring of online ratings and opinions enables companies to adjust their products and services in response to market feedback, thereby refining their offerings and improving performance. It also strengthens customer relationships and fosters continuous improvement processes grounded in the key reputational dimension of trust. The so-called ORI/ORS synthesizes dispersed consumer input by aggregating ratings and reviews into an overall score [1,2,9,10,11].
However, this trust can be undermined when consumers perceive unusual patterns in reviews that, from their perspective, suggest artificial manipulation of a product’s evaluation [12]. Although such distrust is not always explicitly expressed, it influences how subsequent users assess product reliability. In these cases, the conventional reputation index aggregates values that do not align with actual consumer perception. This gap between the displayed reputation score and the user’s subjective judgment underscores the need for mechanisms that can capture how suspicious signals impact trust in digital contexts [13,14,15].
Traditional approaches to review management have primarily focused on detecting and filtering fraudulent or manipulated content. Yet this strategy does not apply to reviews linked to verified purchases, even when they display atypical patterns. Because there is no objective justification for their removal, the issue is not their transactional validity. Instead, the challenge lies in how their patterns shape perceptions of trustworthiness in the reputational environment. This study precisely addresses this tension: distrust does not always stem from false content but from how consumers interpret what others say, particularly when they detect suspicious regularities that appear artificial or coordinated [1,3,6,16,17,18,19,20].
To avoid conceptual ambiguity, it is helpful to distinguish three related phenomena:
- Bias: systematic deviations that make aggregated ratings unrepresentative of the underlying reality (e.g., only delighted customers write reviews).
- Distortion: alterations of the reputation signal caused by coordinated or artificial mechanisms (e.g., review bombing or mass incentivized reviews).
- Informational disorder: as used in this study, a perceptual disruption that emerges when consumers detect atypical patterns in reviews. These patterns may not be fraudulent and may even originate from verified purchases, but they still raise suspicion and erode trust.
This paper proposes a model of reputational adjustment that incorporates consumers’ perception of distrust toward such behavioral patterns. Unlike approaches that focus exclusively on content veracity, this proposal acknowledges signals that trigger suspicion, such as repetition, extreme ratings, or a lack of diversity. The objective is not to modify the original reputation signal, but to correct the systematic perceptual misalignment introduced by these patterns.
This logic is formalized in a computational index, QVP_ORI, designed to complement traditional aggregated metrics. The index serves as an additional perceptual adjustment layer applied on top of existing reputation mechanisms. Based on entropic analysis, untrustworthy patterns are interpreted as informational disorder, which is quantified into a correction factor that modifies the aggregated score without replacing the original mechanism. To our knowledge, no existing reputation models incorporate this type of perceptual adjustment grounded in consumers’ contextual interpretation of review patterns.
By explicitly incorporating consumer perception of others’ opinions, QVP_ORI introduces a contextual and relational dimension that enables a more accurate representation of reputational value. Instead of assuming that all verified reviews carry equal weight, the model adjusts their impact according to how readers interpret them. As a result, the adjusted index reduces the discrepancy between the displayed reputation score and the value effectively internalized by users.
The model was empirically validated through a controlled experiment with 60 participants who evaluated real products accompanied by reviews exhibiting different perceptual configurations. Results showed that the conventional reputation index systematically overestimated perceived trust, whereas the adjusted QVP_ORI significantly reduced this error. Paired t-tests confirmed statistically significant reductions in the discrepancy between reputation scores and perceived trust, demonstrating the model’s ability to capture latent dimensions of reputational judgment that traditional aggregation methods fail to represent.
The remainder of this paper is structured as follows: Section 2 reviews related work and introduces entropy as the conceptual foundation of the proposed model. Section 3 describes the QVP_ORI index and the behavioral patterns identified in digital ecosystems. Section 4 illustrates the model's application to real-world Amazon product data. Section 5 presents the experimental validation, and Section 6 concludes with a discussion and implications.
2. Literature Review and Theoretical Foundations
2.1. Online Reputation and Rating Indices
Online Reputation Indices (ORI/ORS) have become essential tools for synthesizing collective consumer opinions and supporting informed purchasing decisions. These indices are typically constructed through aggregation processes that combine numerical ratings and textual reviews into a single score, summarizing the perceived reputation of a product or service [1,21,22,23,24].
Consumer trust in these indices largely depends on the perceived authenticity and credibility of the reviews they incorporate. However, several studies have shown that ORIs are particularly vulnerable to manipulation, whether through fabricated reviews or more subtle forms of strategic bias, which can distort the underlying reputation signal or affect how users interpret it [13,14,15].
While ORIs provide a simplified, aggregated view that facilitates decision-making, they do not account for the perceptual effects of suspicious review patterns, which can undermine user trust in the index. In such cases, the aggregation mechanism itself remains unchanged, but the displayed reputation score becomes misaligned with the value users effectively perceive. Addressing this gap is the central focus of the model proposed in this study.
2.2. Review Bias, Inauthenticity, and Their Perceptual Impact
In response to growing concerns about review manipulation, numerous approaches have been developed to detect and remove inauthentic or artificial reviews. These methods, based on data mining, machine learning, or linguistic analysis, aim to identify fraudulent content before it can influence reputation indices [16,17,22,25,26,27,28].
However, this strategy has significant limitations. Reviews linked to verified purchases, although seemingly legitimate, may still be influenced by external incentives and are often challenging to flag with automated tools. Moreover, removing reviews, whether fake or legitimate, does not address the perceptual effect that certain suspicious patterns can have on users’ interpretation of reputation scores, even when the underlying reviews are factually valid.
These challenges highlight the need for complementary approaches that go beyond fake-review detection and explicitly incorporate consumers’ perceptual distrust of suspicious patterns. The model proposed in this study addresses this gap by introducing a mechanism that adjusts reputation indices based on the perceptual misalignment these patterns generate, rather than attempting to classify or remove reviews.
For clarity, the key terms used in this study are defined as follows:
- Fake reviews: Reviews intentionally fabricated by actors with no genuine consumption experience, often created to inflate or deflate a product’s reputation artificially. These reviews are typically detectable through linguistic or behavioral anomalies.
- Strategic bias: Systematic but less overt manipulation of review content or ratings, often by real consumers acting under external incentives (e.g., discounts, campaigns, competitor sabotage). Unlike fake reviews, these are more difficult to detect because they originate from genuine purchase transactions.
- Suspicious patterns: Observable irregularities in the distribution or content of reviews (e.g., bursts of activity, extreme polarization, repetitive expressions, geographic clustering). These patterns may emerge from either authentic or manipulated reviews, and their main effect is perceptual: consumers interpret them as signals of potential manipulation, regardless of factual validity.
- Verified purchases: Reviews linked to confirmed transactions on a platform. Although they guarantee transactional validity, they do not guarantee independence of judgment; such reviews can still exhibit suspicious patterns or reflect external incentives.
2.3. Entropy as a Measure of Perceptual Disorder
The concept of entropy, introduced by Shannon in information theory, measures the degree of uncertainty or disorder within a probabilistic system. Entropy quantifies the amount of information required to describe a random variable: the higher the entropy, the greater the uncertainty and the more information is needed; conversely, the lower the entropy, the greater the predictability and the lower the uncertainty [18,29,30].
This concept is particularly relevant for modeling phenomena in which perceptions of trust are influenced by the structure and variability of the information received. In the present context, a product’s reputation score reflects the collective evaluation of previous users' experiences. However, the emergence of suspicious patterns in reviews can foster distrust among readers, thereby diminishing the index's informative value.
Entropy provides a suitable framework for quantifying this effect. Distributions derived from organic reviews typically exhibit high natural entropy, reflecting dispersed and unpredictable rating behavior. This intrinsic informational uncertainty stands in sharp contrast to the artificial low-entropy configurations typical of manipulated feedback.
This phenomenon parallels the information-theoretic distinction between a fair and a loaded die. A fair die yields a stochastic distribution characterized by high entropy, reflecting the intrinsic uncertainty of independent outcomes. In contrast, a loaded die generates a predictable, skewed distribution (low entropy), indicative of external bias. Similarly, in the context of online reviews, authentic feedback is governed by the natural entropy of diverse consumer experiences, whereas inauthentic behaviors often impose an artificial regularity (reduced entropy). This deviation from natural stochasticity contributes to perceptual distrust and erodes confidence in the reputation score.
The model proposed in this study builds on this logic, enabling the quantification of disorder induced by previously identified distrust patterns within the consumer’s perceptual space and adjusting the final product or service rating accordingly. Entropy thus serves as a quantitative tool for measuring such disorder and determining the degree of correction that should be applied to the reputation index.
It is crucial to recognize that the relationship between entropy and trustworthiness is not uniform across all reputational metrics. While high entropy (dispersion) often validates the organic heterogeneity of consumer preferences, other valid reputation signals are characterized by low entropy resulting from genuine consensus rather than manipulation. For objective attributes such as delivery speed or technical specifications, a lack of variation (low entropy) suggests high consensus around a "ground truth" rather than manipulation. Consequently, a robust trust model must distinguish between the artificial order of coordinated attacks and the reliable consensus of genuine agreement, as treating all low-entropy patterns as suspicious would penalize legitimate high-quality products that generate consistent user satisfaction.
This approach allows ratings to reflect consumer perceptions of trust dynamically and can be extended to diverse online reputation systems. In doing so, it complements existing metrics and provides a more robust perspective against the perceptual manipulation of reviews.
3. Model Formalization: The QVP_ORI Index as a Dynamic Valuation Tool
This section presents the computational formalization of the proposed model through the construction of the QVP_ORI index (Quantified Valuation of Perception – Opinion Relational Index). The index is designed as a dynamic mechanism for perceptual reputational adjustment, quantifying the impact of distrust inducing patterns that consumers identify in online reviews.
Rather than replacing traditional aggregation mechanisms, the model functions as a corrective layer applied on top of existing reputation indices. Its purpose is to recalibrate these indices by incorporating the interpretive context through which users process information, so that the resulting score more accurately reflects the perceived trustworthiness of a product or service.
Section 3.1 introduces consumer distrust patterns, previously identified in reviews and user expressions across digital ecosystems. These patterns capture the factors that influence decision making, particularly the decision not to purchase, and are modeled as semantic dimensions that reflect divergences in how products or services are interpreted. Section 3.2 presents the mathematical formulation of the QVP_ORI index, incorporating an entropy based weighting system that assigns relative importance to each pattern according to its perceptual impact.
3.1. Patterns of Consumer Distrust
This section describes the consumer distrust patterns, which constitute the perceptual core and the foundation of the adjustment mechanism within the QVP_ORI model. A large scale analysis of more than 200 million user generated comments collected between 2015 and 2021 revealed that specific recurring patterns in reviews were systematically associated with concerns or barriers that ultimately led users to decide against completing a purchase. These patterns were extracted from comments posted across diverse digital ecosystems [24,31], including the Amazon review dataset [19].
The analysis employed Natural Language Processing (NLP) techniques [20,32], which enabled the empirical identification of ten key distrust patterns influencing consumer perception and decision making. These patterns were grouped into four thematic semantic dimensions, each representing a distinct manifestation of distrust in user reviews: Polarity patterns, Temporal cardinality patterns, Expression patterns, and Geolocation patterns.
Each dimension is operationalized through specific subindices that quantify the perceptual impact of these patterns on trust, serving as the analytical foundation of the QVP_ORI index.
Importantly, the methodology applied here is designed to be replicable and extensible, allowing the set of patterns to be dynamically updated as review behaviors and manipulation tactics evolve. This flexibility ensures the long-term adaptability of the QVP_ORI model in changing digital environments, strengthening its ability to detect emerging signals of distrust.
A complete list of symbols and abbreviations used throughout this section is provided in Appendix A. Notation follows the unified convention detailed in Appendix A, distinguishing theoretical indices (uppercase) from empirical variables (lowercase).
3.1.1. Polarity Patterns
Polarity patterns in natural language processing capture the emotional tone of reviews by measuring the degree of positivity or negativity expressed in textual content. These patterns reflect how consumers interpret the distribution of opinions and directly influence their decision to purchase or not purchase a product or service.
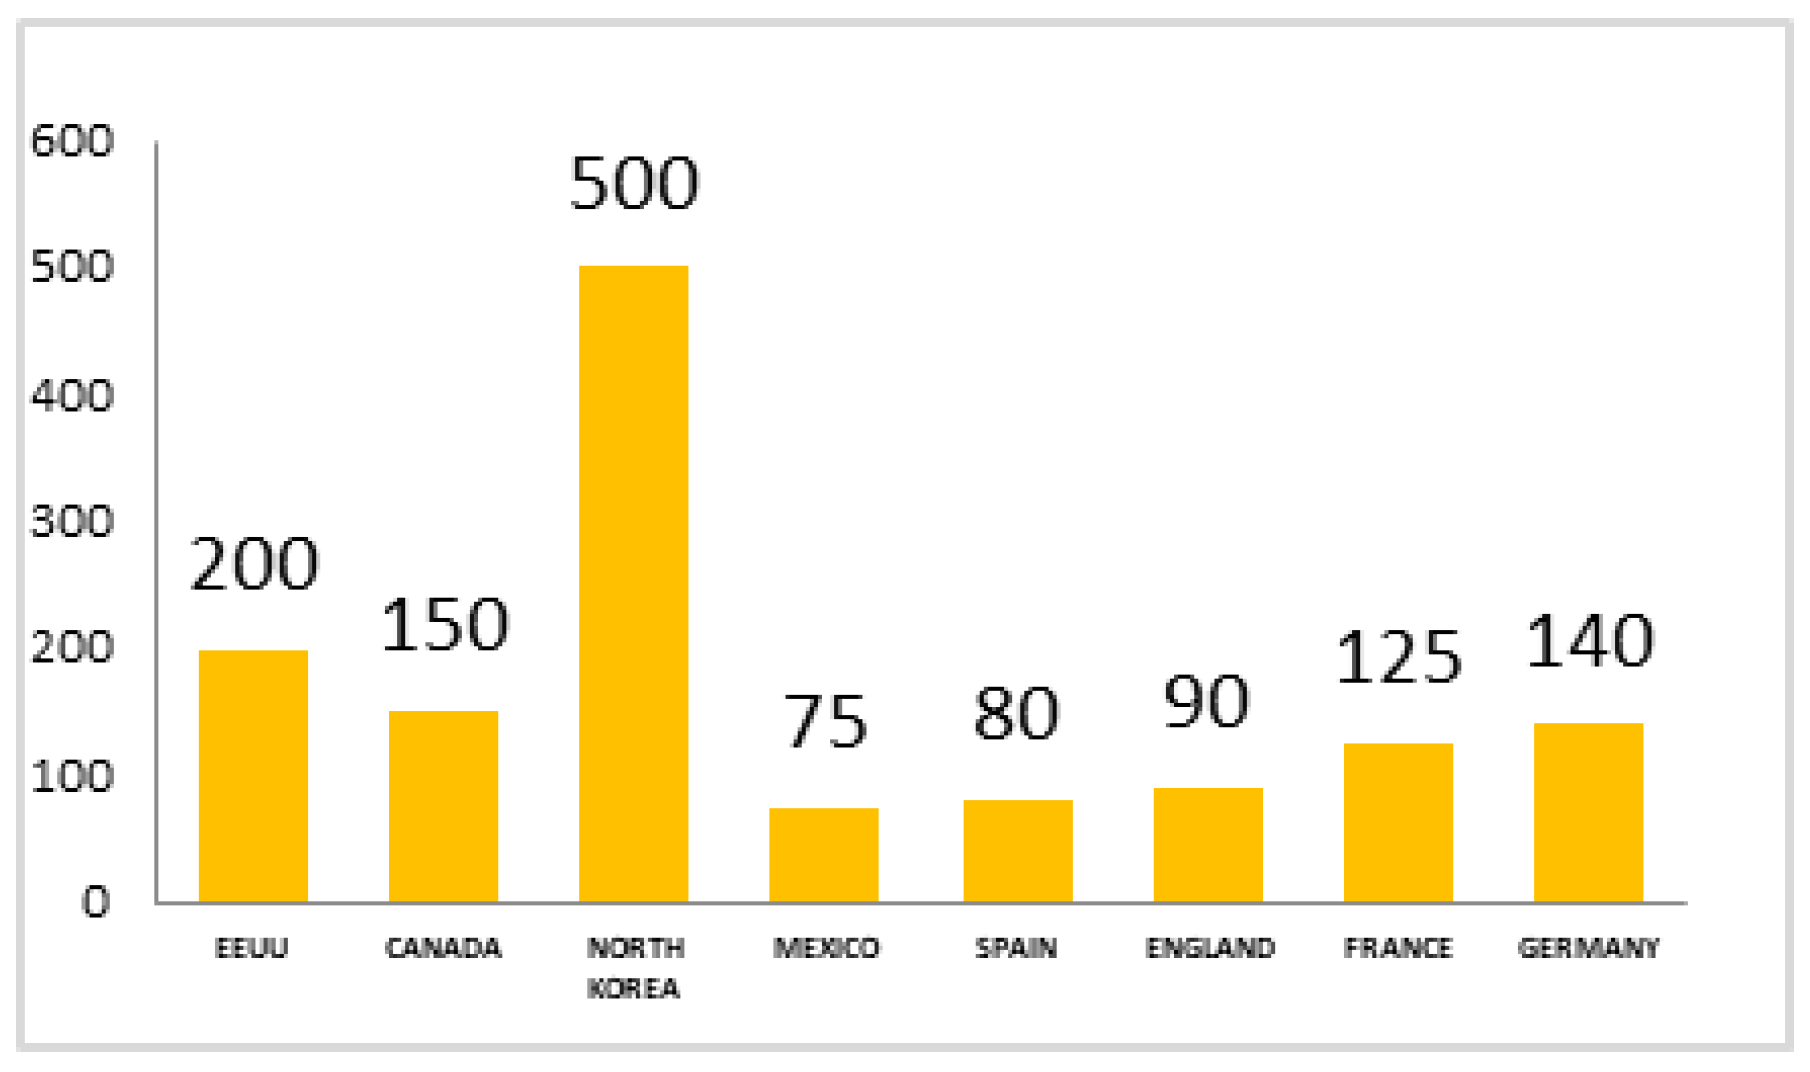
Polarity functions as a perceptual signal that modulates trust. When the polarity distribution across reviews is extreme, i.e., when a substantial number of highly positive and highly negative reviews coexist, consumers often perceive ambiguity and a lack of consensus. This divergence generates uncertainty and reduces trust in both the reviews and the reputation index. Importantly, polarity does not always imply distrust; it is the presence of extreme polarization that induces suspicion of manipulation or unreliability.
This phenomenon is especially relevant for the QVP_ORI model, since detecting extreme polarity patterns helps identify cases where the reputation score may fail to represent consumers’ perceived trust. A typical example arises when reviews for a product or service are sharply divided, creating uncertainty that complicates purchase decisions (see Figure 1).
Three polarity indices have been defined to model this behavior, enabling the quantification of different aspects of polarity distribution in user reviews. Table 1 presents the index, its definitions, and the corresponding formulas.
Where:
- σ: standard deviation of product review polarities.
- σM: mean standard deviation over the same product.
- pi: individual review polarity, pi Є [-1, 1].
- N: total number of reviews.
- C: neutral sentiment threshold.
- Min (1, ⸳): normalization function ensuring values remain within [0, 1].
3.1.2. Temporal Cardinality Patterns
Temporal cardinality patterns analyze how the timing and concentration of reviews influence consumer perceptions of trust or distrust toward a product or service. These patterns capture cases where reviews are unevenly distributed over time and exhibit sudden surges of activity, which consumers often interpret as atypical or artificially induced.
From a perceptual standpoint, a consistent and organically distributed flow of reviews tends to convey authenticity and reinforce trust. By contrast, when many reviews appear in a short time window, consumers may suspect manipulation or coordinated promotion campaigns. This perception undermines confidence in the reviews and reduces trust in the associated reputation index. A representative case is illustrated in Figure 2, where a sharp spike in review activity within a narrow interval creates uncertainty and weakens purchase intention.
To quantify this behavior, three indices have been defined, each measuring different aspects of the temporal distribution of reviews (Table 2):
Where:
- n: total number of time intervals (e.g., months or weeks).
- k: number of detected peaks.
- : count or presence of reviews in interval i associated with peak j (1 if active, 0 otherwise).
- SIA: score of clustering intensity (peak height).
- SID: score of temporal irregularity (distribution deviation).
- α: weight of intensity (e.g., 0.5).
- β: weight of intensity (e.g., 0.5).
- px: number of reviews in peak x.
- hx+1: number of reviews in the following time interval.
- rs: smoothing range (maximum expected or normalized number of reviews).
- prom(⋅): mean of differences between peaks and their adjacent intervals.
These indices are incorporated into the QVP_ORI through the entropy-based weighting system, ensuring that unusual temporal dynamics and their perceptual impact on consumer trust are adequately reflected in the adjusted reputational valuation
3.1.3. Expression Patterns
Expression patterns analyze how contradictory or inconsistent statements within reviews affect consumer trust in a product or service. These patterns highlight cases in which users provide divergent or conflicting evaluations of the same product attributes, creating confusion and uncertainty in decision-making.
From the consumer’s perspective, information is perceived as unreliable when reviews contain inconsistent assessments, for example, praising and criticizing the same feature simultaneously. Such inconsistencies weaken confidence not only in the product but also in the associated reputation index. Figure 3 illustrates this situation: different users evaluate the brightness of a paint differently; some highlight it as a strength, while others describe it as insufficient or defective. These contradictions foster distrust and complicate purchasing decisions.
To capture these effects, three indices have been defined to quantify different aspects of expression in user reviews (Table 3):
Where:
- NCC: number of reviews containing internal contradictions (e.g., antonyms or conflicting phrases).
- NCS: number of reviews with significant semantic or lexical divergence (non-similar reviews).
- NCL: total number of characters across all reviews.
- N: total number of reviews analyzed.
- avg(⋅): average function used to compute mean review length.
These indices are incorporated into the QVP_ORI through an entropy-based weighting system, ensuring the perceptual impact of contradictory or inconsistent expressions is accurately represented in the adjusted reputational valuation.
3.1.4. Geolocation Patterns
Geolocation patterns examine how the geographic origin and diversity of reviews influence consumer trust or distrust. When reviews predominantly originate from a single country or region, especially when this distribution does not align with the product's expected market profile, consumers may perceive the evaluations as manipulated or inauthentic. Such perceptions can undermine trust and negatively impact purchase decisions.
Conversely, a geographically diverse distribution of reviews, consistent with the product’s natural market context, tends to reinforce trust in the authenticity and representativeness of the ratings. In this sense, geographic diversity serves as a perceptual signal of reliability, whereas geographic concentration may signal potential bias.
Figure 4.
Geographic distribution of reviews in product/service evaluations.
To capture this phenomenon, the Country Dominance Index (CDI) has been defined (Table 4). This index measures the degree of concentration of reviews from one or a few countries relative to the total review set, indicating potential geographic bias.
Where:
- CDP: number of reviews from the country with dominant participation.
- CPE: total number of reviews with identified country information.
The CDI is incorporated within the QVP_ORI through the entropy based weighting system, ensuring that the perceptual impact of geographic dominance, conversely or diversity, is adequately represented in the final adjusted reputational valuation.
3.1.5. Interpretation of Entropy in the Patterns
Using entropy to calculate the weights of the patterns within the QVP_ORI index enables the quantification of the level of disorder or dispersion in the observed values for each pattern over time. However, the interpretation of entropy is not uniform across all patterns; it depends on the nature of the phenomenon being modeled and on how consumers perceive disorder or lack of diversity in each case.
In some patterns, higher entropy (greater dispersion) is associated with stronger distrust. For example, in polarity patterns, a wide dispersion of opinions, such as the simultaneous presence of highly positive and highly negative reviews, creates ambiguity and reduces trust. In such cases, the weight of the pattern is calculated directly from its entropy value (Ei).
By contrast, other patterns are characterized by low entropy (lack of diversity) as the primary signal of distrust. For instance, when reviews are concentrated in only a few countries, consumers may interpret this as a sign of manipulation in geolocation patterns. In these cases, the weight is calculated as (1 − Ei), reflecting that reduced diversity amplifies the perceptual impact of the pattern.
Similarly, in temporal cardinality patterns, high entropy reflects irregular surges of reviews within short intervals, which consumers may perceive as artificially induced campaigns. For this reason, the weight is again calculated directly from Ei. The same applies to expression patterns: high entropy indicates contradictions and inconsistencies across user comments, which diminish trust, so Ei is used.
This logic ensures that the weighting of patterns is coherently aligned with their perceptual impact on trust. Patterns in which dispersion increases distrust are weighted directly with Ei, while patterns in which concentration increases distrust are weighted with (1 − Ei). Table 5 summarizes the interpretation adopted for each pattern based on the type of situation that triggers consumer distrust.
By aligning entropy calculation with the perceptual dynamics of distrust, the model ensures that QVP_ORI more faithfully reflects the psychological and cognitive mechanisms underlying consumer decisions in the presence of suspicious signals.
3.2. Emotional Online Valuation Index: QVP_ORI
The QVP_ORI index forms the core of the proposed model, as it enables the dynamic adjustment of product or service ratings based on the perception of distrust that consumers develop when they detect suspicious patterns in reviews. This section outlines the structure of the index and the process by which it is calculated, including its formal definition and the method used to weigh the different patterns.
The presentation is organized as follows: first, the general formula of the index is introduced, together with an explanation of its components and their interpretation. Next, the method for calculating the weights associated with each pattern is described, based on entropy analysis that allows the model to adapt to the perceptual dynamics of consumers.
3.2.1. Definition of the QVP_ORI Index
The QVP_ORI (Quantified Valuation of Perception – Opinion Relational Index) represents the perceptual adjustment factor that reflects the degree to which distrust patterns identified in online reviews affect consumer confidence in a product or service. Rather than serving as a final reputation score, QVP_ORI operates as an additional perceptual adjustment layer applied to the original platform rating.
The adjusted rating is obtained by applying QVP_ORI as a correction factor over the baseline reputation index. This formulation ensures that the final score reflects both the aggregated evaluations and the perceptual influence of suspicious patterns on consumer trust.
Formally, QVP_ORI is defined as a weighted combination of the normalized values of the identified patterns, where each weight is determined through entropy analysis to capture its perceptual relevance:
where:
: normalized value [0, 1] of distrust pattern i (empirical sub-index extracted from review data).
: normalized weight of pattern i, obtained through entropy analysis.
: total number of patterns considered (in this study, n = 10).
To ensure comparability across patterns and maintain stability in the model, the weights are normalized so that:
Finally, the QVP_ORI value can be rescaled to a 0–10 range for interpretability, aligning with standard online reputation systems.
Interpretation
A QVP_ORI score of close to 10 indicates that distrust patterns have minimal impact, suggesting strong consumer confidence in the reviews. A QVP_ORI close to 0 means the strong presence of distrust signals, leading to greater uncertainty and reduced trust.
Thus, the index functions as a bridge between numerical aggregation and perceptual evaluation, integrating how consumers interpret reputational information beyond raw scores.
Final Adjusted Rating
The final product or service reputation score (Adjusted Rating) is obtained by applying the QVP_ORI value as a modulation factor over the original platform rating.
where:
- Radj: adjusted reputation rating.
- Rori: original platform rating.
- QVP_ORI: perceptual adjustment factor derived from entropy weighted distrust patterns.
- α ∈ [[, 1]: sensitivity coefficient controlling the strength of the adjustment.
This multiplicative formulation ensures that the correction is proportional to the detected level of distrust, preserving the original aggregation mechanism while incorporating perceptual modulation. Lower α values prioritize rating stability, whereas higher α values amplify the perceptual correction effect.
This ensures that the adjusted score is directly proportional to perceived trust. When is close to 1, the original rating remains nearly unchanged; when is low (e.g., due to strong distrust patterns), the rating is proportionally penalized. This approach preserves the original aggregation mechanism while integrating a perception-sensitive correction.
Adjustment Coefficient (α)
The parameter α serves as a sensitivity coefficient that regulates the intensity of the reputational adjustment in response to perceived distrust.
Unlike additive corrections, in this model, α scales the effect of QVP_ORI as a multiplicative factor over the original rating
- Lower values of α (close to 0) produce mild corrections, prioritizing rating stability.
- Higher values of α (close to 1) generate stronger corrections, penalizing the rating in proportion to distrust signals.
By construction, this adjustment function is monotonic with respect to the original reputation rating for fixed values of QVP_ORI, ensuring stability and preservation of the ordinal structure of the original index.
Recommended ranges:
- High-trust or high-stakes domains (e.g., healthcare, finance, security): α = 0.7–1.0.
- Low-risk consumer markets: α = 0.2–0.4 to avoid excessive fluctuations.
3.2.2. Weighting Method Based on Entropy
This model uses entropy to dynamically calculate the weights associated with each distrust pattern, determining their relative importance in the QVP_ORI index. Entropy quantifies the degree of disorder or unpredictability in the distribution of values observed for each pattern over time.
In this context, entropy captures the level of informational disorder that users intuitively associate with authenticity or manipulation, depending on the type of pattern. Some patterns generate more consumer distrust when their values are highly dispersed (e.g., polarity, temporal cardinality), while others appear suspicious when they show low diversity (e.g., geographic dominance). This interpretation is detailed in Section 3.1.5.
In this framework, the weight assigned to each pattern is proportional not to its frequency of occurrence but to the informational strength it exhibits within the system. In other words, patterns that generate higher levels of entropy, interpreted as greater variability or disorder in the data, or lower entropy when concentration itself signals distrust, acquire greater relative weight. Consequently, the weighting process reflects the perceptual force of each pattern rather than its numerical prevalence.
The entropy for each pattern i is calculated from the normalized distribution of its subindex values, using the formula:
where:
- : entropy value for pattern i.
- : proportion of values falling into category j.
- : Normalization constant to ensure ∈ [0, 1].
- m is the number of categories (e.g., years, months, or other time intervals) over which the pattern values are distributed.
The interpretation of or depends on the specific distrust pattern, as previously defined in Section 3.1.5. This ensures that the entropy metric accurately reflects the perceptual impact of each pattern on consumer trust.
Note that intermediate entropy values may appear as negative due to the natural logarithm term. To maintain consistency with information theory conventions, the absolute value is considered and normalized within the range [0, 1], ensuring that higher entropy corresponds to greater disorder and lower predictability. This normalization step guarantees comparability across patterns and prevents sign ambiguity in subsequent weighting calculations.
Once the entropy values are obtained, they must be transformed into weights for use in the QVP_ORI index. To ensure that the result forms a convex combination, the weights are normalised so that their sum equals 1:
This normalization guarantees that each pattern contributes proportionally to the final index according to its perceptual relevance, and that the QVP_ORI value remains within the expected range.
Using an entropy based weighting scheme, the model gains flexibility and adaptability: patterns with greater potential to affect consumer trust perception receive higher weights, while those with less perceptual impact contribute less. This dynamic approach also supports future extensions, allowing the inclusion of new patterns without altering the core structure of the model.
4. Application Example
This section illustrates how the QVP_ORI model is operationalized on real world data to demonstrate its capacity to capture perceptual distrust patterns and adjust reputation scores accordingly.
To evaluate the practical usefulness of the QVP_ORI index, an empirical study was conducted using a set of reviews corresponding to four selected products from the Amazon e-commerce platform. The analyzed corpus comprised 6,983 verified purchase reviews recorded between January 2018 and December 2022.
The objective of this analysis is to determine the impact of the occurrence of the previously defined patterns, associated with signals of distrust, on the final product rating. To this end, the ten patterns were applied as analytical criteria to the dataset to quantify how their presence alters consumers’ aggregated perception. Table 6 presents selected examples of the reviews considered for one of the products under analysis. Subsequently, the products and their associated reviews were anonymized, as the purpose of this study is not to evaluate specific products. Table 7 reports the total number of reviews for each product analyzed during the study period.
Intermediate calculations will be illustrated using Product 1 as an example to facilitate understanding of the procedure. However, the aggregated results for the four analyzed products are presented at the end of the section.
Table 8 shows the values of the different indices associated with each pattern for Product 1 across the various years of the study.
Once the indices for each pattern have been obtained, the weight of each pattern is calculated using the Entropy Method proposed in this study. To this end, each variable involved in the entropy calculation will be computed step by step.
For a fixed product and each pattern , let denote the observed value of that pattern in year . The normalized proportions are defined as:
The entropy of pattern is computed as:
Here, he time interval (in years). We use the natural logarithm, and terms with = 0 are treated as 0·ln(0) = 0. This normalization ensures that all entropy values lie within [0, 1], maintaining consistency across patterns and enabling direct comparisons.
As previously stated, the calculation of pattern weights in the index QVP_ORI is performed using the Entropy Method, which assigns objective weights based on the variability in the occurrence of each pattern over time. This variability is interpreted as an indicator of each pattern’s capacity to generate consumer distrust, assigning a greater weight to those with higher disruptive potential in shaping product perception.
To ensure consistency with the notational system defined in Appendix A, all empirical variables (e.g., iatd, ipg, ism) are expressed in lowercase. At the same time, theoretical constructs (e.g., ) remain in uppercase.
The interpretation of ᵢ regarding distrust perception depends on the nature of the pattern (see Table 5). This mechanism ensures that the weights accurately reflect the perceptual impact of each pattern on consumer trust. For patterns where high entropy indicates greater distrust, the weight is taken as . Conversely, for patterns where low entropy indicates greater distrust, the weight is taken as Table 9 presents the final entropy calculation for distrust perception. As previously defined, in some cases, high entropy reflects situations of greater distrust (where ),. In contrast, in others, low entropy signals higher distrust (where ). An example of the latter is the Country Dominance Index (CDI).
Clarification on entropy values. Some values reported in Table 9 may appear negative due to the logarithmic term involved in the computation of Shannon entropy when applied to empirical discrete distributions. These values correspond to intermediate components of the entropy calculation (i.e., log ) and do not represent entropy itself, which is non negative by definition.
The final entropy value for each pattern is obtained by summing these components, applying the normalization constant k=1/ln(m), and rescaling the result to the [0, 1] interval. All entropy-based quantities used for weighting in the QVP_ORI model therefore satisfy the theoretical properties of Shannon entropy and are fully comparable across patterns.
The final weight values are calculated by normalizing them, as shown in Table 10.
The index is calculated using the following formula, yielding QVP values for each analyzed time. The results are presented in Table 11.
where:
- Ii represents the normalized value of each pattern from Table 8, and
- wi represents the corresponding entropy-based weight calculated as described above.
Multiplication by 10 rescales the QVP_ORI value to the 0–10 range, aligning it with conventional reputation rating systems for more straightforward interpretation.
The progressive increase in QVP_ORI values across the analyzed years suggests a gradual reduction in perceptual distrust, indicating that informational disorder in user reviews decreased over time as patterns became more stable. This trend empirically supports the interpretation of QVP_ORI as a perceptual measure sensitive to informational disorder and consumer trust.
To align the QVP_ORI adjustment with the interpretative space of platform ratings, the final valuation is computed by applying the α-modulated correction defined in Section 3.2.4. This operation allows the adjusted score to reflect both the aggregated reputation and the perceptual modulation derived from distrust patterns.
Where
- OriginalRating is the baseline platform rating (e.g., Amazon score),
- QVP_ORI is the perceptual adjustment factor derived from the model,
- α is the sensitivity coefficient controlling the strength of the adjustment (see Section 3.2.4), and
- n is the total number of patterns considered.
This formulation preserves the original aggregation mechanism while introducing a perception-based correction that penalizes reputation scores in proportion to the level of distrust detected. Table 12, Table 13, Table 14 and Table 15 present the Amazon ratings and the corresponding adjusted valuation calculations for products P1–P4.
Figure 5 compares the original Amazon ratings and the QVP_ORI adjusted ratings for Product 1 across the analyzed period. As shown, the adjusted values are consistently lower than the original scores, reflecting the model's perceptual penalty applied to the distrust-inducing patterns identified in the reviews.
This behavior empirically supports the theoretical assumption that informational disorder operates as a perceptual penalty within reputation systems, confirming that QVP_ORI effectively integrates consumer distrust signals into the evaluative process and translates them into measurable adjustments of reputational value
5. Empirical Validation of the QVP_ORI
To evaluate the proposed QVP_ORI index, a controlled experiment was conducted under realistic conditions for digital product evaluation. The objective was to assess whether the adjusted rating reduces the discrepancy with perceived consumer trust compared to a conventional reputation index based on the arithmetic mean of numerical ratings.
5.1. Experimental Design Index
The experimental study was conducted with 60 participants: 40 undergraduate and graduate students from the University of Málaga (Engineering, Psychology, and Marketing) and 20 professionals working in e-commerce and digital communication. All participants had regular exposure to online purchasing environments and experience in interpreting online reviews.
Each participant evaluated six real products using representative excerpts from verified Amazon reviews. Products were selected from different categories (technology, home, and consumer goods) to avoid domain-specific bias. A design was applied, with each participant evaluating all products.
For each product, participants completed three tasks:
- Perceived Trust. “How much trust do the reviews you read about this product generate in you?” (Scale: 0 = no trust, 10 = maximum trust).
- Perceived Reputation. “What overall rating would you give this product, based on what you have read?” (Scale: 0 = very poor reputation, 10 = excellent reputation).
- Selection of Representative Index. For each product, two ratings were shown:
- A conventional reputation index based on the arithmetic mean of user scores.
- A rating based on the QVP_ORI model, adjusted according to detected distrust patterns.
Participants were then asked:
“Of the two ratings shown, which do you think better reflects your overall impression of the product?”
Response options:
- The simple average represents my impression better.
- b. The QVP_ORI index represents my impression better.
- c. Both ratings are equally representative.
- d. Neither rating reflects my perception adequately.
5.2. Results
The results revealed systematic differences between the conventional reputation rating (arithmetic mean) and the adjusted value provided by the QVP_ORI index, as compared with participants perceived trust. In particular, the traditional index consistently overestimated subjective trust, whereas the QVP_ORI adjustment reduced this discrepancy.
Discrepancy analysis. Paired t-tests were conducted to quantify the distance between perceived trust and the values provided by each index using 60 paired observations (n = 60). Results show that the discrepancy between perceived trust and the conventional index was statistically significant (t(59) = −8.43, p < 0.001), indicating a systematic overestimation of trust. While the adjusted QVP_ORI index also differed significantly from perceived trust (t(59) = −4.83, p < 0.001), the magnitude of this discrepancy was substantially lower, confirming that the proposed adjustment reduces the error relative to users’ trust perception.
Directional consistency. Pearson correlations were computed as a complementary measure to assess whether both indices preserved the same reputational trend. The QVP_ORI index showed a strong, statistically significant correlation with perceived trust (r = 0.83, p < 0.01), whereas the conventional index showed a moderate, non-significant correlation (r = 0.72, p = 0.10). These results indicate that the adjustment preserves the original reputational signal while improving alignment with perceived trust.
User preference. When participants were asked which rating better reflected their overall impression, 67.5% selected the QVP_ORI index, compared to 21.3% who preferred the conventional index. The remaining 11.2% reported no clear preference. A binomial test confirmed that the preference for QVP_ORI was statistically significant (p < 0.001).
Table 16 summarizes the statistical results. Figure 6 presents the mean comparisons across the six products, showing the conventional Amazon rating, the QVP_ORI-adjusted index, and participants perceived trust, with 95% confidence intervals. As illustrated, the adjusted index consistently lies closer to the confidence interval of perceived trust, whereas the original rating tends to fall outside this range, reflecting its systematic overestimation.
Figure 6. Comparison of mean values between the original Amazon rating, the QVP_ORI adjusted index, and participants perceived trust (with 95% confidence intervals), illustrating the reduction of discrepancy achieved by the proposed adjustment.
6. Discussion
The results confirm that digital reputation cannot be adequately interpreted as a simple numerical aggregation of ratings, but rather as a phenomenon mediated by perceived trust alignment, which users construct by identifying patterns that suggest manipulation or reputational distortion. The experimental results show that this misalignment is systematic and quantifiable, as the conventional reputation index consistently overestimates perceived trust.
Unlike previous approaches primarily focused on fake review detection, spam filtering, or content-level semantic analysis, the proposed model introduces a perceptual correction layer that operates as a soft-computing mechanism. This layer does not impose binary decisions or hard thresholds; instead, it modulates reputational scores through graded, uncertainty-aware adjustments. Empirical validation shows that this adjustment reduces the mean absolute error between displayed ratings and perceived trust from 1.27 to 0.12, while preserving the original reputational signal.
The use of entropy as a measure of informational disorder is particularly appropriate in this context. The findings indicate that the identified distrust patterns, related to extreme polarity, temporal irregularities, linguistic anomalies, and geolocation inconsistencies, generate increased interpretive uncertainty within the system. This result is consistent with prior research on informational ambiguity and overload in digital environments, which shows that perceived inconsistency or artificiality in discourse undermines trust even when individual content items are not explicitly negative.
Shannon entropy was selected as the disorder metric due to its canonical formulation, interpretability, and minimal assumptions on data distribution. However, the proposed framework is not intrinsically dependent on this specific formulation. Alternative information-theoretic measures (e.g., Rényi or Tsallis entropy) could be incorporated to modulate sensitivity to concentration or dispersion effects without altering the model's structure. In this sense, entropy acts as a general quantitative proxy for perceptual informational disorder, and the choice of Shannon entropy represents a pragmatic engineering decision rather than a restrictive assumption.
A key contribution of the proposed model is that the ten distrust patterns were not normatively or theoretically imposed but inductively extracted from real user comments in which consumers explicitly articulate reasons for distrust or purchase abandonment. This inductive, data-driven identification provides firm empirical grounding, as the patterns reflect recurrent collective interpretive signals observed in naturalistic digital contexts rather than predefined analytical categories. The large-scale analysis, based on more than 200 million reviews processed using natural language processing techniques, supports the robustness and recurrence of these perceptual patterns across products and contexts.
From a methodological perspective, the validation results demonstrate that QVP_ORI primarily improves reputational accuracy by reducing perceptual error rather than altering rankings or directional trends. Although the correlation with perceived trust is preserved (r = 0.83), the model's central contribution lies in minimizing the discrepancy between numerical reputation scores and perception-aligned evaluations. The fact that a clear majority of participants (67.5%) selected the adjusted index over the conventional reputation score confirms that the model captures implicit aspects of collective reputational reasoning applied by users in practice.
The practical implications of these findings are particularly relevant for trust-sensitive digital environments, including e-commerce, healthcare, education, mobility services, and information platforms. QVP_ORI enables monitoring not only of changes in average ratings but also of shifts in the interpretive climate surrounding products and services, facilitating early detection of reputational erosion before it becomes structurally embedded. Its modular architecture enables the incorporation of new perceptual patterns and dynamic weight recalibration, thereby reinforcing its applicability across various domains.
Nevertheless, the results should be interpreted in light of certain limitations. The proposed model operates at the level of aggregated reputational perception and does not assume full exposure of users to the complete distribution of reviews, but rather to the observable patterns presented through the platform interface. The experimental validation was conducted with a controlled, relatively small sample (n = 60), and future studies should replicate the analysis with larger, more heterogeneous populations. In addition, although the model has been applied to massive volumes of review data, the analysis has focused on specific platform contexts, and further cross-platform validation is required. Finally, while the sensitivity parameter α can be interpreted as a reputational risk-aversion factor, future implementations could estimate it through optimization or learning procedures to adapt the model to domain-specific conditions.
7. Conclusions
This work introduces the QVP_ORI index as a quantitative framework for adjusting digital reputation by incorporating perceptual distrust signals from user-generated content. The results show that digital reputation cannot be reliably modeled as a simple numerical aggregation of ratings, as users systematically reinterpret aggregated scores when suspicious patterns of information are detected.
The main contribution of the study is the formalization of a perceptual correction layer applied to an existing reputation index. Using entropy-based weighting and a sensitivity parameter, QVP_ORI models interpretive uncertainty affecting trust and reduces the discrepancy between displayed reputation scores and perceived trust, while preserving the original reputational signal. Empirical validation confirms a substantial reduction in error relative to conventional aggregation methods, supporting the relevance of perceptual factors in reputational judgment.
In addition, the inductive identification of ten distrust patterns, grouped into four semantic dimensions, provides an empirically grounded and extensible basis for modeling reputational perception in large-scale digital environments. These patterns capture recurrent interpretive signals that are not explicitly represented in traditional reputation metrics.
From an applied perspective, QVP_ORI offers a practical tool for platforms and organizations operating in trust-sensitive contexts, enabling the detection of reputational erosion driven by perceptual signals rather than overt rating changes alone. Its modular architecture supports adaptation across domains and facilitates the integration of new perceptual patterns as digital ecosystems evolve.
Overall, this study contributes to narrowing the gap between aggregated reputation metrics and collective perceptual responses by integrating semantic analysis, information theory, and uncertainty-aware modeling within a soft computing framework. QVP_ORI is not intended to replace existing reputation indices, but to complement them with a perceptual dimension that is essential for accurate interpretation and management of digital reputation.
Author Contributions
José Ignacio Peláez: Conceptualization, methodology, formal analysis, model design, supervision, writing – original draft, writing – review & editing. Gustavo F. Vaccaro: Conceptualization, methodology, validation, data analysis, writing – original draft, writing – review & editing. Felix Infante: Data preprocessing, NLP support, experimental setup assistance, review & editing. David Santo: Data curation, implementation support, empirical analysis, review & editing.
Funding
This work was funded by the Spanish Ministry of Science and Innovation under the National. Project Presucear, Reference: PID2023-151727NB-100), and by the Fundación Corporate Excellence – Centre for Reputation Leadership.
Appendix A. Symbols and Abbreviations Used in the QVP_ORI Model
| Symbol | Description | Pattern Dimension |
| IPM | Index of Review Polarity Relative to Their Own Mean | Polarity |
| IPS | Index of Review Polarity Relative to Sentiment Intensity | Polarity |
| IPG/ipg | Index of Review Polarity Relative to Global Mean | Polarity |
| TCAI/iatc | Temporal Cardinality Aggregation Index | Temporal |
| TDAI/iatd | Temporal Deviation Aggregation Index | Temporal |
| MDI/idm | Mean Dispersion Index | Temporal |
| CRI/ipc | Contradictory Review Index | Expression |
| OSI/ism | Opinion Similarity Index | Expression |
| ELI/ile | Expression Length Index | Expression |
| CDI/idp | Country Dominance Index | Geolocation |
| ISO/iso | Index of Semantic Overlap | Expression (if applicable) |
| IVC / ivc | Index of Vocabulary Consistency | Expression |
| QVP_ORI | Quantified Valuation of Perception – Opinion Relational Index | Global Index |
| α | Adjustment coefficient controlling sensitivity | Adjustment parameter |
| Eᵢ | Entropy value of pattern i | Weighting parameter |
| wᵢ | Weight of pattern i (normalized) | Weighting parameter |
| Iᵢ | Normalized value of pattern i | Sub-index value |
| Set of time intervals (e.g., years) within [T_start, T_end] | Time parameter |
References
- Aggarwal, AG; Aakash, NA. Analysing the interrelationship between online reviews and sales: the role of review length and sentiment index in electronic markets. International Journal of Internet Marketing and Advertising 2020, 14(4), 361. [Google Scholar] [CrossRef]
- Al-Yazidi, SA; Berri, J; Hassan, MM. Novel hybrid model for organizations’ reputation in online social networks. Journal of King Saud University - Computer and Information Sciences 2022, 34(8), 5305–17. [Google Scholar] [CrossRef]
- Barbado, R; Araque, O; Iglesias, CA. A framework for fake review detection in online consumer electronics retailers. Inf Process Manag 2019, 56(4), 1234–44. [Google Scholar] [CrossRef]
- Chakraborty, U; Bhat, S. The Effects of Credible Online Reviews on Brand Equity Dimensions and Its Consequence on Consumer Behavior. Journal of Promotion Management 2018, 24(1), 57–82. [Google Scholar] [CrossRef]
- Chan, LK; Hui, Y V.; Lo, HP; Tse, SK; Tso, GKF; Wu, ML. Consumer satisfaction index: new practice and findings. Eur J Mark 2003, 37(5/6), 872–909. [Google Scholar] [CrossRef]
- Chen, L; Li, W; Chen, H; Geng, S. Detection of Fake Reviews: Analysis of Sellers’ Manipulation Behavior. Sustainability 2019, 11(17), 4802. [Google Scholar] [CrossRef]
- Chevalier, JA; Mayzlin, D. The Effect of Word of Mouth on Sales: Online Book Reviews. Journal of Marketing Research 2006, 43(3), 345–54. [Google Scholar] [CrossRef]
- Flanagin, AJ; Metzger, MJ; Pure, R; Markov, A; Hartsell, E. Mitigating risk in ecommerce transactions: perceptions of information credibility and the role of user-generated ratings in product quality and purchase intention. Electronic Commerce Research 2014, 14(1), 1–23. [Google Scholar] [CrossRef]
- Glez-Peña, D; Lourenço, A; López-Fernández, H; Reboiro-Jato, M; Fdez-Riverola, F. Web scraping technologies in an API world. Brief Bioinform 2014, 15(5), 788–97. [Google Scholar] [CrossRef] [PubMed]
- Haque, TU; Saber, NN; Shah, FM. Sentiment analysis on large scale Amazon product reviews. 2018 IEEE International Conference on Innovative Research and Development (ICIRD), 2018; IEEE; pp. 1–6. [Google Scholar]
- Hirschberg, J; Manning, CD. Advances in natural language processing. Science (1979) 2015, 349(6245), 261–6. [Google Scholar] [CrossRef]
- Karaca, Y; Moonis, M. Shannon entropy-based complexity quantification of nonlinear stochastic process. In Multi-Chaos, Fractal and Multi-Fractional Artificial Intelligence of Different Complex Systems; Elsevier, 2022; pp. 231–45. [Google Scholar]
- Khder, M. Web Scraping or Web Crawling: State of Art, Techniques, Approaches and Application. International Journal of Advances in Soft Computing and its Applications 2021, 13(3), 145–68. [Google Scholar] [CrossRef]
- LESNE, A. Shannon entropy: a rigorous notion at the crossroads between probability, information theory, dynamical systems and statistical physics. Mathematical Structures in Computer Science 2014, 24(3), e240311. [Google Scholar] [CrossRef]
- Li, X; Hitt, LM. Self-Selection and Information Role of Online Product Reviews. Information Systems Research 2008, 19(4), 456–74. [Google Scholar] [CrossRef]
- Martens, D; Maalej, W. Towards understanding and detecting fake reviews in app stores. Empir Softw Eng 2019, 24(6), 3316–55. [Google Scholar] [CrossRef]
- Mohawesh, R; Xu, S; Tran, SN; Ollington, R; Springer, M; Jararweh, Y; et al. Fake Reviews Detection: A Survey. IEEE Access. 2021, 9, 65771–802. [Google Scholar] [CrossRef]
- Salminen, J; Kandpal, C; Kamel, AM; gyo, Jung S; Jansen, BJ. Creating and detecting fake reviews of online products. Journal of Retailing and Consumer Services 2022, 64, 102771. [Google Scholar] [CrossRef]
- Wu, Y; Ngai, EWT; Wu, P; Wu, C. Fake online reviews: Literature review, synthesis, and directions for future research. Decis Support Syst. 2020, 132, 113280. [Google Scholar] [CrossRef]
- Zaman, M; Vo-Thanh, T; Nguyen, CTK; Hasan, R; Akter, S; Mariani, M; et al. Motives for posting fake reviews: Evidence from a cross-cultural comparison. J Bus Res. 2023, 154, 113359. [Google Scholar] [CrossRef]
- Chang, C. Fake News: Audience Perceptions and Concerted Coping Strategies. Digital Journalism 2021, 9(5), 636–59. [Google Scholar] [CrossRef]
- Peláez, JI; Cabrera, FE; Vargas, LG. Estimating the importance of consumer purchasing criteria in digital ecosystems. Knowl Based Syst. 2018, 162, 252–64. [Google Scholar] [CrossRef]
- Peláez, JI; Martínez, EA; Vargas, LG. Products and services valuation through unsolicited information from social media. Soft comput 2020, 24(3), 1775–88. [Google Scholar] [CrossRef]
- Vaccaro-Witt, GF; Bernal, H; Guerra Heredia, S; Cabrera, FE; Peláez, JI. Effect of Informational Divergence on the Mental Health of the Population in Crisis Situations: A Study in COVID-19. Societies 2025, 15(5), 118. [Google Scholar] [CrossRef]
- Nadkarni, PM; Ohno-Machado, L; Chapman, WW. Natural language processing: an introduction. Journal of the American Medical Informatics Association 2011, 18(5), 544–51. [Google Scholar] [CrossRef] [PubMed]
- Nalewajski, RF. Entropy, Information and Communication Channels. In Information Theory of Molecular Systems; Elsevier, 2006; pp. 56–90. [Google Scholar]
- Ni, J; Li, J; McAuley, J. Justifying Recommendations using Distantly-Labeled Reviews and Fine-Grained Aspects. In Proceedings of the 2019 Conference on Empirical Methods in Natural Language Processing and the 9th International Joint Conference on Natural Language Processing (EMNLP-IJCNLP), Stroudsburg, PA, USA, 2019; Association for Computational Linguistics; pp. 188–97. [Google Scholar]
- Peláez, JI; Bernal, R; Karanik, M. Majority OWA operator for opinion rating in social media. Soft comput. 2016, 20(3). [Google Scholar] [CrossRef]
- Ratnasingham, P. The importance of trust in electronic commerce. Internet Research 1998, 8(4), 313–21. [Google Scholar] [CrossRef]
- Stampa, E; Schipmann-Schwarze, C; Hamm, U. Consumer perceptions, preferences, and behavior regarding pasture-raised livestock products: A review. Food Qual Prefer 2020, 82, 103872. [Google Scholar] [CrossRef]
- Vaccaro, G; Cabrera, FE; Pelaez, JI; Vargas, LG. Comparison matrix geometric index: A qualitative online reputation metric. Appl Soft Comput 2020, 96, 106687. [Google Scholar] [CrossRef]
- Zhu, F; Zhang, X. Impact of Online Consumer Reviews on Sales: The Moderating Role of Product and Consumer Characteristics. J Mark. 2010, 74(2), 133–48. [Google Scholar] [CrossRef]
Figure 1.
Extreme polarity in the evaluation of products/services.
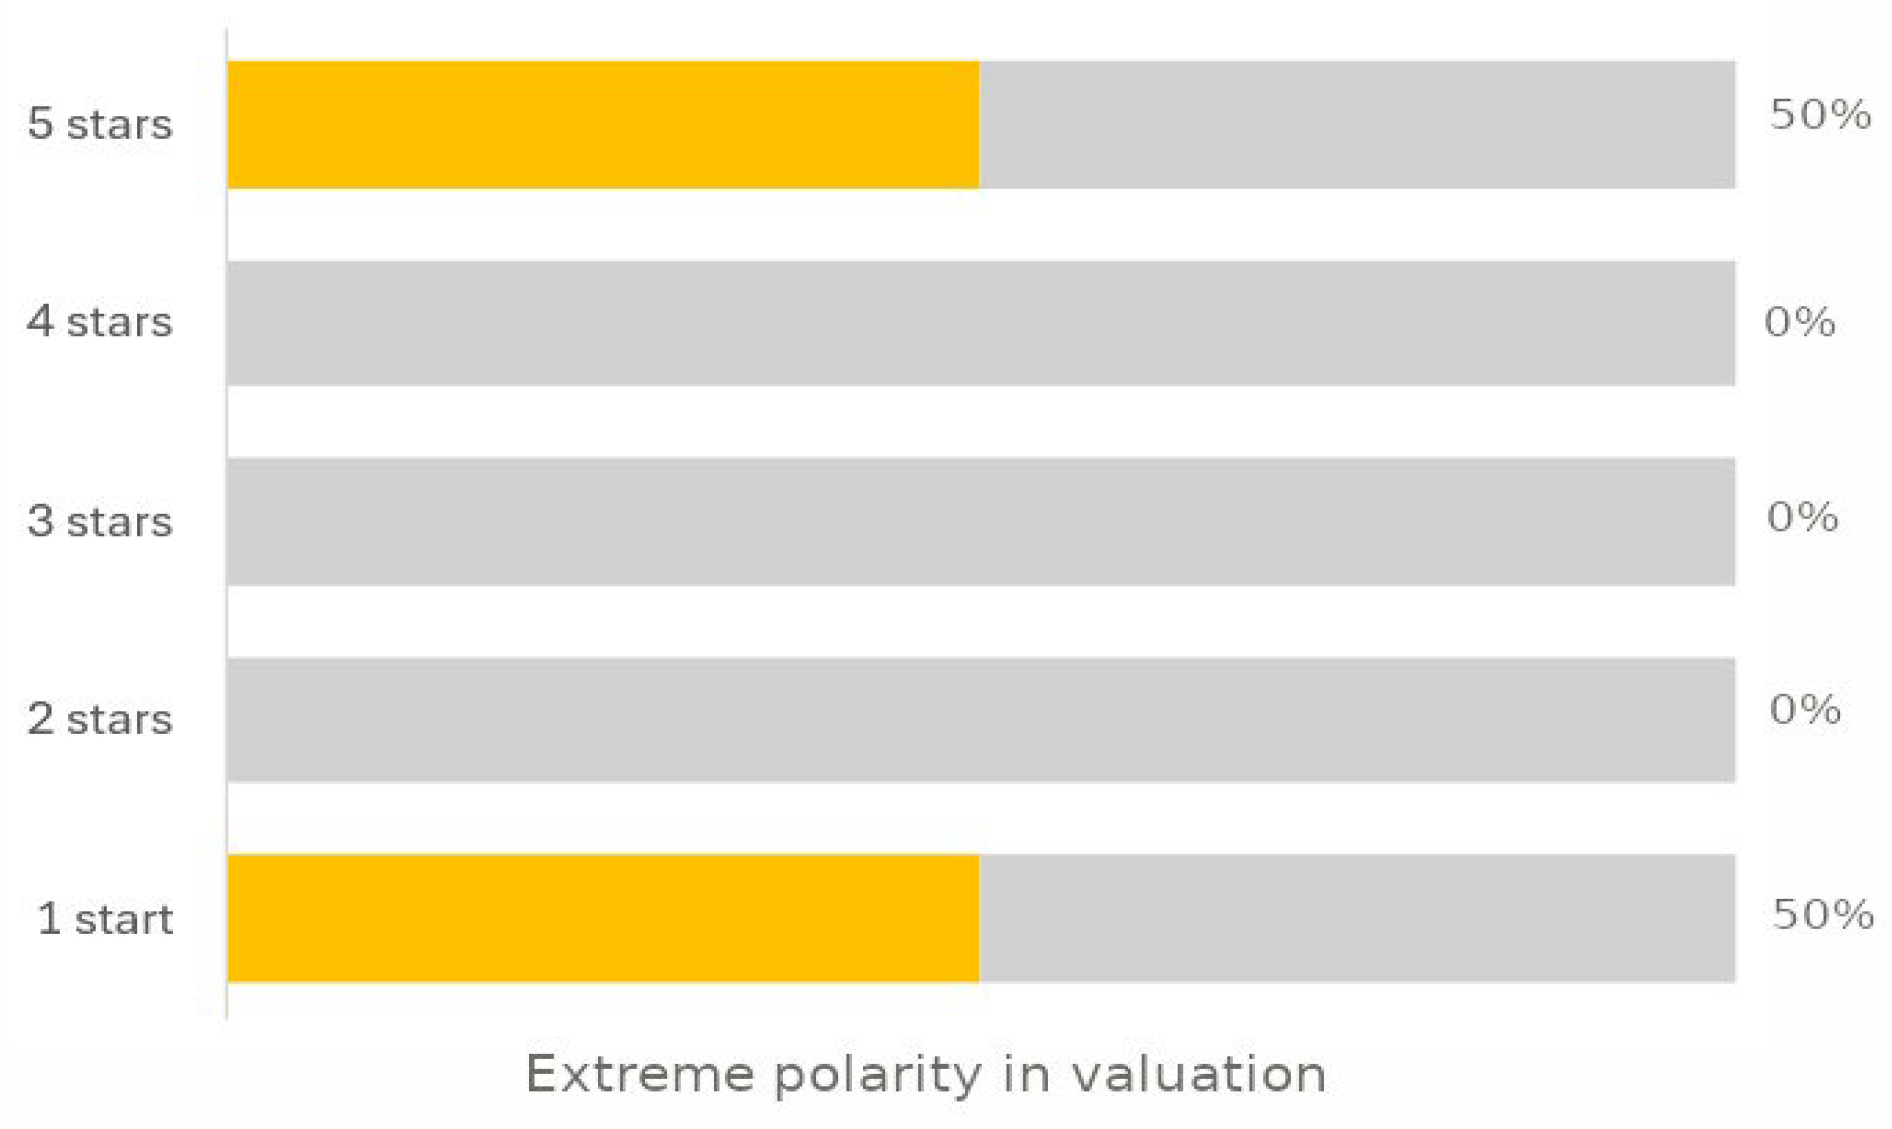
Figure 2.
Temporal cardinality in product and service reviews.
Figure 3.
Contradictory expressions in product reviews.
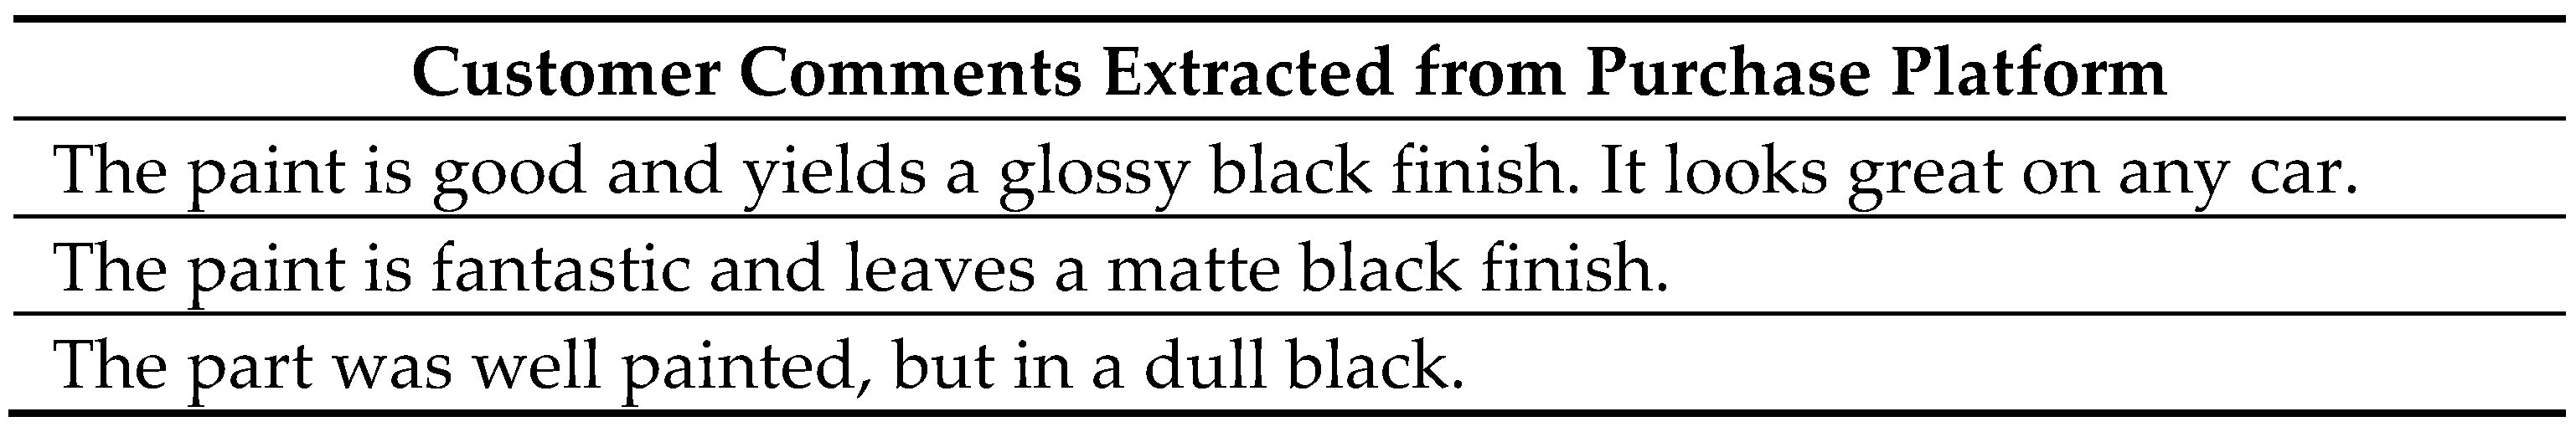
Figure 5.
Comparison between original Amazon ratings and QVP_ORI-adjusted ratings for Product 1 (2018–2022).
Figure 5.
Comparison between original Amazon ratings and QVP_ORI-adjusted ratings for Product 1 (2018–2022).
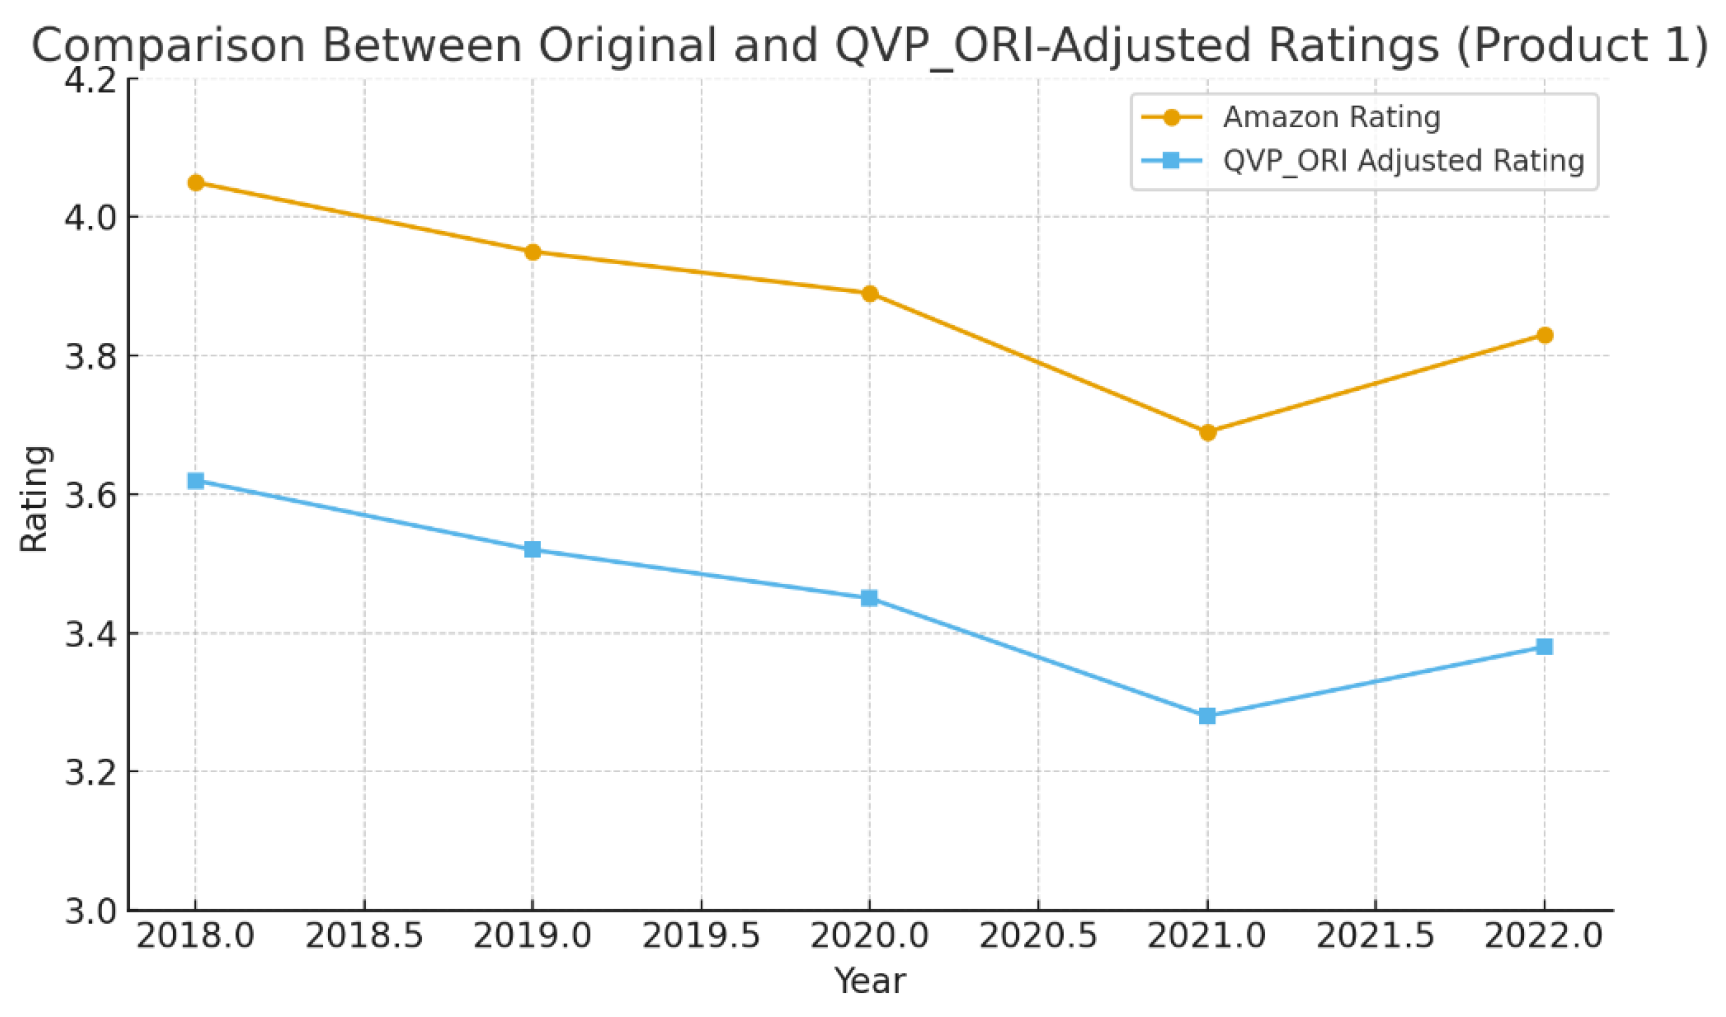
Figure 6.
Comparison of mean values between Amazon’s original rating, the QVP_ORI adjusted index, and participants perceived trust (with 95 % confidence intervals).
Figure 6.
Comparison of mean values between Amazon’s original rating, the QVP_ORI adjusted index, and participants perceived trust (with 95 % confidence intervals).
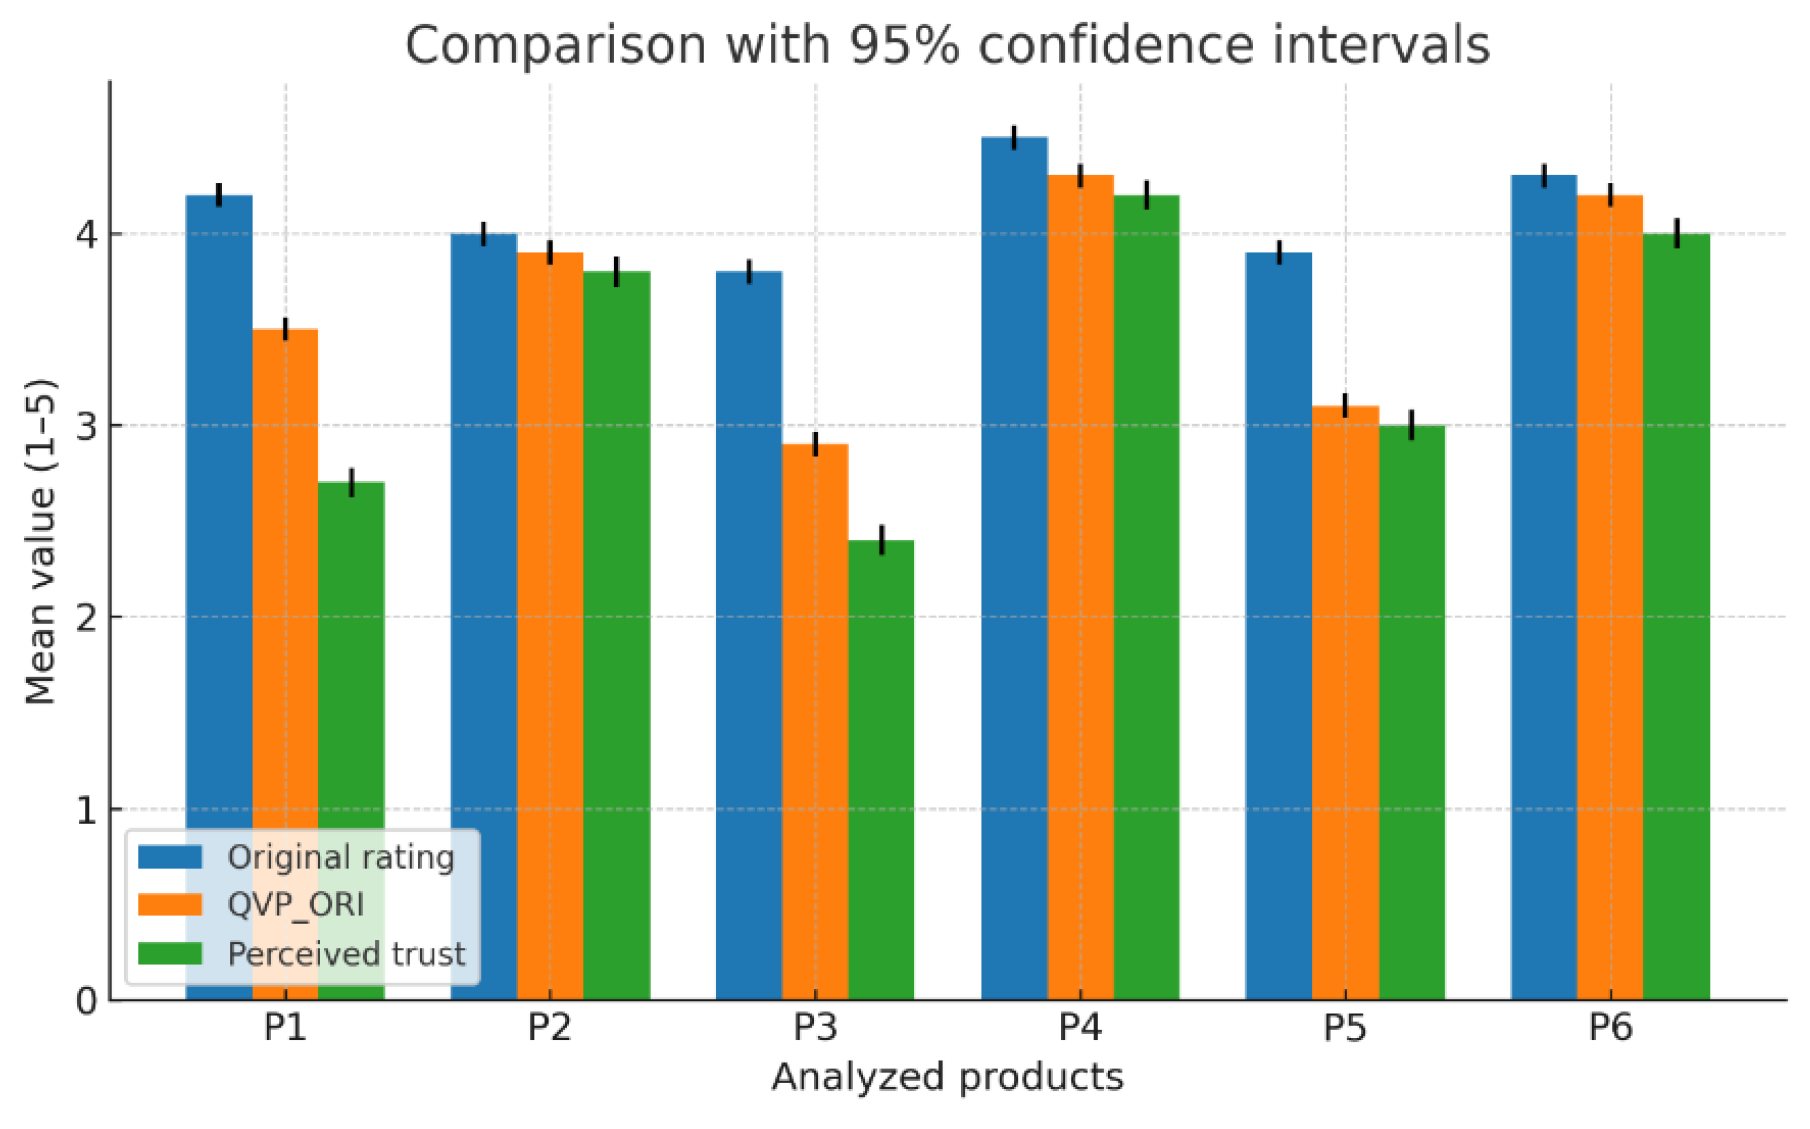

Table 1.
Polarity Indexes.
| Index | Definition | Mathematical Expressions |
|---|---|---|
| Index of Review Polarity Relative to Their Own Mean (IPM) | Measures how polarized the reviews are with respect to their own average polarity value. | |
| Index of Review Polarity Relative to Sentiment Intensity (IPS) | Measures the polarization of reviews based on a reference sentiment intensity value. | |
| Index of Review Polarity Relative to Global Mean (IPG) | Measures the polarity of individual reviews with respect to the overall average polarity across all reviews. |
Table 2.
Temporal cardinality Indices.
| Index | Definition | Mathematical Expressions |
|---|---|---|
| Index of Temporal Cardinality Aggregation (TCAI) | Measures the presence of peaks or high concentrations of reviews at specific points in time. | |
| Index of Temporal Deviation Aggregation (TDAI) | Measures the prominence of peaks in the temporal distribution and their deviation from the overall distribution. | |
| Index of Mean Dispersion (MDI) | Measures the average difference between identified peaks and their adjacent intervals, quantifying temporal irregularity. |
Table 3.
Expression-based Indices.
| Index | Definition | Mathematical Expressions |
|---|---|---|
| Index of Contradictory Review (CRI) | Measures the degree of contradiction within reviews through the presence of antonyms or opposing terms in the same comment. It focuses on product or service attributes rather than on the overall sentiment. | |
| Index of Opinion Similarity (OSI) | Measures the degree of similarity among reviews in terms of the vocabulary used to describe the product. Low similarity may indicate a lack of consensus or the presence of inconsistent opinions. | |
| Index Expression Length (ELI) | Measures the average length of reviews in terms of character count, as an indirect indicator of the informational depth of the comment. |
Table 4.
Geolocation Index.
| Index | Definition | Mathematical Expressions |
|---|---|---|
| Index of Country Dominance (CDI) | Measures the degree of concentration of reviews from one or a few countries relative to the total set, as an indicator of potential geographic bias. |
Table 5.
Interpretation adopted for each pattern in this work.
| Pattern | Situation that Generates Distrust | Weight Calculation Method |
|---|---|---|
| Polarity | High entropy (intense polarization of opinions) | Ei |
| Temporal Cardinality | High entropy (irregular spikes in review activity over time) | Ei |
| Expressions | High entropy (presence of contradictory or inconsistent expressions) | Ei |
| Geolocation | Low entropy (concentration of reviews from a small number of countries) | 1 - Ei |
Table 6.
Comments Expressed by Users in Verified Purchases.
| Product | Rating | Review |
| Google-Pixel-3a | 3 | The phone works great; the only problem is that after four months, the battery no longer lasts more than five hours. |
| Google-Pixel-3a | 3 | Nice display, but it is not transparent black like the iPhone 13; it is smooth and pleasing to read. Fingerprint (ok forget it), normal battery life. |
| Google-Pixel-3a | 4 | The camera is often blurry...requires a steady hand. |
| Google-Pixel-3a | 2 | Excellent camera, Loads reasonably fast. Garbage hardware. The speaker broke within a month. The charging port broke within 6 months. |
| Google-Pixel-3a | 4 | Very good, but it sometimes has trouble connecting to the internet, and it is very durable. |
Table 7.
Number of Reviews Analyzed per Product during the Period January 2018 – December 2022.
| Product | Number of Reviews |
|---|---|
| Product 1 | 2155 |
| Product 2 | 1651 |
| Product 3 | 1998 |
| Product 4 | 1179 |
| Total Reviews | 6983 |
Table 8.
Index Values for Product 1.
| Años | iatd | ipg | ipc | ism | iatc | idm | ile | iso | ivc | idp |
| 2018 | 0,13 | 0,68 | 0,27 | 0,49 | 0,49 | 0,35 | 0,44 | 0,95 | 0,95 | 0,10 |
| 2019 | 0,13 | 0,69 | 0,26 | 0,47 | 0,60 | 0,75 | 0,15 | 0,95 | 0,90 | 0,20 |
| 2020 | 0,31 | 0,67 | 0,25 | 0,47 | 0,52 | 0,60 | 0,40 | 0,98 | 0,92 | 0,20 |
| 2021 | 0,13 | 0,73 | 0,23 | 0,47 | 0,54 | 0,58 | 0,44 | 0,98 | 0,90 | 0,30 |
| 2022 | 0,27 | 0,71 | 0,23 | 0,51 | 0,60 | 0,87 | 0,38 | 0,83 | 0,91 | 0,40 |
Table 9.
Entropy Values Calculated for Product 1.
| Year | iatd | ipg | ipc | ism | iatc | idm | ile | iso | ivc | idp |
| 2018 | -0,27 | -0,32 | -0,33 | -0,32 | -0,31 | -0,24 | -0,34 | -0,32 | -0,33 | -0,20 |
| 2019 | -0,27 | -0,32 | -0,33 | -0,32 | -0,33 | -0,34 | -0,21 | -0,32 | -0,32 | -0,31 |
| 2020 | -0,37 | -0,32 | -0,32 | -0,32 | -0,31 | -0,32 | -0,33 | -0,33 | -0,32 | -0,30 |
| 2021 | -0,27 | -0,33 | -0,31 | -0,32 | -0,32 | -0,31 | -0,34 | -0,33 | -0,32 | -0,37 |
| 2022 | -0,36 | -0,32 | -0,31 | -0,33 | -0,33 | -0,36 | -0,33 | -0,31 | -0,32 | -0,34 |
| Entropy | 0,94 | 1,00 | 1,00 | 1,00 | 1,00 | 0,97 | 0,97 | 1,00 | 1,00 | 0,94 |
| 1-Entropy | 0,06 | 0,00 | 0,00 | 0,00 | 0,00 | 0,03 | 0,03 | 0,00 | 0,00 | 0,06 |
Note: empirical pattern variables (iatd, ipg, ipc, etc.) are expressed in lowercase, while theoretical constructs (Eᵢ) remain in uppercase for clarity.
Table 10.
Final Weights per Pattern.
| Pattern | iatd | ipg | ipc | ism | iatc | idm | ile | iso | ivc | idp |
|---|---|---|---|---|---|---|---|---|---|---|
| Preliminary Weight | 0,94 | 1,00 | 1,00 | 1,00 | 1,00 | 0,97 | 0,97 | 1,00 | 1,00 | 0,06 |
| Normalized Weight (wi) | 0,11 | 0,11 | 0,11 | 0,11 | 0,11 | 0,11 | 0,11 | 0,11 | 0,11 | 0,01 |
Note: Weights are normalized so that ∑wᵢ = 1, ensuring proportional contribution of each pattern to the QVP_ORI index.
Table 11.
QVP_ORI Values for Product 1.
| Year | iatd | ipg | ipc | ism | iatc | idm | ile | iso | ivc | idp | QVP |
| 2018 | 0,01 | 0,08 | 0,03 | 0,06 | 0,05 | 0,04 | 0,05 | 0,11 | 0,11 | 0,00 | 5,29 |
| 2019 | 0,01 | 0,08 | 0,03 | 0,05 | 0,07 | 0,08 | 0,02 | 0,11 | 0,10 | 0,00 | 5,45 |
| 2020 | 0,03 | 0,08 | 0,03 | 0,05 | 0,06 | 0,07 | 0,04 | 0,11 | 0,10 | 0,00 | 5,69 |
| 2021 | 0,01 | 0,08 | 0,03 | 0,05 | 0,06 | 0,06 | 0,05 | 0,11 | 0,10 | 0,00 | 5,57 |
| 2022 | 0,03 | 0,08 | 0,03 | 0,06 | 0,07 | 0,10 | 0,04 | 0,09 | 0,10 | 0,00 | 5,91 |
Table 12.
Adjusted Rating for Product 1.
| Years | Amazon Rating | |
|---|---|---|
| 2018 | 4,05 | 3,62 |
| 2019 | 3,95 | 3,52 |
| 2020 | 3,89 | 3,45 |
| 2021 | 3,69 | 3,28 |
| 2022 | 3,83 | 3,38 |
Table 13.
Adjusted Rating for Product 2.
| Years | Rating Amazon | |
|---|---|---|
| 2018 | 3,92 | 3,42 |
| 2019 | 4,03 | 3,54 |
| 2020 | 3,75 | 3,32 |
| 2021 | 3,89 | 3,39 |
| 2022 | 4,01 | 3,55 |
Table 14.
Adjusted Rating for Product 3.
| Years | Rating Amazon | |
|---|---|---|
| 2018 | 3,87 | 3,41 |
| 2019 | 4,15 | 3,72 |
| 2020 | 4,01 | 3,54 |
| 2021 | 3,73 | 3,31 |
| 2022 | 3,87 | 3,41 |
Table 15.
Adjusted Rating for Product 4.
| Years | Amazon Rating | |
|---|---|---|
| 2018 | 3,78 | 3,29 |
| 2019 | 3,95 | 3,50 |
| 2020 | 3,99 | 3,43 |
| 2021 | 4,16 | 3,60 |
| 2022 | 4,07 | 3,56 |
Table 16.
Summary of statistical results.
| Test | Statistic | p-value | Interpretation |
| Pearson (Original index) | r = 0.72 | 0.10 | Moderate, not significant |
| Pearson (QVP_ORI) | r = 0.83 | < 0.01 | High and significant |
| t-test: Trust vs. Original | t(59) = –8.43 | < 0.001 | Significant difference |
| t-test: Trust vs. QVP_ORI | t(59) = –4.83 | < 0.001 | Significant difference, lower discrepancy |
Disclaimer/Publisher’s Note: The statements, opinions and data contained in all publications are solely those of the individual author(s) and contributor(s) and not of MDPI and/or the editor(s). MDPI and/or the editor(s) disclaim responsibility for any injury to people or property resulting from any ideas, methods, instructions or products referred to in the content. |
© 2026 by the authors. Licensee MDPI, Basel, Switzerland. This article is an open access article distributed under the terms and conditions of the Creative Commons Attribution (CC BY) license.
Copyright: This open access article is published under a Creative Commons CC BY 4.0 license, which permit the free download, distribution, and reuse, provided that the author and preprint are cited in any reuse.


