
Submitted:
26 January 2026
Posted:
26 January 2026
You are already at the latest version
Abstract
We present a study to assess the feasibility and implications of replacing internal combustion engine vehicles with battery-powered electric vehicles (EVs) in a car-sharing fleet.
For the analysis, we used operational data from a local car-sharing company, which encompasses various aspects such as trip distance, start and duration, vehicle type, and pickup and return locations.
To evaluate the impact of transitioning the entire fleet to EVs, we used EV and charger models to simulate the battery-powered trips and also the necessary post-trip recharging.
Both could affect the service quality of car sharing services, as the requested trip distance might not be covered by an electric vehicle due to range or charging time limitations.
Specifically, in our simulation-based analysis, we identified chains of consecutive bookings as a critical factor for car-sharing electrification.
Furthermore, to assess the potential impact of electrification on the energy grid, we used data about the local grid load and its composition to relate it to the predicted vehicle charging times.
Keywords:
car-sharing
; mobility
; electrification
; simulation
; electric vehicles
; electric fleet
1. Introduction and Motivation
Electric vehicles (EVs) represent a shift towards sustainable and efficient mobility, particularly within urban areas. Also, with their lower variable (energy and maintenance) costs compared to internal combustion engine vehicles (ICEVs), they become attractive for car sharing, which can further contribute to sustainability by reducing the total number of cars needed in a city.
However, in a car-sharing scenario, notable drawbacks of EVs are their limited range and the time required to re-charge the battery. While EV battery technology and charging infrastructure is continuously improving, current EV characteristics may not support long-distance travel and might not align well with the quick turnaround times expected in car-sharing services. Both could thus potentially affect the service’s convenience and attractiveness. In this paper, we investigate the feasibility and implications of replacing ICEVs with EVs in a car-sharing context, using real-world operational data from a car-sharing provider based in Schleswig-Holstein, Germany. We aim to answer the following research questions:
- RQ1: What is the technical feasibility of converting the car-sharing fleet from ICEVs to battery-powered electric vehicles (BEVs), based on the given trip data?
- RQ2: What are the operational factors that could impact the success of an BEV car-sharing fleet, and can these factors be quantified?
- RQ3: What is the potential impact of a large-scale BEV car-sharing fleet on the local energy grid, and how does the timing of charging events correlate with grid load?
Our approach is data- and simulation-driven. The analysis is based on a large, real-world dataset of (ICEV) car sharing trips1, and simulations that model a corresponding, hypothetical fleet of EVs together with their charging behavior. This model includes scenarios that pertain to different policies like long-range bookings returning fully charged, empty, or with various state-of-charge (SOC) levels in-between. Using this model and the historic, but representative booking data, we can then answer RQ1 by quantifying to what extent the transition to EVs would make certain trips infeasible.
A critical operational factor we identify (addressed in RQ2) is the concept of booking chains. These are sequences of closely spaced, consecutive bookings of the same resource, which lead to sets of bookings that influence each other in a cause-and-effect relationship. In the electric car-sharing scenario, such a chain means that the SOC of a vehicle returned from a trip constrains the possibilities for subsequent bookings, as there might not be enough time to charge to an SOC level sufficient to serve these bookings. In our study, we define specific metrics of such chains (e.g., chain length, total chain distance), and analyze how they correlate with booking requests that cannot be served due to EV range and charging limitations.
In a second part of the study (addressing RQ3), we used data about the local energy grid’s daily load to relate it to the vehicle charging times predicted by our model. This way, we can analyze whether the EVs would put significant additional load on the energy grid.
Our main contributions are threefold. First, we propose a data- and simulation-driven methodology to assess the feasibility of electrifying a car-sharing fleet using large-scale, real-world booking and trip data. Second, we introduce the concept of booking chains as a critical operational factor for EV adoption and develop specific metrics to capture their properties and correlations with service disruptions. Third, we extend our analysis to include the interaction between EV charging patterns and the local energy grid. More concretely,
- we develop a simulation-based methodology to assess the replacement of ICEVs with EVs in a car-sharing fleet, using a comprehensive dataset of historical trips;
- we identify booking chains as a critical determinant of electrification success, as consecutive bookings with insufficient charging time may compromise vehicle availability;
- we define and evaluate booking-chain metrics (e.g., chain length and back-to-back booking score) that correlate with potential battery-related issues, thereby helping providers forecast the viability of EV adoption;
- we extend our model to analyze energy-system interactions, showing that predicted charging times frequently coincide with high-demand periods on the Schleswig-Holstein grid, potentially exacerbating imbalances.
This paper is an extended version of [1], which originally presented a threefold set of contributions.
First, the study presents an extensive analysis of car-sharing data collected over a 2.5-year period from January 2018 to June 2020. Second, it develops a simulation-based methodology to assess the feasibility of transitioning car-sharing fleets from internal combustion engine vehicles (ICEVs) to electric vehicles (EVs). Third, it introduces and formally defines the concept of booking chains as critical sequences of consecutive bookings that influence the adequacy of EV charging. In this context, we further defined a set of booking-chain metrics, including chain length, total chain distance, and the back-to-back booking score. Finally, the work provides a grid integration analysis demonstrating that EV charging demand peaks coincide with evening grid balancing periods.
The present version extends these contributions in several important ways. Most notably, it incorporates an additional dataset from 2023–2024 comprising 252,569 raw records corresponding to 196,852 trips, thereby enabling a comparative analysis across multiple time periods. Moreover, the grid integration analysis is substantially updated to include a multi-year comparison and a discussion of the potential role of vehicle-to-grid (V2G) technologies. In addition, the analysis of related work is considerably expanded, covering recent developments in car-sharing business models, challenges in EV adoption, smart charging strategies, and advances in V2G technologies.
Our results may be used for guiding the transition towards a partial or complete EV fleet for car sharing. One direct application of our identified metrics could be to determine which car-sharing stations to upgrade to more vehicles or more powerful chargers to shorten the booking chains, and thus reduce the amount of booking that cannot be served. Also, ranking the car-sharing stations and vehicles by booking chain length gives a good indication of which ones can or should be electrified right away or should be kept until more advanced technology (long-range vehicle models or fast-charging stations) is available.
The remainder of the paper is structured as follows. Section 2 reviews related work. Section 3 introduces the car-sharing setting, while Section 4 describes the booking and trip data obtained from a car-sharing company. Section 5 outlines our modeling methodology. Section 6 analyzes booking chains and operational factors, and Section 7 presents the simulation results. Section 8 extends our analysis with energy data to examine the grid implications of large-scale electrification. Finally, Section 9 concludes the paper and outlines future research directions.
2. Literature Review
This review focuses on existing research relevant to assessing the electrification of car-sharing fleets through data-driven simulation. We examine key challenges of EV adoption in shared mobility, prior simulation-based feasibility studies, approaches to managing charging under operational constraints, and the intersection of shared EVs with the electricity grid.
2.1. EV Adoption Challenges in Car-Sharing
The electrification of car-sharing fleets represents a strategic shift toward more sustainable urban transport, and operators have often been among the earliest adopters, providing many users with their first exposure to electric mobility [2]. Yet despite this head start, widespread deployment continues to face numerous setbacks that differ significantly from private EV ownership. Infrastructure remains perhaps the most visible constraint: a lack of fast-charging stations, limited charging point density, and suboptimal station placement contribute directly to range anxiety and vehicle unavailability, particularly for services that depend on rapid vehicle turnover [3,4,5]. These issues are compounded by economic hurdles, EVs carry higher upfront costs, and the parallel investment in charging infrastructure can strain operator budgets [6]. Operationally, the sequential nature of car-sharing bookings introduces a challenge private EV owners never face: batteries can become depleted across consecutive trips, sometimes necessitating costly staff interventions to relocate and recharge vehicles [7]. User acceptance adds another layer of complexity; unfamiliarity with EV range limitations and charging procedures can drive customers toward ICE vehicles, thereby lowering the utilization of electric fleet segments [2]. The failure of car2go’s all-electric service in San Diego serves as a cautionary tale, illustrating how promised infrastructure that fails to materialize, combined with limited-range vehicles and high user expectations, can erode trust and ultimately doom a service [8].
2.2. Simulation-Based Analysis of Fleet Electrification
Simulation has emerged as an indispensable tool for evaluating EV integration scenarios without the expense and risk of real-world deployment. By creating digital twins of car-sharing fleets and their operational environments, researchers can test different vehicle compositions, charging infrastructure layouts, and operational policies under controlled yet realistic conditions.
A significant portion of work in this direction focuses on infrastructure planning and optimization. For example, Borgosano et al. used simulation to demonstrate that a well-distributed and centralized charging network is critical for maximizing trip fulfillment and minimizing operational costs in free-floating electric car-sharing systems [4]. Similar approaches have been applied to station-based systems to determine the optimal number and power rating of chargers per station, balancing capital investment against service-level guarantees [9,10].
Another key line of research uses simulation to develop and evaluate operational strategies, particularly smart charging algorithms. These studies show how dynamic scheduling-based on predicted trip demand, vehicle state-of-charge, and external signals like electricity prices-can significantly improve fleet utilization, and reduce energy costs [11,12]. Simulation-based approaches that incorporate relocation strategies have been proposed to address spatial imbalances in vehicle and charger availability, thereby exploring potential solutions to one of the challenges faced by one-way services [13].
However, the validity and practical relevance of these simulations depend heavily on the input data used to generate travel demand. Many studies rely on synthetic trip generation models [14] or aggregated travel survey data, which may not capture the high-resolution, stochastic booking patterns-including intense sequences of back-to-back rentals that characterize real car-sharing operations. While studies such as that by Klingert and Lee [15] provide valuable insights by assessing 100% electrification using real-world private vehicle movement data at a city scale, their focus remains on personal mobility. Consequently, they do not address the core operational constraint in shared fleets: the rapid turnover of bookings on individual vehicles. This can leave critically short time windows for recharging and represents a primary source of potential service disruption in an EV context.
2.3. Booking Patterns, Charging Management, and Smart Solutions
Effectively managing an electric car-sharing fleet requires strategies that align charging with inherently unpredictable usage patterns. The literature has explored various approaches, from eager charging policies that maximize state-of-charge between trips to opportunity charging that exploits brief idle windows [16,17]. Infrastructure models also vary: some operators deploy dedicated station-based chargers to guarantee availability, while free-floating fleets depend more heavily on the public charging network, introducing its own uncertainties [16]. Smart Charging (SC) and Vehicle-to-Grid (V2G) technologies represent more advanced solutions. SC systems can dynamically adjust charging power in response to grid signals, helping to avoid congestion and reduce electricity costs [18,19]. V2G extends this capability by enabling bidirectional energy flow, allowing parked fleet vehicles to provide grid services during idle periods, which can improve both economic viability and grid stability [20,21,22]. Dynamic pricing models further incentivize charging during off-peak hours, aligning operator costs with system-wide efficiency [23,24]. A critical insight from this body of work is that the effectiveness of any such strategy hinges on the underlying pattern of vehicle usage. Our contribution centers on the concept of booking chains-sequences of temporally compressed, consecutive bookings–as a quantifiable operational factor that directly constrains charging opportunities. By defining metrics for chain intensity and correlating them with battery-related failures, we provide a predictive tool that operators can use to assess electrification risks without requiring detailed state-of-charge tracking.
2.4. Grid Integration of Shared EV Fleets
The potential for large-scale EV charging to strain local electricity grids has been recognized as a key concern for widespread adoption, particularly as EV penetration increases and charging loads become more concentrated in time and space [25,26]. Research in this area has begun to quantify how aggregated charging loads from shared fleets align–or conflict–with periods of peak electricity demand and variable renewable generation, highlighting the risk of exacerbating evening demand peaks if charging is unmanaged [27,28]. The promise of V2G technology is particularly relevant here, as it could transform fleet vehicles from passive grid loads into active, distributed storage resources, offering valuable grid services like frequency regulation and peak shaving while potentially generating new revenue streams for operators [29]. However, most existing analyses either model hypothetical charging profiles based on simplified assumptions about travel behavior [14] or use aggregate regional data that smooths over the operational details and temporal granularity of specific car-sharing services [15]. This approach limits their ability to assess the true, localized grid impact under realistic operational constraints, such as the clustering of vehicle returns after commuting hours or the limited idle time between consecutive bookings [26]. Our study addresses this methodological shortcoming by coupling a detailed, trip-by-trip simulation of EV charging schedules-derived directly from our case study’s high-resolution booking data-with high-resolution grid balancing data from the Schleswig-Holstein region. This allows us to provide a concrete, location-specific assessment of how post-trip charging aligns with periods when the grid is already under stress, and to discuss the practical implications for both car-sharing operators planning electrification and grid planners managing network capacity.
2.5. Positioning Our Work
Previous studies on electrification have primarily focused on the impact of private vehicle electrification on the local energy system [15], and on urban mass public transport [30]. While the work in [15] assesses 100% electrified mobility using real-world movement data from the German city of Mannheim, their analysis specifically addresses private vehicle usage patterns rather than shared fleet operations. Consequently, they do not examine critical operational constraints inherent to car-sharing, such as consecutive bookings and rapid vehicle turnover. Furthermore, their dataset captures general mobility patterns at urban scale, whereas our study is based on exclusive operational data from a car-sharing provider in the state of Schleswig-Holstein, covering 159,287 trips across 291 vehicles from January 2018 through June 2020, with an additional dataset of 196,852 trips across 375 vehicles from 2023 through 2024. These unique datasets enable our detailed investigation of booking chains-a concept not considered in [15] and their direct implications for charging infrastructure requirements and service feasibility in a shared mobility context. The work in [31] establishes a comprehensive evaluation system for Electric Car-Sharing Systems (ECSS) planning, focusing on four major indicators: construction of stations, maintenance & replacement of stations, routine inspection, and vehicle usability & relocation management, which collectively influence both revenue and cost of fleet electrification. The authors in [32] examine electric car-sharing and the elements that are found in successful programs in North America and Europe. The study in [33] discusses key concerns of fleet operators looking to switch to EV fleets by 2030, and what can be done to ease the challenges of fleet electrification.
In addition, several studies have proposed solutions to mitigate the technical limitations of EVs, such as a limited travel range and a scarcity of charging infrastructure compared to conventional fuel stations for ICEVs, that pose challenges to fleet electrification. For instance, the study in [34] introduces a smart charging method that optimizes the use of charging points to support electric car-sharing operations. This method manages charging duration by allocating power to vehicles based on their SOC and the desired end-of-charge time. Similarly, the authors in [12] propose a queueing network model to make electric vehicle sharing more viable and profitable. This model describes how customers choose EVs based on energy levels and implements a charging-up-to policy.
While these studies provide valuable insights into the factors that can aid in the successful transition of fleets to EVs (in a car sharing context), they do not focus on the specific booking patterns and their impact on the feasibility of such a transition. Our study fills this gap by using a data- and simulation-driven approach to identify critical features in the booking patterns that may lead to infeasibility of bookings, and thus are critical factors for successful car sharing electrification. Furthermore, we relate the vehicle charging times predicted by our model to the local energy grid’s daily load, allowing us to analyze whether the EVs would put significant additional load on the energy grid. This comprehensive approach differentiates our work from previous studies and provides a more nuanced understanding of the challenges and opportunities associated with transitioning to EVs in a car-sharing context.
3. Car-Sharing Setting Overview
Car-sharing is a mobility service that enables users to rent vehicles on-demand without ownership commitments [35]. This service has emerged as a transformative solution to urban mobility challenges, offering an alternative to private vehicle ownership while mitigating issues such as traffic congestion, pollution, and parking scarcity. To establish a clear foundation, the following discussion outlines the various configurations and key elements that define a car-sharing system.
3.1. Car-Sharing Operation
Car-sharing services have evolved from small-scale operations into larger businesses, incorporating advanced communication and reservation technologies [36]. The proliferation of smartphones and mobile apps has revolutionized the industry, enabling seamless booking, payment, and vehicle tracking. The success of car-sharing depends on various factors, including member characteristics, neighborhood attributes, and partnerships with organizations to promote the service [37]. The operation of car-sharing services involves several key steps: registration, booking, vehicle pickup, usage, and return of the vehicle. Each step is designed to ensure a seamless user experience while maintaining operational efficiency. We explain each of these steps in the following:
- Registration: To become a member of a car-sharing service, users typically complete a registration process by creating an account on the provider’s digital platform, which may be accessible via a website or mobile application. During this process, users are required to provide personal information, including their name, contact details, and driver’s license information. The registration process varies across providers, with some systems requiring additional data verification [38]. Many platforms also conduct background checks to assess the user’s driving history and eligibility. Once approved, users gain access to the service and can begin booking vehicles. Some providers offer tiered membership plans, enabling users to choose between pay-as-you-go options or subscription-based models that offer discounted rates for frequent users [39].
- Booking: Booking a vehicle is one of the most critical aspects of the car-sharing experience, as it directly impacts how quickly and conveniently users can access a vehicle. Most car-sharing platforms utilize mobile applications or web interfaces that allow users to browse available vehicles in real-time. Users can filter search results based on factors such as vehicle type (e.g. compact car, bus, SUVs, EV), location, and pricing. Once a suitable vehicle is identified, users can reserve it for a specific time period. Advanced systems often incorporate geolocation technology to display the nearest available vehicles and provide estimated walking times to reach them. Additionally, some platforms employ dynamic pricing models, where booking costs fluctuate based on demand, encouraging users to book during off-peak hours to secure lower rates.
- Vehicle Pickup: After booking a vehicle, users proceed to the designated pickup location/station. Users typically rely on smartphone apps that communicate with the vehicle via Bluetooth or cellular networks to unlock the vehicle. Some services also provide physical access cards or key fobs as backup options. Upon unlocking the vehicle, users are required to perform a quick inspection to document any pre-existing damage, ensuring accountability and transparency. This step is crucial for both users and providers, as it helps prevent disputes over the vehicle’s condition upon return.
- Usage: Once the inspection is done, users can begin their journey. Car-sharing services emphasize responsible usage, encouraging users to drive safely and adhere to traffic regulations. Many platforms offer additional features to enhance the driving experience, such as navigation tools, fuel level indicators, and reminders to refuel when necessary. For electric vehicles, users may receive notifications about nearby charging stations and battery range estimates. Providers typically include insurance coverage as part of the service, although terms and conditions vary depending on the provider and membership plan [39]. Real-time customer support (via the phone) is usually available to assist users with any issues that arise during their trip, ensuring a smooth and hassle-free experience. Furthermore, users can call-in to extend their booking when the need arises.
- Return: Returning the vehicle marks the final step in the car-sharing process. After parking, users lock the vehicle using the app or key fob, thereby completing the trip. In the case of EV, the user is instructed to plugin the vehicle for charging. The platform then calculates the total cost based on usage metrics such as time, distance, or a combination of both. Users receive a detailed invoice, which is typically accessible through the app or emailed for record-keeping purposes.
3.2. Car-Sharing Business Models
While the round-trip business model served as the foundational car-sharing concept, the landscape has significantly diversified over time. We will now examine various types of models and explain how they function.
3.2.1. Round-Trip Car-Sharing
Also known as station-based car-sharing, this model allows members to access a fleet of shared vehicles typically on an hourly basis. Vehicles are parked at fixed stations or hubs, and users must pick up and return them to the same designated location by the end of their reservation. Failure to do so can result in penalties or additional fees.
This model is particularly common in densely populated urban areas where parking space is scarce but predictable. By requiring vehicles to be returned to fixed stations, round-trip car-sharing simplifies fleet management and helps prevent vehicle clustering. However, it may also reduce user convenience, as flexibility in drop-off locations is limited. Because it has historically been the most widely adopted car-sharing model, numerous studies have examined its effects on vehicle kilometers traveled, GHG emissions, individual transportation costs, and private vehicle ownership [40].
3.2.2. Open-End Car-Sharing
Also known as free-floating or one-way car-sharing, this model allows users to pick up and drop off vehicles anywhere within a predefined service area, rather than at fixed stations. Members can end their trips at any legal parking spot within the operational zone, offering greater flexibility for spontaneous, point-to-point travel. This model is increasingly adopted in urban and suburban regions with high mobility demand and relaxed parking regulations, appealing to users seeking convenience for irregular or unplanned trips. While open-end systems reduce infrastructure dependency, they introduce logistical complexities such as vehicle redistribution and parking management.
3.2.3. Hybrid Car-Sharing
Hybrid car-sharing combines elements of both round-trip (station-based) and open-end (free-floating) models to leverage the strengths of each while mitigating their respective limitations. In a hybrid model, users might have the option to pick up a vehicle from a designated station and return it to any legal parking spot within a defined zone (one-way), or alternatively, pick up from a free-floating area and return to a station. Some models also allow users to return a vehicle to its original station, much like a traditional round-trip system, while also offering free-floating flexibility for certain trips. This approach aims to maximize user convenience and operational efficiency by offering more diverse options for vehicle access and return. Hybrid models are emerging in areas that require a blend of predictability and flexibility, such as cities with varying urban densities and differing parking regulations.
4. Car-Sharing Operational Data Analysis
The aim of this paper is to assess the feasibility of transitioning a car-sharing fleet from internal ICEVs to EVs. To this end, we conducted a simulation leveraging historical operational data from the car-sharing provider StattAuto eG (Lübeck, Germany) based in Schleswig-Holstein, Germany. This provider offers a hybrid model, with the station-based approach being predominant. Their operations are efficient, utilizing an extensive network of strategically positioned stations that serve over 600 members across over 150 stations. Figure 1 shows an example of a car-sharing vehicle operated by the provider, parked at a strategic pickup station on the University of Lübeck’s campus.
4.1. Data Preprocessing
Our analysis utilizes two operational datasets. The first trip data spans two and a half years, specifically from January 2018 through June 2020, while the second trip data spans from 2023 to 2024. Before preprocessing, the first dataset contained 371,437 database rows, while the second contained 252,569. Each booking spans one to four rows, reflecting the booking and accounting process steps. Some lines represent trips the customer canceled, or instances where the requested car was swapped. These bookings remained in the system for billing and other purposes. Manual intervention in some trips also resulted in redundant and duplicate booking entries. This occurred when administrators altered a trip, which could affect the next planned trip scheduled on the same car. Such alterations could trigger car replacement or a shift in the trip’s end time. However, not all of these modifications are reflected in the system, leading to double bookings for the same car and/or overlapping trip times. We refined the data to determine the number of trips accurately. This process involved consolidating all rows associated with a single booking to identify individual trips. We eliminated all trips that did not occur and those that overlapped with trips booked following a cancellation. Given that each trip is priced based on both duration and distance traveled, we utilized this information to recalculate the precise start and end times of trips with overlapping times and adjust their duration accordingly. This process resulted in a final count of 159,287 and 196,852 entries in the first and second datasets respectively, all representing actual trips.
Each booking record includes details such as start and end times, trip duration, distance driven, vehicle license number, and pickup/return station etc. The earlier dataset (2018–2020) was recorded in a legacy system with coarser timestamp granularity, whereas the newer dataset (2023–2024) comes from an updated system with higher temporal resolution, thus also less unwanted entries. In the legacy system, booking start times (for station-based rentals) were rounded to the nearest half-hour and no separate record of the actual vehicle pickup (unlock) time was kept. In contrast, the modern system provides exact timestamps to the minute (or second) for both the booking’s official start (payment initiation) and the moment the car is actually accessed. This improvement reveals very short idle periods that previously appeared as zero-minute gaps between back-to-back bookings in the legacy system. This fine-grained data allows for more accurate observation of usage patterns and potential charging opportunities for EVs between rentals.
4.2. Trip Information
The analysis encompasses two distinct periods: 2018–2020 and 2023–2024. The car-sharing fleet grew significantly between these periods, from 291 to 375 vehicles. From the outset, vehicles were categorized by their power source: electric vehicles (EVs) and internal combustion engine vehicles (ICEVs).
In the initial 2018–2020 period, the fleet consisted of 37 EVs and 254 ICEVs. The 37 EVs were responsible for 19,802 trips, representing 12.44% of all trips, and covered a total of 672,864 kilometers. In contrast, the 254 ICEVs accounted for the majority of activity, with 139,485 trips (87.56%) and 7,439,232 kilometers traveled. Notably, twelve of these ICEVs were assigned to an open-end model.
The subsequent 2023–2024 data reveals a marked shift towards electric mobility. While the number of ICEVs saw a modest increase to 283, the EV fleet more than doubled to 92 vehicles. This expansion is reflected in their usage: EV trips surged to 56,099, increasing their share to 28.52% of all trips. Furthermore, the total distance covered by EVs increased dramatically to over 2.2 million kilometers. Although the dataset does not specify the number of open-end vehicles for this period, the overall metrics demonstrate a significant growth in car-sharing activity, with EV adoption and utilization far outpacing that of ICEVs. A full summary of these statistics is provided in Table 1.
EVs and ICEVs encompass various brands and models, and we categorized them into seven distinct types. For easy reference, we aligned them based on a general description of car classification schemes [41,42]. Table 2 details the names of car types, fleet counts, and the number of trips executed by each distinct type, including the EVs (“Elektro”). We also show in the table the combined kilometers traveled by each car type, the number of trips per car, and the number of kilometers per car. All numbers are rounded to the nearest natural number. The cars designated for the open-end model belong to one of the car types (City Car), so we counted them together. Through this, preferences among users for different car types can be deduced. However, because the primary focus of our analysis is on evaluating the feasibility of converting the ICEV fleet to EVs, we refrain from providing a detailed breakdown of the “Elektro” fleet by car type in the subsequent discussion. We later return to this point by showing which car types within the “Elektro” category receive the operator’s main investments.
The City car type, with a fleet count of 134 in the earlier dataset, is a lightweight vehicle designed primarily for urban commuting and maneuverability. In this dataset, it was the most utilized car type, accounting for 87,572 trips, which represented approximately 33.2% of total trips and indicated a strong user preference. This dominance in utilization is also observed in the newer dataset. The Super Mini type, with a fleet count of 71 in the earlier dataset, facilitated 33,050 trips during that period. This type of car typically falls between City car and larger Compact cars in terms of size. Despite a smaller fleet than the City car type, the Super Mini cars were used for more trips, suggesting a higher booking rate in the earlier dataset. The Compact (Sedan) and Compact Wagon types, with earlier fleet counts of 21 and 14 respectively, facilitated 10,043 and 3,369 trips. While not as heavily used as City cars or Super Minis, these types still represented a significant portion of the total trips in the earlier dataset. The LCVp Bus, LCVc Transporter, and Multi-purpose van types had the smallest fleet counts and facilitated the fewest trips in the earlier dataset. For a comprehensive overview of fleet counts and trip numbers across all car types in both the earlier and newer datasets, please refer to Table 2.
4.3. Booking Patterns
Car sharing operations, due to their inherent flexibility – i.e., freedom to book at any time, possibility to extend a booking –, can exhibit unpredictable usage patterns. To better understand these usage patterns, we analyzed car pickup and return times, as shown in Figure 2a. Figure 2b corresponds to the 2018–2020 dataset, while SubFigure 2 presents the 2023–2024 dataset. These figures provide a detailed hourly breakdown of the number of cars picked up and returned throughout the day. There are discernible peaks at 9:00 AM for pickups and 6:00 PM for returns, suggesting a correlation with typical commuting hours. Our analysis also reveals a higher frequency of car usage on weekdays as compared to weekends. This could potentially be attributed to the increased demand for commuting during the workweek.
In addition to analyzing usage times, we also examined the distances covered during these car-sharing trips, as depicted in Figure 3. Figure 3a corresponds to the 2018–2020 dataset, while Figure 3b presents the 2023–2024 dataset. Our findings indicate that short bookings, ranging between 1 and 100 kilometers, are the most prevalent. However, there are a few outliers where trips cover distances exceeding 700 kilometers, indicating the occasional long-distance journey. On average, each car in the car-sharing dataset travels approximately 30 kilometers daily. When we look at individual bookings, the average distance covered per booking for each car is slightly higher, at 51.29 kilometers. This suggests that while cars are used frequently, each use tends to cover a moderate distance.
We further looked into the duration of these trips, presenting our findings in Figure 4 for the first dataset and Figure 5 for the second dataset. These figures encompasses both the frequency of single-day and multi-day trips. On a typical single day, a trip usually lasts about 10% of the day, which is equivalent to roughly 2.5 hours. While there are instances of trips lasting up to a month, the majority of trips do not exceed three days. This indicates that while car-sharing is used for both short and long duration, the majority of users tend to return the cars within a relatively short time frame.
4.4. Comparing Trends and Development
Over time, the composition of car-sharing fleets undergoes continuous evolution, shaped by both operational strategy and vehicle lifecycle considerations. New vehicles are regularly introduced to enhance service efficiency, meet emerging mobility demands, and incorporate technological advancements. Simultaneously, older or underperforming vehicles are systematically phased out due to mechanical wear, outdated specifications, or shifting user preferences.
This trend is evident in Figure 6, which illustrates the fleet evolution between 2018 and 2020 for both electric (Elektro) and non-electric (Non-Elektro) vehicles. Notably, a few cars were missing from the Non-Elektro fleet from January 2018 until March 2019, followed by a sharp increase and then a period of relative stability until April 2020. In contrast, the Elektro fleet started with only a few vehicles in 2018 and gradually expanded, reaching around 25 cars by mid-2020. This upward trend in electric vehicle adoption reflects a deliberate operational shift toward sustainability and modernization, aligning with broader industry movements toward low-emission mobility.
Figure 7 extends the analysis into the 2023–2024 period, offering a more recent snapshot of fleet dynamics. The Non-Elektro segment continues to dominate numerically, increasing from approximately 160 to 200 vehicles. However, the most significant trend is the relative growth of the Elektro fleet. While starting from a smaller base, it exhibits a much steeper growth trajectory, rising from around 50 to 75 vehicles – a proportional increase of approximately 50% compared to the 25% growth seen in the Non-Elektro segment. This parallel upward trajectory indicates an overall fleet expansion driven by rising demand. Crucially, the faster growth rate of the Elektro fleet suggests that electric vehicles are not just being added but are becoming an increasingly significant part of the fleet’s composition strategy, even as traditional vehicles remain central to current operations.
Figure 8 offers a more granular view of the Elektro fleet by disaggregating vehicle types, revealing subtle shifts in consumer preference and operational strategy. Among the electric categories, City cars and Super Minis exhibit the most pronounced growth, each surpassing 35 unique vehicles by the end of 2024. The City car segment follows a steady upward trajectory, while the Super Mini category shows a brief decline before regaining momentum. Elektro Compact cars, though introduced later, demonstrate modest yet consistent expansion. These trends suggest a strong user inclination toward smaller, urban-optimized electric vehicles-likely driven by factors such as suitability for short trips, parking convenience, and operational cost-effectiveness. The diversification and scaling of EV types within the fleet reflect a data-informed, adaptive approach aimed at aligning vehicle offerings with evolving mobility patterns and user expectations.
5. Approach and Methodology
The goal here is to simulate the electrification of car-sharing fleets by meticulously replicating the historical booking patterns characteristic of (mainly) ICEV fleets. This would require an adequate data model of EVs, underpinning their mobility and charging behavior. Since such data is rarely available due to the limited number of fully electric car-sharing operations, we construct our EV models for use in this simulation.
5.1. EV Models
Assuming that the booking demand remains the same, we constructed a fleet of EVs based on the ICEVs in order to simulate whether the transitioned fleet can handle the same volume and types of bookings as the ICEV fleet did. This was done by selecting the most popular model within the ICEV fleet from each of the seven car types and designating it as a representative model. We then identified its EV counterpart within the EV fleet, and used its specifications, such as battery capacity, travel range, and energy consumption, as the attributes of the newly modeled, hypothetical EV.
Table 3 presents the mapping between the brands in the ICEV fleets and their corresponding EV counterparts. For instance, within the “City car” type, the prevalent model is the “VW Up”. We found its electric version, the “VW e-Up”, in the EV segment of our data. When an ICEV does not have a direct electric counterpart within the EV segment, we conduct an online search to identify a suitable electric equivalent. In the EV segment of our dataset, the majority of the cars fall within the city car type, as such we use the “VW e-Up” as a representative model.
In Table 4, we display the specifications of these corresponding EV counterparts, which serve as the basis for our simulation. To continue with the “City car” example, as seen from Table 4, the model is equipped with a lithium-ion battery with a nominal energy capacity of 35 kWh. This allows it to travel between 180 km and 260 km on a single charge. In terms of charging, it takes 16 hours and 12 minutes to reach 100% State of Charge (SOC) using AC charging (2.3 kW), while DC charging (50 kW) can achieve 80% SOC in just about 1 hour.
5.2. Charging Model
To simulate EV operations, we make several assumptions about charging behavior. We assume linear charging: the battery’s state-of-charge increases linearly over time at a constant power rate until full. Each EV begins charging immediately when it is parked at its home station after a trip (“eager charging”), and it continues to charge until either the battery is full or the next trip for that vehicle begins. This implies that any idle time between trips is utilized for recharging the vehicle. We use a default charging power of 19.2 kW (approximate Level-2 charger) for most simulations, reflecting the typical chargers used by the car-sharing company. In addition, we explore a high-power charging scenario at 350 kW (Level-3 DC fast charging) to assess its impact on fleet availability. For simplicity, charging efficiency losses and nonlinear tapering effects at high states of charge are ignored – the model treats charging as ideal and proportional to time. Each trip consumes battery energy based on distance traveled (using the vehicle’s per-km consumption rate), and vehicles cannot exceed their available charge. We further assume drivers do not partially charge during a trip, except in the scenario where we explicitly allow en-route recharging (described below). Finally, all bookings are taken as given (same start times, durations, and distances as in the historical record) with no behavioral changes, so that any infeasibility is solely due to the EV’s range or charging constraints.
Formal Definitions: Let us define the following parameters for each vehicle type:
- : Battery capacity (kWh)
- : Energy consumption rate (kWh per km)
- : Maximum range on a full charge (km)
For each booking i with distance :
- : Energy required for the trip (kWh)
- : State of charge at booking start (fraction, 0–1)
- : Available energy (kWh)
Long-Range Booking Scenarios: A critical aspect of the charging model is how we handle long-range bookings – trips whose distance would exceed the range of a fully charged battery. In our simulation we consider three scenarios (policies) for such bookings:
- I-TLCB (Ignoring Trips Longer than Car Battery): In this conservative scenario, vehicles are assumed unable to recharge except at their home station during idle times. Thus, any booking i that requires more energy than a single full charge () is considered infeasible. The system flags these trips as “Max Range Exceeded,” and if a car’s available charge () cannot cover the required energy (), it results in an undesired recharge (UR) event (an operational shortfall). Essentially, all long-range trips are treated as problematic under this policy, since no mid-trip charging is allowed. No special mitigation is applied beyond identifying the issue, meaning these bookings would hypothetically fail or cause the vehicle to deplete its battery before completion.
- E-FULL (Excluding Full-Range Exceeding Bookings): In this scenario, the system proactively excludes any trip that exceeds the EV’s full-charge range. Such bookings are simply ignored in the simulation results where – effectively assuming the trip would not be accepted or served by an EV due to range limitations. This is equivalent to a policy where long trips are not undertaken by electric cars at all. The feasibility condition is simply . By removing all bookings beyond one charge worth of distance, we ensure no vehicle ever runs out of charge mid-trip (no unscheduled recharge events occur, by policy). This scenario provides an upper bound on performance when EVs strictly operate within their range constraints.
- A-LBRO (Allowing Long Bookings with Recharge Outside): This scenario permits long-range trips by assuming that vehicles can recharge en route (e.g., at public fast chargers during the trip) if needed. In the simulation, bookings where are allowed to proceed, on the assumption that the driver will obtain sufficient charge along the way to complete the journey. We implement this by not penalizing or excluding trips when ; effectively, the vehicle’s battery is “topped up” externally to accommodate the trip. This scenario mirrors the behavior of combustion vehicles (which can refuel on the go) and represents a best-case where charging infrastructure is ubiquitous for long trips. It results in no range-related failures as long as external charging is presumed available. Here, UR events occur only when but due to insufficient charge from prior bookings. The reasoning why these recharge events are undesired is that the user might have booked the car with the model’s maximum range in mind and had hoped to finish the trip without recharging. Additionally, we mandate a minimum return SOC of 25%.
These three scenarios bracket the possible operational strategies for handling trips beyond the EV range – from not accommodating them at all (E-FULL), to allowing them with difficulty (I-TLCB, which would register many UR events), to fully accommodating them via fast charging (A-LBRO). By comparing these policies, we can understand the trade-offs in terms of service coverage versus charging issues. The scenarios are applied consistently across the simulation to evaluate how many bookings would be disrupted or require special handling in each case.
6. Booking Chains
6.1. Concept and Formal Definition
We now introduce a central concept in our analysis to capture charging limitations: booking chains. A booking chain is a sequence of bookings for the same car and the same charging station, where the time gap between two consecutive bookings (i.e., from the return time point until the next booking starts) is less than the battery capacity divided by the charging power - that is, the time required for a full recharge:
A booking chain is thus a necessary, but not a sufficient, condition that bookings influence each other because one booking trip is compromised by a previous booking trip due to reducing the initial battery charge. It provides an effective means to identify potentially problematic booking sequences without necessitating detailed knowledge of the vehicle’s exact SOC history or the specific charging practices employed.
Formally, let be a sequence of n consecutive bookings with start and end times and , respectively ( and ). Then we call this sequence a booking chain if for all ,
where .
The rationale for this definition is two-fold: 1) it is independent of the charging strategy, 2) it is straight forward to calculate without needing to retrace or recalculate the previous state of charge of a single car. For instance, a booking chain with four bookings that occurs in our data is shown in Figure 9. The figure illustrates a booking chain consisting of four bookings, each identified by a unique ID: 507833, 506512, 507058, and 508385. The y-axis represents the SOC level, while the x-axis denotes the booking times. Initially, the first booking commenced with a full battery (SOC) and utilized only a portion of it, bringing it to 88%. The car was then returned from the trip and fully recharged back to 100% before the pickup of the next booking (ID 506512). The next two bookings were immediately initiated without the car undergoing a recharge process. The bookings form a chain because, if the battery had been empty, there would not have been enough time to fully recharge it between bookings, which could be critical for trips that use a large portion of the SOC.
6.2. Booking Chain Metrics
In addition, we will define various metrics related to booking chains. The metrics we will be examining include Chain Length, Total Chain Distance, Total Chain Duration, Average Time Between Bookings, Average Distance per Booking, Average Speed of Chain, Max Distance of Chain, Busiest Day of the Week, Peak Booking Hour of Day, Average Booking Duration, Back-to-Back Booking Score, Utilization Rate, Repeat User Rate, and Booking Lead Time. These metrics provide valuable insights into the usage patterns of vehicles, including frequency and duration of bookings, utilization rates, and user diversity, intending to find metrics that could correlate with battery capacity issues within booking chains.
- Chain Length: This metric measures the number of bookings in a chain: n.
- Total Chain Distance: This metric calculates the total distance covered by all bookings in a chain: .
- Total Chain Duration: This metric sums up the total duration of all bookings in a chain: .
- Average Time Between Bookings: This metric calculates the average time between bookings within a chain: .
The following metrics are listed for completeness but only informally defined for the sake of brevity:
- Average Distance per Booking: This metric calculates the average distance covered per booking within a chain.
- Average Speed of Chain: This metric calculates the average speed of a vehicle within a chain.
- Max Distance of Chain: This metric identifies the maximum distance covered in a single booking within a chain.
- Busiest Day of the Week: This metric identifies the day of the week with the most bookings within a chain.
- Peak Booking Hour of Day: This metric identifies the hour of the day with the most bookings within a chain.
- Average Booking Duration: This metric calculates the average duration of bookings within a chain.
- Back-to-Back Booking Score: This metric counts the number of bookings within a chain with no gap time to the following booking of the chain.
- Utilization Rate: This metric calculates the ratio of the total booking duration to the total available time within a chain.
- Repeat User Rate: This metric calculates the ratio of unique users to the total number of bookings within a chain.
- Booking Lead Time: This metric calculates the average time between when a booking is made and when it starts within a chain.
6.3. Evolution from Perfect Back-to-Back Bookings to Dense Bookings Score
In the first dataset (2018 through June 2020), start times for the trips were recorded in 30-minute blocks. For example, a booking ending at 13:16 would be rounded and recorded as 13:30, while the next booking start would also be recorded in the subsequent 30-minute block. This created apparent zero idle time between consecutive back-to-back bookings on a given car. However, with improved timestamp resolution in the second dataset (2023–2024), we observed that many of these seemingly zero-minute gaps were in fact slightly longer pauses in disguise. This insight revealed operational flexibility in practice and motivated us to define a more general metric that accounts for short idle periods across the combined datasets.
We therefore introduced the dense bookings score, a new metric that generalizes the back-to-back booking rate by allowing small gaps between bookings across the combined dataset. The Dense Bookings Score is defined as the proportion of all bookings with an idle gap of 30 minutes or less before the next booking (i.e., min of actual downtime between consecutive bookings). This threshold counts not only perfectly contiguous bookings (0 min gap) but also those with a brief pause (up to a half-hour) as part of a “dense” sequence of usage.
7. Simulation and Analysis
Following our analysis in the previous sections, our data exhibits similar usage patterns. For example, the frequency of pickups peaks between 5:00 and 10:00, while returns peak between 17:00 and 20:00 in both datasets. Although the second dataset contains more total kilometers traveled, the majority of trips in both datasets fall within the 1–100 km range. Therefore, we combined the datasets for our simulation analysis. We simulate different recharging strategies, which will be described in the rest of this section.
7.1. Recharging Strategies
We assigned distinct EV attributes to various vehicle models, including battery size, power consumption, and efficiency per kilometer (see Table 4), and simulate their usage. We utilized a level 2 charger which could deliver around 19.2 kW of power and a level 3 charger that can deliver around 350 kW of power. We used an eager charging strategy: upon completing a journey, the vehicle’s battery automatically recharges until it is fully charged or the next reservation starts. We calculate energy usage during trips using a linear function that correlates directly with the distance covered.
One aspect of our study examines the impact of different strategies for managing long-range trips within an electrified car-sharing fleet. We differentiate the simulation results by how long-range trips are accounted for and handled. Long-distance trips are those where the car travels more than what a fully charged battery can handle. We mark these trips as Max Range Exceeded. We then try two strategies: the first one ignores any trip that is too long to be covered by a fully charged battery, assuming the vehicles cannot be recharged outside the home charging station. The second one allows these trips, assuming that the vehicle could be recharged during the trip. We are mainly looking for trips where the state of charge is not enough to cover the distance needed. This happens when there is not enough time to charge between bookings. We call this Undesired Recharge (UR). Below we look at these strategies in more detail:
- Ignore trips that are too long to be covered by a fully charged Battery (I-TLCB): In this scenario, all long-range trips are assumed to be problematic. We adopt the strategy that vehicles can only be recharged at the home charging station. Consequently, any booking that exceeds the range of a fully charged battery gets the status Max Range Exceeded, and those for which the available state of charge (SOC) in the vehicle is insufficient to cover the intended distance, is counted as UR. Since these mobility needs were met using the ICE counterpart and are not fulfilled with this strategy, the vehicle is idle during those times. This strategy allows for charging opportunities, thereby reducing UR events for other trips. Simulation results can be seen in Figure 10. In this figure, Max Range Exceeded points to trips that could not be completed because they were longer than what a fully charged battery could handle. On the other hand, UR shows trips that could have been completed with a full battery but failed because the battery did not have enough charge at the time.
- Exclude bookings uncoverable by a fully loaded battery (E-FULL): This scenario, with its results shown in Figure 11, disallows long-range trips altogether, leaving time slots vacant and increasing opportunities for vehicle charging. The key difference between the previous strategy and this one is that in the previous strategy, trips that exceed a full battery’s capacity are included in the simulation, and any trip falling within this category is flagged as Max Range Exceeded. In contrast, this strategy ignores these trips and assumes the car is idle. This strategy results in fewer UR events. Because the long-range bookings are not counted as valid, the overall number of bookings decreases. By excluding the long-range trips, one can visually see the percentage of trips with UR that were hardly noticed in the result of I-TLCB scenario. This suggests that a high percentage of the trips have a travel distance beyond the capacity of a fully charged battery. The result from the I-TLCB scenario shows that some EV trips (the Elektro segment) also exhibit both Max Range Exceeded and UR events, as certain multi-day trips can recharge at external stations. This is because certain trips with the EVs that stretch over days can recharge on the trip. Our simulation was able to identify such trips.
- Allow long range bookings and recharging outside home station (A-LBRO): Mirroring the handling of combustion engine vehicles, this scenario requires drivers to recharge the vehicle once the battery is depleted. A minimum SOC of 25% is mandated for returned vehicles. This scenario most closely replicates real-world conditions and car-sharing agency’s policies. This scenario increases undesired charging events because vehicles are unavailable for charging at their home station during allocated time slots. The results of this scenario are depicted in Figure 12.
To assess the effect of each scenario, we focus on key performance indicators, including the number of bookings completed, service availability (SA), and the number of UR events to analyze the simulation result. The summary of these indicators are shown in Table 5. From the table we can see that increasing charging power from 19.2 kW to 350 kW consistently improves SA and reduces the frequency of UR events across all scenarios. The “Allow long range bookings and recharging outside home station” strategy, despite its increased occurrence of undesired recharge events, mirrors the actual policies of the car-sharing provider closest and as such, offers a realistic approximation of car usage patterns for the simulated state of EV technology of 2018 and maintains high SA.
7.2. Booking Chain Metrics Evaluation
Based on the analysis of the booking data in Table 5, which indicates that in the last and most realistic scenario (allowing long range and recharging outside home-station), less than 0.25% of the bookings would fail post-electrification of the fleet, it is possible to determine metrics that car-sharing providers can use as an upper margin for switching to EV. Consequently, we have formulated a set of booking chain metrics. These metrics, derived from the inherent characteristics of bookings and booking chains, obviate the need for direct tracking of the SOC across bookings, focusing instead on their correlation with battery-related discrepancies identified in the simulation. Figure 13 presents a heatmap illustrating these correlations. The correlation between “Average Time between Bookings” and “Average Booking Duration” is 1, indicating that those metrics are redundant. The metrics that show correlations with chains with battery errors are “Chain Length” (0.14), “Busiest Day of the Week” (0.096), “Back-to-Back Booking Score” (0.25), and “Booking Lead Time” (-0.084).
While it makes sense that longer booking chains and back-to-back bookings could prevent the battery from being sufficiently charged, and the UR events occurring more likely on busy days than on slow days, it is counter-intuitive that trips that are planned long in advance should somehow prevent the battery from running out.
An important observation from the Dense Bookings Score analysis is its temporal distribution across the dataset. While the metric effectively captures continuous vehicle utilization patterns, examining when these dense booking sequences occur reveals operational insights critical for charging infrastructure planning. Dense booking chains predominantly cluster during weekday peak hours (morning and evening commutes), suggesting that charging windows are most constrained during these periods. This temporal concentration implies that operators must strategically balance charging capacity allocation, potentially reserving high-power chargers specifically for vehicles entering dense booking sequences during peak periods, while standard chargers suffice during off-peak times when booking intervals naturally allow for longer charging sessions.
Comparing booking chain metrics between the 2018-2020 and 2023-2024 datasets reveals notable shifts in usage intensity that directly impact electrification feasibility. The newer dataset exhibits both higher average Chain Length and increased Dense Bookings Scores, indicating more intensive vehicle utilization. Specifically, the proportion of chains with Dense Bookings Scores above 0.5 increased by approximately 18% in the 2023-2024 period, correlating with the expanded EV fleet share (from 12.44% to 28.52% of trips). This suggests that as the fleet becomes more electric and users gain confidence with EV technology, booking patterns intensify, placing greater demands on charging infrastructure. The negative correlation of Booking Lead Time with UR events (-0.084) becomes more pronounced in the recent dataset, reinforcing that advance bookings provide valuable predictive signals for proactive charging management.
7.3. Observations and Findings
UR events can only occur in settings of consecutive bookings and indicate that the cars were unable to recharge fully between those bookings:
- LCVc transporters are particularly vulnerable to reaching their battery limits when subjected to consecutive bookings without adequate recharge times, reflecting a higher operational risk in high-demand scenarios. This can be seen in Figure 11 and Figure 12, where the LCVc transporters experience the highest UR event. In our simulation, this issue can be resolved by adding an extra car to the LCVc transporters fleet.
- EVs, especially those with efficient energy use and adequate range, such as city cars and super minis, demonstrate resilience against such challenges, showcasing their suitability for the current usage patterns of short trips. These groups have the highest number of trips and in both scenarios they are among the groups with fewest URs.
The simulation results across both datasets reveal that optimal fleet electrification requires differentiated strategies based on vehicle type and usage patterns. City cars and Super Minis, which together account for over 60% of total bookings, demonstrate the highest suitability for immediate full electrification due to their favorable ratio of average trip distance (26-36 km) to battery range. In contrast, LCVc transporters, despite comprising only 1.7% of the fleet, exhibit disproportionately high UR rates (0.60-0.80% under Level 2 charging) due to their higher energy consumption (0.227 kWh/km) and longer average trip distances (36-47 km per booking). This finding suggests a phased electrification approach: prioritizing high-volume, short-range vehicle categories while maintaining ICEV or hybrid options for specialty vehicles with intensive usage patterns until either battery technology improves or dedicated high-power charging infrastructure is deployed. The dramatic reduction in UR events when upgrading from Level 2 (19.2 kW) to Level 3 (350 kW) charging from 1,174 to 524 events in the A-LBRO scenario demonstrates that charging infrastructure investment yields non-linear improvements in service quality. This 55% reduction in UR events through infrastructure upgrade effectively eliminates the majority of battery-related constraints without requiring changes to booking policies or fleet size. However, the cost-benefit analysis must consider that even with Level 2 infrastructure, the SA remains remarkably high (99.69%), suggesting that strategic placement of a limited number of high-power chargers at stations with the highest Dense Bookings Scores may provide an economically optimal solution rather than fleet-wide Level 3 deployment. Analysis of the station-level data indicates that approximately 15-20% of stations account for over 60% of all UR events, pointing to targeted infrastructure investments as a pragmatic electrification pathway.
Going back to our research questions: To address RQ1, we found that technical feasibility is strongly affirmed across all the simulated scenarios. Our simulation of 373,123 historical trips shows that standard Level 2 charging (19.2 kW) delivers 99.69% service availability with only 0.25% of bookings resulting in failures. Upgrading to Level 3 fast charging (350 kW) pushes availability to 99.86% and cuts failure rates by more than half. The most realistic scenario–allowing en-route recharging for long trips–enables EVs to serve 99.7% of historical demand without modifying user behavior. Vehicle-level analysis reveals a clear feasibility gradient: City cars and Super Minis, which handle over 60% of bookings, show failure rates below 0.1% with Level 3 charging, while LCVc Transporters experience 3-4 times higher failure rates under identical conditions. This indicates that partial fleet electrification is immediately viable for urban vehicle categories, whereas high-consumption specialty vehicles require targeted infrastructure investment before full transition. Critically, our results demonstrate that service quality can be maintained at near-ICEV levels today for the majority of the fleet, with infrastructure upgrades rather than technology limitations being the primary remaining barrier.
As regards to RQ2: We identified that the critical operational factor hindering full fleet electrification is booking chain intensity–the temporal clustering of consecutive bookings that prevents adequate recharging between trips. Our analysis reveals this can be quantified through the Dense Bookings Score (proportion of bookings with ≤30 min gaps), which identifies problematic sequences without requiring state-of-charge tracking. The Back-to-Back Booking Score shows the strongest correlation with battery errors (correlation coefficient of 0.25), outperforming simple chain length (0.14). These metrics expose differentiated risks across vehicle types: LCVc Transporters exhibit failure rates 3-4 times higher than City cars due to high energy consumption (0.227 kWh/km) and deployment in dense booking sequences. This quantification framework provides operators with predictive tools to identify electrification risks before transition, addressing the operational constraints that would undermine full fleet electrification of a car-sharing service.
8. Extension to Grid Integration
In an electrical power grid, balancing the power is crucial for ensuring the reliability and stability of the electrical supply. This involves matching the electricity production (supply) with the electricity consumption (demand) in real-time, as electricity cannot be buffered in the grid itself and thus the amount generated must be consumed immediately [25]. To achieve this balance, at certain times it might be necessary to ramp up production by switching on additional power plants like natural gas or hydroelectric plants, or conversely increase consumption by switching on pumped-storage power stations or battery banks to buffer excess energy. This energy is called balancing energy. In this section, we use publicly available power grid data2 to identify when balancing occurs in the period aligning with the car-sharing data we have. Specifically, we are interested in periods where additional power needed to be fed to the grid (positive balancing energy). We then investigate, using again a simulation, whether the necessary charging of the EVs after the trips would coincide with these balancing periods, thus adding further burden to the power grid and aggravating the imbalance.
Balancing periods: In German grids, pumped-storage hydropower serves as the main control reserve to ensure the balance between energy supply and demand [43]. Our analysis thus focuses on periods where hydro-pumped power plants are activated to provide additional power (positive balancing energy). We assume that pumped-storage activation that exceeded a threshold of 1.5 GW ( of its maximal power) indicates periods when the grid requires balancing due to high demand. In this way, we identified two balancing periods per day, as shown as yellow bars in Figure 14, roughly from 8am to 9am and from 5.30pm to 6.30pm in the evening.
To model car battery charging in our simulation, we use the given data on the charging times and the power ratings. Here we assume that the ending of the bookings directly coincides with the beginning of charging. By aggregating this data then across all vehicles, we can create an overall power distribution. Typically, bookings start in the morning, and the influx of returning cars begins around noon, continuing until late in the evening, as shown in Figure 2. Thus, by this time, most bookings have been completed, and this period represents the main charging activity of the day.
We simulated week 11 for the years 2018, 2020, and 2024. Figure 14 shows the aggregated charging distribution for a typical day, together with the balancing periods on that day, i.e., when pumped-storage hydropower was activated. The dark stripe in the plot indicates when the pumped-storage is operating. Observe that many trips end at the close of working hours, around 18:00, resulting in a broad peak in power demand. While the first period is largely unaffected, as very few cars return early enough to require charging at this time, it can be seen that many EV charging periods (post-trip) coincide with the second balancing period of the day, thus (unfortunately) they would further contribute to the imbalance.
Since the simulation analyzes week 11 across all years (2018, 2020 and 2024), the consistency of balancing periods becomes a critical validation point. Across these observation weeks spanning three years, the morning (8:00-9:00) and evening (17:30-18:30) balancing periods remain remarkably stable, occurring with over 85% consistency within ±30-minute windows. This temporal stability strengthens the concern that EV charging patterns will systematically coincide with grid stress periods, as both are fundamentally driven by human activity patterns that remain consistent across years. However, week 11 (mid-March) represents a moderate demand period-neither peak winter heating nor peak summer cooling loads are present. The overlap between EV charging and balancing periods during this representative week suggests that the grid impact would likely be more severe during extreme seasonal demand periods, when balancing requirements are already elevated and additional EV charging load could push the grid closer to capacity limits.
The expansion of the EV fleet from 37 vehicles (2018-2020) to 92 vehicles (2023-2024) provides a longitudinal perspective on how increasing electrification scales grid impact. The 2.5× increase in fleet size, combined with the higher EV trip share (from 12.44% to 28.52% of total trips) and greater total distance covered (from 672,864 km to 2,234,849 km), demonstrates substantial growth in charging demand. As shown in Figure 14, the charging load peak continues to coincide with the evening balancing period (17:30-18:30), suggesting that this temporal overlap will intensify as the fleet expands. Projecting this growth trajectory toward full fleet electrification, the cumulative charging load during peak evening hours would scale accordingly, potentially creating significant additional demand during periods when the grid already requires balancing support. This underscores the necessity of smart charging strategies or vehicle-to-grid (V2G) integration not merely as optimization opportunities but as essential prerequisites for sustainable large-scale fleet electrification.
Other recent work [44] investigated peak-shaving in the context of electric car sharing, that is, how bookings can be shifted in time to avoid or at least reduce additional load peaks resulting from charging. Another question that would be interesting to investigate is whether there are periods of negative balancing energy – i.e., times when additional demand needs to be created to store excess supply-that would align with the charging of the vehicle fleet.
As regards to RQ3: Our simulation reveals that large-scale electrification would significantly stress the local energy grid. By aggregating vehicle charging loads from our booking simulation and overlaying them with grid balancing periods (when pumped-storage hydropower exceeds 1.5 GW), we find the overlap is substantial and growing. Charging energy coinciding with these critical windows increased from 21.8% in 2018 to 46.0% in 2024 as it can be seen in Figure 14. This pattern is consistent across years: the morning (8:00-9:00) and evening (17:30-18:30) balancing periods show “over 85% consistency within ±30-minute windows.” driven by commuter return times peaking around 18:00. As the EV fleet expanded 2.5× (from 37 to 92 vehicles), total weekly charging load in our simulated week 11 grew from 11,292 kWh to 24,211 kWh, demonstrating compounding grid impact. Without intervention, this systematic coincidence will intensify with full fleet electrification. V2G integration becomes essential not as an optimization, but as a prerequisite to transform this threat into a grid-balancing opportunity.
9. Outlook and Conclusion
The transition to electric vehicles (EVs) within car-sharing services presents opportunities and challenges for sustainable urban mobility and grid stability. Our simulation-driven analysis has explored the effects on the availability of the service, possible business metrics that other car-sharing services can employ to reach informed decisions about their switch to EVs, and implications to the power grid if charging happens immediately after returning.
Our work could be extended in several directions. One goal is to consider different recharging policies: future work should focus on developing and evaluating more sophisticated recharging policies that account for real-time grid conditions, flexible power prices, vehicle usage patterns, or charging infrastructure availability. Dynamic recharging policies, which adapt to both user demand and grid stability requirements, could optimize charging schedules, reduce grid strain during peak periods, and even enable EVs to provide balancing energy to the grid on demand.
Moreover, we could extend the analysis of the grid integration: the integration of EV fleets into the power grid should be extended to leverage V2G technologies. By allowing EVs to not only draw power from the grid and supply it back when necessary could make car-sharing fleets a significant resource for grid stability. This would require advancements in smart charging infrastructure, grid-responsive vehicle technologies, and regulatory frameworks that support bi-directional energy flows. Research is needed to understand optimal strategies and technologies to leverage many cars across different parts of the local distribution and city grid to avoid unnecessary load in choke points of the grid, like transformers.
Finally, we plan to refine the booking chain metrics: We did manage to find metrics that allow us to forecast if a successful switch to EVs is likely. This can be refined considerably into a quantitative tool by comparing booking chain metrics with those of other car-sharing providers. It could enable car-sharing providers worldwide to identify low-hanging fruits for electrification in their fleet.
References
- Ali, A.T.; Schuldei, A.; Sachenbacher, M.; Leucker, M. Simulation-based Analysis of Car-sharing Electrification in Schleswig-Holstein, Germany. In Proceedings of the Proceedings of the 7th ACM SIGCAS/SIGCHI Conference on Computing and Sustainable Societies, 2024, pp. 97–106.
- Oxford, T. Electric Vehicle Car Sharing: Challenges and Opportunities. Technical report, Transport Studies Unit, University of Oxford, 2023. Available at: https://www.tsu.ox.ac.uk/sites/default/files/2023-01/EV-Car-Share-Final.pdf.
- Stryi-Hipp, G.; Sprengeler, M.; Nguyen, P.; Popova, R.; Landfester, G. E-Mobilität Im Carsharing Und in Fuhrparks 2021. [CrossRef]
- Borgosano, S.; Nocera, A.; Longo, M.; Yaici, W. Impact of Fleet Electrification and Charging Infrastructure on Free-Floating Car Sharing in Milan. [CrossRef]
- Roni, M.; Yi, Z.; Smart, J. Optimal Charging Management and Infrastructure Planning for Free-Floating Shared Electric Vehicles. Transportation Research Part D: Transport and Environment 2019, 72, 1–17. [CrossRef]
- Abouee-Mehrizi, H.; Baron, O.; Berman, O.; Chen, D. Adoption of Electric Vehicles in Car Sharing Market. Production and Operations Management 2018, 27, 150–165.
- Chen, T.D.; Kockelman, K. MANAGEMENT OF A SHARED, AUTONOMOUS, ELECTRIC VEHICLE FLEET: CHARGING AND PRICING STRATEGIES 2015.
- Seki, S.; Nigro, N. Electrifying Carshare Services. Technical report, Atlas Policy Group, 2018. Available at: https://atlaspolicy.com/atlaspolicy/wp-content/uploads/2018/10/Electrifying_Carshare_Services.pdf.
- Yao, Z.; Gendreau, M.; Li, M.; Ran, L.; Wang, Z. Service operations of electric vehicle carsharing systems from the perspectives of supply and demand: A literature review. Transportation Research Part C: Emerging Technologies 2022, 140, 103702. [CrossRef]
- Roni, M.S.; Yi, Z.; Smart, J.G. Optimal charging management and infrastructure planning for free-floating shared electric vehicles. Transportation Research Part D: Transport and Environment 2019, 76, 155–175. [CrossRef]
- Lo Franco, S. et. al.. Smart Charging for Electric Car-Sharing Fleets Based on Charging Duration Forecasting and Planning. Sustainability 2022, 14, 12077. [CrossRef]
- He, L.; Ma, G.; Qi, W.; Wang, X.; Hou, S. Planning and Management of Charging Facilities for Electric Vehicle Sharing. Artificial Intelligence, Machine Learning, and Optimization Tools for Smart Cities: Designing for Sustainability 2022, pp. 135–153.
- He, L.; Ma, G.; Qi, W.; Wang, X. Charging an electric vehicle-sharing fleet. Manufacturing & Service Operations Management 2021, 23, 471–487.
- Chen, T.D.; Kockelman, K.M. Management of a shared autonomous electric vehicle fleet: Implications of pricing schemes. Transportation Research Record 2016, 2572, 37–46. [CrossRef]
- Klingert, S.; Lee, J.W. Using real mobility patterns to assess the impact of 100% electrified mobility in a German city. Energy Informatics 2022, 5, 32. [CrossRef]
- gridX. Four types of EV charging strategy for different use cases 2025.
- Clean Cities and Communities. Project Lessons: EV Car Share 2024.
- AMPECO. Smart Charging: The Definitive Guide. https://www.ampeco.com/guides/smart-charging/, 2025.
- Virta. Smart EV Charging: What Is It and How Does It Work? https://www.virta.global/vehicle-to-grid-v2g, 2025. [Online; accessed 31-June-2025].
- Hassan, M.; Qureshi, K.; Khan, S.; Ahmed, S.; Iqbal, Z. Vehicle to Grid: Technology, Charging Station, Power Transmission, Communication Standards, Techno-Economic Analysis, Challenges, and Recommendations. Energies 2023, 16, 142.
- Fontana, M. and Inturri, G. and Li, T. and Zito, R.. Carsharing with Electric Vehicles and Vehicle-to-Grid: a future business model? Transportation Research Procedia 2015, 10, 915–924.
- Fontana, M.; Inturri, G.; Li, T.; Zito, R. Carsharing with Electric Vehicles and Vehicle-to-Grid: A Future Business Model? Transportation Research Procedia 2015, 10, 915–924.
- PowerGo. Dynamic charging prices at PowerGo 2025.
- Kalakanti, A.K.; Rao, S. Dynamic pricing for electric vehicle charging. In Proceedings of the Proceedings of the 40th ACM/SIGAPP Symposium on Applied Computing, 2025, pp. 1609–1611.
- Fan, X.; Liu, B.; Liu, J.; Ding, J.; Han, X.; Deng, Y.; Lv, X.; Xie, Y.; Chen, B.; Hu, W.; et al. Battery technologies for grid-level large-scale electrical energy storage. Transactions of Tianjin University 2020, 26, 92–103. [CrossRef]
- Chen, G.; Zhang, Z. Control strategies, economic benefits, and challenges of vehicle-to-grid applications: Recent trends research. World Electric Vehicle Journal 2024, 15, 190. [CrossRef]
- Biondi, E.; Boldrini, C.; Bruno, R. The impact of regulated electric fleets on the power grid: The car sharing case. In Proceedings of the 2016 IEEE 2nd International Forum on Research and Technologies for Society and Industry Leveraging a better tomorrow (RTSI). IEEE, 2016, pp. 1–6.
- Li, P.L. The influence of electric vehicles charging and discharging on power grid. Advanced Materials Research 2014, 978, 67–71. [CrossRef]
- Kukula, M. and Paprocka, I. and Szreter, M. and Turała, M.. Electric Vehicles and Energy Communities: Vehicle-to-Grid Opportunities and a Sustainable Future. Energies 2025, 18, 854.
- Zhou, Y.; Ong, G.P.; Meng, Q. The road to electrification: Bus fleet replacement strategies. Applied Energy 2023, 337, 120903. [CrossRef]
- Xue, Y.; Zhang, Y.; Chen, Y. An evaluation framework for the planning of electric car-sharing systems: A combination model of AHP-CBA-VD. Sustainability 2019, 11, 5627. [CrossRef]
- Nicholas, M.; Bernard, M.R. Success factors for electric carsharing. International Council on Clean Transportation Working Paper 2021 2021, 30.
- Lightfoot. The 4 Key Challenges of EV Fleet Transitions. https://www.lightfoot.co.uk/news/2022/01/27/the-4-key-challenges-of-ev-fleet-transitions/, 2022. Accessed: 2024-02-25.
- Lo Franco, F.; Cirimele, V.; Ricco, M.; Monteiro, V.; Afonso, J.L.; Grandi, G. Smart charging for electric car-sharing fleets based on charging duration forecasting and planning. Sustainability 2022, 14, 12077. [CrossRef]
- Machado, C.A.S.; de Salles Hue, N.P.M.; Berssaneti, F.T.; Quintanilha, J.A. An overview of shared mobility. Sustainability 2018, 10, 4342. [CrossRef]
- Shaheen, S.; Sperling, D.; Wagner, C. Carsharing in Europe and North American: past, present, and future 2001.
- Millard-Ball, A. Car-sharing: Where and how it succeeds. Transportation Research Board 2005.
- Turoń, K.; Czech, P. Polish systems of car-sharing-the overview of business to customer service market. In Proceedings of the Scientific And Technical Conference Transport Systems Theory And Practice. Springer, 2018, pp. 17–26.
- Shaheen, S.; Chan, N. Mobility and the Sharing Economy: Potential to Overcome First-and Last-Mile Public Transit 2016.
- Cao, X.; Zhou, H.; Li, H.; Kong, X. Analysis of the Contribution of China’s Car-Sharing Service to Carbon Emission Reduction. Energies 2023, 16, 5518. [CrossRef]
- Observatory, A.F. General Information: Vehicle Types, 2023. Accessed: 26-12-2023.
- Wikipedia contributors. Car classification — Wikipedia, The Free Encyclopedia. https://en.wikipedia.org/wiki/Car_classification, 2023. [Online; accessed 31-December-2023].
- Agricola, A.C. Der Beitrag von Pumpspeicherwerken zur Netzstabilität und zur Versorgungssicherheit – die wachsende Bedeutung von Pumpspeicherwerken für die Energiewende. https://www.dena.de/test/user_upload/150716_Ergebnispapier_Pumpspeicherwerke.pdf, 2023. Accessed: 2024-02-27.
- Thoma, D.; Sachenbacher, M.; Leucker, M.; Ali, A.T. A Digital Twin for Coupling Mobility and Energy Optimization: The ReNuBiL Living Lab. In Proceedings of the Applications of Formal Methods and Digital Twins, 2023.
| 1 | The data were made available by StattAuto eG (Lübeck, Germany) under a license ensuring compliance with data protection and privacy requirements. |
| 2 |
Figure 1.
Car-sharing station on University of Lübeck’s campus with electric cars and two bi-directional charging stations. These EVs were integrated into the fleet as part of a research initiative to collect operational data on electric vehicle usage in car-sharing contexts, complementing the historic ICEV dataset used to simulate fleet electrification.
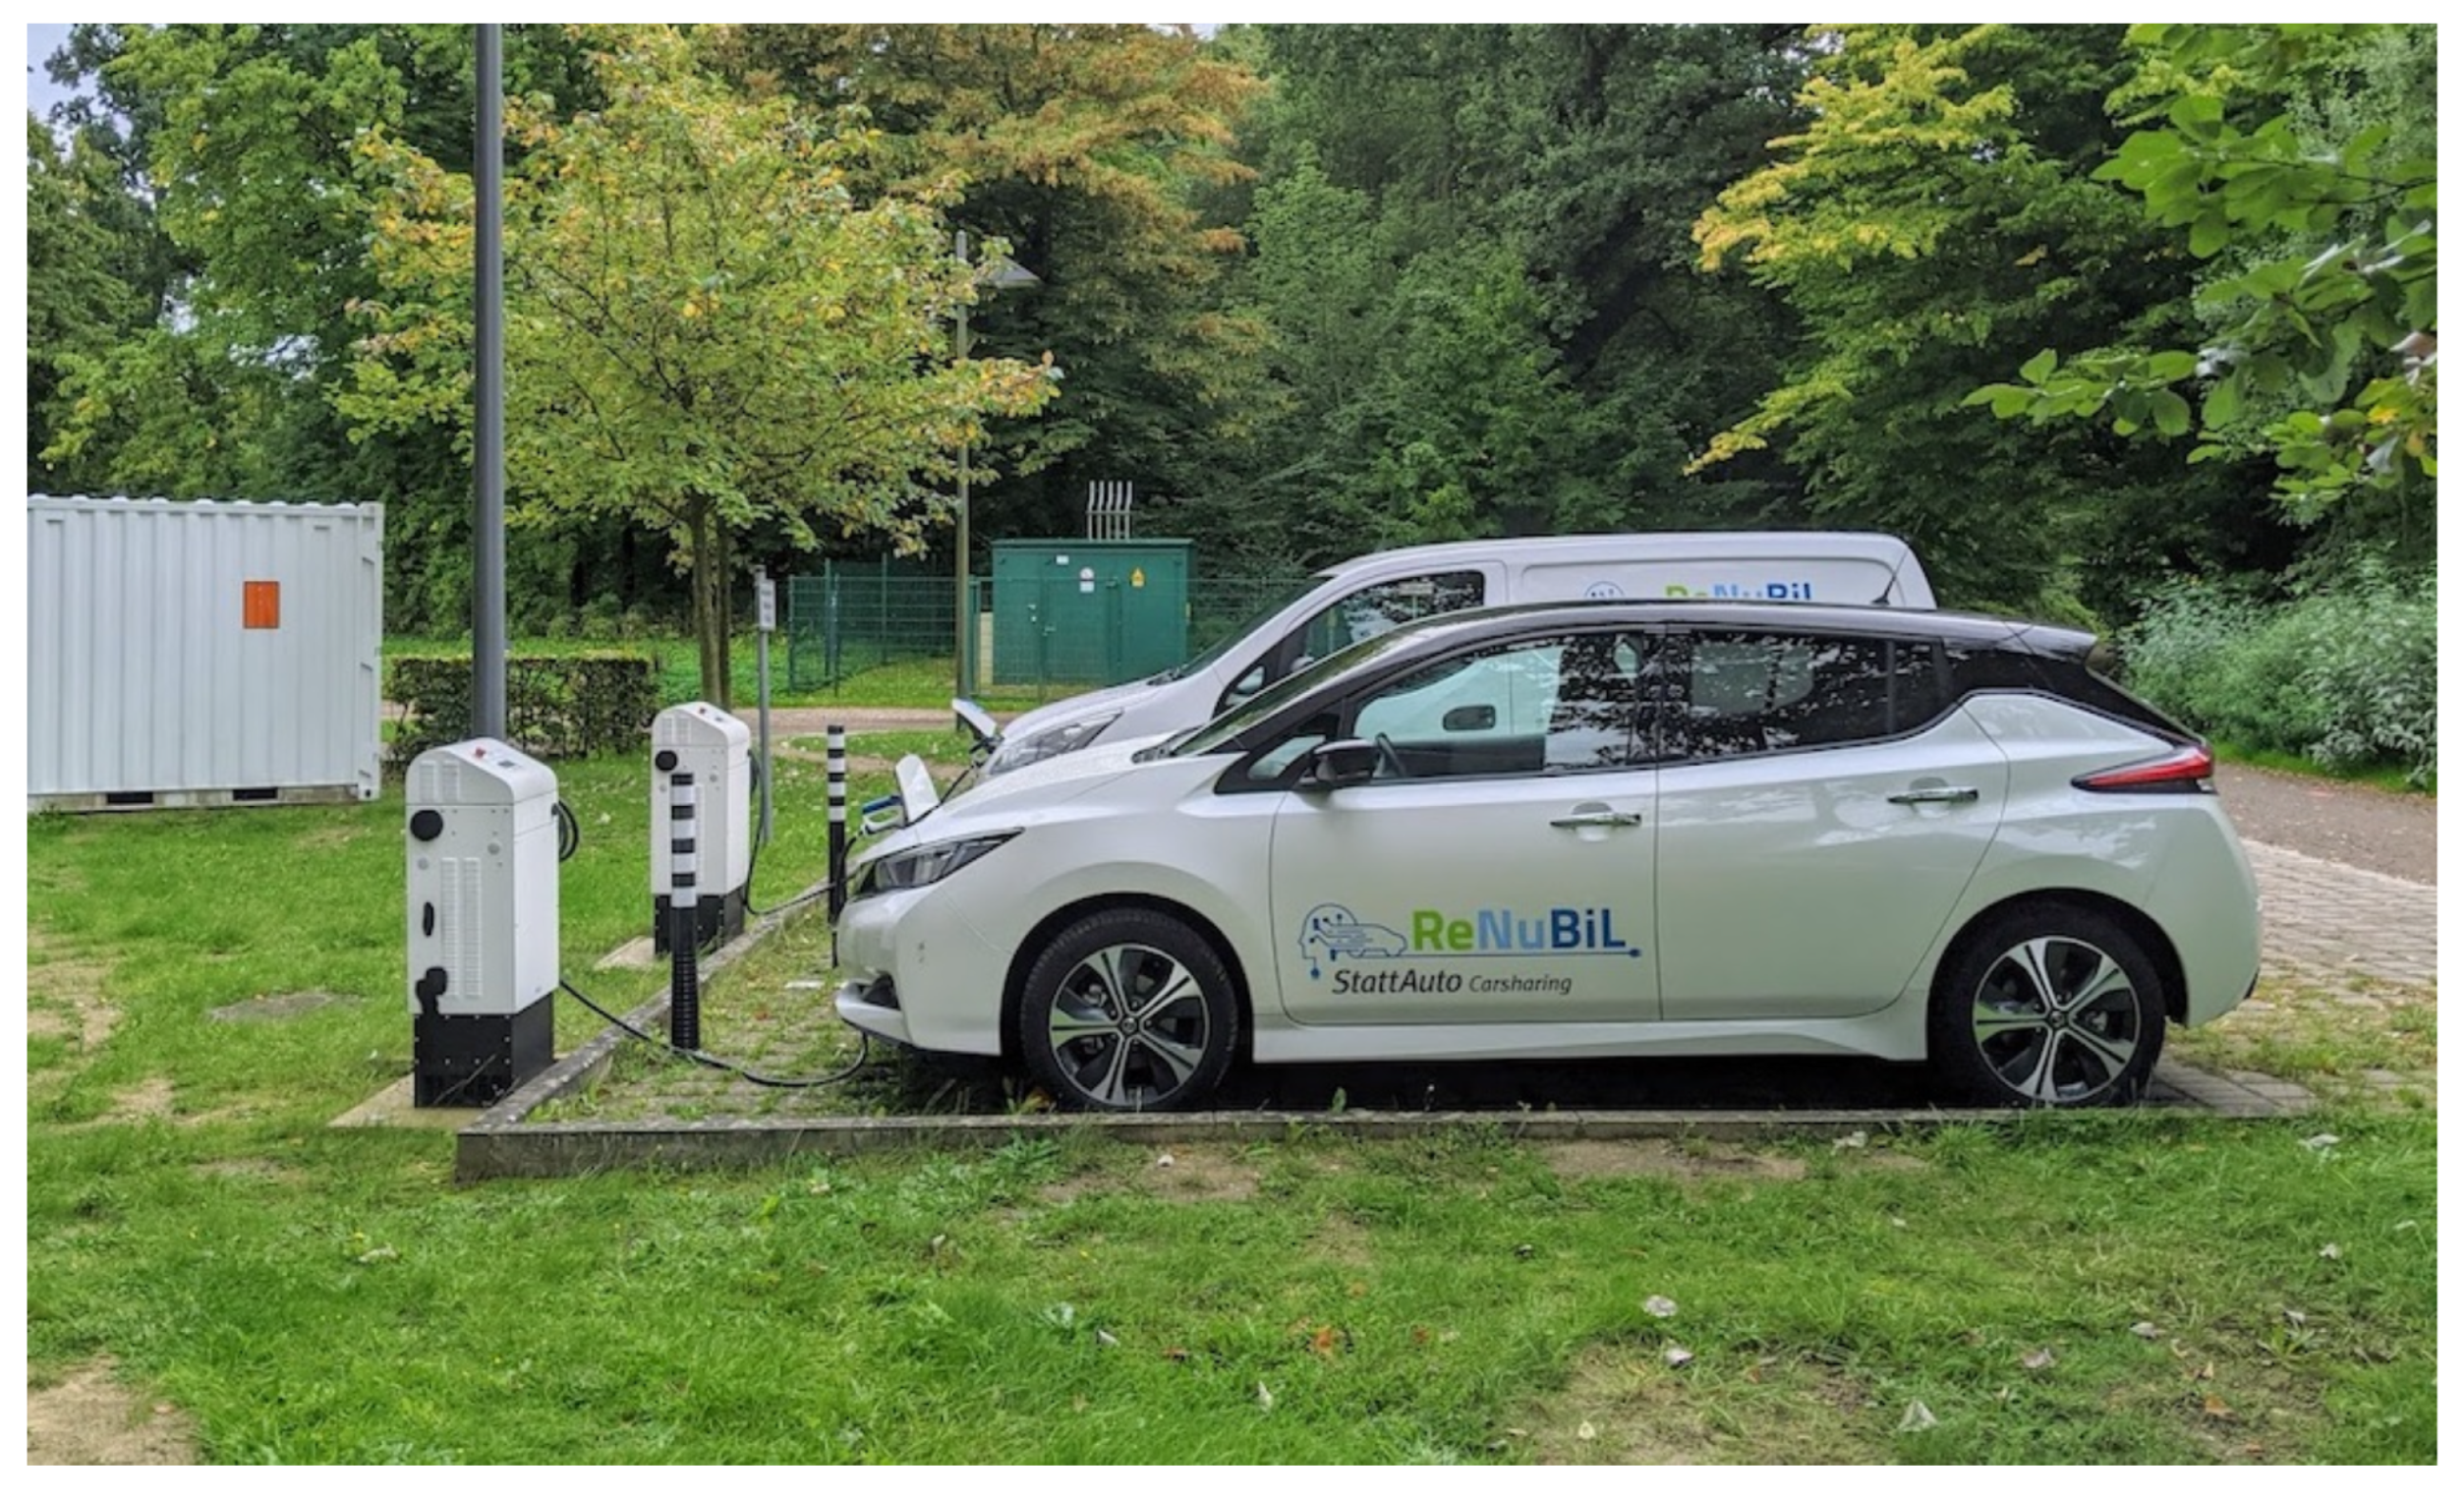
Figure 2.
Frequent pick-up and return times across both datasets.
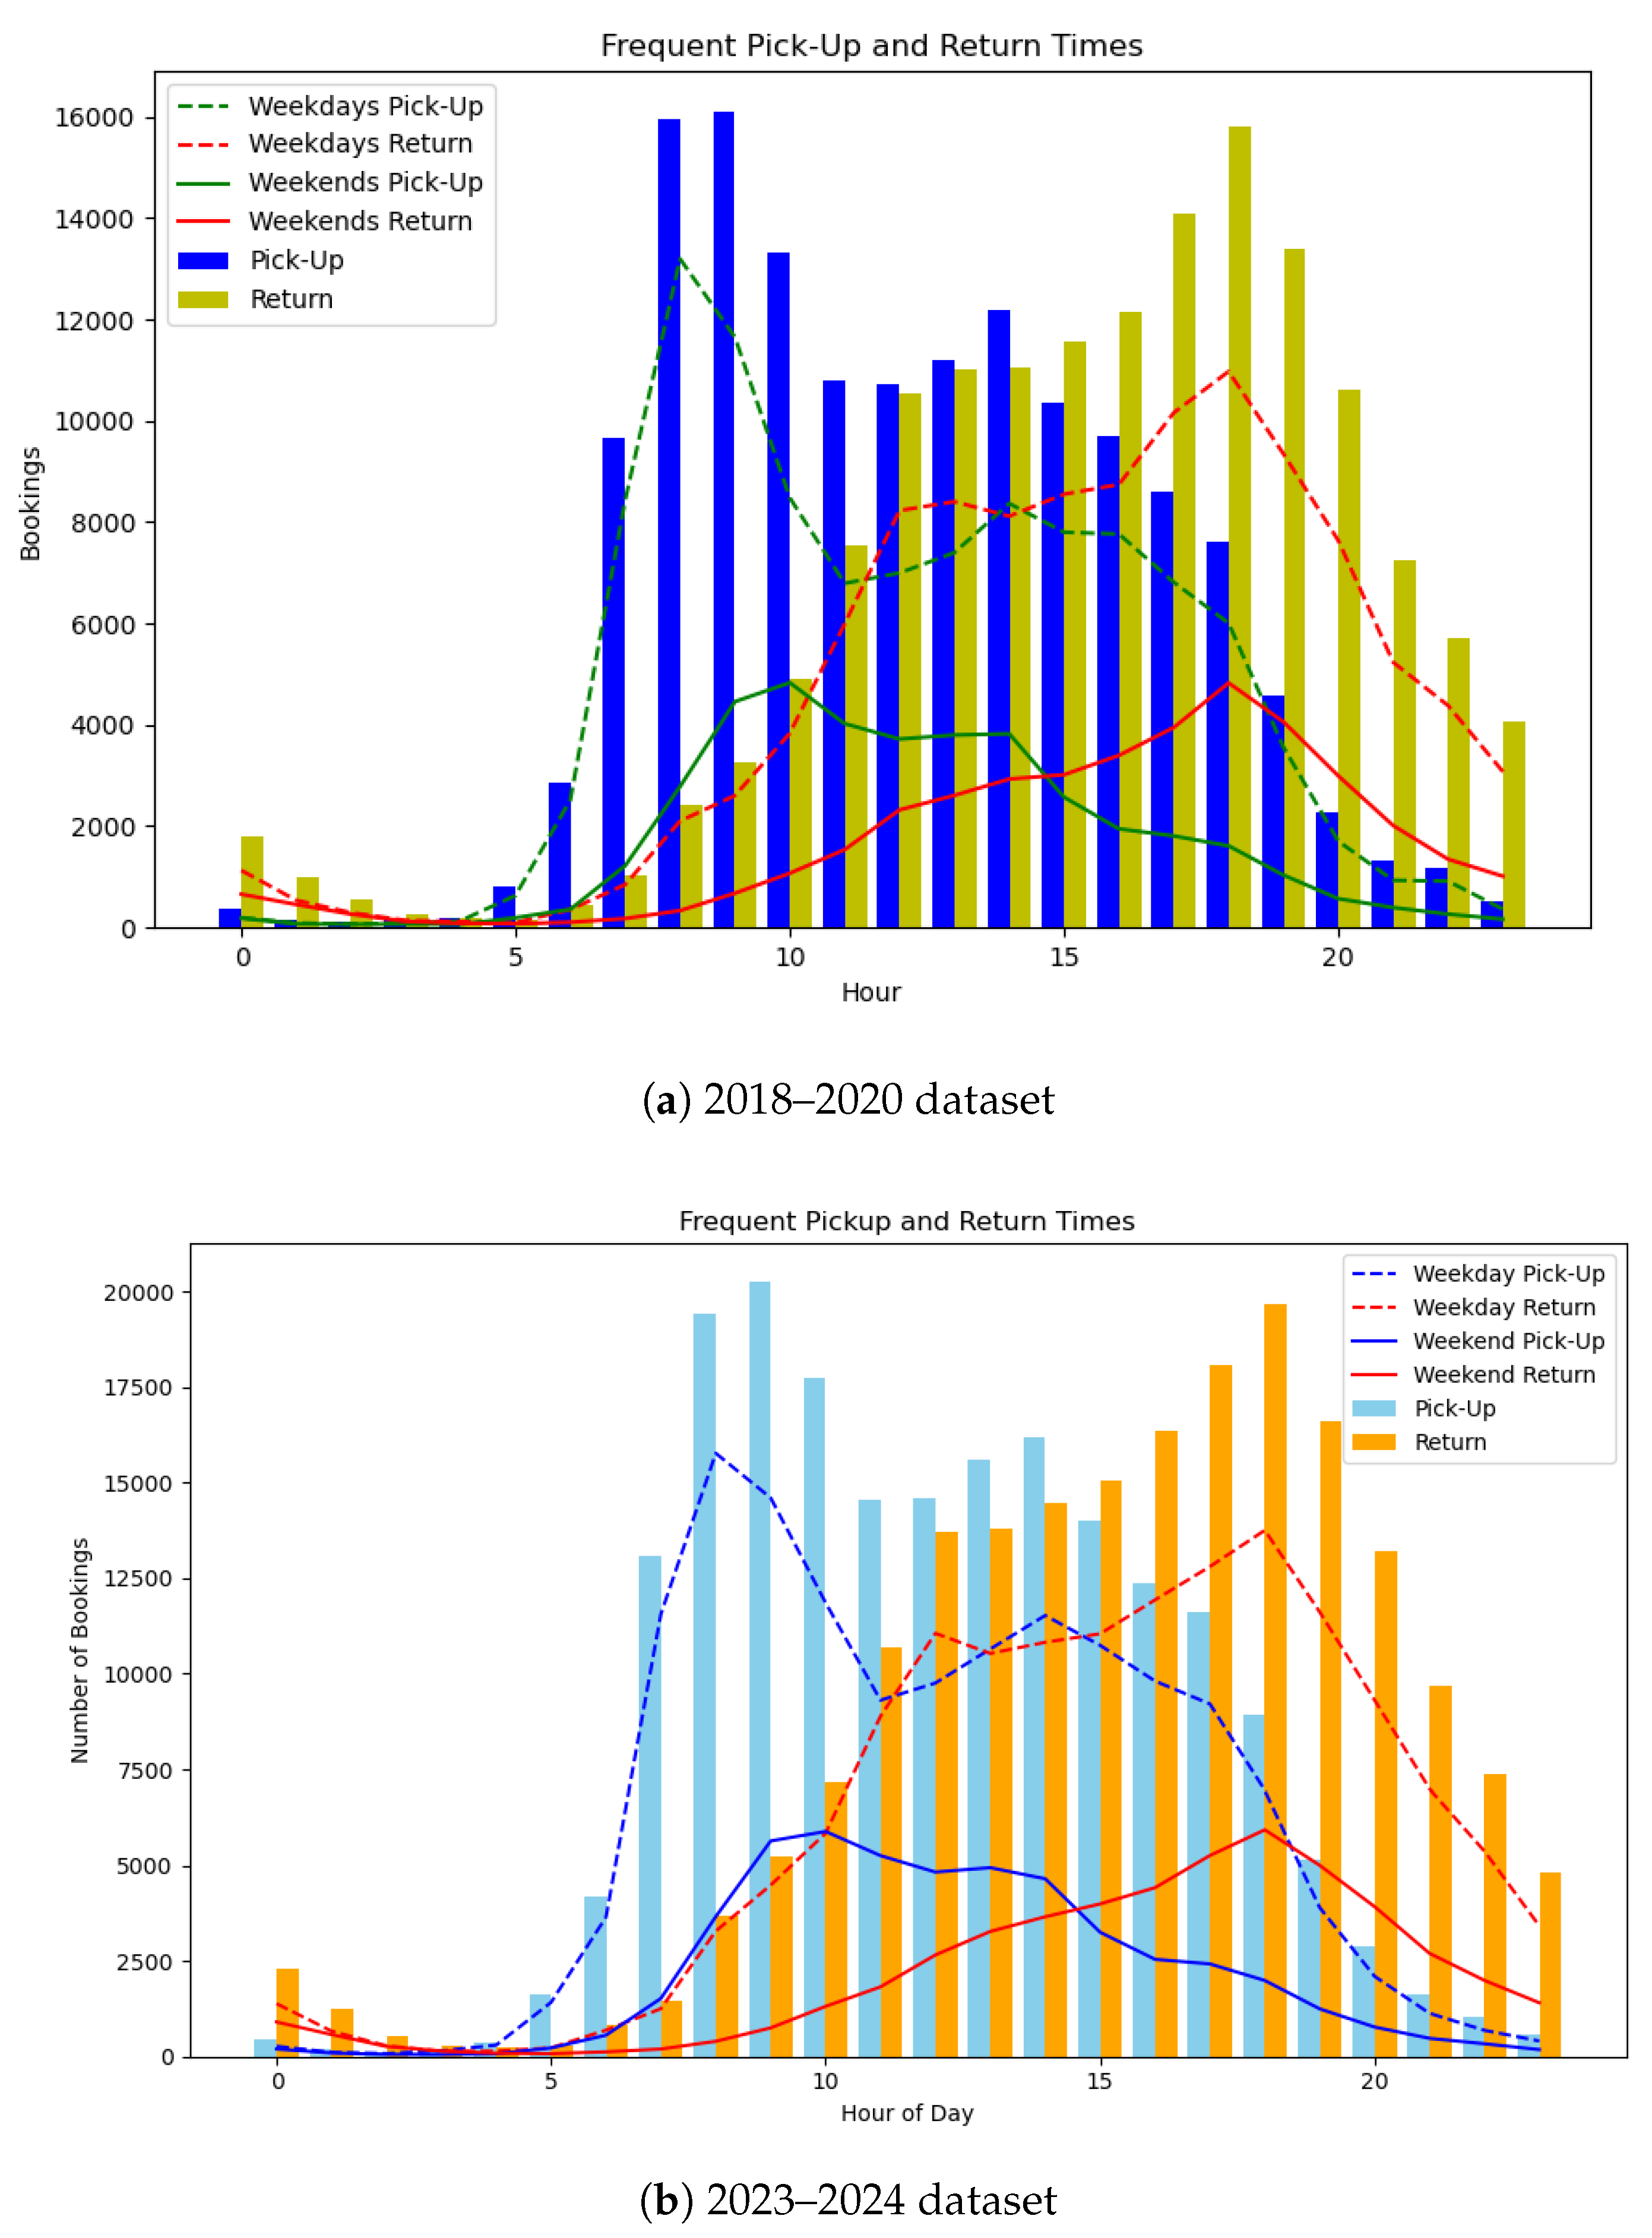
Figure 3.
Bookings range in terms of distance covered.
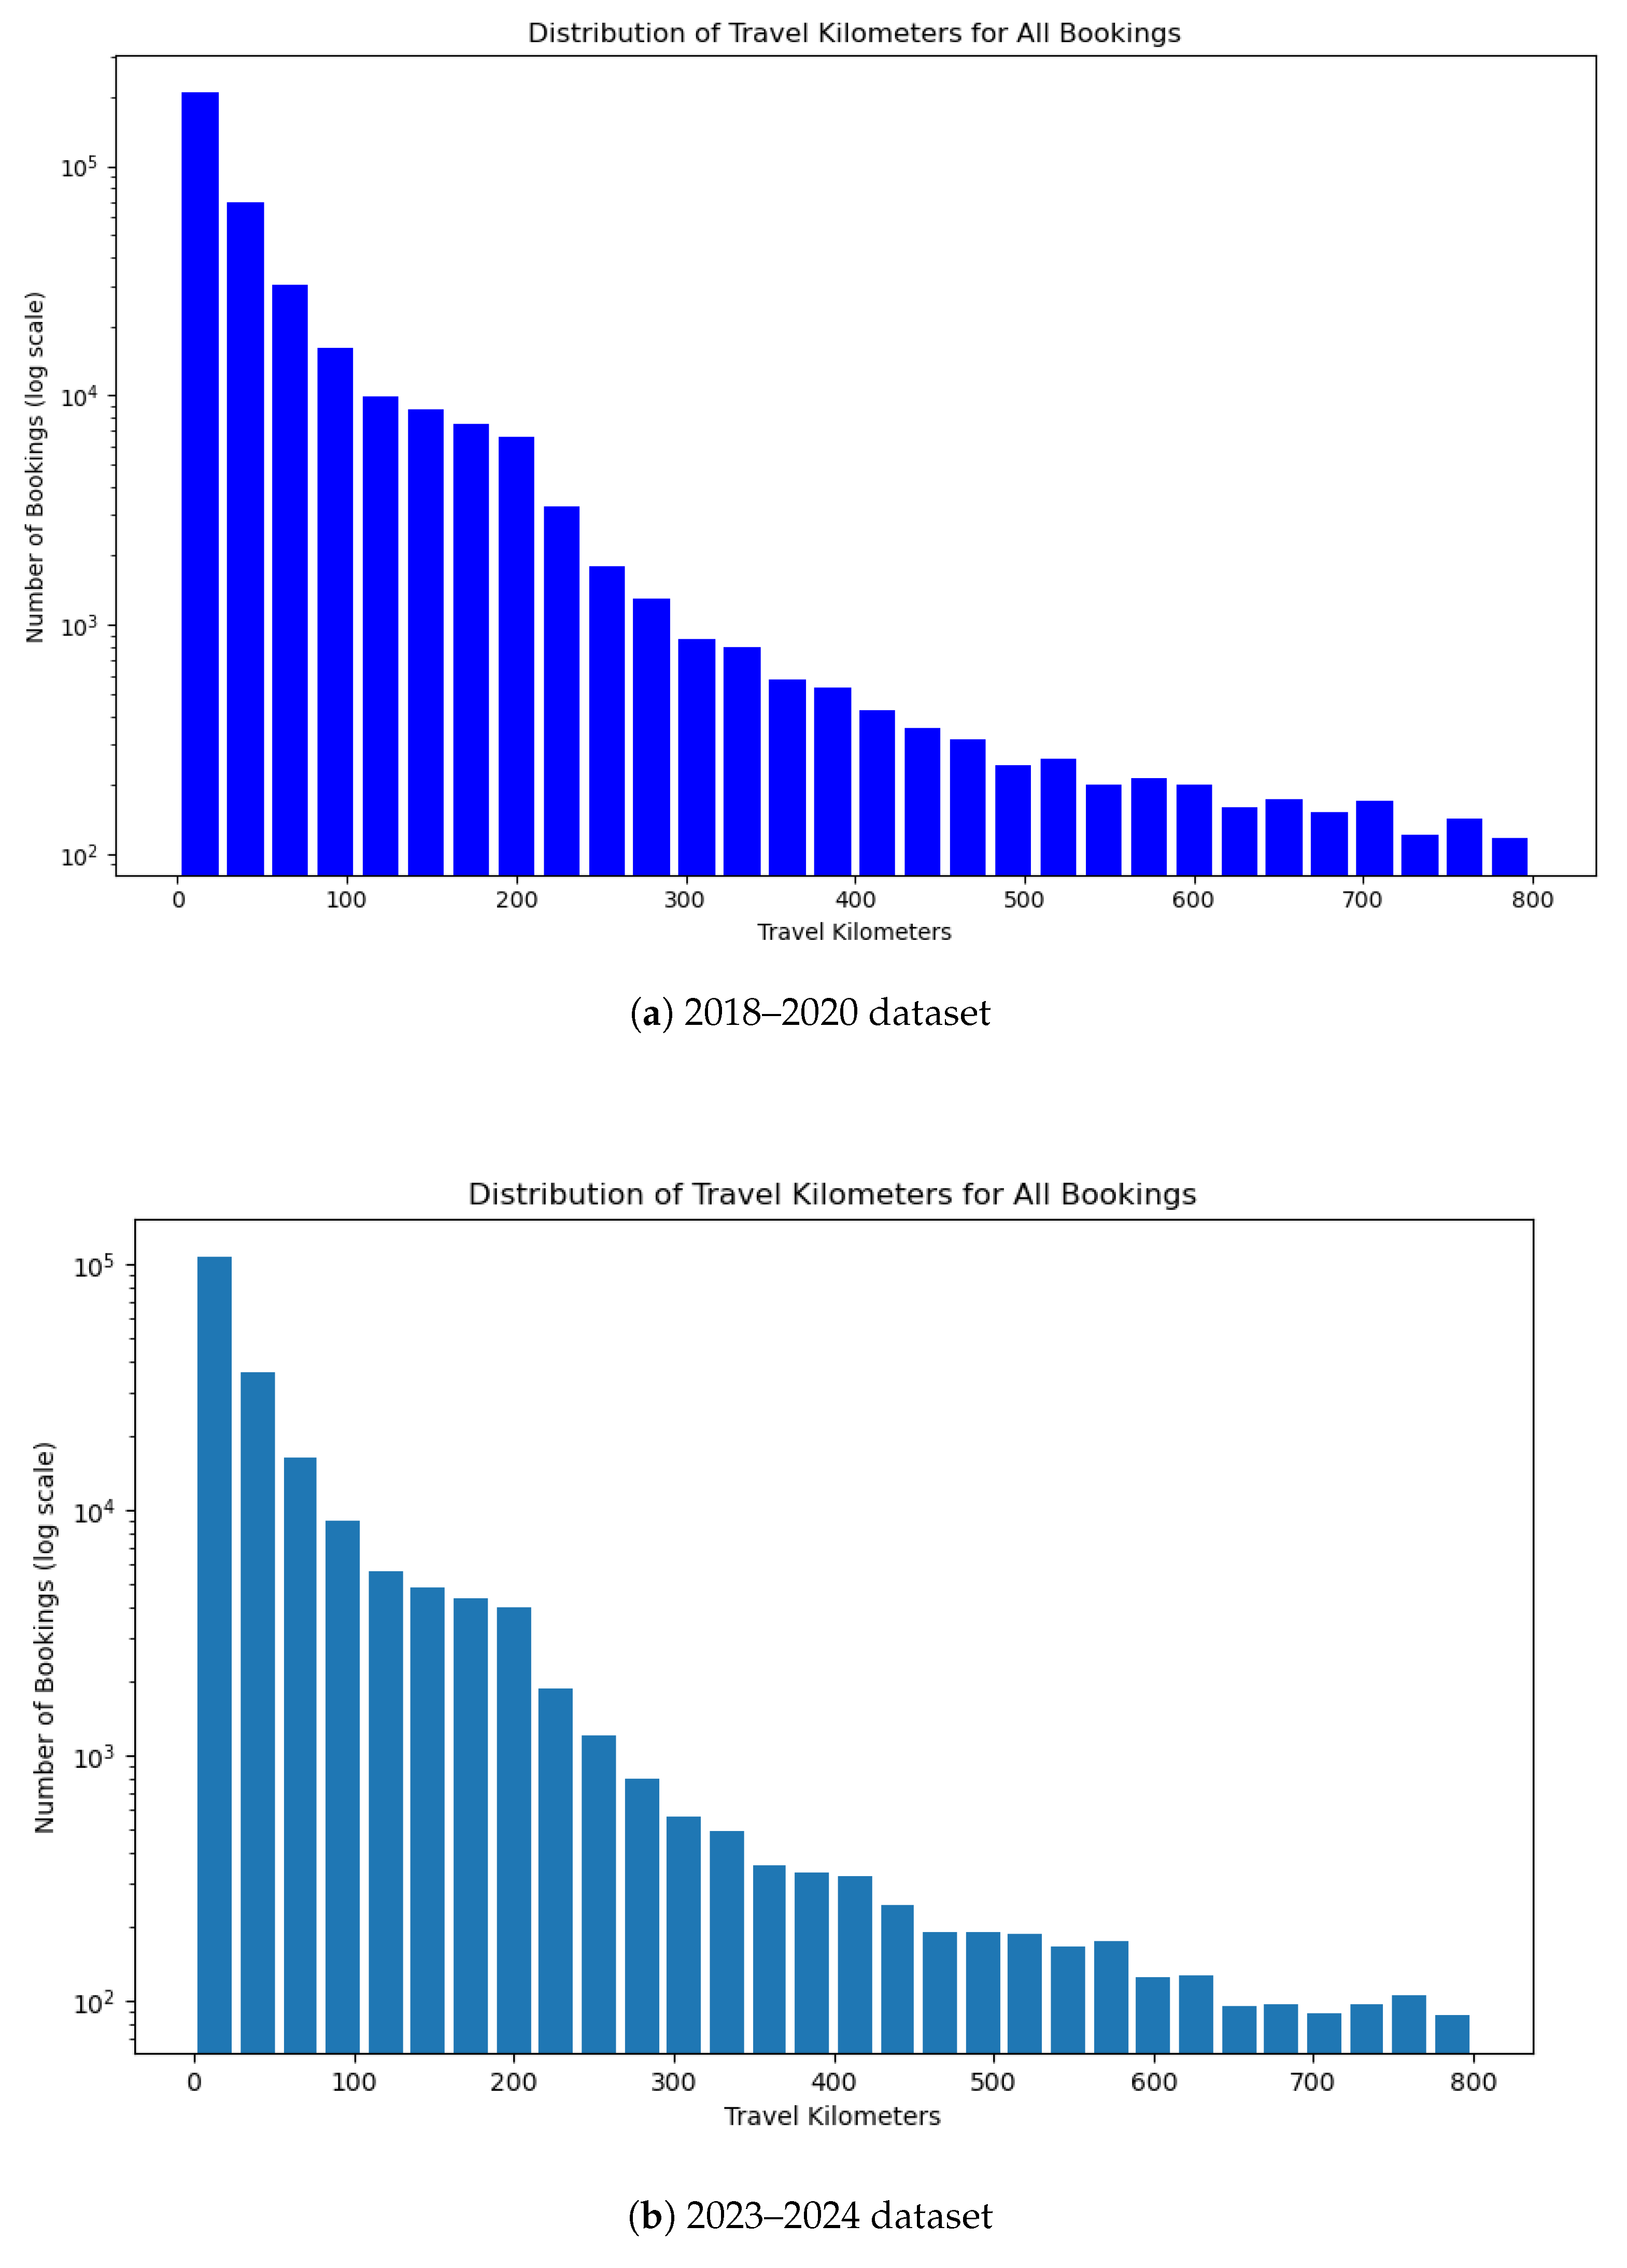
Figure 4.
Trip duration: frequency of single day and multiple days bookings (2018–2020).
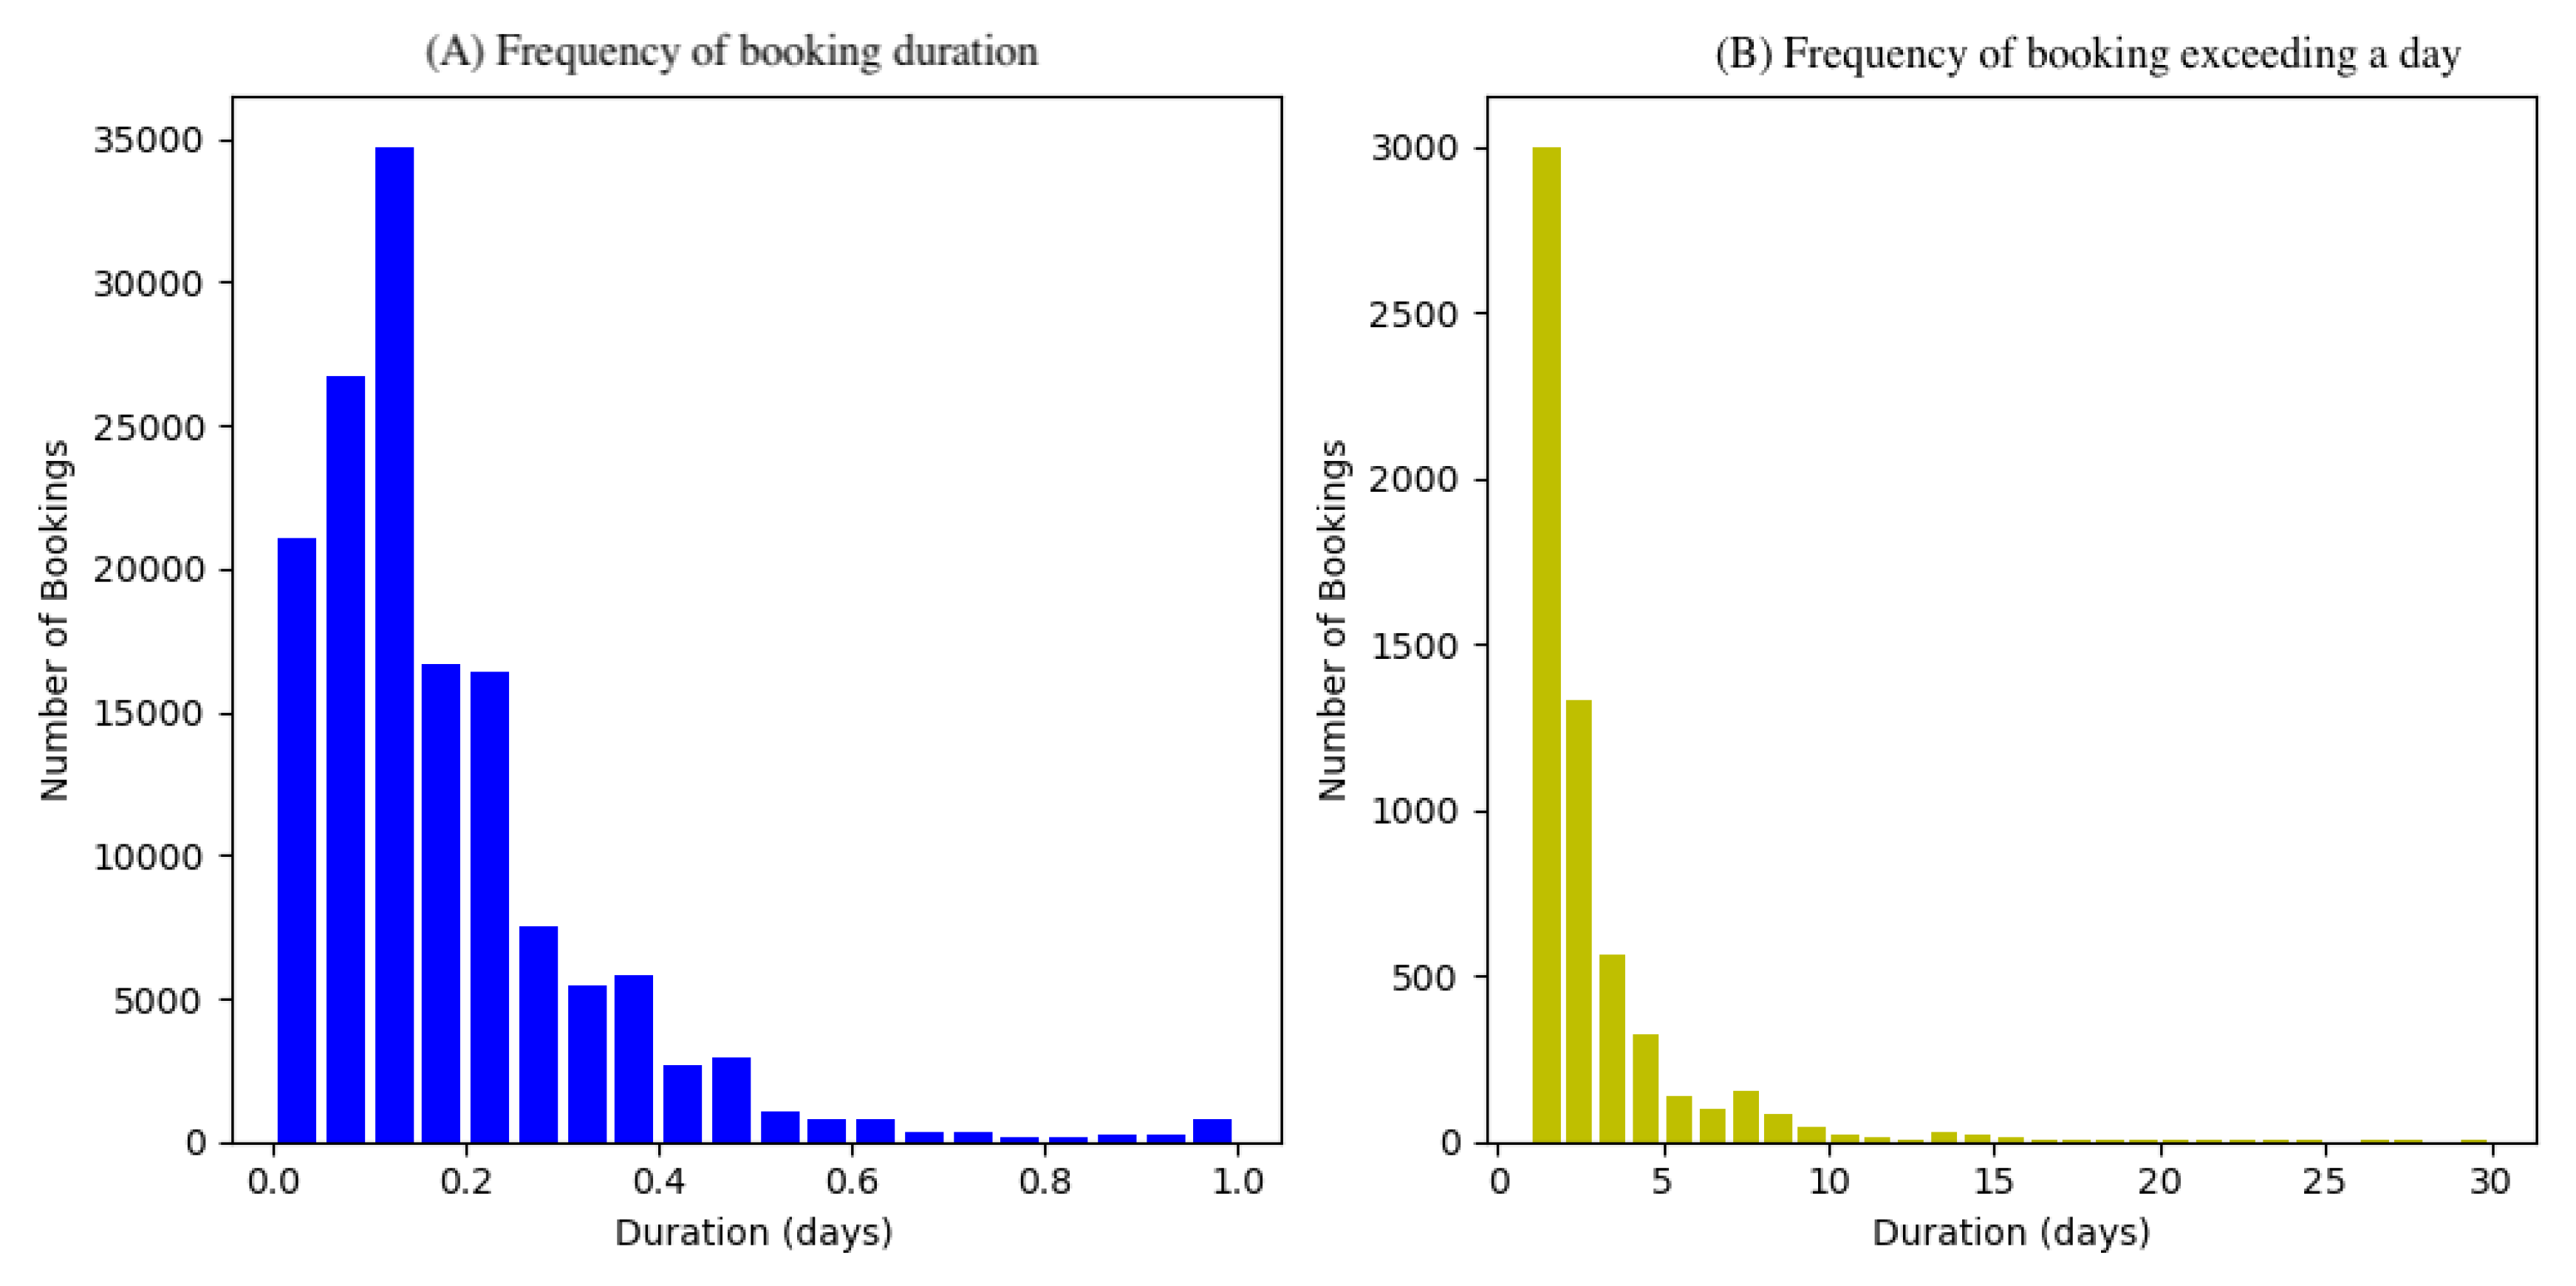
Figure 5.
Trip duration: frequency of single day and multiple days bookings (2023–2024).
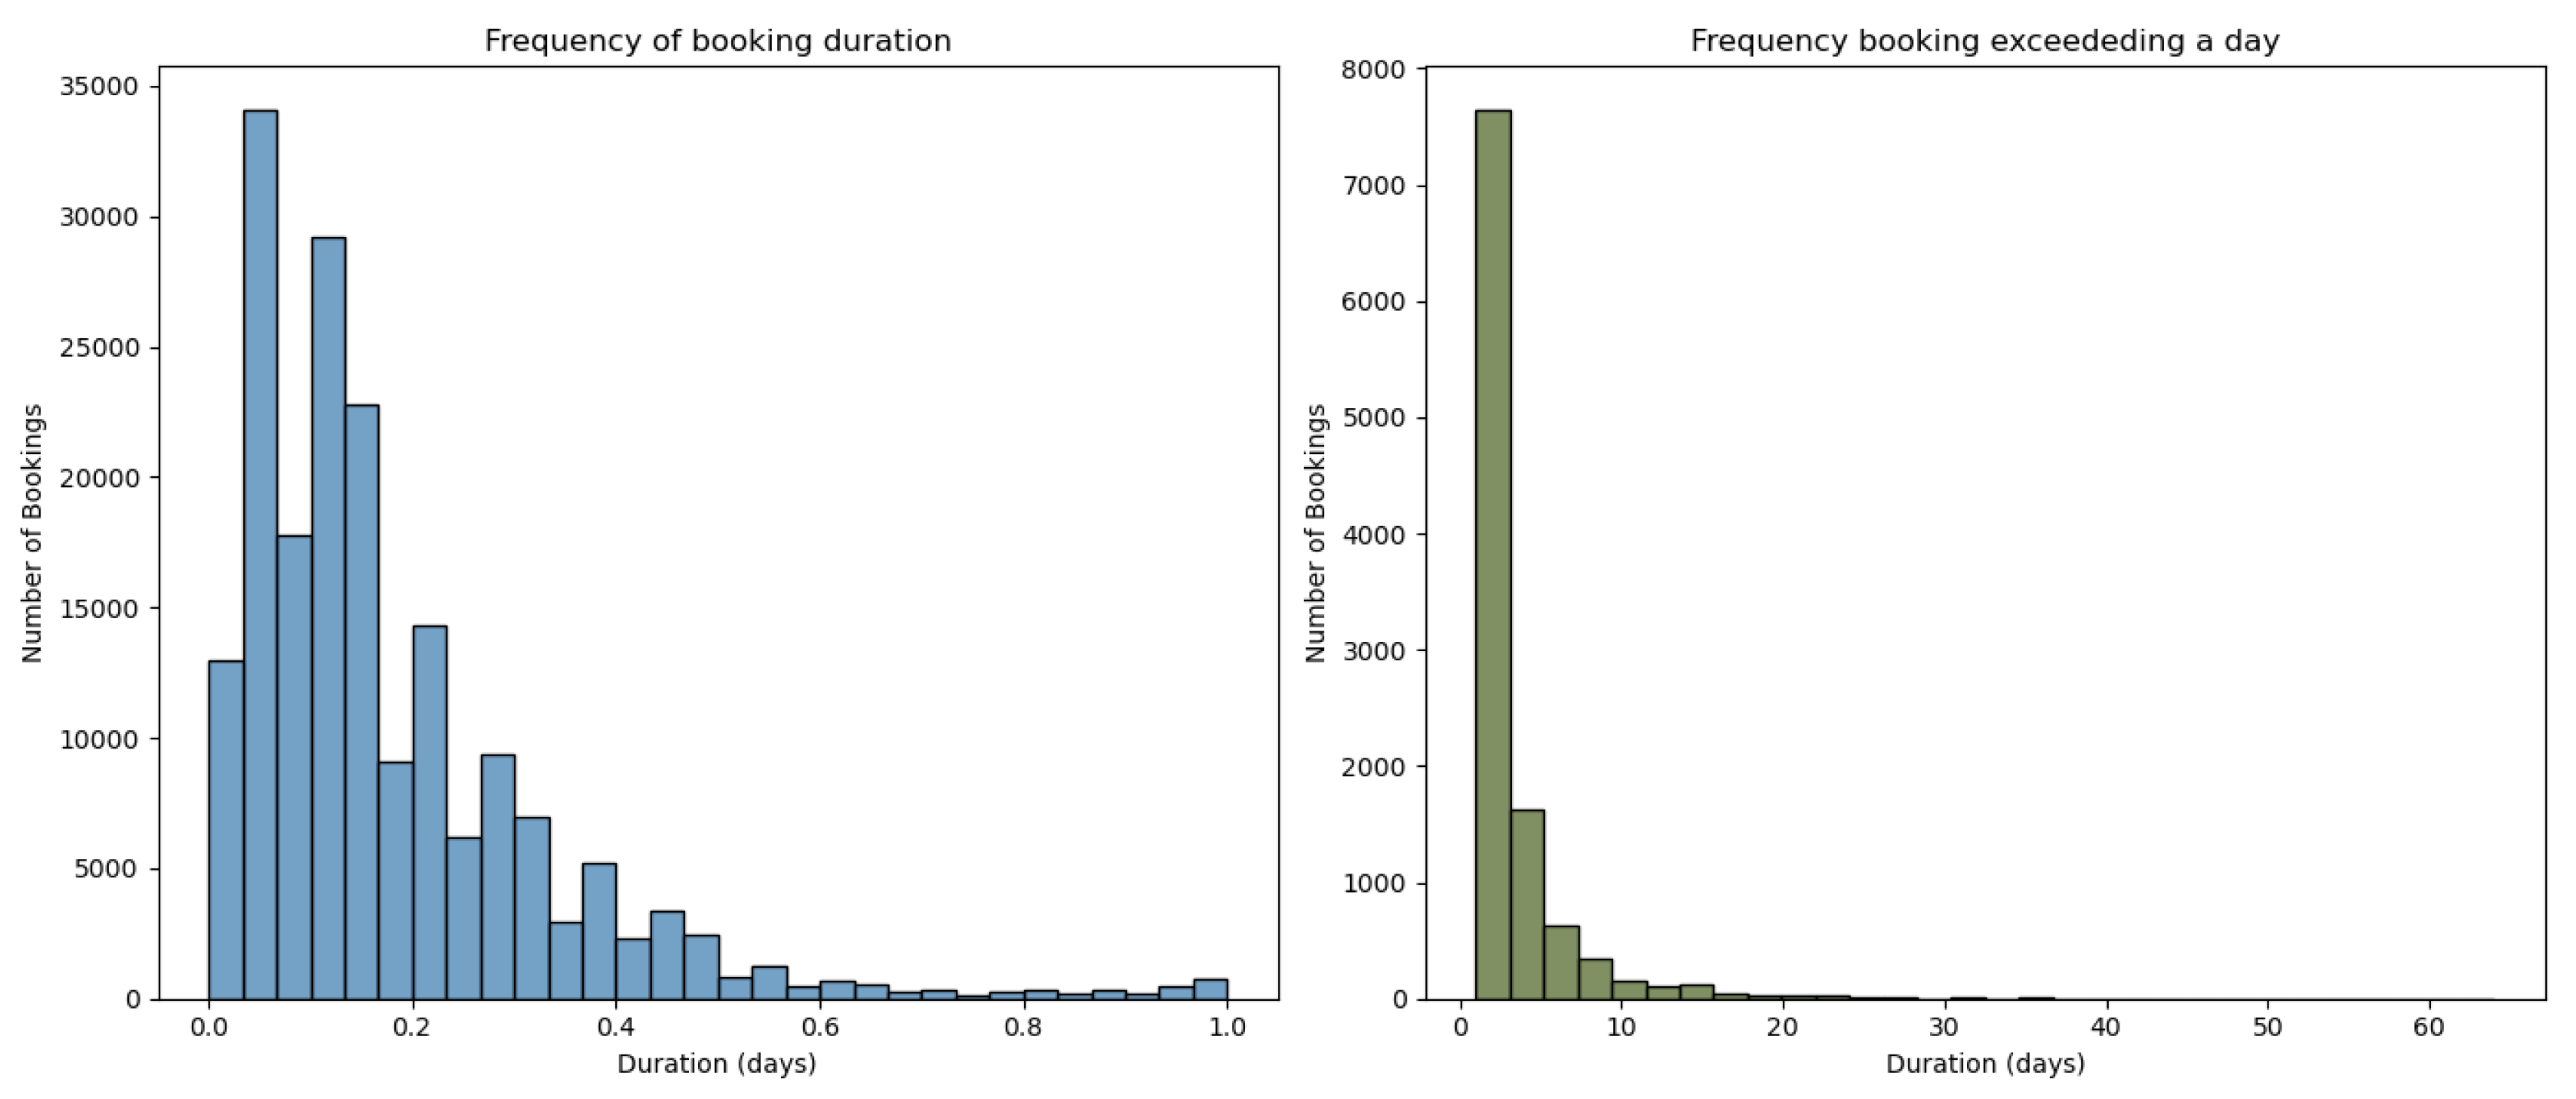
Figure 6.
Fleet growth between June 2018–2020).
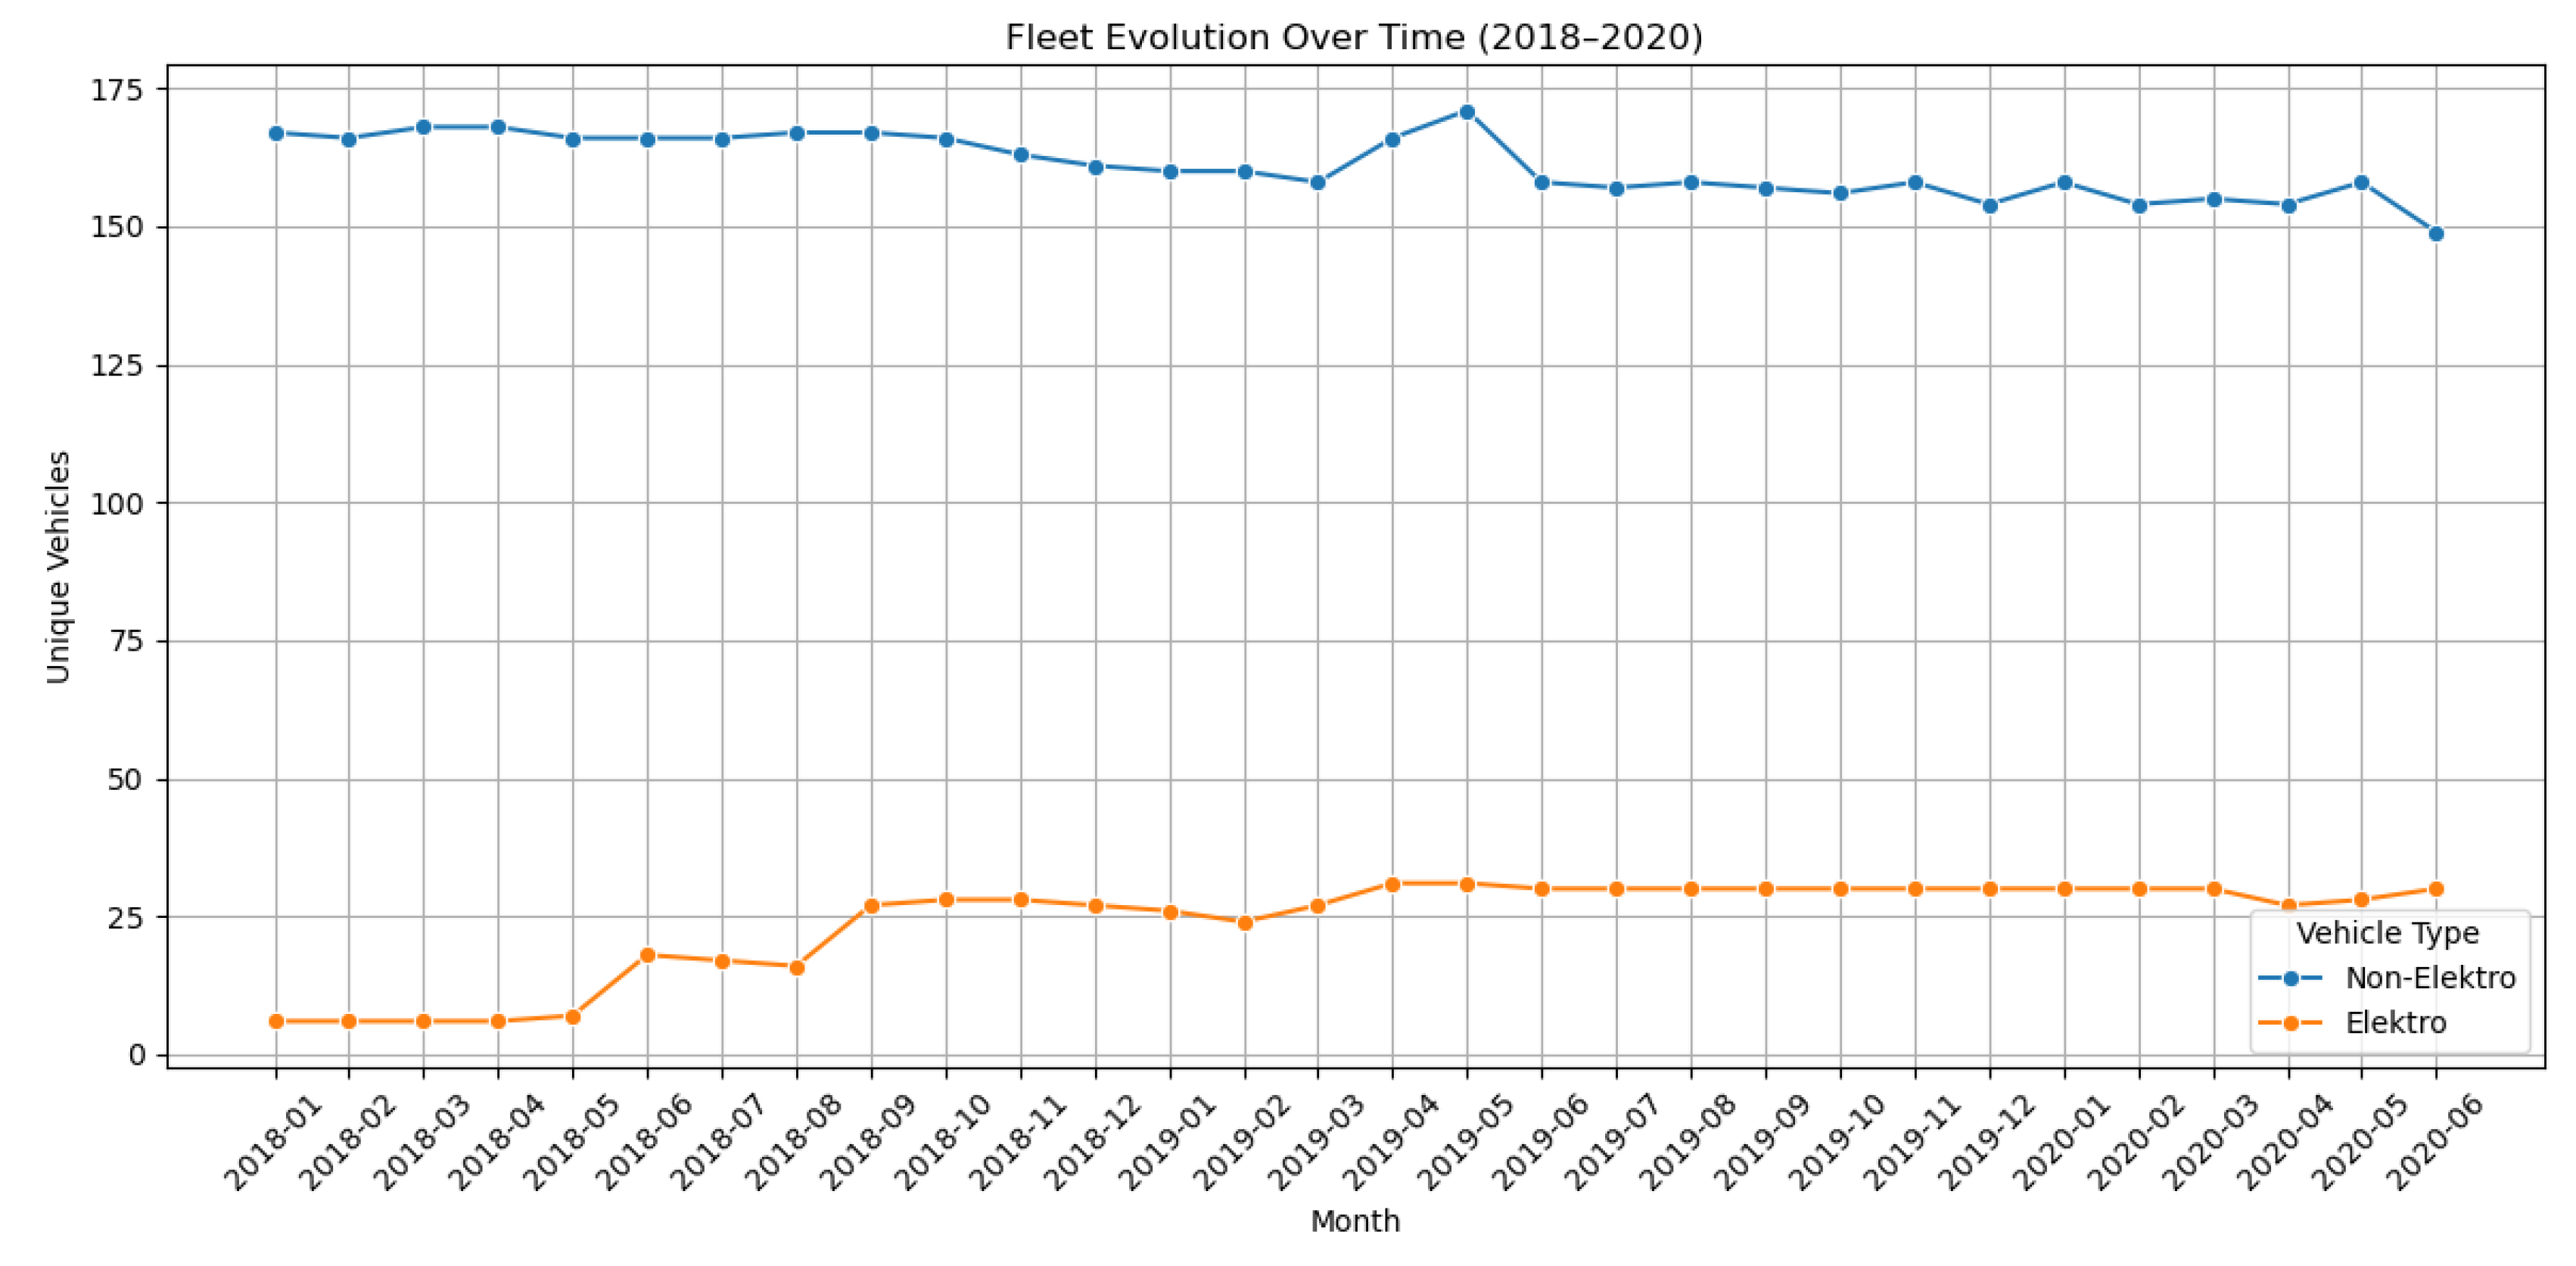
Figure 7.
Fleet growth between 2023–2024.
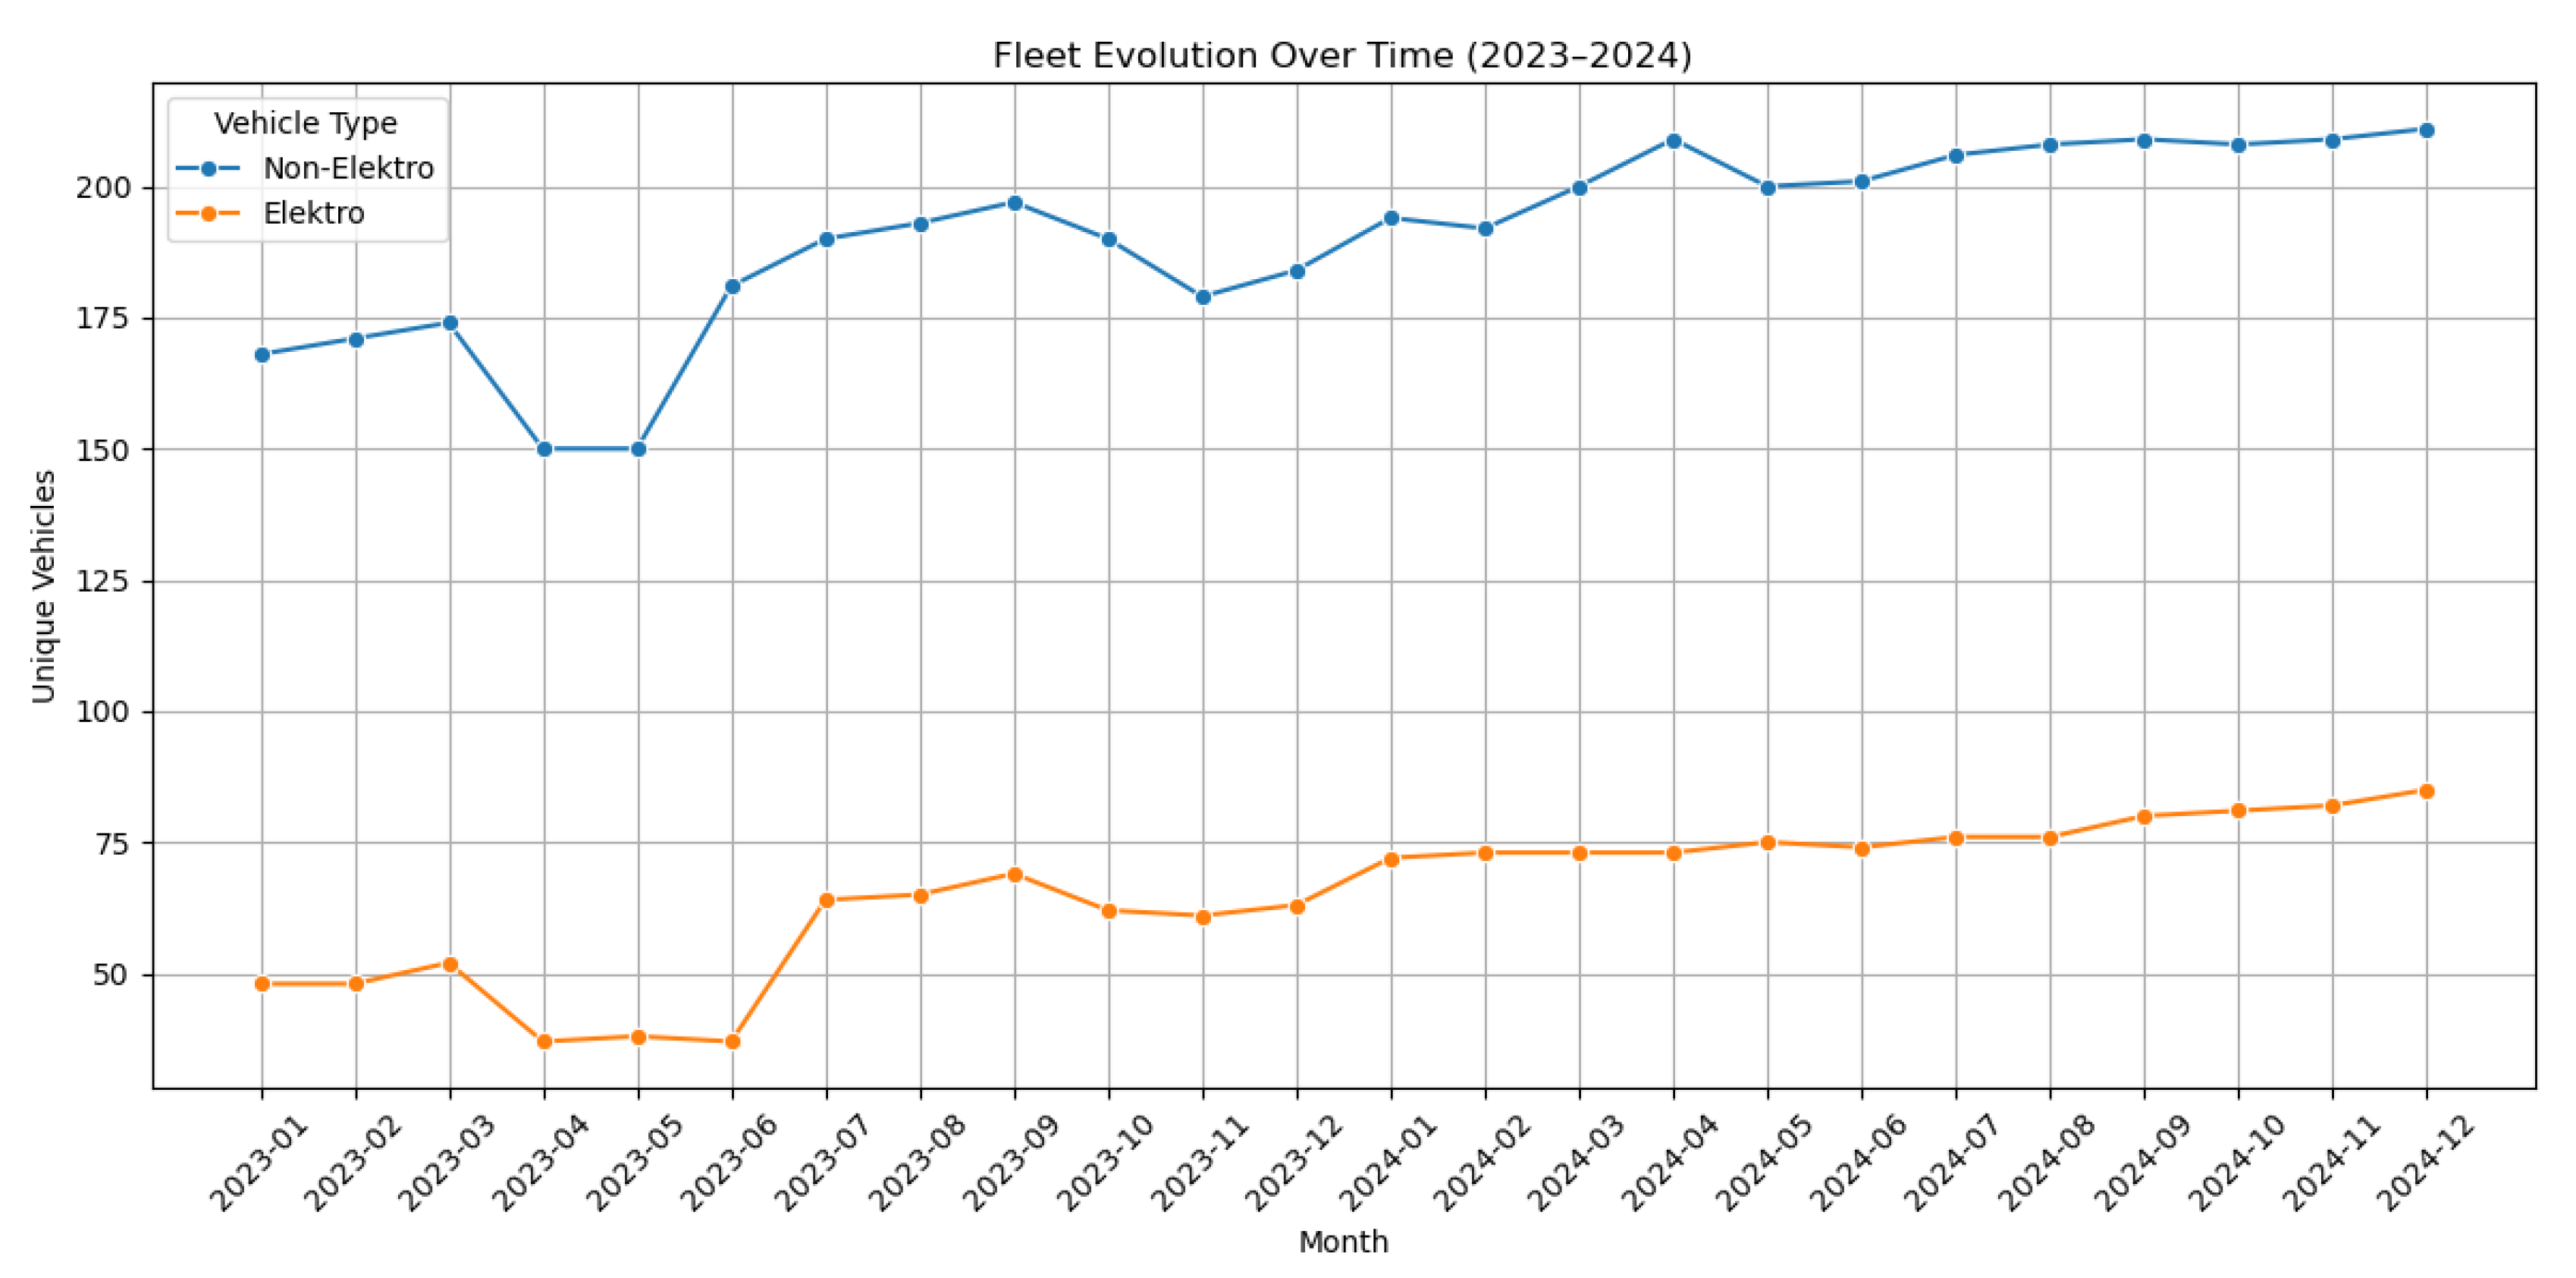
Figure 8.
More investment are focusing in Electric version of the City Car.
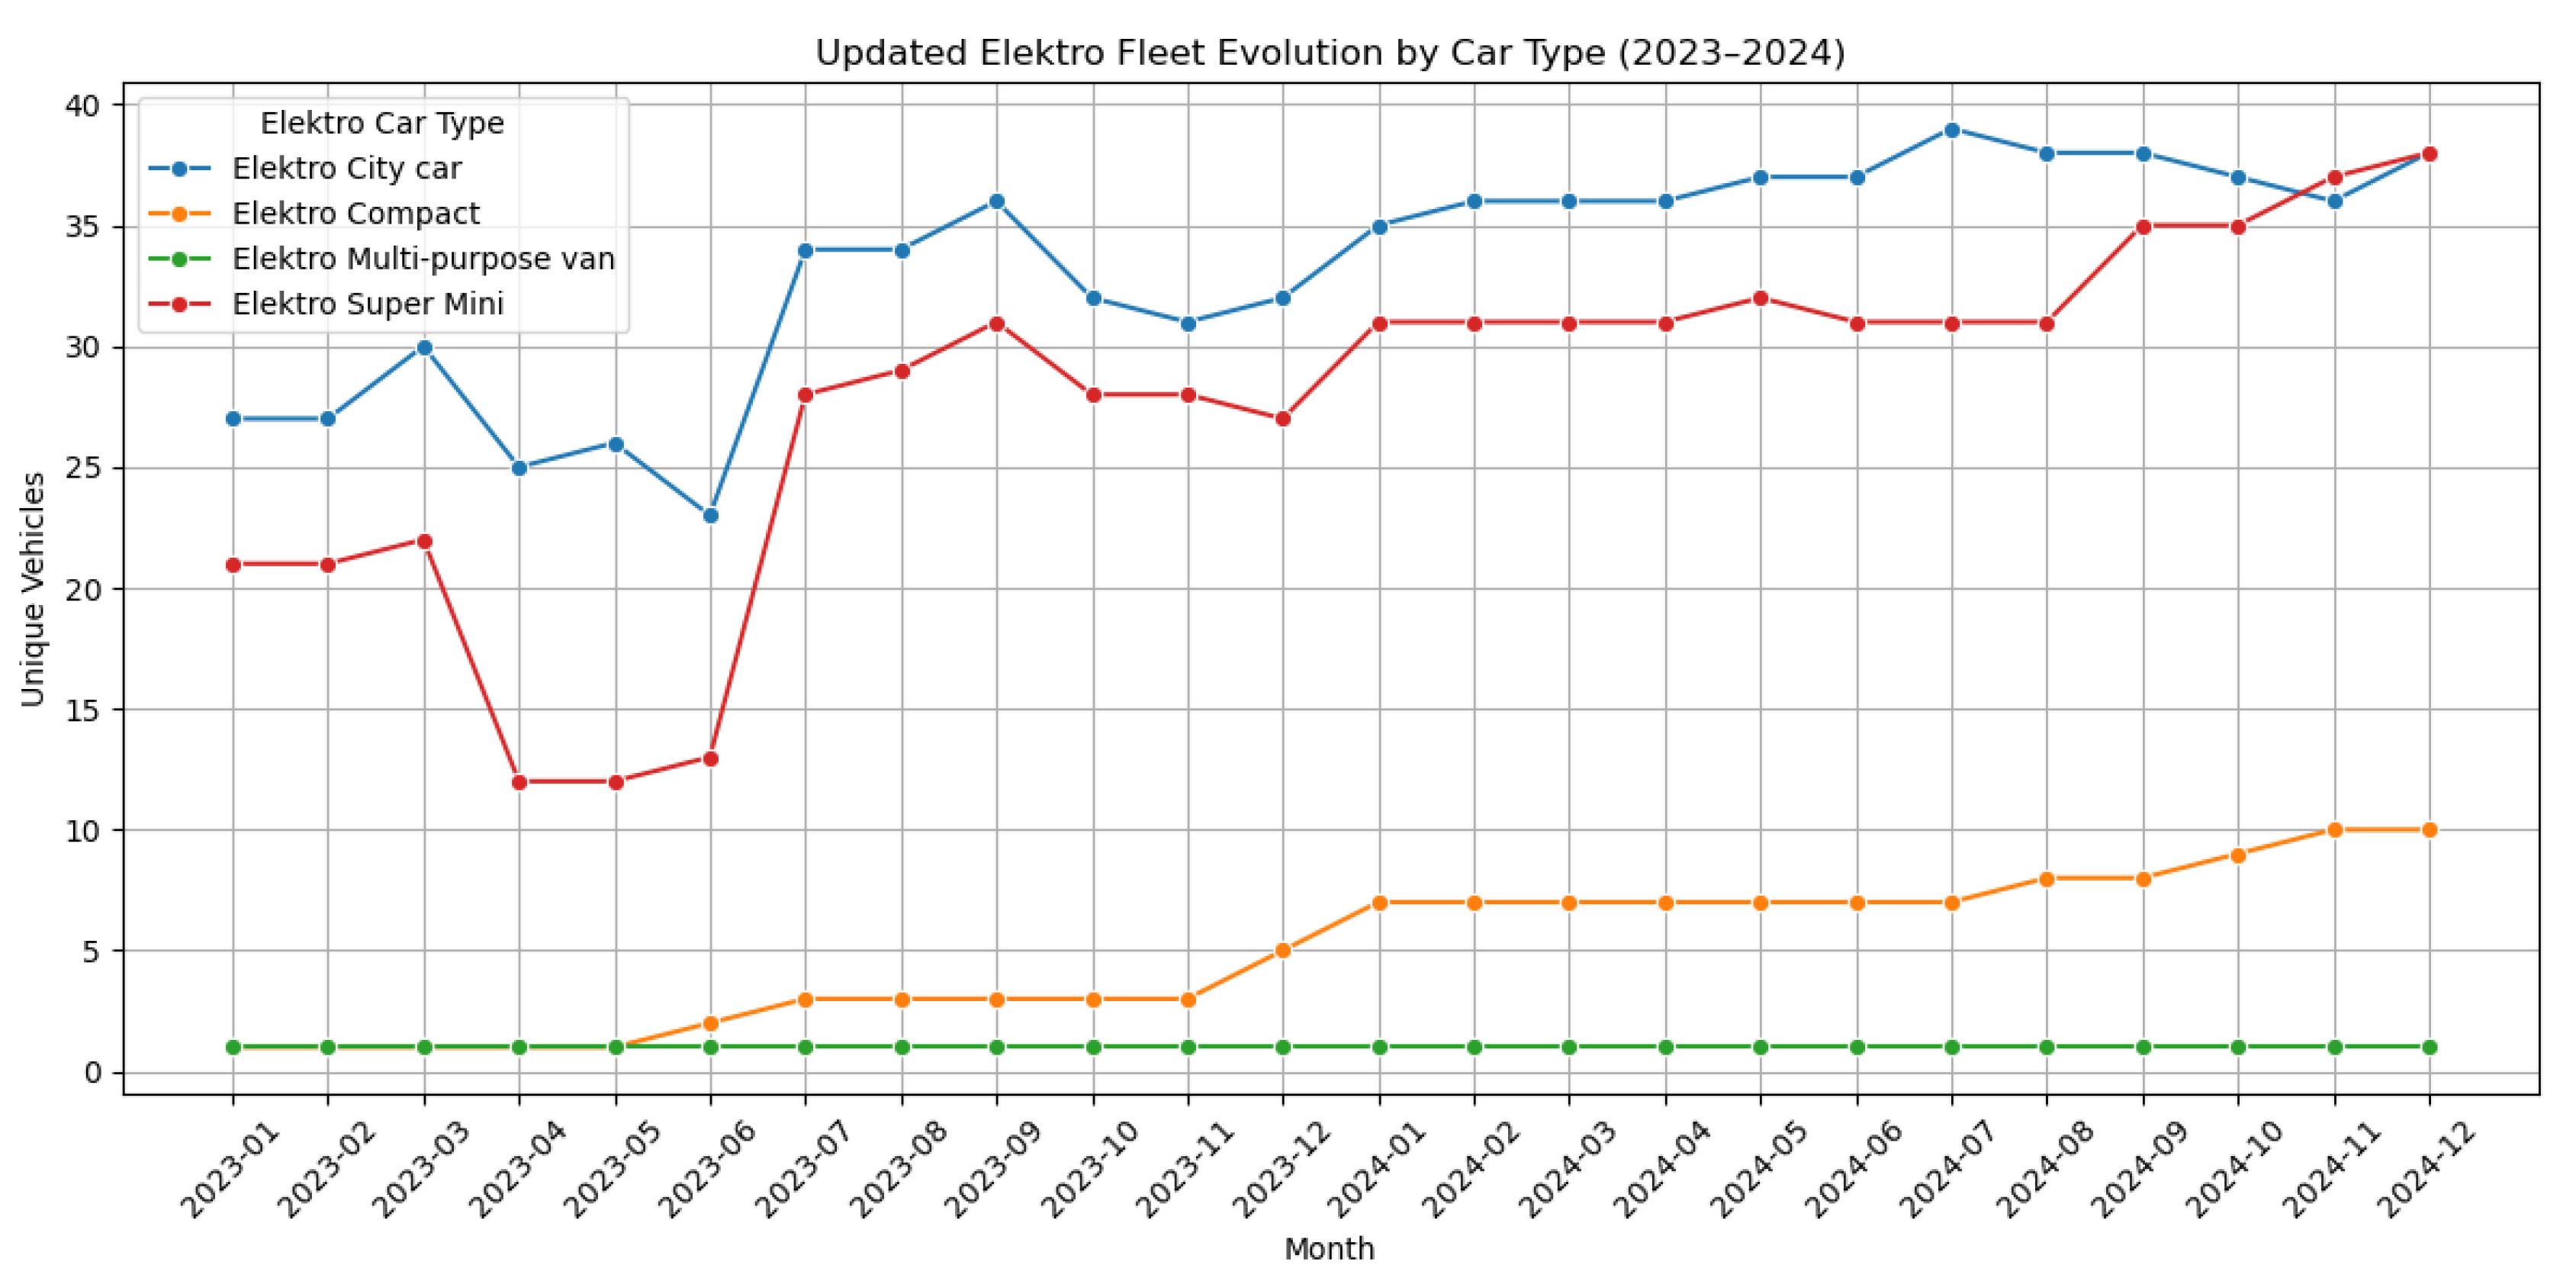
Figure 9.
Example of a booking chain with four bookings.
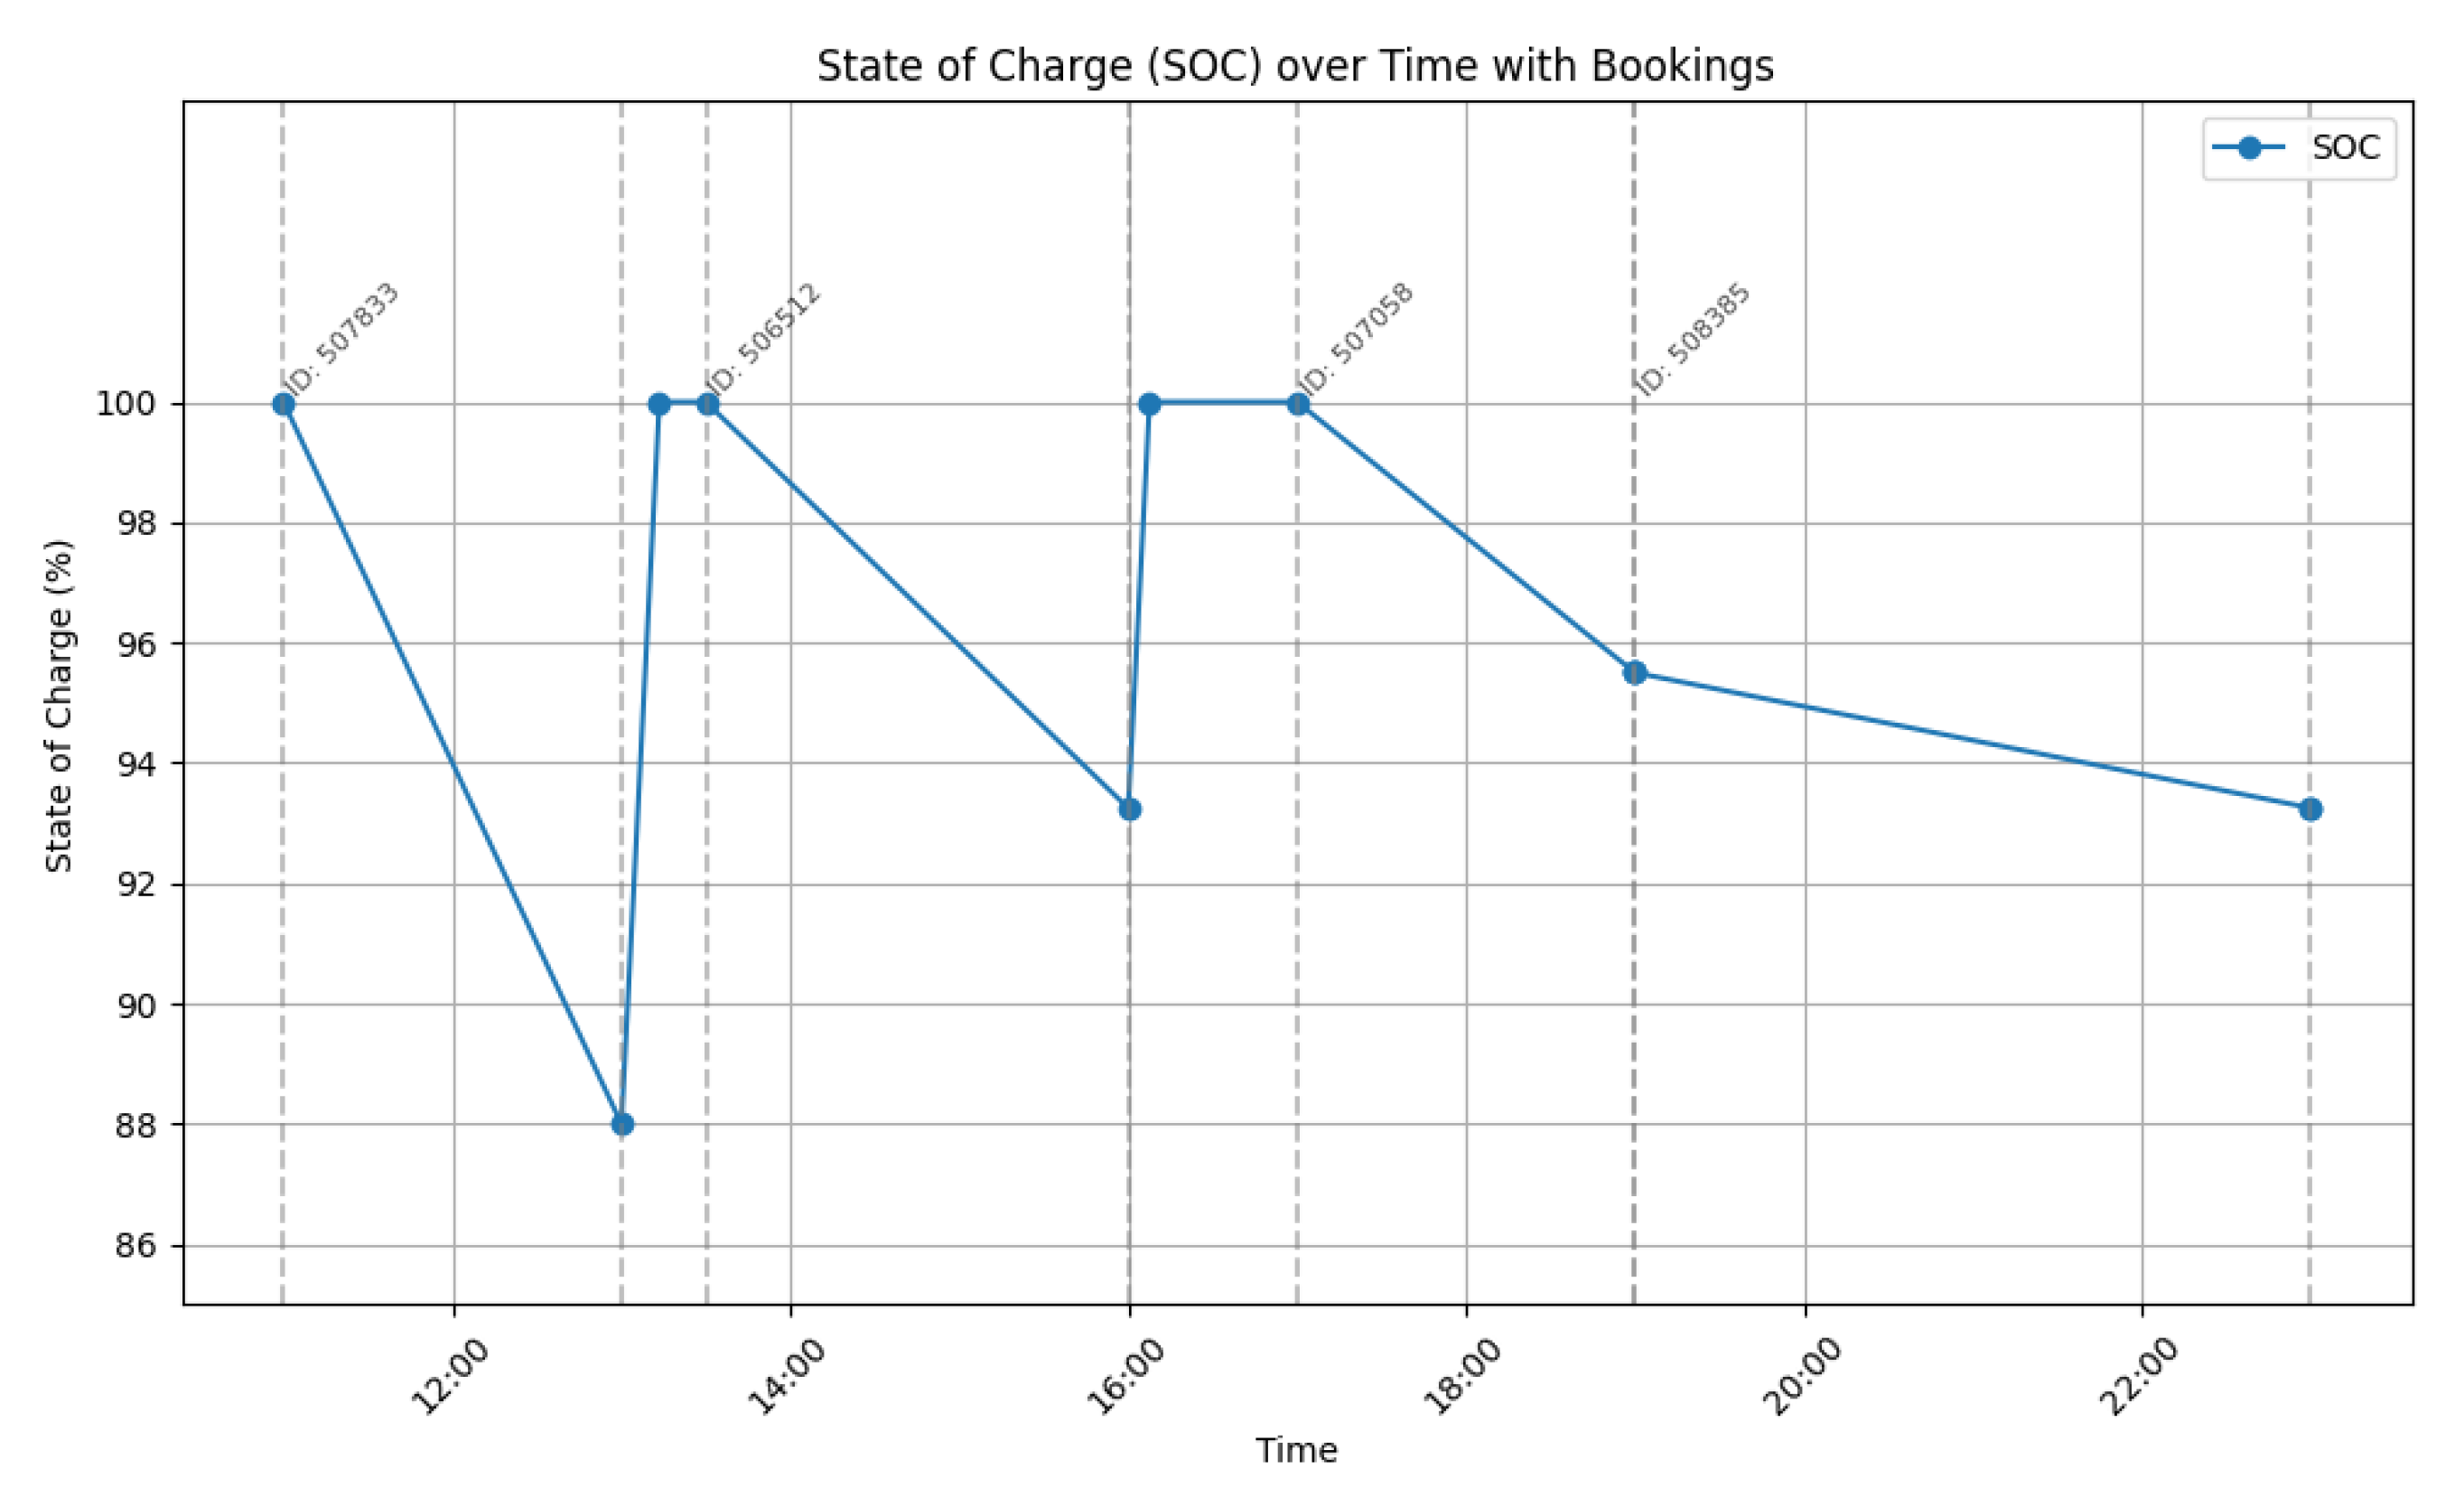
Figure 10.
Simulation result with ignored long-range bookings.
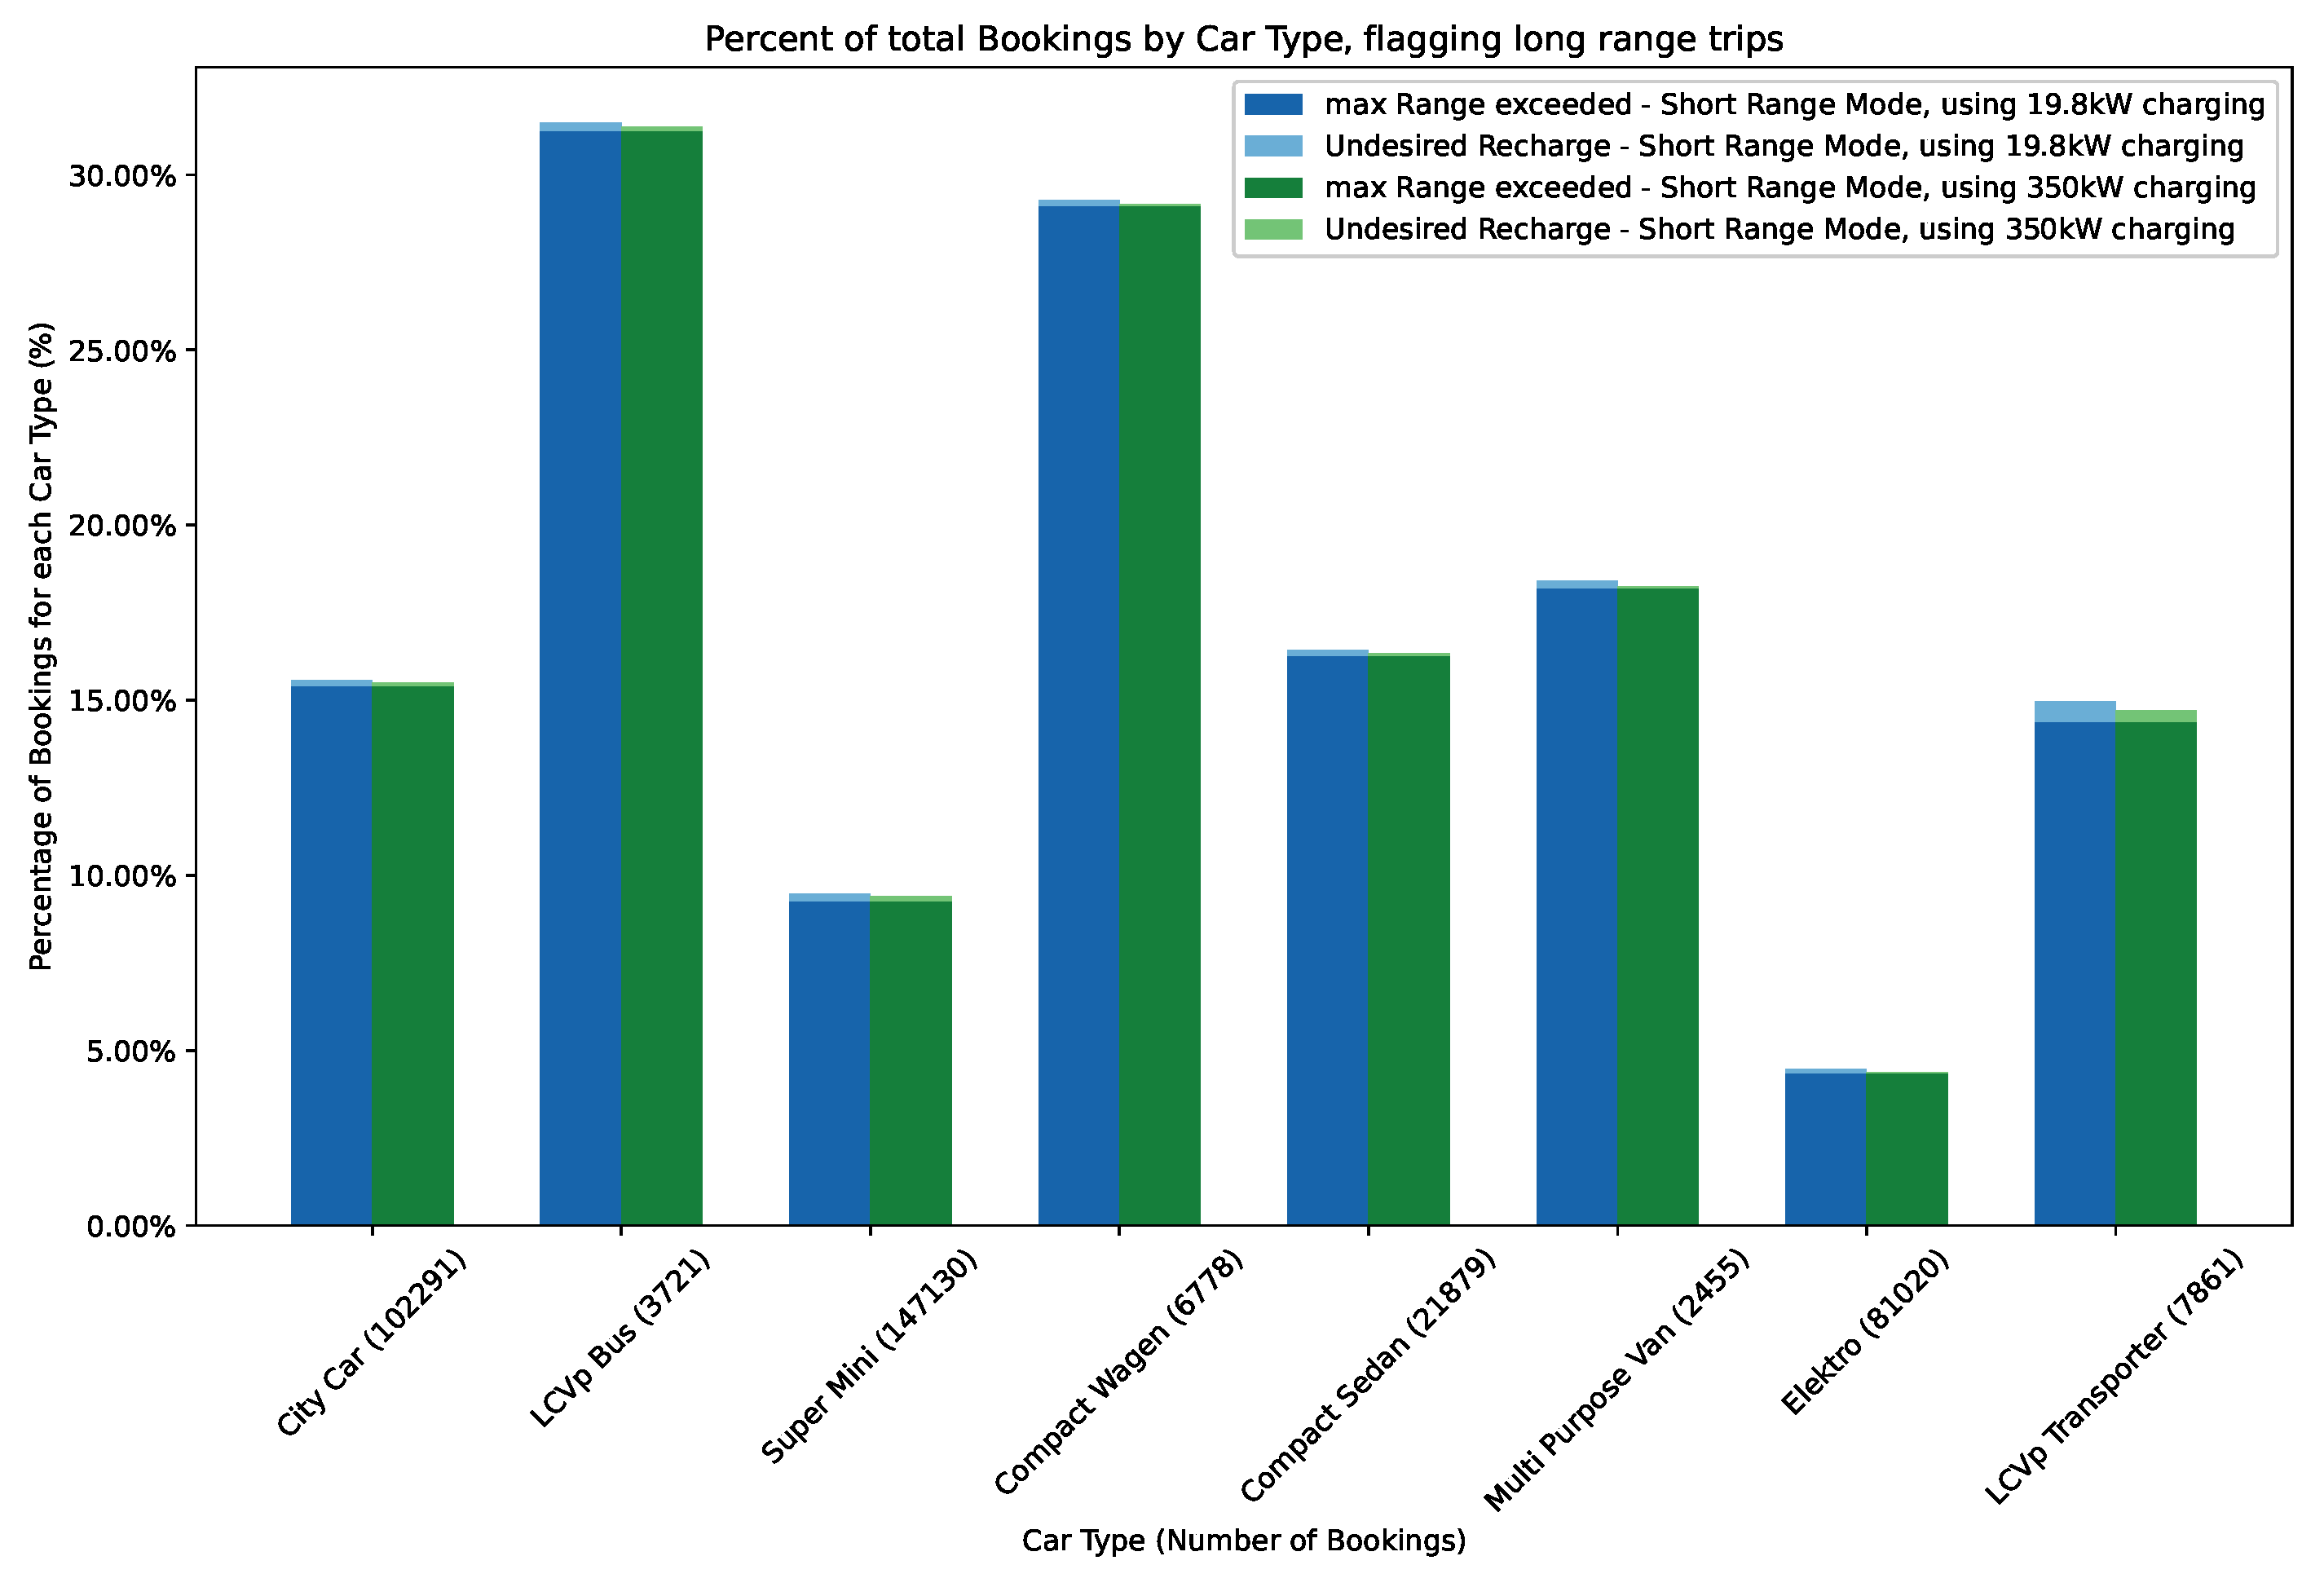
Figure 11.
Simulation result excluding long-range bookings that cannot be covered with a fully charged battery.
Figure 11.
Simulation result excluding long-range bookings that cannot be covered with a fully charged battery.
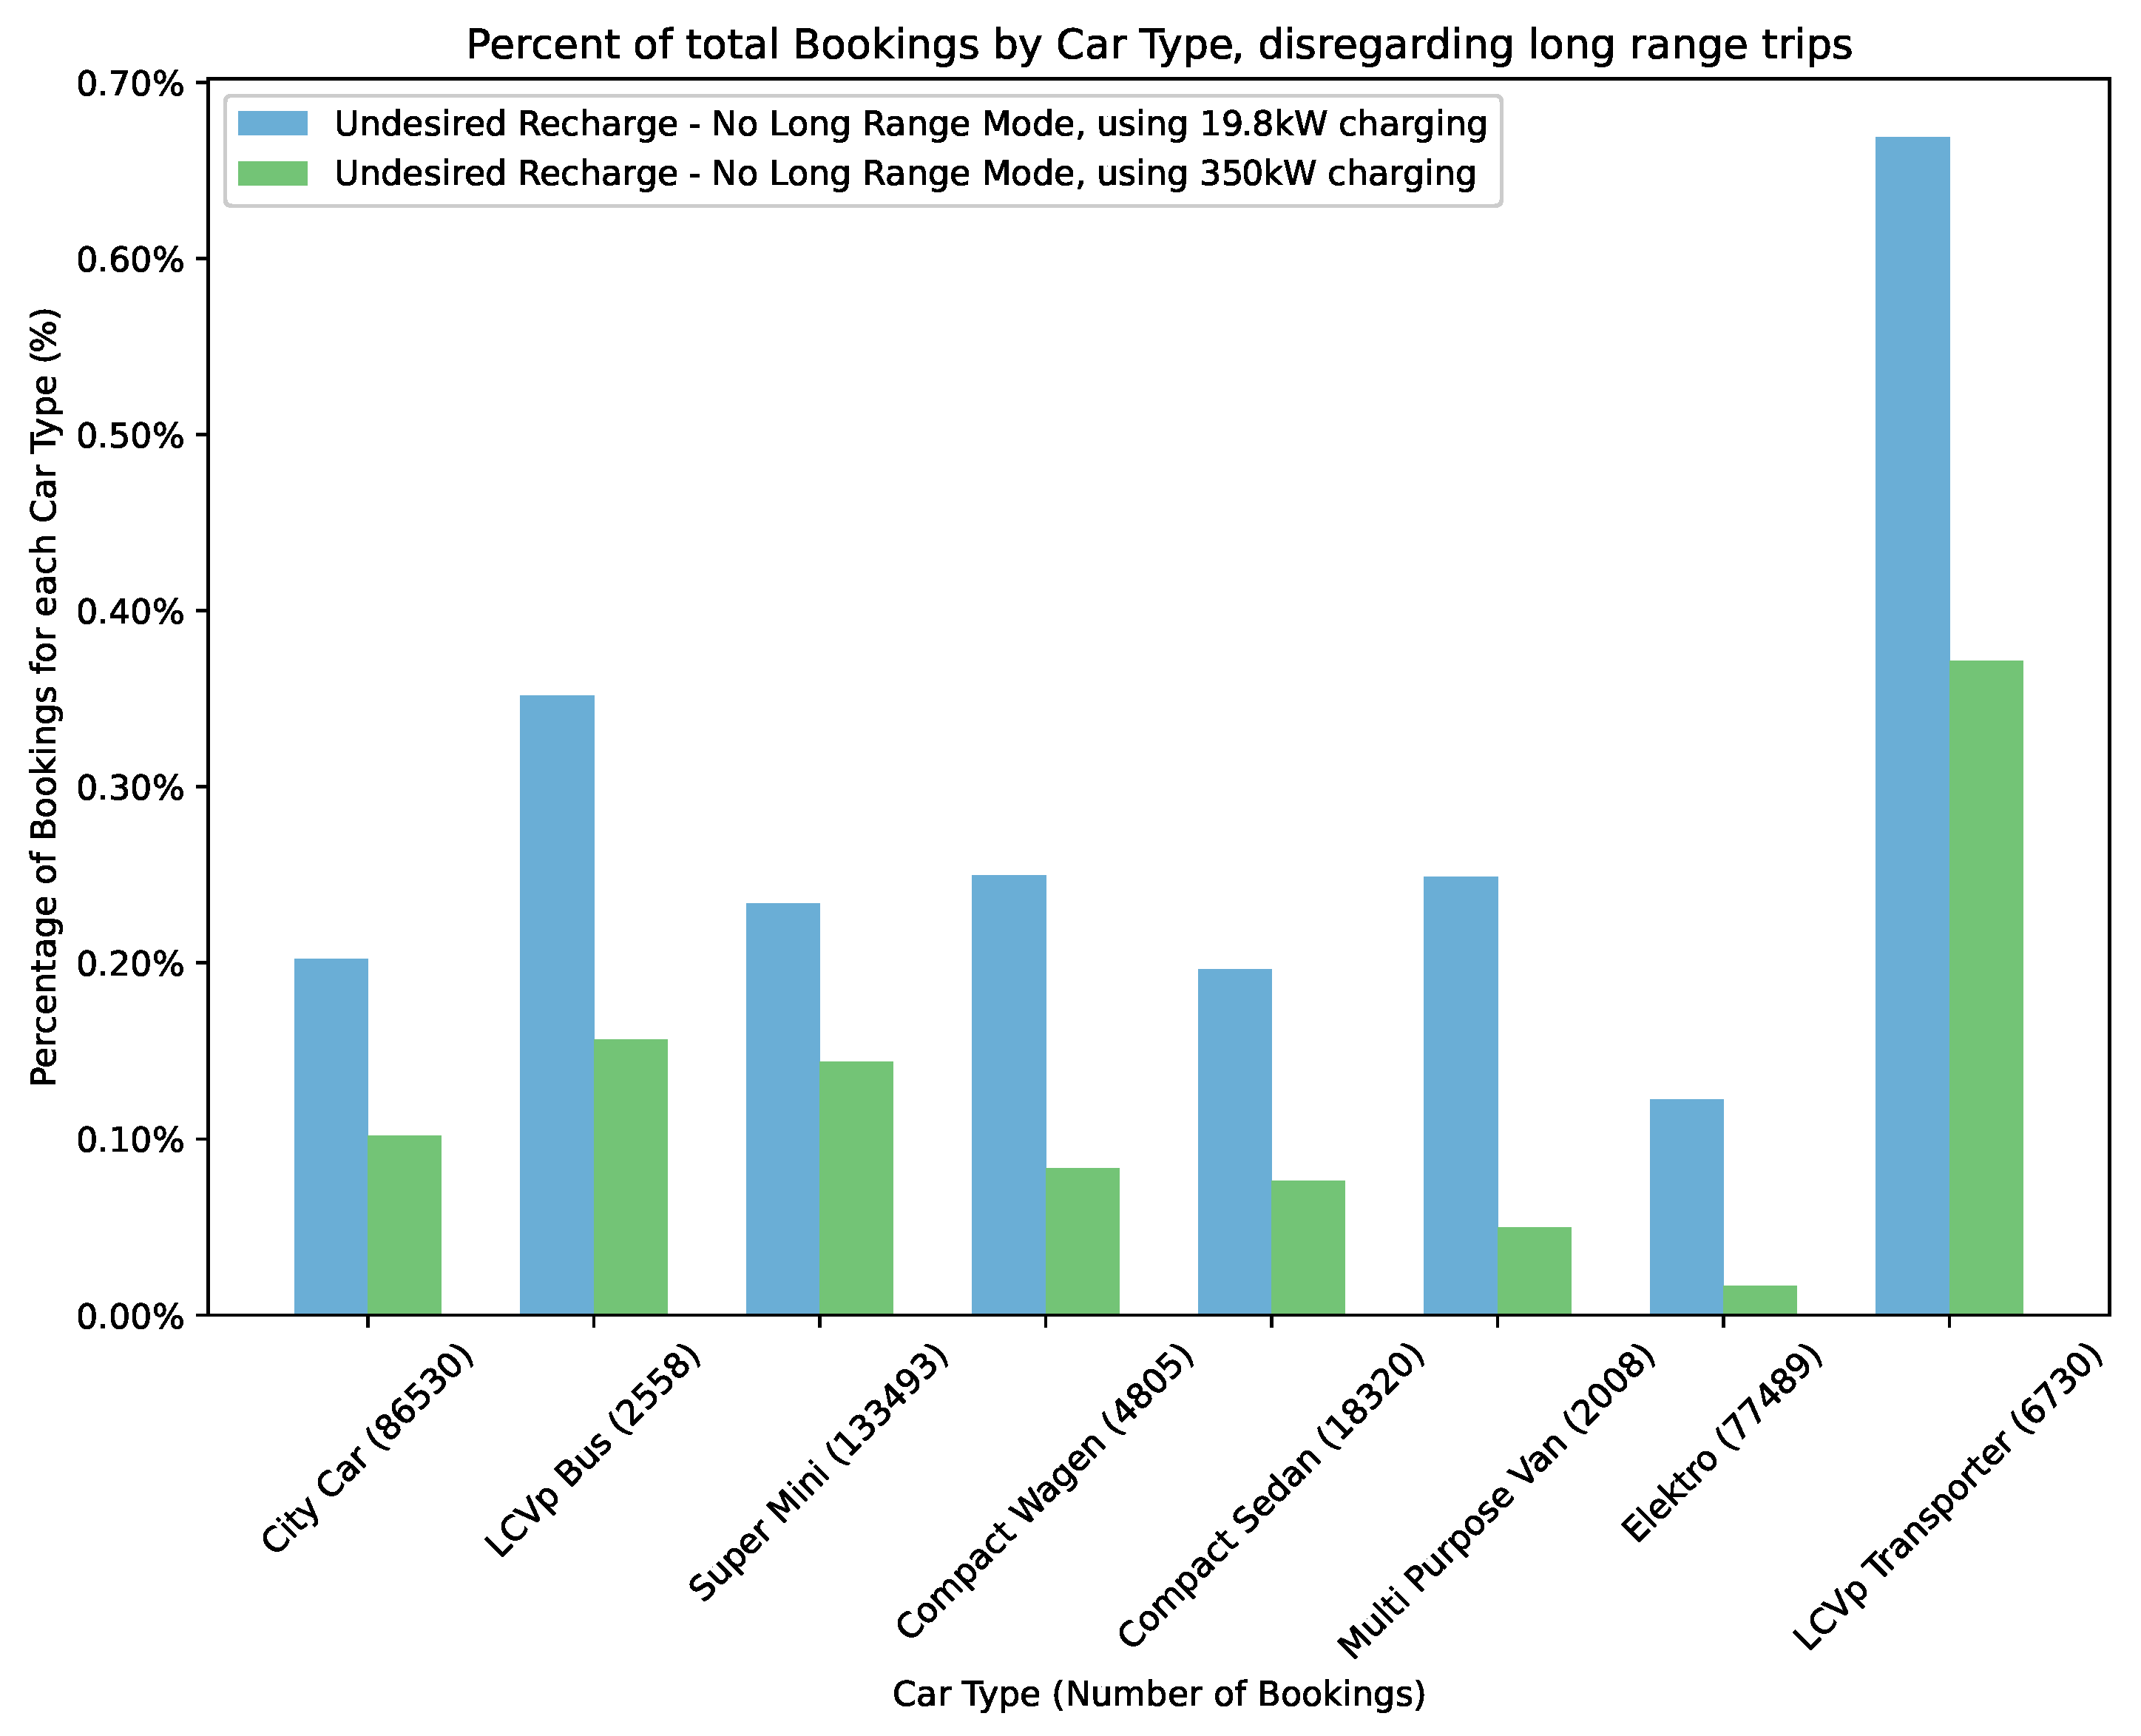
Figure 12.
Simulation result for accepting long-range bookings that exceed the car’s battery range, provided the user recharges during use.
Figure 12.
Simulation result for accepting long-range bookings that exceed the car’s battery range, provided the user recharges during use.
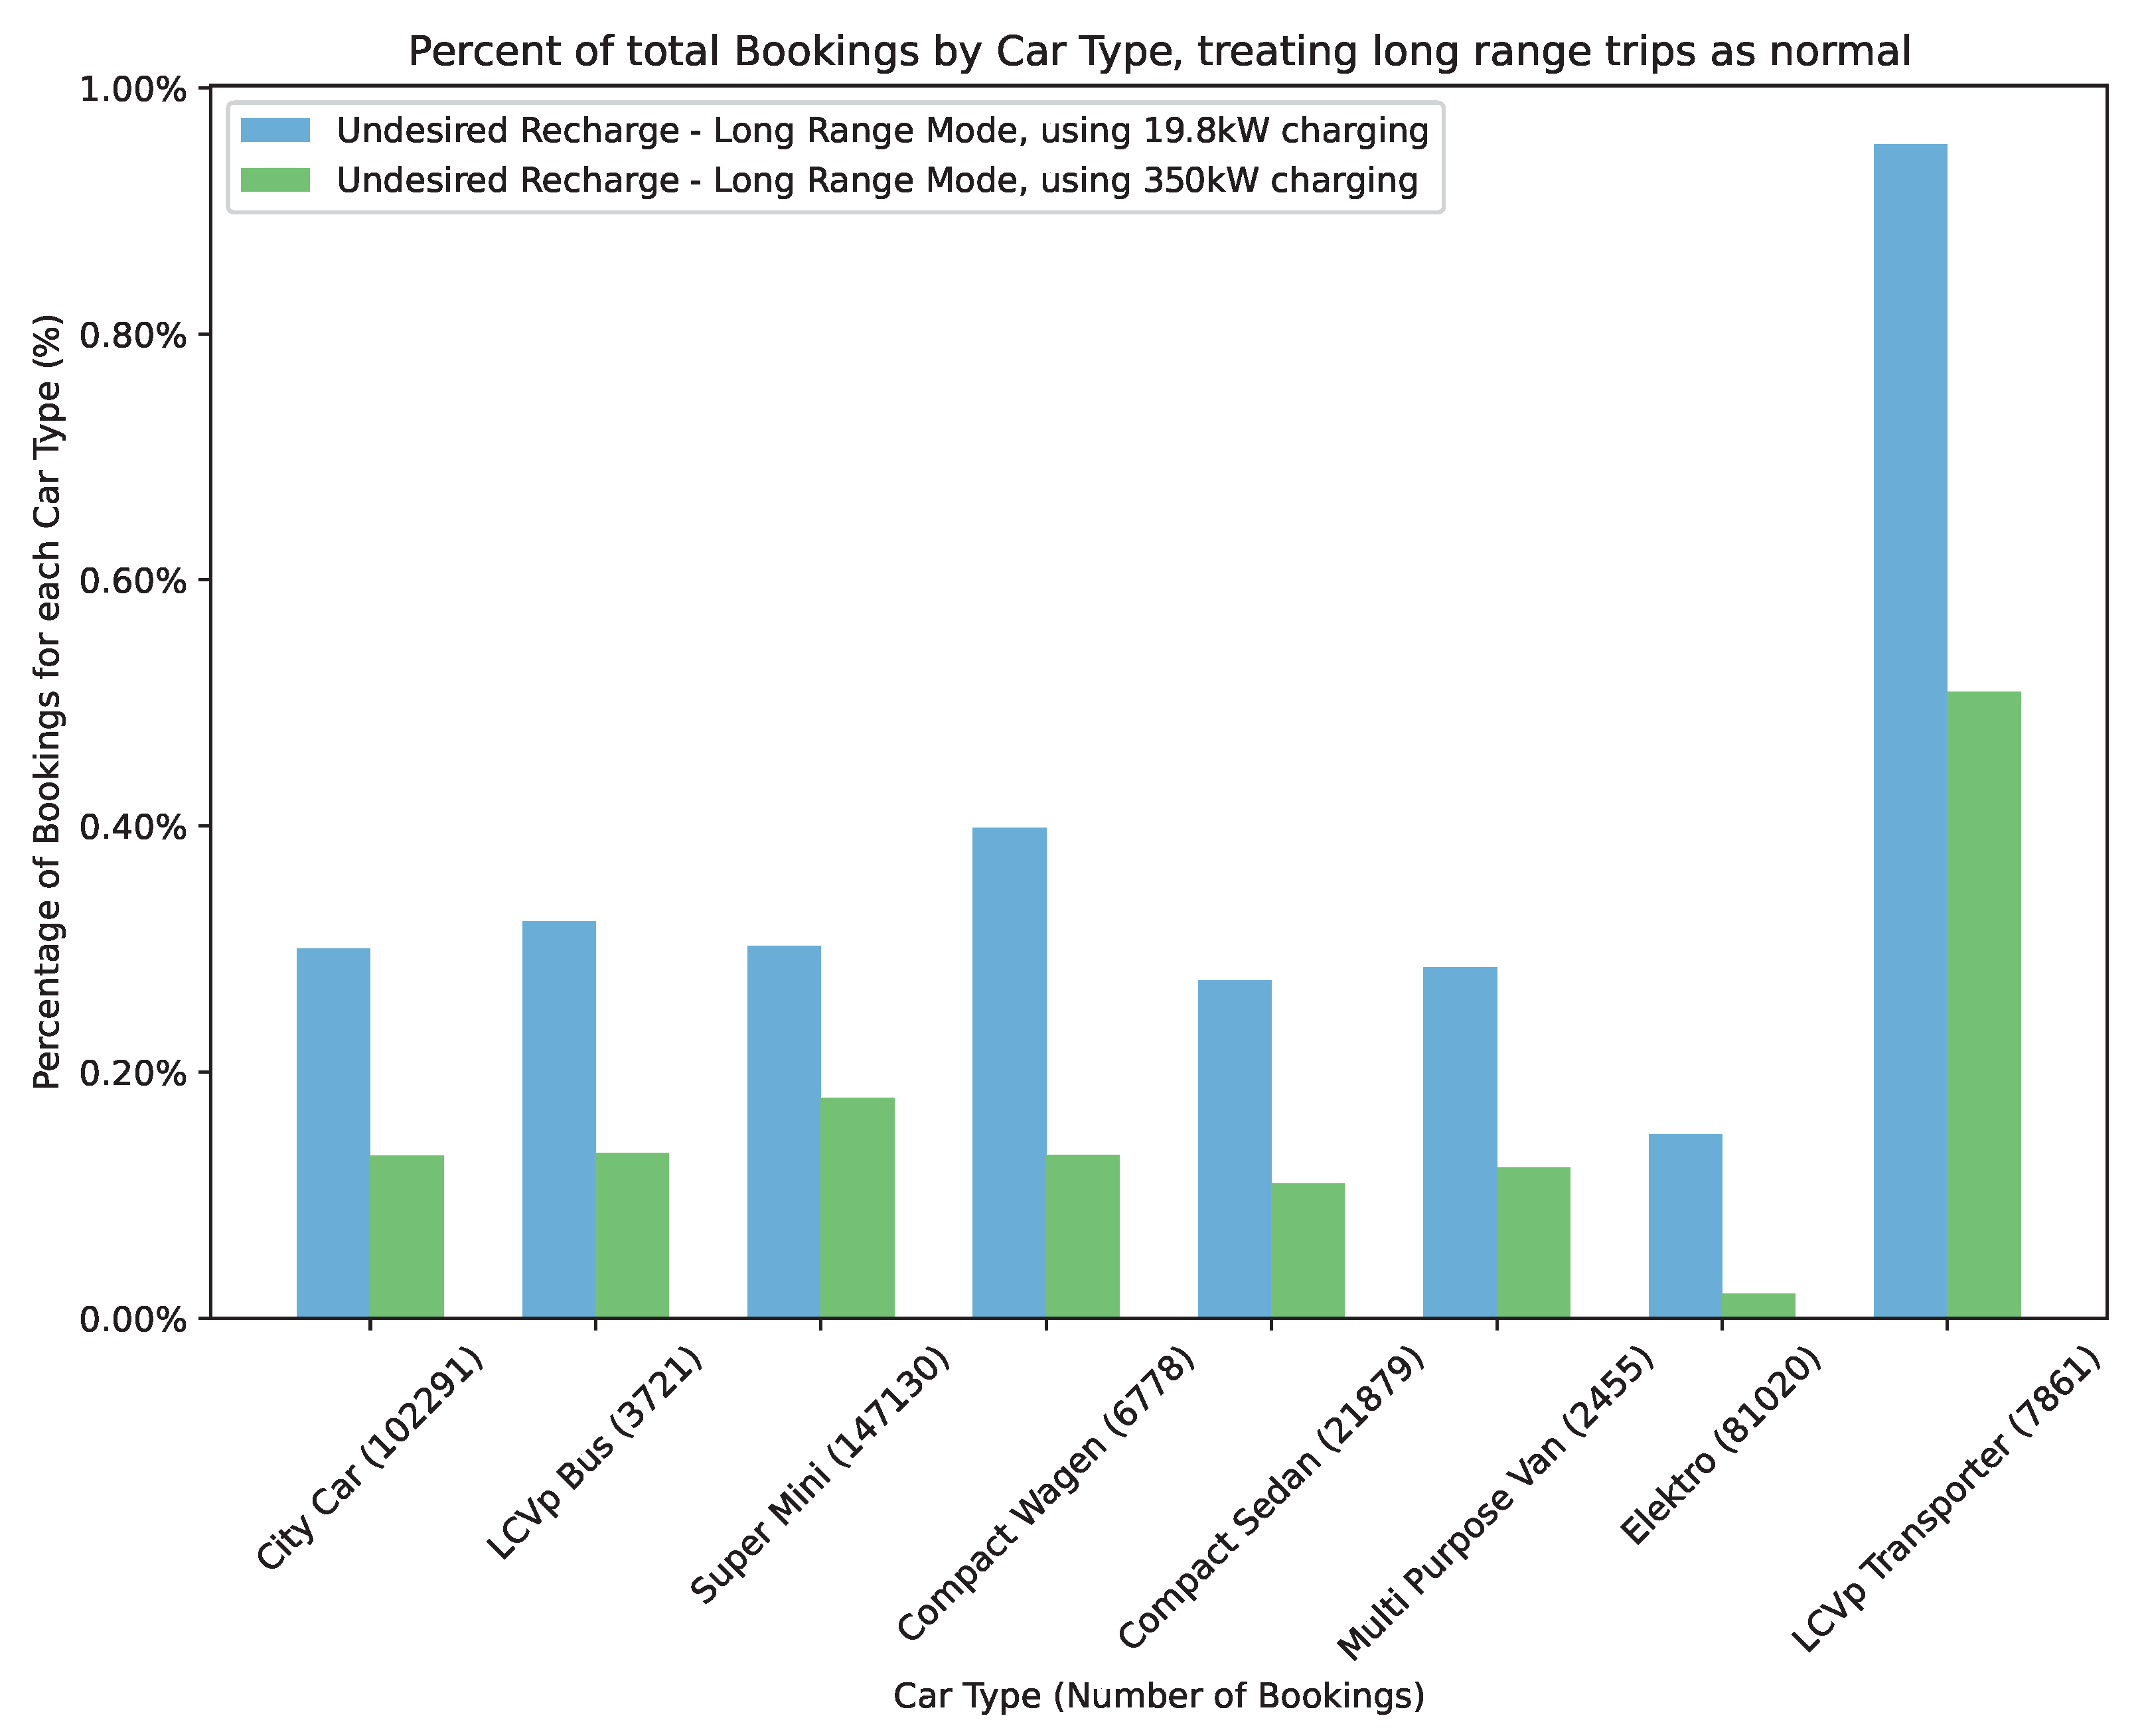
Figure 13.
Correlation matrix: booking chain metrics and undesired recharge events (UR).
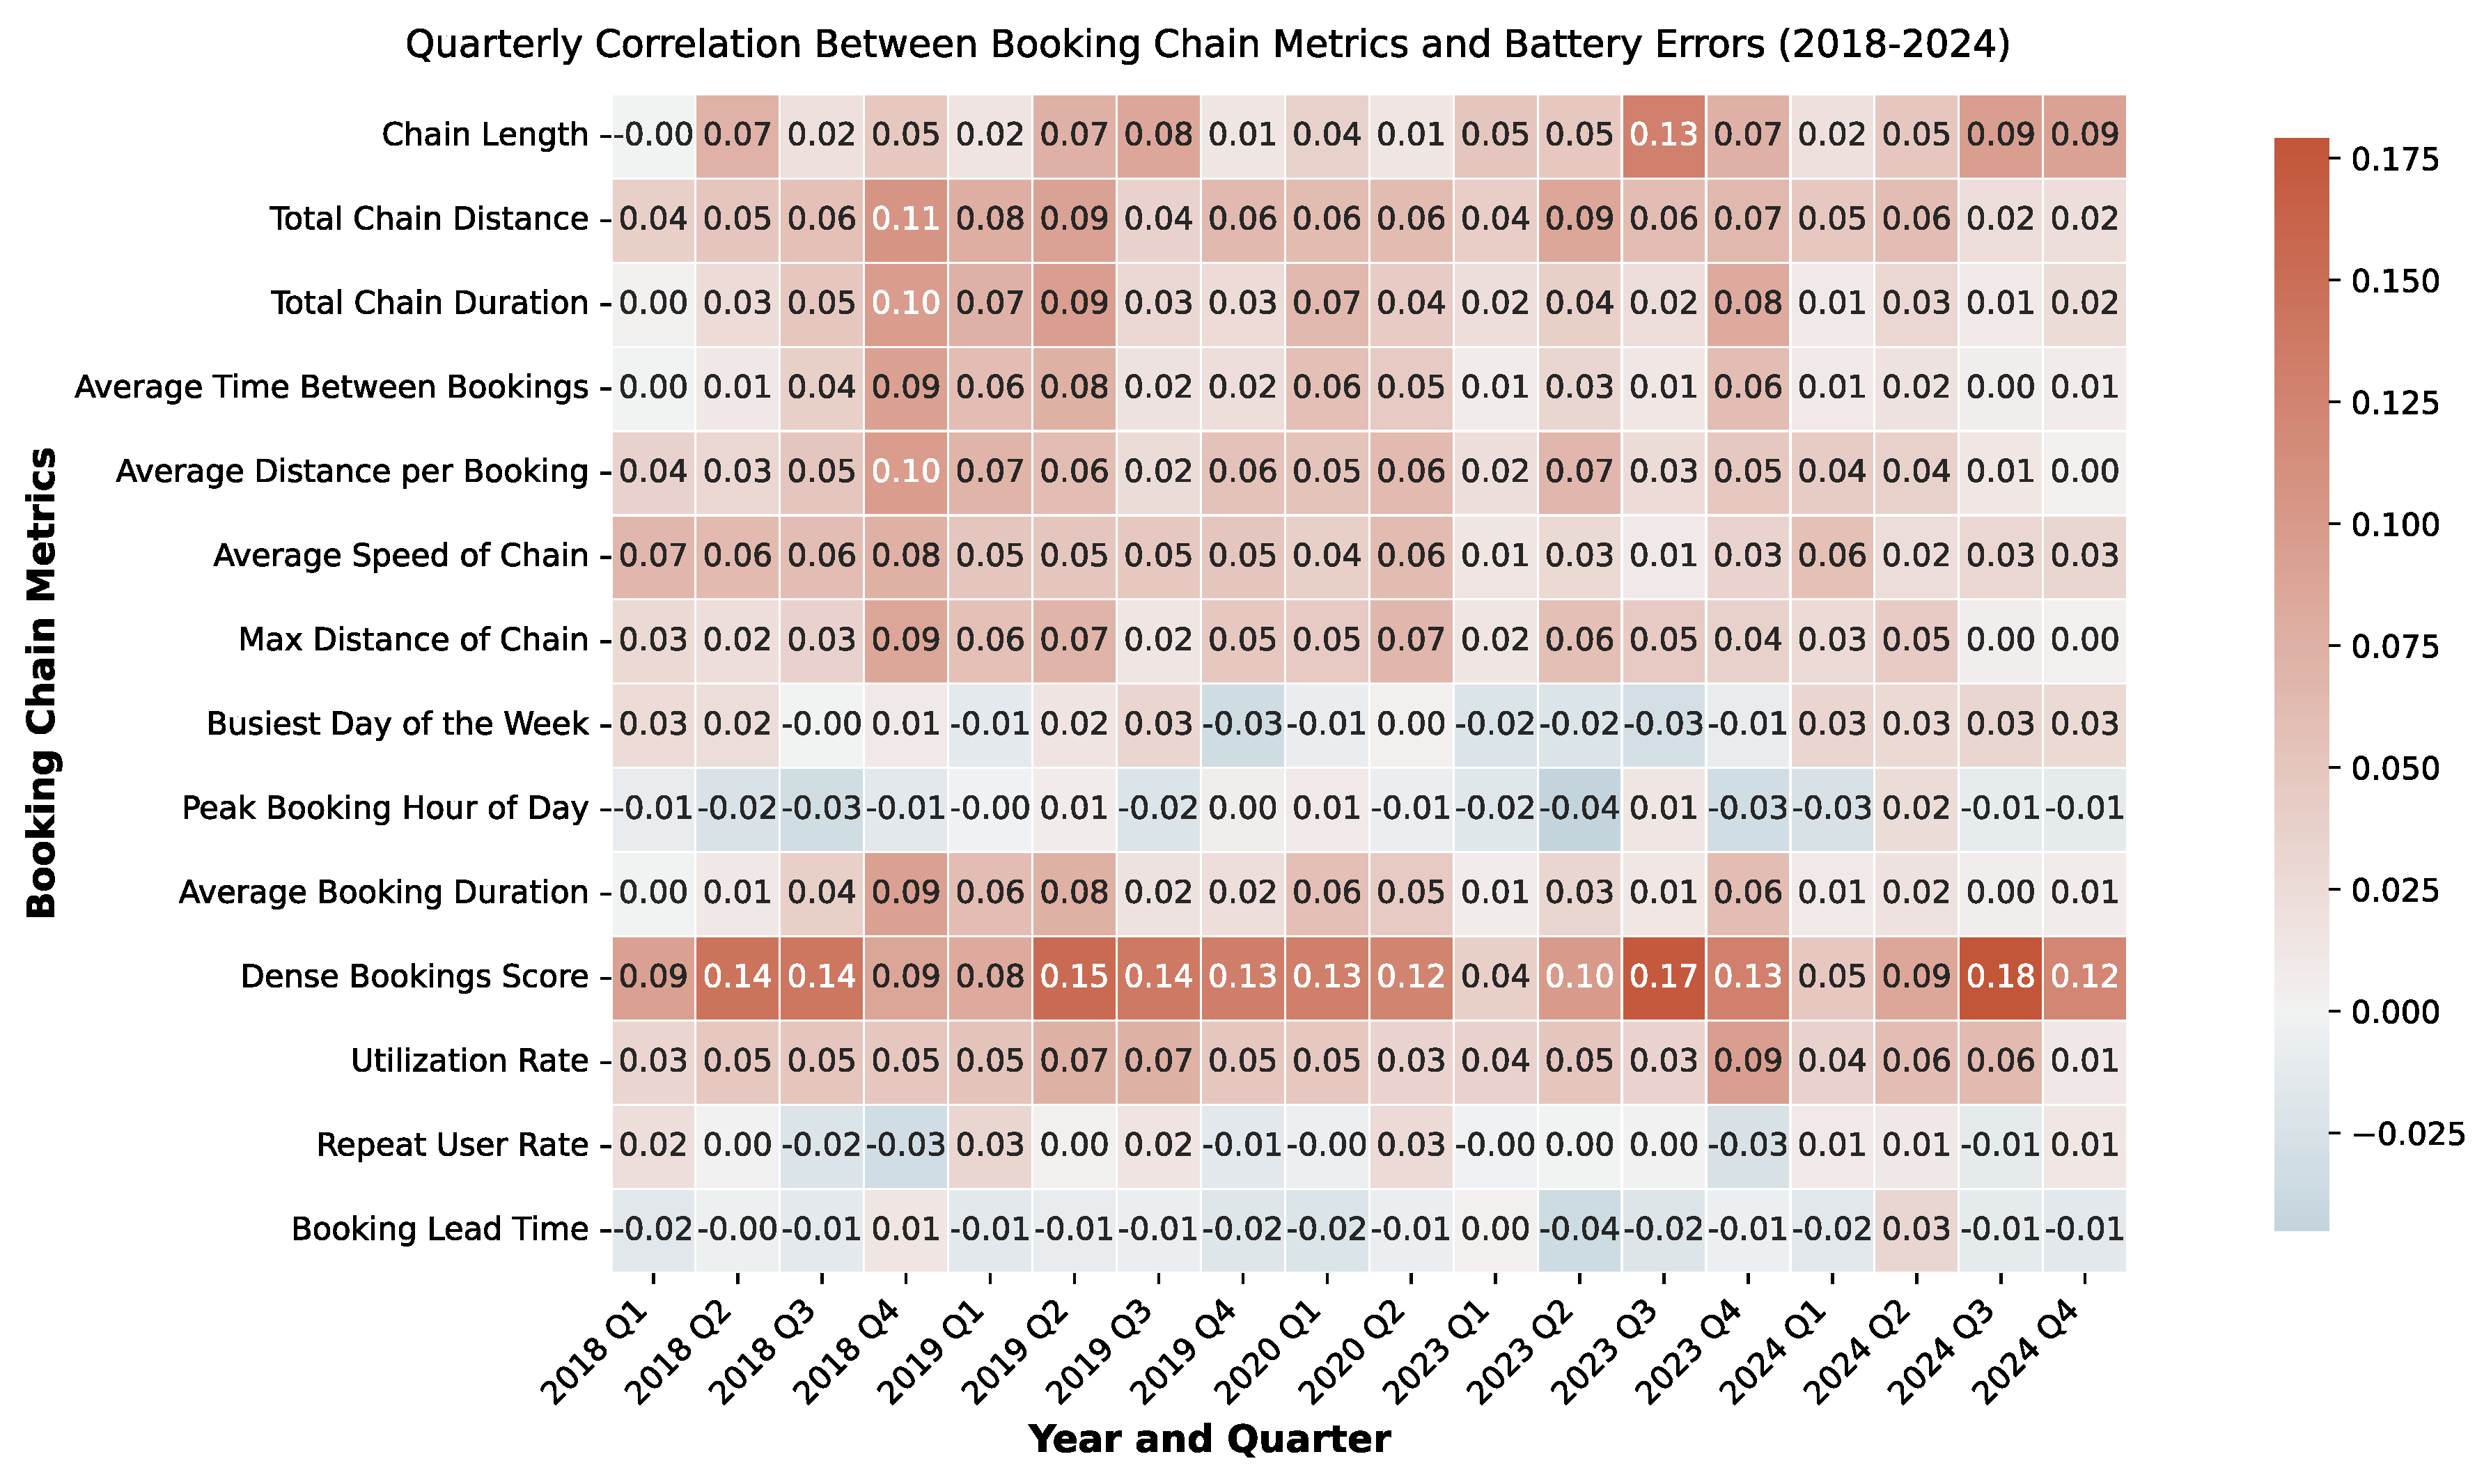
Figure 14.
Aggregated charging distribution over all cars for a typical day.
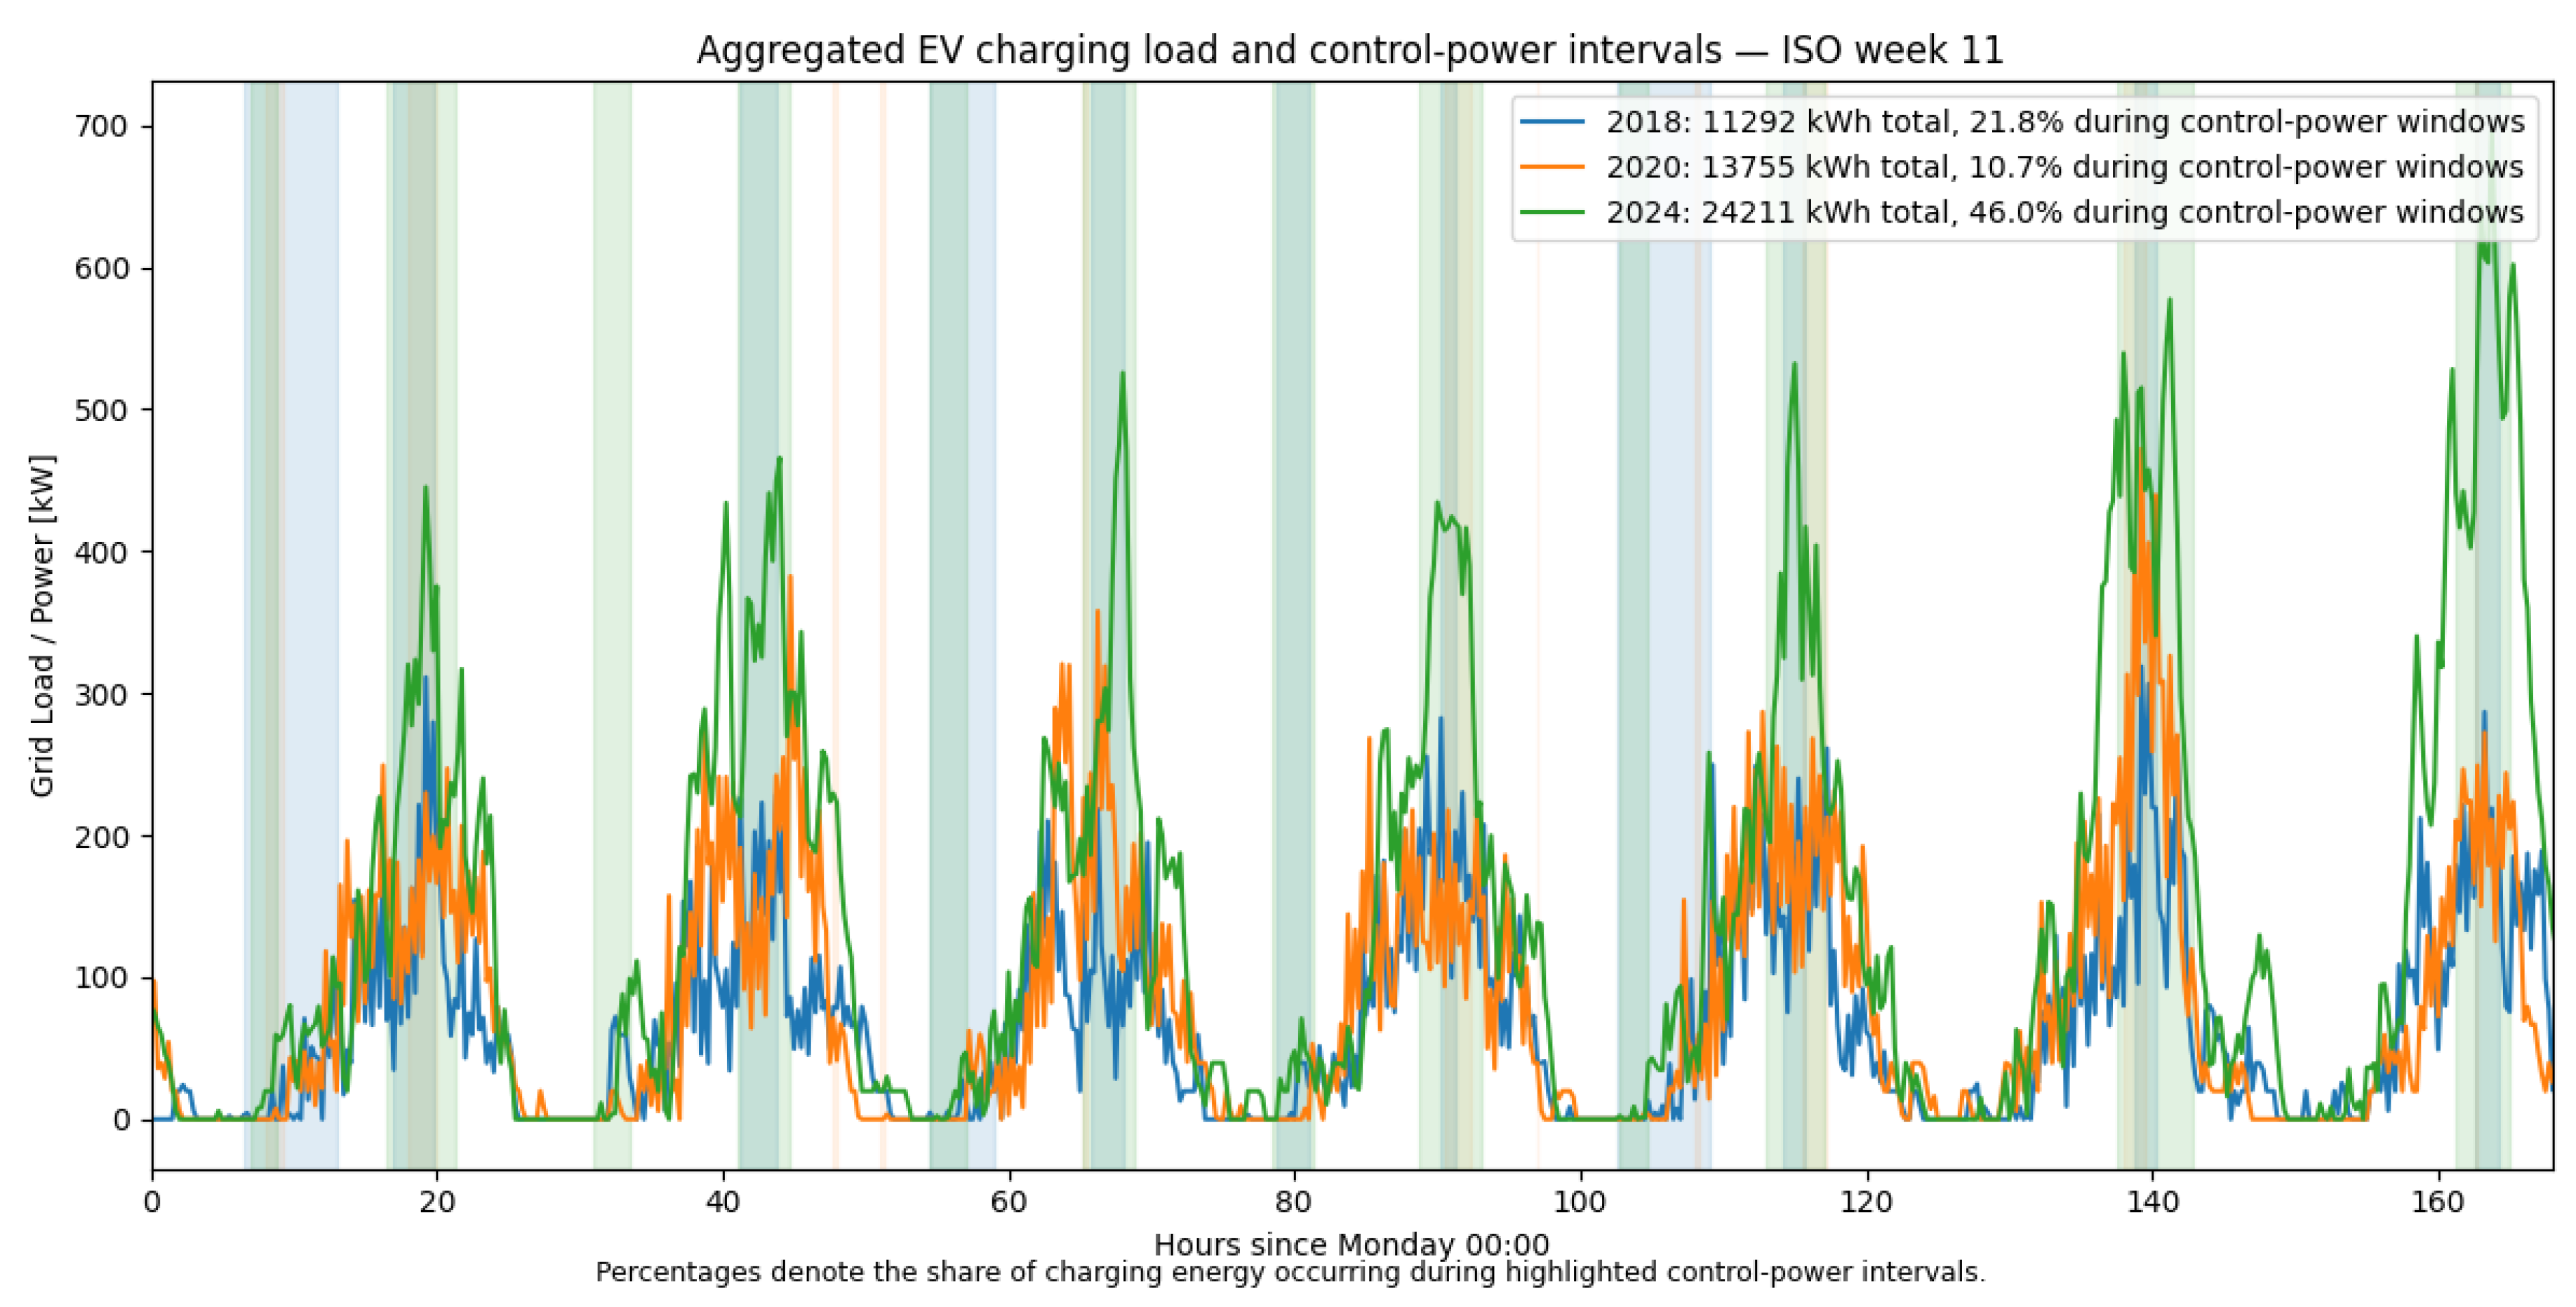

Table 1.
EV and ICEV statistics across two periods.
| Metric | 2018–2020 | 2023–2024 |
|---|---|---|
| Fleet Composition | ||
| Total car fleet | 291 | 375 |
| EV count | 37 | 92 |
| ICEV count | 254 | 283 |
| Open-end fleet | 12 | N/A |
| Trip Statistics | ||
| EV trips | 19,802 | 56,099 |
| ICEV trips | 139,485 | 140,630 |
| % of EV trips | 12.44% | 28.52% |
| % of ICEV trips | 87.56% | 71.48% |
| Distance Covered | ||
| EV kilometers | 672,864 | 2,234,849 |
| ICEV kilometers | 7,439,232 | 9,291,132 |
Table 2.
Car type statistics for two periods: 2018–2020 and 2023–2024. LCVp = Light Commercial Vehicle for passengers; LCVc = Light Commercial Vehicle for cargo. TpC = Trips per Car; kpC = km per Car. The car types from the dataset are mapped to standard automotive classification scheme for easy recognition.
| Car Type | # Fleet | # Trips | # km | TpC | kpC | |||||
|---|---|---|---|---|---|---|---|---|---|---|
| 18–20 | 23–24 | 18–20 | 23–24 | 18–20 | 23–24 | 18–20 | 23–24 | 18–20 | 23–24 | |
| City car | 134 | 130 | 87572 | 68130 | 3560110 | 3687191 | 654 | 524 | 26568 | 28363 |
| Super Mini | 71 | 101 | 33050 | 51285 | 2194112 | 3653206 | 466 | 508 | 30900 | 36170 |
| Compact | 21 | 24 | 10043 | 9952 | 727593 | 887360 | 478 | 415 | 34647 | 36973 |
| Compact Wagon | 14 | 12 | 3369 | 3383 | 385133 | 419752 | 241 | 282 | 27506 | 34979 |
| Multi-purpose van | 2 | 5 | 864 | 1479 | 91860 | 142626 | 432 | 296 | 45930 | 28525 |
| LCVp Bus | 7 | 6 | 1728 | 1823 | 300028 | 264289 | 247 | 304 | 42861 | 44048 |
| LCVc Transporter | 5 | 5 | 2859 | 4578 | 180396 | 236708 | 572 | 916 | 36079 | 47342 |
| Elektro | 37 | 92 | 19802 | 56099 | 672864 | 2234849 | 535 | 610 | 18183 | 24292 |
Table 3.
Car Types and Corresponding EV Information.
| Car Type | ICEV Model | Corresponding EV |
|---|---|---|
| City car | VW up | VW e-up |
| Super Mini | Opel Corsa | Opel Corsa-e |
| Compact | Chevrolet Cruze | Nissan Leaf |
| Compact wagon | Toyota Corolla Kombi | Volkswagen ID.4 |
| Multi-purpose van | Renault Kangoo | Nissan e-NV200 |
| LCVp | Renault Trafic | Renault Trafic Van E-Tech |
| LCVPc | Opel Movano | Movano Electric |
| Elektro | VW | VW e-up |
Table 4.
Car Types and Corresponding EV Information.
| Corresponding EV | Battery Capacity (kWh) | Power Consumption (kWh/km) | Rate per-km |
|---|---|---|---|
| City car | 35 | 0.145 | 0.29 |
| Super Mini | 36 | 0.129 | 0.27 |
| Compact | 40 | 0.14 | 0.32 |
| Compact Wagon | 50 | 0.172 | 0.5 |
| Multi-purpose van | 50 | 0.2 | 0.34 |
| LCVp Bus | 50 | 0.217 | 0.43 |
| LCVc Transporter | 33 | 0.227 | 0.43 |
| Elektro | 35 | 0.145 | 0.29 |
Table 5.
Simulation Results in Figures with Undesired Recharge (UR) events and Service Availability (SA) for the combined dataset.
Table 5.
Simulation Results in Figures with Undesired Recharge (UR) events and Service Availability (SA) for the combined dataset.
| Charging Power | ||
|---|---|---|
| Scenario | Level 2 | Level 3 |
| (19.2 kW) | (350 kW) | |
| I-TLCB | 745 UR | 359 UR |
| 373 123 bookings | 88.07% SA | 88.017% SA |
| E-FULL | 745 UR | 359 UR |
| 329 344 bookings | 99.77% SA | 99.89% SA |
| A-LBRO | 1174 UR | 524 UR |
| 373 123 bookings | 99.69% SA | 99.86% SA |
Disclaimer/Publisher’s Note: The statements, opinions and data contained in all publications are solely those of the individual author(s) and contributor(s) and not of MDPI and/or the editor(s). MDPI and/or the editor(s) disclaim responsibility for any injury to people or property resulting from any ideas, methods, instructions or products referred to in the content. |
© 2026 by the authors. Licensee MDPI, Basel, Switzerland. This article is an open access article distributed under the terms and conditions of the Creative Commons Attribution (CC BY) license (http://creativecommons.org/licenses/by/4.0/).
Copyright: This open access article is published under a Creative Commons CC BY 4.0 license, which permit the free download, distribution, and reuse, provided that the author and preprint are cited in any reuse.


