
Submitted:
25 January 2026
Posted:
26 January 2026
You are already at the latest version
Preprints on COVID-19 and SARS-CoV-2
Abstract
Background: U.S. hospitals continue to invest in digital infrastructure, yet evidence on how health information technology (HIT) capital investment relates to financial performance, particularly after COVID-19, remains mixed.Objective: To estimate associations between HIT capital intensity and hospital profitability from 2018 to 2023, assess nonlinearity, and test whether associations differed during the COVID-19 years. Methods: Using the RAND HCRIS hospital panel (3,480 hospital-year observations from HIT-reporting hospitals, 2018–2023), we defined HIT capital intensity as HIT-designated capital stock divided by total assets. Primary analyses estimated year-specific regressions with HIT-intensity quintiles and spline specifications for nonlinearity, adjusting for hospital size (log total assets) and teaching status. Pooled models incorporated year fixed effects and HIT-intensity interactions with a COVID indicator (2020–2021). Sensitivity analyses included alternative winsorization (5th/95th percentile), hospital-fixed effects, and placebo tests using non-HIT fixed-asset intensity.Results: Reporter rates ranged from 24.6% (2018; 545/2,212) to 19.4% (2023; 982/5,063). In year-specific quintile models, the highest HIT-intensity quintile (Q5) was associated with lower winsorized total margin versus Q1 in 2018 (β = −0.055; p = 0.008), 2019 (β = −0.042; p = 0.016), and 2023 (β = −0.034; p = 0.010), with weaker estimates in 2020–2022. In pooled interaction models, higher-intensity hospitals exhibited a lower margin gap outside COVID years (e.g., Q5: β = −0.041; p < 0.001) with partial attenuation during COVID (Q5×COVID: β = 0.032; p = 0.073). Hospital fixed-effects estimates for quintiles were not statistically significant (Q5: β = −0.015; p = 0.438). A pooled 5/95 winsorization robustness check remained negative for Q5 (β = −0.029; p < 0.001). Placebo analyses showed similar patterns for non-HIT fixed assets (Q5: β = −0.032; p = 0.006). Conclusions: Higher HIT capital intensity is associated with lower profitability at the upper end of the intensity distribution in some years, with suggestive attenuation during COVID-19. However, the fixed-effects and placebo results are consistent with time-invariant confounding or broader capital-intensity dynamics rather than HIT-specific causal effects. Policies targeting financially constrained hospitals may help sustain digital investment while protecting financial stability.
Keywords:
health information technology (HIT)
; hospital profitability
; total margin
; panel data
; fixed-effects regression
; COVID-19 moderation
; robustness and placebo tests
Plain Language Summary
Hospitals continue to spend heavily on digital systems, but it is still unclear whether these investments improve hospital finances. Using national Medicare cost report data from 2018–2023, we measured how “HIT capital intensity” (HIT capital stock as a share of total assets) relates to hospitals’ profit margin among hospitals that reported HIT capital stock. In 2018, 2019, and 2023, hospitals with the highest HIT intensity had lower profit margins than those with the lowest intensity; differences were smaller and not statistically clear in 2020–2022. During the COVID-19 years (2020–2021), the margin gap for higher-intensity hospitals appeared smaller. However, results were not significant in within-hospital fixed-effects models, and a placebo test using non-HIT assets showed similar patterns, suggesting the observed relationships may reflect broader capital structure or stable hospital characteristics rather than HIT itself causing lower profits.
1. Introduction
1.1. Background and Motivation
Hospitals’ adoption and implementation of electronic health records accelerated after major federal policy initiatives—most notably the Health Information Technology for Economic and Clinical Health (HITECH) Act—intended to speed EHR uptake through incentive payments tied to “meaningful use.”[1] The Meaningful Use regulation operationalized these incentives by specifying program objectives and associated reporting requirements, shaping hospitals’ health IT priorities.[2]
Despite sustained spending, the relationship between HIT investment and hospital financial performance remains unsettled. Evidence syntheses have generally found positive effects of HIT on quality and process outcomes, but financial returns are less consistently demonstrated and may vary by context, implementation approach, and horizon. [3,4,5] Mechanisms plausibly operate in both directions: HIT can improve efficiency, coordination, and revenue cycle performance, but it also imposes up-front capital and ongoing implementation costs (training, workflow redesign, maintenance, vendor lock-in) that may depress margins—particularly during periods of operational stress. [4,5,6]
The question is especially salient in the post-2018 period, which combines a more mature HIT environment with major shocks to hospital operations and finances. COVID-19 created abrupt revenue disruptions (e.g., elective procedure pauses) and simultaneous demand for digital capabilities (telehealth, analytics, coordination), intensifying concerns about hospital liquidity and financial resilience. [7] These conditions make it timely to re-examine how HIT capital intensity relates to profitability and whether associations differ during COVID-era years.
1.2. Gap in the Literature
Prior work leaves four specific gaps that motivate this study.
- Distributional/nonlinear effects. Average effects may obscure nonlinearity: moderate HIT capital intensity may be compatible with positive returns, while very high intensity could reflect costly overinvestment, integration burden, or correlated structural features (system affiliation, service mix) that are themselves margin-relevant. Empirical tests of nonlinearity remain limited. [6]
- Recent period and COVID-era heterogeneity. Evidence focused on earlier adoption eras may not generalize to 2018–2023, when HIT is more embedded, and when COVID-era disruptions altered both care delivery and financial conditions. [7]
- Specificity and credibility checks. Associations may reflect broader capital intensity or stable hospital characteristics rather than HIT-specific effects. Placebo-style checks and within-hospital (fixed-effects) contrasts are not routinely deployed in this literature, limiting interpretability. [4,5,6]
1.3. Study Contribution and Overview
We address these gaps using a hospital balance-sheet approach to HIT investment and a design that emphasizes pattern testing (distributional structure, nonlinearity, COVID moderation, and credibility checks). We leverage the RAND-enhanced HCRIS hospital panel—built from Medicare hospital cost reports and value-added fields—because it provides consistent multi-year financial statement elements needed to construct capital intensity measures. [8] Cost reports are a core administrative source for hospital financial and utilization information, maintained by CMS in HCRIS. [9]
1.4. Research Questions (RQs)
RQ1.
Among hospitals reporting HIT-designated capital stock, how is HIT capital intensity associated with total margin in each year 2018–2023?
RQ2.
Is the association nonlinear (concentrated at higher intensity levels)?
RQ3.
Does the association differ during the COVID years (2020–2021) versus other years?
RQ4.
To what extent are observed associations consistent with within-hospital change (vs time-invariant hospital differences) and with HIT-specific effects (vs general capital intensity)?
1.5. Hypotheses
H1 (cross-sectional association):
Higher HIT capital intensity—especially the top quintile—will be associated with lower total margin (relative to Q1) in at least some years.
H2 (nonlinearity):
Any negative association will be concentrated at higher intensity levels (upper quintiles / upper spline segment).
H3 (COVID moderation):
The negative margin gap at higher intensity will be attenuated during 2020–2021 (positive interaction terms).
H4 (credibility checks):
If associations reflect time-invariant confounding or broader capital dynamics, then (a) hospital fixed-effects estimates will attenuate toward zero, and/or (b) placebo capital-intensity measures will show similar patterns.
2. Methods
2.1. Data Source and Sample
We used the RAND HCRIS calendar-year hospital panel (2024 release), which harmonizes Medicare hospital cost-report information from the Healthcare Cost Report Information System (HCRIS) into a longitudinal analytic file. [8,9] We restricted the study period to calendar years 2018–FY2023 to capture a mature post-adoption HIT environment and the COVID-era financial disruption years.
Within each fiscal year, we restricted the sample to hospitals with total assets ≥ $1,000,000 and selected one observation per Medicare provider-year using a completeness rule prioritizing nonmissing HIT stock, HIT payments, and total margin; remaining ties were resolved by selecting the record with the largest total assets. Primary analyses were restricted to “HIT reporters,” defined as hospital-years with nonmissing and nonnegative HIT-designated capital stock. This reporter restriction improves measurement of the primary exposure but also implies nonrandom selection into reporting, which we treat explicitly as a limitation (see Robustness/Reporting). The attenuation under hospital fixed effects and the similar placebo patterns suggest that observed associations may reflect time-invariant hospital characteristics or broader capital-intensity dynamics rather than HIT-specific impacts.
Data cleaning and construction. We applied prespecified cleaning steps, including provider-year deduplication using the completeness rule described above, exclusion of hospitals with total assets < $1,000,000, restriction to nonmissing and nonnegative HIT-designated capital stock for the reporter sample, and within-year winsorization of total margin; HIT intensity quintiles and spline knots were computed within year among reporters.
2.2. Variables and Measures
Outcome (profitability). The outcome was total margin. For year-specific models, margins were winsorized at the 1st/99th percentiles within year among HIT reporters to reduce leverage from extreme values, consistent with the distributional characteristics of cost-report financial items. A pooled 5th/95th winsorization was used as a sensitivity specification.
Exposure (HIT capital intensity). The primary exposure was HIT capital intensity, defined as HIT-designated capital stock (ending balance) divided by total assets. Because the distribution of HIT capital intensity is right-skewed among reporters (Figure 1), we operationalized exposure in two complementary ways:
- Quintiles (Q1–Q5) defined within year among HIT reporters (Q1 as reference), and
- Spline specification using ln(1 + HIT intensity) with knots at the 25th/50th/75th percentiles within year, to test whether slope changes are concentrated in the upper range.
Covariates. All models adjusted for hospital size (log total assets) and teaching status (major teaching vs non-teaching, as available). Pooled models included year indicators and a COVID-period indicator (2020–2021). If state fixed effects are included in the pooled specification, we report this explicitly and interpret them as controls for time-invariant state-level differences.
Placebo exposure (specificity check). To assess whether observed patterns are HIT-specific versus reflecting broader capital intensity, we constructed a placebo measure: non-HIT fixed asset intensity (non-HIT fixed assets divided by total assets), estimated in otherwise identical models. Because non-HIT fixed assets may be missing or inconsistently reported for some provider-years, placebo analyses are interpreted as credibility checks rather than definitive falsification tests.
Variable construction and field definitions. All analytic variables were constructed from RAND’s standardized HCRIS-derived fields; a complete crosswalk of source fields and transformations (HIT capital stock, total assets, total margin, teaching indicator, and derived intensity measures).
2.3. Statistical Analysis Plan (tied to RQs/Hs)
All analyses used OLS with robust standard errors and were conducted in Stata 18 (StataCorp LLC). Stata Statistical Software. College Station, TX: StataCorp LLC. [10]
A1 (RQ1/H1): Year-specific quintile models. For each year , we estimated:
with Q1 as the reference category. This specification tests whether the highest-intensity group (Q5) differs from the lowest (Q1) within each year.
A2 (RQ2/H2): Nonlinearity via spline models. Within each year, we fit two-segment linear spline models in ln(1 + HIT intensity) with knots at the p25/p50/p75 cut points (estimated among reporters). The nonlinearity test assesses whether the slope in the upper segment differs from that in the lower segment, consistent with diminishing returns or high-intensity strain.
A3 (RQ3/H3): Pooled moderation model. We estimated a pooled model including year indicators and HIT quintile × COVID interactions (COVID = 1 for 2020–2021). The interaction terms test whether the margin gap for higher intensity hospitals is attenuated during the COVID years.
A4 (RQ4/H4): Credibility checks.
- Hospital fixed effects (within-hospital change): We estimated a pooled hospital-fixed-effects model among reporters to assess whether within-hospital changes in HIT intensity quintile track within-hospital changes in margin, recognizing that identification relies on within-hospital variation and controls only for time-invariant unobservables. Standard panel-data reasoning motivates interpreting differences between cross-sectional and fixed-effects estimates as evidence about stable confounding. [11]
- Placebo models: We re-estimated A1–A3 using non-HIT fixed asset intensity quintiles to evaluate specificity.
- Oster bounds: We used the coefficient stability approach to characterize sensitivity to omitted variable bias as an exploratory robustness check, interpreting results cautiously given assumptions required for extrapolation and the fact that stability metrics can behave poorly when the baseline is low, or coefficient movements are small. [12]
Missing data. Analyses used complete-case observations within the HIT-reporter hospital-year sample; missingness in the primary exposure is reflected in HIT stock reporting rates by year, and the placebo analysis was conducted on the subset with non-HIT fixed asset values observed.
2.4. Reporting and Robustness
We report this observational study in accordance with the STROBE statement and the RECORD extension for routinely collected health data (see Table A1 and Table A2). We pre-specify primary versus sensitivity analyses (primary: year-specific reporter-only quintile and spline models with 1/99 winsorization; sensitivity: pooled 5/95 winsorization, fixed effects, placebo, and Oster). We also document potential selection into HIT reporting and its implications for generalizability.
3. Results
3.1. Sample Characteristics
Across 2018–2023, HIT stock reporting among eligible hospitals declined from 24.6% in 2018 (545/2,212) to 19.4% in 2023 (982/5,063). Among reporters, HIT capital intensity was right-skewed (illustrated in FY2023; Figure 1), consistent with a small number of hospitals reporting very high HIT capital intensity values.
Accordingly, we used within-year intensity quintiles and flexible spline specifications for ln(1+intensity) to reduce sensitivity to extreme values and to assess nonlinearity in the descriptive statistics.
3.2. RQ1/H1: Year-Specific Quintile Associations (Table 2; Figure 2; Figure 3)
In year-specific reporter-only OLS models with winsorized total margin (p1/p99 within year), higher HIT intensity was associated with lower margins in selected years, concentrated at the top quintile.
- 2018: Q5 vs Q1 β = −0.055 (p = 0.008; SE = 0.021; ~95% CI −0.096 to −0.015) and Q3 vs Q1 β = −0.040 (p = 0.011; SE = 0.016).
- 2019: Q5 vs Q1 β = −0.042 (p = 0.016; SE = 0.017; ~95% CI −0.077 to −0.008).
- 2020–2022: estimates were smaller and not statistically distinguishable from zero (e.g., 2020 Q5 β = −0.031, p = 0.293; 2022 Q5 β = −0.004, p = 0.829).
- 2023: Q5 vs Q1 β = −0.034 (p = 0.010; SE = 0.013; ~95% CI −0.060 to −0.008).
3.3. RQ2/H2: Nonlinearity
Spline models of ln(1 + HIT intensity) provided mixed evidence of nonlinearity by year. In 2021 and 2023, the post-knot slope term (l2) was negative and statistically significant for at least some knot choices, consistent with more negative associations concentrated in higher-intensity ranges. For FY2023, l2 was negative and statistically significant across knot placements (p25: p<0.001; p50: p=0.001; p75: p=0.005), indicating a more negative slope at higher levels of ln(1+intensity). In contrast, for 2018–2020 and 2022, slope changes were generally not statistically significant.
Spline results are shown in Table 3,
3.4. RQ3/H3: COVID Moderation
In pooled models with year indicators, higher HIT-intensity quintiles were associated with lower margins in non-COVID years (e.g., Q5 main effect β = −0.041; p<0.001). Interaction terms indicate partial attenuation during COVID years (2020–2021): Q4×COVID β = 0.033 (p = 0.029) and Q5×COVID β = 0.032 (p = 0.073). Interpreted as net COVID-year effects, Q5’s estimated gap vs Q1 was smaller during COVID years (≈ −0.041 + 0.032 = −0.009), while Q4’s net effect was near zero or slightly positive (≈ −0.021 + 0.033 = +0.012).
COVID interaction results are reported in Table 4 (pooled model).
3.5. RQ4/H4: Credibility Checks (FE + Robustness + Placebo)
In the pooled hospital fixed-effects model, HIT quintile indicators were not statistically significant (e.g., Q5 β = −0.015; p = 0.438), consistent with attenuation when using within-hospital rather than between-hospital variation. In robustness analyses using pooled 5th/95th winsorization of the raw margin outcome, the Q5 association remained negative (β = −0.029; p<0.001). In placebo models using non-HIT fixed-asset intensity quintiles (subset), the top quintile was also negatively associated with margins (Q5 β = −0.032; p = 0.006), consistent with the possibility that pooled associations reflect broader capital intensity or hospital type rather than HIT-specific effects.
4. Discussion
4.1. Principal Findings
Using a balance-sheet-based HIT capital intensity measure among HIT stock reporters (Table 1), higher HIT capital intensity, especially Q5, was associated with lower adjusted total margin in 2018, 2019, and 2023 (Table 2; Figure 3), with weaker and statistically non-distinguishable associations in 2020–2022. Evidence for nonlinearity was mixed, but upper-range associations were more consistently negative in 2021 and 2023 (Table 3). In pooled interaction models, COVID-year interactions suggested attenuation of the negative association in 2020–2021, but fixed-effects and placebo patterns caution against a HIT-specific causal interpretation.
4.2. RQ1/H1: Interpreting the Year-by-Year Results
The Q5 vs Q1 estimates should be read as conditional cross-sectional associations among reporters, not causal effects (Table 2). The across-year variation—including weaker effects in 2020–2022—fits a literature in which HIT–performance links vary by context, implementation, and complementary capabilities, and are not uniformly positive or negative. [15,16,17] In your data, the “re-emergence” of a negative Q5 association in 2023 is compatible with a high-capital-intensity burden interpretation (e.g., depreciation/financing and broader fixed-cost structure) rather than a clean “HIT payoff” story.
4.3. RQ2/H2: Nonlinearity (Upper-Tail Strain vs Diminishing Returns)
Where spline models show a more negative upper-segment slope (notably 2021 and 2023; Table 3), the most defensible interpretation is upper-tail strain/diminishing returns: at very high capital intensity, incremental digital capital may correlate with higher fixed costs, greater implementation burden, or organizational disruption unless matched by complementary process/workforce investments.20,21 This framing remains hypothesis-generating because the splines do not identify mechanisms, only shape.
4.4. RQ3/H3: COVID Moderation
The pooled interaction results are best framed as suggestive attenuation of the negative Q5 association during 2020–2021 (interaction terms near conventional thresholds). A cautious hypothesis is that pre-existing digital capacity may have supported operational adaptation during disruption (e.g., workflow reconfiguration, rapid scaling of virtual modalities), even if it did not translate into uniformly higher margins. This interpretation is consistent with broader evidence that the value of HIT is context-dependent and often hinges on complementary organizational changes. [1,17]
4.5. RQ4/H4: Why this Should not be Framed as Causal
Two outputs directly weaken causal language: (1) fixed-effects attenuation toward null indicates that between-hospital differences (time-invariant factors like baseline strategy, service mix, market position) likely drive much of the cross-sectional association; and (2) the placebo association with non-HIT fixed-asset intensity implies the pattern may reflect broader capital structure rather than HIT-specific dynamics. Together, the defensible conclusion is that high HIT capital intensity is a marker of lower margins in some years among reporters, not evidence that “HIT reduces margins.”
4.6. Strengths
Recent national cost-report-based panel covering 2018–2023; balance-sheet-based exposure definition (capital-stock framing); explicit tests for nonlinearity; COVID moderation test; and transparent robustness/credibility checks (FE and placebo).
4.7. Limitations and Future Research
Selection into HIT capital-stock reporting is limited and plausibly non-random, constraining external validity. The exposure measure may be heterogeneous across hospitals because “HIT-designated” capital can reflect differences in capitalization and coding practices, raising concerns about measurement comparability. The current specification includes a limited set of covariates, leaving residual confounding plausible; the unbalanced panel also reduces within-hospital leverage, consistent with the attenuation of effects under fixed effects. In addition, the placebo outcome is available only for a subset, and the IV approach is not informative given the extremely small complete-case sample, reinforcing the need to frame results as associative and to motivate stronger designs and richer data in future work.
4.8. Implications
Policy and management implications. The COVID-19 period illustrates why short-run margin effects should not be over-interpreted as “returns” to any single investment category. Peer-reviewed evidence shows that operating margins fell early in the pandemic while total margins were partly buffered by nonoperating revenue and relief funds, with vulnerability concentrated among certain hospital types (notably smaller and rural facilities). [18] At the same time, analyses of the Provider Relief Fund indicate that relief payments largely offset losses rather than systematically increasing profits, and that effects were concentrated among hospitals that were financially vulnerable pre-pandemic. [19] Against this backdrop, our finding that the negative high-intensity margin gap appears to narrow during the COVID years is consistent with the idea that system-wide shocks and temporary financing can materially reshape profitability signals, making it inappropriate to infer durable “margin gains” from higher HIT capital intensity during crisis periods. [18,19] A defensible implication is that if policy aims to sustain digital capability during shocks, support should be targeted toward financially constrained hospitals to prevent underinvestment or destabilization, rather than assuming uniform incentives will translate into improved margins. [18,19] Finally, evidence that administrative costs remain substantial—and that computerization alone does not necessarily reduce administrative burden—reinforces the managerial implication that any value from digital capital is likely contingent on complementary operational changes (workflow redesign, staffing models, and governance), not capital accumulation alone. [20]
5. Conclusion
In this national cost-report panel restricted to hospital-years reporting HIT-designated capital stock, higher HIT capital intensity—particularly the top quintile—was associated with lower adjusted total margin in 2018, 2019, and 2023, but not consistently in 2020–2022. Pooled interaction results suggested partial attenuation of this negative association during the COVID years (2020–2021), though the evidence was modest. Fixed-effects attenuation and a similar placebo pattern using non-HIT fixed-asset intensity suggest that stable between-hospital differences and broader capital-structure dynamics may explain much of the observed association, limiting HIT-specific causal interpretation. Future work should use richer covariates and designs better suited to causal inference (e.g., linked claims and market data, quasi-experimental shocks, and stronger instruments).
Funding
No specific grant or external funding was received for this study.
Ethical Approval
In accordance with federal regulations (45 CFR 46), institutional review board (IRB) approval was not required because no human subjects were involved.
Data Availability Statement
The Medicare hospital panel used in this study was obtained from the RAND Corporation’s HCRIS-derived data, accessed under a data use agreement. Due to licensing restrictions, redistribution of these data is not permitted. Interested researchers may request access directly from RAND under the same terms. Replication code and documentation to reproduce all results (conditional on data access) are publicly available via the Open Science Framework (OSF):.
Competing Interests
The authors declare no potential conflicts of interest with respect to the research, authorship, or publication of this article.
Data Citation
White C. RAND Hospital Data: Web-Based Tool. TL-303. RAND Corporation; 2024. Available from: https://www.rand.org/pubs/tools/TL303.html.
Appendix A

Table A1.
— STROBE checklist.
| Section | Item No. | Recommendation | Where addressed in your manuscript |
| Title/Abstract | 1a | Indicate study design in title/abstract | Title/Abstract: observational study using RAND HCRIS hospital panel; year-specific regressions and pooled panel models |
| Title/Abstract | 1b | Informative, balanced abstract | Abstract: Background, Objective, Methods, Results, Conclusions |
| Introduction | 2 | Scientific background and rationale | Introduction 1.1–1.3 (HITECH context; mixed evidence; post-2018 + COVID motivation) |
| Introduction | 3 | Objectives and prespecified hypotheses | Introduction 1.4 (RQs) and 1.5 (Hypotheses H1–H4) |
| Methods | 4 | Key elements of study design early | Methods 2.1 and 2.3 (year-specific cross-sections + pooled panel; FE; placebo) |
| Methods | 5 | Setting, locations, relevant dates | Methods 2.1 (U.S. hospitals; FY2018–FY2023; COVID years 2020–2021) |
| Methods | 6a | Eligibility criteria and selection methods | Methods 2.1 (assets ≥ $1M; dedup rule; “HIT reporters” definition; one record/provider-year) |
| Methods | 7 | Define outcomes/exposures/confounders | Methods 2.2 (total margin; HIT intensity; covariates; placebo exposure) |
| Methods | 8* | Data sources & measurement; comparability | Methods 2.1–2.2 (RAND HCRIS-derived measures; construction of HIT stock, assets, margin; reporting restriction noted) |
| Methods | 9 | Address potential sources of bias | Methods 2.1 (nonrandom reporting) + 2.4 (reporting/robustness); Discussion limitations (selection, measurement heterogeneity, confounding) |
| Methods | 10 | Explain study size | Methods 2.1 (panel size; reporter-only analytic restriction) + Results 3.1 (reporter counts by year) |
| Methods | 11 | Handling quantitative variables/groupings | Methods 2.2 (winsorization; quintiles; ln(1+intensity) splines; knot selection) |
| Methods | 12a | Statistical methods and confounding control | Methods 2.3 (OLS; robust/clustered SEs; covariates; year FE; COVID indicator) |
| Methods | 12b | Subgroups/interactions | Methods 2.3 A3 (HIT quintile × COVID interactions) |
| Methods | 12c | Missing data handling | Methods 2.1 (completeness rule; reporter restriction); Results 3.1 (reporting rates). Add explicit sentence if desired: “Analyses used complete-case within reporter-years; missingness described via reporting rates.” |
| Methods | 12d | Sampling strategy methods | Not applicable (administrative panel; no complex survey sampling) |
| Methods | 12e | Sensitivity analyses | Methods 2.3 A4 and 2.4 (5/95 winsorization; FE; placebo; Oster) |
| Results | 13a* | Numbers at each stage | Results 3.1 (eligible hospitals by year; reporter counts; analytic Ns in tables) |
| Results | 13b* | Reasons for non-participation | Not applicable in human-subject sense; instead: reporting restriction explained (HIT stock missing/nonreported) |
| Results | 13c* | Flow diagram | Not Applicable |
| Results | 14a* | Participant characteristics/confounders | Results Table 1 (assets, margins, teaching %, HIT intensity among reporters) |
| Results | 14b* | Missing data per variable | Partially addressed via reporter/non-reporter counts; consider adding a brief missingness table/statement for key variables. |
| Results | 15* | Outcome events/summary measures | Results Table 1 (margin summaries) + Table 2, Table 3, Table 4, Table 5, Table 6 and Table 7 (regression outcomes) |
| Results | 16a | Unadjusted/adjusted estimates + precision | Results 3.2–3.5 and Table 2, Table 3, Table 4, Table 5, Table 6 and Table 7 (adjusted coefficients with SEs/p-values; clarify CI presentation if desired) |
| Results | 16b | Category boundaries for categorized variables | Methods 2.2 (within-year quintiles; knots at p25/p50/p75). Consider adding: “Quintile cut points available on request / in supplement.” |
| Results | 16c | Translate relative to absolute risk | Not applicable (continuous margin outcome) |
| Results | 17 | Other analyses (subgroups/sensitivity) | Results 3.3–3.5 (splines; COVID interactions; FE; robustness; placebo; Oster) |
| Discussion | 18 | Summarize key results vs objectives | Discussion 4.1–4.5 |
| Discussion | 19 | Limitations (bias/imprecision direction/magnitude) | Discussion 4.7 + 4.5 (noncausal framing; selection into reporting; measurement/coding heterogeneity; residual confounding) |
| Discussion | 20 | Cautious overall interpretation | Discussion 4.5 and Conclusion (explicitly noncausal; FE+placebo caution) |
| Discussion | 21 | Generalisability | Discussion 4.7 and 4.8 (external validity limited to reporters; broader generalization cautioned) |
| Other | 22 | Funding and role of funders | No specific funding received |
* For cross-sectional STROBE wording (“participants”), interpret as “hospital-year observations” and “eligible hospitals/provider-years.”.
Table A2.
RECORD Statement—Checklist for studies using routinely collected health data.
| RECORD item | STROBE item | Recommendation (RECORD) | Where addressed in your manuscript / what to add |
| 1.1 | 1 | Indicate in the title/abstract that the study used routinely collected health data | Abstract/Methods already states RAND HCRIS hospital panel; routinely collected Medicare cost-report data (HCRIS). |
| 1.2 | 1 | If applicable, state the type of data, database name, geographic region, and timeframe | Methods 2.1: RAND HCRIS calendar-year hospital panel (2024 release), U.S., FY2018–FY2023. |
| 1.3 | 1 | If linkage was performed, state this clearly in title/abstract | No individual-level linkage was performed; analyses used the RAND-enhanced HCRIS panel. |
| 6.1 | 6 | Describe methods of population selection, including codes/algorithms used to identify the study population | Methods 2.1 gives inclusion rules (assets ≥ $1M, dedup, reporter definition). |
| 6.2 | 6 | Provide validation of codes/algorithms if available; otherwise explain why not | We relied on RAND’s standardized construction of HCRIS elements; we did not independently validate provider-type classification beyond RAND documentation. |
| 6.3 | 6 | If linkage was conducted, show flow diagram with linkage success | Not applicable. |
| 7.1 | 7 | Provide a complete list of codes/algorithms used to define exposures, outcomes, confounders | Define variables conceptually in Methods 2.2. HIT capital stock field, total assets field, margin components) and transformations (winsor cut points, ln(assets), ln(1+intensity)). |
| 7.2 | 8 | Describe data cleaning methods | In the method section |
| 7.3 | 8 | If linkage across databases was done, describe linkage methods and quality | Not applicable. |
| 8.1 | 8 | Describe data sources and measurement and comparability | Methods 2.1–2.2 HIT-designated capital may reflect differences in capitalization/coding across hospitals; we address this as a limitation and via placebo/FE checks. |
| 9 | 9 | Describe efforts to address bias | We have (reporter restriction + limitations + placebo/FE). Selection into HIT reporting may be nonrandom; we report reporting rates and interpret associations as conditional on reporting. |
| 10 | 10 | Explain how study size was arrived at | Covered (panel + restrictions + reporter-only). |
| 11 | 11 | Explain quantitative variable handling | Covered (winsorization, quintiles, splines). Quintiles were computed within year among reporters; spline knots were set at within-year p25/p50/p75 of ln(1+intensity). |
| 12.1 | 12 | Describe statistical methods incl. confounding control | Covered (OLS, covariates, year FE, COVID interaction, FE, placebo, Oster). |
| 12.2 | 12 | Describe methods for missing data | Partly covered via “HIT reporters” definition. Analyses were complete-case within the reporter-year sample; missingness is summarized via HIT-stock reporting rates by year (Table 1). |
| 12.3 | 12 | If linkage performed, describe methods to assess linkage quality and its effect | Not applicable. |
| 13.1 | 13 | Describe selection of persons/records—include a flow diagram if useful | Eligible hospital-years → apply assets threshold → deduplicate provider-year → define reporters → analytic N. |
| 13.2 | 14 | Provide descriptive characteristics, including data completeness | Table 1 covers characteristics; (e.g., teaching status availability if incomplete; placebo subset availability). |
| 13.3 | 14 | If linkage performed, show numbers linked/unlink | Not applicable |
| 19.1 | 19 | Discuss implications of using routinely collected data: misclassification, unmeasured confounding, missing data, changing eligibility over time | Limitations 4.7 largely covers this. Changes in reporting practices over 2018–2023 may affect observed reporting rates and measurement consistency. |
| 22.1 | 22 | Provide information on how to access protocol, raw data, and programming code | Replication code and logs are available on OSF; RAND HCRIS-derived data are available via RAND under a data use agreement and cannot be redistributed. |
References
- Adler-Milstein, J.; Jha, A.K. HITECH Act Drove Large Gains In Hospital Electronic Health Record Adoption. Heal. Aff. 2017, 36, 1416–1422. [Google Scholar] [CrossRef] [PubMed]
- Blumenthal, D.; Tavenner, M. The “Meaningful Use” Regulation for Electronic Health Records. New Engl. J. Med. 2010, 363, 501–504. [Google Scholar] [CrossRef] [PubMed]
- Buntin, M.B.; Burke, M.F.; Hoaglin, M.C.; Blumenthal, D. The Benefits Of Health Information Technology: A Review Of The Recent Literature Shows Predominantly Positive Results. Heal. Aff. 2011, 30, 464–471. [Google Scholar] [CrossRef] [PubMed]
- Low, A.F.H.; Phillips, A.B.; Ancker, J.S.; Patel, A.R.; Kern, L.M.; Kaushal, R. Financial effects of health information technology: a systematic review. 2013, 19, SP369–76. [Google Scholar] [PubMed]
- Modi, S.; Feldman, S.S. The Value of Electronic Health Records Since the Health Information Technology for Economic and Clinical Health Act: Systematic Review. 2022, 10, e37283. [Google Scholar] [CrossRef] [PubMed]
- Wang, T.; Wang, Y.; McLeod, A. Do health information technology investments impact hospital financial performance and productivity? Int. J. Account. Inf. Syst. 2018, 28, 1–13. [Google Scholar] [CrossRef]
- Khullar, D.; Bond, A.M.; Schpero, W.L. COVID-19 and the Financial Health of US Hospitals. JAMA 2020, 323, 2127–2128. [Google Scholar] [CrossRef] [PubMed]
- White, C. RAND Hospital Data: Web-Based Tool; Rand Corporation: Santa Monica, CA, United States, 2018; Available online: https://www.rand.org/pubs/tools/TL303.html#citation.
- Centers for Medicare; Medicaid Services. Cost Reports (HCRIS overview). Available online: https://www.cms.gov/data-research/statistics-trends-and-reports/cost-reports (accessed on 10 January 2026).
- StataCorp. Stata 18. Statistical software; StataCorp LLC: College Station, TX, 2023; Available online: https://www.stata.com/manuals18/svy.pdf?utm_.
- Wooldridge, JM. Econometric Analysis of Cross Section and Panel Data, 2nd ed.; MIT Press: Cambridge (MA), 2010. [Google Scholar]
- Oster, E. Unobservable Selection and Coefficient Stability: Theory and Evidence. J. Bus. Econ. Stat. 2019, 37, 187–204. [Google Scholar] [CrossRef]
- von Elm, E.; Altman, D.G.; Egger, M.; Pocock, S.J.; Gotzsche, P.C.; Vandenbroucke, J.P. The Strengthening the Reporting of Observational Studies in Epidemiology (STROBE) Statement: Guidelines for reporting observational studies. BMJ 2007, 335, 806–808. [Google Scholar] [CrossRef] [PubMed]
- Benchimol, E.I.; Smeeth, L.; Guttmann, A.; Harron, K.; Moher, D.; Petersen, I.; Sørensen, H.T.; von Elm, E.; Langan, S.M. The REporting of studies Conducted using Observational Routinely-collected health Data (RECORD) Statement. PLoS Med. 2015, 12, e1001885. [Google Scholar] [CrossRef]
- Collum, T.H.; Menachemi, N.; Sen, B. Does electronic health record use improve hospital financial performance? Evidence from panel data. Heal. Care Manag. Rev. 2016, 41, 267–274. [Google Scholar] [CrossRef] [PubMed]
- Sharma, L.; Chandrasekaran, A.; Boyer, K.K.; McDermott, C.M. The impact of Health Information Technology bundles on Hospital performance: An econometric study. J. Oper. Manag. 2016, 41, 25–41. [Google Scholar] [CrossRef]
- Dranove, D.; Forman, C.; Goldfarb, A.; Greenstein, S. The Trillion Dollar Conundrum: Complementarities and Health Information Technology. Am. Econ. Journal: Econ. Policy 2014, 6, 239–270. [Google Scholar] [CrossRef]
- Li, K.; Al-Amin, M.; Rosko, M.D. Early Financial Impact of the COVID-19 Pandemic on U.S. Hospitals. J. Heal. Manag. 2023, 68, 268–283. [Google Scholar] [CrossRef] [PubMed]
- Gangopadhyaya, A.; Blavin, F.; Coughlin, T.A. COVID-19 Provider Relief Fund Payments Were Appropriately Targeted And Did Not Boost Selected Hospitals’ Profits. Heal. Aff. 2023, 42, 1100–1109. [Google Scholar] [CrossRef] [PubMed]
- Woolhandler, S.; Campbell, T.; Himmelstein, D.U. Costs of Health Care Administration in the United States and Canada. New Engl. J. Med. 2003, 349, 768–775. [Google Scholar] [CrossRef] [PubMed]
Figure 1.
Distribution of HIT capital intensity (reporters), FY2023. Notes: Histogram shows the distribution of HIT capital intensity among HIT stock reporters in FY2023. HIT capital intensity is defined as HIT-designated capital stock divided by total assets. Y-axis is percent of hospitals.
Figure 1.
Distribution of HIT capital intensity (reporters), FY2023. Notes: Histogram shows the distribution of HIT capital intensity among HIT stock reporters in FY2023. HIT capital intensity is defined as HIT-designated capital stock divided by total assets. Y-axis is percent of hospitals.
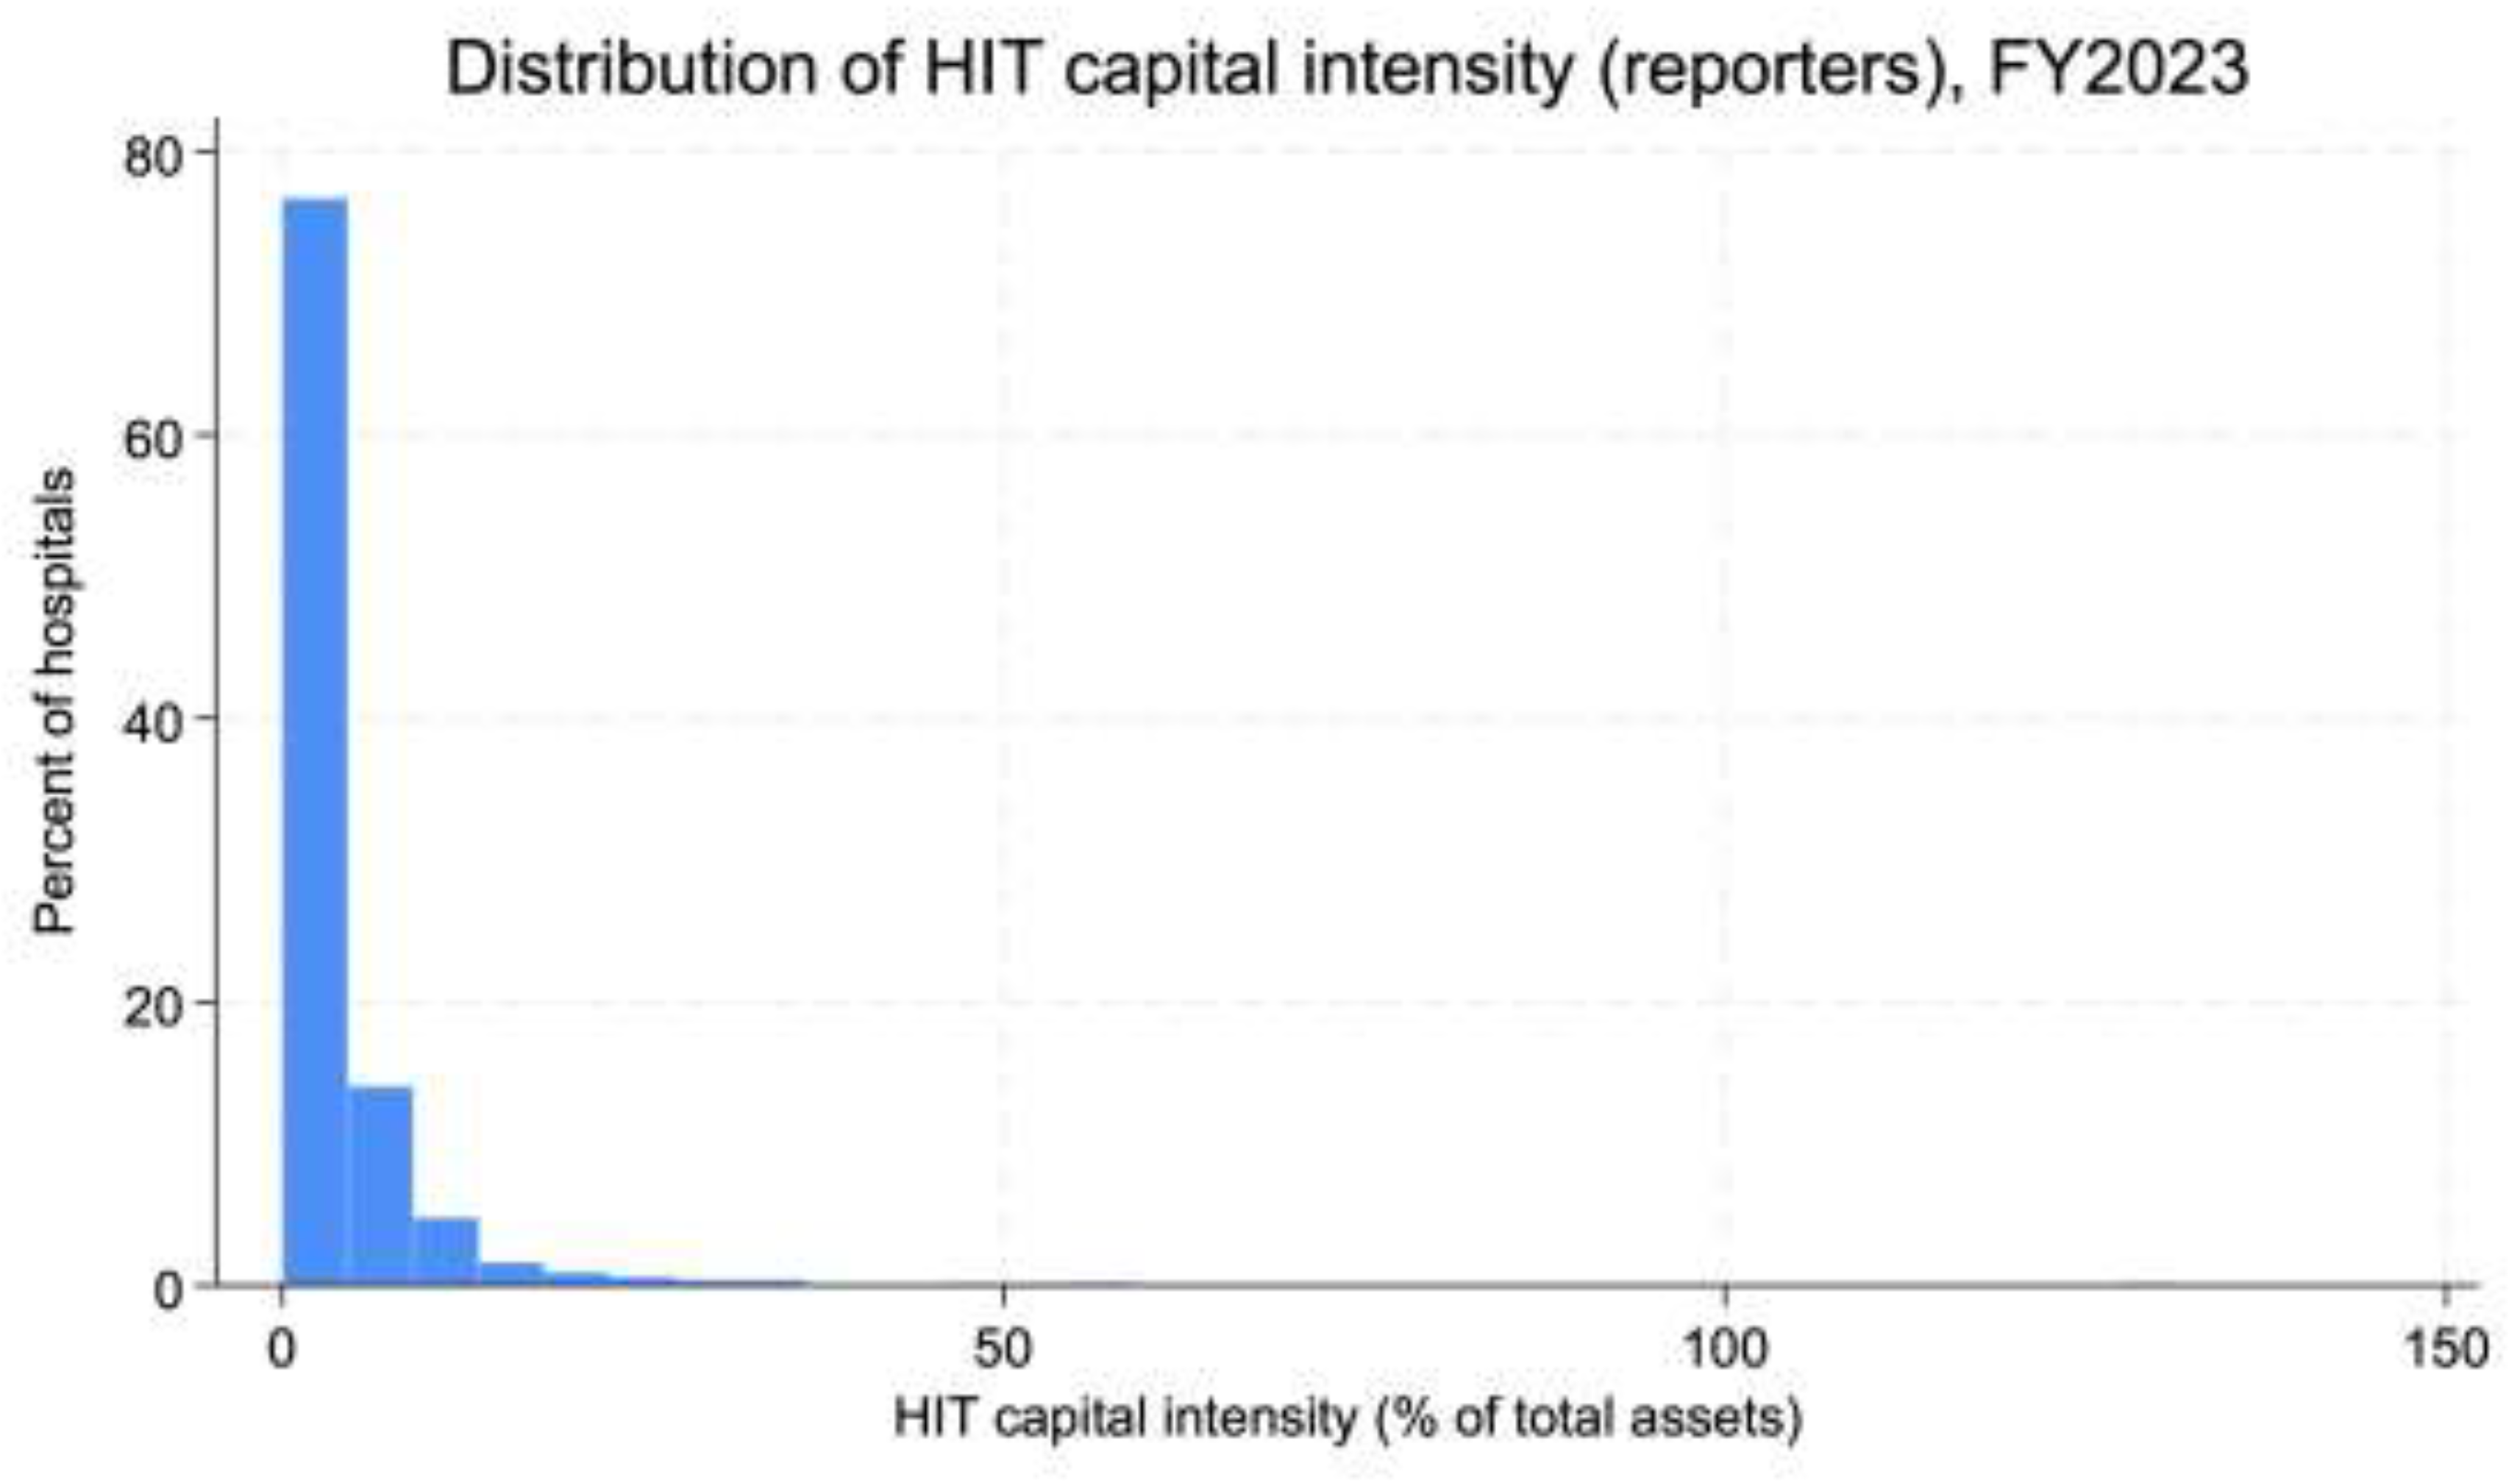
Figure 2.
Adjusted total margin by HIT intensity quintile, FY2023. Notes: Points are model-adjusted mean total margin by HIT intensity quintile (Q1–Q5) among HIT stock reporters in FY2023; bars indicate 95% confidence intervals. Estimates are from the FY2023 reporter-only regression corresponding to Table 2 (FY2023 column), with the same covariates and trimming/winsorization used for the main models.
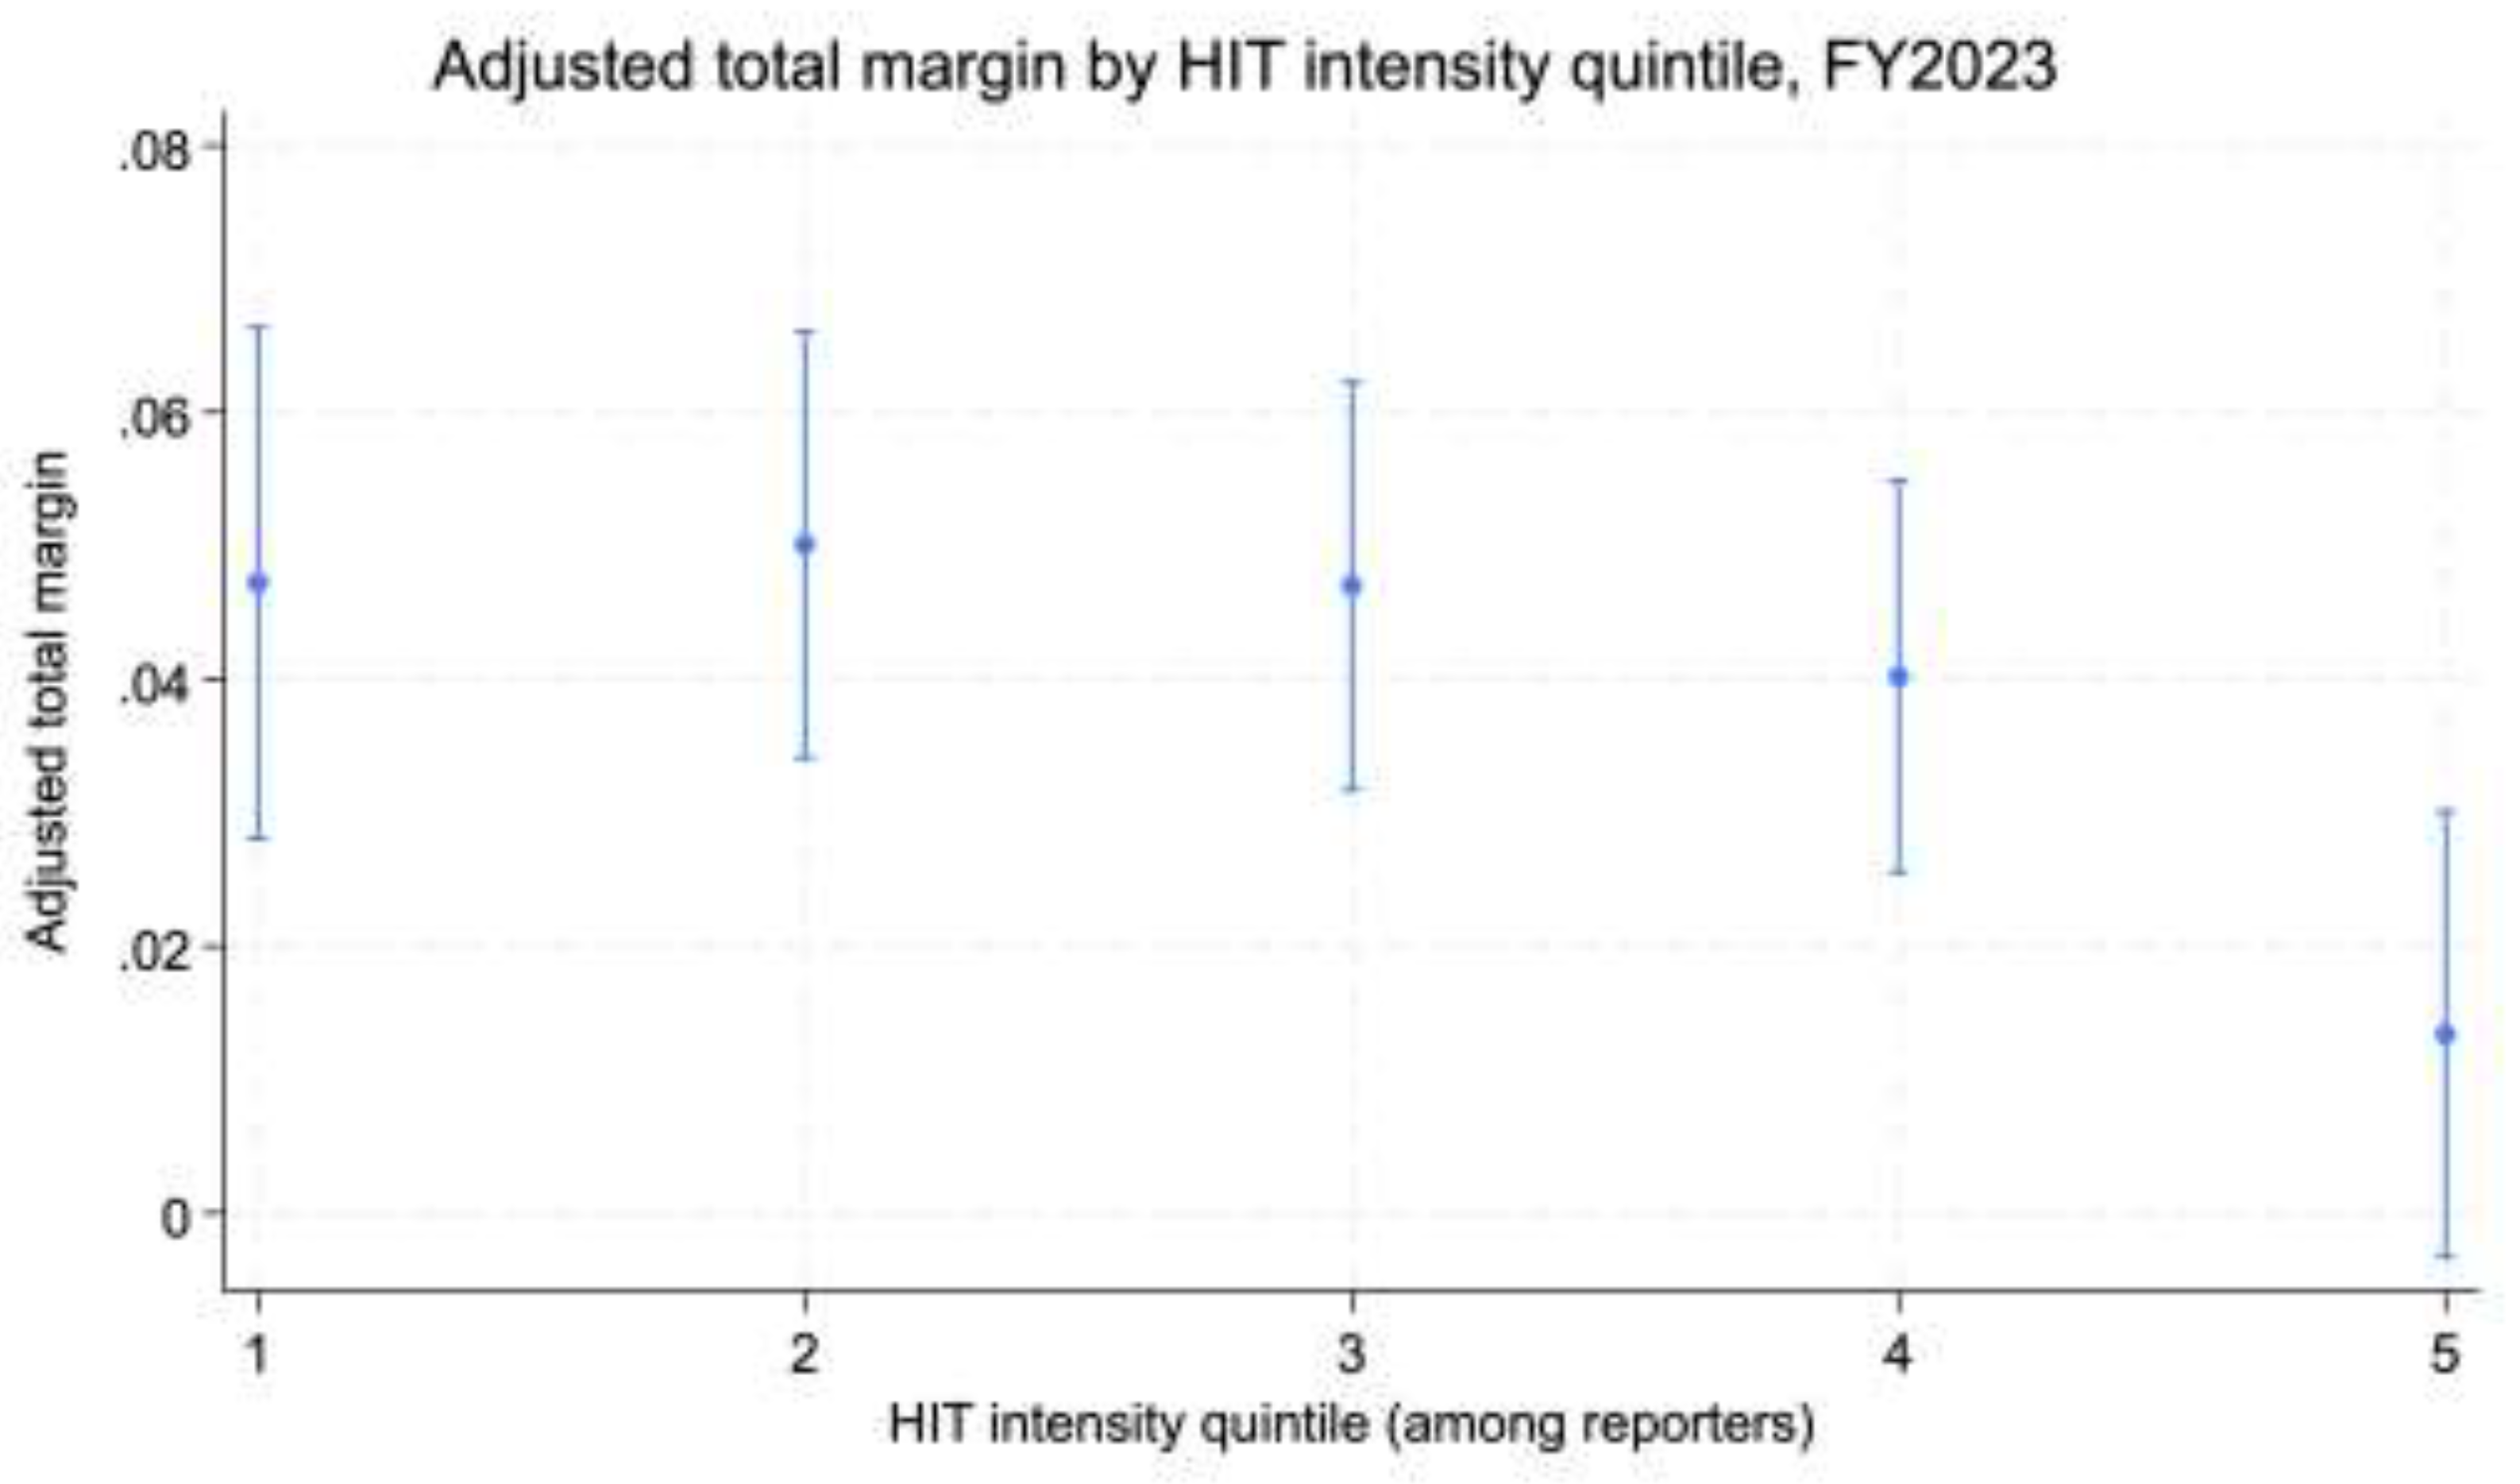
Figure 3.
FY2023 adjusted total margin coefficients by HIT intensity quintile (reporter-only sample). Notes: Coefficient plot from the FY2023 reporter-only regression (Table 2, FY2023 column). Points are estimated coefficients, and bars are 95% confidence intervals. HIT quintile coefficients are relative to Q1 (omitted reference). Covariates shown include log(total assets) and teaching category (as specified in the main model).
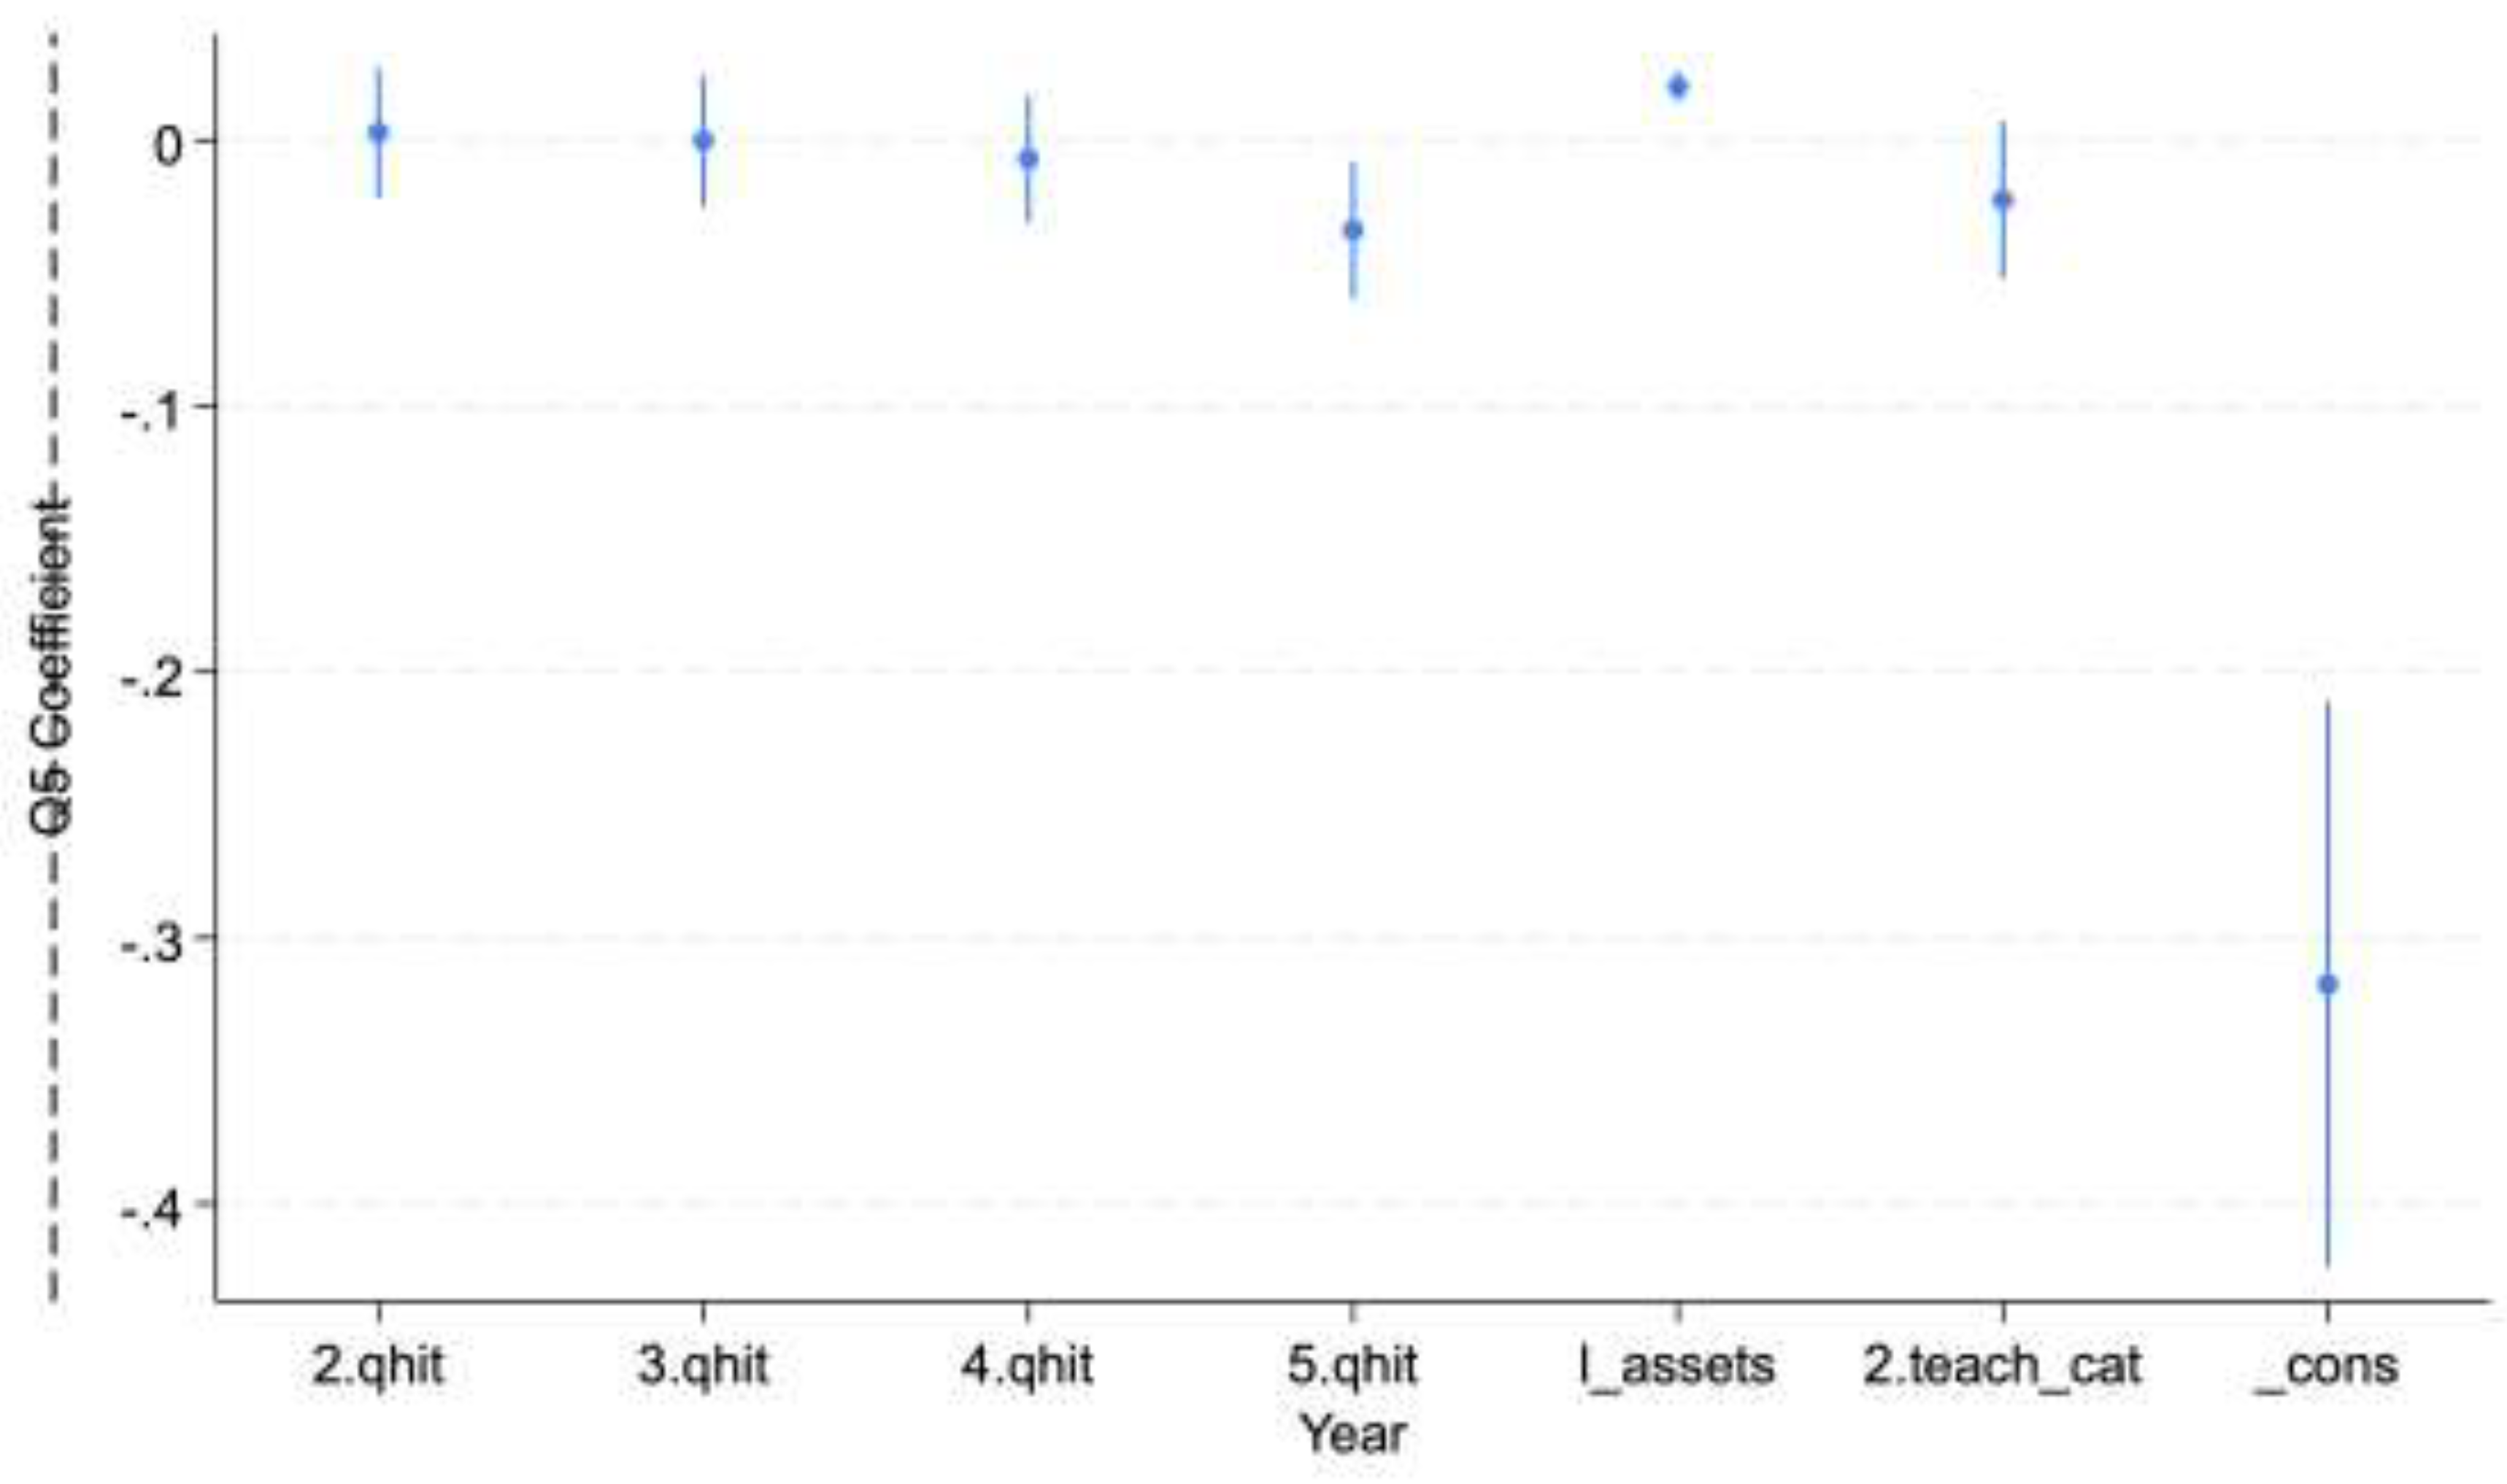
Table 1.
Sample characteristics (FY2018–FY2023), overall vs HIT stock reporters vs non-reporters.
Values are mean (SD) and median; assets are in $ millions. HIT intensity is HIT-designated capital stock / total assets (reporters only).
Table 1.
Sample characteristics (FY2018–FY2023), overall vs HIT stock reporters vs non-reporters.
Values are mean (SD) and median; assets are in $ millions. HIT intensity is HIT-designated capital stock / total assets (reporters only).
| FY | Group | N | Total assets, mean (SD) | Assets, median | Total margin, mean (SD) | Margin, median | HIT intensity, mean (SD) | HIT intensity, median | Major teaching, % |
|---|---|---|---|---|---|---|---|---|---|
| 2018 | All hospitals | 2,212 | 242.54 (1063.94) | 42.80 | 0.0228 (0.2334) | 0.0403 | 0.0671 (0.0899) | 0.0408 | 5.47 |
| 2018 | HIT reporters | 545 | 286.54 (1366.15) | 51.40 | 0.0183 (0.1884) | 0.0258 | 0.0671 (0.0899) | 0.0408 | 5.50 |
| 2018 | Non-reporters | 1,667 | 228.16 (944.45) | 41.49 | 0.0243 (0.2465) | 0.0451 | — | — | 5.46 |
| 2019 | All hospitals | 2,211 | 264.77 (1196.80) | 46.77 | 0.0612 (2.2414) | 0.0557 | 0.1555 (2.0305) | 0.0381 | 5.34 |
| 2019 | HIT reporters | 513 | 308.17 (1513.31) | 53.15 | 0.0478 (0.1208) | 0.0509 | 0.1555 (2.0305) | 0.0381 | 6.55 |
| 2019 | Non-reporters | 1,698 | 251.65 (1083.34) | 44.30 | 0.0653 (2.5626) | 0.0580 | — | — | 5.24 |
| 2020 | All hospitals | 2,349 | 288.34 (1197.86) | 51.71 | 0.0415 (0.3679) | 0.0729 | 0.0513 (0.0684) | 0.0334 | 5.32 |
| 2020 | HIT reporters | 507 | 361.49 (1709.12) | 66.41 | 0.0587 (0.1962) | 0.0697 | 0.0513 (0.0684) | 0.0334 | 6.11 |
| 2020 | Non-reporters | 1,842 | 268.21 (1012.56) | 47.53 | 0.0368 (0.4024) | 0.0747 | — | — | 5.10 |
| 2021 | All hospitals | 2,270 | 289.63 (1169.05) | 54.72 | -0.0718 (6.1586) | 0.0922 | 0.0462 (0.0531) | 0.0312 | 5.55 |
| 2021 | HIT reporters | 487 | 415.60 (1917.20) | 68.87 | 0.0948 (0.1516) | 0.0998 | 0.0462 (0.0531) | 0.0312 | 6.98 |
| 2021 | Non-reporters | 1,783 | 255.22 (855.69) | 51.74 | -0.1175 (6.9525) | 0.0892 | — | — | 5.16 |
| 2022 | All hospitals | 2,283 | 292.44 (1144.02) | 56.88 | 0.0005 (0.2814) | 0.0207 | 0.0529 (0.1333) | 0.0306 | 5.78 |
| 2022 | HIT reporters | 465 | 389.28 (1866.36) | 70.52 | 0.0025 (0.2105) | 0.0169 | 0.0529 (0.1333) | 0.0306 | 7.31 |
| 2022 | Non-reporters | 1,818 | 267.67 (866.71) | 53.36 | -0.0007 (0.2997) | 0.0226 | — | — | 5.39 |
| 2023 | All hospitals | 5,063 | 316.32 (1036.04) | 62.66 | 0.0241 (0.4213) | 0.0389 | 0.0385 (0.0702) | 0.0204 | 7.19 |
| 2023 | HIT reporters | 982 | 276.16 (781.92) | 66.32 | 0.0187 (0.6214) | 0.0214 | 0.0385 (0.0702) | 0.0204 | 6.62 |
| 2023 | Non-reporters | 4,081 | 325.98 (1088.23) | 61.28 | 0.0255 (0.3560) | 0.0393 | — | — | 7.33 |
Notes: Table reports sample characteristics by fiscal year for all hospitals, HIT stock reporters (HIT-designated capital stock observed), and non-reporters (HIT stock missing), after restricting to hospitals with total assets ≥ $1,000,000 and deduplicating to one record per provider-year (best completeness, then highest assets). Assets are reported in $ millions. Total margin is reported in its raw scale (not winsorized). HIT capital intensity is HIT-designated capital stock divided by total assets and is reported only for stock reporters (non-reporters are missing). HIT payment intensity is defined as HIT incentive payments divided by total assets and is reported when payments are observed (payments may be non-missing outside the stock-reporter group). Teaching status is summarized as percent major teaching and percent minor teaching (based on available teaching indicators). Values are mean, standard deviation, and median (p50). Percentages are expressed in percentage points.
Table 2.
Main models (year-specific): Total margin by HIT capital intensity quintile (Q1 ref). Outcome is winsorized total margin (p1/p99) among reporters; robust SEs.
Table 2.
Main models (year-specific): Total margin by HIT capital intensity quintile (Q1 ref). Outcome is winsorized total margin (p1/p99) among reporters; robust SEs.
| Variable | 2018 (N=540, R²=0.063) | 2019 (N=513, R²=0.109) | 2020 (N=503, R²=0.019) | 2021 (N=484, R²=0.033) | 2022 (N=463, R²=0.022) | 2023 (N=977, R²=0.085) |
|---|---|---|---|---|---|---|
| Q2 | -0.024 (0.014) | -0.007 (0.015) | 0.017 (0.020) | 0.001 (0.016) | -0.038 (0.022) | 0.003 (0.013) |
| Q3 | -0.040 (0.016) | -0.002 (0.013) | -0.002 (0.022) | 0.007 (0.015) | 0.005 (0.017) | -0.000 (0.013) |
| Q4 | -0.037 (0.020) | -0.015 (0.016) | 0.017 (0.022) | -0.011 (0.016) | -0.025 (0.019) | -0.007 (0.012) |
| Q5 | -0.055 (0.021) | -0.042 (0.017) | -0.031 (0.029) | -0.027 (0.018) | -0.004 (0.020) | -0.034 (0.013) |
| log(assets) | 0.013 (0.005) | 0.019 (0.004) | 0.005 (0.006) | 0.000 (0.004) | 0.009 (0.005) | 0.020 (0.003) |
| Major teaching | -0.007 (0.017) | -0.053 (0.021) | -0.009 (0.020) | -0.071 (0.020) | -0.035 (0.020) | -0.022 (0.015) |
Notes: Outcome is winsorized total margin (1st/99th percentiles) within each fiscal year among HIT stock reporters. HIT capital intensity is defined as HIT-designated capital stock / total assets; quintiles are constructed within the year among reporters, with Q1 (lowest) as the reference category. Each column reports an OLS regression for the indicated fiscal year, controlling for log(total assets) and teaching status (major vs non-teaching, as available). Robust standard errors are reported in parentheses. N is the number of HIT reporters included in the regression. p<0.10, *p<0.05, **p<0.01.
Table 3.
Spline models (year-specific): Nonlinearity in HIT intensity (ln(1+intensity)), knot at p25 / p50 / p75 Outcome is the same winsorized margin among reporters; robust SEs. “l1” and “l2” are the two spline segments.
Table 3.
Spline models (year-specific): Nonlinearity in HIT intensity (ln(1+intensity)), knot at p25 / p50 / p75 Outcome is the same winsorized margin among reporters; robust SEs. “l1” and “l2” are the two spline segments.
| FY | Knot | l1 | l2 | log(assets) | Major teaching | N | R² |
|---|---|---|---|---|---|---|---|
| 2018 | p25 | -2.061 (1.028) | -0.193 (0.133) | 0.011 (0.005) | -0.005 (0.017) | 540 | 0.065 |
| 2018 | p50 | -1.025 (0.463) | -0.155 (0.153) | 0.011 (0.005) | -0.006 (0.017) | 540 | 0.066 |
| 2018 | p75 | -0.462 (0.258) | -0.152 (0.198) | 0.012 (0.005) | -0.007 (0.017) | 540 | 0.062 |
| 2019 | p25 | -0.342 (0.988) | -0.018 (0.044) | 0.023 (0.004) | -0.058 (0.023) | 513 | 0.097 |
| 2019 | p50 | -0.433 (0.387) | -0.015 (0.042) | 0.022 (0.004) | -0.056 (0.023) | 513 | 0.099 |
| 2019 | p75 | -0.370 (0.208) | -0.008 (0.037) | 0.020 (0.004) | -0.055 (0.022) | 513 | 0.102 |
| 2020 | p25 | 1.899 (2.215) | -0.442 (0.279) | 0.003 (0.005) | -0.004 (0.022) | 503 | 0.029 |
| 2020 | p50 | 0.289 (0.733) | -0.464 (0.312) | 0.003 (0.005) | -0.003 (0.022) | 503 | 0.029 |
| 2020 | p75 | 0.095 (0.392) | -0.554 (0.381) | 0.003 (0.005) | -0.003 (0.022) | 503 | 0.031 |
| 2021 | p25 | 0.459 (1.582) | -0.306 (0.134) | -0.000 (0.004) | -0.071 (0.021) | 484 | 0.036 |
| 2021 | p50 | -0.014 (0.481) | -0.328 (0.145) | 0.000 (0.004) | -0.071 (0.021) | 484 | 0.036 |
| 2021 | p75 | -0.228 (0.273) | -0.314 (0.172) | -0.000 (0.004) | -0.071 (0.021) | 484 | 0.036 |
| 2022 | p25 | -1.426 (1.729) | -0.024 (0.089) | 0.008 (0.005) | -0.036 (0.020) | 463 | 0.011 |
| 2022 | p50 | 0.192 (0.591) | -0.050 (0.090) | 0.009 (0.005) | -0.038 (0.020) | 463 | 0.010 |
| 2022 | p75 | 0.064 (0.329) | -0.052 (0.092) | 0.009 (0.005) | -0.038 (0.020) | 463 | 0.010 |
| 2023 | p25 | 0.434 (1.977) | -0.291 (0.080) | 0.020 (0.003) | -0.023 (0.015) | 977 | 0.089 |
| 2023 | p50 | -0.353 (0.588) | -0.279 (0.084) | 0.019 (0.003) | -0.022 (0.015) | 977 | 0.089 |
| 2023 | p75 | -0.430 (0.267) | -0.256 (0.090) | 0.019 (0.003) | -0.022 (0.015) | 977 | 0.089 |
Notes: Outcome is winsorized total margin (1st/99th percentiles) within each fiscal year among HIT stock reporters. HIT capital intensity is modeled using a spline in ln(1 + HIT capital intensity) with a single knot placed at the 25th, 50th, or 75th percentile of ln(1 + intensity) within year (columns labeled p25/p50/p75). The reported coefficients (l1, l2) correspond to the slope below and above the knot, respectively. Models control for log(total assets) and teaching status (major vs non-teaching, as available). Robust standard errors are reported in parentheses. N is the number of HIT reporters included in the regression. p<0.10, *p<0.05, **p<0.01.
Table 4.
Pooled model with COVID interaction (HIT intensity quintiles) Dependent variable: outcome_w (winsorized total margin).
Table 4.
Pooled model with COVID interaction (HIT intensity quintiles) Dependent variable: outcome_w (winsorized total margin).
| Variable | (1) outcome_w |
|---|---|
| HIT intensity quintile (Q2 vs Q1) | −0.014* (0.008) |
| HIT intensity quintile (Q3 vs Q1) | −0.011 (0.007) |
| HIT intensity quintile (Q4 vs Q1) | −0.021*** (0.008) |
| HIT intensity quintile (Q5 vs Q1) | −0.041*** (0.008) |
| Q2 × COVID | 0.028* (0.015) |
| Q3 × COVID | 0.019 (0.015) |
| Q4 × COVID | 0.033** (0.015) |
| Q5 × COVID | 0.032* (0.018) |
| Log(total assets) | 0.013*** (0.002) |
| Teaching category: Major (ref = Non-teaching) | −0.034*** (0.008) |
| Year = 2019 (ref = 2018) | 0.026*** (0.007) |
| Year = 2020 | −0.034*** (0.008) |
| Year = 2022 | −0.014* (0.009) |
| Year = 2023 | 0.015** (0.007) |
| N | 3,480 |
| R-squared | 0.080 |
Notes: Estimates from pooled OLS models among HIT stock reporters, FY2018–FY2023. HIT intensity is categorized into within-year quintiles; Q1 is the omitted reference. COVID equals 1 in FY2020–FY2021 (0 otherwise). Models include log(total assets), teaching category, and year indicators. Standard errors are clustered at the hospital level (provider number) and reported in parentheses. p<0.10, *p<0.05, **p<0.01.
Table 5.
Hospital fixed-effects model (within-hospital changes) Dependent variable: outcome_w (winsorized total margin).
Table 5.
Hospital fixed-effects model (within-hospital changes) Dependent variable: outcome_w (winsorized total margin).
| Variable | (1) outcome_w |
|---|---|
| HIT intensity quintile (Q2 vs Q1) | 0.011 (0.015) |
| HIT intensity quintile (Q3 vs Q1) | −0.000 (0.019) |
| HIT intensity quintile (Q4 vs Q1) | −0.008 (0.019) |
| HIT intensity quintile (Q5 vs Q1) | −0.015 (0.020) |
| Log(total assets) | 0.045*** (0.009) |
| Teaching category: Major (ref = Non-teaching) | −0.066** (0.026) |
| N | 3,480 |
| Within R-squared | 0.038 |
Notes: Hospital fixed-effects (within) estimates using the pooled panel of HIT stock reporters, FY2018–FY2023. HIT intensity is categorized into within-year quintiles; Q1 is the omitted reference. The dependent variable is outcome_w (total margin winsorized at p1/p99). Standard errors are clustered at the hospital level (provider number) and reported in parentheses. p<0.10, *p<0.05, **p<0.01.
Table 6.
Robustness: pooled winsorization of margins (p5/p95).
| (1) | |
| Dependent variable | outcome_w_rob |
| HIT intensity quintile 2 (ref: Q1) | -0.007 |
| (0.005) | |
| HIT intensity quintile 3 (ref: Q1) | -0.008* |
| (0.005) | |
| HIT intensity quintile 4 (ref: Q1) | -0.013** |
| (0.005) | |
| HIT intensity quintile 5 (ref: Q1) | -0.029*** |
| (0.006) | |
| ln(assets) | 0.010*** |
| (0.001) | |
| Teaching status: Non-teaching (ref) | 0.000 |
| (.) | |
| Teaching status: Major | -0.032*** |
| (0.006) | |
| Year = 2019 (ref: 2018) | 0.020*** |
| (0.006) | |
| Year = 2020 (ref: 2018) | 0.040*** |
| (0.006) | |
| Year = 2021 (ref: 2018) | 0.063*** |
| (0.006) | |
| Year = 2022 (ref: 2018) | -0.013** |
| (0.006) | |
| Year = 2023 (ref: 2018) | 0.009* |
| (0.005) | |
| N | 3,480 |
| R-squared | 0.100 |
Note: Standard errors in parentheses. * p < 0.10, ** p < 0.05, *** p < 0.01. Standard errors are clustered at the hospital level; total margins are winsorized at p5/p95.
Table 7.
Placebo: non-HIT fixed-asset intensity quintiles (subset).
| (1) Outcome: outcome_w | |
| Placebo quintile = 2 | 0.012 (0.010) |
| Placebo quintile = 3 | 0.005 (0.010) |
| Placebo quintile = 4 | 0.011 (0.011) |
| Placebo quintile = 5 | -0.032*** (0.012) |
| ln(assets) | 0.018*** (0.003) |
| Teaching: Major | -0.052*** (0.014) |
| Year = 2019 | 0.025** (0.011) |
| Year = 2020 | 0.031** (0.013) |
| Year = 2021 | 0.069*** (0.013) |
| Year = 2022 | -0.017 (0.014) |
| Year = 2023 | 0.000 (0.011) |
| N | 1,050 |
| R-squared | 0.135 |
Notes: Standard errors in parentheses. Standard errors are clustered at the hospital level. outcome_w is winsorized at p1/p99. * p<0.10, ** p<0.05, *** p<0.01.
Disclaimer/Publisher’s Note: The statements, opinions and data contained in all publications are solely those of the individual author(s) and contributor(s) and not of MDPI and/or the editor(s). MDPI and/or the editor(s) disclaim responsibility for any injury to people or property resulting from any ideas, methods, instructions or products referred to in the content. |
© 2026 by the authors. Licensee MDPI, Basel, Switzerland. This article is an open access article distributed under the terms and conditions of the Creative Commons Attribution (CC BY) license (http://creativecommons.org/licenses/by/4.0/).
Copyright: This open access article is published under a Creative Commons CC BY 4.0 license, which permit the free download, distribution, and reuse, provided that the author and preprint are cited in any reuse.


