
Submitted:
23 January 2026
Posted:
26 January 2026
You are already at the latest version
Abstract
Agriculture in the European Union operates within a complex environment shaped by biological constraints, technological change, institutional frameworks and increasing climate variability. While existing research has largely explained agricultural competitiveness through productivity, technological adoption or policy incentives, less attention has been given to how the internal organisation of production-related functions constrains performance. This study addresses that gap by empirically examining the role of agricultural functional fragmentation and structural incompatibility in shaping agricultural competitiveness across EU Member States over the period 2004–2023. Unlike related concepts such as structural complexity, diversification or farm management complexity, which describe the variety of activities within agricultural systems, this framework focuses on the simultaneity and biological rigidity of core functions that must be coordinated in parallel, generating cumulative coordination burdens. Using harmonised data from FAOSTAT, FADN, WDI, WGI and WMO, the analysis constructs a multidimensional competitiveness index and a system-level measure of functional fragmentation. The empirical strategy combines descriptive analysis with fixed-effects panel regressions, interaction models, instrumental-variable estimations and extensive robustness checks. The results show that higher functional fragmentation is consistently associated with lower agricultural competitiveness, while technological intensity exerts a stable positive effect. Climate anomalies over the observed period are linked to modest average performance gains rather than losses, and institutional quality alone does not offset structural constraints. Overall, the findings highlight functional fragmentation as a persistent structural determinant of agricultural competitiveness and underscore the importance of system-level coordination alongside technological progress.
Keywords:
functional fragmentation
; agricultural competitiveness
; structural constraints
; technological intensity
; institutional quality
; European Union agriculture
1. Introduction
At the global level, agriculture remains a foundational sector for economic development, social stability, and long-term food security. It sustains rural livelihoods, contributes to territorial cohesion, and provides essential inputs to global value chains, while simultaneously operating under conditions of rapid technological change, market volatility, and increasing climate pressure [1,2,3]. Despite significant technological progress in many regions, agricultural performance continues to display substantial variation across countries, reflecting persistent differences in farm size distribution, production specialization, labour organisation, and institutional environments [4,5]. These structural characteristics play a critical role in shaping productivity, income generation, and competitive outcomes. Within the European Union, agriculture operates in a particularly dense and complex institutional setting. The Common Agricultural Policy (CAP), single-market regulations, and national governance frameworks jointly influence production incentives, administrative requirements, technological adoption, and risk-management strategies [6,7,8]. At the same time, pronounced heterogeneity persists between Western and Eastern Member States, reflecting historically path-dependent structural trajectories, uneven levels of technological intensity, and differing exposure to climate variability [9]. These asymmetries suggest that agricultural performance cannot be explained solely by factor endowments or technology levels, but also depends on how production-related functions are organised and coordinated within agricultural systems. In this context, this study uses the term functional fragmentation (AFF/SIT Theory) to describe the cumulative burden arising from the simultaneous execution of biological, technological, managerial, and institutional tasks that are inherent to agricultural production. Unlike diversification or general structural complexity, functional fragmentation refers to the unavoidable and time-sensitive functions embedded in biological production processes that must be managed in parallel. These functions impose coordination demands that can limit the ability of farms to transform available inputs, technologies, and institutional support into competitive performance.
Figure 1 provides a schematic representation of this functional architecture. It illustrates how the farm holding or producer is simultaneously embedded in four interrelated functional domains—biological, technological, managerial, and institutional–market, which together generate functional fragmentation. Each domain captures a distinct set of constraints, including biological seasonality and climate sensitivity, technological and equipment-related requirements, managerial task complexity and labour organisation, and institutional and market-related obligations such as regulatory compliance and subsidy administration. The figure highlights that functional fragmentation does not arise from any single domain in isolation, but from their concurrent operation and interaction, which collectively shape the capacity of agricultural systems to achieve competitive outcomes. Existing research has provided important insights into agricultural productivity, technology adoption, climate impacts, and institutional quality [10,11,12,13]. However, these strands of literature typically analyse these determinants separately, without explicitly accounting for how their simultaneous operation creates cumulative constraints at the system level. As a result, limited attention has been given to the internal organisation of agricultural production as a set of parallel and interdependent functions that farmers must coordinate under biological and institutional constraints. Against this background, the purpose of this study is to examine how functional fragmentation influences agricultural competitiveness across European Union Member States. Using harmonised country-level data from FAOSTAT, the Farm Accountancy Data Network (FADN), the World Development Indicators (WDI), the Worldwide Governance Indicators (WGI), and the World Meteorological Organization (WMO), the analysis evaluates the relationship between functional fragmentation, technological intensity, climate anomalies, and competitive performance over the period 2004–2023. The study adopts a system-oriented empirical approach that allows these factors to be examined jointly within a unified analytical framework. Based on the underlying analytical logic and existing empirical evidence, the study tests three hypotheses. First, higher levels of functional fragmentation are expected to be associated with lower agricultural competitiveness, reflecting the cumulative coordination burden faced by producers. Second, climate shocks are expected to exert stronger negative effects on competitiveness in more fragmented systems, which are structurally less adaptable to environmental variability. Third, the positive effect of technological intensity on competitiveness is expected to weaken as fragmentation increases, indicating limits to the effective absorption of technological improvements. Together, these hypotheses frame functional fragmentation as a structural constraint on performance, a source of vulnerability to external shocks, and a conditioning factor in the effectiveness of technological progress. The following section presents the methodological framework used to empirically evaluate these relationships across EU Member States.
2. Literature Review
The economic analysis of agricultural performance has traditionally been grounded in production theory, where efficiency and competitiveness are understood as outcomes of the optimal allocation of land, labour, and capital under given technological conditions [14]. Subsequent contributions extended this perspective by emphasising that technological progress and institutional change in agriculture are largely endogenous, shaped by relative factor scarcities and economic incentives rather than occurring as exogenous shocks [15]. While these approaches have provided a robust foundation for analysing productivity and structural change, they largely interpret agricultural performance through factor–product relationships and marginal adjustments, with limited attention to the biological and organisational characteristics of agricultural production. Later theoretical and empirical work incorporated institutional and governance dimensions, highlighting the role of transaction costs, property rights, and regulatory frameworks in shaping investment decisions, resource allocation, and technology adoption in agriculture [16,17]. From this perspective, institutional quality affects competitiveness by influencing the predictability of the policy environment, administrative burdens, and incentives faced by producers. Parallel strands of literature have focused on risk and uncertainty, particularly climate-related variability, recognising that agricultural decisions are inherently conditioned by stochastic biological and environmental processes that generate nonlinear economic outcomes [18,19,20].
Although these frameworks acknowledge the sector’s exposure to climate and biological risks, they typically treat such factors as external shocks rather than examining how internal production structures condition their economic effects. Within this broader literature, agricultural competitiveness has evolved into a multidimensional concept, commonly defined as the ability of the sector to sustain productivity, profitability, and market integration under changing economic and environmental conditions [21,22]. Empirical studies frequently operationalise competitiveness using partial productivity indicators, such as yield per hectare, labour productivity, or income-based measures, often drawing on FAO and farm-accountancy data to analyse cross-country differences [23,24,25]. Complementarily, total factor productivity (TFP) has been widely employed as a synthetic measure of efficiency and technological change, estimated through growth accounting, production-function approaches, or data envelopment analysis [26].
While these metrics are well established, they capture selected performance dimensions and provide limited insight into the internal organisation of agricultural production processes. A growing empirical literature also examines the role of institutions and governance in shaping agricultural outcomes, frequently relying on composite indicators such as the Worldwide Governance Indicators to assess how regulatory quality, government effectiveness, and rule of law affect productivity and income through transaction costs and administrative complexity [27,28]. In parallel, climate-oriented studies increasingly incorporate temperature anomalies, rainfall variability, and extreme events as key determinants of yield volatility and long-term productivity trends [29,30]. Despite the expanding scope of indicators, these empirical approaches typically analyse technological, institutional, and climatic factors separately, without explicitly considering how their simultaneous operation creates cumulative constraints at the system level. Structural analyses of agricultural systems in developed economies, particularly within the European Union, further document persistent heterogeneity in farm structures, productivity levels, and responses to policy incentives [31,32,33].
This literature highlights the coexistence of small-scale, fragmented farms alongside highly capitalised and specialised operations, as well as enduring productivity gaps between Western and Eastern Member States. Although these studies acknowledge the interaction between farm structure, technology adoption, and institutional frameworks, they generally rely on isolated indicators and do not conceptualise these elements as components of an integrated functional burden faced by producers. Related research streams, including the literature on agricultural multifunctionality, complexity-oriented approaches, farm management frameworks, and bioeconomic modelling- provide valuable insights into diversification, nonlinear interactions, and biological constraints. However, multifunctionality studies primarily treat economic, environmental, and social functions as policy-relevant outputs rather than structural constraints. Complexity-oriented approaches emphasise interactions but rarely operationalise functional load in empirical analysis. Farm management studies address decision-making complexity without explicitly linking it to biological simultaneity, while bioeconomic models simulate biological–economic processes without representing the cumulative coordination demands imposed on producers. Taken together, the existing literature offers rich insights into productivity, technology, institutions, and climate impacts, yet remains fragmented in its treatment of how these dimensions jointly shape agricultural performance. In particular, limited attention has been given to the internal organisation of agricultural production as a system of simultaneous and interdependent biological, technological, managerial, and institutional functions. This gap motivates a more integrated empirical approach that examines how the accumulation and interaction of these functions condition agricultural competitiveness. The present study builds on these strands by jointly analysing structural, technological, institutional, and climatic factors within a unified analytical framework, focusing on their combined influence on agricultural competitiveness across European Union Member States.
3. Materials and Methods
The research operationalizes AFF/SIT Theory - within a strictly formalized empirical framework that enables quantitative testing of the core structural equation:
where: denotes the competitiveness of the agricultural sector, is an institutional–market coefficient reflecting the extent to which available technologies and resources are translated into economic outcomes, is the biologically feasible maximum of technological efficiency in the absence of functional fragmentation, is the index of functional fragmentation, and is a parameter measuring the strength of the negative impact of fragmentation on competitiveness.
The empirical architecture combines five main data sources: FAOSTAT (agricultural output, areas and inputs), WDI (macroeconomic framework), WGI (institutional environment), FADN (sectoral indicators for farm holdings in the EU), and the WMO (time series of temperature anomalies based on harmonized global temperature products – HadCRUT5, Berkeley Earth and GISTEMP).
The analytical unit is the country–year for EU Member States. For each pair , where denotes the country and the year, we construct: a composite competitiveness index , a functional fragmentation index , a climate shock indicator , a technological intensity indicator and an institutional parameter , alongside a set of control variables describing the structure of the agricultural sector and the macroeconomic environment. Data from the individual sources are integrated via a common “country–year” key, nominal values are deflated using appropriate WDI deflators, and climate series are expressed as anomalies relative to a standard reference period.
3.1. Measuring Competitiveness
Competitiveness is treated as a multidimensional phenomenon, encompassing income-based, biophysical and factor–productivity dimensions. At the “farm sector” level by country, we use aggregated FADN indicators describing the representative farm in country and . First, we define three income dimensions:
where is average income per hectare, is average income per labour unit, is average gross margin per hectare. is the average Farm Net Income per farm in country , year (SE420), is the average Family Farm Income (SE430), is the average Total Output (SE131), is average Total Inputs (SE270), is average Total Labour Input in Annual Work Units (SE010), and is the average utilized agricultural area (UAA), computed from the corresponding FADN area codes.
The biophysical dimension of competitiveness is derived from FAOSTAT. For each country and year , aggregating across main crop groups, we define:
where is the aggregate yield-based competitiveness index, is production of crop or crop group in country , year , is the corresponding area, and are weights reflecting the economic importance of crop in total agricultural output (its share in the value of production). Thus, reflects average biophysical land productivity given the crop structure.
Factor competitiveness is measured via Total Factor Productivity (TFP), estimated at the country–year level using a Cobb–Douglas production function:
where is real agricultural output in country , year , is the TFP term, is the agricultural capital stock (capital formation and available capital aggregates from WDI and FAOSTAT), is agricultural employment, is agricultural land, denotes agricultural inputs (fertilizers, feed, energy, etc.), ,, , are factor elasticities, and is the residual capturing unobserved efficiency and technology. After estimating the function, TFP is defined as:
where is Total Factor Productivity in country , year , and is the estimated residual from the production function.
Finally, we construct a composite competitiveness index by combining the income dimensions ,,, the biophysical indicator and the TFP indicator using either a dimension-reduction technique (principal components) or a normalized average. The index is a scalar representation of competitiveness for country , year , consistent with the structural AFF/SIT equation.
3.2. Constructing Functional Fragmentation
The functional fragmentation index is the quantitative representation of the main mechanism in AFF/SIT Theory: the accumulation and overlap of biological, technological, managerial and institutional-market functions that must be performed in the agricultural sector. At the country - year level it is defined as:
where is the functional fragmentation index for country , year . is the biological component, is the technological component, is the managerial component and is the institutional–market component. The multiplicative form reflects the theoretical claim that burdens across domains mutually reinforce each other rather than adding linearly.
Biological component measures the diversification and complexity of biological systems managed in the agricultural sector. It is derived from FADN indicators on land and livestock structure: SE026 (arable land), SE027 (permanent crops), SE035 (cereals), SE046 (vegetables and flowers), SE050 (vineyards), SE055 (orchards), SE060 (olive groves), SE080 (total livestock units). We define a distribution of production or area across crop and livestock groups where is the share of group in the overall agricultural portfolio of country, year . The biological component is then given by the Shannon index:
where is the biological diversification measure, are group shares, and is the natural logarithm. Higher values indicate more biologically diverse systems and more even distributions, implying more biological functions to be managed.
Technological component reflects the labour–technological and input burden required to sustain agricultural production and is constructed using FADN data for Total Labour Input (SE010), Paid Labour Input (SE020), Total Inputs (SE270) and cash-flow indicators (SE526, SE530, SE532):
where is the technological component,/ is average labour per hectare, / is input intensity, is a financial stress and liquidity index derived from cash-flow indicators, and ,, are scaling and weighting parameters
Managerial component measures managerial complexity – the number of parallel production lines, joint crop–livestock management and contractual commitments. It uses a diversification index based on production structure, and the share of rented land :
where is the managerial component, reflects the number and relative importance of different production lines, is the share of rented land in total agricultural area, and, are scaling and weighting parameters.
Institutional–market component captures the functional burden arising from subsidy regimes, regulations and institutional conditions and is derived from FADN and WGI:
where is the institutional–market component, is the average size of subsidies per farm or per hectare (SE605, SE406, SE409), expressed relative to average output - , is a composite institutional index built from WGI subcomponents, and , are scaling parameters.
Before being combined in each component is standardized (z-transformation or rescaling to [0,1]) to avoid dominance driven purely by measurement units. The resulting index is consistent with the theoretical AFF/SIT construct and captures the functional complexity of the agricultural sector across countries and years.
3.3. Clarification of the Institutional Parameter τ
In the structural AFF/SIT equation, the coefficient τ represents the institutional–market transmission efficiency of available technologies and resources. Conceptually, τ captures the degree to which the institutional environment - regulations, property rights, contract enforcement, subsidy regimes and governance quality - enables the realization of the biologically feasible technological potential . Formally τ [0,1] where values closer to 1 indicate high institutional efficiency, while lower values reflect frictions that distort or attenuate technological translation into observed competitiveness. The parameter is empirically proxied by a normalized composite institutional index constructed from the six WGI dimensions. Thus, τ is not estimated as a free parameter but is operationalized as an observable institutional efficiency measure.
3.4. Handling Near-Zero Values in the Functional Fragmentation Index
Since the functional fragmentation index is defined multiplicatively as:
Because all components are standardized to the [0,1] interval, none of them approaches zero in practice. Thus, FF cannot collapse to zero, and the multiplicative structure does not introduce numerical instability
3.5. Climate Shocks and Econometric Specification
Climate shocks are measured using temperature anomalies based on WMO data. For each country , year we define:
where is the climate shock, is mean annual temperature computed from WMO combined temperature indicators, and is the mean temperature for country c over a reference period (2000-2023). When cross-country comparability requires it, a standardized version is used:
where is the standardized climate shock, is the mean temperature over the available series for country , and is the standard deviation of temperature.
The main panel equation used to test AFF/SIT Theory is:
where is the synthetic competitiveness index, is the functional fragmentation index, is a vector of control variables (agricultural size and structure, macroeconomic indicators, institutional indices, long-term climate trends), are country fixed effects, are year fixed effects, and is the idiosyncratic error term.
To test specifically the interaction between climate shocks and functional fragmentation, we estimate:
where is the interaction term between fragmentation and climate shock. The parameter measures whether and how climate shocks modify the effect of functional fragmentation on competitiveness.
The theorem on decreasing returns to technological progress under high is tested by including a technological intensity indicator and an interaction term :
where is a technological intensity indicator, is the interaction between technologies and fragmentation ,,, are parameters, and is the error term.
Due to potential endogeneity of , instrumental variables (2SLS) are employed. In the first stage:
where is a vector of instruments (historical climate characteristics and lagged WGI values, , are parameters, and is the residual. In the second stage is used in the equation for to correct for endogeneity.
3.6. Data Integration
All data are integrated via a common “country–year” key. FAOSTAT provides output, area, yield and key agricultural input aggregates for EU Member States. WDI complements the macroeconomic picture with agricultural value added, agricultural employment, capital formation and income per capita. WGI supplies the six institutional indices, which are combined into the parameter τ and enter the construction of the institutional–market component . FADN provides sectoral aggregates for farms by country, including income, area, production structure, labour, inputs, subsidies and cash flows, from which the competitiveness indicators and the components of are derived. WMO supplies temperature series and anomalies from which climate shocks are constructed. After aligning periods and countries, a final panel dataset is built in which, for each pair , the following variables are available: ,,, and institutional, macroeconomic and agricultural control variables. This integrated methodological framework transforms AFF/SIT Theory from a purely conceptual construction into a fully measurable and empirically testable model in the context of European agriculture.
3.7. Weighting Strategy for Composite Indicators
All components entering the competitiveness index and the functional fragmentation index are standardized to ensure comparability across heterogeneous measurement scales. Following established practices in composite indicator construction [34,35], equal weighting is applied across conceptually distinct dimensions, given the absence of theoretical or empirical justification for assigning differential ex-ante importance. As a robustness alternative, a data-driven weighting scheme based on Principal Components Analysis is employed, whereby weights correspond to the loadings of the first principal component and therefore maximize explained variance in the underlying data. It is important to clarify that the use of equal weights does not imply an assumption of conceptual independence among the dimensions included in and . Equal weighting reflects epistemic neutrality rather than theoretical separability. In the AFF/SIT framework, interdependence across biological, technological, managerial, and institutional domains is captured structurally through the multiplicative form of , which encodes the theoretical axiom that constraints in one domain amplify constraints in the others. Thus, weighting is used solely to place indicators on commensurable scales, while the interaction mechanism is embedded in the functional form. Empirically, the consistency of results under both equal-weight and PCA-based schemes confirms that findings are not driven by the chosen weighting strategy.
3.8. Robustness Tests
A set of robustness tests is conducted to verify that the empirical results derived from the AFF/SIT framework are not driven by modelling choices, measurement definitions, or sample composition. The robustness checks focus on four dimensions: (I) alternative constructions of the functional fragmentation index, (II) alternative measures of competitiveness, (III) alternative climate-shock definitions, and (IV) endogeneity and error-structure diagnostics.
Alternative Functional Fragmentation Specifications
Since the core fragmentation measure is defined as:
we verify that results do not hinge on this multiplicative form. Three alternative variants are estimated:
Additive index
Standardized multiplicative index
with each component standardized via z-scores.
Principal-component index
Reestimating Eqs. (13)–(15) with , and confirms that the key coefficients remain stable in sign and significance.
Alternative Competitiveness Measures
To ensure that results are not driven by the construction of the composite index , we test:
TFP- only measure
Yield-only measure
Income-only composite
Substituting these measures into Eqs. (13)–(15) yields consistent negative effects of fragmentation and robust interaction effects with climate shocks.
Alternative Climate-Shock Definitions
The baseline climate shock is:
Robustness is checked using: dataset-specific anomalies (HadCRUT5, Berkeley Earth and GISTEMP), standardized anomalies and 3-year smoothed anomalies.
Across all variants, the interaction term in Eq. (14), remains negative and statistically significant.
Endogeneity and Specification Diagnostics
To address potential endogeneity in we estimate a 2SLS first-stage equation:
where includes historical climate variability and lagged institutional indicators. Weak-instrument tests (Kleibergen–Paap F-statistic) and Hansen J-tests confirm instrument validity. IV estimations of Eqs. (13)–(15) produce coefficients consistent with baseline models. Additionally, models are re-estimated using country-clustered, heteroskedasticity-robust and Driscoll–Kraay standard errors. In all cases, the main AFF/SIT predictions remain unchanged.
4. Results
This section presents the empirical results of the analysis for the period. The results are structured in three steps. First, descriptive indicators are used to document cross-country differences in agricultural competitiveness, functional fragmentation and technological intensity across EU Member States. Second, panel econometric models are employed to quantify the relationships between competitiveness, fragmentation, technology and climate conditions. Finally, a series of robustness checks and instrumental-variable estimations are presented to assess the stability and consistency of the main findings.
4.1. Functional Fragmentation Across Member States
This section presents the empirical results for the period 2004–2023. Table 1 reports the average values of the composite competitiveness index and its main income, productivity and efficiency components for each EU Member State.
The table shows substantial heterogeneity in agricultural performance across countries. Belgium, the Netherlands, Spain, Denmark and Italy record the highest values of , combining relatively strong net farm income per hectare, higher family farm income per labour unit and comparatively favourable margins. In contrast, Finland, Bulgaria, Estonia, Croatia and Malta display persistently negative index values, low margins and modest yield performance. Based on the distribution of in Table 1, four groups of countries can be distinguished. Group A comprises highly competitive systems, Group B moderately competitive systems with positive but smaller index values, Group C lower-middle performers, and Group D low-competitiveness systems. These descriptive patterns indicate that differences in income generation and productivity are strongly associated with overall competitiveness outcomes across Member States.
Cross-country differences in the internal organisations of agricultural systems are illustrated in Figure 2, which reports mean values of the functional fragmentation indicator by country. The figure shows considerable variation across Member States. Finland, Bulgaria and Lithuania exhibit the lowest fragmentation levels, indicating relatively integrated production structures, whereas Croatia, Italy and France display the highest levels of fragmentation. Malta is positioned in the middle of the distribution, close to Hungary and Cyprus, suggesting moderate rather than extreme fragmentation. Comparing Figure 2 with the competitiveness ranking in Table 1 reveals a broadly negative association between fragmentation and competitiveness. Countries with low fragmentation tend to exhibit higher or moderate competitiveness, while highly fragmented systems are more frequently found among lower-performing groups. Notable exceptions include France and Italy, which combine high fragmentation with relatively strong competitiveness, reflecting their orientation towards high value-added and technologically intensive production. Malta’s combination of moderate fragmentation and low competitiveness indicates that weak performance is not driven by fragmentation alone, but by its interaction with limited productivity and technological intensity.
4.2. Technological Intensity
Differences in technological intensity are presented in Figure 3, which displays average input use per hectare by country as a proxy for technological and management intensity. The figure highlights sharp contrasts across the EU. The Netherlands, Italy, Belgium, Cyprus and Denmark are characterised by very high input intensity, consistent with capital-intensive and high-value production systems. At the opposite end, Lithuania, Latvia, Estonia, Bulgaria and Slovakia exhibit low input use per hectare, reflecting more extensive production structures.
Malta’s technological intensity lies between these extremes, indicating a low- to medium-intensity system. When Figure 2 is compared with competitiveness outcomes in Table 1, higher technological intensity is generally associated with higher competitiveness. However, the relationship is not uniform: some highly intensive systems underperform relative to their input levels, while certain lower-intensity systems perform better than expected. This asymmetry suggests that technology is a necessary but not sufficient condition for competitiveness and that its effectiveness depends on the degree of structural integration.
4.3. Climate Shocks and Temporal Trends
The evolution of climate conditions is summarised in Table 2, which reports average regional temperature anomalies (RA-6) for Europe across three sub-periods and across three independent datasets. All series show a clear warming trend. The period 2004–2009 is characterised by relatively small positive anomalies, 2010–2015 by moderate warming, and 2016–2023 by pronounced temperature deviations.
Although climate shocks are common across all Member States within the region, their economic relevance differs depending on national structural characteristics. Countries with higher competitiveness and more integrated production systems appear better positioned to operate under increasingly warm conditions, whereas structurally constrained systems face greater adjustment challenges. These patterns motivate the econometric analysis that follows.
4.4. Baseline Panel Regression Results
The baseline fixed-effects regression results are reported in Table 3, which links competitiveness to functional fragmentation, technological intensity and climate shocks while controlling for country and year effects. The coefficient on functional fragmentation is large, negative and highly significant, indicating that higher fragmentation is systematically associated with lower competitiveness. Technological intensity enters with a positive and statistically significant coefficient, confirming its role as an enabling factor. Climate shocks are also positively associated with competitiveness over the observed period, suggesting that recent warming has not translated into average performance losses at the EU level. The high within- R² reported in Table 3 indicates that these variables jointly explain a substantial share of within-country variation in competitiveness.
4.5. Interaction Effects
To assess whether the effects of climate and technology depend on fragmentation, two interaction models are estimated: one that includes an interaction between fragmentation and climate shocks, and another that includes an interaction between fragmentation and technological intensity. The corresponding estimates are reported in Table 4 and Table 5.
In both specifications, the direct effects of fragmentation, technology and climate remain statistically significant. The interaction terms between fragmentation and climate shocks and between fragmentation and technological intensity are not statistically significant. These results indicate that fragmentation primarily shifts the overall level of competitiveness downward rather than fundamentally altering the marginal effects of climate or technology.
4.6. Instrumental-Variable Estimates for Fragmentation
To address potential endogeneity of functional fragmentation arising from omitted variables or reverse causality, instrumental-variable regressions are estimated. Long-run climate variability and lagged institutional quality are used as instruments for fragmentation. The corresponding first-stage and second-stage results are reported in Table 6 and Table 7, respectively.
Table 6 presents the first-stage regression results, with functional fragmentation as the dependent variable. Both instruments are positively and statistically significantly associated with fragmentation. Long-run climate variability exhibits a positive and highly significant coefficient, indicating that greater historical climatic volatility is associated with higher levels of fragmentation. Lagged institutional quality is also positively and significantly related to fragmentation. The joint F-statistic for the instruments exceeds conventional relevance thresholds, suggesting that weak-instrument concerns are limited.
The second-stage IV estimates are reported in Table 7, with agricultural competitiveness as the dependent variable. In this specification, the coefficient on instrumented fragmentation remains negative but becomes statistically insignificant. By contrast, technological intensity and climate shocks retain positive and highly significant coefficients. The overidentification test indicates some tension with the assumption of perfect instrument exogeneity, advising caution in interpreting the precise magnitude of the IV coefficient on fragmentation.
Taken together, the IV results do not overturn the baseline findings from the fixed-effects models. The direction of the fragmentation effect remains negative, but its magnitude is estimated with less precision when relying exclusively on the selected instruments. The IV estimates are therefore best interpreted as a complementary robustness exercise rather than as a replacement for the baseline panel results.
4.7. Robustness Tests
The robustness of the estimated relationship between fragmentation and competitiveness is examined under alternative definitions of fragmentation, alternative competitiveness measures and different climate indicators. Table 8 summarises the estimated fragmentation coefficients across four fragmentation indices and four competitiveness indicators.
The results reported in Table 8 confirm the central empirical pattern. Fragmentation is consistently negatively associated with competitiveness when performance is measured using the composite index, TFP-based indicators or yield-based measures, particularly when fragmentation is constructed as FF mult, FF add or FF pca. Income-only measures display weaker and less stable coefficients, reflecting the influence of policy transfers and short-term income variability. The standardised fragmentation index (FF mult_z) yields smaller coefficients and mixed significance, but these results do not contradict the overall negative association observed across specifications. Overall, the robustness tests indicate that the negative relationship between fragmentation and competitiveness is not driven by a specific index construction or performance definition.
4.8. Institutional Quality and Governance
The final set of results introduces the composite institutional quality parameter τ into the competitiveness regressions, both as a direct determinant and through interaction with fragmentation. The corresponding estimates are reported in Table 9.
As shown in Table 9, fragmentation remains negative and highly statistically significant when institutional quality is included, confirming its role as a core structural determinant of competitiveness. The direct effect of institutional quality is small and statistically insignificant, and the interaction term between fragmentation and institutional quality is also insignificant. Technological intensity and climate shocks retain positive and statistically significant coefficients. These results indicate that improvements in governance alone do not fundamentally alter the negative association between fragmentation and competitiveness. Institutional quality shapes the broader operating environment but does not eliminate the underlying structural constraints captured by fragmentation.
4.9. Additional Robustness: Alternative Standard-Error Corrections
To assess the sensitivity of the baseline results to alternative variance estimators, the fixed-effects model is re-estimated using heteroskedasticity-robust HC3 standard errors, country-clustered standard errors and Driscoll–Kraay standard errors. The results are summarised in Table 10.
Across all three specifications reported in Table 10, the coefficient on functional fragmentation remains negative and highly statistically significant. Technological intensity continues to exhibit a positive and strongly significant effect, while climate shocks remain moderately positive and significant. The within- R² remains unchanged across specifications, indicating that alternative error structures affect statistical inference but not explanatory power. These results confirm that the core empirical findings are robust to commonly used standard-error corrections in panel-data analysis.
5. Discussion
The results of this study provide consistent empirical evidence on the structural determinants of agricultural competitiveness in the European Union and allow for a systematic interpretation of performance differences across Member States. Across descriptive indicators, baseline fixed-effects regressions, interaction models, instrumental-variable estimations and extensive robustness checks, a common pattern emerges: functional fragmentation is persistently and negatively associated with agricultural competitiveness. This finding supports the central analytical premise that the accumulation of simultaneous biological, technological, managerial and institutional demands constrains the ability of agricultural systems to translate inputs, technologies and institutional support into economic outcomes. The baseline panel results show a strong and highly statistically significant negative coefficient for fragmentation, confirming H01. Countries characterised by more fragmented production structures consistently exhibit lower competitiveness, even after controlling for technology, climate conditions and unobserved country-specific effects. This pattern suggests that fragmentation represents a system-level constraint rather than a transitory or country-specific phenomenon. At the same time, technological intensity displays a stable and positive association with competitiveness across all model specifications, underscoring the importance of technological upgrading as a necessary condition for improved performance. However, the results also indicate that technology alone does not eliminate structural disadvantages, as highly fragmented systems continue to underperform despite comparable or even high input intensity.
Contrary to expectations, H02 is not supported by the empirical evidence. Climate anomalies over the period 2004–2023 are associated with modest improvements in average competitiveness, and no statistically significant interaction between climate shocks and fragmentation is detected. This outcome does not contradict the underlying analytical logic but highlights the importance of contextual and temporal conditions. The observed period for Europe is characterised primarily by gradual warming and a reduction in extreme cold events, which may have generated favourable growing conditions on average. As a result, climatic effects appear to operate as a common background factor rather than as a differentiated stressor across fragmented and non-fragmented systems. These findings suggest that the impact of climate on competitiveness is mediated by broader environmental trajectories and may differ under alternative climatic regimes or over longer time horizons. A similar pattern is observed for H03. The interaction between technological intensity and fragmentation is not statistically significant, indicating that the marginal effect of technology on competitiveness does not systematically weaken in more fragmented systems. While fragmentation lowers the overall level of competitiveness, technological upgrading remains beneficial across all structural configurations. This result suggests that fragmented systems retain a certain capacity to absorb and utilise technology, potentially supported by policy frameworks, investment subsidies and extension services at the EU level. At the same time, the absence of interaction effects implies that technology does not fundamentally resolve the structural coordination constraints associated with fragmentation, but rather operates within them. The instrumental-variable estimates provide additional nuance. While the direction of the fragmentation effect remains negative, its magnitude becomes less precisely estimated once endogeneity is explicitly addressed. This sensitivity reflects the deep institutional and historical roots of fragmentation, which are only partially captured by available instruments. Importantly, the IV results do not contradict the baseline findings but indicate that the most reliable evidence on fragmentation is provided by the fixed-effects panel models, with IV estimates serving as a complementary robustness check rather than as a definitive causal benchmark.
The robustness analyses further strengthen the empirical conclusions. Across alternative fragmentation indices, different competitiveness measures, multiple climate datasets and alternative standard-error corrections, the negative association between fragmentation and competitiveness remains stable. The effect is particularly pronounced when competitiveness is measured using productivity- and yield-based indicators, whereas income-based measures show greater variability, reflecting the influence of policy transfers and short-term income fluctuations. Together, these results demonstrate that the observed relationship is not an artefact of measurement choices, estimation techniques or data properties. Finally, the inclusion of institutional quality adds an important dimension to the interpretation of results. Governance indicators do not exert a strong direct effect on competitiveness, nor do they significantly interact with fragmentation. This suggests that improvements in institutional quality alone are insufficient to offset structural constraints when fragmentation is high. Instead, institutional factors appear to shape the broader environment in which structural and technological adjustments take place, rather than directly determining performance outcomes.
Overall, the findings indicate that agricultural competitiveness in the European Union is shaped not only by technology, climate or institutions in isolation, but by the internal organisation and coordination of core production-related functions. Functional fragmentation emerges as a persistent structural characteristic that lowers baseline performance and conditions how agricultural systems respond to external drivers. By explicitly linking micro-level functional pressures to macro-level competitiveness outcomes, the analysis provides a system-oriented perspective that complements existing productivity- and technology-focused approaches and clarifies why structurally constrained agricultural systems struggle to fully realise their productive potential.
6. Conclusions
This study provides a system-oriented empirical assessment of agricultural competitiveness in the European Union by examining how the internal organisation of production-related functions shapes performance outcomes across Member States. Using a comprehensive panel dataset covering the period 2004–2023 and integrating structural, technological, institutional and climatic dimensions, the analysis demonstrates that functional fragmentation constitutes a persistent structural constraint on agricultural competitiveness. Countries characterised by higher levels of fragmentation systematically exhibit lower competitive performance, even when controlling for technological intensity, climate conditions and unobserved country-specific factors. The results confirm that technological upgrading remains a key driver of agricultural performance, yet its effectiveness is conditional on the underlying structural configuration of agricultural systems. Technological intensity consistently exerts a positive effect on competitiveness, but it does not fully compensate for the coordination burdens associated with fragmented production structures. Similarly, institutional quality alone does not offset structural disadvantages, suggesting that improvements in governance shape the broader operating environment rather than directly eliminating system-level constraints. Climate anomalies during the observed period are associated with modest average performance gains, reflecting the specific climatic trajectory in Europe over the last two decades, and do not disproportionately penalise more fragmented systems.
By jointly analysing these dimensions within a unified framework, the study contributes to the literature by shifting attention from isolated determinants of performance towards the internal functional architecture of agricultural systems. The findings indicate that agricultural competitiveness cannot be fully understood through inputs, technology or institutions in isolation, but emerges from the alignment and coordination of biological, technological, managerial and institutional functions. Functional fragmentation lowers baseline performance and conditions how agricultural systems respond to external drivers, thereby helping to explain persistent competitiveness gaps across EU Member States. Several limitations should be acknowledged. The analysis is conducted at the national level and therefore cannot capture farm-level heterogeneity or within-country adjustment mechanisms. In addition, the climate effects identified in this study are specific to the 2004–2023 period and may differ under more extreme climatic conditions. Future research could extend the framework to micro-level data, explore dynamic adjustment processes, and examine how functional fragmentation interacts with more severe climate stress or alternative policy regimes.
Overall, the study highlights that improving agricultural competitiveness in structurally constrained systems requires not only continued technological progress but also greater coordination and integration of core production-related functions. Addressing structural fragmentation alongside technological and institutional development appears essential for enhancing the long-term resilience and performance of agricultural systems in the European Union.
Funding
This research was funded by the Bulgarian National Science Fund through the research project “Agricultural Land, Green Transformation, Energy Transition, Digital Environment”, Administrative Agreement Contract No. KP-06-N96/2, dated 9 December 2025. The author also gratefully acknowledges the financial support of the research project “Sustainability of Bulgarian Agricultural Holdings from Vulnerable Sectors and the Influence of the Institutional Environment”, funded under Administrative Agreement No. KP-06-M96/, dated 9 December 2025.
Data Availability Statement
The data used in this study are publicly available from the following sources: FAOSTAT (Food and Agriculture Organization of the United Nations), the Farm Accountancy Data Network (FADN), the World Development Indicators (World Bank), the Worldwide Governance Indicators, and temperature anomaly data from the World Meteorological Organization. No new primary data were generated by the authors.
Acknowledgments
The author gratefully acknowledges the support of the Bulgarian National Science Fund through the research projects “Agricultural Land, Green Transformation, Energy Transition, Digital Environment” (Administrative Agreement No. KP-06-N96/2, dated 9 December 2025) and “Sustainability of Bulgarian Agricultural Holdings from Vulnerable Sectors and the Influence of the Institutional Environment” (Administrative Agreement No. KP-06-M96/, dated 9 December 2025).
Conflicts of Interest
The authors declare no conflicts of interest.
Abbreviations
| AFF/SIT Theory | Agricultural Functional Fragmentation / Structural Incompatibility Theory |
References
- Berhane, A. Climate change and variability impacts on agricultural productivity and food security. Clim. Weather Forecast. 2018, 6, 240. [Google Scholar] [CrossRef]
- Gandeva, R. Economic analysis of similarity among regions of world agriculture. J. Mt. Agric. Balkans 2024, 27, 4. [Google Scholar]
- Bachev, H. Institutional environment and climate change impacts on sustainability of Bulgarian agriculture. Bulg. J. Agric. Sci. 2018, 24, 4. [Google Scholar]
- Borisov, P.; Miladinoski, D. Competitiveness of agricultural enterprises: theories and determinants. J. Bio-Based Mark. 2022, 1, 58–70. [Google Scholar]
- Nowak, A.; Kaminska, A. Agricultural competitiveness: the case of the European Union countries. Agric. Econ.-Czech 2016, 62, 507–516. [Google Scholar] [CrossRef]
- González-Moralejo, S.A.; Estruch-Sanchís, F.D.B. The Common Agricultural Policy and the increased competitiveness of Spanish regional agriculture. J. Agric. Sci. 2017, 9, 74–91. [Google Scholar] [CrossRef]
- Rac, I.; Erjavec, K.; Erjavec, E. Agriculture and environment: friends or foes? Conceptualising agri-environmental discourses under the European Union’s Common Agricultural Policy. Agric. Hum. Values 2024, 41, 147–166. [Google Scholar] [CrossRef]
- Langlais, A. The new Common Agricultural Policy: reflecting an agro-ecological transition. The legal perspective. Rev. Agric. Food Environ. Stud. 2023, 104, 51–66. [Google Scholar] [CrossRef]
- Reif, J.; Koleček, J.; Morelli, F.; Benedetti, Y. Population trends of ground-nesting birds indicate increasing environmental impacts from Eastern to Western Europe: different patterns for open-habitat and woodland species. Front. Environ. Sci. 2023, 11, 1156360. [Google Scholar] [CrossRef]
- Chandio, A.A.; Shah, M.I.; Sethi, N.; Mushtaq, Z. Assessing the effect of climate change and financial development on agricultural production in ASEAN-4: the role of renewable energy, institutional quality, and human capital as moderators. Environ. Sci. Pollut. Res. 2022, 29, 13211–13225. [Google Scholar] [CrossRef]
- Orji, A.; Kelechi, O.E.; Anthony-Orji, O.I.; Ogbuabor, J.E.; Isaac, N. Do climate change and institutional quality impact on agricultural productivity in Nigeria? J. Infrastruct. 2025, 1, 21–47. [Google Scholar] [CrossRef]
- Tanti, P.C.; Jena, P.R.; Aryal, J.P. Role of institutional factors in climate-smart technology adoption in agriculture: Evidence from an Eastern Indian state. Environ. Chall. 2022, 7, 100498. [Google Scholar] [CrossRef]
- Madaki, M.Y.; Barnabas, B.; Shehu, A.; Ullah, A.; Bavorova, M. Institutional services towards climate action: A case of climate change adaptation of agro-pastoralists in the drylands of Nigeria. Clim. Policy 2025, 1–15. [Google Scholar] [CrossRef]
- Antle, J.M.; Capalbo, S.M. An introduction to recent developments in production theory and productivity measurement. In Agricultural Productivity; 2015; pp. 17–95. [Google Scholar]
- Han, L.; Zhou, Y.; Yin, L. Exogenous impacts on the links between energy and agricultural commodity markets. Energy Econ. 2015, 49, 350–358. [Google Scholar] [CrossRef]
- North, D.C. Institutions, Institutional Change and Economic Performance; Cambridge University Press: Cambridge, UK, 1990; p. 33. [Google Scholar]
- Williamson, O.E. The new institutional economics: taking stock, looking ahead. J. Econ. Lit. 2000, 38, 595–613. [Google Scholar] [CrossRef]
- Stoorvogel, J.J.; Antle, J.M.; Crissman, C.C.; Bowen, W. The tradeoff analysis model: integrated bio-physical and economic modeling of agricultural production systems. Agric. Syst. 2004, 80, 43–66. [Google Scholar] [CrossRef]
- Janssen, S.; Van Ittersum, M.K. Assessing farm innovations and responses to policies: a review of bio-economic farm models. Agric. Syst. 2007, 94, 622–636. [Google Scholar] [CrossRef]
- Cheng, Y. Analysis of development strategy for ecological agriculture based on a neural network in the environmental economy. Sustainability 2023, 15, 6843. [Google Scholar] [CrossRef]
- Cock, J.; Prager, S.; Meinke, H.; Echeverria, R. Labour productivity: the forgotten yield gap. Agric. Syst. 2022, 201, 103452. [Google Scholar] [CrossRef]
- Giannakis, E.; Bruggeman, A. Exploring the labour productivity of agricultural systems across European regions: a multilevel approach. Land Use Policy 2018, 77, 94–106. [Google Scholar] [CrossRef]
- Cornia, G.A. Farm size, land yields and the agricultural production function: an analysis for fifteen developing countries. World Dev. 1985, 13, 513–534. [Google Scholar] [CrossRef]
- Petrov, D.; Mitov, A. Assessing the economic and ecological outcomes of sustainable farming techniques in Bulgaria. Bulg. J. Agric. Econ. Manag. 2025, 70, 28–43. [Google Scholar] [CrossRef]
- Petrov, D. Trend scenarios for the impact of smart contracts on transaction costs in agricultural enterprises. Bulg. J. Agric. Econ. Manag. 2025, 70, 15–27. [Google Scholar] [CrossRef]
- Coelli, T.J.; Rao, D.S. Total factor productivity growth in agriculture: a Malmquist index analysis of 93 countries, 1980–2000. Agric. Econ. 2005, 32, 115–134. [Google Scholar] [CrossRef]
- Hamilton, N.D. Feeding the world’s future: agrarian justice and the rule of law. Drake J. Agric. Law 2008, 13, 545. [Google Scholar]
- Georgiev, M. Agricultural land, governance, and institutional change: evidence from a Bulgarian study. Governance and Institutional Change 2024.
- Legler, D.M.; Bryant, K.J.; O’Brien, J.J. Impact of ENSO-related climate anomalies on crop yields in the US. Climatic Change 1999, 42, 351–375. [Google Scholar] [CrossRef]
- Getnet, G.T.; Dagnew, A.B.; Ayal, D.Y. Spatiotemporal variability and trends of rainfall and temperature in the tropical moist montane ecosystem: implications to climate-smart agriculture in the Geshy watershed, Southwest Ethiopia. Clim. Serv. 2023, 30, 100384. [Google Scholar] [CrossRef]
- Bachev, H.; Mihailova, M.; Terziev, D.; Georgiev, M.; Dimova, N.; Marinov, P.; Mikova, R.; Blagoeva, S. Structure and management of contractual relations in Bulgarian agriculture, 2024.
- Huber, R.; Bartkowski, B.; Brown, C.; El Benni, N.; Feil, J.H.; Grohmann, P.; Müller, B. Farm typologies for understanding farm systems and improving agricultural policy. Agric. Syst. 2024, 213, 103800. [Google Scholar] [CrossRef]
- Hasler, B.; Termansen, M.; Nielsen, H.Ø.; Daugbjerg, C.; Wunder, S.; Latacz-Lohmann, U. European agri-environmental policy: evolution, effectiveness, and challenges. Rev. Environ. Econ. Policy 2022, 16, 105–125. [Google Scholar] [CrossRef]
- Organisation for Economic Co-operation and Development (OECD). Handbook on Constructing Composite Indicators: Methodology and User Guide; OECD Publishing: Paris, France, 2008. [Google Scholar]
- United Nations Development Programme (UNDP). Human Development Report 2015: Work for Human Development; UNDP: New York, NY, USA, 2015; Available online: https://hdr.undp.org.
Figure 1.
Functional architecture of fragmentation and its domains.
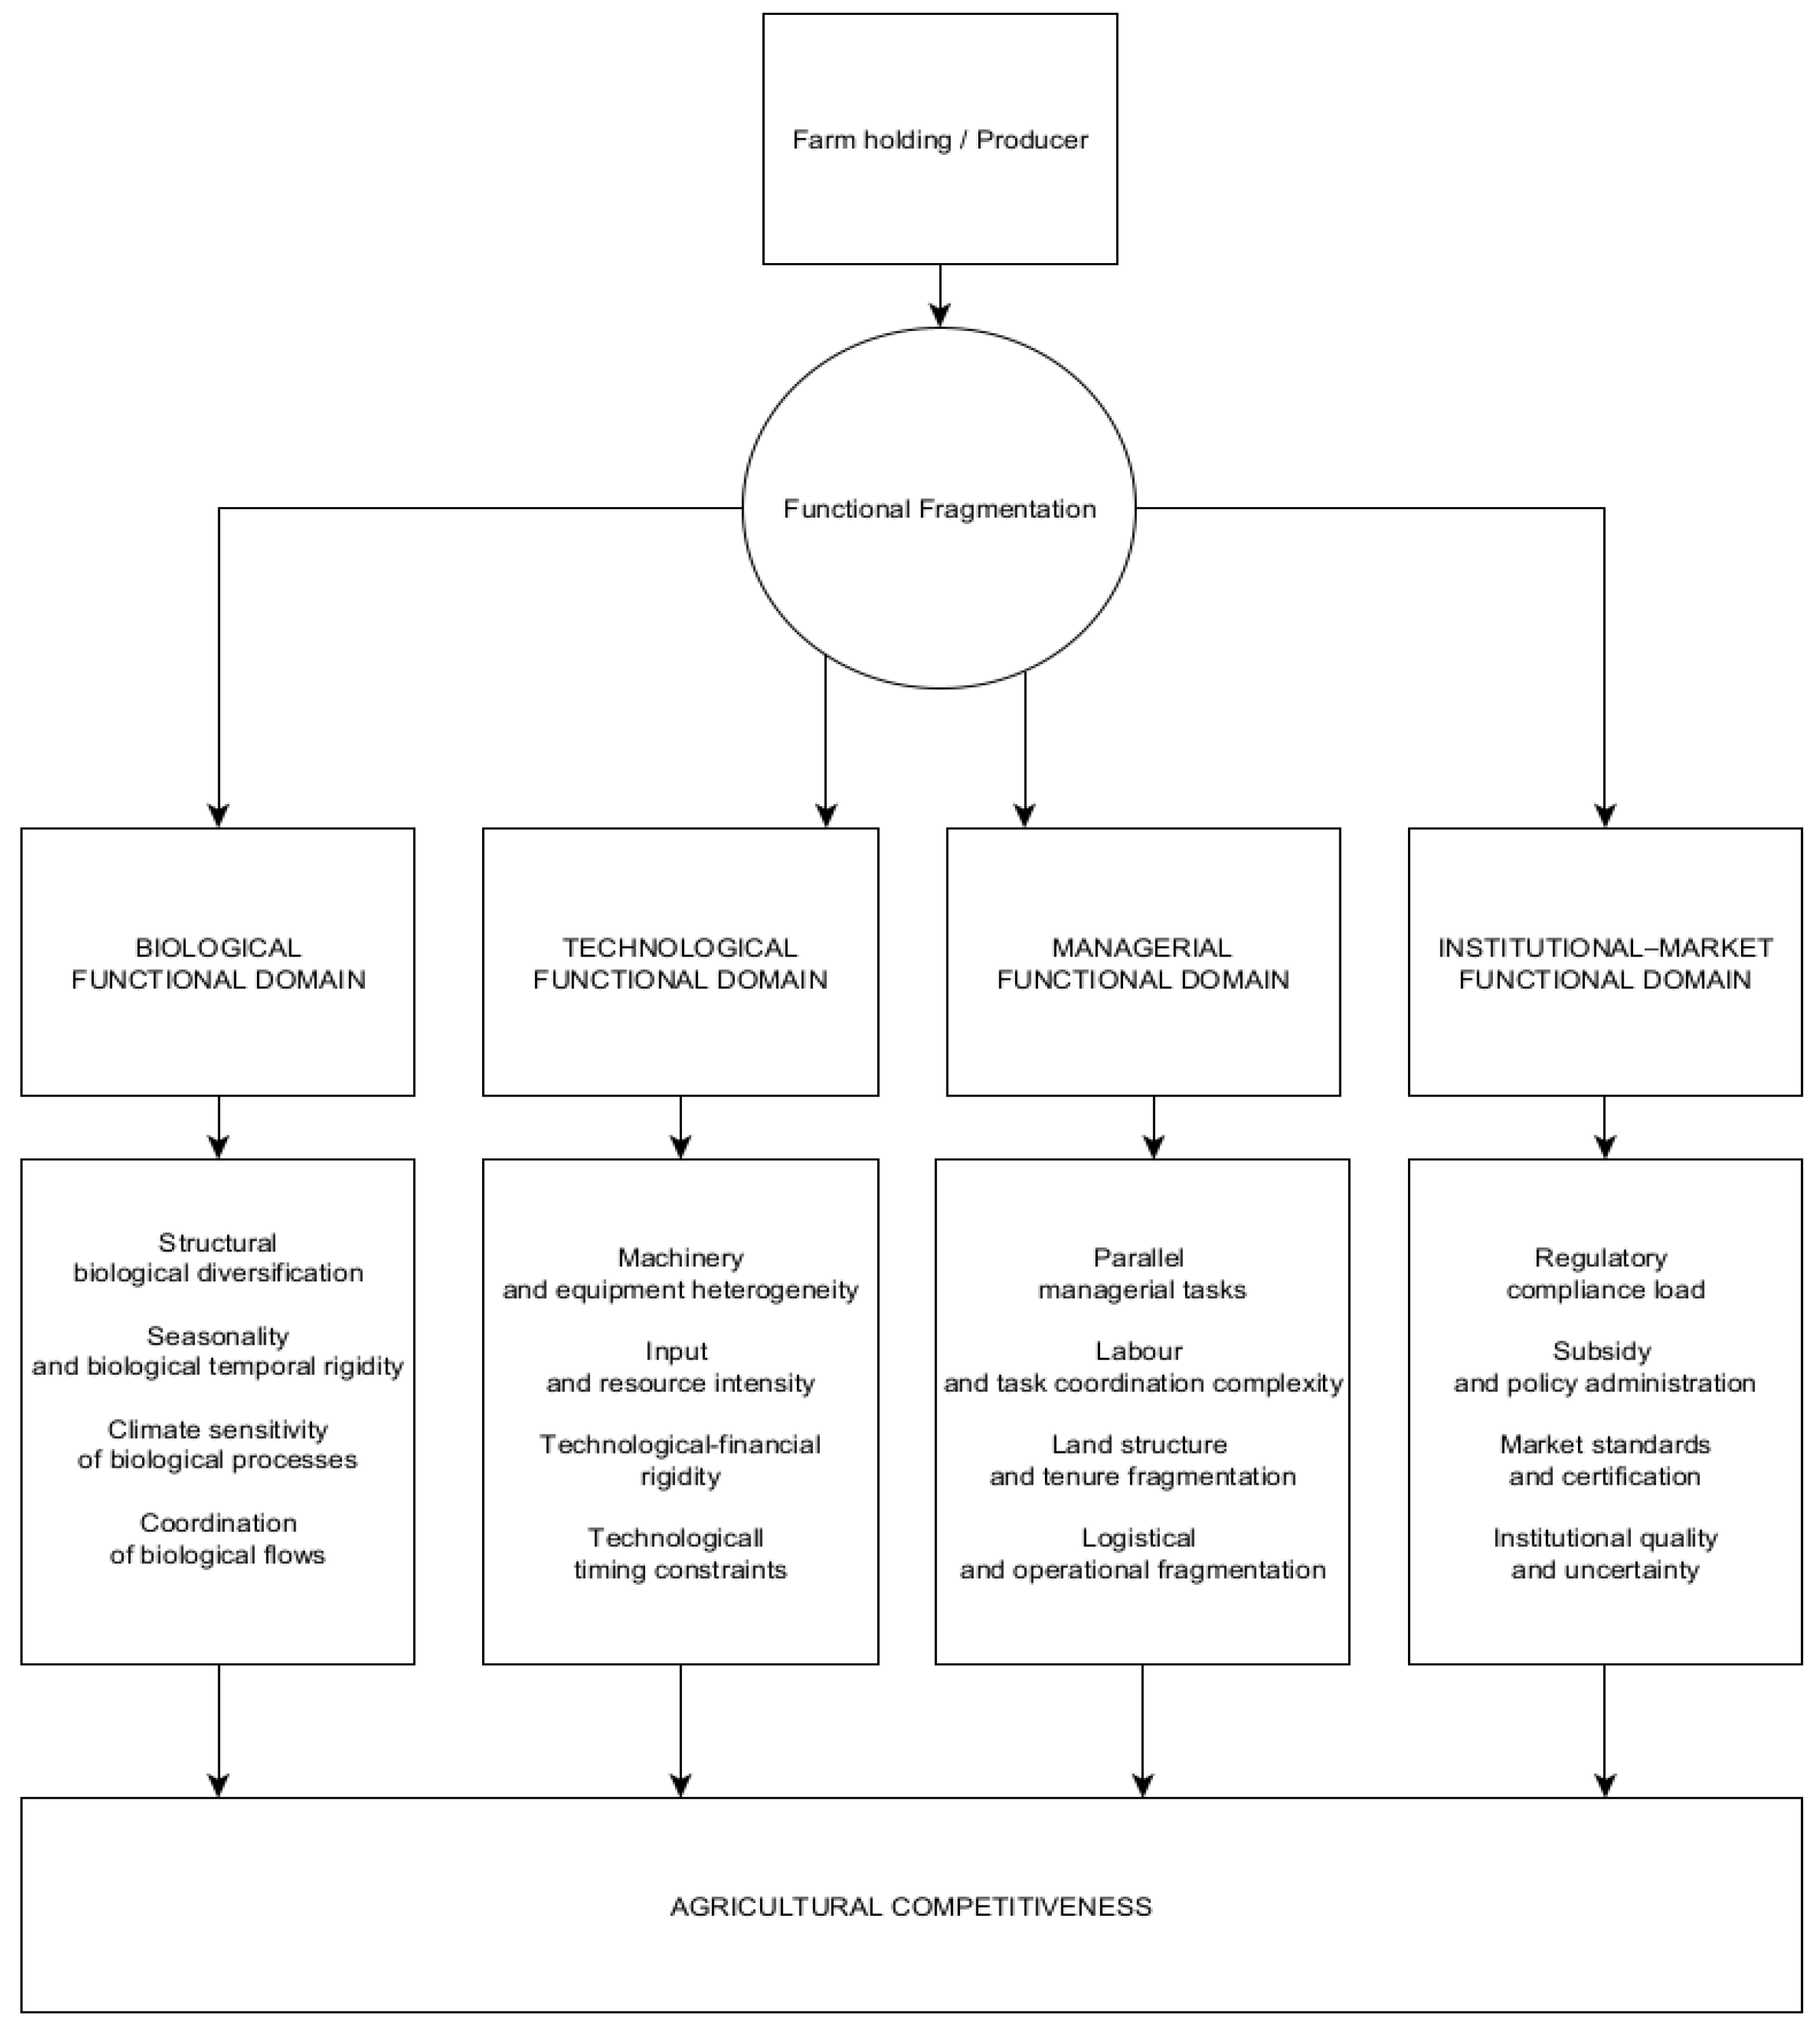
Figure 2.
Functional fragmentation by country.
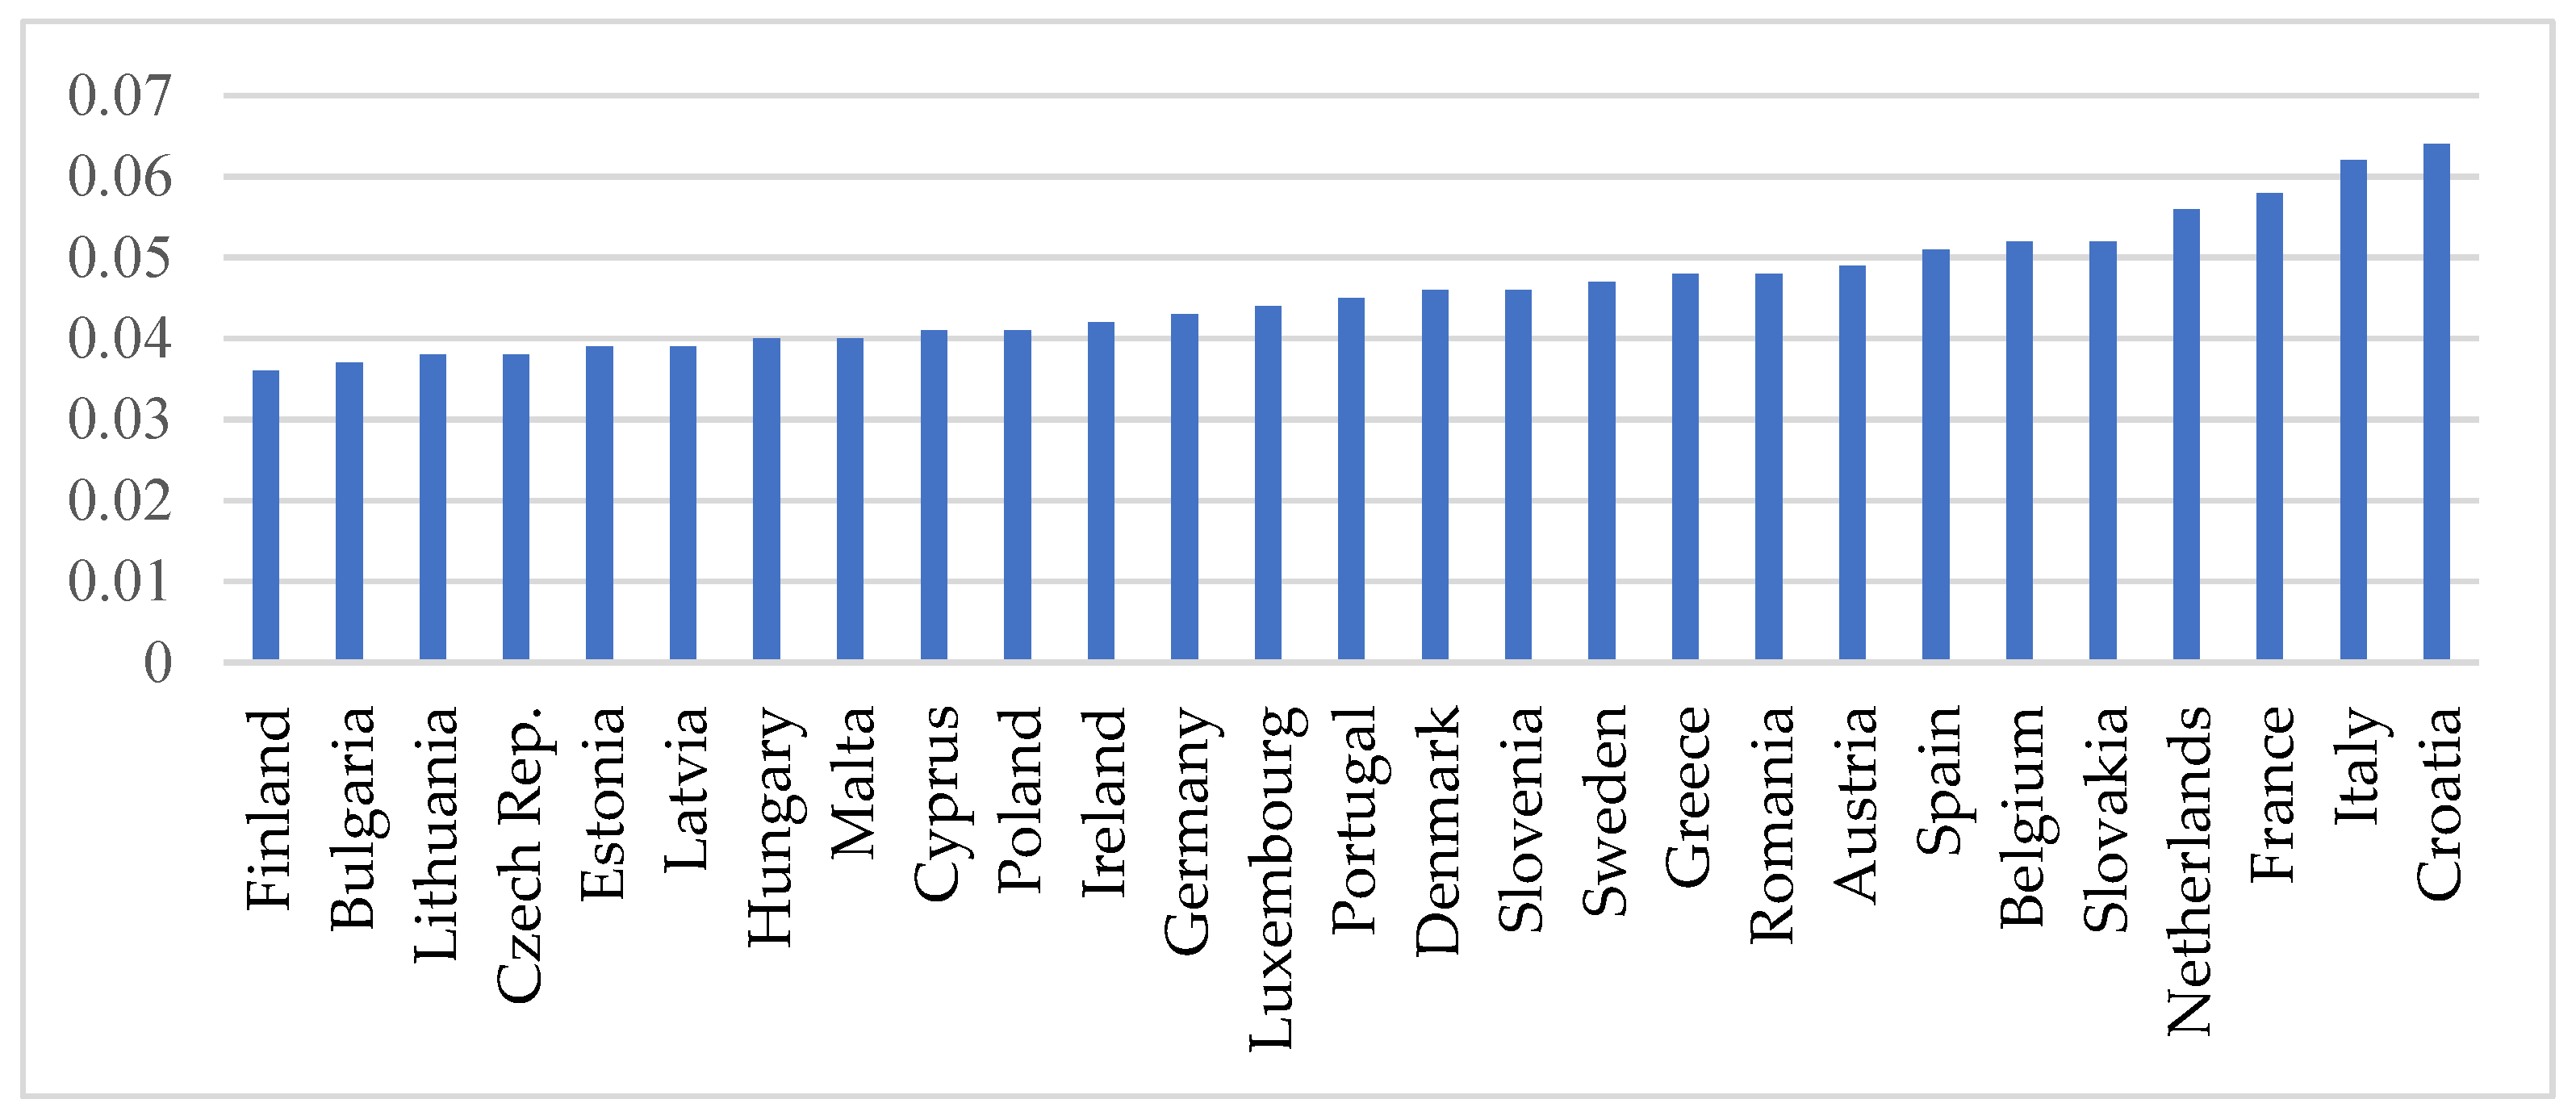
Figure 3.
Technological intensity (inputs per ha).
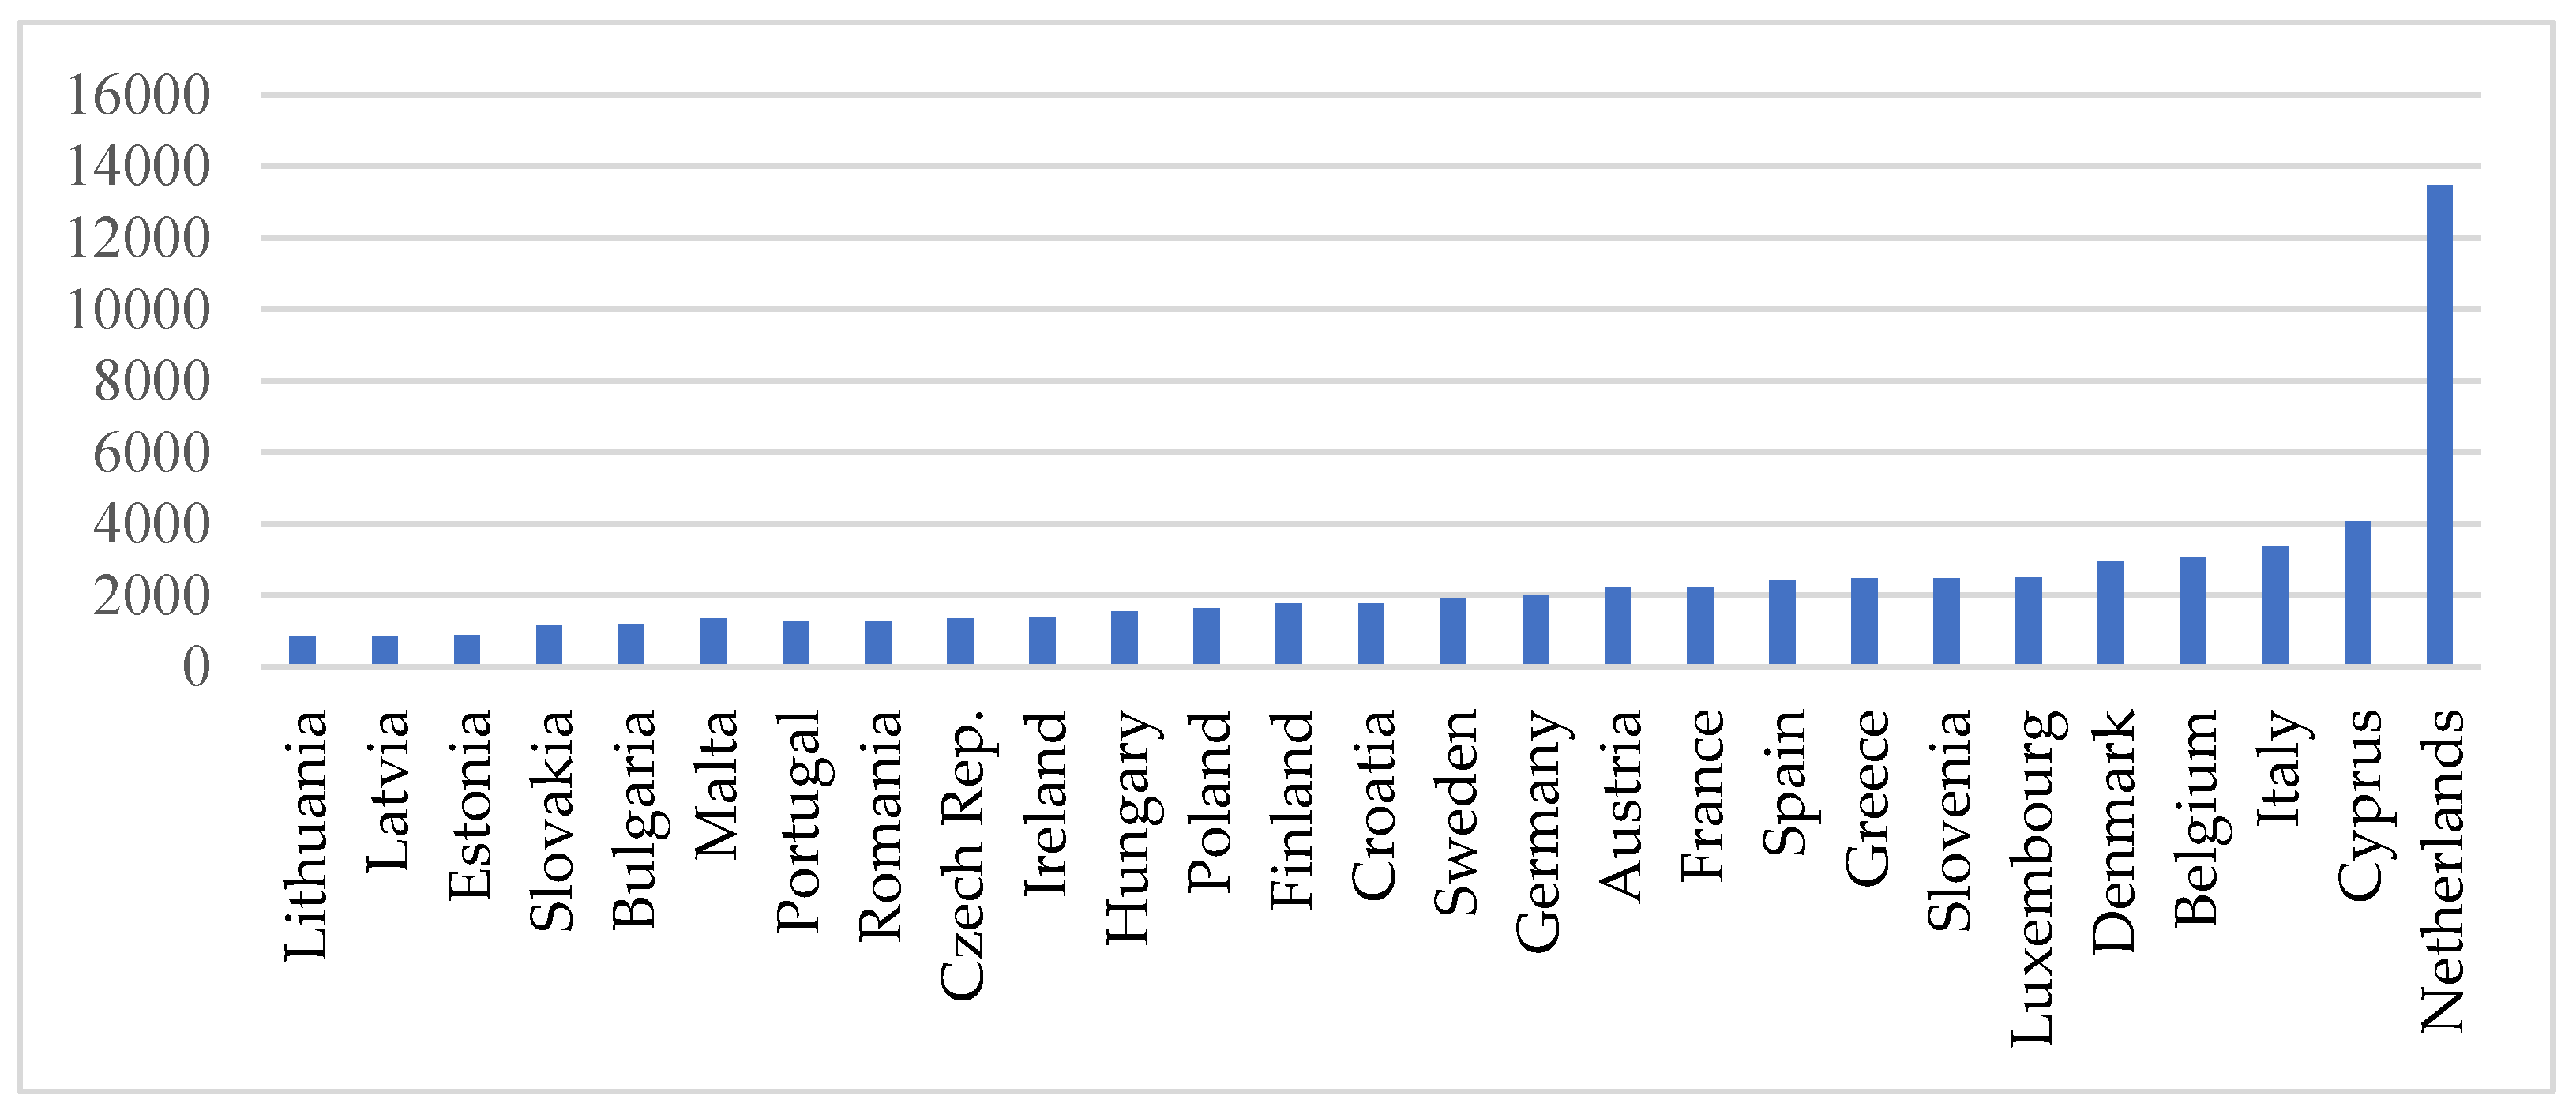

Table 1.
Competitiveness indicators by country.
| Country | C* | FNI/ha (€) | FFI/L (€) | Margin/ha (€) | Yield €/ha | TFP residual | Obs. |
|---|---|---|---|---|---|---|---|
| Austria | 0.11 | 938.98 | 14,340.95 | 305.93 | 2,225.09 | 0.06 | 20 |
| Belgium | 0.85 | 1,293.01 | 20,081.30 | 836.68 | 3,063.46 | 0.43 | 20 |
| Bulgaria | –0.61 | 266.15 | 2,863.73 | 14.44 | 1,195.62 | –0.30 | 20 |
| Cyprus | –0.15 | 1,087.55 | 7,440.41 | 598.35 | 4,053.64 | –0.08 | 20 |
| Czech Rep. | –0.49 | 186.66 | 2,925.43 | –204.05 | 1,343.42 | –0.27 | 20 |
| Denmark | 0.48 | 298.44 | 21,575.30 | –36.17 | 2,939.64 | 0.26 | 20 |
| Germany | 0.16 | 475.08 | 14,014.48 | 85.62 | 2,006.98 | 0.05 | 20 |
| Estonia | –0.49 | 131.9 | 6,951.08 | –77.03 | 876.96 | –0.08 | 20 |
| Greece | 0.17 | 1,386.30 | 11,415.87 | 695.24 | 2,474.11 | 0.07 | 20 |
| Spain | 0.66 | 719.92 | 17,594.24 | 462.32 | 2,407.30 | 0.11 | 20 |
| Finland | –0.71 | 361.05 | 17,050.26 | –507.42 | 1,774.49 | –0.04 | 20 |
| France | 0.13 | 455.4 | 13,859.93 | 108.94 | 2,225.09 | 0.06 | 20 |
| Croatia | –0.44 | 652.74 | 4,375.95 | 242.03 | 1,774.49 | –0.04 | 11 |
| Hungary | –0.13 | 380.72 | 14,313.02 | 66.81 | 1,539.63 | –0.02 | 20 |
| Ireland | 0.08 | 523.31 | 19,814.40 | 112.05 | 1,397.48 | –0.01 | 20 |
| Italy | 0.35 | 1,093.98 | 14,517.33 | 547.45 | 3,381.70 | 0.26 | 20 |
| Latvia | –0.40 | 182.72 | 6,093.41 | 13.08 | 855.08 | –0.09 | 20 |
| Lithuania | –0.39 | 210.12 | 6,723.21 | 14.34 | 831.54 | 0 | 20 |
| Luxembourg | 0.23 | 419.8 | 18,611.72 | 98.55 | 2,484.12 | –0.06 | 20 |
| Malta | –0.48 | 320 | 3,300.00 | 25 | 1,280.00 | –0.20 | 18 |
| Netherlands | 0.74 | 1,136.65 | 18,041.90 | 558.02 | 13,472.44 | 0.07 | 20 |
| Poland | –0.05 | 335.08 | 7,701.49 | 119.84 | 1,632.65 | 0.01 | 20 |
| Portugal | 0.1 | 556.52 | 8,562.46 | 321.74 | 1,284.28 | 0.1 | 20 |
| Romania | –0.19 | 287.13 | 3,678.38 | 47.9 | 1,281.21 | 0.08 | 17 |
| Slovakia | –0.02 | 280.83 | 5,080.44 | 59.07 | 1,150.11 | –0.02 | 20 |
| Slovenia | –0.22 | 459.36 | 11,865.36 | 203.72 | 2,473.12 | –0.22 | 20 |
| Sweden | –0.18 | 585.43 | 15,186.69 | –79.70 | 1,896.79 | –0.08 | 20 |
Table 2.
Regional temperature anomalies (RA-6, Europe).
| Period | HadCRUT5 (°C) | Berkeley (°C) | GISTEMP (°C) | HadCRUT5 MA(3) |
|---|---|---|---|---|
| 2004–2009 | 0.118 | 0.126 | 0.128 | 0.129 |
| 2010–2015 | 0.294 | 0.258 | 0.272 | 0.299 |
| 2016–2023 | 0.699 | 0.661 | 0.727 | 0.686 |
| Period | HadCRUT5 (°C) | Berkeley (°C) | GISTEMP (°C) | HadCRUT5 MA(3) |
Table 3.
Baseline fixed-effects regression (dependent variable: C*).
| Variable | Coefficient | Robust SE | Significance |
|---|---|---|---|
| FF_mult | –3.734 | 0.63 | *** |
| Tech | 0.00016 | 0.000031 | *** |
| Shock_had | 0.197 | 0.086 | ** |
| Country FE | yes | ||
| Year FE | yes | ||
| N | 506 | ||
| R² | 0.843 |
Table 4.
Interaction between fragmentation and climate.
| Variable | Coefficient | Robust SE | Significance |
|---|---|---|---|
| FF mult | –3.651 | 0.608 | *** |
| Tech | 0.000157 | 0.000031 | *** |
| Shock_had | 0.233 | 0.093 | ** |
| FF mult × Shock | –0.892 | 0.787 | n.s. |
| Country FE | yes | ||
| Year FE | yes | ||
| N | 506 | ||
| R² | 0.844 |
Table 5.
Interaction between fragmentation and technology.
| Variable | Coefficient | Robust SE | Significance |
|---|---|---|---|
| FF mult | –4.430 | 2.078 | ** |
| Tech | 0.000157 | 0.000031 | *** |
| Shock had | 0.197 | 0.086 | ** |
| FF mult × Tech | 0.000405 | 0.0012 | n.s. |
| Country FE | yes | ||
| Year FE | yes | ||
| N | 506 | ||
| R² | 0.844 |
Table 6.
First-stage regression for fragmentation.
| Variable | Coefficient | Robust SE | Significance |
|---|---|---|---|
| Shock_sd_30 | 0.0216 | 0.006 | *** |
| WGI_{t–1} | 0.0319 | 0.01 | *** |
| Constant | –0.0057 | ||
| N | 480 | ||
| F-stat (joint instruments) | 19.15 | *** |
Table 7.
Second-stage IV regression.
| Variable | Coefficient | Robust SE | Significance |
| FF_hat | –0.033 | 2.057 | n.s. |
| Shock_had | 0.441 | 0.086 | *** |
| Tech | 0.0001 | 0.000009 | *** |
| Constant | –0.577 | 0.093 | *** |
| N | 480 | ||
| R² | 0.391 |
Table 8.
Robustness of fragmentation effects under alternative indices.
| Dependent variable | FF mult | FF add | FF mult_z | FF_pca |
|---|---|---|---|---|
| C* | –3.73 (0.63)*** | –0.41 (0.07)*** | 0.02 (0.01) n.s. | –0.28 (0.04)*** |
| C_TFP_only | –8.91 (1.28)*** | –1.07 (0.13)*** | 0.00 (0.01) n.s. | –0.62 (0.08)*** |
| C_yield_only | –0.43 (0.14)*** | –0.06 (0.02)*** | 0.00 (0.01) n.s. | –0.04 (0.01)*** |
| C_income_only (z-score) | –1.86 (1.26) n.s. | –0.11 (0.14) n.s. | 0.04 (0.01)*** | –0.18 (0.08)* |
Table 9.
Institutional quality, fragmentation and competitivenes.
| Variable | Coefficient | Robust SE | Significance |
|---|---|---|---|
| FF mult | –4.71 | 1.54 | *** |
| τ (WGI_comp) | –0.20 | 0.17 | n.s. |
| FF mult × τ | 0.94 | 1.01 | n.s. |
| Tech | 0.00016 | 0.00003 | *** |
| Shock_had | 0.2 | 0.09 | ** |
| Country FE | yes | ||
| Year FE | yes | ||
| N | 500+ | ||
| R² | 0.84 |
Table 10.
Robustness to alternative standard errors.
| Specification | FF mult (SE) | Tech (SE) | Shock_had (SE) | R² |
|---|---|---|---|---|
| HC3 (baseline) | –3.73 (0.63)*** | 0.000157 (0.000031)*** | 0.197 (0.086)** | 0.843 |
| Clustered by country | –3.68 (0.71)*** | 0.000159 (0.000035)*** | 0.210 (0.095)** | 0.843 |
| Driscoll–Kraay (T=20) | –3.61 (0.78)*** | 0.000155 (0.000037)*** | 0.185 (0.090)** | 0.843 |
Disclaimer/Publisher’s Note: The statements, opinions and data contained in all publications are solely those of the individual author(s) and contributor(s) and not of MDPI and/or the editor(s). MDPI and/or the editor(s) disclaim responsibility for any injury to people or property resulting from any ideas, methods, instructions or products referred to in the content. |
© 2026 by the authors. Licensee MDPI, Basel, Switzerland. This article is an open access article distributed under the terms and conditions of the Creative Commons Attribution (CC BY) license (http://creativecommons.org/licenses/by/4.0/).
Copyright: This open access article is published under a Creative Commons CC BY 4.0 license, which permit the free download, distribution, and reuse, provided that the author and preprint are cited in any reuse.


