
Submitted:
26 January 2026
Posted:
26 January 2026
You are already at the latest version
Abstract
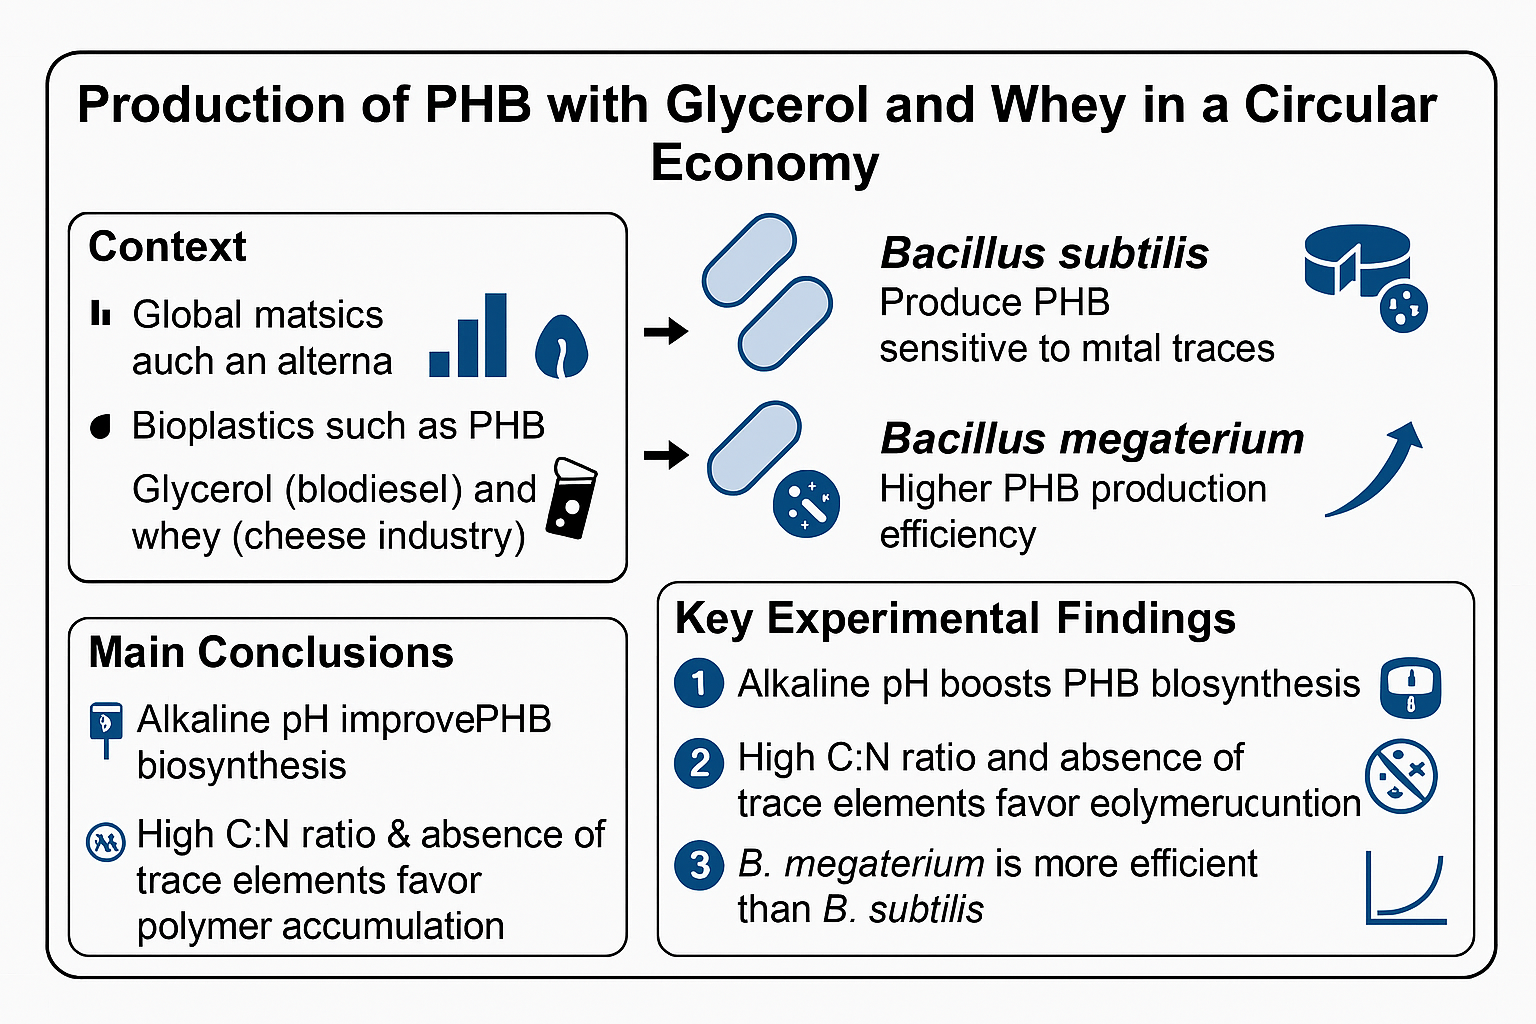
From 1950 to the present, plastic production and use have increased mainly because plastics possess qualities like stability, light weight, versatility, and decreasing production costs. However, most plastics are not biodegradable, and only a small portion is recycled worldwide. Bioplastics serve as an alternative if they are biodegradable and derived from residual materials, promoting a circular economy. PHB is a polymer with characteristics similar to some commercial plastics. It was discovered in the 1920s and has been examined by researchers and engineers since then due to its potential as a biodegradable bioplastic. Some microorganisms can produce PHB under controlled conditions. In this work, PHB production was analyzed using two strains: Bacillus subtilis and Bacillus megaterium. Using two byproducts—whey and glycerol—as substrates and varying the culture media compositions. Both byproducts and both strains are suitable for PHB production; the absence of nitrogen and trace element sources enhances PHB yield. Additionally, bacterial growth, substrate uptake, and PHB production were modeled using logistic growth and the Luedeking-Piret models.
Keywords:
1. Introduction
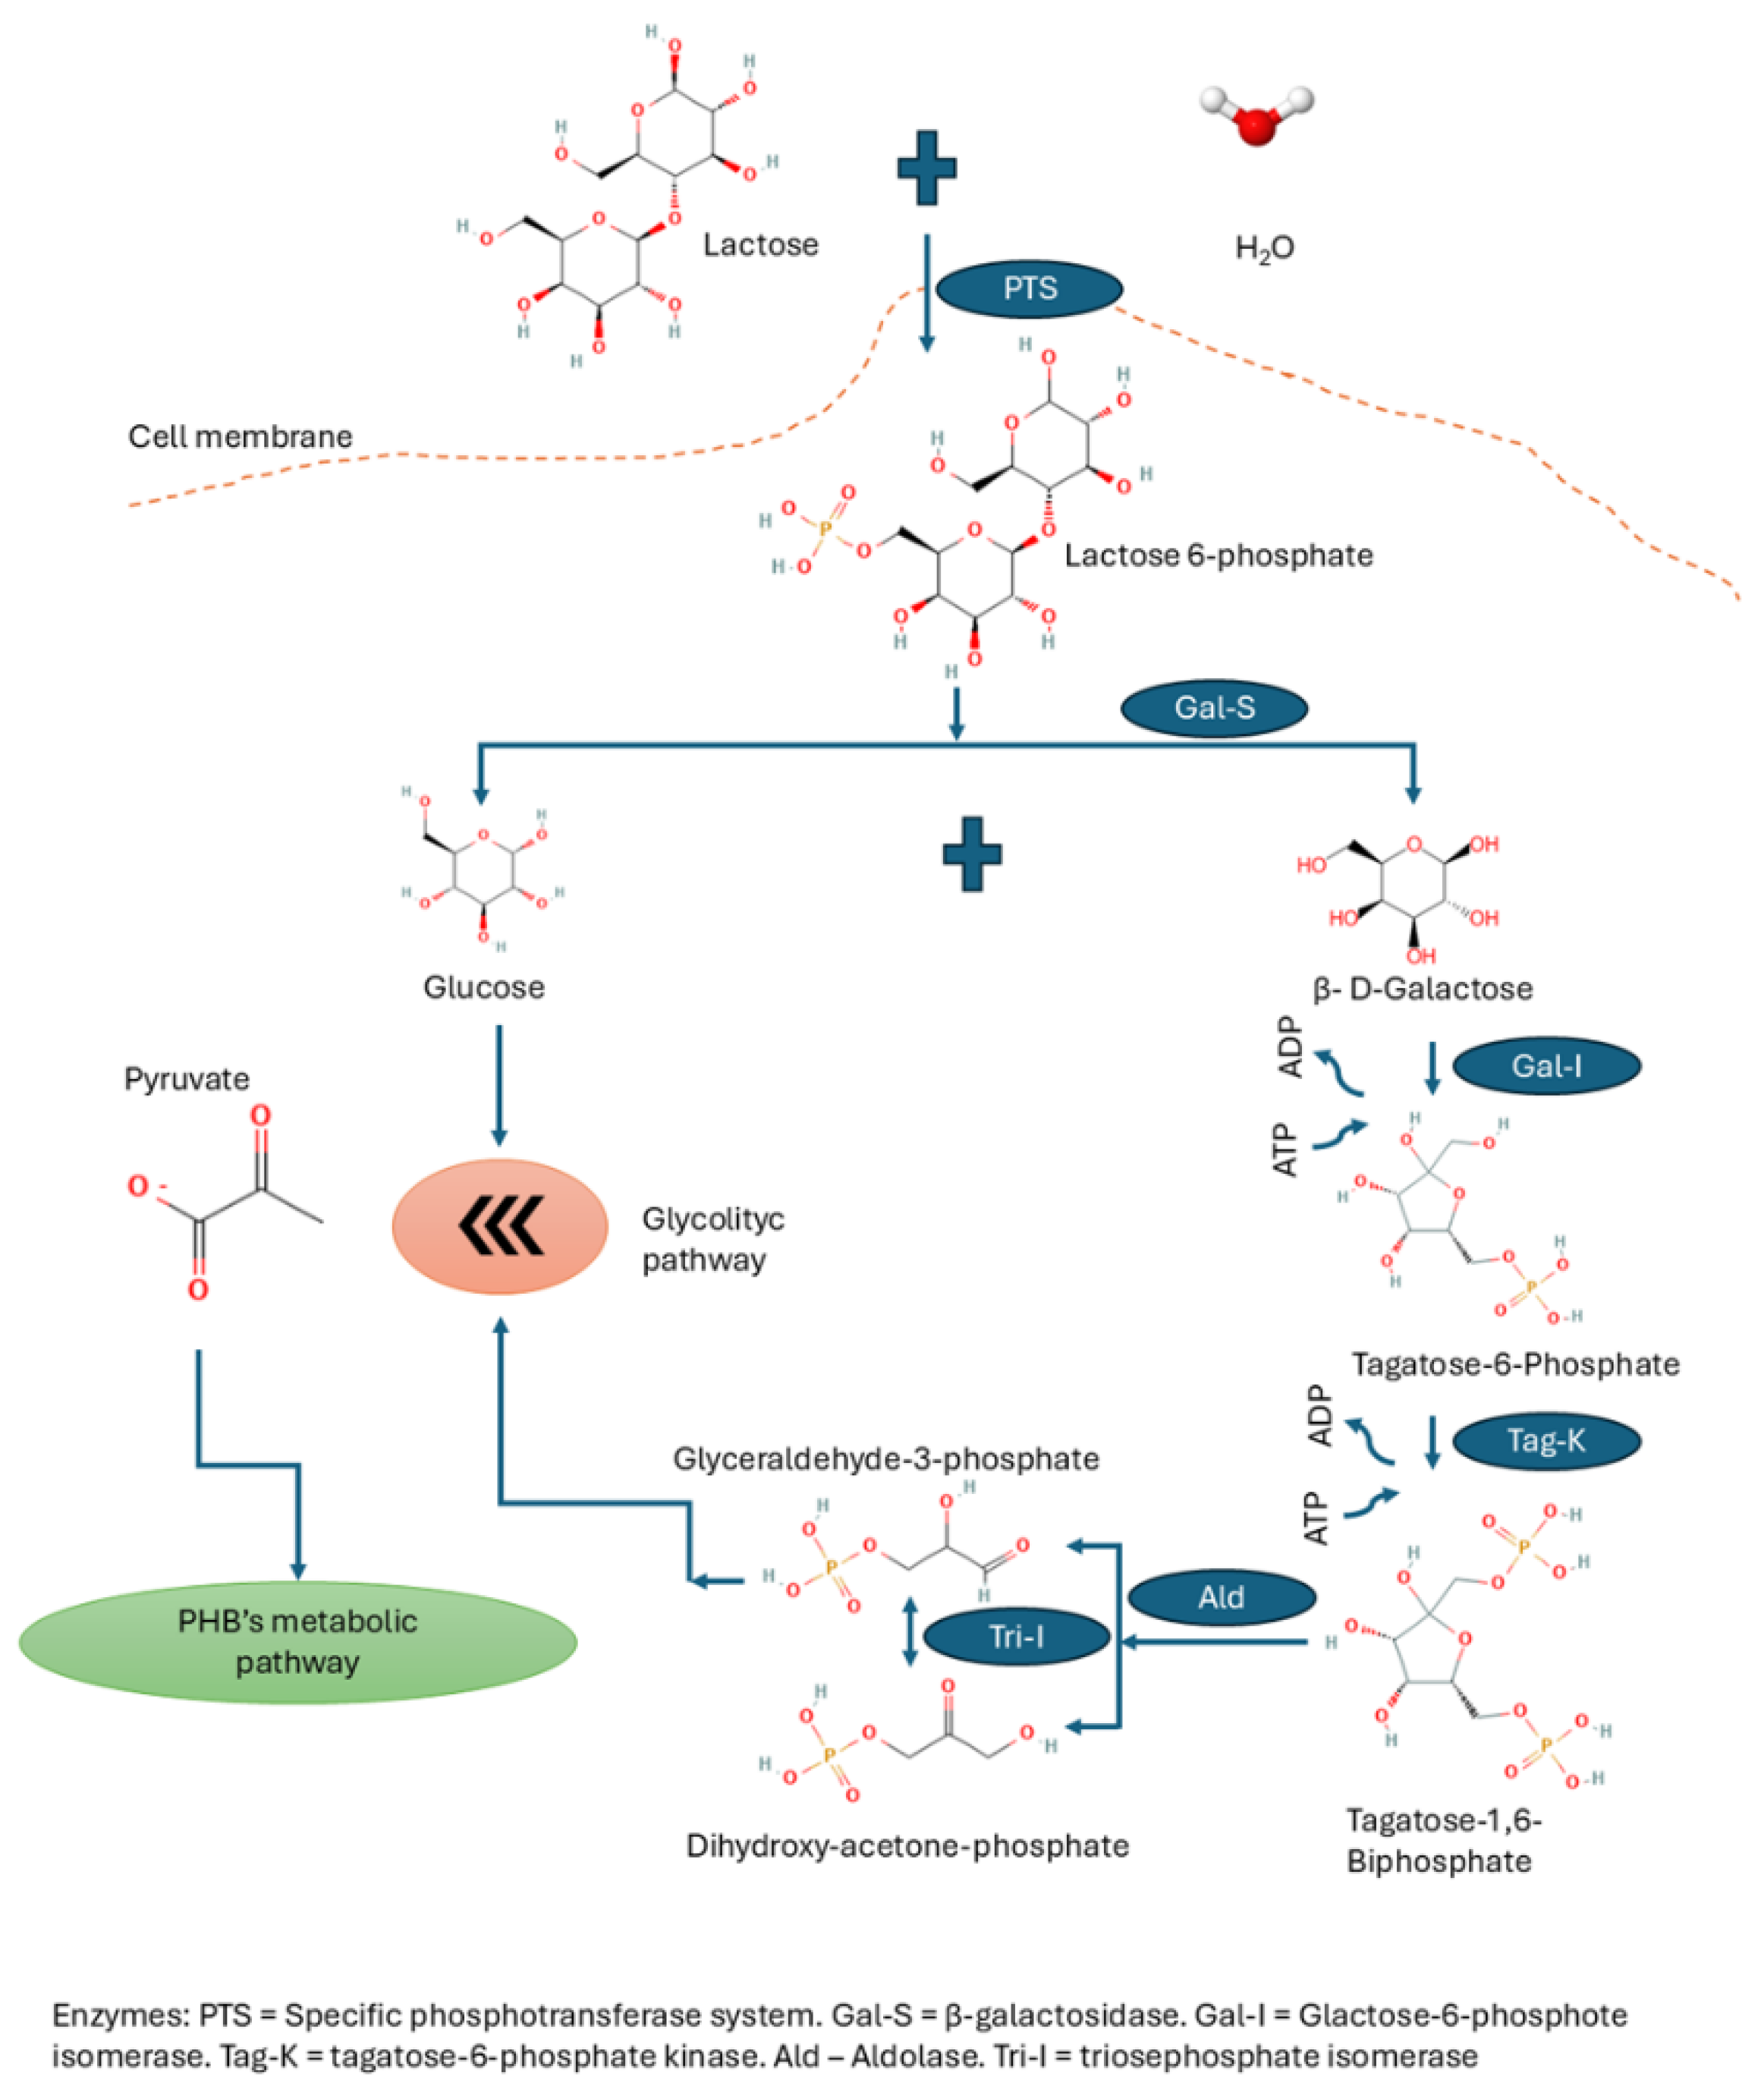
Metabolic Pathways
Whey as Substrate
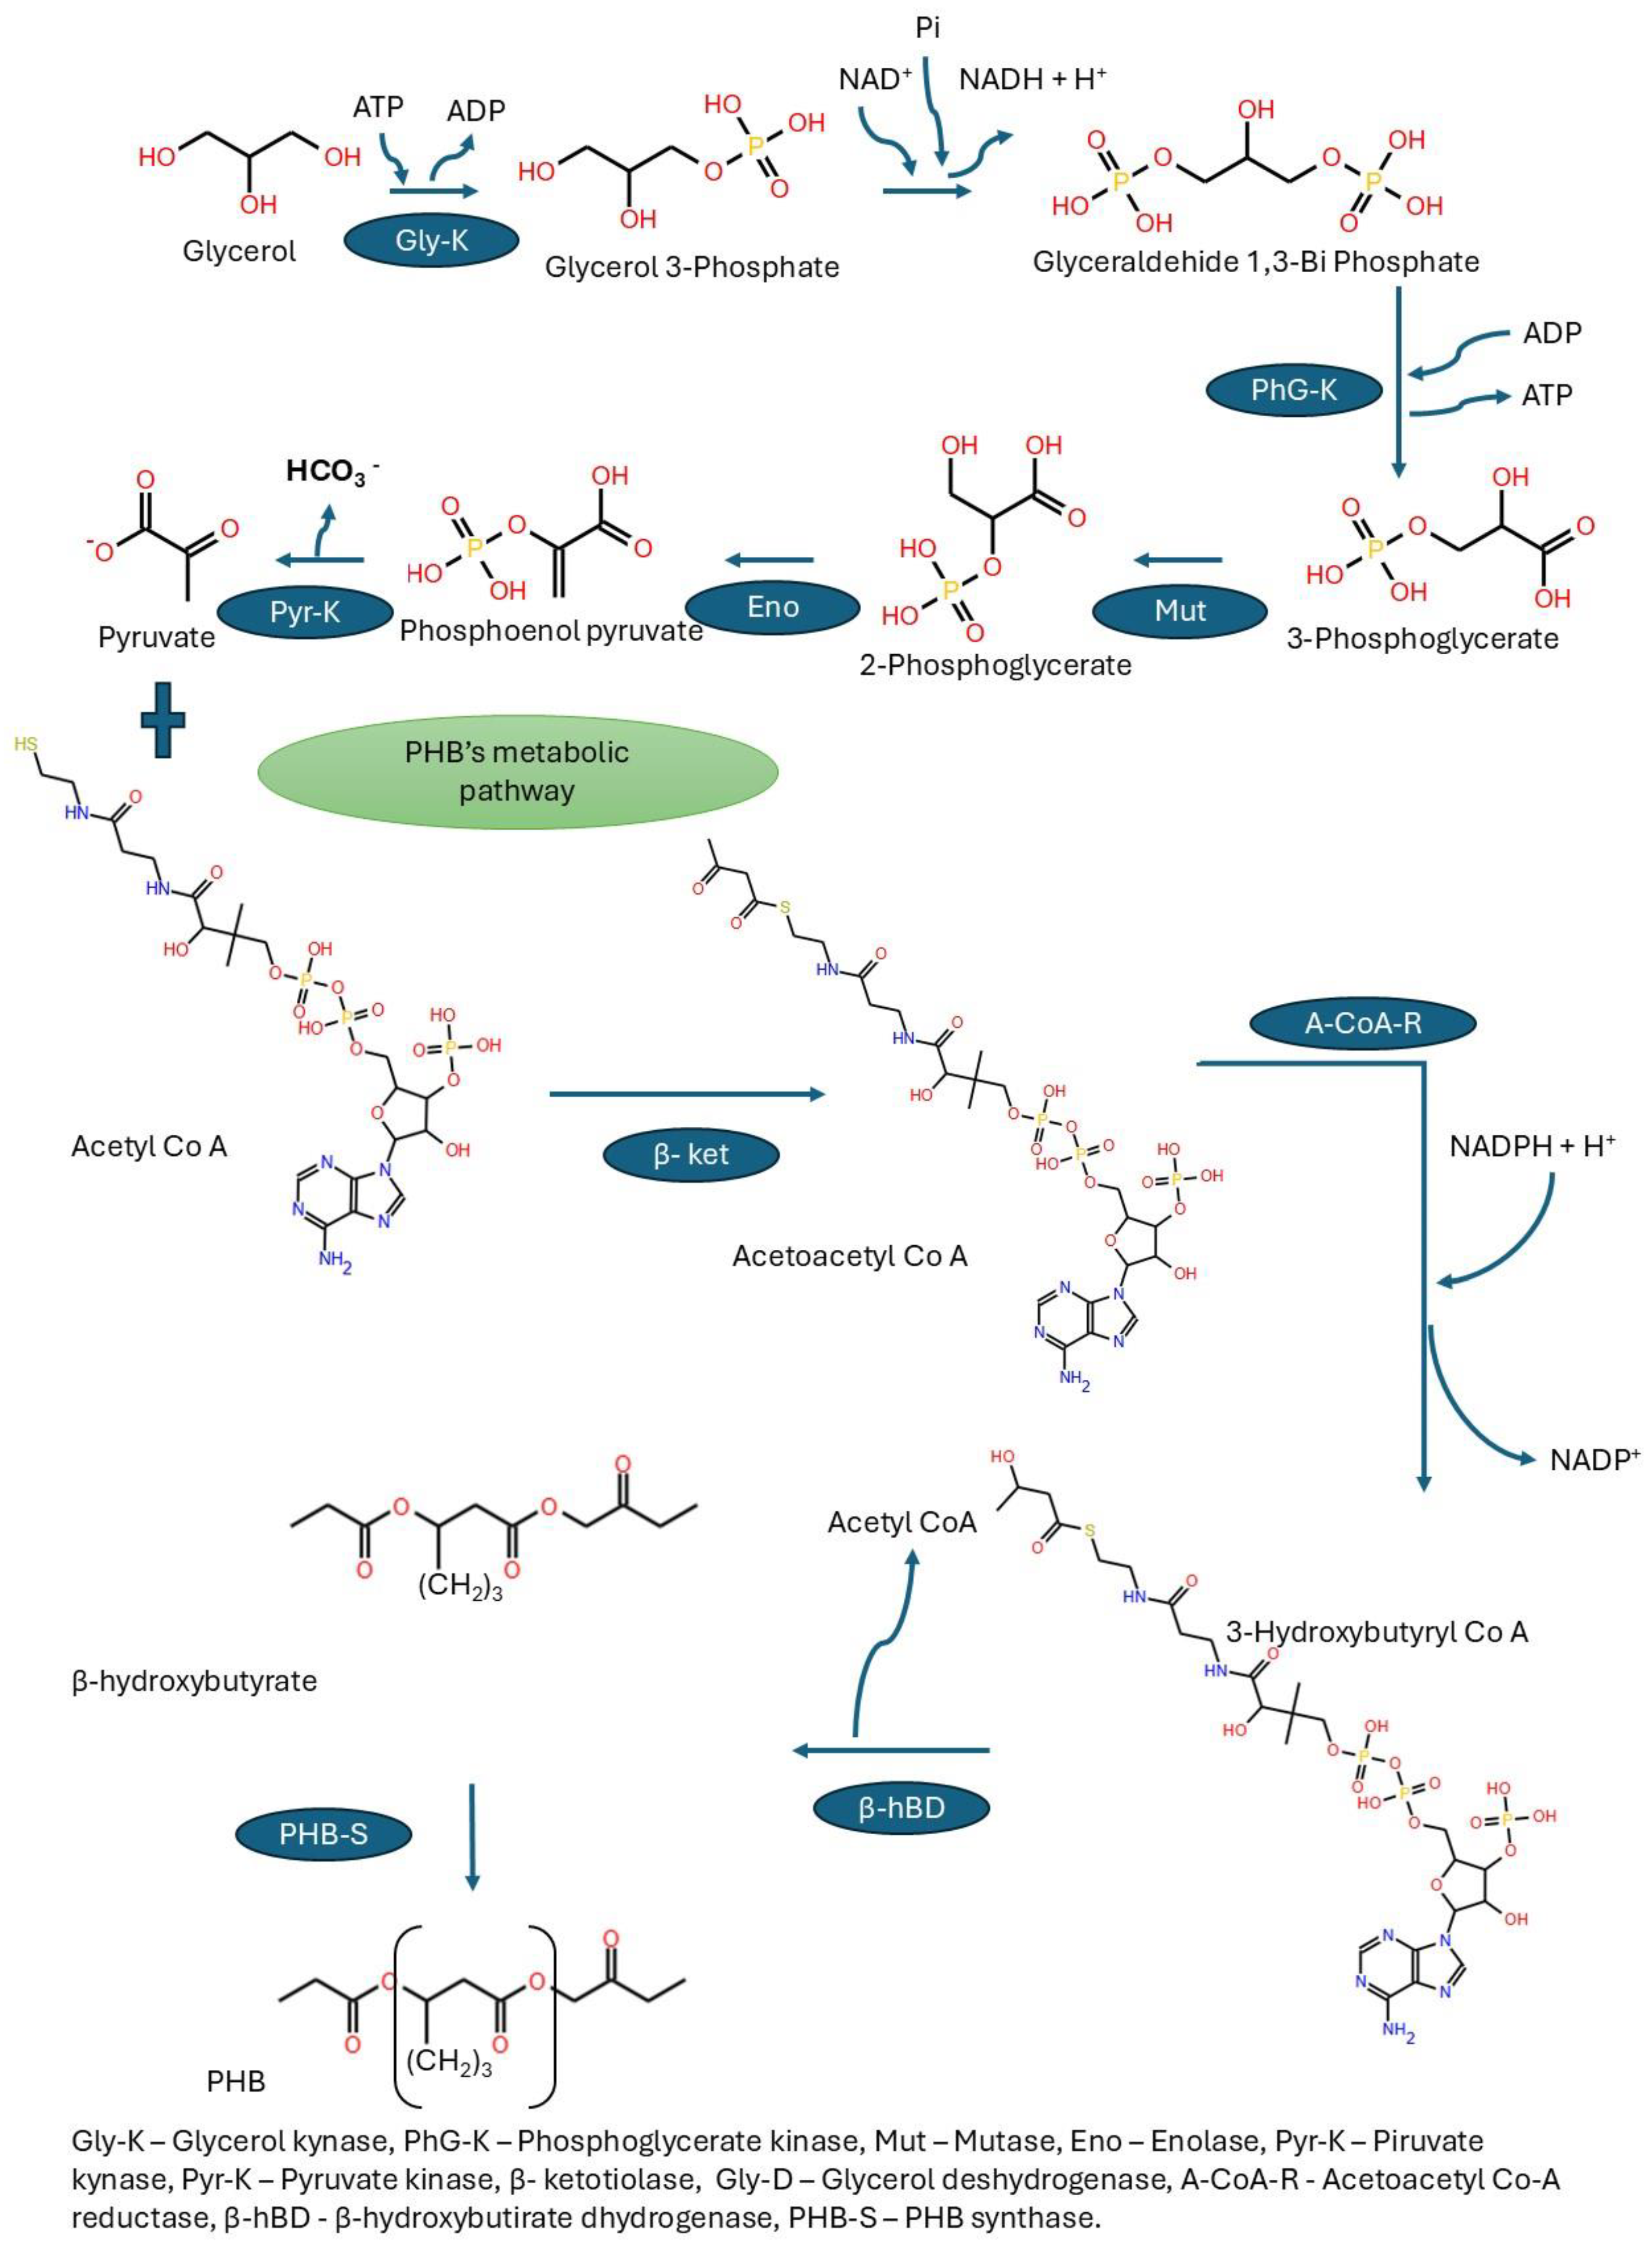
Glycerol as Substrate
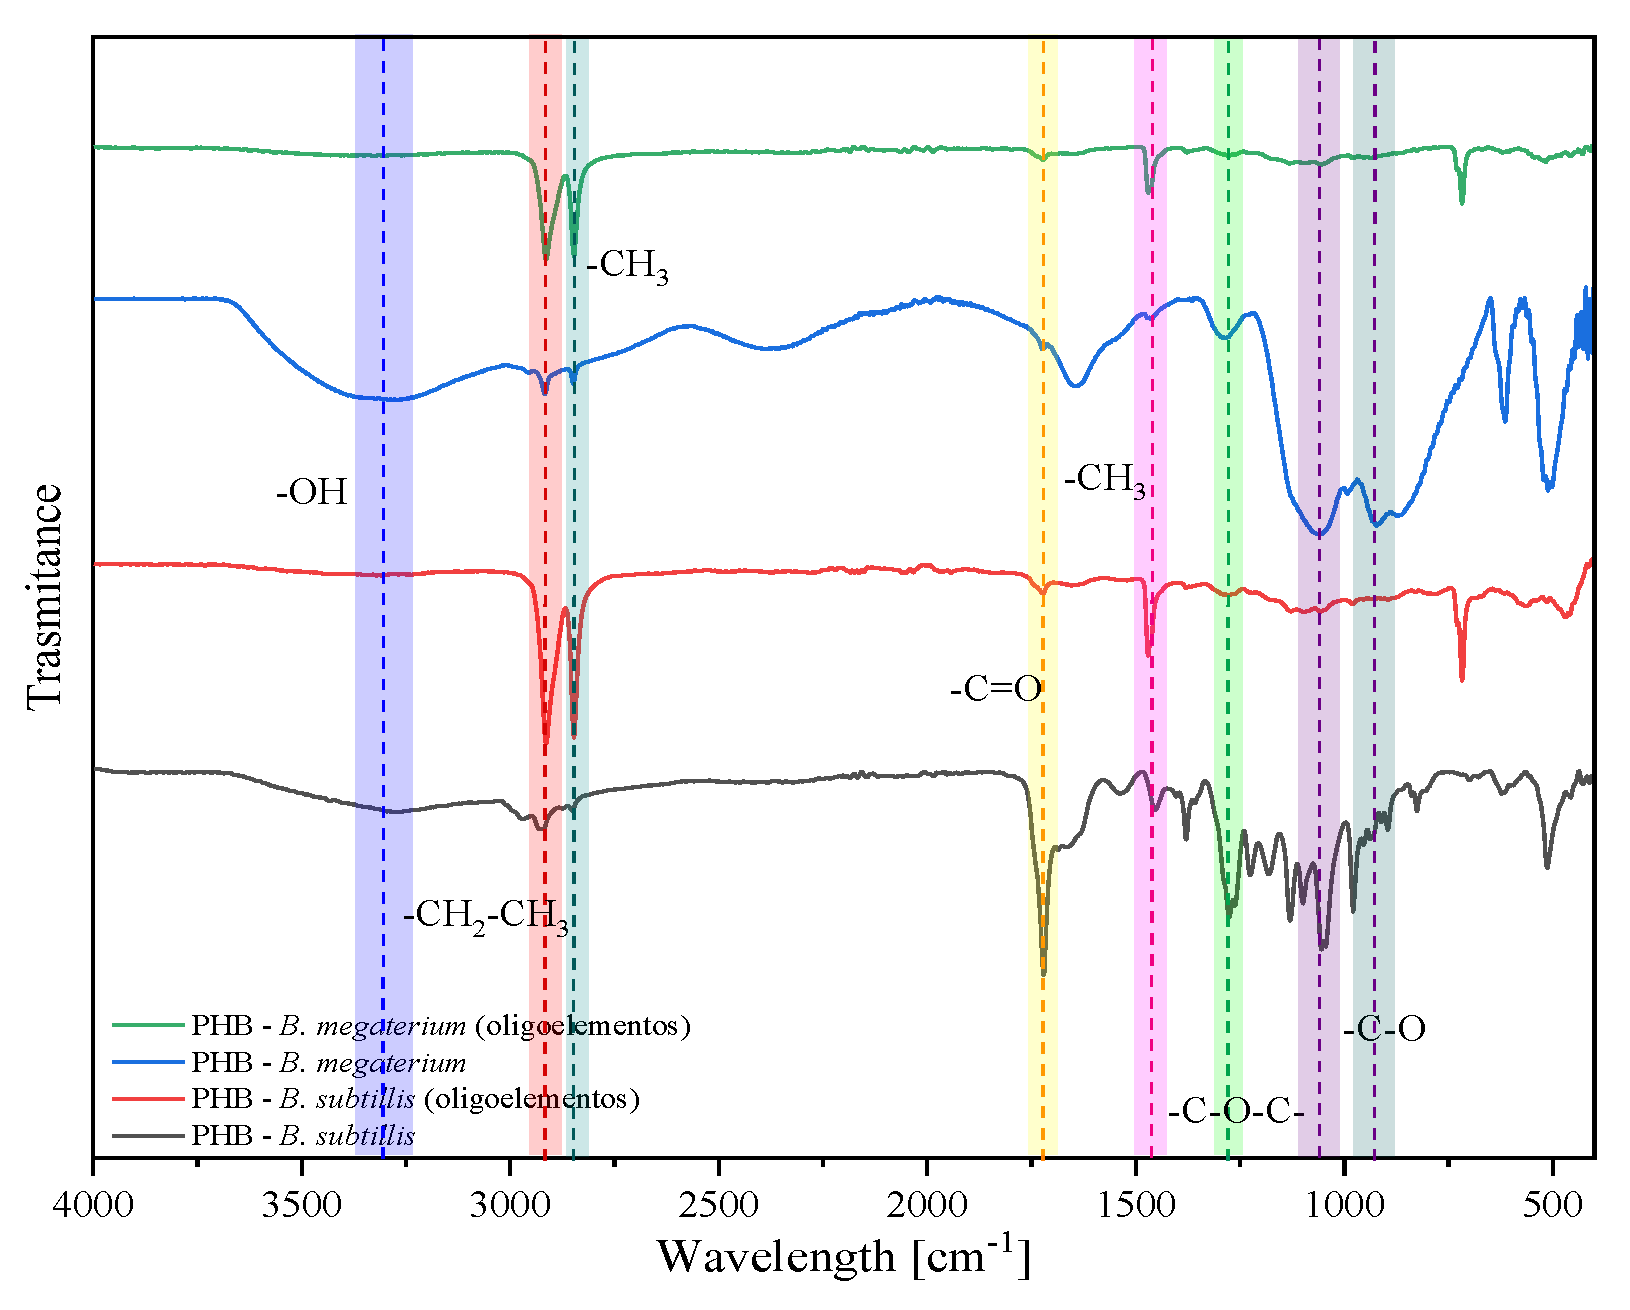
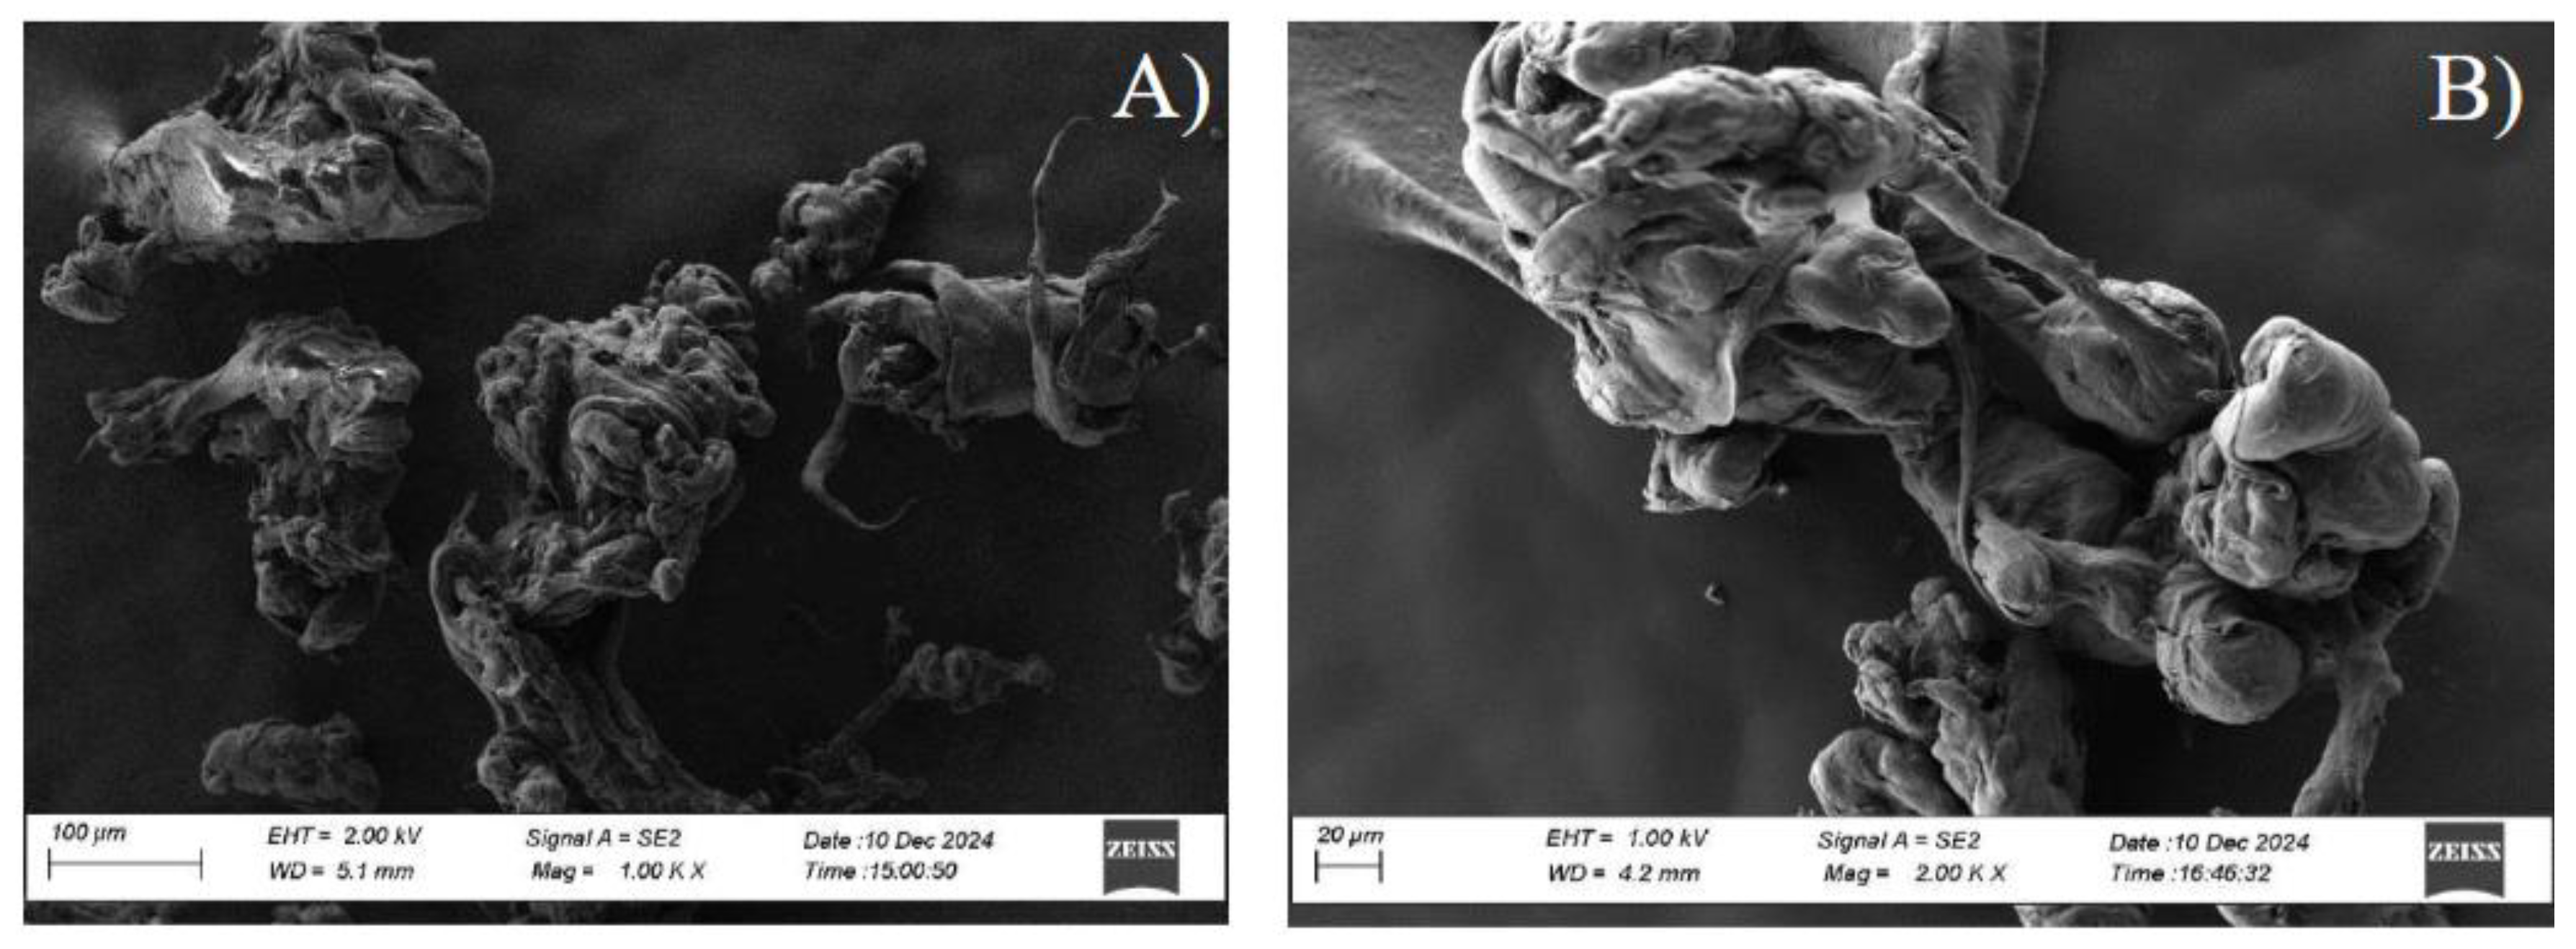
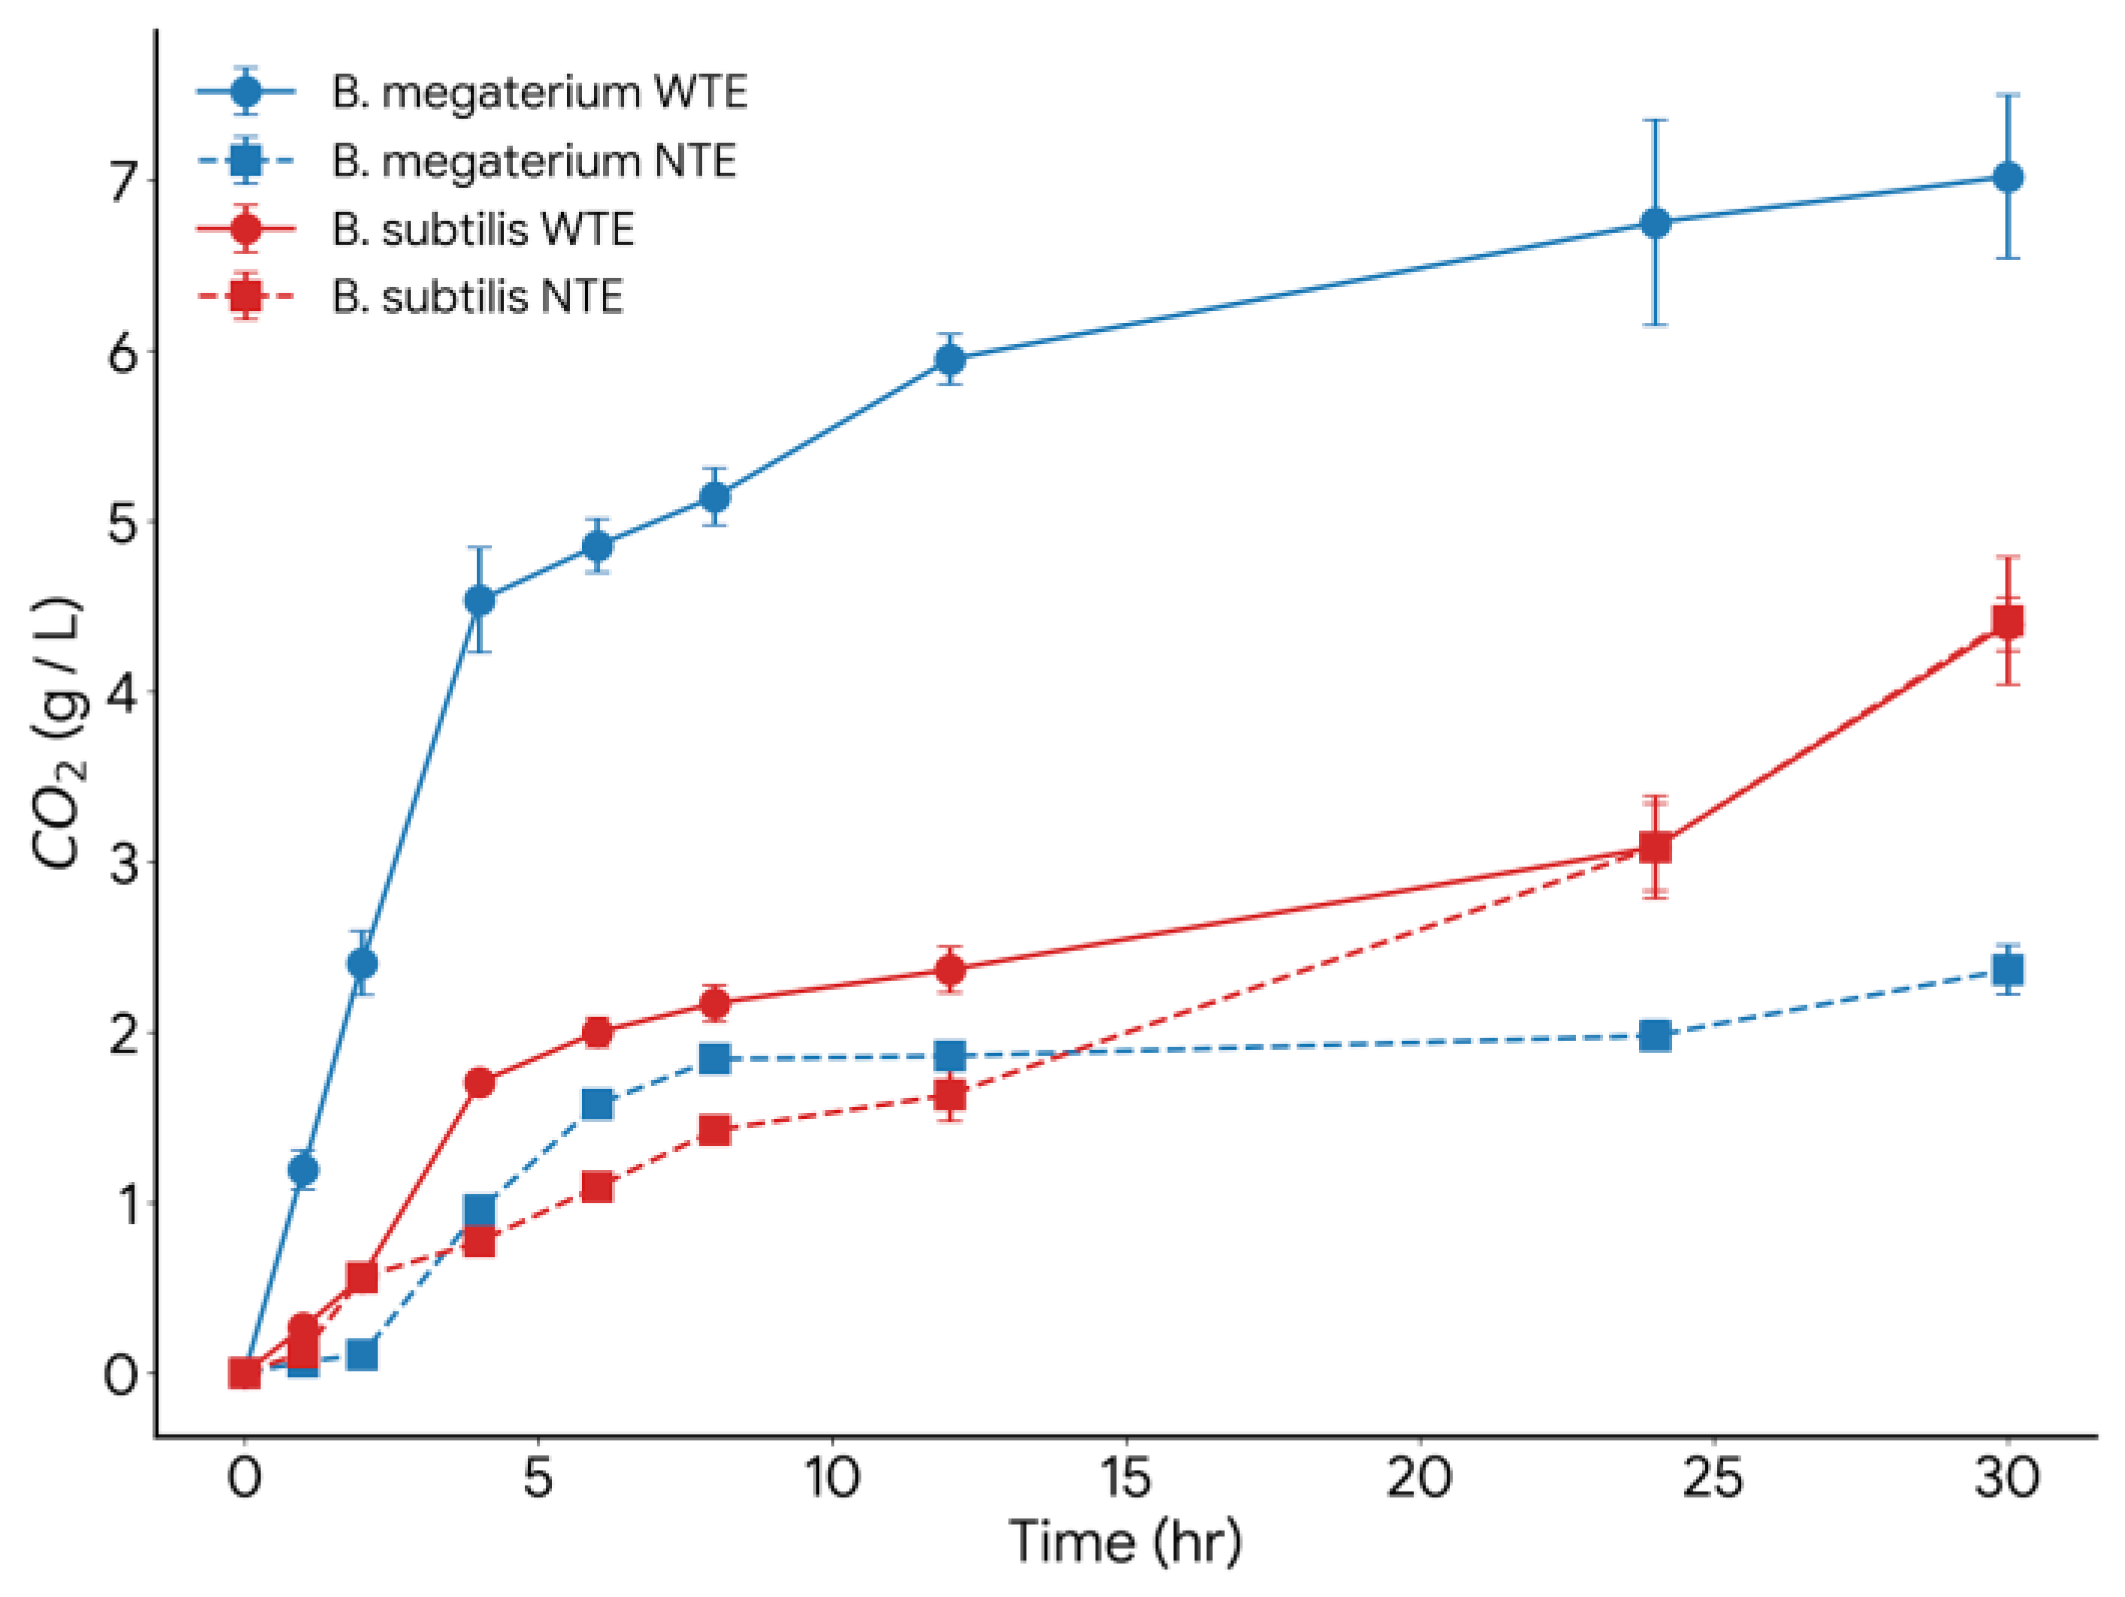
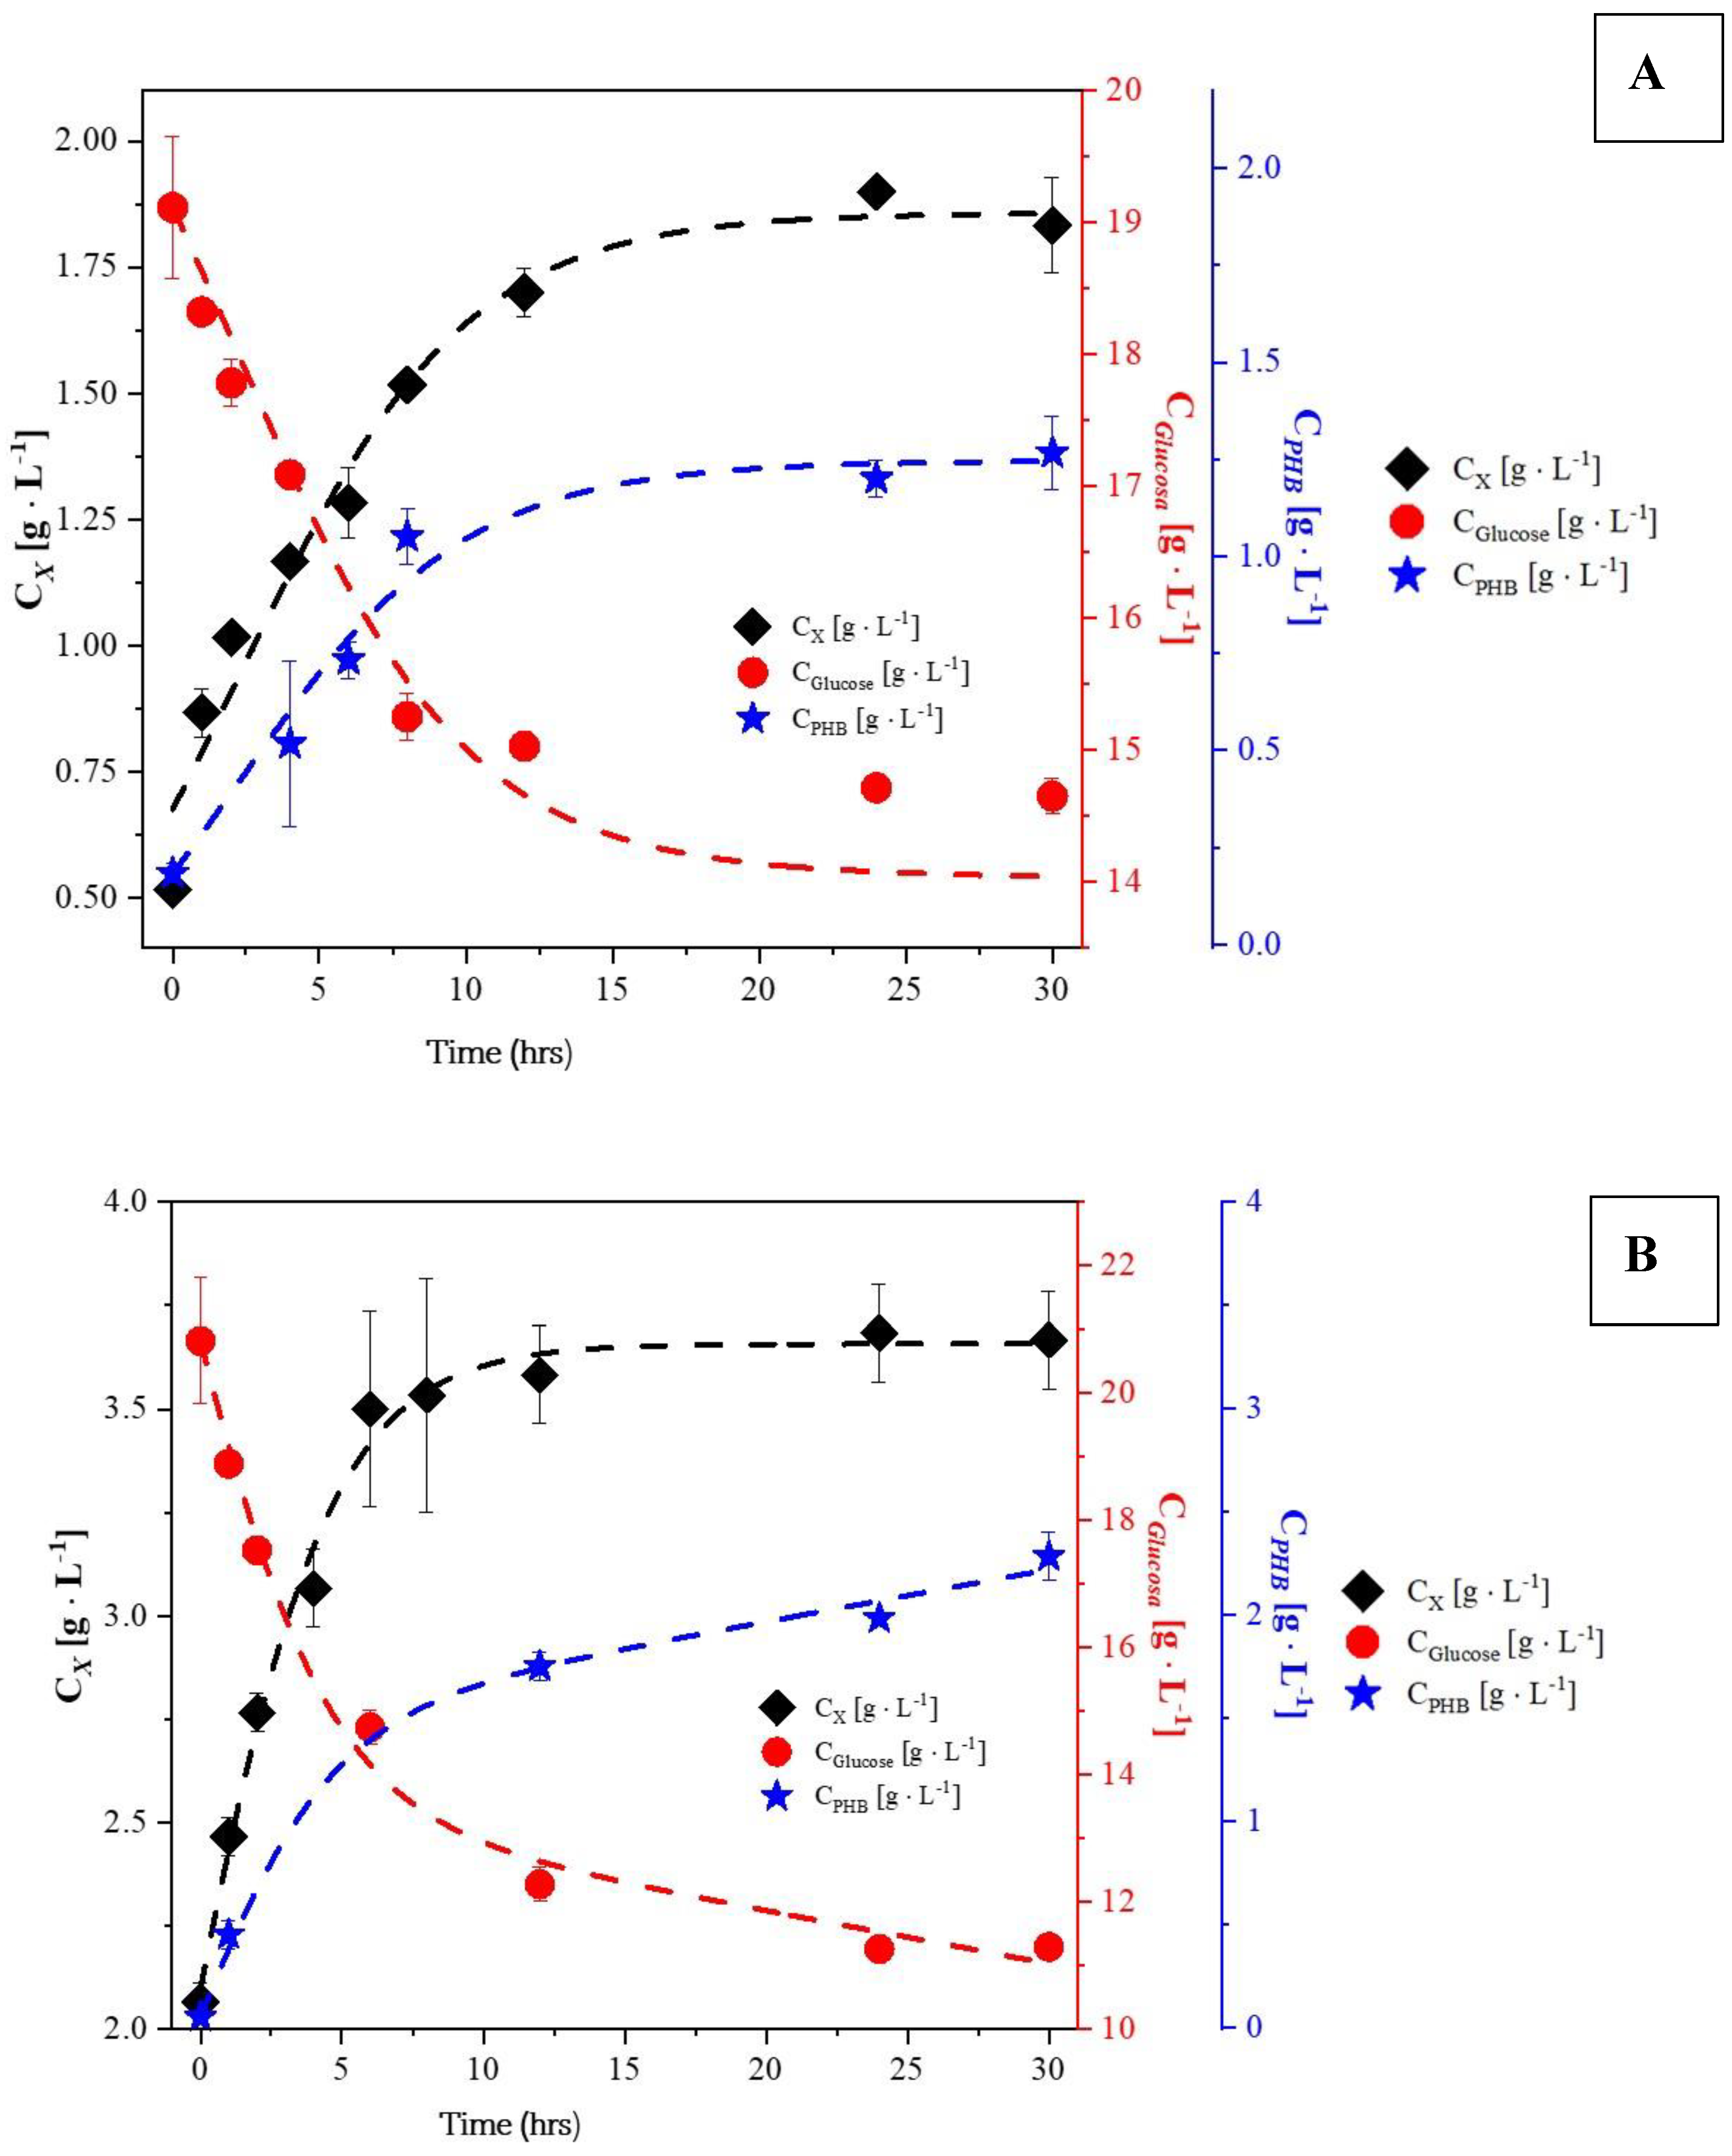
2. Results and Discussion
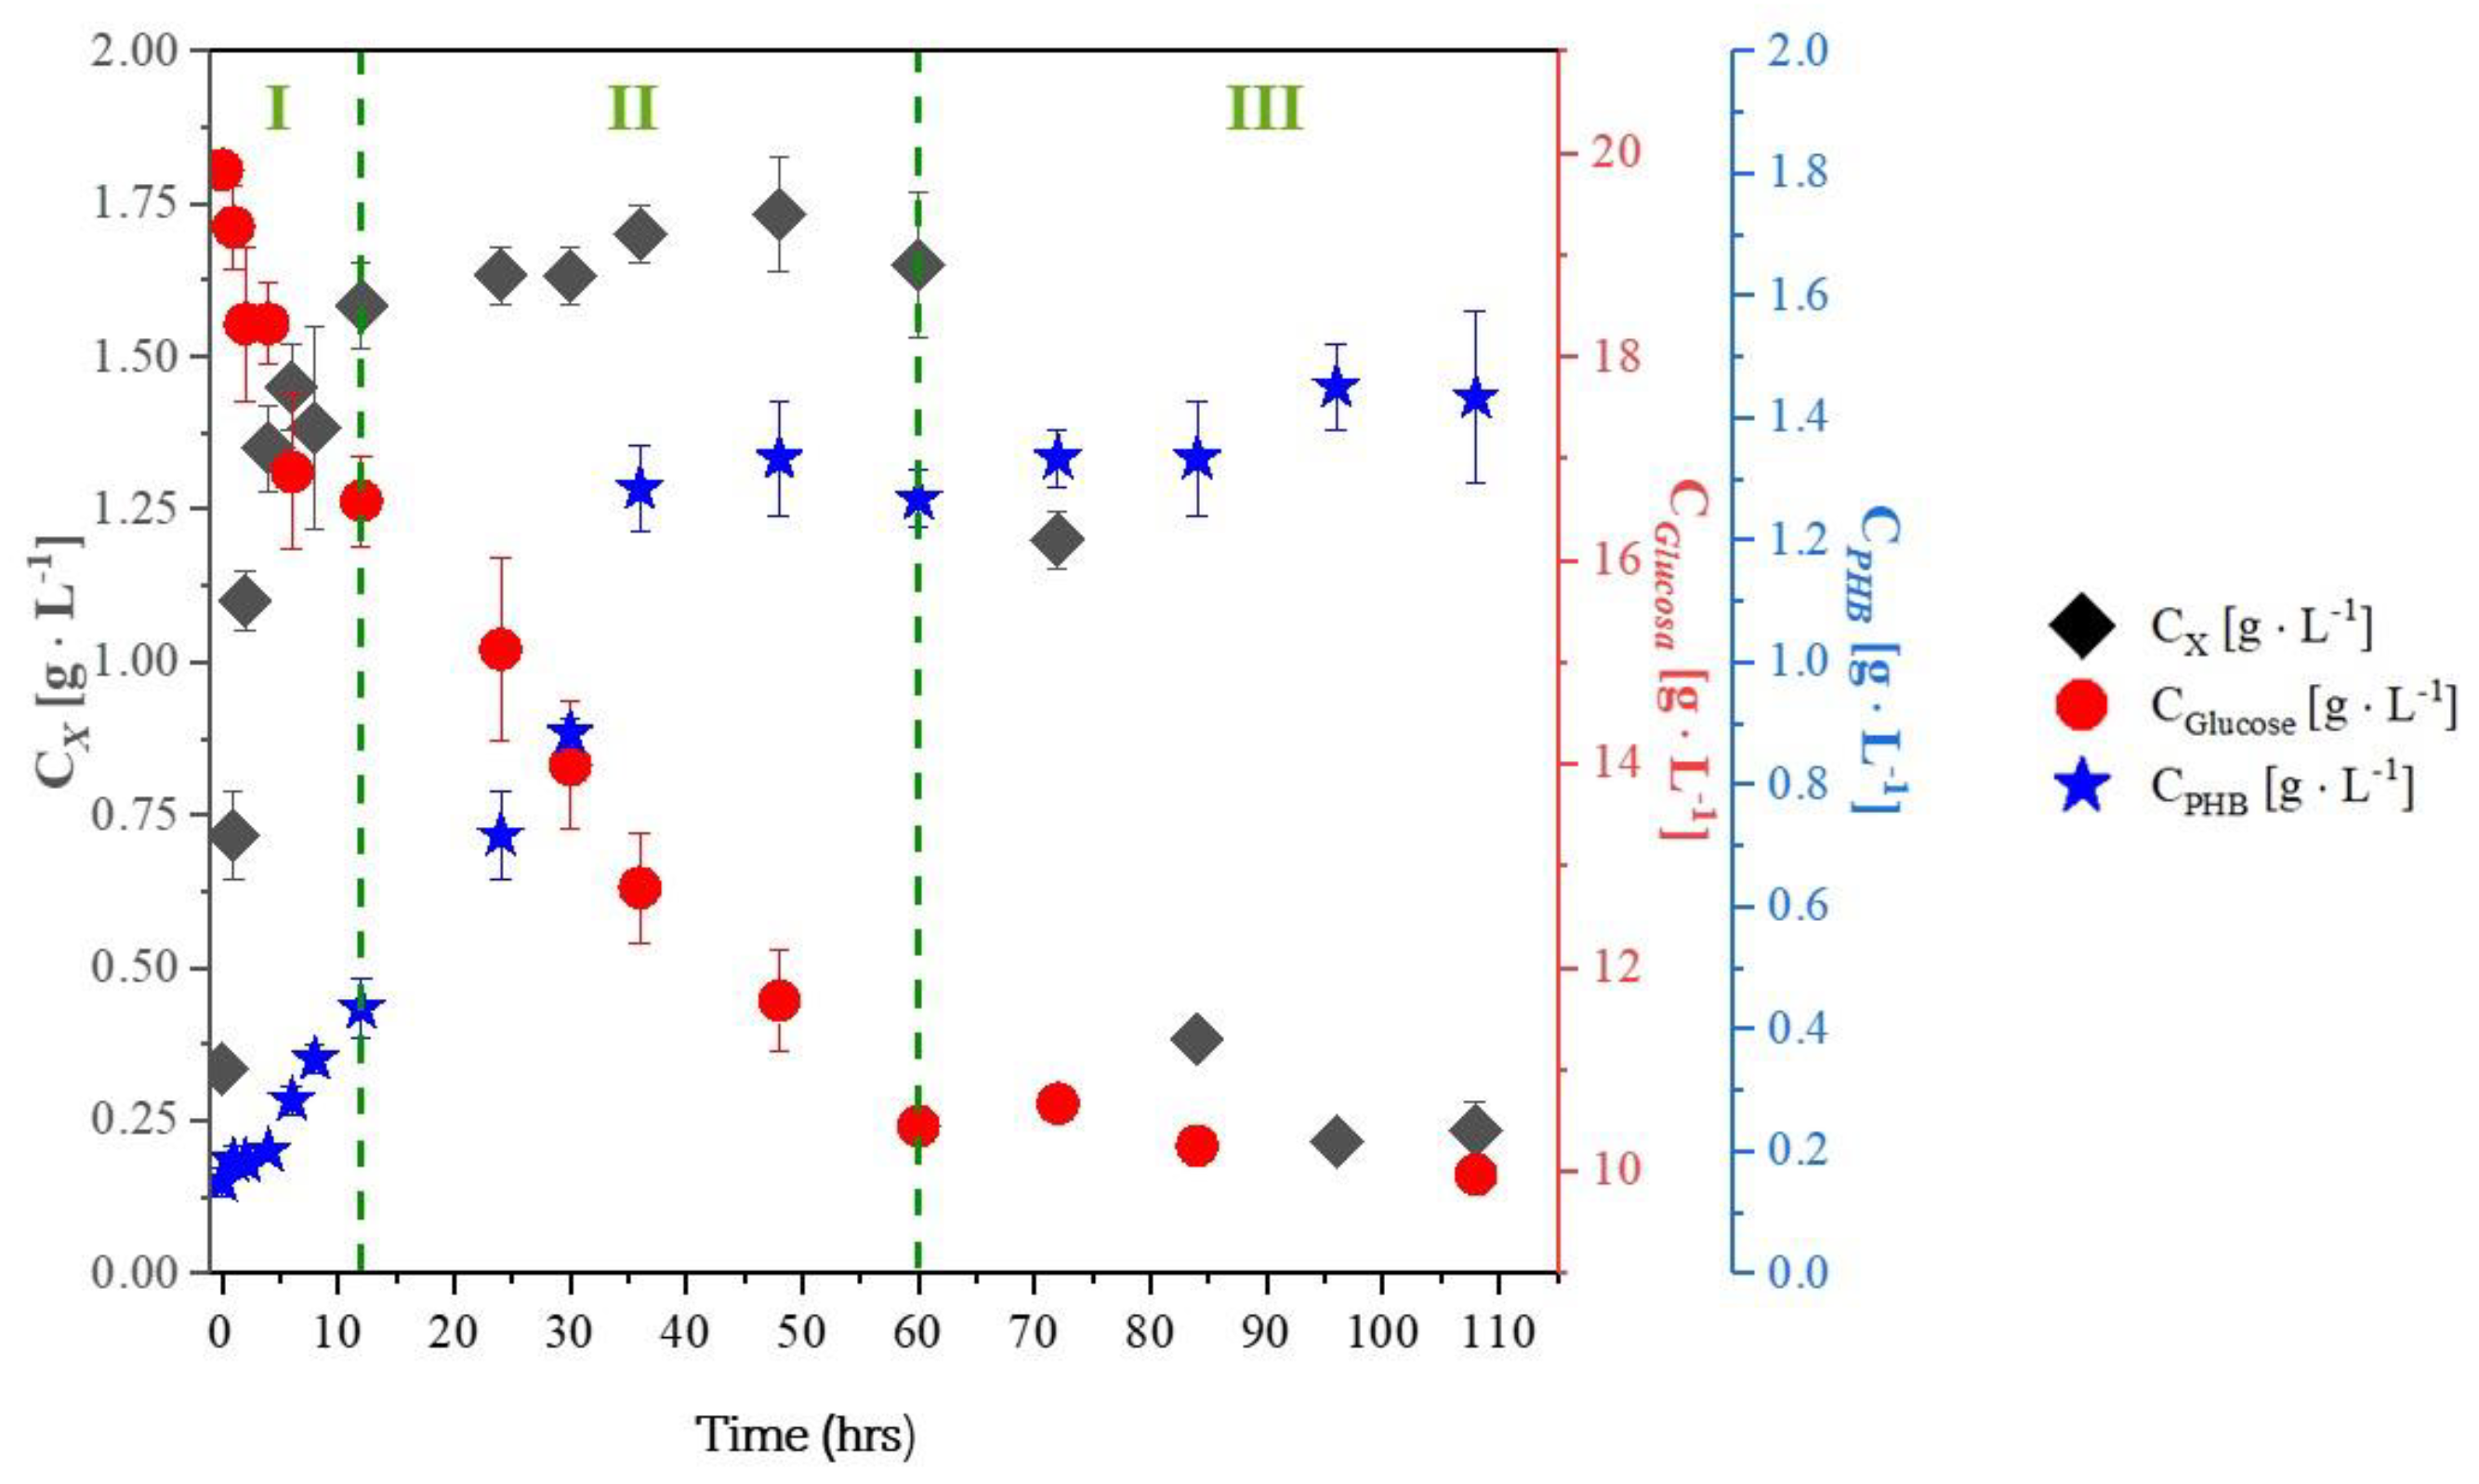
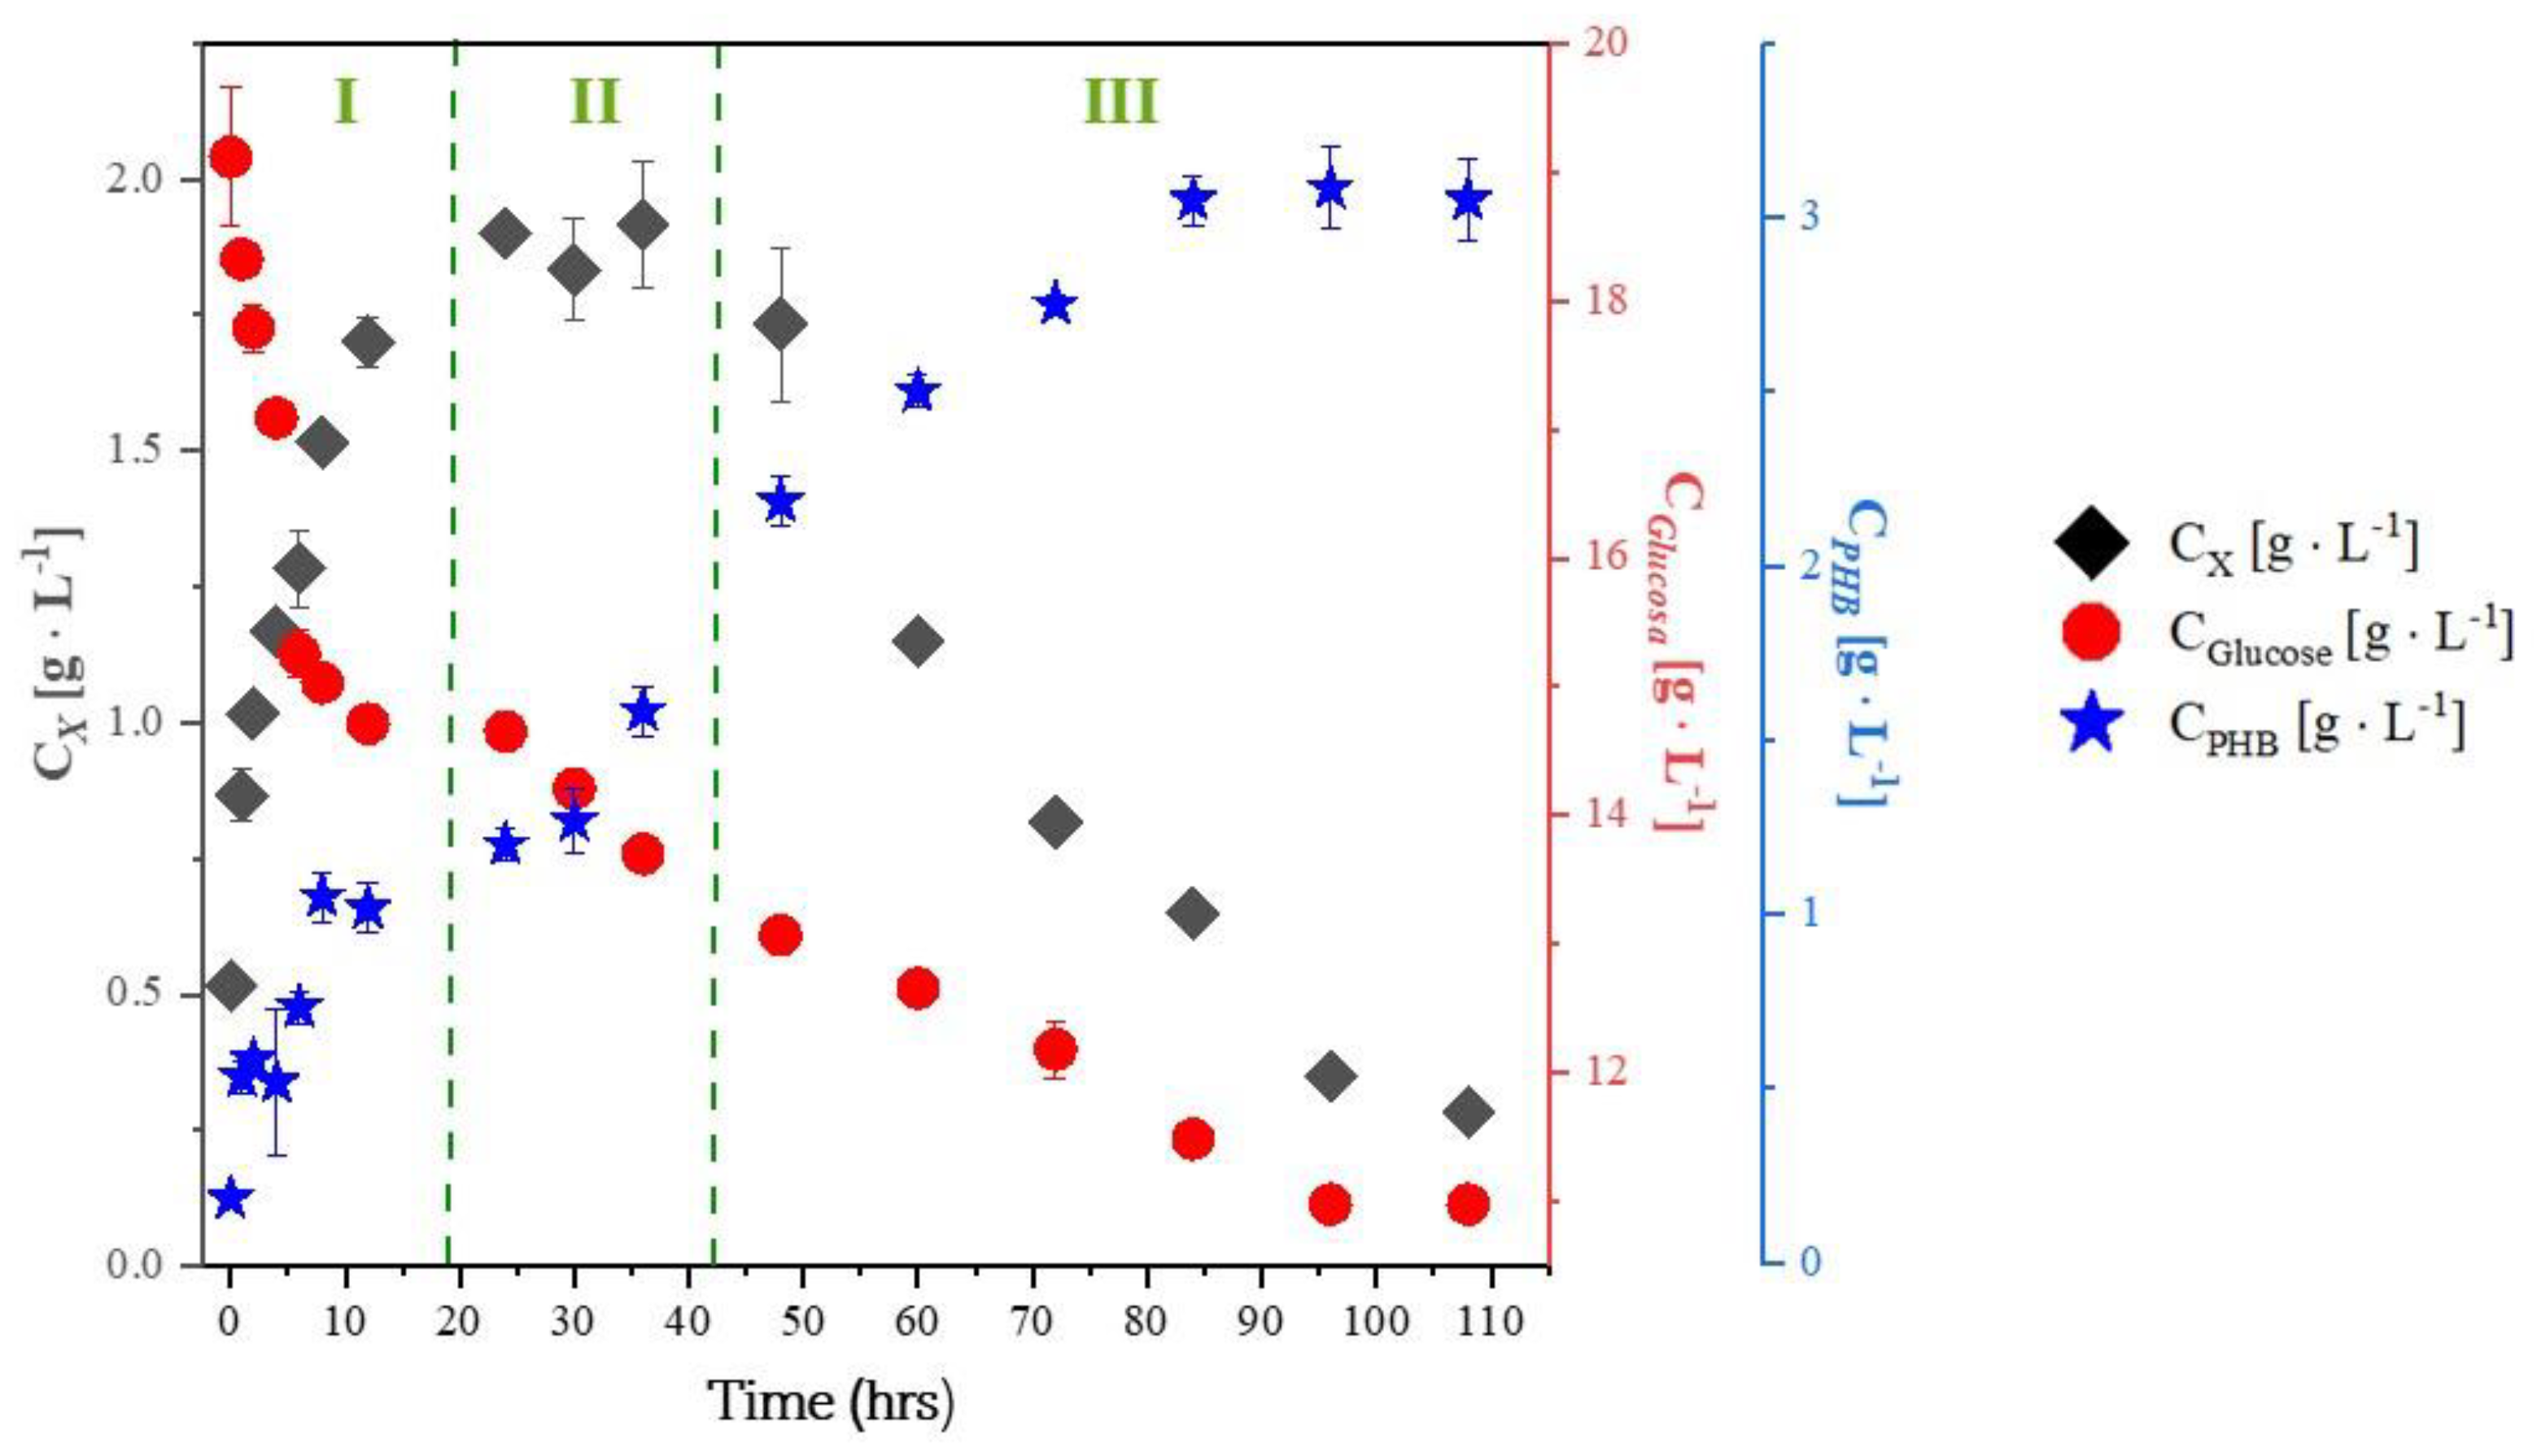
2.1. Experiments with Whey
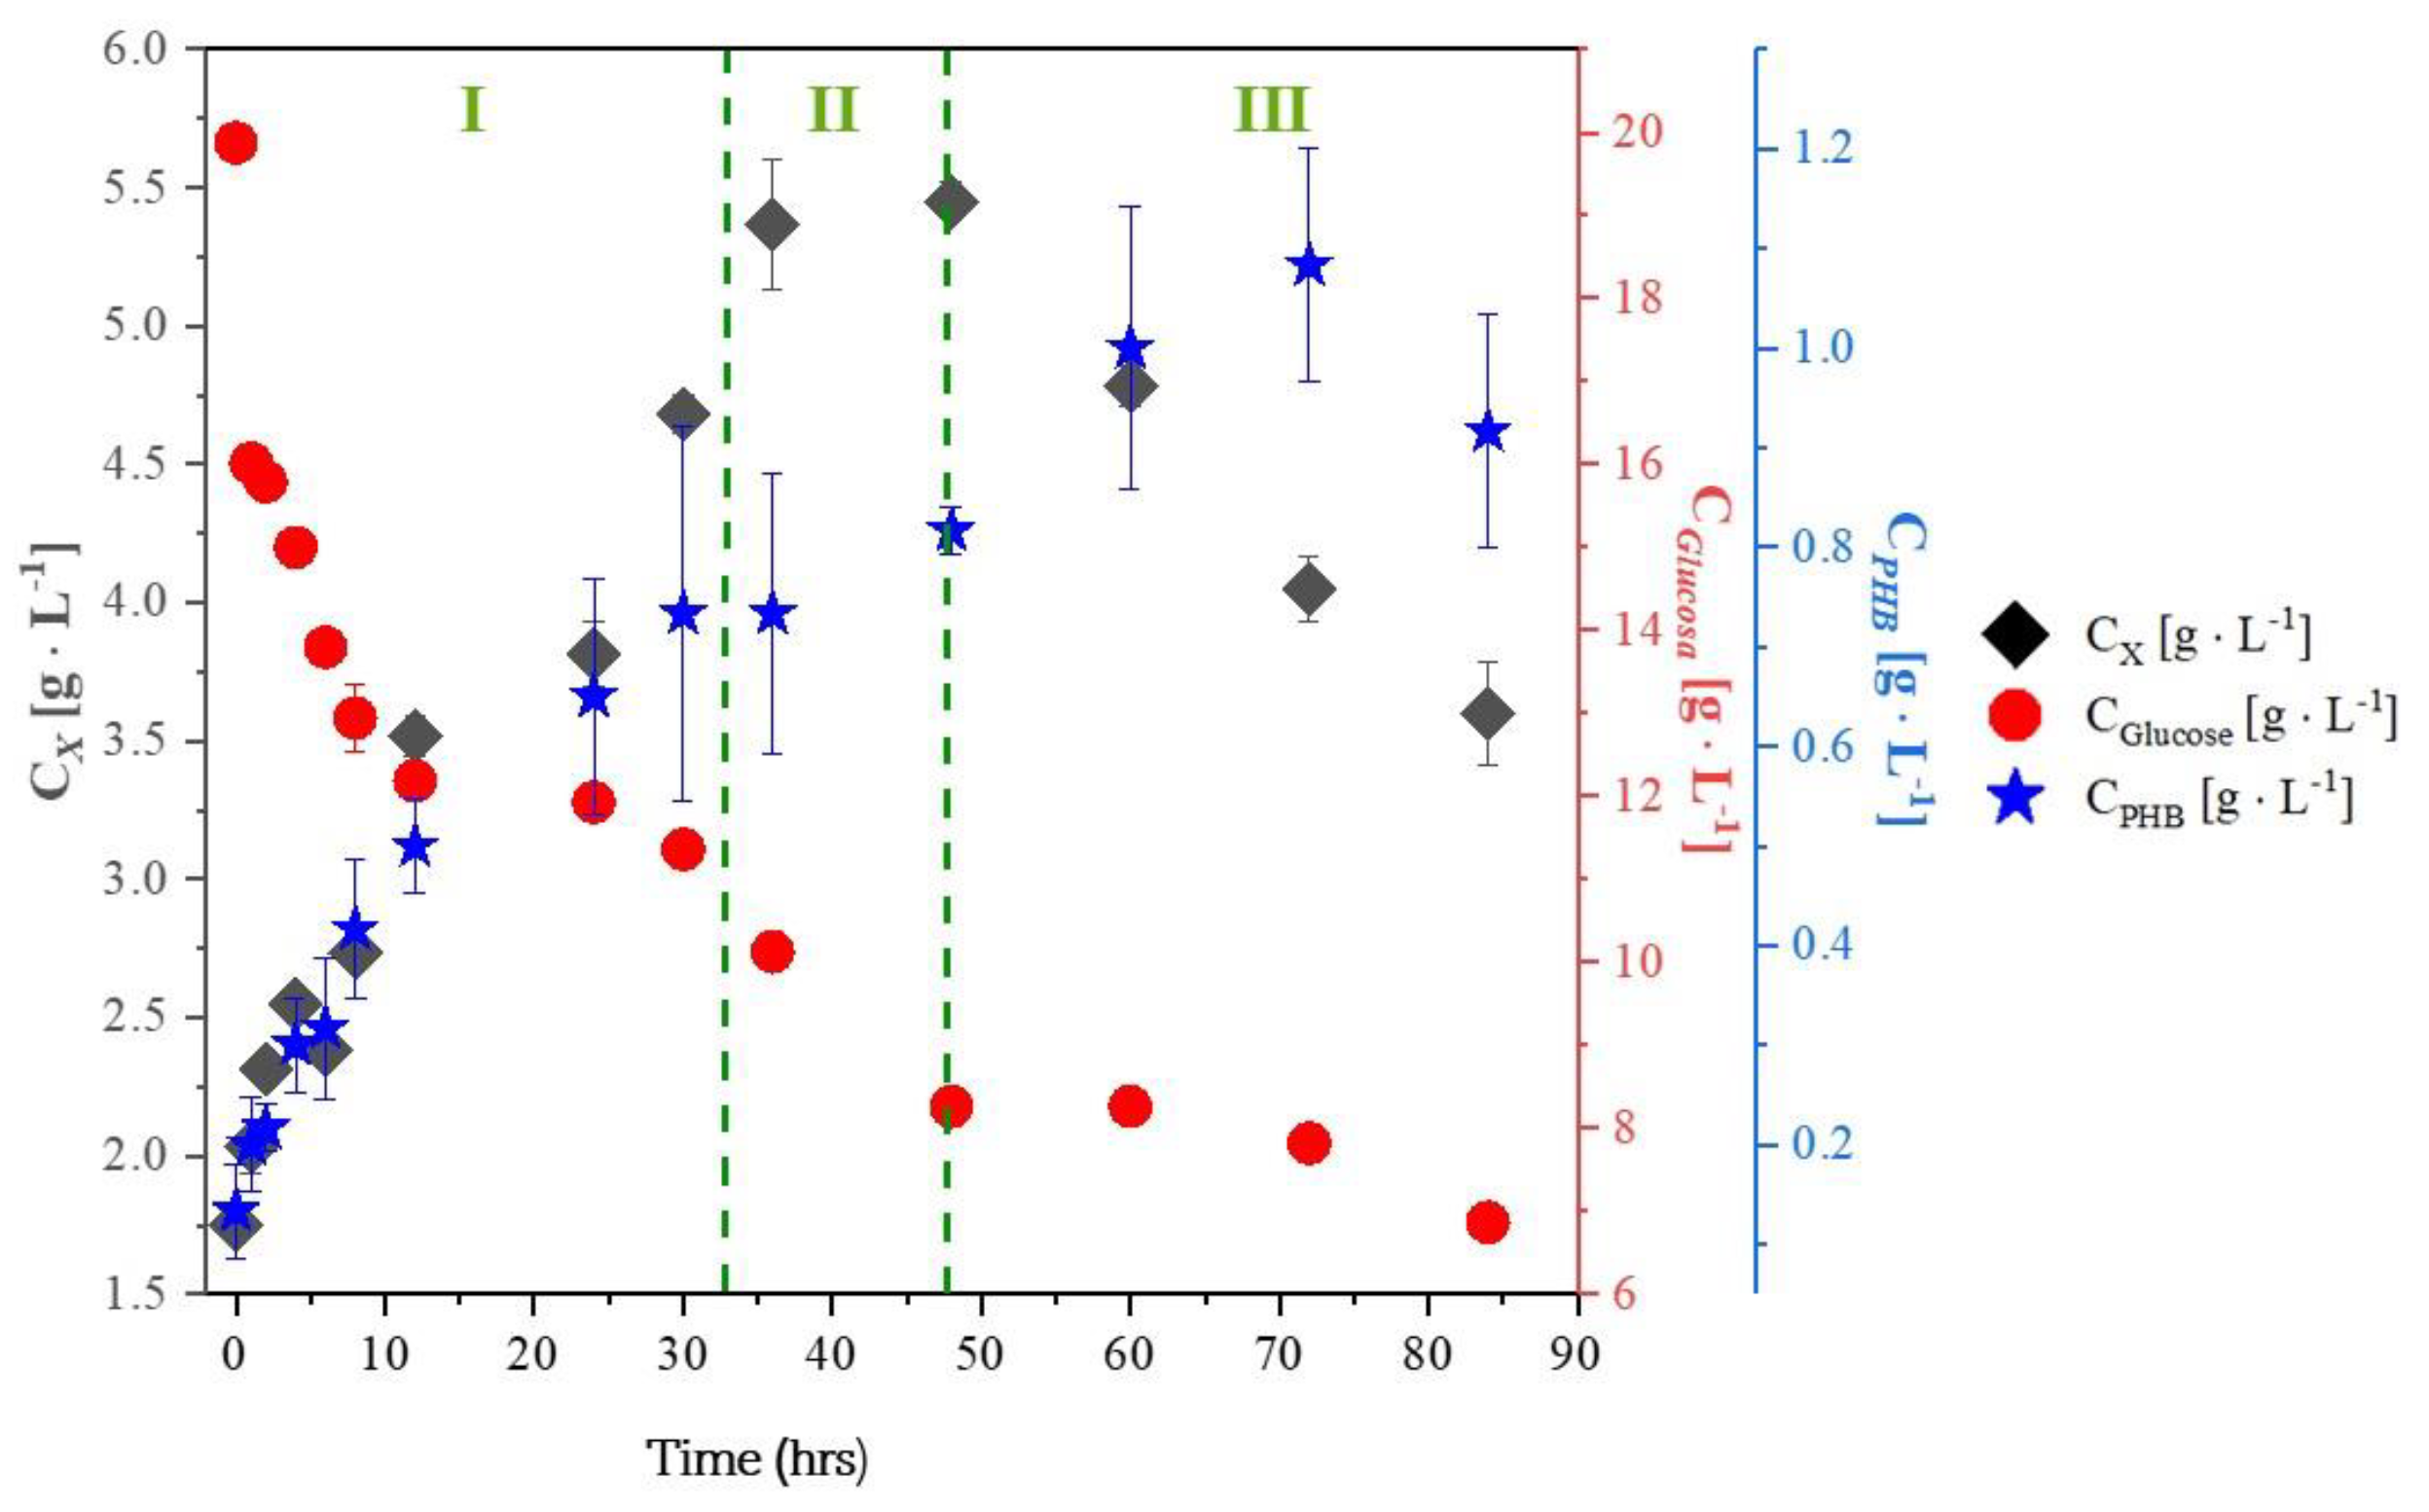
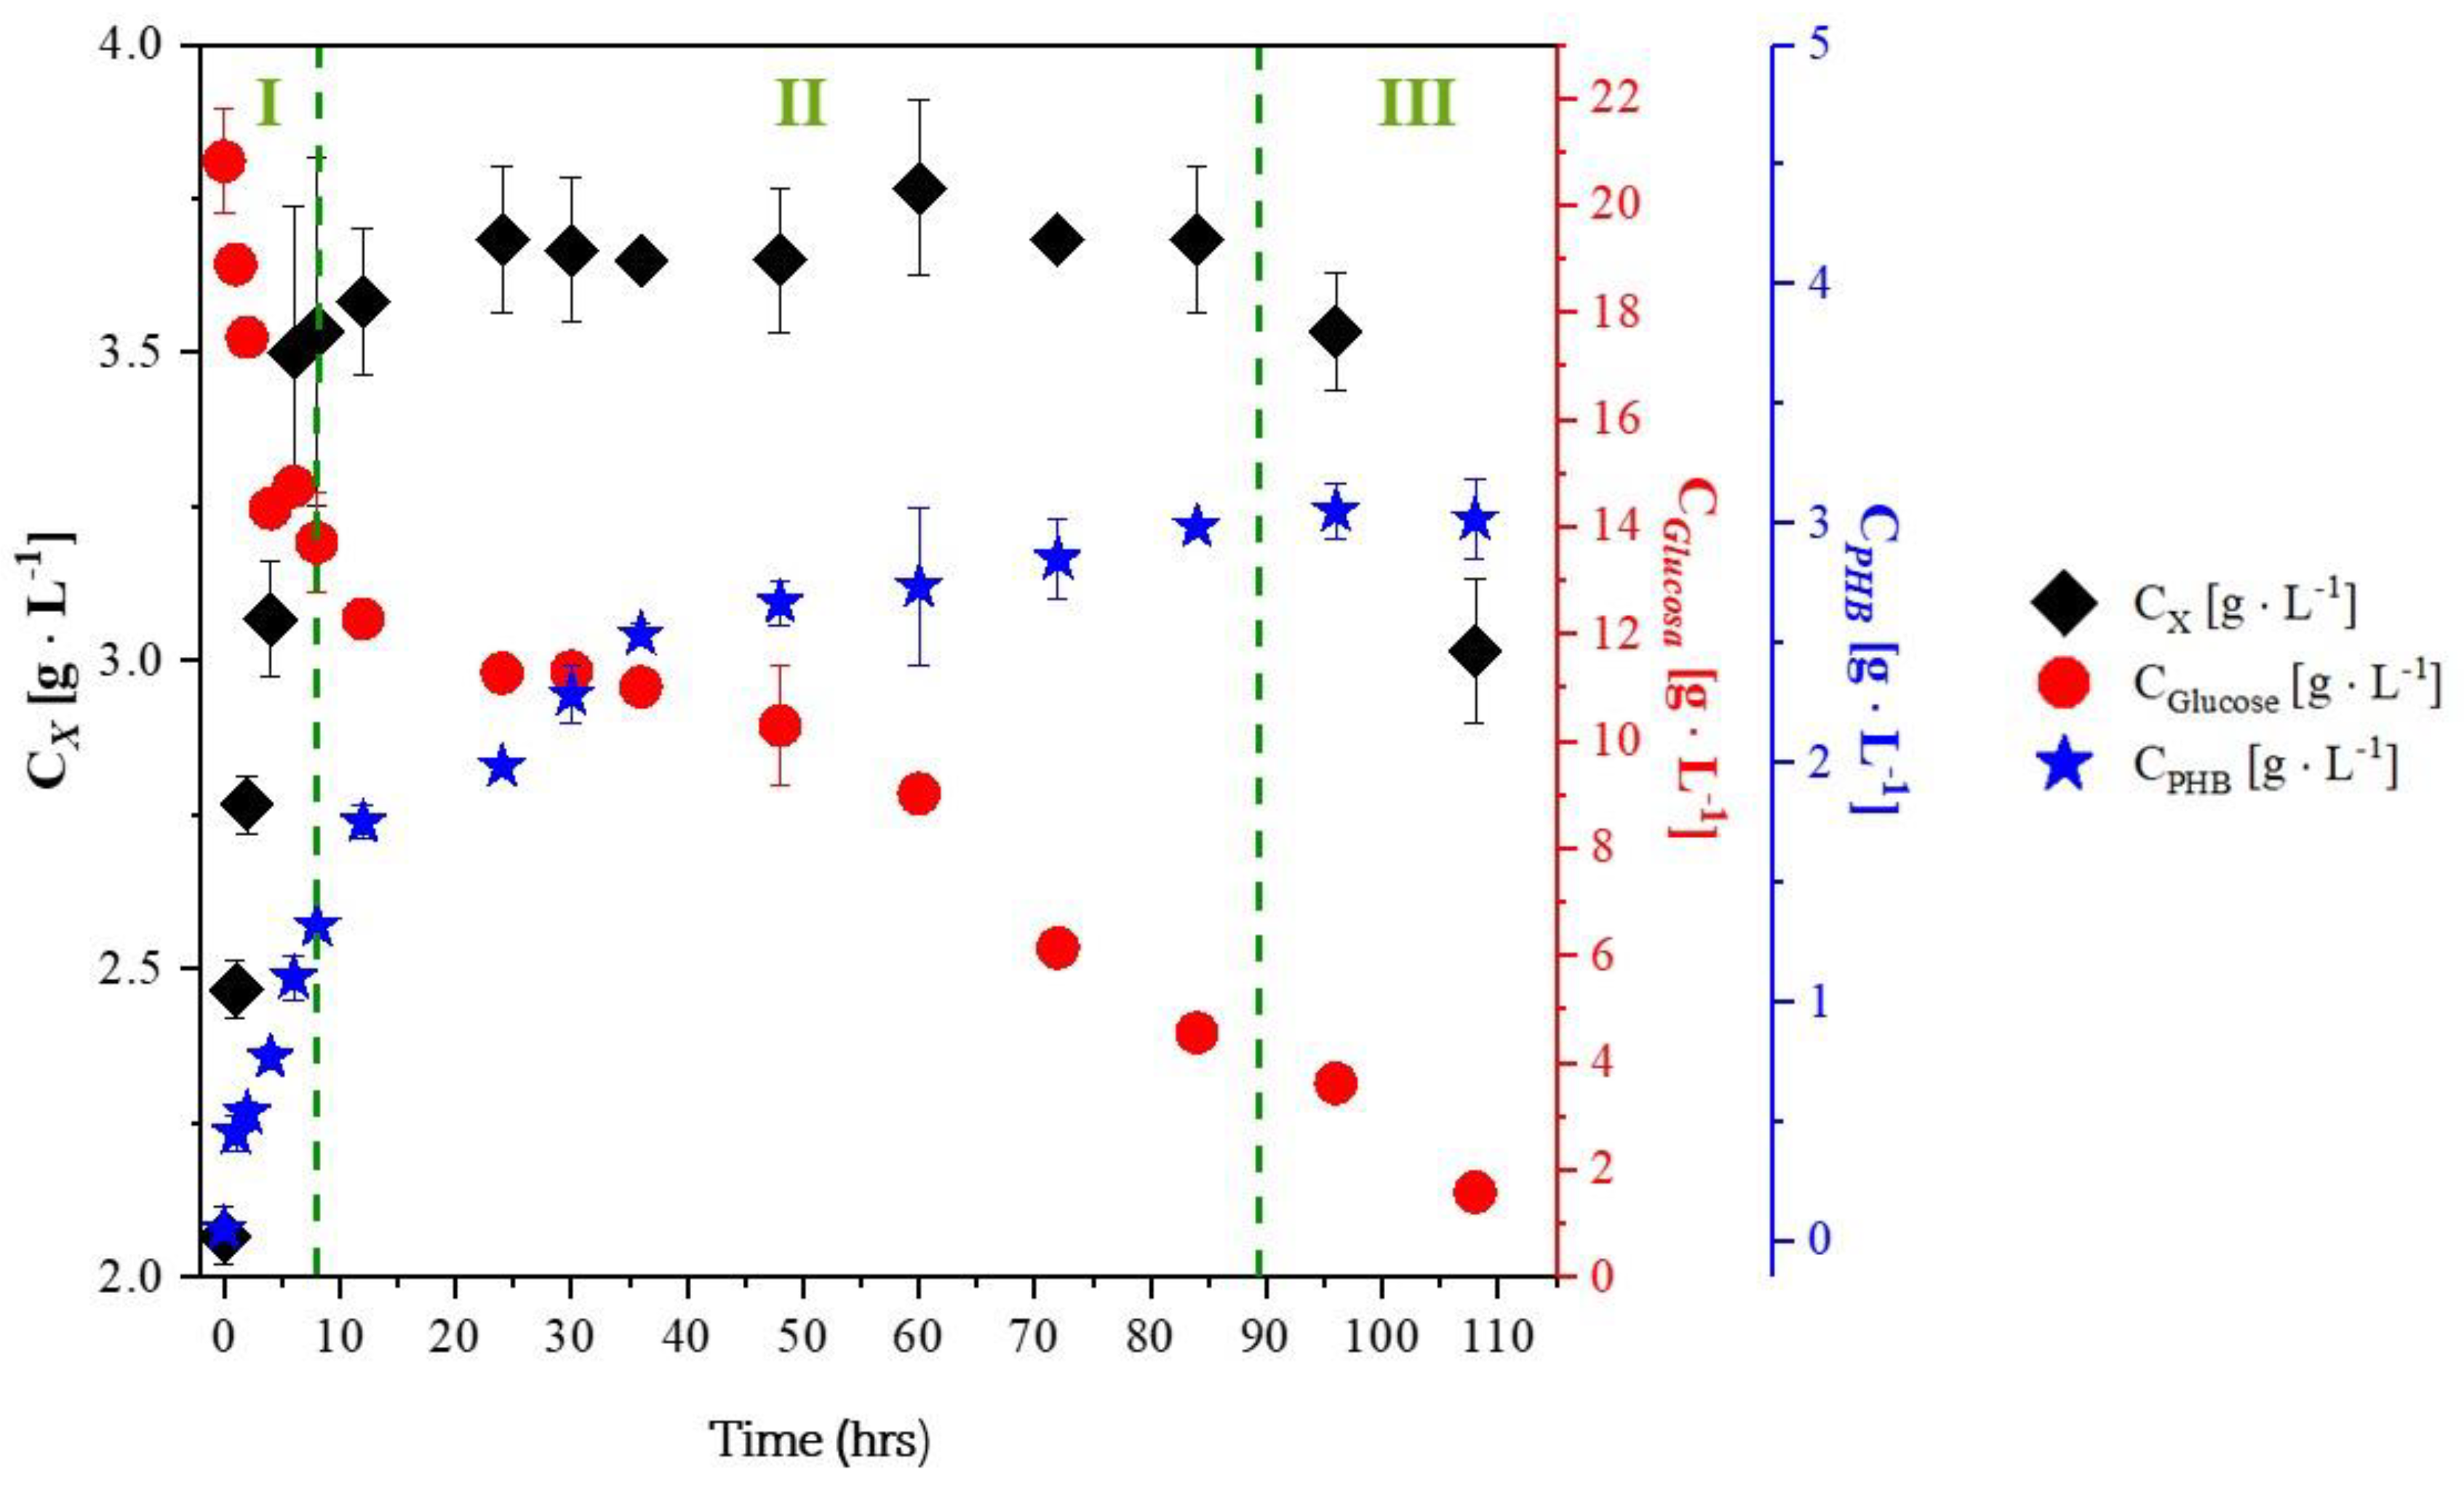
2.2. Experiments with Glycerol
2.3. Material Balance
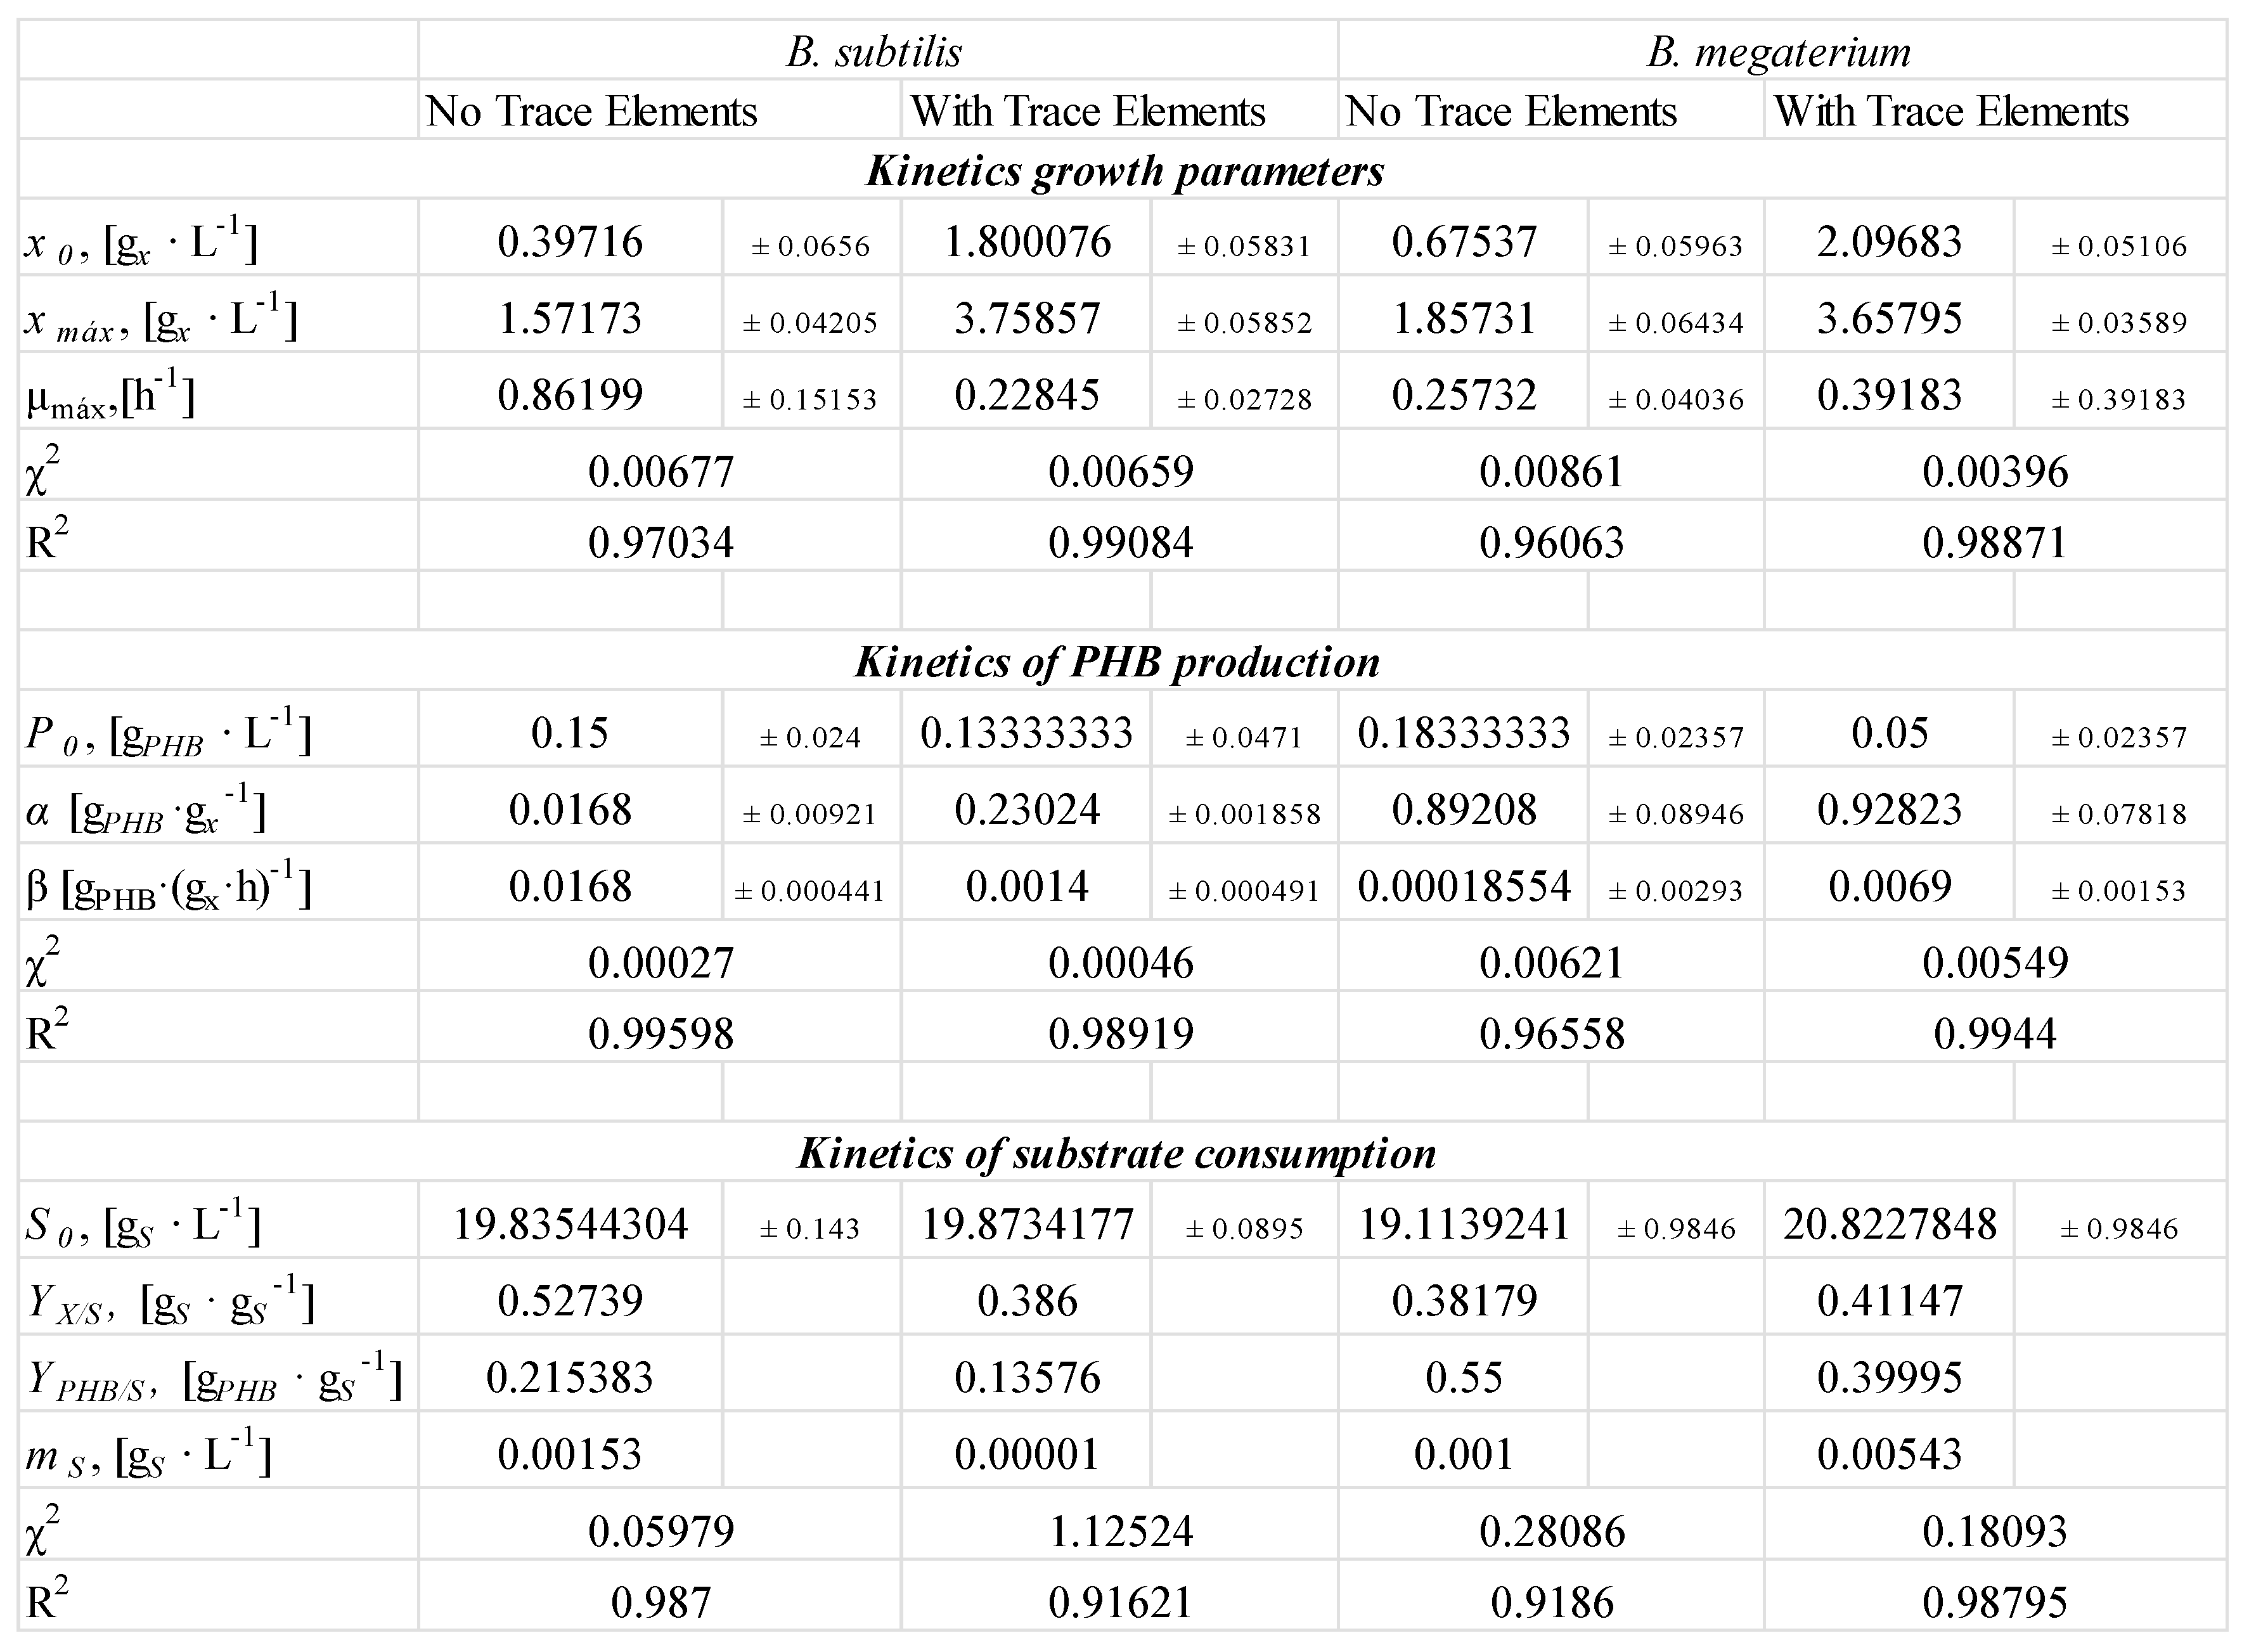
2.4. Model
3. Conclusion
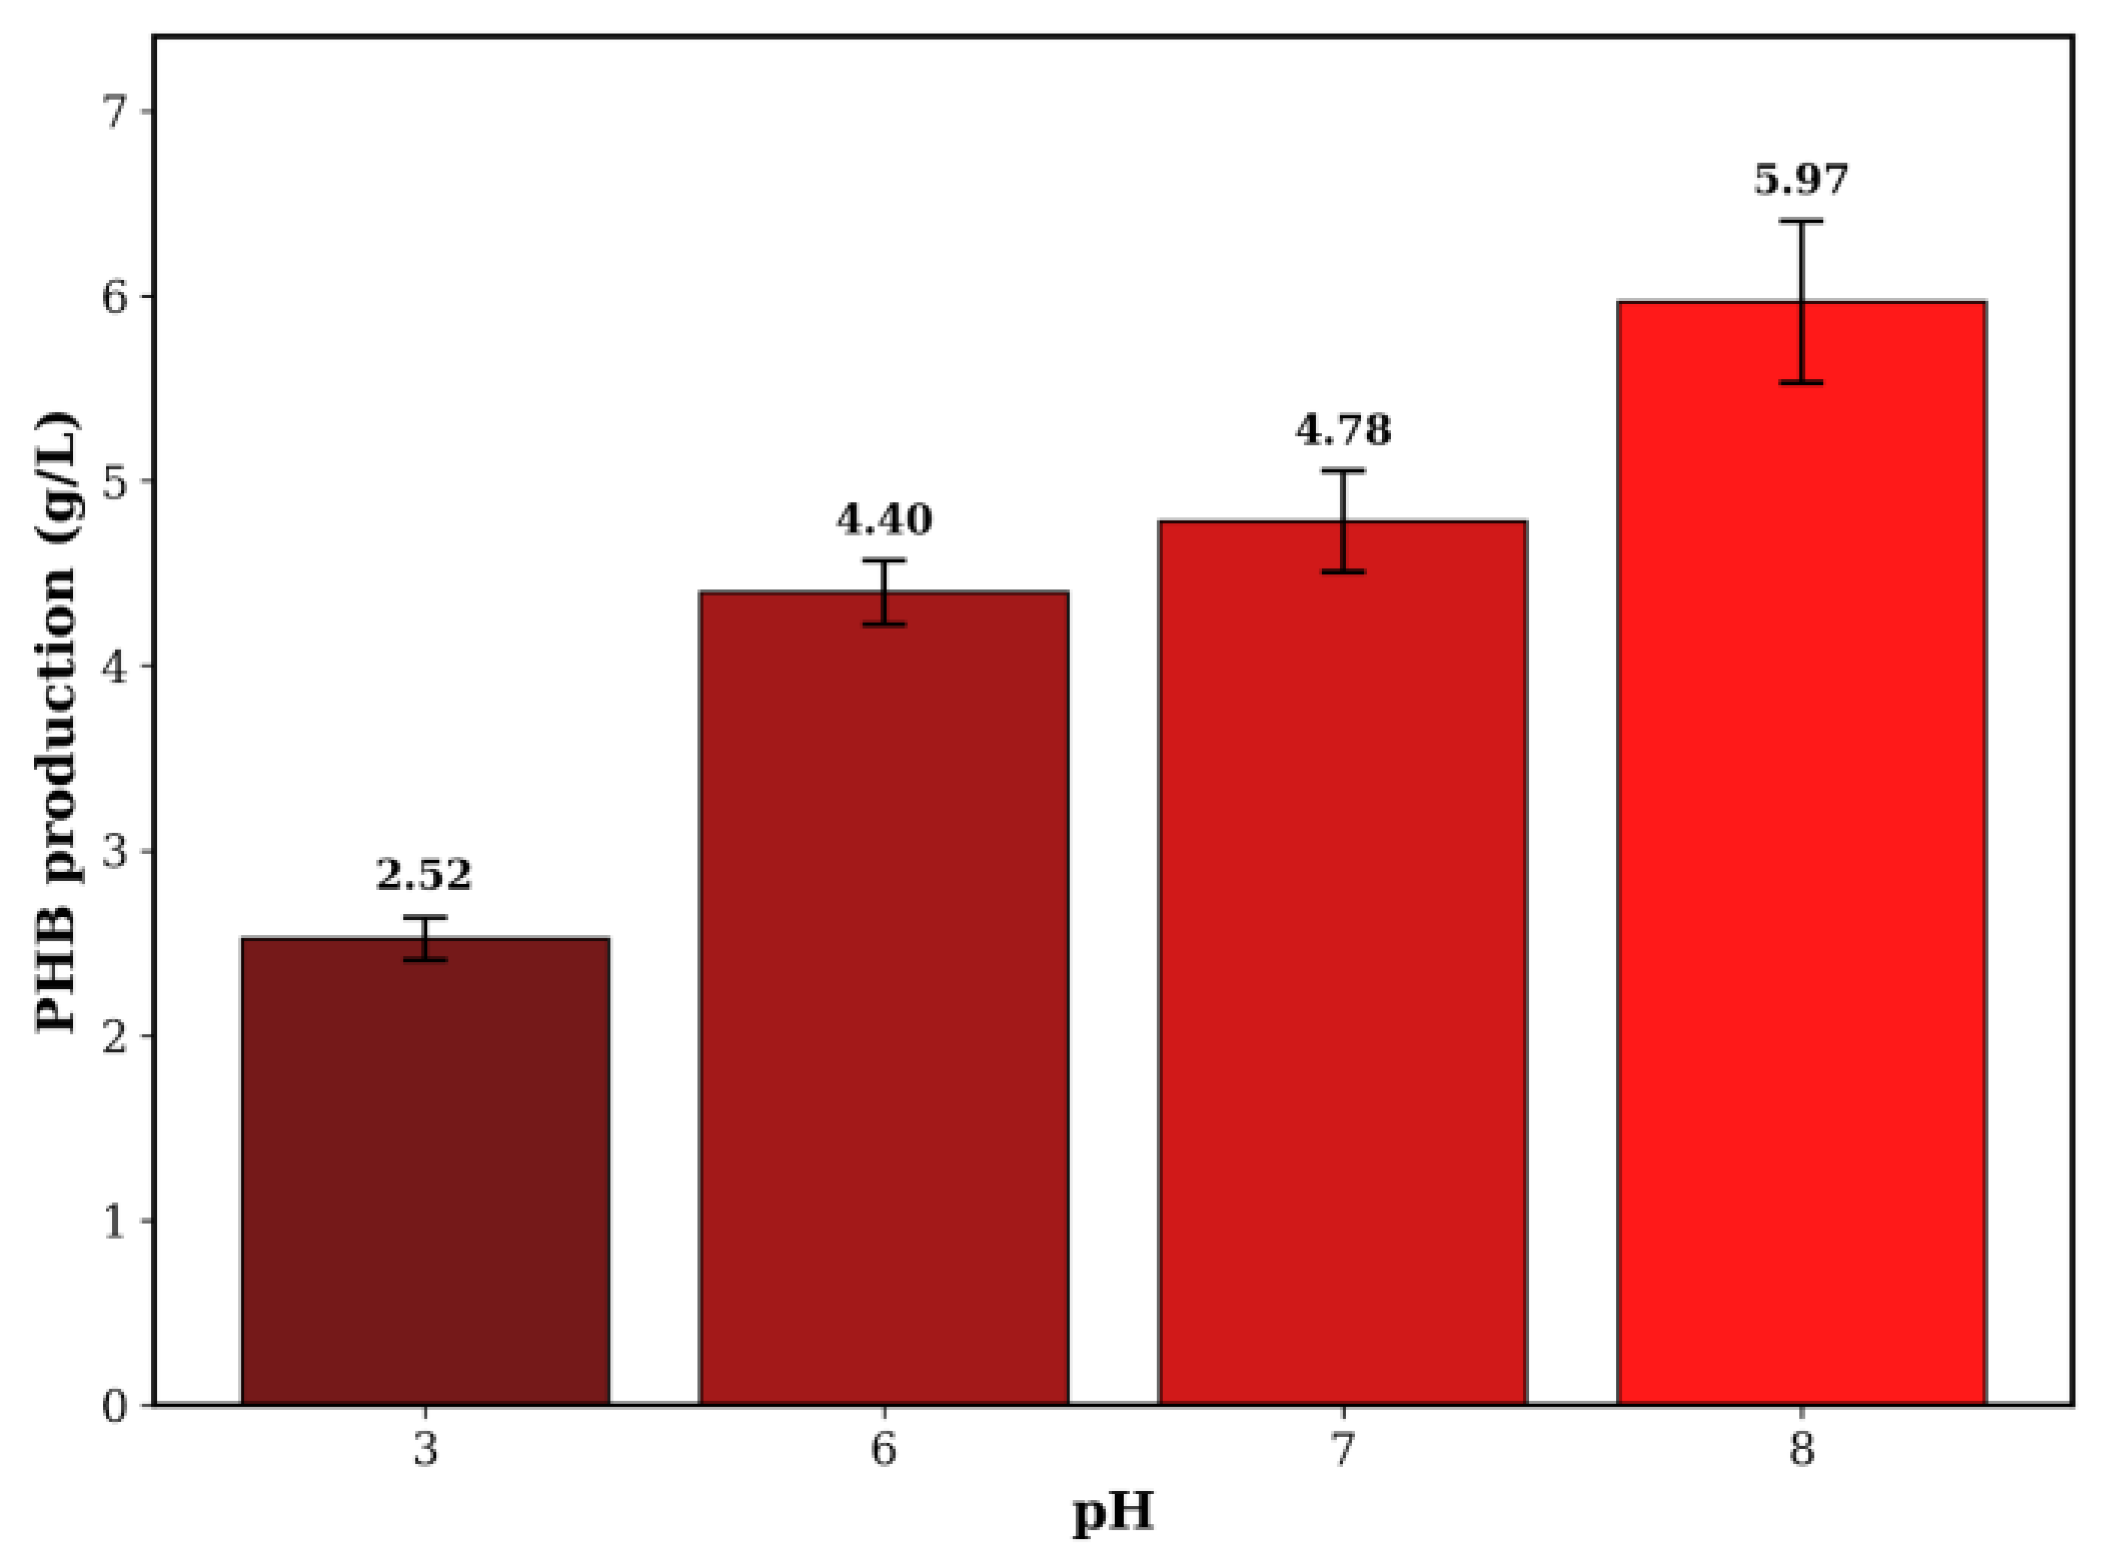
- Effect of pH on Biosynthesis: The pH level of the culture medium was identified as a key factor directly affecting bioproduction yield. PHB production showed a positive correlation with increasing pH within the evaluated range, rising from 2.52 g/L at pH 3 to a maximum at pH 8.
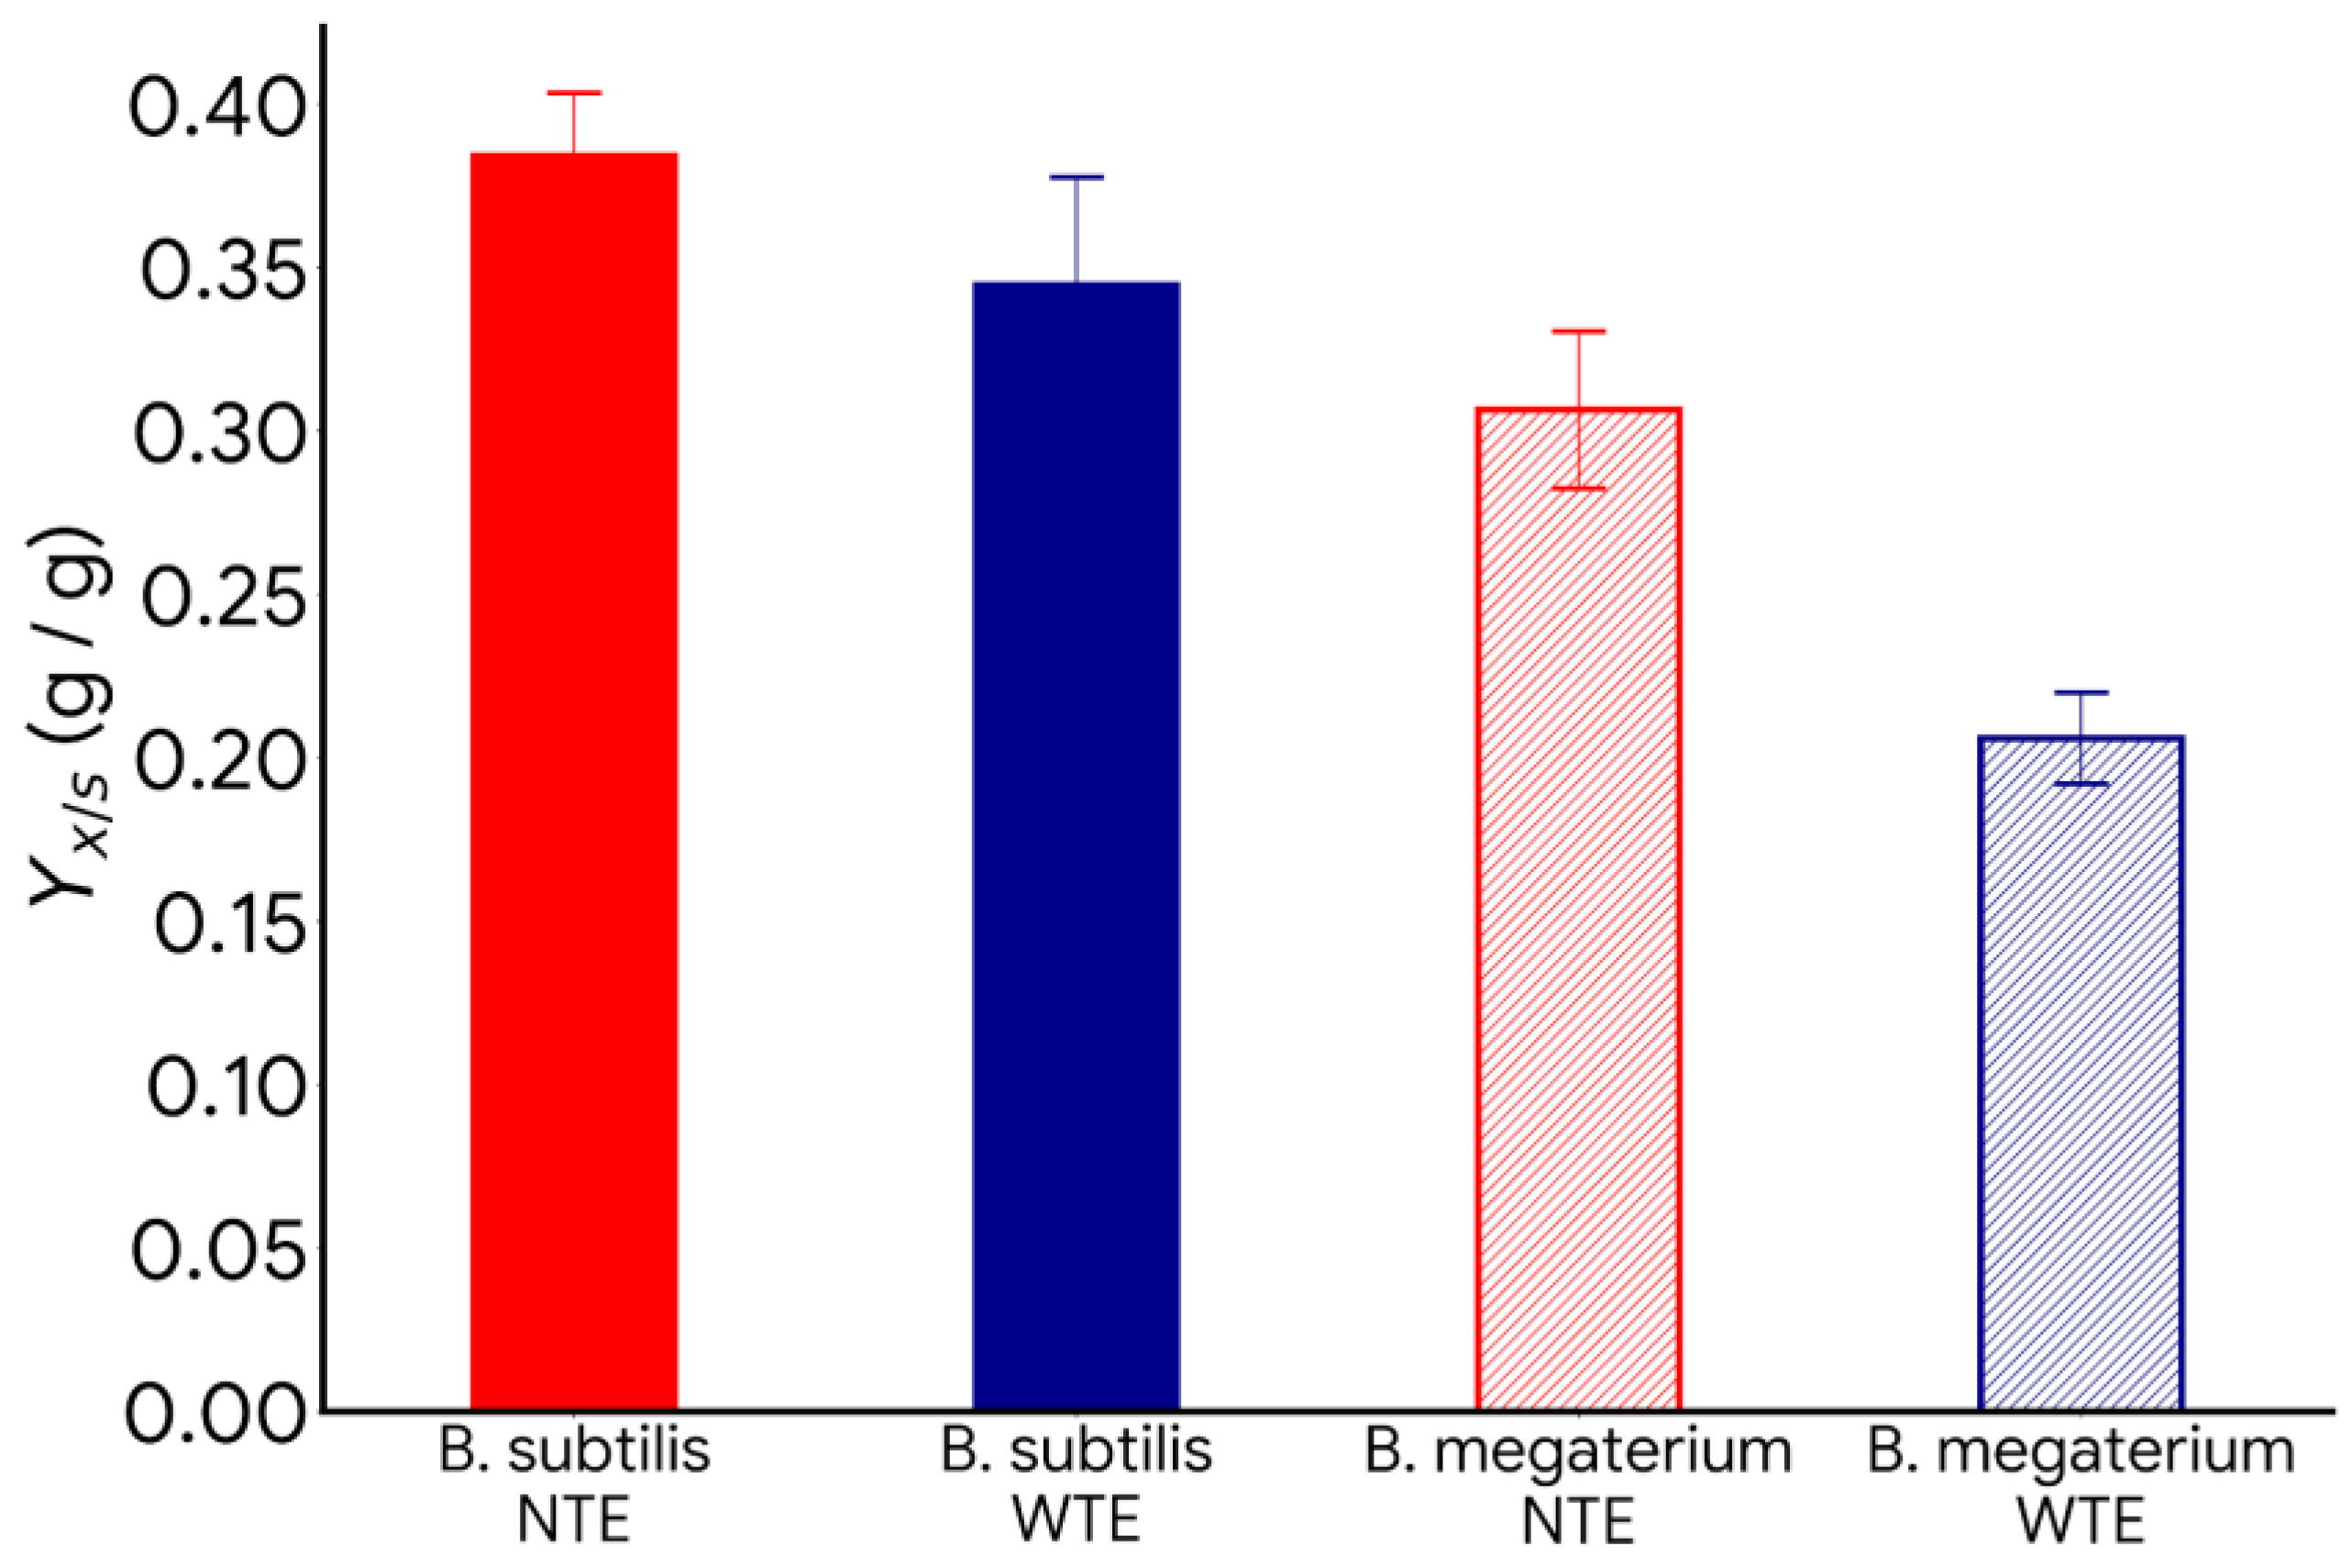
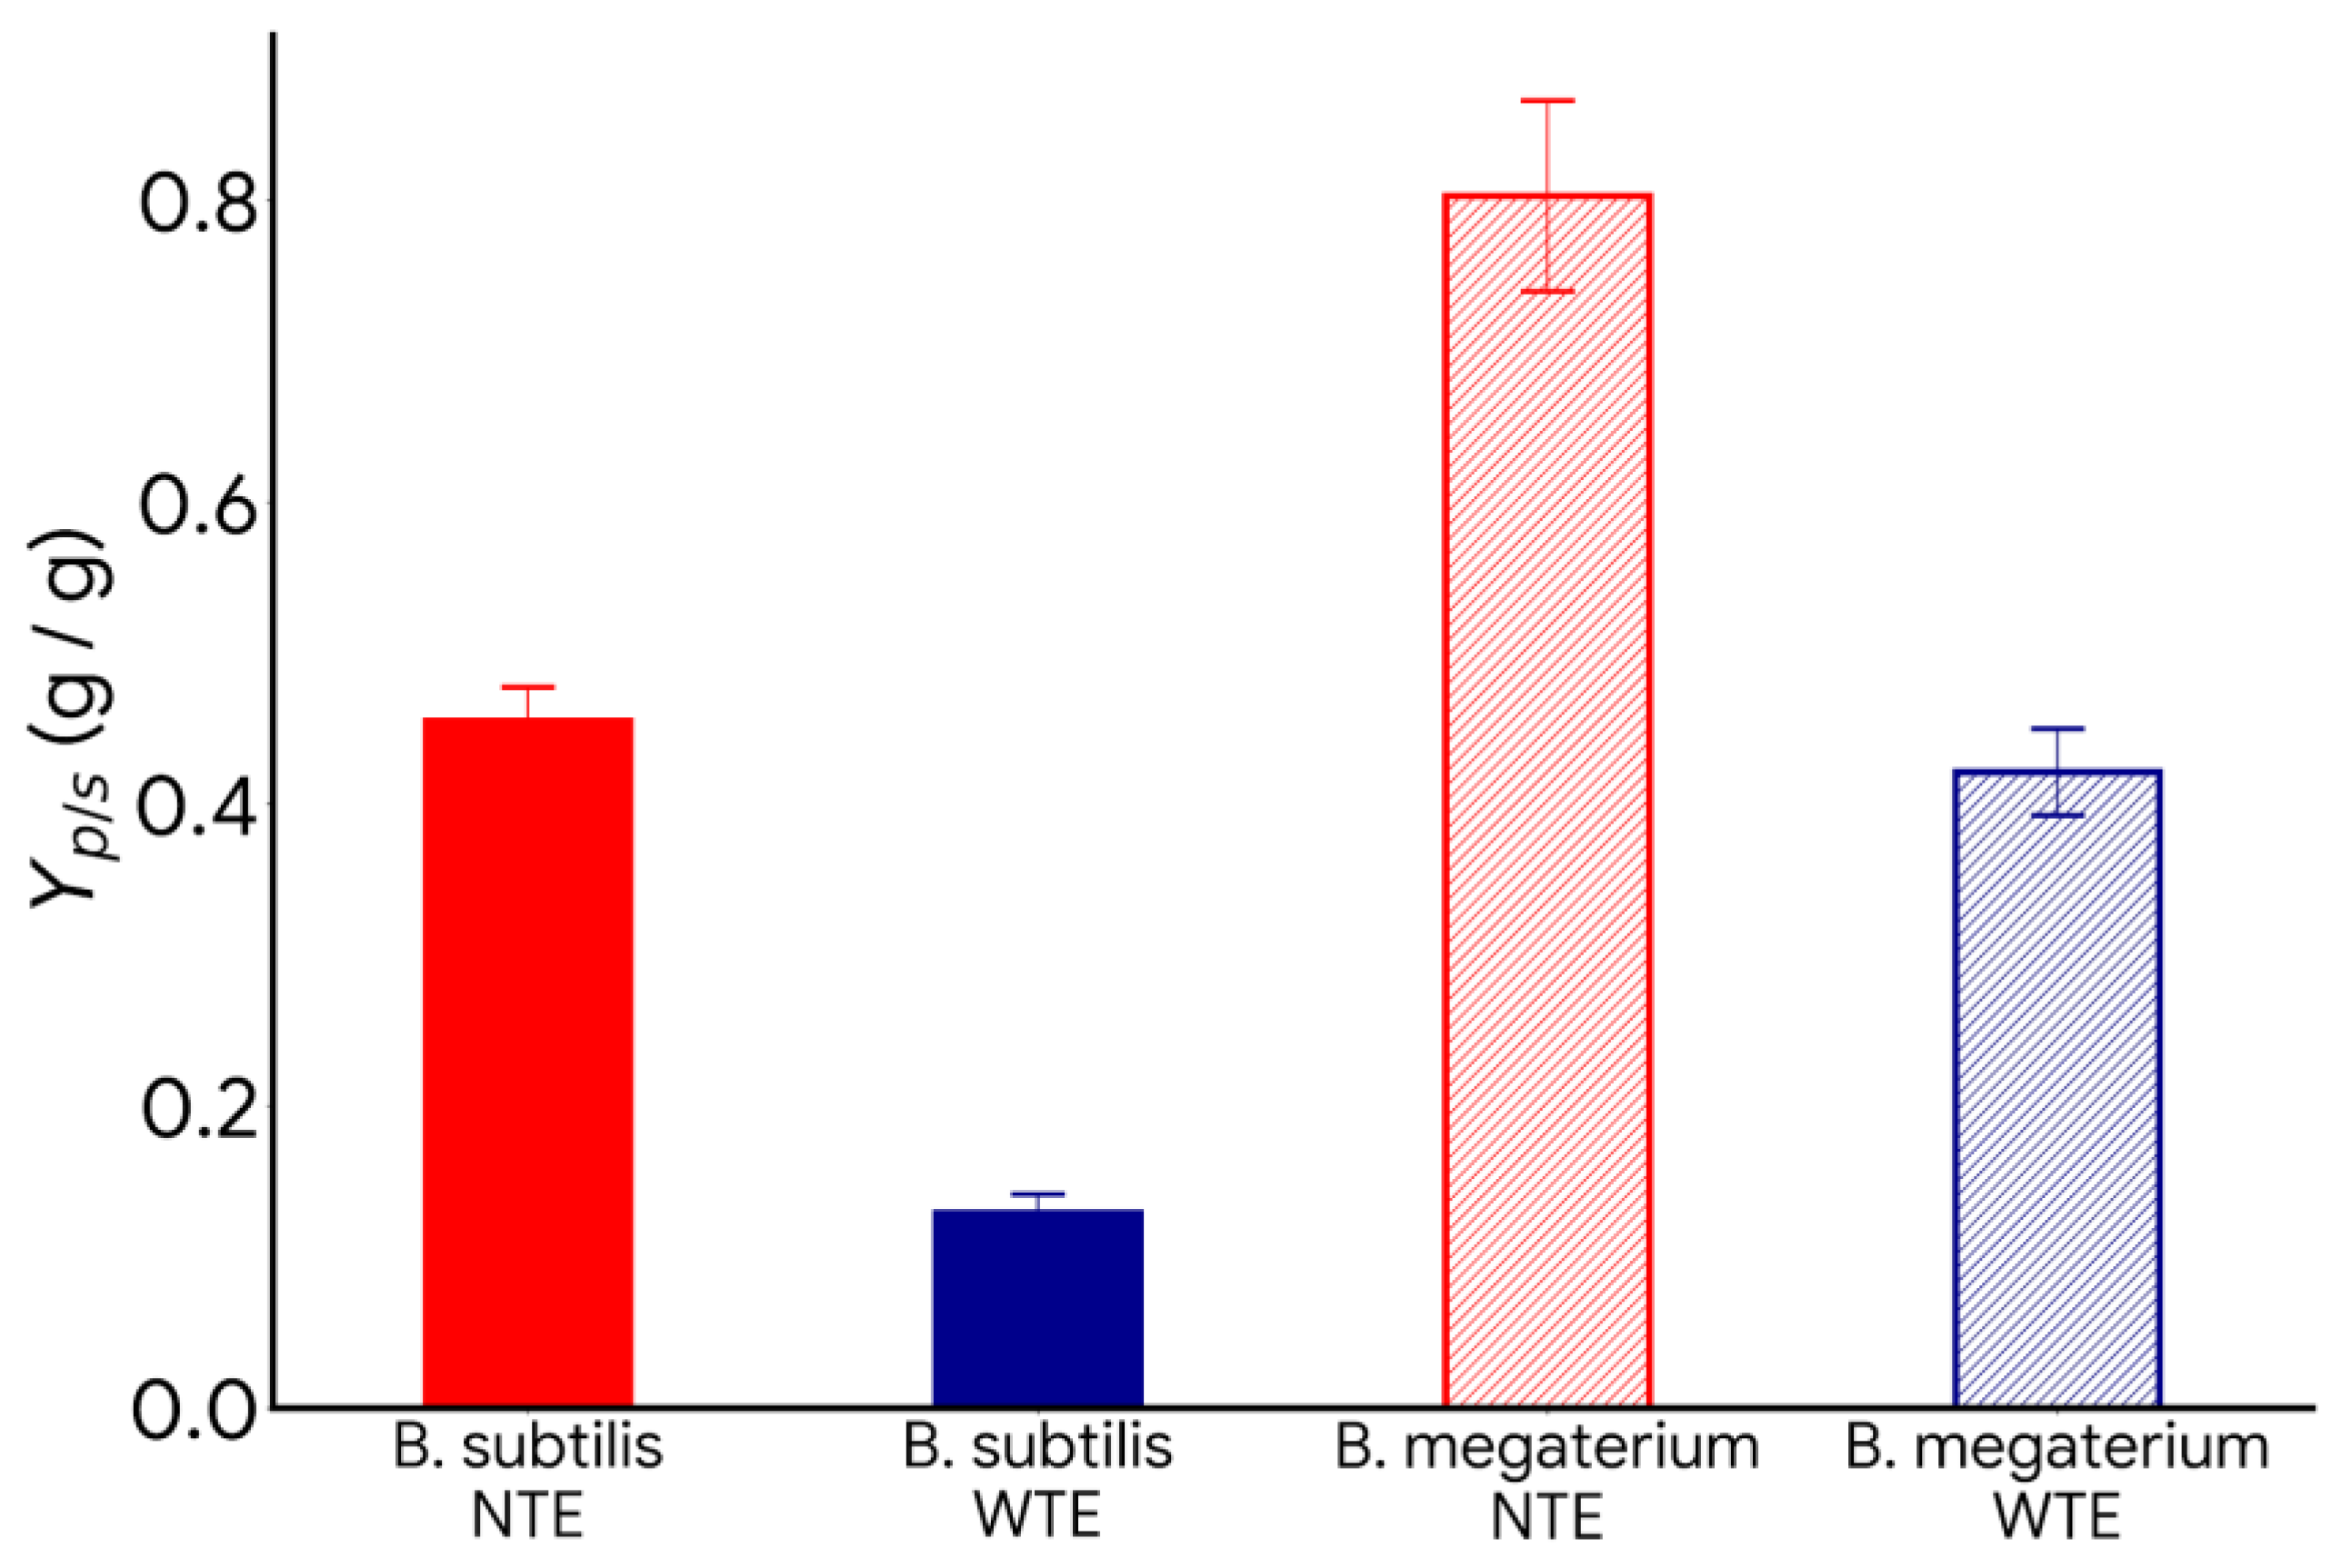
- Effect of nitrogen and carbon sources: The lack of nitrogen and the excess of carbon sources promote PHB production with B. megaterium and B. subtilis.
- Effect of trace element deficiency: The absence of trace elements in the culture media increases PHB production and the product-to-substrate yield coefficient.
- PHB production after the exponential growth phase: In all experiments with glycerol, PHB production continued during the stationary and death phases. This is because trace elements like magnesium and calcium, which are involved in enzyme activity, return more slowly to the metabolic pathways responsible for growth and energy generation.
- Waste Valorization and Sustainability: Using glycerol and whey as sources of carbon and nitrogen not only cuts production costs related to pure substrates but also offers a sustainable method for managing agro-industrial waste. This strategy advances the shift toward a circular bioeconomy by converting polluting waste into high-value, biodegradable bioplastics.
- This work shows that using residual material, suppressing certain trace elements, maintaining a high C:N ratio, and controlling pH can create cost-effective and environmentally friendly processes to produce bioplastics like PHB.
4. Materials and Methods
- Pyruvate produces ethanol or lactate under anaerobic conditions in a nutrient-balanced culture medium.
- Under aerobic conditions, pyruvate is converted into oxaloacetate and enters the Krebs cycle to produce energy and support cell growth, using a nutrient-balanced culture media.
- PHB production is increased in culture media with excess carbohydrates and a deficiency of nutrients such as nitrogen, phosphorus, oxygen, sulfur, or trace elements. When cells are cultured in media containing excess glucose, sucrose, lipids, glycerol, and other carbon sources, Acetyl CoA accumulates. The lack of nitrogen, phosphorus, oxygen, and sulfur halts the synthesis of nucleic acids and proteins, leading to a decrease in cell growth.
- The excess of NADPH and Acetyl Co-A increased the synthesis of 3-hydroxybutyryl-CoA, the monomer of PHB, because high levels of NADPH and NADH inhibit citrate synthase in the TCA cycle, which ensures the availability of acetyl CoA to connect with 3-Phosphoglycerate.
- Cells form PHB’s conglomerate in the cytoplasm as a future source of carbon and energy.
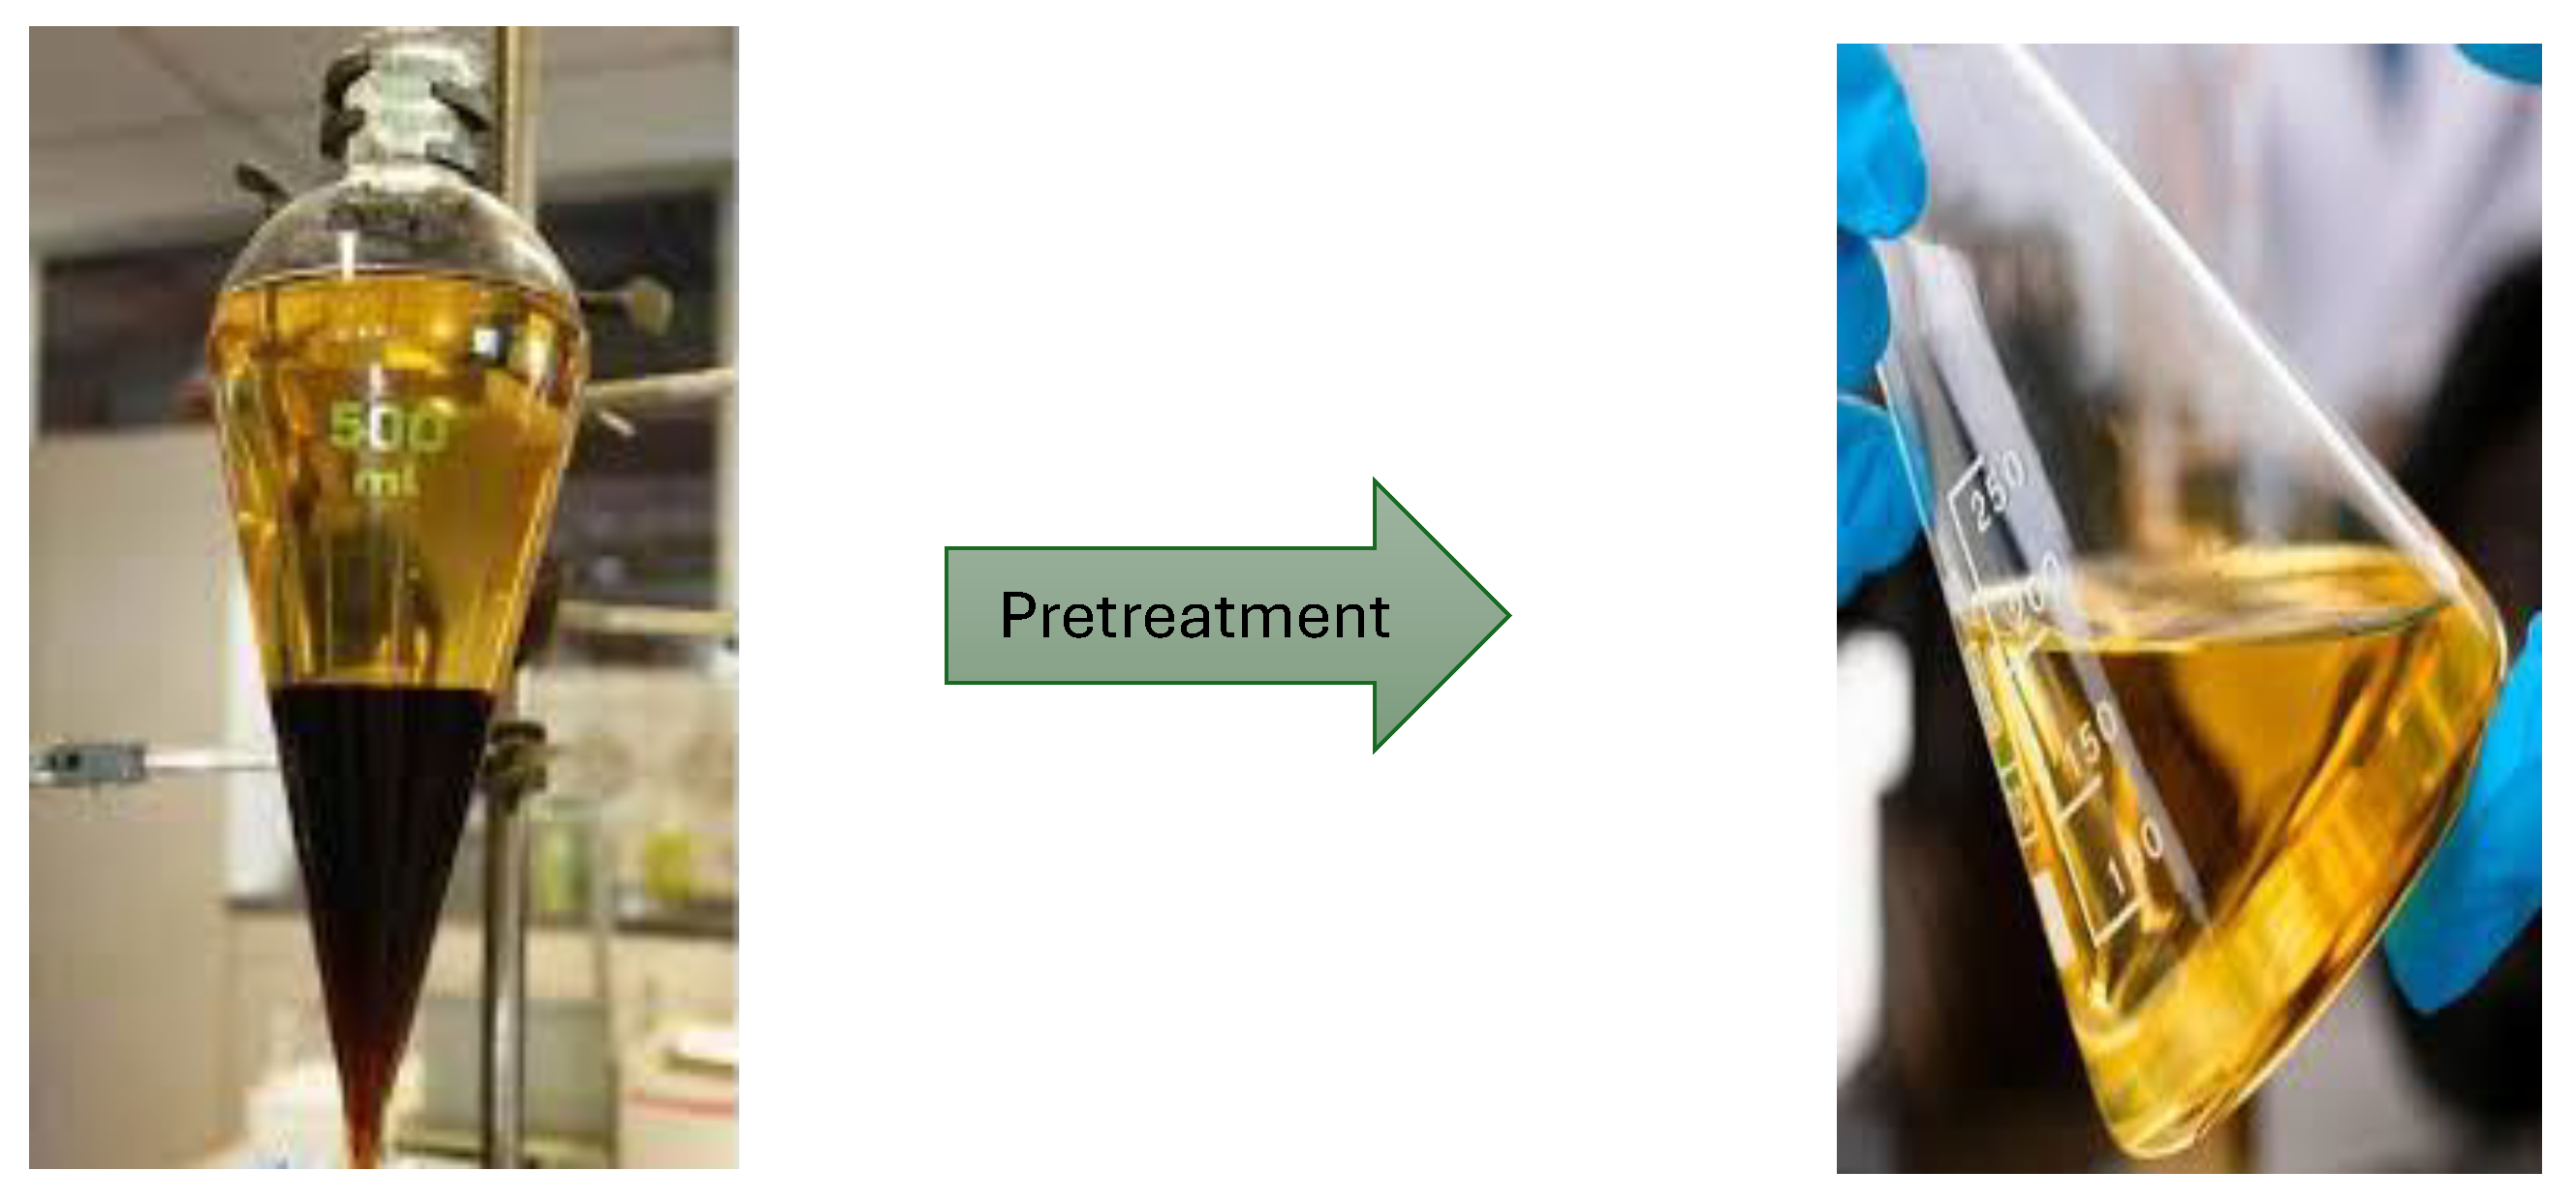
Experiments with Whey
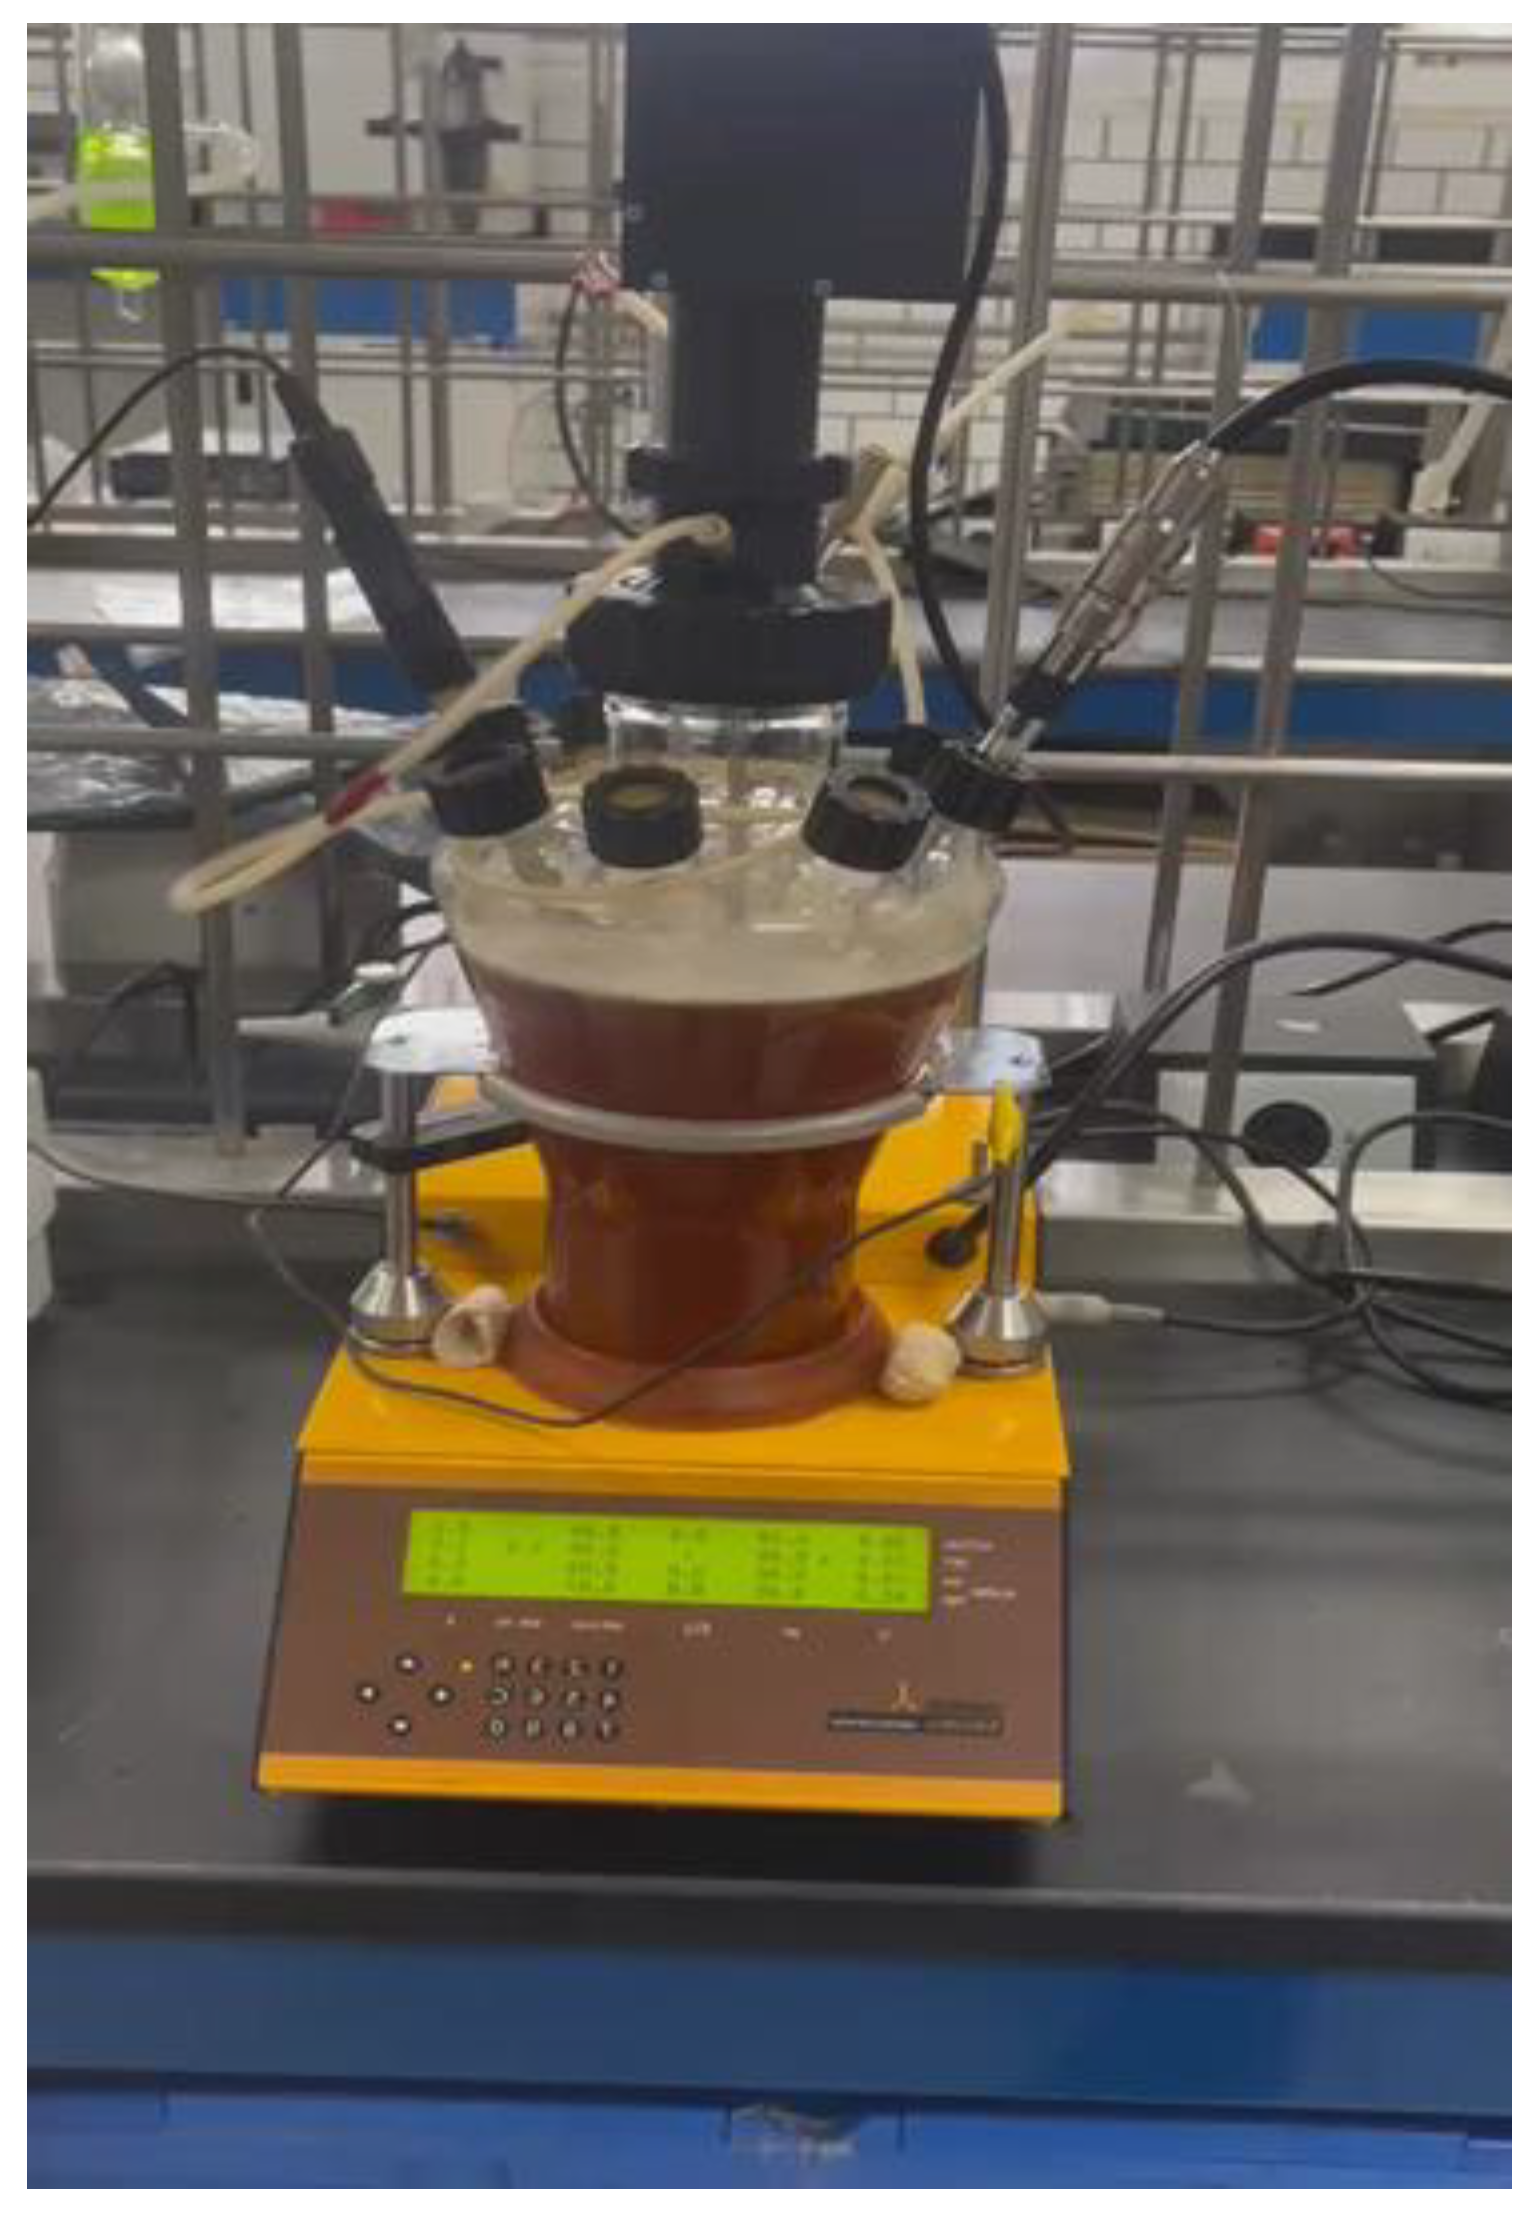
Bioreaction
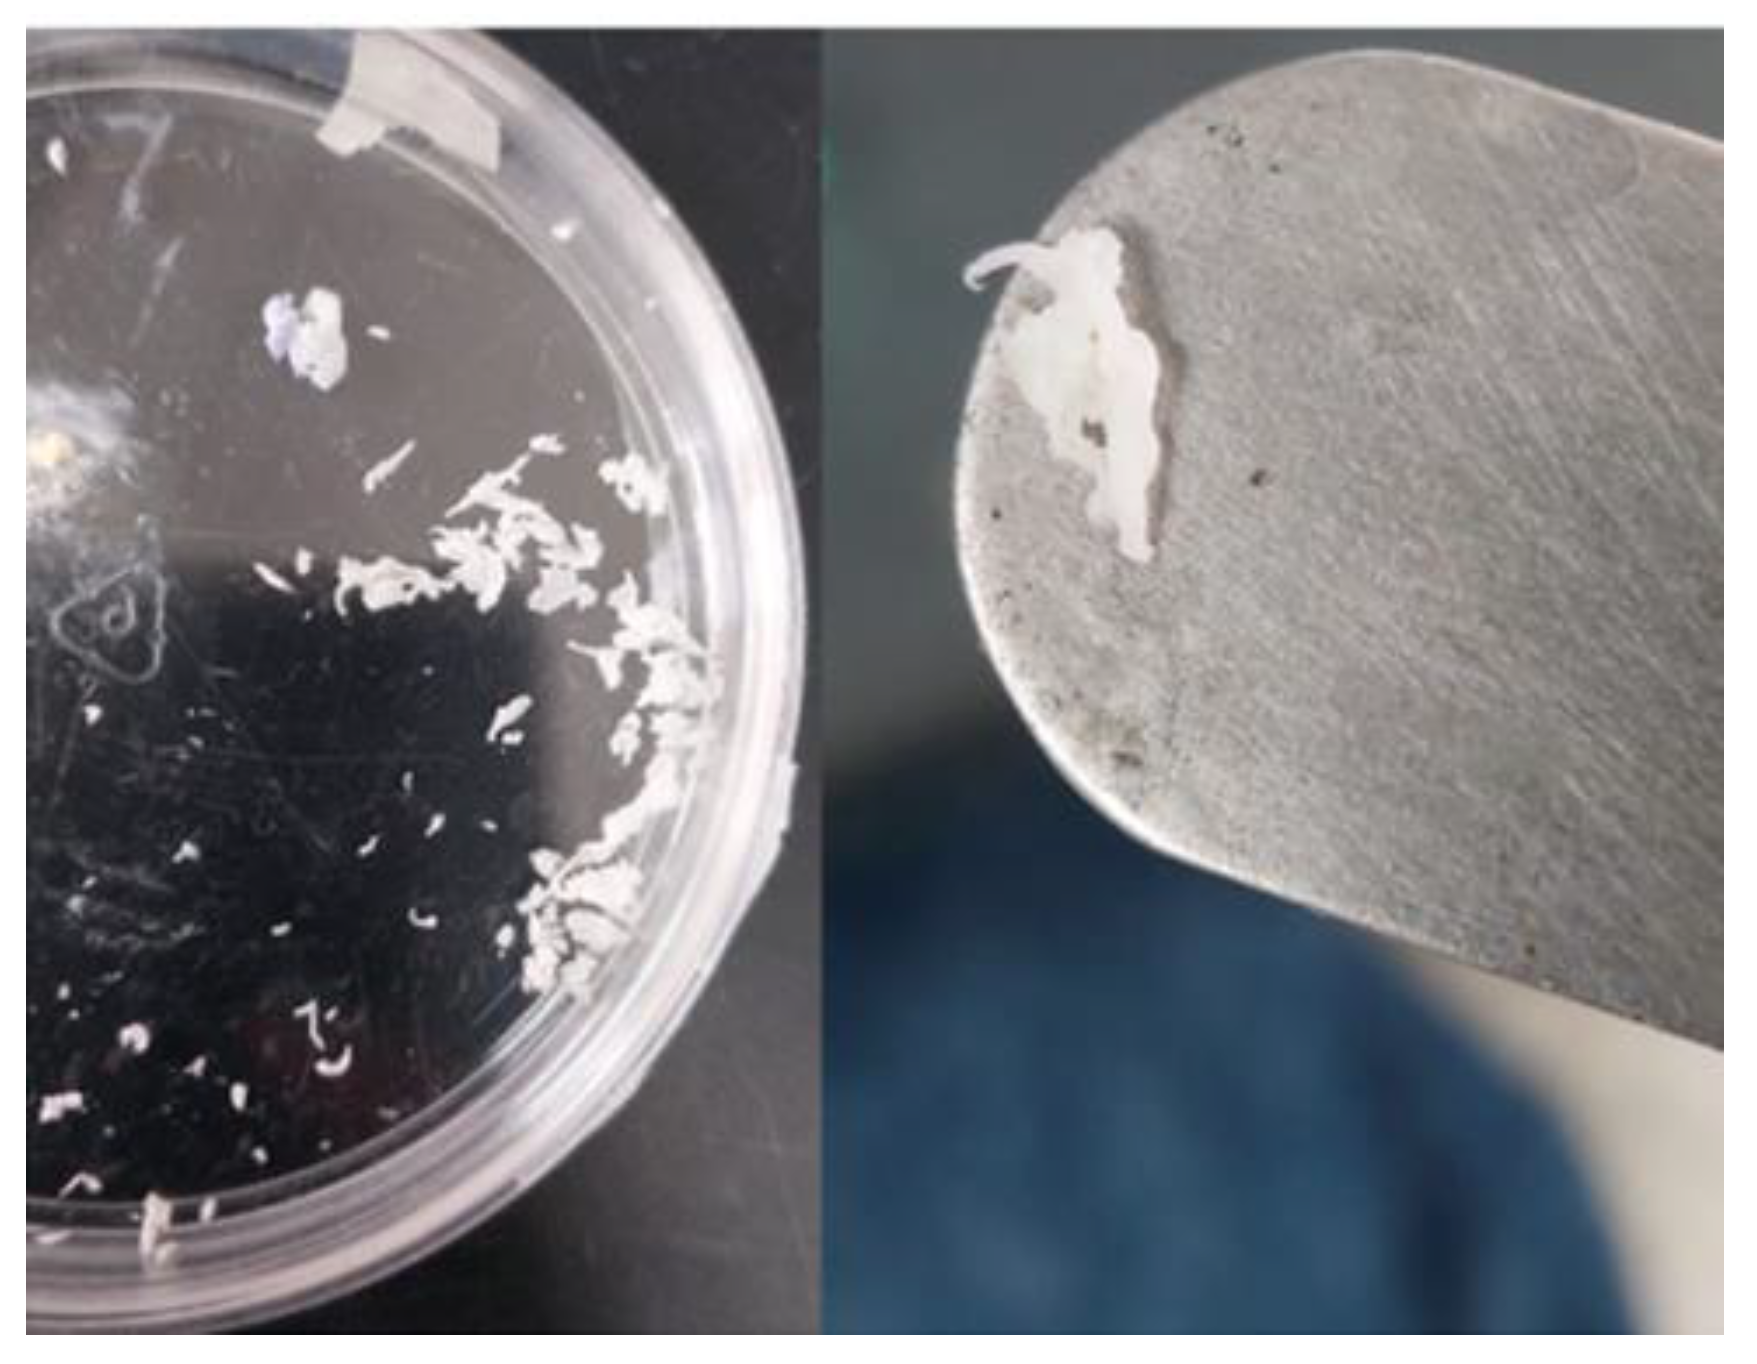
Recovery and Washing of PHB
Experiments with Glycerol
Bioreaction
Recovery of PHB and Glucose
Analysis
Material Balance
Model
Author Contributions
Funding
Conflicts of Interest
Abbreviations
| A-CoA-R | Acetoacetyl coenzyme A reductase |
| ADP | Adenosine diphosphate |
| Ald | Aldolase enzyme |
| ATP | Adenosine triphosphate |
| Bio-PE | Bio-based-polyethylene |
| Bio-PET | Bio-based polyethylene terephthalate |
| Bio-PP | Bio-based-polypropylene |
| BM | Biomass |
| Percentage of glucose consumed at the end of the exponential growth phase | |
| Percentage of glucose consumed at the end of the cell death phase | |
| Substrate concentration at time = 0 | |
| Substrate concentration at the end of the experiment | |
| PHB concentration at the end of the exponential growth phase | |
| Maximum PHB concentration obtained | |
| Substrate concentration at the end of the exponential growth phase | |
| Specific PHB production rate [gP L-1 h-1] | |
| Specific substrate consumption rate [gS L-1 h-1] | |
| Specific growth rate [gx L-1 h-1] | |
| Eno | Enolase enzyme |
| g | Gram |
| GAL-I | Galactose-6-phosphate isomerase enzyme |
| Gal-S | Β-galactosidase enzyme |
| Glu-K | Glycerol kinase enzyme |
| Gly-K | Glycerol kinase enzyme |
| 3HB | 3-hydroxybutyrate |
| 4HB | 4-hydroxybutyrate |
| HD | 3-Hydroxydecanoate |
| HHc | 3-Hydroxyhexanoate |
| 3HV | 3-Hydroxyvalerate |
| L | Liter |
| MT | Million tons |
| Mut | Mutase enzyme |
| NAD | Nicotinamide adenine dinucleotide |
| NTE | Without trace elements |
| P | Product [PHB] concentration [g L-1] |
| PE | Polyethylene |
| PET | Polyethylene terephthalate |
| PP | Polypropylene |
| PHAs | Polyhydroxyalkanoates |
| PHB | Polyhydroxybutyrate |
| PHB-S | β-PHB synthase enzyme |
| PhG-K | Phosphoglycerate kinase enzyme |
| PLA | Polylactic acid |
| PTS | Lactose-specific phosphotransferase system |
| PVC | Polyvinylchloride |
| S | Substrate concentration [g L-1] |
| t | Time [h] |
| Tag-K | Tagatose-6-phosphate kinase enzyme |
| TCA | Tricarboxylic acid cycle |
| TE | Trace elements |
| Tri-I | Triosephosphate isomerase enzyme |
| Biomass concentration [g L-1] | |
| Maximum biomass concentration [g L-1] | |
| Actual growth, maximum yield | |
| Yield coefficient PHB/Substrate at the end of the exponential growth phase | |
| Yield coefficient of PHB production/substrate at the maximum PHB concentration obtained. | |
| Yield coefficient of biomass/substrate at the end of the exponential growth phase | |
| Subindex | |
| C | Carbon dioxide |
| e | In the exponential phase of growth |
| G | Glycerol |
| i | Initial, time = 0 |
| N | Ammonium sulfate |
| PHB | Polyhydroxybutyrate |
| S | Glucose |
| w | Water |
| x | Biomass |
| Greek Letters | |
| A specific constant of maintenance dependent on growth | |
| A specific constant of maintenance independent of growth | |
| β-ket | β-Keotiolase enzyme |
| β-hBD | β-hydroxybutirate dehydrogenase enzyme |
| Maximum specific constant growth rate | |
References
- OECD [Internet]. 2022 [cited 2025 Mar 6]. Global Plastics Outlook. Available from: https://www.oecd.org/en/publications/global-plastics-outlook_de747aef-en.html.
- SciSpace - Paper [Internet]. Elsevier Academic Press; 2014 [cited 2025 Mar 4]. Principles of tissue engineering. Available from: https://scispace.com/papers/principles-of-tissue-engineering-54fega0nz0.
- Ghanbarzadeh B, Almasi H, Ghanbarzadeh B, Almasi H. Biodegradable Polymers. In: Biodegradation - Life of Science [Internet]. IntechOpen; 2013 [cited 2025 Mar 4]. Available from: https://www.intechopen.com/chapters/45095.
- Berlanga M, Montero M, Borrell J, Guerrero R. Rapid spectrofluorometric screening of poly-hydroxyalkanoate-producing bacteria from microbial mats. Int Microbiol Off J Span Soc Microbiol. 2006 July 1;9:95–102.
- ASLIM B, SAĞLAM N, BEYATLI Y. Determination of Some Properties of Bacillus Isolated from Soil. Turk J Biol. 2002 Jan 1;26(1):41–8.
- McAdam B, Brennan Fournet M, McDonald P, Mojicevic M. Production of Polyhydroxybutyrate (PHB) and Factors Impacting Its Chemical and Mechanical Characteristics. Polymers. 2020 Dec;12(12):2908. [CrossRef]
- Brandl H, Gross RA, Lenz RW, Fuller RC. Pseudomonas oleovorans as a Source of Poly(β-Hydroxyalkanoates) for Potential Applications as Biodegradable Polyesters. Appl Environ Microbiol. 1988 Aug;54(8):1977–82. [CrossRef]
- Strey J, Wittchen KD, Meinhardt F. Regulation of β-Galactosidase Expression in Bacillus megaterium DSM319 by a XylS/AraC-Type Transcriptional Activator. J Bacteriol. 1999 May;181(10):3288–92. [CrossRef]
- Iskandar CF, Cailliez-Grimal C, Borges F, Revol-Junelles AM. Review of lactose and galactose metabolism in Lactic Acid Bacteria dedicated to expert genomic annotation. Trends Food Sci Technol. 2019 June;88:121–32. [CrossRef]
- Norma González García, Contreras M, González Reynoso O, Córdova López JA. SÍNTESIS Y BIODEGRADACIÓN DE POLIHIDROXIALCANOATOS: PLÁSTICOS DE ORIGEN MICROBIANO. Rev Int Contam Ambient. 2013 Feb;29(1):77–115.
- Moreno P, Yañez C, Cardozo NSM, Escalante H, Combariza MY, Guzman C. Influence of nutritional and physicochemical variables on PHB production from raw glycerol obtained from a Colombian biodiesel plant by a wild-type Bacillus megaterium strain. New Biotechnol. 2015 Dec 25;32(6):682–9. [CrossRef]
- Rivas-Castillo AM, Valdez-Calderón A, Angeles-Padilla AF, Figueroa-Ocampo CB, Carrillo-Ibarra S, Quezada-Cruz M, et al. PHB production by Bacillus megaterium strain MNSH1-9K-1 using low-cost media. Braz J Microbiol. 2024 Jan 12;55(1):245–54. [CrossRef]
- Faccin DJL, Rech R, Secchi AR, Cardozo NSM, Ayub MAZ. Influence of oxygen transfer rate on the accumulation of poly(3-hydroxybutyrate) by Bacillus megaterium. Process Biochem. 2013 Mar 1;48(3):420–5. [CrossRef]
- Arrieta MP, Castro-López MDM, Rayón E, Barral-Losada LF, López-Vilariño JM, López J, et al. Plasticized Poly(lactic acid)–Poly(hydroxybutyrate) (PLA–PHB) Blends Incorporated with Catechin Intended for Active Food-Packaging Applications. J Agric Food Chem. 2014 Oct 15;62(41):10170–80. [CrossRef]
- Zhang Y, Sun W, Wang H, Geng A. Polyhydroxybutyrate production from oil palm empty fruit bunch using Bacillus megaterium R11. Bioresour Technol. 2013 Nov 1;147:307–14. [CrossRef]
- López JA, Naranjo JM, Higuita JC, Cubitto MA, Cardona CA, Villar MA. Biosynthesis of PHB from a new isolated Bacillus megaterium strain: Outlook on future developments with endospore-forming bacteria. Biotechnol Bioprocess Eng. 2012 Apr;17(2):250–8. [CrossRef]
- Naranjo JM, Posada JA, Higuita JC, Cardona CA. Valorization of glycerol through the production of biopolymers: The PHB case using Bacillus megaterium. Bioresour Technol. 2013 Apr;133:38–44. [CrossRef]
- RamKumar Pandian S, Deepak V, Kalishwaralal K, Rameshkumar N, Jeyaraj M, Gurunathan S. Optimization and fed-batch production of PHB utilizing dairy waste and seawater as nutrient sources by Bacillus megaterium SRKP-3. Bioresour Technol. 2010 Jan 1;101(2):705–11. [CrossRef]
- Zhao ZM, Xi JT, Xu JF, Ma LT, Zhao J. Enhancement of Bacillus subtilis Growth and Sporulation by Two-Stage Solid-State Fermentation Strategy. Processes. 2019 Oct;7(10):644. [CrossRef]
- Vehapi M, İnan B, Kayacan-Cakmakoglu S, Sagdic O, Özçimen D. Optimization of Growth Conditions for the Production of Bacillus subtilis Using Central Composite Design and Its Antagonism Against Pathogenic Fungi. Probiotics Antimicrob Proteins. 2023 June 1;15(3):682–93. [CrossRef]
- Liu J, Zhao L, Ma D, Sun X, Liu X li. Optimization of Solid Fermentation Process of Bacillus megaterium and Its Application in Crop Growth. In: Liu H, Song C, Ram A, editors. Advances in Applied Biotechnology. Singapore: Springer; 2018. p. 329–38.
- Gómez Cardozo JR, Velasco Bucheli R, Marín Pareja N, Ruíz Villadiego OS, Correa Londoño GA, Mora Martínez AL. Fed-batch production and characterization of polyhydroxybutyrate by Bacillus megaterium LVN01 from residual glycerol. DYNA. 2020 July 1;87(214):111–20.
- Aguilar JA, Beltrán DÁ, Larios JLC, Brambila MMG, Santiesteban HHL. “PRODUCCIÓN DE BIOPLÁSTICO PHA (POLIHIDROXIALCANOATO), MEDIANTE.
- Iftikhar N, Quddus F, Nadeem N, Ali I, Raza MU, Zaid M. Production of Polyhydroxyalkanoates (pha) by bacillus and pseudomonas on Cheap Carbon Substrates. Braz Arch Biol Technol. 2024;67:e24230082. [CrossRef]
- Draper NR, Smith H. Applied Regression Analysis. John Wiley & Sons; 1998. 736 p.
- Lizárraga-Chaidez M, Mendoza-Sánchez M, Abadía-García L, García-Pérez J, Lizárraga-Chaidez M, Mendoza-Sánchez M, et al. El inocente impacto ambiental del suero de la leche. Epistem Sonora. 2023 Dec;17(35):88–97. [CrossRef]
- Tang C, Xi T, Zheng J, Cui X. Chemical Properties of Whey Protein in Protein Powders and Its Impact on Muscle Growth in Athletes: A Review. Nat Prod Commun. 2025 Mar 1;20(3):1934578X251326124. [CrossRef]
- Miller GL. Use of Dinitrosalicylic Acid Reagent for Determination of Reducing Sugar. Anal Chem. 1959 Mar 1;31(3):426–8. [CrossRef]
- Madron F, Veverka V, Vaněček V. Statistical analysis of material balance of a chemical reactor. AIChE J. 1977;23(4):482–6. [CrossRef]
- D RCP, D KMP, D PMDP. Bioprocess Engineering Principles. Amsterdam Boston Heidelberg London New York Oxford Paris San Diego San Francisco Singapore Sydney Tokyo; 2025. 746 p.
- Nielsen J, Villadsen J, Lidén G. Bioreaction Engineering Principles: Second Edition. Boston, MA; 2003. 794 p.
- Lee SY, Choi JI. Production of microbial polyester by fermentation of recombinant microorganisms. Adv Biochem Eng Biotechnol. 2001;71:183–207.
- Cardozo JRG, Bucheli RV, Pareja NM, Villadiego OSR, Londoño GAC, Martínez ALM. Producción por lote alimentado y caracterización de polihidroxibutirato por Bacillus megaterium LVN01 a partir de glicerol residual. DYNA. 2020 July 1;87(214):111–20.

| Property | PHB | PP |
| Crystalline melting point (°C) | 175 | 176 |
| Crystallinity (%) | 80 | 70 |
| Molecular weight (Da) | 5 x 10⁵ | 2 x 10⁵ |
| Glass transition temperature (°C) | 4 | -10 |
| Density [g/cm3] | 1.25 | 0.905 |
| Flexural modulus (GPa) | 4 | 1.7 |
| Tensile strength (MPa) | 40 | 38 |
| Extension to break (%) | 6 | 400 |
| Ultraviolet resistance | good | poor |
| Solvent resistance | poor | good |
| Microorganism | Substrate | PHB [gL-1] | PHB [g L-1 h-1] | Reference |
| Bacillus megaterium B2 | Glycerol | 1.2 | 0.11 | (11) |
| Bacillus megaterium B2 | Glycerol | 1.59 | 0.044 | (12) |
| Bacillus megaterium B2 | Cacao liquid wastes | 11.6 | 0.16 | (13) |
| Bacillus megaterium DSM32T | Saccharose | 0.162 | (13) | |
| Bacillus megaterium S29 | Glucose | 5.4 | 0.45 | (14) |
| Bacillus megaterium R11 | OPEFB* | 12.48 | 0.26 | [(15) |
| Bacillus megaterium BBST4 | Glucose | 3.3 | 0.103 | (16) |
| Bacillus megaterium BBST4 | Glycerol | 4.8 | 0.114 | (17) |
| Bacillus megaterium BA-019 | Molasses |
4.16 | 0.35 |
(18) |
| Bacillus megaterium | Whey | 5.97 | 0.124 |
This work |
| Experiment set | Strein and conditions |
Yield coefficient [C-mol CO2/C-mol Glucose] |
Values reported [C-mol CO2/C-mol Glucose] |
| 1 | B. subtilis NTE | 0.54 | 0.3 - 0.6 |
| 2 | B. subtilis WTE | 0.49 | 0.3 - 0.6 |
| 3 | B. megaterium NTE | 0.39 | 0.4 – 0.7 |
| 4 | B. megaterium WTE | 0.41 | 0.3 - 0.6 |
| Component |
Concentration [% mass] |
Notes |
| Water | ≈ 93 | Main component |
| Lactose | ≈ 5.1 | Primary carbohydrate |
| Proteins | ≈ 0.8 | Includes β-lactoglobulin, α-lactalbumin, glycomacropeptide, serum albumin |
| Fats | 0.1 – 0.4 | Lower in acid whey |
| Mineral (ash) | ≈ 0.5 – 0.7 | Calcium, phosphorus, sodium, potassium, magnesium |
| Vitamins | Traces | B-complex, especially riboflavin |
| Compound |
Concentration [g L-1] |
Concentration [mol L-1] |
| Glycerol C3H8O3 | 60.0 | 0.6516 |
| Glucose C6H12O6 | 20.0 | 0.1111 |
| Ammonium sulfate [NH4]2SO4 | 0.8 |
0.00605 |
| Magnesium sulfate MgSO4 • 7 H2O | 0.2 | 0.00081 |
| Trace elements (NulanZa brand) [mL L-1] | 1 | |
| Total carbon | 2.4546 | |
| Total nitrogen | 0.0121 | |
| C/N relation | 220:1 | |
| Initial pH level | 7.0 | |
| Temperature | [°C] | 30 |
| Agitation | 3.5 Hz | 210 rpm |
| Total volume | [L] | 1.7 |
| Time | [hrs.] | 180 |
| Inoculum volume | [L] | 0.3 |
Disclaimer/Publisher’s Note: The statements, opinions and data contained in all publications are solely those of the individual author(s) and contributor(s) and not of MDPI and/or the editor(s). MDPI and/or the editor(s) disclaim responsibility for any injury to people or property resulting from any ideas, methods, instructions or products referred to in the content. |
© 2026 by the authors. Licensee MDPI, Basel, Switzerland. This article is an open access article distributed under the terms and conditions of the Creative Commons Attribution (CC BY) license (http://creativecommons.org/licenses/by/4.0/).


