Submitted:
23 January 2026
Posted:
26 January 2026
You are already at the latest version
Abstract
This study, based on long-term engineering practice, conducted a systematic analysis of the evolution process of the enterprise communication system from the application layer to the platform layer. By integrating the operation and maintenance records of multiple communication systems from 2014 to 2024, a quantitative study was carried out from dimensions such as function module reusability, operational complexity, and service capacity. The statistical results show that as the degree of system platformization increases, the reusability of core functional modules has risen from approximately 30% to over 65%. The annual maintenance manpower input has decreased by approximately 35% to 40%. The research results indicate that the platform-based architecture has significant advantages in supporting the long-term evolution and multi-service coordination of enterprise communication systems.
Keywords:
enterprise communication systems
; platform-based evolution
; engineering analysis
; software architecture
; quantitative research
1. Introduction
Enterprise communication systems are critical for multi-service operations and internal collaboration. Traditional application-centric architectures resulted in low module reuse, inconsistent interfaces, and high operational pressure, limiting adaptability. To enhance resource integration and service capacity, platform-based architectures have become mainstream. Andersen et al. [1] (2023) noted their advantages in module versatility and deployment efficiency; Cao [2] (2024) highlighted improved multi-domain collaboration; Nevi et al. [3] (2025) emphasized integration across business models; and de Zabala et al. [4] (2025) stressed the role of resource orchestration in performance evolution. However, engineering and quantitative studies on architectural transitions remain limited. This paper addresses the gap by constructing an indicator system using data from 2014–2024 to analyze the shift from application- to platform-level architectures in terms of module reuse, operational complexity, and service capacity.
2. Engineering Metrics Framework Construction and Data Sources
2.1. Design of the Metric System for Platform Effectiveness Evaluation
The architectural evolution of platformized communication systems requires multidimensional quantification through systematic engineering metrics[5]. An evaluation framework can be constructed based on module reuse levels, system support capabilities, and maintenance complexity. Among these, the module reuse rate reflects the sharing of functional components across different systems, the system carrying index measures the support breadth of business subsystems, and the maintenance labor intensity quantifies the level of operational and maintenance resource investment [6]. The module reuse rate is defined as follows:
where denotes the number of system samples, represents the number of functional modules reused across multiple platforms in the th system, and is the total number of functional modules in that system. The system carrying index is calculated using a weighted average of business coverage and interface extensibility:
Where represents the number of business types supported by the current system, denotes the total number of business types, indicates the number of reusable interfaces, signifies the total number of interfaces, and is the weighting parameter.
2.2. Data Collection Methodology and Sample System Description
Data was collected from eight communication systems deployed between 2014 and 2024 in the financial, telecom, and energy sectors, all requiring high reliability and multi-service support. Sources include deployment documents, module inventories, maintenance records, and interface logs, archived by system providers during project acceptance and routine operations. Due to differences in development stages and platform maturity, the systems vary in log formats, module granularity, and interface naming. To ensure comparability, standardized coding was applied to module names, interface types, and business identifiers, reducing structural heterogeneity in the quantitative analysis. The coding scheme is defined as follows:
Where represents the standardized expression of theth module in theth system, denotes the functional category of the module, corresponds to the business type code, and identifies the module’s service level. The function implements field mapping and unique index generation. This standardization method supports subsequent multi-system quantitative analysis of module reuse rate ( ), system carrying capacity index ( ), and interface abstraction rate ( ), ensuring consistency and scalability of metrics across time series and architectural layers [7].
2.3. Data Cleaning and Standardization Workflow
To ensure consistency in dimension, accuracy, and timestamps, data cleaning follows a hierarchical process based on log structure and semantics, comprising four phases: field standardization, anomaly removal, identifier normalization, and metric mapping (see Figure 1). In the first phase, key fields—such as module names, interface types, and business labels—are aligned using the coding scheme from Section 3.2 to resolve naming mismatches and redundant classifications. Anomaly removal uses statistical outlier detection to eliminate records that violate logical constraints, such as spikes in call frequency or missing values. Thresholds are determined via normal distribution fitting[8]. For continuous fields, the standard deviation-based filtering function is defined as:
where is the mean of , is the standard deviation, and is the outlier threshold coefficient (recommended range: 2–3).In phase 3, all numerical and categorical fields are normalized to the [0,1] range to enhance computational accuracy and cross-system metric stability. A semantic multi-to-one mapping is then applied—for example, mapping module names to functional categories and corresponding reuse indicators. This unified conversion transforms heterogeneous fields into comparable structural metrics, ensuring statistical robustness and supporting cross-system trend analysis.
3. Engineering Analysis of Architectural Evolution
3.1. Functional Module Evolution and Service Abstraction Strategy
During platformization, communication system modules evolved from embedded forms to service-oriented structures. Early architectures were tightly coupled, with modules bound to business logic, limiting reuse and causing redundant development during scaling. As abstraction demands grew, intermediate encapsulation enabled generic business functions to be extracted and restructured into schedulable service components. This shift enhanced decoupling, replacing full interface coupling with orchestrated service interactions. The abstraction level is measured by the module decoupling factor, , defined as:
Where represents the total number of modules, denotes the number of external interfaces directly dependent on the th module, and indicates the total number of interfaces for that module. When approaches 1, it signifies higher module abstraction and stronger decoupling.
3.2. Unification Process of Communication Kernel and Interface Architecture
The communication kernel, as the control center of enterprise systems, is central to platform development. In traditional architectures, each business module handled its own protocol parsing and interface logic, resulting in inconsistent standards, redundant interactions, and fragmented updates. To improve decoupling and coordination, the kernel was abstracted into an intermediate layer managing core functions like connection handling, message dispatching, protocol conversion, and scheduling [9]. Once unified, the kernel provides services through standardized formats and protocols, enabling concurrent access and scalable operations. The interface architecture integrates a registry and gateway to ensure service visibility, protocol compatibility, and access control, replacing the module-to-module model with a centralized module-to-service structure that shortens and simplifies call paths. A flattening ratio of interface paths can be defined as , where and denote the average call chain lengths before and after unification, respectively. When , the unified interface architecture effectively compresses invocation paths, enhances module reuse, and improves service transparency—thereby strengthening the platform’s structural capacity and operational efficiency.
3.3. Multi-Service Support Architecture Adaptation Mechanism
Multi-service support is essential for evaluating the stability and adaptability of platform communication architectures. As business subsystems vary in access requirements—timing, protocols, concurrency, and authentication—the architecture employs a multi-layered adaptation mechanism, including a unified gateway, dynamic protocol parser, asynchronous buffer, and domain-based permission control. A service distribution engine bridges business clusters with the communication kernel and data bus, enabling scheduling and isolation through routing tables and service registries. The platform’s concurrent adaptation capacity under load is quantified by the adaptation capacity coefficient, defined as:
Where represents the maximum concurrent business volume supported by the platform, denotes the average transaction response time, and signifies the business complexity factor.
3.4. Evolution of Middleware, Configuration Center, and Resource Pooling Deployment
Platform deployment has increasingly incorporated middleware, centralized configuration centers, and resource pooling to enable cross-module coordination and unified resource management. Middleware supports service decoupling and protocol adaptation through asynchronous communication and load balancing using message queues, service buses, and API gateways. Configuration centers manage variables, versioning, and credentials, allowing hot updates and canary releases without restarts. Resource pooling abstracts computing, storage, and network resources into schedulable units, supporting cross-service sharing and isolation via virtualization frameworks [10]. As shown in Figure 2, these components form a closed-loop control structure—“middleware–configuration center–resource pool”—through a unified abstraction layer that improves availability and operational control.
To measure resource scheduling efficiency within the platform deployment system, the resource utilization coefficient is defined as:
Where represents the actual utilized capacity of the th resource unit, denotes the allocated capacity, and indicates the total number of resource nodes.
4. Quantitative Analysis Results and Performance Comparison Evaluation
4.1. Analysis of Module Reuse Rate Trends
To assess structural optimization during platform evolution, eight systems from 2014 to 2024 were analyzed. Annual totals of functional and reused modules were extracted from inventories, registration logs, and version records. Standardized coding ensured consistency across systems. As shown in Table 1, module reuse was below 35% in 2014. With modular abstraction, layered services, and unified interfaces, it rose steadily—exceeding 50% after the 2018 adoption of centralized configuration and gateways, and reaching 67.4% by 2024. While this reflects platform maturity, concurrent technologies like containerization and CI/CD may have contributed. This analysis isolates architectural trends; future studies should apply multivariate models to clarify causality.
4.2. Statistics on Changes in Operational Maintenance Man-Hours
From 2014 to 2024, operational labor data—covering incident response, version updates, configuration changes, and interface testing—were sourced from daily work orders and annual HR reports. After data cleansing, standardized calculations produced annual man-hours per system, with platform-related effort mapped at the module level.
As shown in Figure 3, early systems required over 970 person-hours annually due to tight coupling and inconsistent interfaces. From 2018, centralized configuration and middleware improved standardization, reducing maintenance effort to 610 hours by 2022—a 35% decrease. Modular abstraction and interface unification lowered update and testing workloads; configuration updates dropped from 4.5 to 2.1 hours, and compatibility testing time fell by 28% with unified gateways. While platform design was central, CI/CD and container adoption after 2018 also likely played a role. This analysis focuses on structural impacts, though future studies should use multivariate methods to isolate contributing factors.
4.3. Correlation Analysis of Metrics and Summary of Platformization Outcomes
To examine correlations among key indicators during communication system platformization, a cross-sectional dataset was created using four metrics: module reuse rate, maintenance man-hours, service capacity, and resource utilization. After normalization, Pearson coefficients were calculated for each pair and visualized with trend and scatter plots. As shown in Figure 4, module reuse rate correlates positively with service capacity , indicating that abstraction and reuse enhance scalability. It also shows a negative correlation with maintenance hours), reflecting reduced resource demand through architectural optimization. This relationship can be structurally interpreted as:
Resource utilization, as a deployment efficiency metric, shows strong synergy with other indicators, highlighting the role of unified scheduling in platform performance. However, some effects may stem from concurrent technologies such as containerization, CI/CD, or auto-scaling. While statistical links to platform architecture are evident, causal strength remains unclear. Future work should apply multivariate regression or structural modeling to isolate overlapping influences and clarify causality.
5. Conclusions
Quantitative analysis of module reuse, resource utilization, and labor hours demonstrates the integration benefits and enhanced stability of platform-based communication architectures. Strong metric correlations validate the engineering value of resource pooling, configuration decoupling, and unified middleware. However, since the data comes from finance, telecom, and energy sectors with mature modular systems, generalizability is limited. Concurrent technologies like containerization, CI/CD, and automation may also have influenced outcomes, but their effects were not isolated. Future studies should apply multivariate and structural models to distinguish platformization impacts and expand validation to sectors such as manufacturing and the public domain.
References
- Andersen, R; Brunoe, T D; Nielsen, K. Platform-based product development in the process industry: a systematic literature review[J]. International Journal of Production Research 2023, 61(5), 1696–1719. [Google Scholar] [CrossRef]
- Cao, J. Construction and Application of Industry-University-Research Platform Based on Software Engineering and Internet of Things Technology in Digital Art[J]. Computer-Aided Design & Applications 2024, 21, 122–140. [Google Scholar]
- Nevi, G; Montera, R; Cucari, N; et al. Integrating AI and ESG in digital platforms: New profiles of platform-based business models[J]. Journal of Engineering and Technology Management 2025, 78, 101913. [Google Scholar] [CrossRef]
- de Zabala, Y; Bikfalvi, A; de Castro, R; et al. Orchestrating resources and capabilities for platform-based servitization: recommendations for SMEs to overcome tensions[J]. International Journal of Industrial Engineering and Management 2025, 16(4), 359–376. [Google Scholar] [CrossRef]
- Hu, L. Topic Classification of Small Sample News Based on Prompt Engineering. Applied and Computational Engineering 2025, 170, 101–107. [Google Scholar] [CrossRef]
- Liu, Z; Li, Z; Zhang, Y; et al. Comparing business, innovation, and platform ecosystems: a systematic review of the literature[J]. Biomimetics 2024, 9(4), 216. [Google Scholar] [CrossRef] [PubMed]
- Salamzadeh, A; Dana, L P; Ebrahimi, P; et al. Technological barriers to creating regional resilience in digital platform-based firms: Compound of performance sensitivity analysis and BIRCH algorithm[J]. Thunderbird International Business Review 2024, 66(2), 135–149. [Google Scholar] [CrossRef]
- Topalova, I; Lozova, T; Riepnova, T; et al. Business Process Management in Entrepreneurial Activity Based on a Platform Approach[J]. Indian Journal of Information Sources and Services 2024, 14(2), 46–55. [Google Scholar] [CrossRef]
- Proulx, M; Gardoni, M. Harness collaboration between manufacturing Small and medium-sized enterprises through a collaborative platform based on the business model canvas[J]. Concurrent Engineering 2023, 31(3-4), 127–136. [Google Scholar] [CrossRef]
- Popova, P; Popov, V; Marinova, K; et al. The Digital Platform—new opportunities and implementation strategy[C]//2024 16th International Conference on Electronics, Computers and Artificial Intelligence (ECAI); IEEE; Volume 2024, pp. 1–9.
Figure 1.
Data Cleaning and Standardization Process.
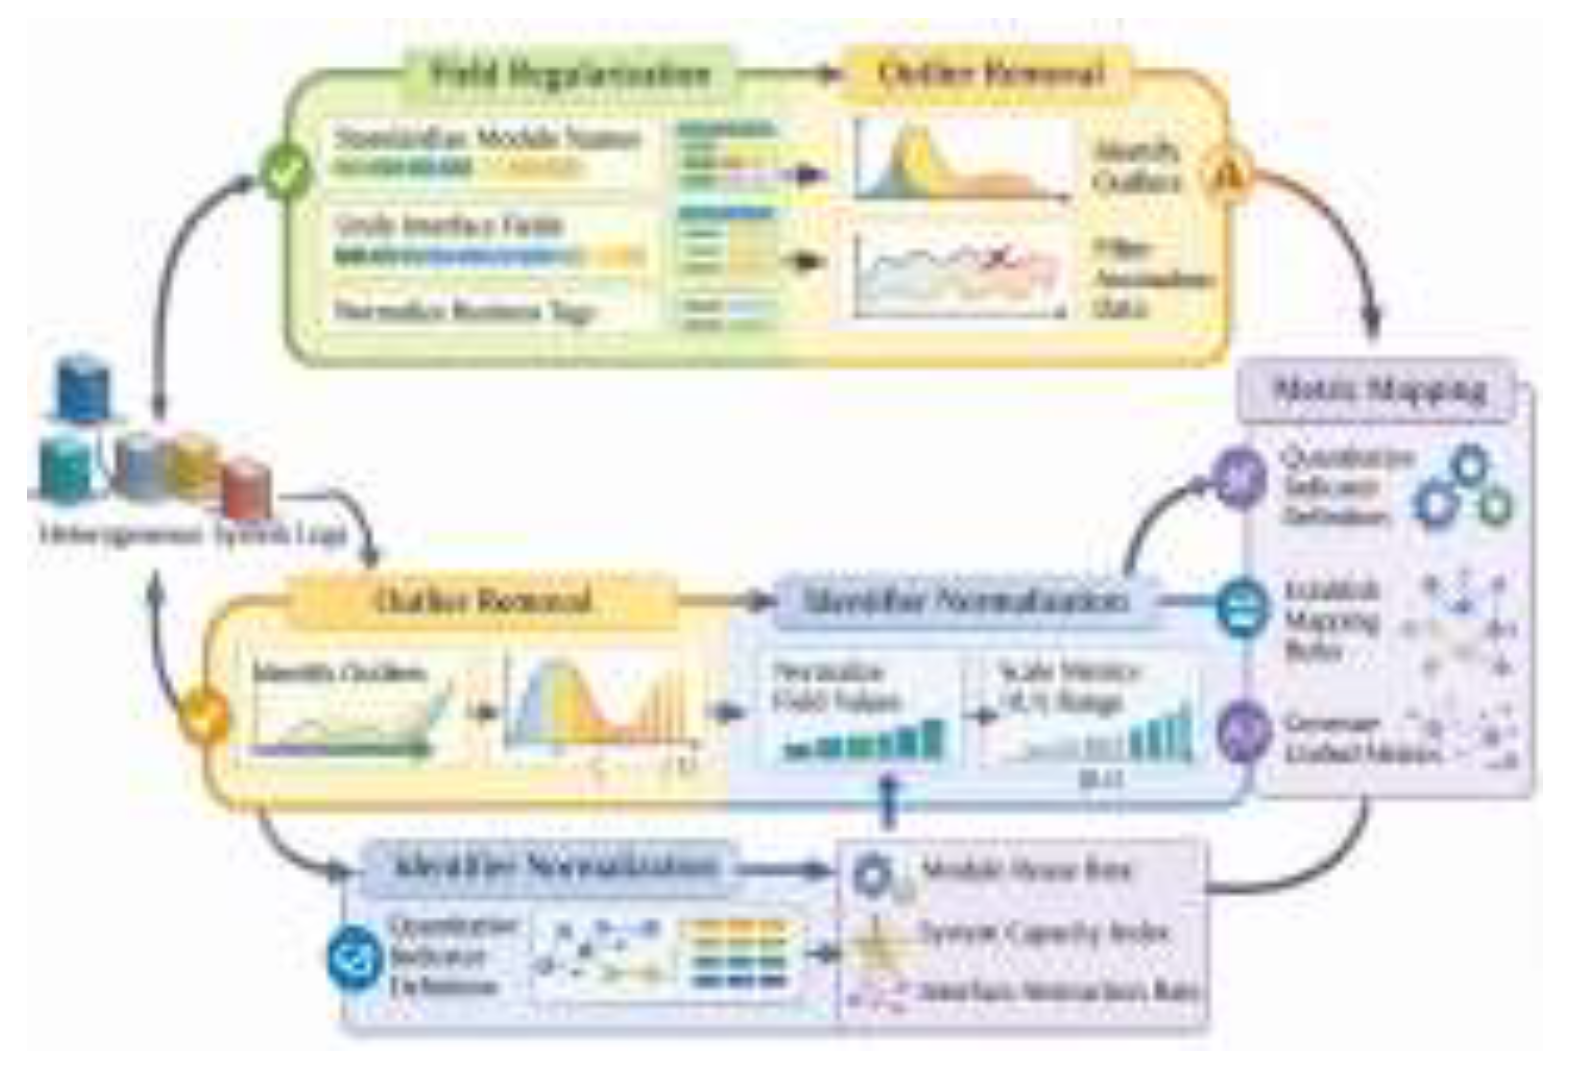
Figure 2.
Cluster Infrastructure Pool Deployment Architecture.
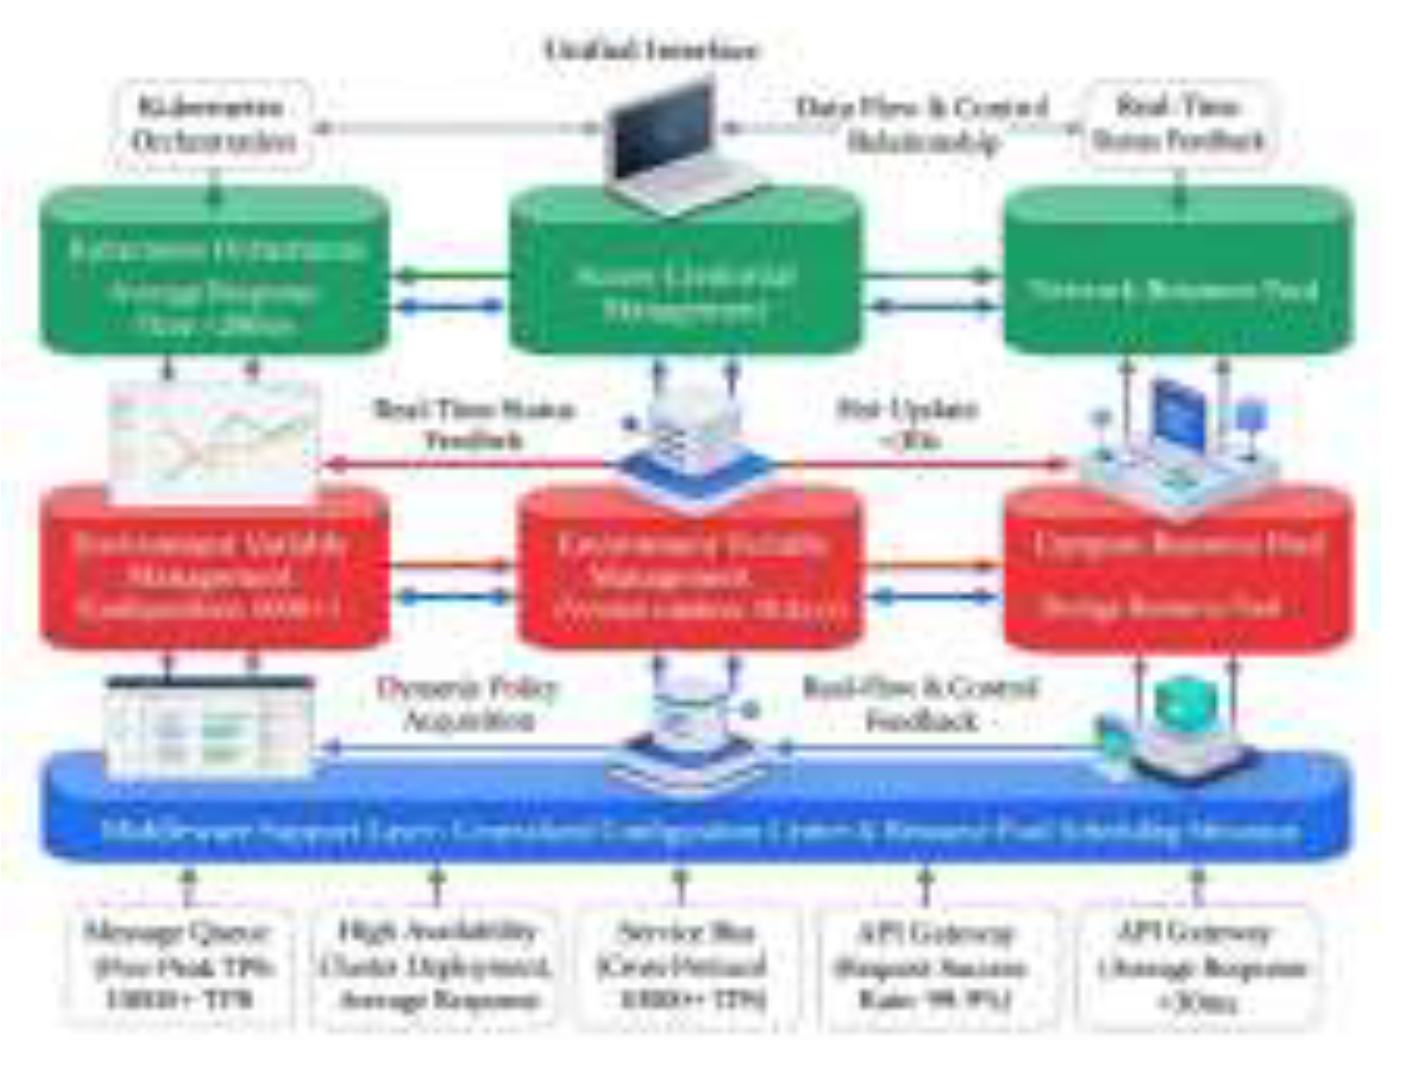
Figure 3.
Maintenance Time Changes Before and After Platform Architecture Implementation.
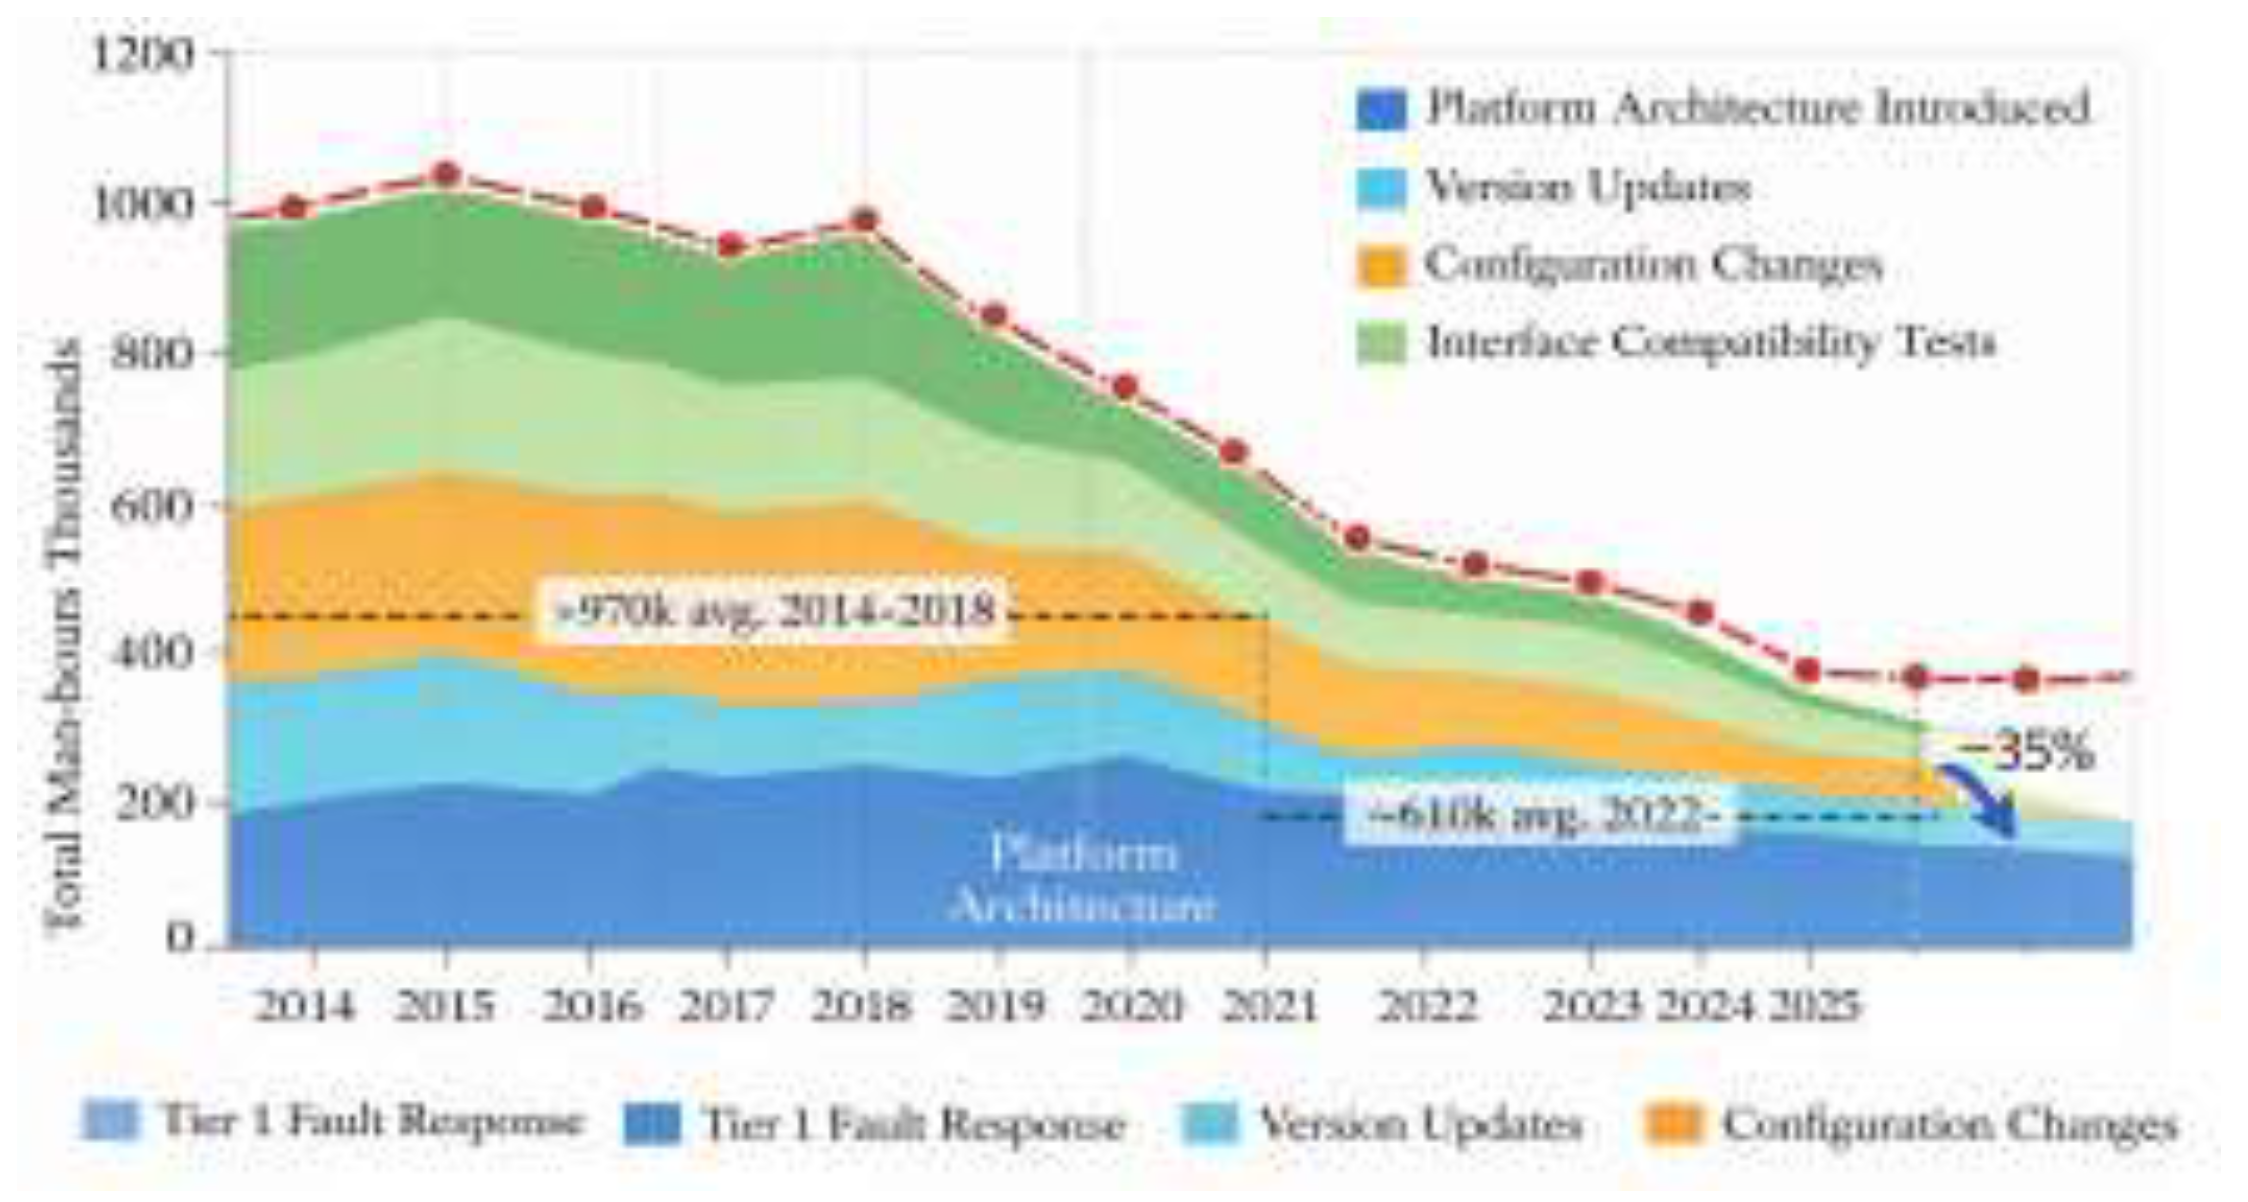
Figure 4.
Correlation Analysis of Platformization Index.
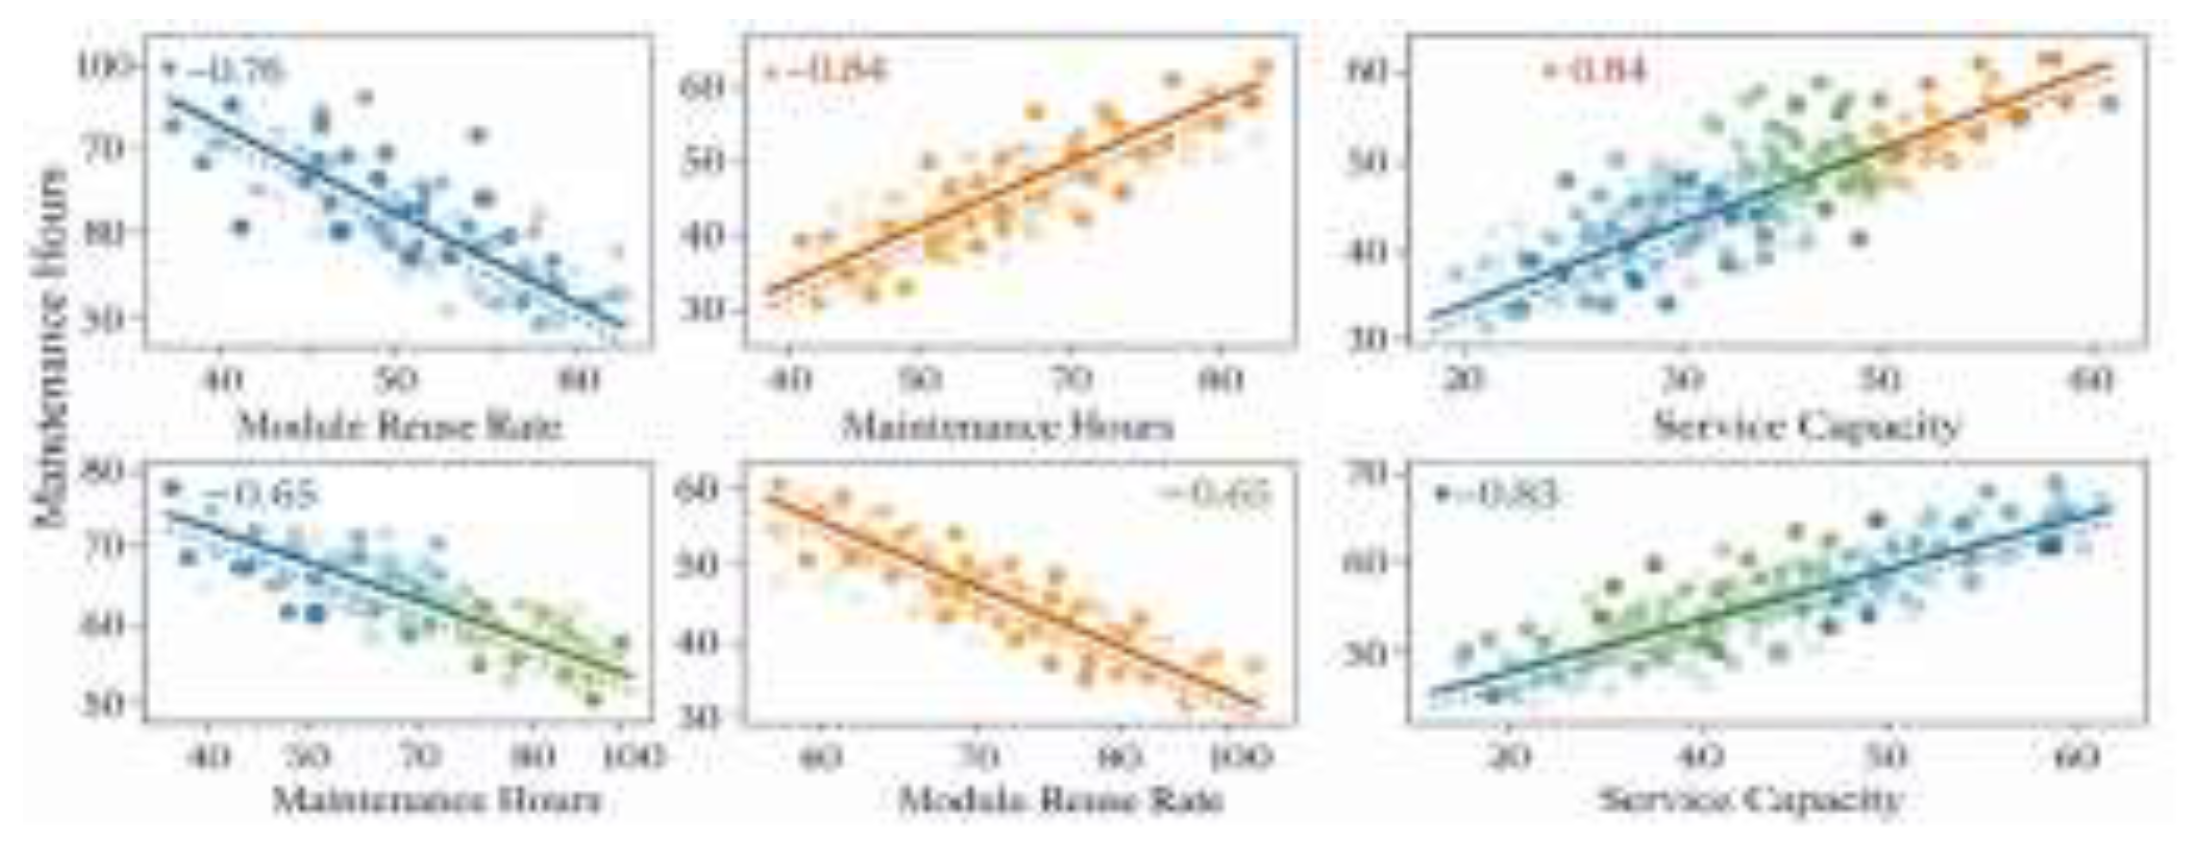

Table 1.
Annual Module Reuse Rate Statistics.
| Year | Number of Sample Systems | Total Modules | Number of Reused Modules | Module Reuse Rate (%) |
| 2014 | 3 | 126 | 43 | 34.1 |
| 2016 | 4 | 139 | 59 | 42.4 |
| 2018 | 5 | 153 | 79 | 51.6 |
| 2020 | 6 | 166 | 89 | 53.6 |
| 2022 | 7 | 178 | 102 | 57.3 |
| 2024 | 8 | 185 | 125 | 67.4 |
Disclaimer/Publisher’s Note: The statements, opinions and data contained in all publications are solely those of the individual author(s) and contributor(s) and not of MDPI and/or the editor(s). MDPI and/or the editor(s) disclaim responsibility for any injury to people or property resulting from any ideas, methods, instructions or products referred to in the content. |
© 2026 by the authors. Licensee MDPI, Basel, Switzerland. This article is an open access article distributed under the terms and conditions of the Creative Commons Attribution (CC BY) license (http://creativecommons.org/licenses/by/4.0/).
Copyright: This open access article is published under a Creative Commons CC BY 4.0 license, which permit the free download, distribution, and reuse, provided that the author and preprint are cited in any reuse.


