Submitted:
22 January 2026
Posted:
23 January 2026
You are already at the latest version
Abstract
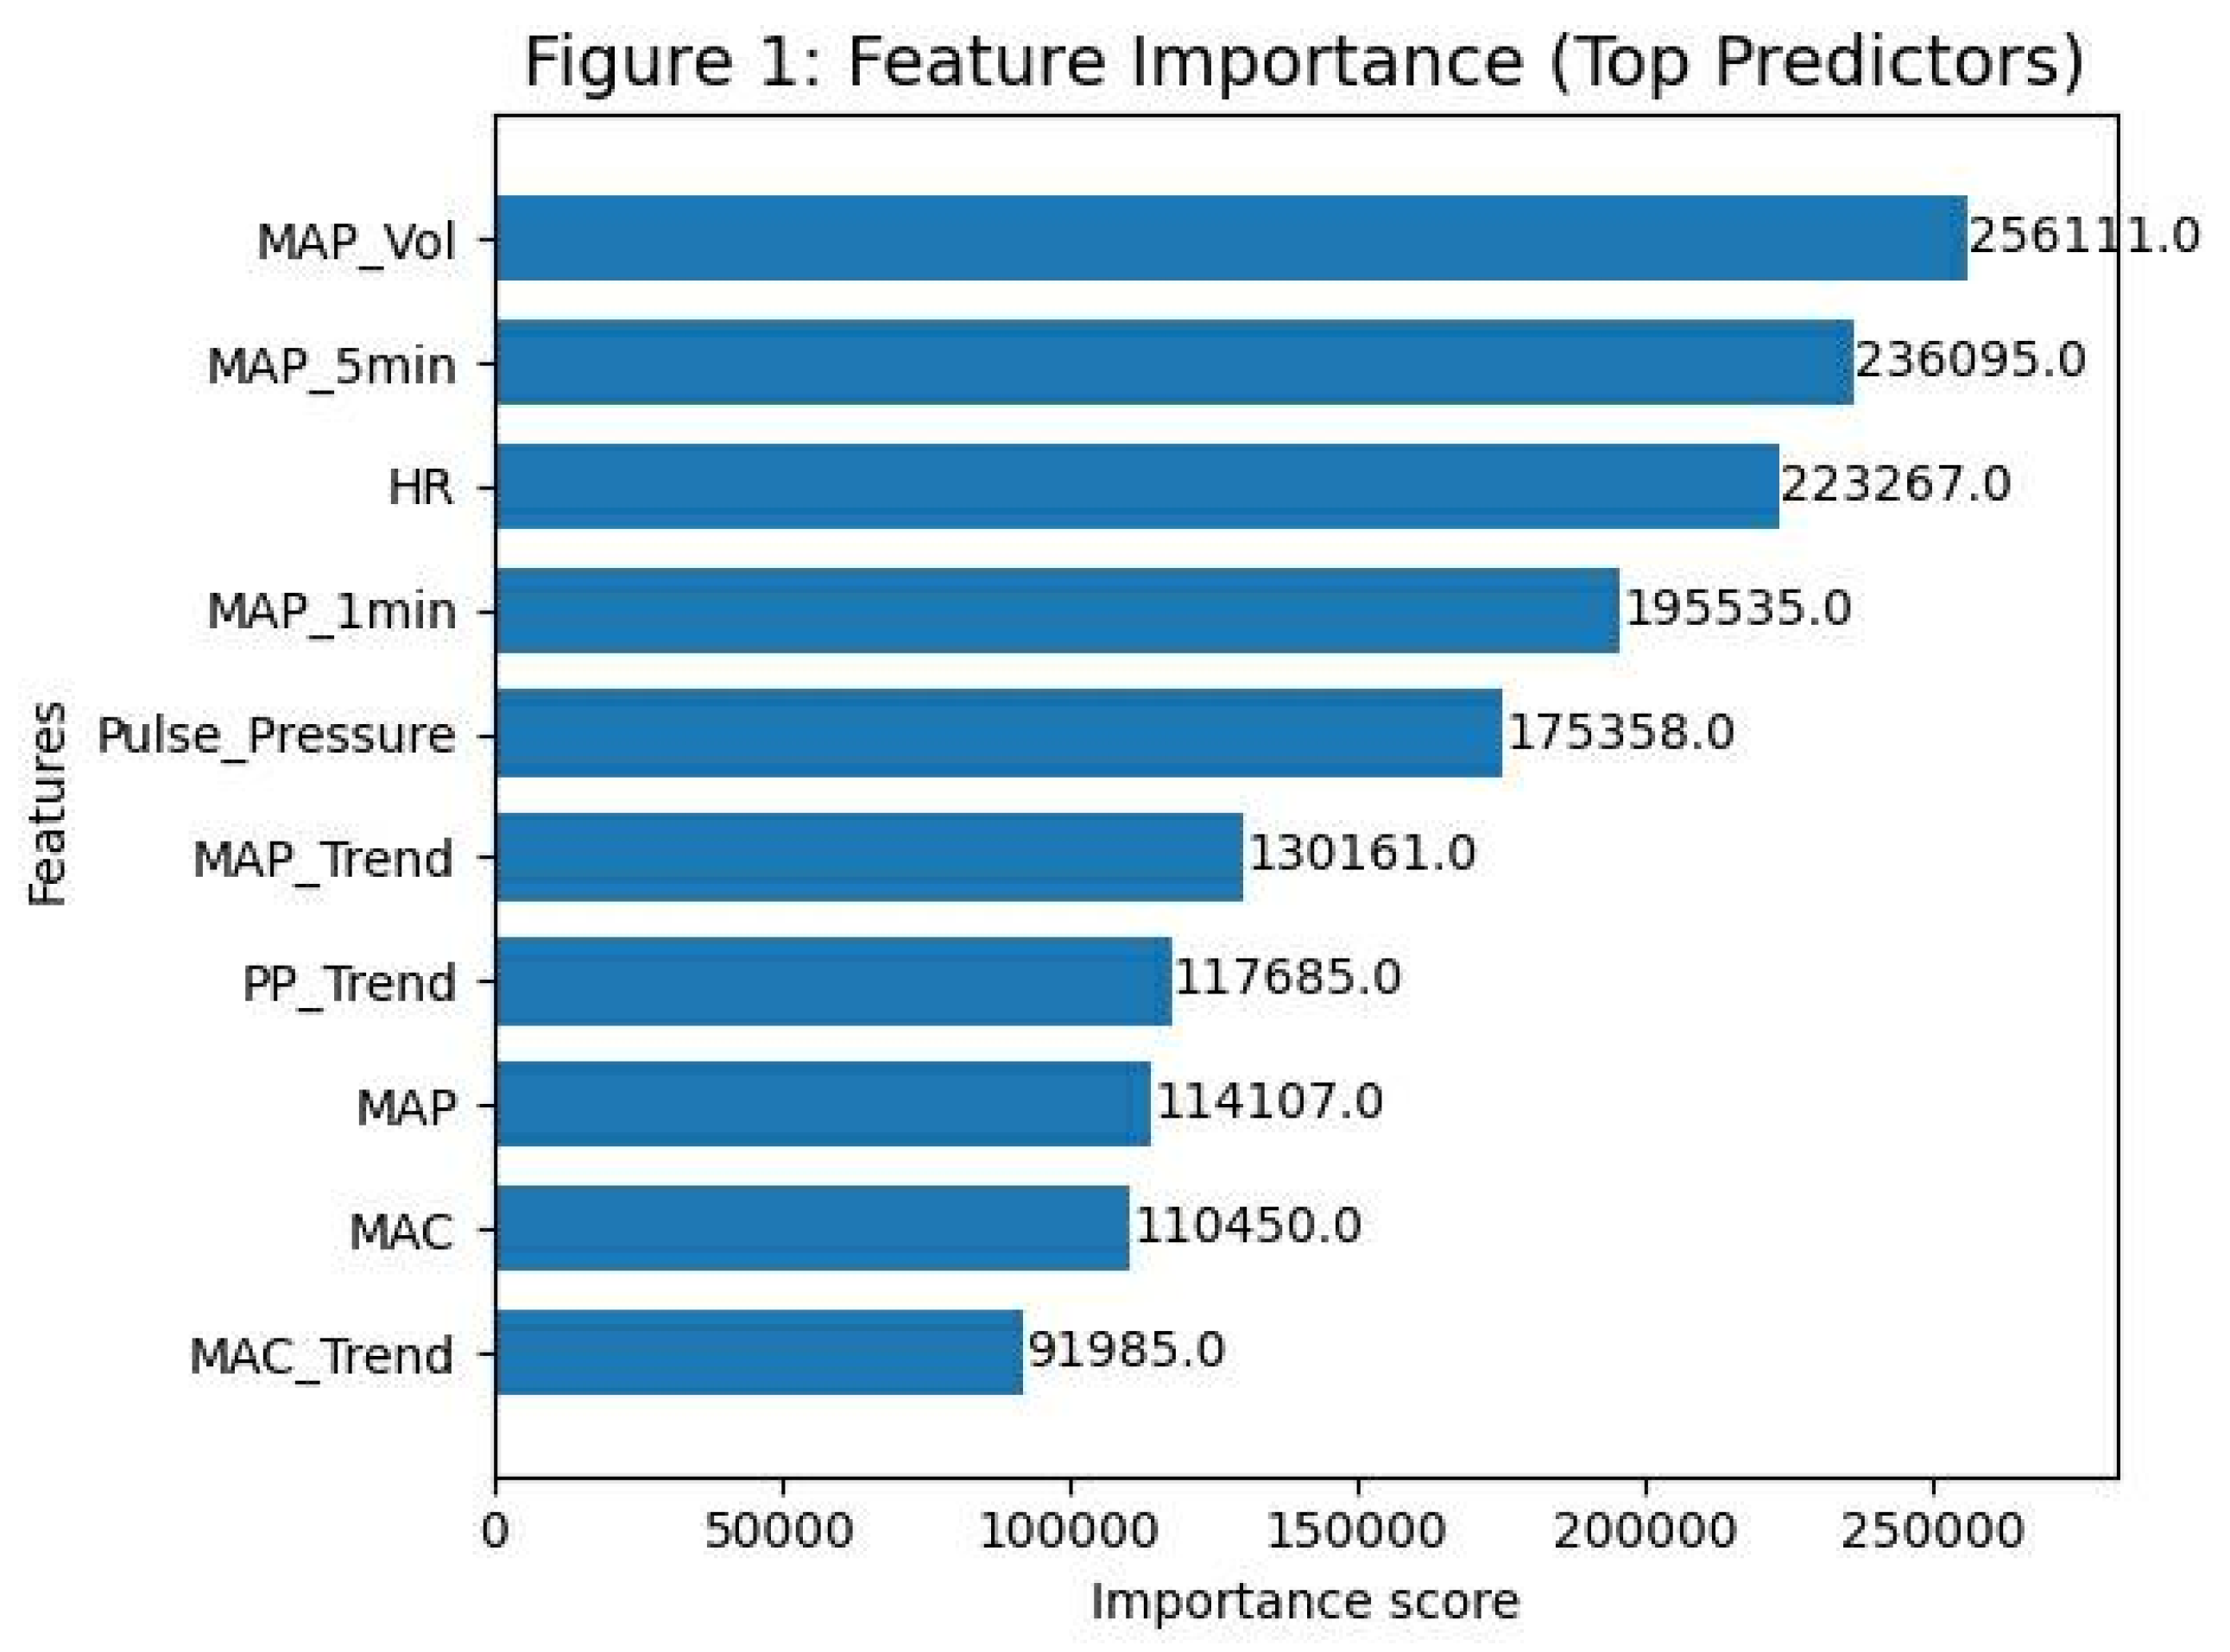
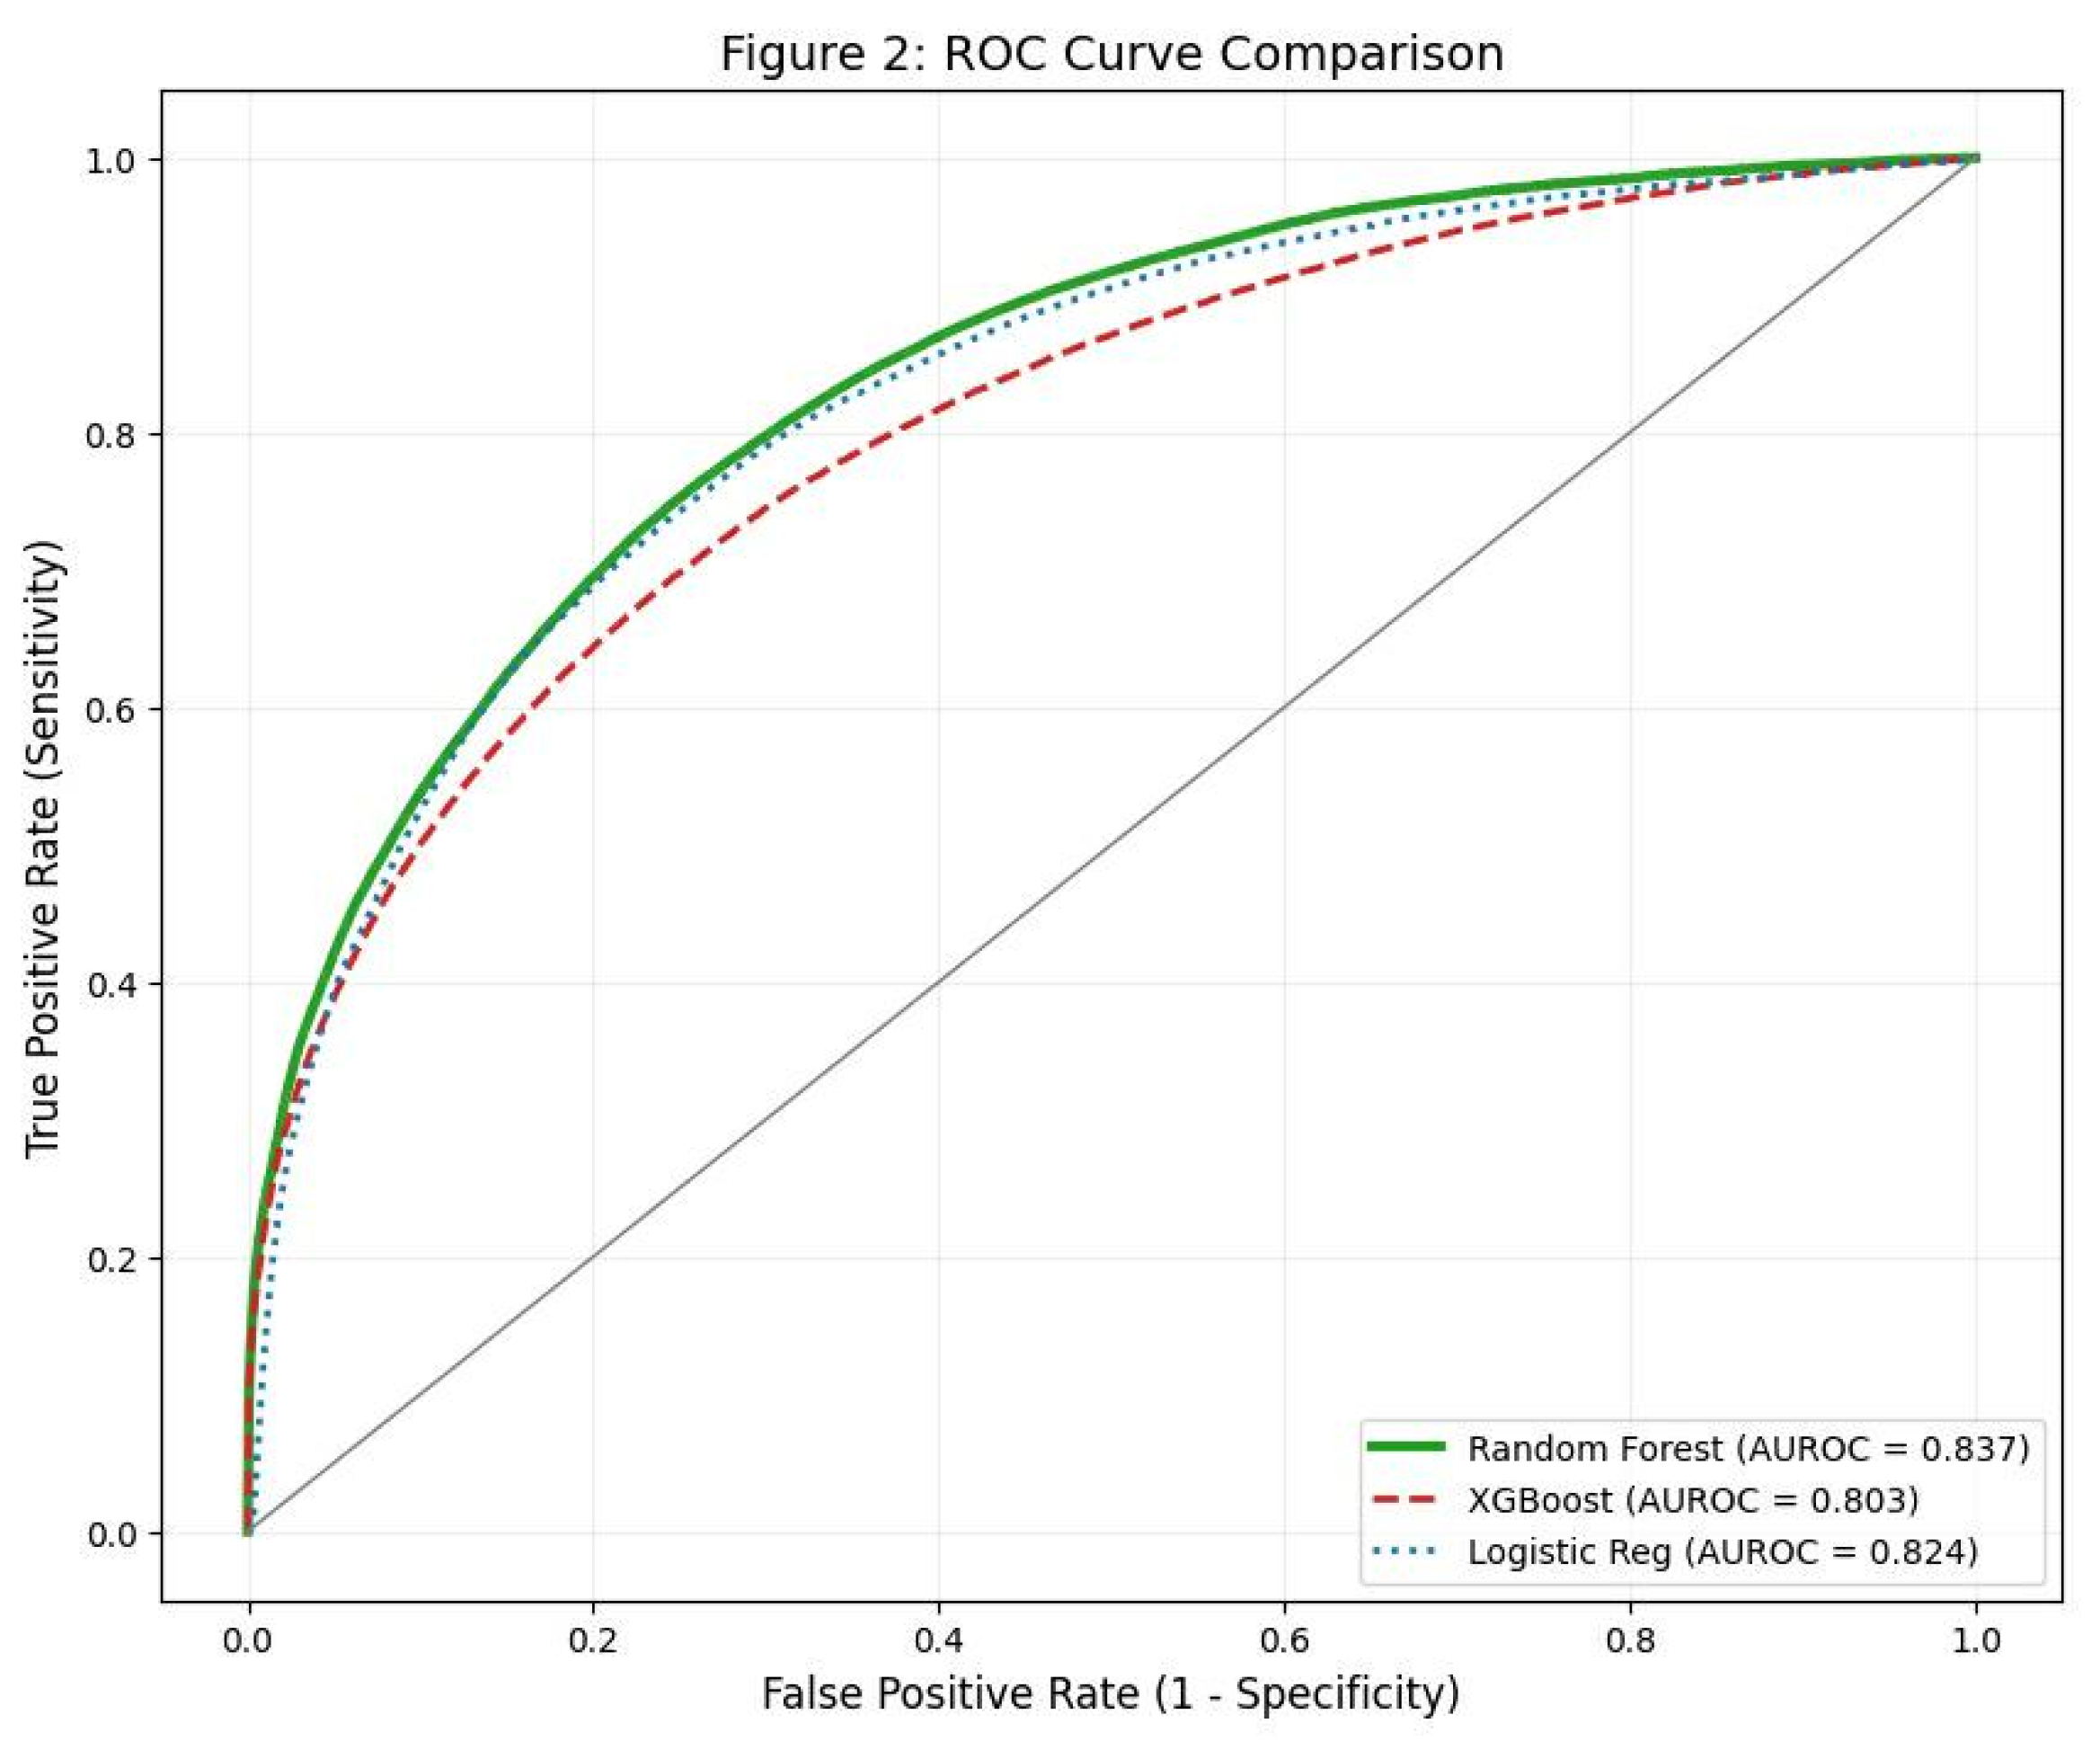
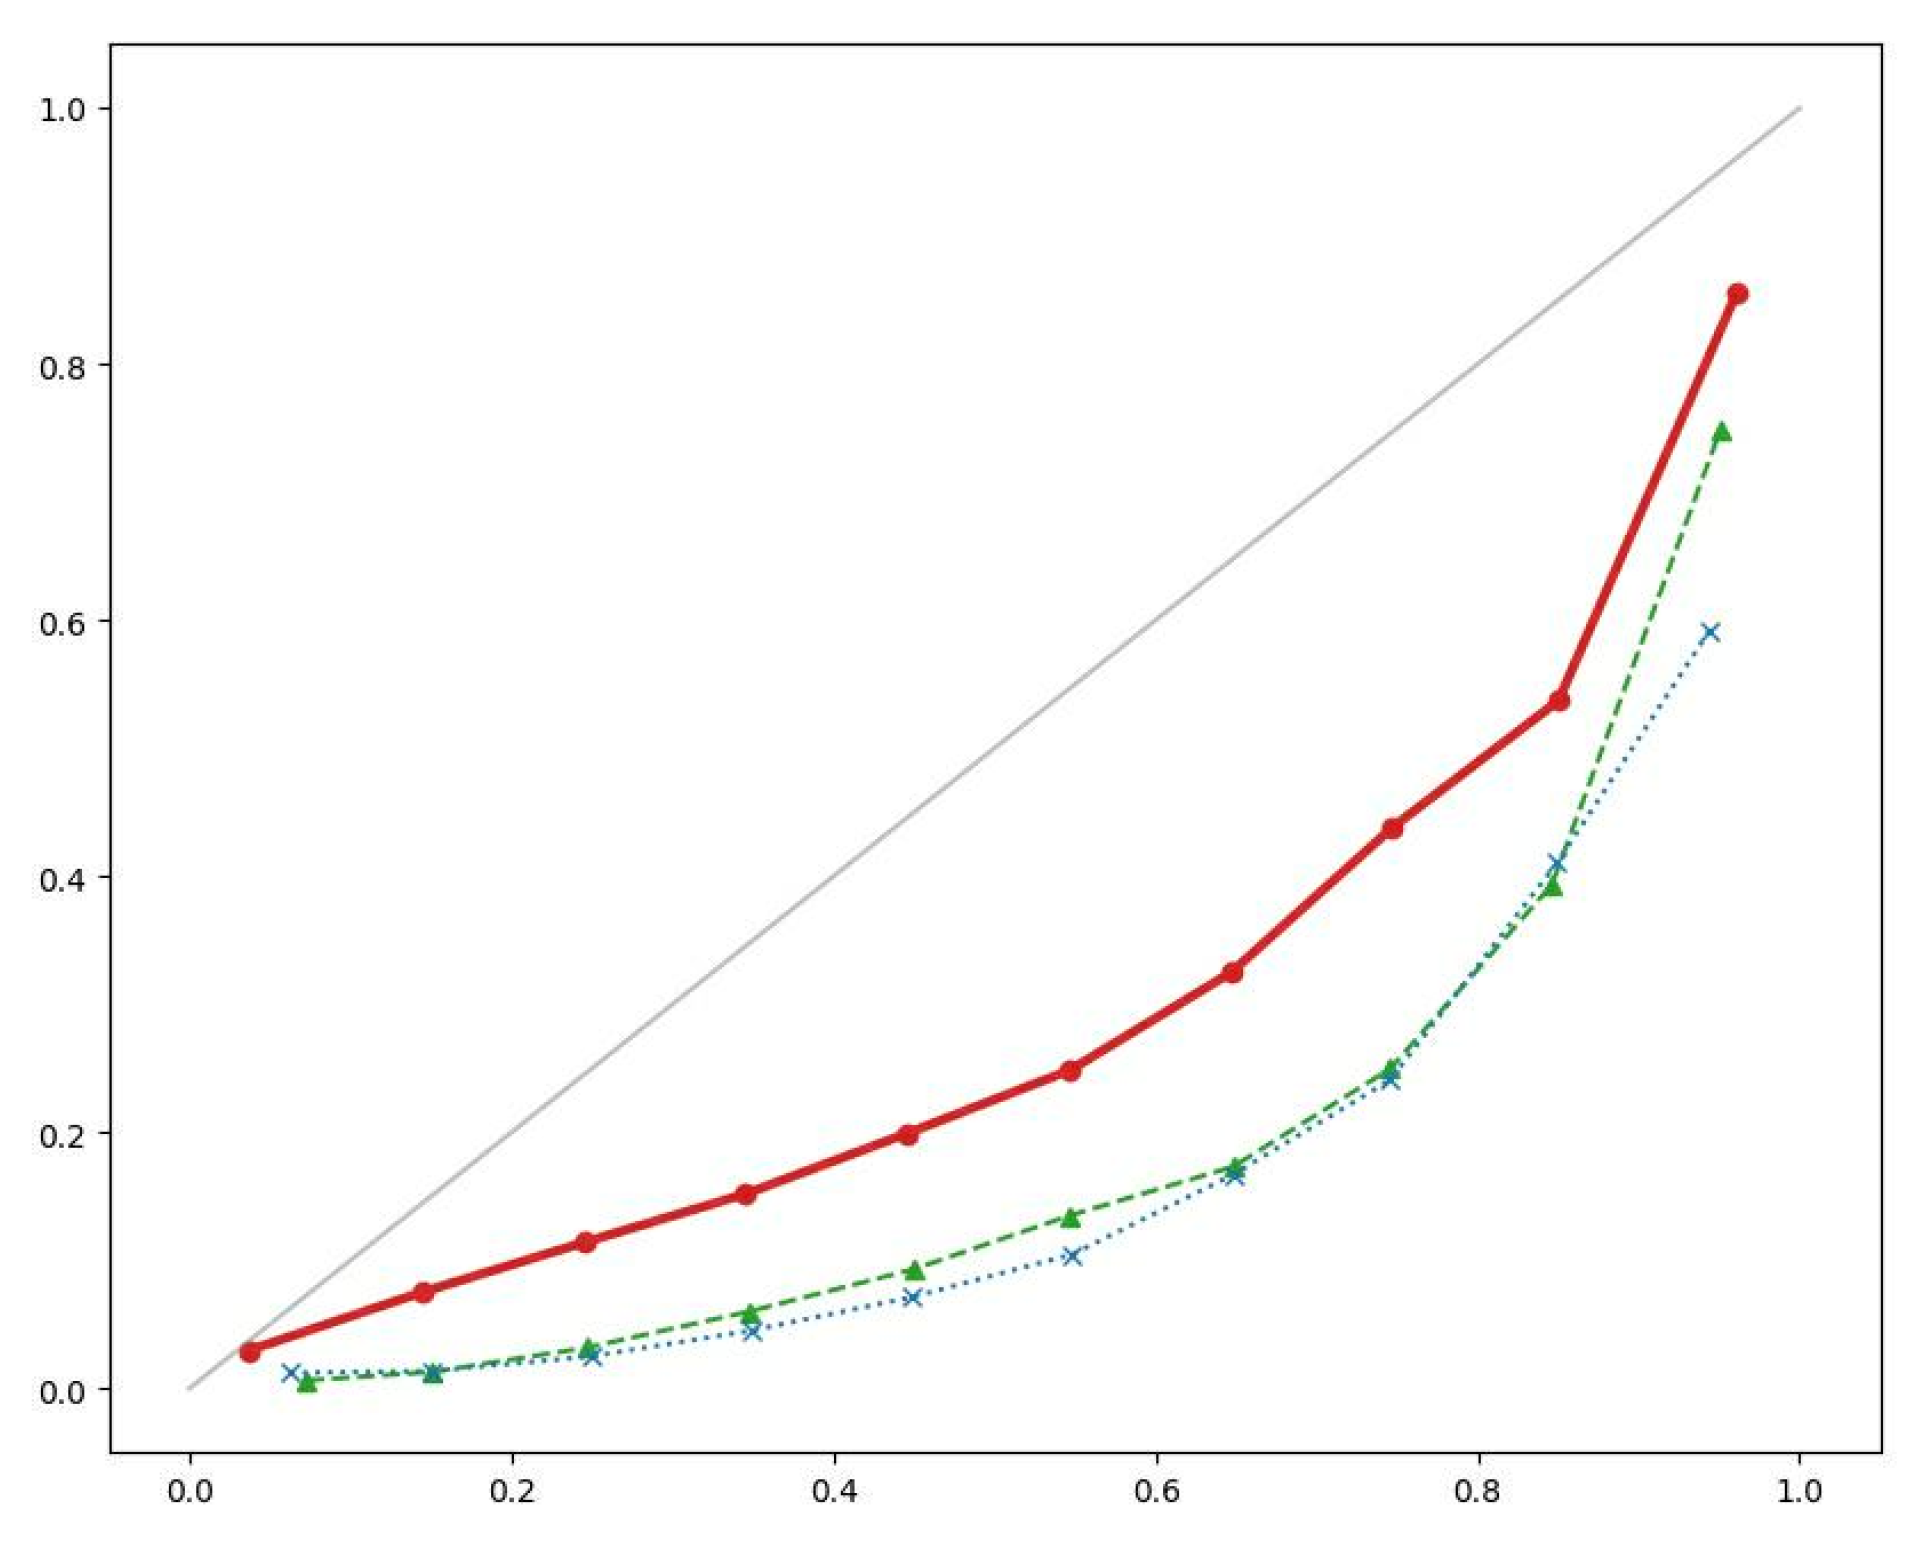
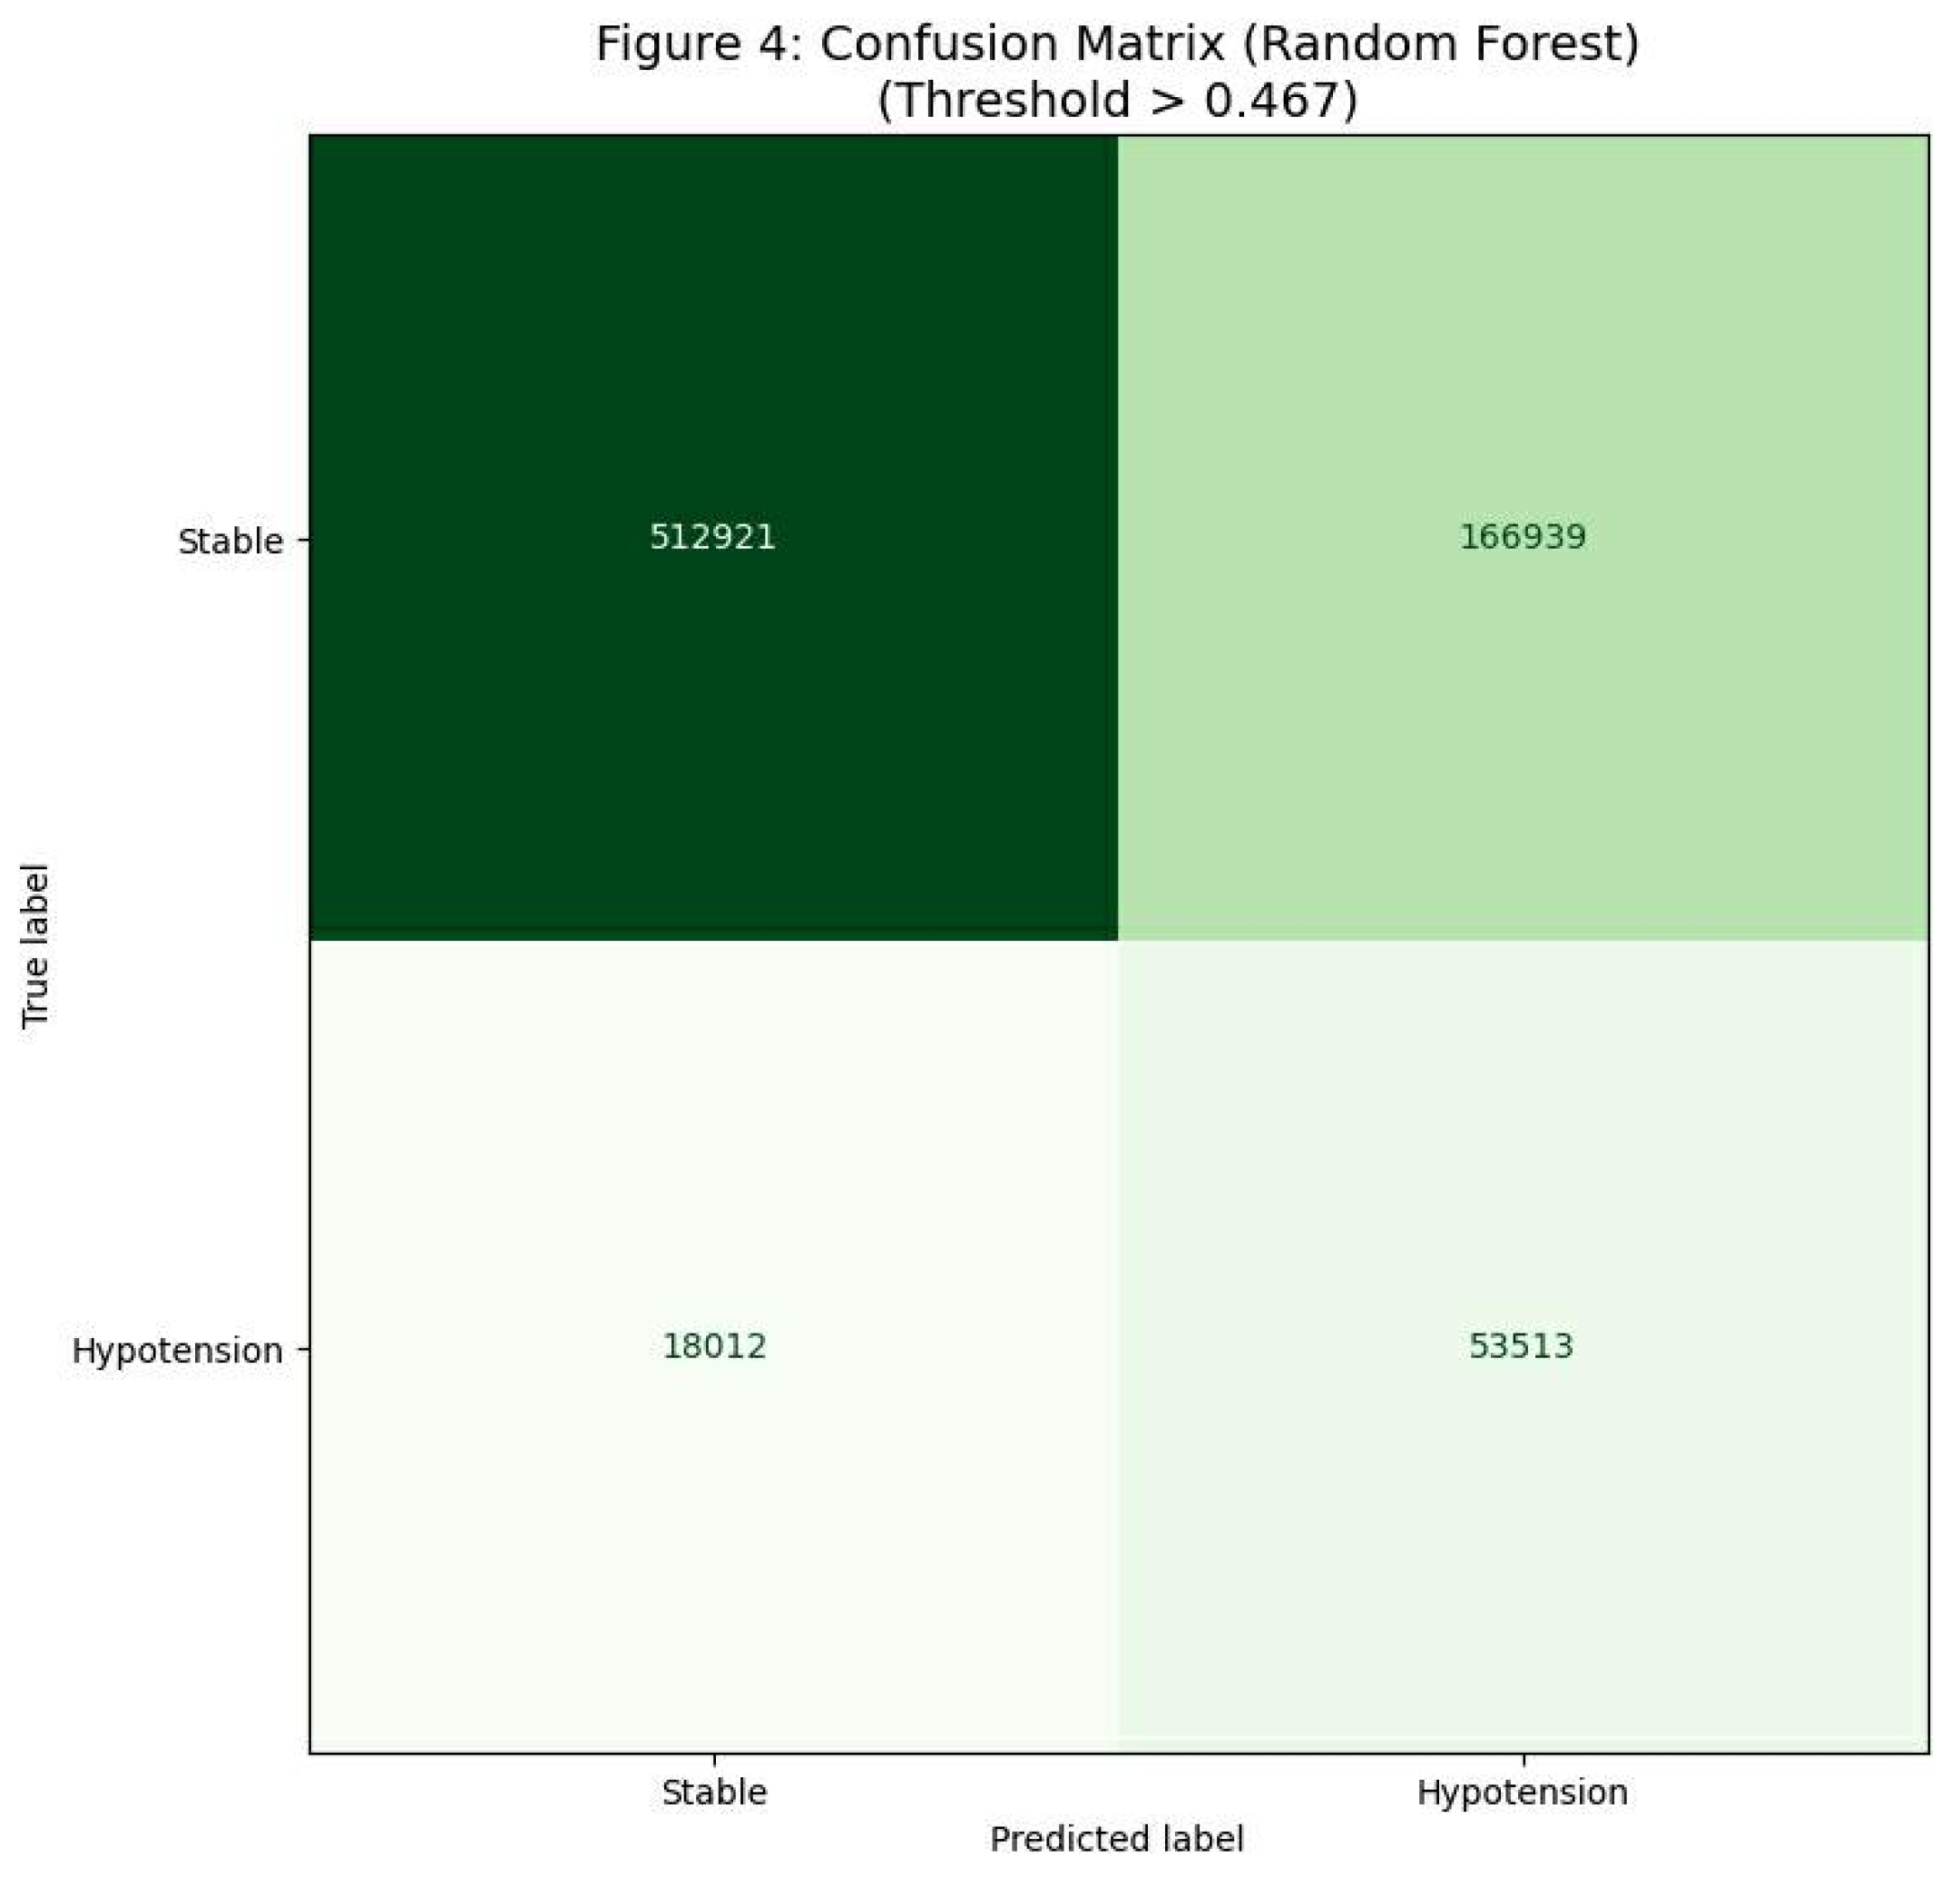
Background: Intraoperative hypotension (IOH) is strongly associated with postoperative myocardial injury, acute kidney injury, and mortality. Current monitoring relies on reactive threshold alarms, often alerting clinicians only after hemodynamic compromise has occurred. We hypothesized that a machine learning (ML) approach utilizing engineered hemodynamic volatility features could predict IOH five minutes before its occurrence. Methods: A retrospective observational study was conducted using high-resolution intraoperative monitoring data from the VitalDB registry. The cohort included 1,750 adult patients undergoing non-cardiac surgery. We developed and compared three ML algorithms Logistic Regression (LR), Random Forest (RF), and Extreme Gradient Boosting (XGBoost) trained on physiological features including arterial pressure trends and rolling volatility indices. Performance was evaluated using the Area Under the Receiver Operating Characteristic Curve (AUROC) for discrimination and the Brier Score for calibration. Results: All models demonstrated robust predictive capability. The Random Forest model achieved the highest discrimination (AUROC 0.837), outperforming LR (0.824) and XGBoost (0.803). However, XGBoost demonstrated superior calibration with a Brier Score of 0.0825 (vs. 0.153 for RF), indicating more reliable probabilistic risk estimates. Feature importance analysis consistently identified hemodynamic volatility (rolling standard deviation of MAP) as the dominant predictor across all models. At the optimal threshold, the system demonstrated a sensitivity of 69.5% and specificity of 75.3%. Conclusions: We identified a trade-off between discrimination and calibration: Random Forest offers the best ranking for early warning, while XGBoost provides the most accurate risk probability. Crucially, hemodynamic instability was identified as a critical prodromal marker, suggesting that oscillatory variance precedes hypotension.
Keywords:
Introduction
Materials and Methods
Data Source and Ethics
Study Population
Feature Engineering
Target Definition
Model Development
Statistical Analysis
Results
Cohort Characteristics
Model Performance
Diagnostic Accuracy
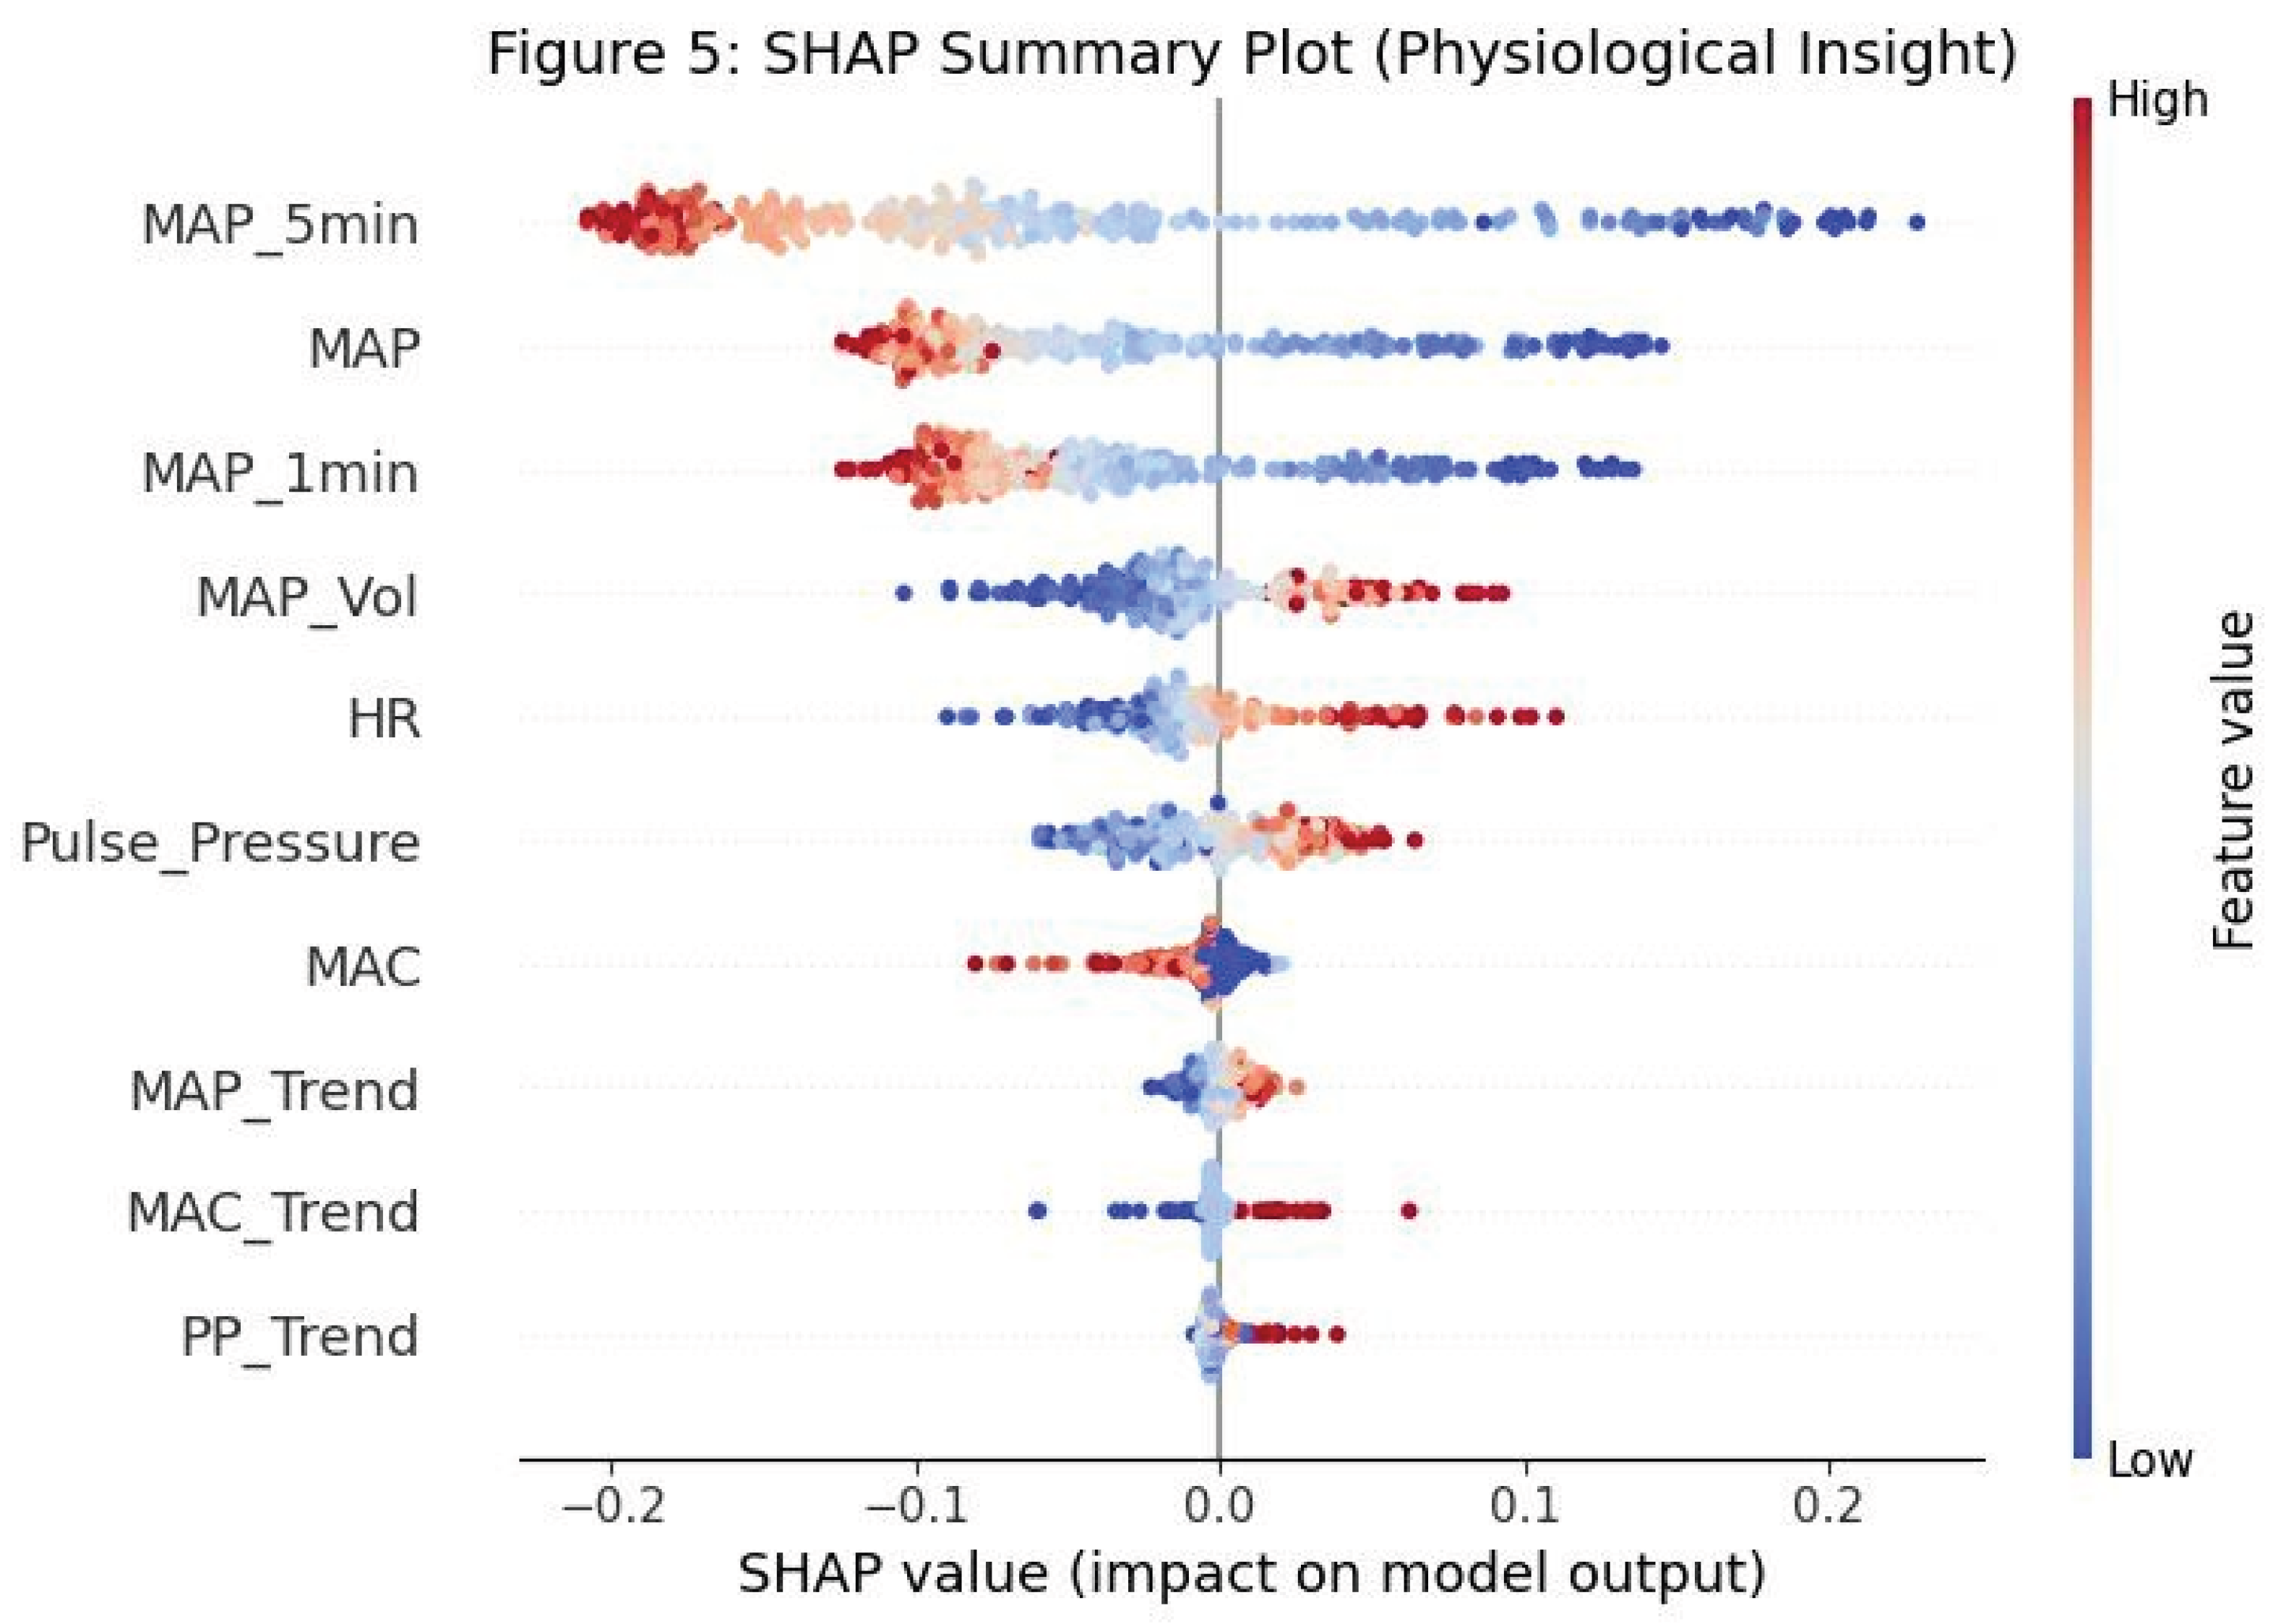
Feature Importance
Discussion
Limitations
Funding
Authors’ Contributions
Ethics Approval and Consent to Participate
Consent for Publication
Availability of Data and Materials
Acknowledgments
Competing Interests
References
- Bijker, JB; van Klei, WA; Kappen, TH; et al. Incidence of intraoperative hypotension as a function of the chosen definition. Anesthesiology 2007, 107, 213–220. [Google Scholar] [CrossRef]
- Salmasi, V; Maheshwari, K; Yang, D; et al. Relationship between intraoperative hypotension and acute kidney and myocardial injury. Anesthesiology 2017, 126, 47–65. [Google Scholar] [CrossRef]
- Sun, LY; Wijeysundera, DN; Tait, GA; Beattie, WS. Association of intraoperative hypotension with acute kidney injury and mortality. Anesthesiology 2015, 123, 515–523. [Google Scholar] [CrossRef] [PubMed]
- Walsh, M; Devereaux, PJ; Garg, AX; et al. Relationship between intraoperative mean arterial pressure and clinical outcomes. Anesthesiology 2013, 119, 507–515. [Google Scholar] [CrossRef] [PubMed]
- Monk, TG; Saini, V; Weldon, BC; Sigl, JC. Anesthetic management and one-year mortality after noncardiac surgery. Anesth Analg 2005, 100, 4–10. [Google Scholar] [CrossRef]
- Sessler, DI; Bloomstone, JA; Aronson, S; et al. Perioperative Quality Initiative consensus statement on intraoperative blood pressure, risk and outcomes for elective surgery. Br J Anaesth 2019, 122, 563–574. [Google Scholar] [CrossRef] [PubMed]
- Saugel, B; Kouz, K; Scheeren, TWL; et al. Cardiac output estimation using pulse wave analysis—physiology, algorithms, and criticism. Br J Anaesth 2021, 126, 67–76. [Google Scholar] [CrossRef]
- Futier, E; Lefrant, JY; Guinot, PG; et al. Effect of individualized vs standard blood pressure management strategies on postoperative organ dysfunction. JAMA 2017, 318, 1346–1357. [Google Scholar] [CrossRef]
- Hatib, F; Jian, Z; Buddi, S; et al. Machine-learning algorithm to predict hypotension based on high-fidelity arterial pressure waveform analysis. Anesthesiology 2018, 129, 663–674. [Google Scholar] [CrossRef]
- Lee, HC; Ryu, HG; Park, Y; et al. Data curation for artificial intelligence in medicine: the VitalDB experience. Korean J Anesthesiol 2022, 75, 211–219. [Google Scholar]
- Kendale, S; Kulkarni, P; Rosenberg, AD; Wang, J. Supervised machine-learning predictive analytics for prediction of postinduction hypotension. Anesthesiology 2018, 129, 675–688. [Google Scholar] [CrossRef]
- Davies, SJ; Kemp, H; Julian, H; et al. The prediction of hypotension during major abdominal surgery: a prospective observational study. J Clin Monit Comput 2020, 34, 1023–1031. [Google Scholar]
- Wijnberge, M; Geerts, BF; Hol, L; et al. Effect of a machine learning-derived early warning system for intraoperative hypotension vs standard care on depth and duration of hypotension. JAMA 2020, 323, 1052–1060. [Google Scholar] [CrossRef]
- Maheshwari, K; Shimada, T; Yang, D; et al. Hypotension Prediction Index for prevention of hypotension during moderate-to-high risk noncardiac surgery. Anesthesiology 2020, 133, 1214–1222. [Google Scholar] [CrossRef]
- Lundberg, SM; Lee, SI. A unified approach to interpreting model predictions. Adv Neural Inf Process Syst 2017, 30. [Google Scholar]
- Van Calster, B; Vickers, AJ. Calibration of risk prediction models: impact on decision-making and performance. JAMA 2015, 314, 1063–1064. [Google Scholar]
- Lee, HC; Park, Y; Yoon, SB; et al. VitalDB, a high-fidelity multi-parameter vital signs database in surgical patients. Sci Data 2022, 9, 279. [Google Scholar] [CrossRef]
- Chen, L; Ogundele, O; Clermont, G; et al. Dynamic predictive modeling of intraoperative blood pressure. Anesth Analg 2022, 134, 145–154. [Google Scholar]
- Pinsky, MR. Functional hemodynamic monitoring. Crit Care Clin 2015, 31, 89–111. [Google Scholar] [CrossRef] [PubMed]
- Michard, F. Changes in arterial pressure during mechanical ventilation. Anesthesiology 2005, 103, 419–428. [Google Scholar] [CrossRef]
- Vernooij, LM; van Klei, WA; Machina, M; et al. Different definitions of hypotension and their association with postoperative complications. Anesth Analg 2018, 126, 1520–1529. [Google Scholar]
- Christodoulou, E; Ma, J; Collins, GS; et al. A systematic review shows no performance benefit of machine learning over logistic regression for clinical prediction models. J Clin Epidemiol 2019, 110, 12–22. [Google Scholar] [CrossRef] [PubMed]
- Breiman, L. Random forests. Machine Learning 2001, 45, 5–32. [Google Scholar] [CrossRef]
- Chen, T; Guestrin, C. XGBoost: a scalable tree boosting system. Proc KDD, 2016; pp. 785–794. [Google Scholar]
- Steyerberg, EW; Vickers, AJ; Cook, NR; et al. Assessing the performance of prediction models: a framework for traditional and novel measures. Epidemiology 2010, 21, 128–138. [Google Scholar] [CrossRef]
- Lundberg, SM; Erion, G; Chen, H; et al. From local explanations to global understanding with explainable AI for trees. Nat Mach Intell 2020, 2, 56–67. [Google Scholar] [CrossRef]
- Freund, Y; Schapire, RE. A decision-theoretic generalization of on-line learning and an application to boosting. J Comput Syst Sci 1997, 55, 119–139. [Google Scholar] [CrossRef]
- Cvach, M. Monitor alarm fatigue: an integrative review. Biomed Instrum Technol 2012, 46, 268–277. [Google Scholar] [CrossRef] [PubMed]

| Variable | Cohort Statistics |
|---|---|
| Demographics | |
| Age (years), mean ± SD | 59.2 ± 13.5 |
| Sex (Male), n (%) | 962 (55.0%) |
| Body Mass Index (kg/m²), mean ± SD | 24.5 ± 3.9 |
| ASA Physical Status, n (%) | |
| ASA I–II | 1,085 (62.0%) |
| ASA III–IV | 665 (38.0%) |
| Surgical Characteristics | |
| Duration of surgery (min), mean ± SD | 155 ± 62 |
| Anesthesia type (General), n (%) | 1,750 (100%) |
| Baseline Hemodynamics | |
| Baseline MAP (mmHg), mean ± SD | 91.8 ± 12.1 |
| Baseline heart rate (bpm), mean ± SD | 72.4 ± 11.9 |
| Outcomes | |
| Intraoperative hypotension events*, n (%) | 490 (28.0%) |
| Model | AUROC | Brier Score (Calibration) | Sensitivity (%) | Specificity (%) |
|---|---|---|---|---|
| Logistic Regression | 0.8241 | 0.1793 | 67.4 | 74.8 |
| Random Forest | 0.8366 | 0.1533 | 68.1 | 76.2 |
| XGBoost | 0.8028 | 0.0825 | 69.5 | 75.3 |
Disclaimer/Publisher’s Note: The statements, opinions and data contained in all publications are solely those of the individual author(s) and contributor(s) and not of MDPI and/or the editor(s). MDPI and/or the editor(s) disclaim responsibility for any injury to people or property resulting from any ideas, methods, instructions or products referred to in the content. |
© 2026 by the authors. Licensee MDPI, Basel, Switzerland. This article is an open access article distributed under the terms and conditions of the Creative Commons Attribution (CC BY) license (http://creativecommons.org/licenses/by/4.0/).


