
Submitted:
21 January 2026
Posted:
23 January 2026
You are already at the latest version
Abstract
Introduction: Orthobiologics such as Platelet-Rich Plasma (PRP) and Injectable Platelet-Rich Fibrin (i-PRF) have emerged as promising tools in regenerative medicine. However, the lack of methodological standardization and the still limited comparative characterization between these products represent significant barriers to their optimized clinical application. This comparative laboratory study aimed to characterize and differentiate PRP and i-PRF, focusing on their cellular composition, obtained volume, and concentration of Platelet-Derived Growth Factor (PDGF-BB). Materials and Methods: This study was conducted with 34 healthy individuals. Peripheral blood samples were collected from all participants. PRP was obtained using a modified double-spin centrifugation protocol, whereas i-PRF was prepared using a modified low-speed centrifugation technique. Cellularity (platelet and leukocyte counts), final produced volume, and PDGF-BB concentration were assessed using complete blood count analysis and enzyme-linked immunosorbent assay (ELISA), respectively. Statistical analysis was performed using Generalized Linear Models (GLM). Results: Both protocols resulted in significant increases in platelet and leukocyte concentrations compared to baselines values. PRP showed significantly higher platelet and leukocyte concentrations compared with i-PRF, as well as markedly higher PDGF-BB levels. In contrast, i-PRF yielded a substantially greater final volume and enabled a higher absolute delivery of total leukocytes, whereas PRP delivered a greater absolute number of platelets. Female Sex, presence of comorbidities, and increased abdominal circumference positively influenced product volume and cellular composition. Discussion: Although both PRP and i-PRF effectively concentrate blood-derived components, they present distinct biological profiles regarding cellularity, volume, and growth factor availability. These findings indicate that PRP and i-PRF are not interchangeable, and their clinical use should be guided by the target tissue, therapeutic mechanism, and evidence from randomized clinical trials.
Keywords:
platelet-rich plasma
; platelet-rich fibrin
; growth factors
; regenerative medicine
; blood platelets
1. Introduction
Platelet-Rich Plasma (PRP) is a traditional orthobiologic (Lana et al., 2014; Kruel et al., 2021) with more than three decades of clinical use. It is defined as the plasma fraction (containing anticoagulant) with a platelet concentration higher than physiological levels (Marx, 2001; Marx et al., 1998). Its clinical applicability is supported by high-level scientific evidence across several musculoskeletal conditions, particularly knee osteoarthritis (Oeding et al., 2023; Oeding et al., 2024) and tendinopathies (Mishra et al., 2014; Fitzpatrick et al., 2019), as well as other indications (Oeding et al., 2023).
However, technical variability associated with the lack of methodological standardization represents one of the main factors contributing to heterogeneity in PRP composition, and ultimately leading to poor reproducibility of findings, hindering comparative studies and meta-analyses, and results in inconsistent clinical outcomes, providing arguments for critics of PRP therapies (Chahla et al., 2017). In this context, our research group has previously developed solutions such as classification proposals for PRP preparation techniques (Lana et al., 2017).
The growing interest in orthobiologics and their therapeutic potential has driven the development of a second generation of PRP derived products, including Injectable Platelet-Rich Fibrin (i-PRF) (Dohan et al., 2006). These preparations offer immediate advantages, such as reduced costs due to simplified centrifugation systems and the elimination of anticoagulants (Choukroun et al., 2006), which may theoretically promote a more physiological tissue repair process (Narayanaswamy et al., 2023).
Nevertheless, differences in the characterization and protocolization of these products, as well as distinctions in the resulting preparations, are not clearly delineated in the scientific literature. This gap represents a barrier to the proper development of future clinical trials aimed at elucidating the specific benefits and clinical indications of each orthobiologic.
Regarding the characterization of these products, the Platelet-Derived Growth Factor (PDGF) is selected frequently as a marker in platelet concentrate evaluations (Fretto et al., 1993). It is an important cytokine and marker of platelet function stored in the alpha granules of this critical cellular fragment involved in the initiation of tissue repair processes. PDGF comprises a family of disulfide-linked dimeric proteins that play a fundamental role in regenerative medicine. This family includes four homodimeric isoforms (PDGF-AA, PDGF-BB, PDGF-CC, and PDGF-DD) and one heterodimeric isoform (PDGF-AB). Among these, PDGF-BB stands out as the most versatile and potent subtype, capable of activating both PDGF receptors and inducing more robust biological responses. We therefore present a comparative laboratory study between two distinct and established protocols: leukocyte-rich PRP (L-PRP) and i-PRF, both obtained from the same participating donor. Hereafter, whenever the term PRP is used, it refers to a leukocyte-rich formulation within the context of the present protocol. The study focuses on differences in cellularity, volume, and quantitative analysis of Platelet-Derived Growth Factor (PDGF).
2. Materials and Methods
The study was conducted at the Proregen Clinic – Regenerative Orthopedics, located in Bento Gonçalves, RS, Brazil. Sample size calculation was performed a priori using G*Power version 3.1, applying the test “Means: Difference from constant.” An effect size (ω) of 0.50 (50%), statistical power of 80%, and an alpha level of 0.05 were adopted to minimize type I and type II errors, resulting in a total sample of 34 individuals for data collection.
2.1. Ethical Aspects
This project was registered on the AGHUse Pesquisa platform and Plataforma Brasil and approved by the Research Ethics Committee of the Hospital de Clínicas de Porto Alegre under approval number 6,640,941 (CAAE: 74707623.8.0000.5327). The researchers conducted the study in accordance with ethical principles, ensuring data confidentiality and participant privacy, in compliance with Brazilian National Health Council Resolutions CNS 466/2012 and CNS 510/2016, as well as all applicable regulations and legislation. In addition, the researchers adhered to the requirements of Brazilian Law No. 13,709, dated August 14, 2018, regarding the processing of sensitive personal data used in the research. Informed consent was obtained from all subjects involved in the study.
2.2. Inclusion and Exclusion Criteria
The sample included adult individuals of both sexes, aged between 18 and 70 years, who met all internationally recognized basic blood donation criteria (WHO, 2012). These criteria included a minimum body weight of 50 kg, adequate rest (at least 6 hours of sleep in the previous 24 hours), having eaten prior to donation, and being in good general health. Individuals who did not meet blood donation criteria or who presented abnormal erythrogram values (hemoglobin <13.0 g/dL for men and <12.0 g/dL for women; hematocrit <39% for men and <36% for women, in accordance with WHO guidelines) after blood collection were excluded from the study.
2.3. Variables of Interest
In addition to general demographic information, the collected variables included anthropometric data (body weight, height, body mass index [BMI], and abdominal circumference), complete blood count, and habitual medication use. Furthermore, product-related parameters such as cellularity, produced volume, and PDGF quantification are detailed below.
2.4. Peripheral Blood Collection
From each participant, 66 mL of whole blood were collected via peripheral venipuncture and distributed into nine BD Vacutainer® tubes:
- Four tubes containing ACD (8.5 mL capacity, containing 1.5 mL of acid citrate dextrose): 7 mL of blood per tube, totaling 28 mL for PRP production;
- Four dry tubes without anticoagulant or clot activator (9 mL capacity): 9 mL of blood per tube, totaling 36 mL for i-PRF production;
- One EDTA tube (2 mL): used for baseline complete blood count, allowing comparison of platelet and leukocyte levels with those obtained in PRP and i-PRF.
The selection of tubes with similar capacities but different blood volumes was based on their availability for Cell Processing Centers in Brazil and compliance with Brazilian Health Regulatory Agency (ANVISA) standards for open systems used in PRP and i-PRF preparation.
2.5. Preparation of Leukocyte-Rich Platelet-Rich Plasma
The PRP preparation protocol followed the modified technique described by Amable et al. (2013) and validated by Huber et al. (2016). After peripheral blood collection, the blood-containing tubes were centrifuged at 300 × g for 5 minutes to separate red blood cells, the leukocyte layer (buffy coat), and plasma. After the first centrifugation, plasma was collected together with the buffy coat using a 14 G needle, minimizing red blood cell contamination. Hereafter, whenever the term PRP is used, it refers to a leukocyte-rich formulation within the context of the present protocol.
This content (plasma + buffy coat + platelets) was transferred to a sterile 15 mL Falcon tube and subjected to a second centrifugation at 700 × g for 17 minutes, resulting in platelet and leukocyte concentration in a pellet at the bottom of the tube. From the total volume, 80% of the upper plasma layer, corresponding to platelet-poor plasma, was removed, and the remaining 20% (cell pellet – PRP) was homogenized and sent for cell counting. Aliquots of 500 µL were stored at −80 °C for PDGF quantification. No sample was stored for longer than 180 days. All processing steps were performed in a class IIA biological safety cabinet, in accordance with Brazilian Health Regulatory Agency (ANVISA) Resolution RDC 508/2021.
2.6. Preparation of Injectable Platelet-Rich Fibrin
i-PRF was produced using a modified low-speed centrifugation technique (Choukroun & Ghanaati, 2018). Briefly, the four tubes containing whole blood without anticoagulant were immediately centrifuged at 60 × g for 5 minutes to separate serum (still in liquid form), red blood cells, and buffy coat.
The tube cap was disinfected with 70% ethyl alcohol and punctured using a 14 G catheter. The first 2 mL were discarded, and the milliliter closest to the red blood cell layer (buffy coat) was aspirated using the needle. A 100 µL aliquot of this fraction was transferred to an EDTA tube for platelet and leukocyte quantification, and three 500 µL aliquots were stored at −80 °C for subsequent growth factor analysis.
2.7. Evaluation of Both Products
The parameters used for PRP and i-PRF validation were: (i) platelet count; (ii) leukocyte count; (iii) produced volume; and (iv) concentration of platelet-derived growth factor (PDGF-BB), assessed by enzyme-linked immunosorbent assay (ELISA). Platelet and leukocyte recovery was evaluated using complete blood count analysis, in which baseline values for each individual were compared with those obtained in PRP and i-PRF. Produced volume and overall cellular recovery (platelet and leukocyte) were also assessed, which is particularly relevant for clinical correlation regarding absolute cell delivery in therapeutic protocols (Figure 1)
2.8. Enzyme-Linked Immunosorbent Assay (ELISA)
Accurate quantification of PDGF-BB, particularly through enzyme-linked immunosorbent assay (ELISA), is essential for assessing the quality and efficacy of platelet-based preparations used in regenerative procedures. For PDGF-BB quantification in PRP and i-PRF, samples were thawed in a water bath at 37 °C. PDGF-BB levels were quantified using a commercially available ELISA kit with reactivity for human samples (Fine Test, Interprise), which is available on the national market. All analyses were performed at the Laboratory Research Unit of the Experimental Research Center of the Hospital de Clínicas de Porto Alegre (HCPA).
Briefly, the assay is based on sandwich ELISA technology. An anti–PDGF-BB antibody was pre-coated onto a 96-well microplate. A biotin-conjugated anti–PDGF-BB antibody was used as the detection antibody. Standards and test samples (100 µL) were added to the wells and incubated for 90 minutes at room temperature.
After incubation, unbound conjugates were removed by washing with wash buffer. Subsequently, 100 µL of the biotinylated detection antibody was added to bind the target protein captured by the coated antibody, followed by incubation for 1 hour. The plate was then washed three times.
After removal of unbound conjugates, 100 µL of horseradish peroxidase (HRP)–streptavidin was added and incubated for 30 minutes, followed by five washing cycles. Subsequently, 90 µL of tetramethylbenzidine (TMB) substrate was added to visualize the enzymatic reaction and incubated for 15 minutes.
Finally, 50 µL of stop solution (sulfuric acid) was added to each well. The enzymatic reaction produced a blue color that turned yellow upon addition of the stop solution. Absorbance was measured at 450 nm using a microplate reader. The concentration of the target protein in each sample was calculated by constructing a standard curve, with analyte concentration being proportional to the measured absorbance values.
2.9. Data Analysis
Collected data were stored in a Microsoft Excel spreadsheet. Statistical analyses were performed using JAMOVI software and the R Core Team environment. Data normality was assessed using the Kolmogorov–Smirnov and Shapiro–Wilk tests. Continuous variables analyzed in independent groups were expressed as mean ± standard deviation.
Effect size was calculated using eta squared (η²) and interpreted according to Cohen (2013) as follows: η² ≈ 0.01 (small effect), η² ≈ 0.06 (medium effect), and η² ≈ 0.14 (large effect). Categorical variables were presented as number and percentage [n (%)], and nominal categorical variables were analyzed using the Chi-square (χ²) test with continuity correction or Fisher’s exact test, as appropriate.
Generalized Linear Models (GLM) were applied for cross-sectional analyses, and the lowest Akaike Information Criterion (AIC) value was used to determine the most appropriate model. Additionally, regression analyses were performed using Gamma distribution with identity link function and Negative Binomial distribution, as appropriate. Regression assumptions were verified through multicollinearity diagnostics, including tolerance and variance inflation factor (VIF).
The dependent variables included continuous outcomes: platelet count (mm³), leukocyte count (mm³), PDGF-BB concentration, volume (mL), total leukocytes, and total platelets. Independent (explanatory) variables included group (Baseline/PRP/i-PRF), sex (female/male), comorbidity (no/yes), alcohol consumption (no/yes), abdominal circumference (cm), and age (years). All prerequisites for regression model application were satisfied. A p-value < 0.05 was considered statistically significant for all analyses, and 95% confidence intervals (CI) and odds ratios (OR) were reported.
3. Results
Collected data were stored in a Microsoft Excel spreadsheet. Statistical analyses were performed using JAMOVI software and the R Core Team environment. Data normality was assessed using the Kolmogorov–Smirnov and Shapiro–Wilk tests. Continuous variables analyzed in independent groups were expressed as mean ± standard deviation.
Effect size was calculated using eta squared (η²) and interpreted according to Cohen (2013) as follows: η² ≈ 0.01 (small effect), η² ≈ 0.06 (medium effect), and η² ≈ 0.14 (large effect). Categorical variables were presented as number and percentage [n (%)], and nominal categorical variables were analyzed using the Chi-square (χ²) test with continuity correction or Fisher’s exact test, as appropriate.
Generalized Linear Models (GLM) were applied for cross-sectional analyses, and the lowest Akaike Information Criterion (AIC) value was used to determine the most appropriate model. Additionally, regression analyses were performed using Gamma distribution with identity link function and Negative Binomial distribution, as appropriate. Regression assumptions were verified through multicollinearity diagnostics, including tolerance and variance inflation factor (VIF).
The dependent variables included continuous outcomes: platelet count (mm³), leukocyte count (mm³), PDGF-BB concentration, volume (mL), total leukocytes, and total platelets. Independent (explanatory) variables included group (Baseline/PRP/i-PRF), sex (female/male), comorbidity (no/yes), alcohol consumption (no/yes), abdominal circumference (cm), and age (years). All prerequisites for regression model application were satisfied. A p-value < 0.05 was considered statistically significant for all analyses, and 95% confidence intervals (CI) and odds ratios (OR) were reported.
A total of 36 participants were initially selected for the study; however, two were excluded: one due to a diagnosis of diarrheal syndrome with onset on the day of blood collection, and another due to hypoferritinemia. Thus, 34 individuals considered healthy were included in the analysis, of whom 26 (76.5%) were female and 8 (23.5%) were male. In addition, 33 participants (97.1%) were Caucasian, and only one self-identified as Black (2.9%).
Regarding BMI categories, normal-weight and overweight individuals were the most frequent, whereas obesity was less prevalent. Only one participant reported being a smoker. Notably, half of the participants reported alcohol consumption, and 70.6% reported regular use of medications, while 35.3% presented at least one comorbidity (Table 1).
Among the comorbidities observed in the total sample, systemic arterial hypertension was the most prevalent, affecting six individuals (17.6%), followed by hypothyroidism and migraine, each with two cases (5.88%). Asthma, dyslipidemia, fibromyalgia, Nutcracker syndrome, and pelvic varices were each reported in one individual (2.94%). The most frequently used medications were antidepressants (venlafaxine, escitalopram, duloxetine, and fluoxetine), used by 29.4% of the study population; antihypertensive agents (losartan, hydrochlorothiazide, olmesartan, enalapril, and propranolol), used by 26%; and contraceptives or estradiol, used by 20% of participants (Table 1).
No significant association was observed between sex and BMI category (χ² = 6.08; df = 4; p = 0.16), nor between sex and the presence of comorbidities (χ² = 0.32; df = 1; p = 0.41).
The continuous variables measured in healthy individuals generally demonstrated higher mean platelet and leukocyte counts in PRP, followed by i-PRF, and subsequently by baseline values (Table 2).
3.1. Baseline, Platelet-Rich Plasma (PRP), and Injectable Platelet-Rich Fibrin (i-PRF)
Based on regression analysis, the variable Group (χ² = 1160; df = 2; p < 0.001) showed a significant effect on platelet count. Regarding platelet levels across groups, PRP presented the highest values, followed by i-PRF, and finally the baseline sample (Table 3; Figure 2).
Regarding leukocyte count, only the variable Group, which represents the type of blood-derived sample analyzed (baseline whole blood, PRP, i-PRF), showed a significant effect (χ² = 335.2; df = 2; p < 0.001). PRP exhibited the highest leukocyte counts, with a mean difference of 13,144.8 leukocytes compared with baseline and a mean difference of 5,475 leukocytes compared with i-PRF (Table 4; Figure 3).
3.2. Platelet-Derived Growth Factor – BB Isoform (PDGF-BB) and Volume (PRP vs. i-PRF)
Regarding PDGF-BB levels, the regression analysis demonstrated that the variable Group (χ² = 296.2; d.f. = 1; p < 0.001) had a significant effect. The i-PRF group was associated with a significant reduction in the expected level of the outcome variable (PDGF-BB) when compared with the reference group (PRP). Specifically, the i-PRF group exhibited, on average, a 92.5% reduction in PDGF-BB levels (OR: 0.07; 95% CI: 0.05–0.09) relative to PRP (Table 5; Figure 4).
Regarding volume (mL), the variables Group (x2 = 411,6; d.f.=1; p<0,001) Gender (x2 = 12,72; d.f.=1; p<0,001), Waist Circumference (x2 = 5,41; d.f.=1; p=0,02), and Comorbidity (x2 = 4,53; d.f.=1; p=0,03) were found to have a significant effect. The estimator for the Gender variable was negative (-0.83), indicating that men present, on average, a volume 0.83 mL lower compared to women (reference group). The i-PRF group showed an average of 4.66 mL more than the PRP group. This volume difference reflects both the distinct initial collection (36 mL for i-PRF versus 28 mL for PRP) and different concentration rates: PRP concentrated 10.14% of total blood (average of 2.84 mL from 28 mL), while i-PRF concentrated 20.11% (average of 7.6 mL from 36 mL). The estimator for the Waist Circumference variable was significantly positive (0.01), indicating that for every 1 cm increase in Waist Circumference, there is an average increase of 0.01 mL in Volume (Table 6; Figure 5). Regarding comorbidity, individuals with at least one comorbidity presented, on average, a 0.40 mL higher volume compared to those without this condition.
3.3. Total Platelets and Total Leukocytes (Platelet-Rich Plasma [PRP] vs. Injectable Platelet-Rich Fibrin [i-PRF])
Regarding total platelet counts, the variable Group showed a significant effect (χ² = 5.88; d.f. = 1; p = 0.01) (Table 7; Figure 6).
Regarding total leukocyte counts, it was possible to verify that the variables Group (χ² = 50.1; d.f. = 1; p < 0.001), Comorbidity (χ² = 7.25; d.f. = 1; p = 0.007), and Abdominal Circumference (χ² = 9.76; d.f. = 1; p = 0.002) showed significant effects.
The positive estimator indicates that the presence of comorbidity is associated with an increase in the expected level of total leukocytes compared to the group without comorbidities. This means that, on average, the group with comorbidities presents 22% more leukocytes (OR: 1.22; 95% CI: 1.05–1.41) than the group without comorbidities.
In addition, the I-PRF group is associated with a significant increase in the expected level of total leukocytes compared to the reference group (PRP). This indicates that, on average, the I-PRF group presents a 64% increase (OR: 1.64; 95% CI: 1.43–1.88) compared to PRP.
4. Discussion
Following the analysis of samples from 34 participants and the characterization of the experimental protocols, this laboratory study demonstrated that both platelet-rich plasma (PRP) and injectable platelet-rich fibrin (I-PRF) significantly increased platelet concentration when compared with baseline values. However, PRP consistently yielded a higher platelet concentration than I-PRF, corroborating previous reports describing PRP as a more efficient platelet-concentrating system (Huber et al., 2016; Choukroun & Ghanaati, 2018). These findings provide a useful reference for future protocol standardization, whether using open systems in cell processing centers or commercially available closed kits.
None of the independent variables evaluated—sex, comorbidities, alcohol consumption, abdominal circumference, or age—significantly influenced platelet concentration, reinforcing that the preparation protocol itself is the primary determinant of platelet yield. This highlights the importance of protocol selection rather than patient-related factors when aiming to optimize platelet concentration in blood-derived orthobiologics.
Leukocyte concentration also increased following blood processing, with PRP and I-PRF both presenting higher leukocyte counts than baseline. The PRP protocol employed prioritized buffy coat harvesting, which explains its higher leukocyte concentration. Specifically in tendinopathy, where the rate of cytokine release and the presence or absence of leukocytes may influence tissue repair, this comparative analysis between PRP and i-PRF may have clinically relevant implications (Fitzpatrick et al., 2019; Choukroun et al., 2006; Narayanaswamy et al., 2023). In tendinopathies, leukocyte-rich preparations—especially those containing monocytes—have been associated with improved healing responses (Mishra et al., 2014; Fitzpatrick et al., 2019; Martins et al., 2024). Although PRP demonstrated higher leukocyte concentration than I-PRF, the clinical superiority of either product remains to be determined and should be addressed in future standardized clinical trials.
Consistent with the higher platelet concentration observed in PRP, PDGF-BB levels measured by ELISA were markedly higher in PRP than in I-PRF, in agreement with previous investigations (Kobayashi et al., 2016; Costa et al., 2025). Importantly, this difference cannot be explained solely by platelet concentration, suggesting that the distinct biological behavior of these products plays a critical role. PRP is characterized by rapid platelet degranulation and immediate growth factor release, facilitating early detection of PDGF-BB. In contrast, I-PRF forms a fibrin matrix that promotes slower, more physiological cytokine release, which may limit early PDGF-BB detection by ELISA but potentially prolong biological activity in vivo (Narayanaswamy et al., 2023). Future basic science studies may help better understanding of this potential mechanism.
From a practical perspective, blood-derived orthobiologics may require different volumes depending on the target tissue. While PRP typically produces smaller volumes, I-PRF offers a higher yield with simpler and faster processing, representing a practical clinical advantage. Sex-related differences in volume production were observed, likely reflecting physiological differences in hematocrit, as previously described. Abdominal circumference and comorbidity status were also associated with volume variations, possibly due to differences in plasma volume and hematological profiles.
When absolute cellular delivery is considered, PRP provided a higher total number of platelets, whereas I-PRF delivered a greater total number of leukocytes. This distinction suggests that, under the protocols studied, PRP may be more suitable when platelet delivery is prioritized, while I-PRF may be advantageous for leukocyte-mediated biological effects. Given the growing evidence supporting the role of leukocytes—particularly within a fibrin matrix—in modulating inflammation and tissue regeneration, I-PRF warrants further investigation in clinical scenarios such as tendinopathies (Mishra et al., 2014; Fitzpatrick et al., 2019; Martins et al., 2024).
Additionally, the presence of comorbidities was associated with increased total leukocyte delivery, reflecting expected immune responses in individuals with chronic conditions. Abdominal circumference also showed a modest positive association with leukocyte counts. While these findings are physiologically plausible, the functional quality of leukocytes in individuals with metabolic disorders or obesity remains uncertain and may influence regenerative outcomes.
The limited number of head-to-head laboratory comparisons between PRP and I-PRF, combined with the increasing clinical interest in I-PRF, motivated the present study. Our findings confirm that PRP and I-PRF are biologically distinct products and should not be considered interchangeable. Differences in platelet and leukocyte concentration, total cellular delivery, volume, anticoagulant use, and growth factor release kinetics underscore the need for product-specific indications. Well-designed randomized controlled trials are essential to clarify the clinical implications of these differences and to guide evidence-based application of PRP and I-PRF in musculoskeletal disorders such as tendinopathies and osteoarthritis.
This study has several limitations that should be acknowledged. First, its laboratory and cross-sectional design precludes any direct inference regarding clinical efficacy, biological activity in vivo, or therapeutic superiority between PRP and i-PRF. Although cellular composition, volume, and PDGF-BB concentration provide important surrogate markers, they do not capture the complex interactions occurring after injection, including tissue-specific responses, fibrin remodeling, cytokine release kinetics, and immune modulation. Second, PDGF-BB was assessed at a single time point, which likely underestimates the biological potential of i-PRF, given its fibrin-based structure and sustained growth factor release profile; therefore, cumulative or time-dependent release was not evaluated. Third, only one growth factor was quantified, and other relevant mediators involved in tissue repair and inflammation were not measured. Additionally, the sample consisted predominantly of female and Caucasian participants, which may limit generalizability to other populations. Finally, although the protocols were carefully standardized, the findings are specific to the preparation techniques employed and should not be extrapolated to other PRP or i-PRF systems. These limitations reinforce the need for future studies integrating longitudinal growth factor analyses, functional assays, and well-designed randomized clinical trials to clarify the clinical implications of the observed biological differences.
Author Contributions
Conceptualization, A.V.S.K. and F.M.; Methodology, A.V.S.K., M.C.R.F., and S.C.H.; Investigation, A.V.S.K., M.C.R.F., D.A., and C.V.D.; Data curation, M.C.R.F. and D.A.; Formal analysis, G.L.S.; Resources, C.R.G. and C.V.D.; Validation, S.C.H.; Writing—original draft, A.V.S.K.; Writing—review and editing, F.M. and M.C.Q.; Supervision, F.M. and S.C.H.; Project administration, A.V.S.K. and M.C.R.F.; Ethical approval and regulatory oversight, C.R.G.; Funding acquisition, not applicable. All authors have read and agreed to the published version of the manuscript.
Funding
This research received no external funding.
Institutional Review Board Statement
This project was registered on the AGHUse Pesquisa platform and Plataforma Brasil and approved by the Research Ethics Committee of the Hospital de Clínicas de Porto Alegre under approval number 6,640,941 (CAAE: 74707623.8.0000.5327). The researchers conducted the study in accordance with ethical principles, ensuring data confidentiality and participant privacy, in compliance with Brazilian National Health Council Resolutions CNS 466/2012 and CNS 510/2016, as well as all applicable regulations and legislation. In addition, the researchers adhered to the requirements of Brazilian Law No. 13,709, dated August 14, 2018, regarding the processing of sensitive personal data used in the research.
Acknowledgments
During the preparation of this manuscript/study, the author(s) used AI for the purposes of editing images and graphics. The authors have reviewed and edited the output and take full responsibility for the content of this publication.
Conflicts of Interest
The authors declare no conflicts of interest.
Abbreviations
The following abbreviations are used in this manuscript:
| ACD | Acid citrate dextrose |
| AIC | Akaike Information Criterion |
| ANVISA | Brazilian Health Regulatory Agency (Agência Nacional de Vigilância Sanitária) |
| BMI | Body mass index |
| CAAE | Certificate of Presentation for Ethical Consideration (Certificado de Apresentação para Apreciação Ética) |
| CBC | Complete blood count |
| CI | Confidence interval |
| ELISA | Enzyme-linked immunosorbent assay |
| GLM | Generalized linear model |
| HCPA | Hospital de Clínicas de Porto Alegre |
| i-PRF | Injectable platelet-rich fibrin |
| IRB | Institutional Review Board |
| L-PRP | Leukocyte-rich platelet-rich plasma |
| OR | Odds ratio |
| PDGF | Platelet-derived growth factor |
| PDGF-BB | Platelet-derived growth factor BB isoform |
| PRF | Platelet-rich fibrin |
| PRP | Platelet-rich plasma |
| RDC | Collegiate Board Resolution (Resolução da Diretoria Colegiada) |
| SD | Standard deviation |
| VIF | Variance inflation factor |
| WHO | World Health Organization |
References
- Amable, P.R.; Carias, R.B.V.; Teixeira, M.V.T.; Pacheco, I.C.; Amaral, R.J.F.C.; Granjeiro, J.M.; Borojevic, R. Platelet-rich plasma preparation for regenerative medicine: Optimization and quantification of cytokines and growth factors. Stem Cell Res. Ther. 2013, 4, 67. [Google Scholar] [CrossRef] [PubMed]
- Bansal, H.; Leon, J.; Pont, J.L.; Wilson, D.A.; Bansal, A.; Agarwal, D.; Preoteasa, I. Platelet-rich plasma (PRP) in osteoarthritis (OA) knee: Correct dose critical for long-term clinical efficacy. Sci. Rep. 2021, 11, 3971. [Google Scholar] [CrossRef]
- Chahla, J.; Cinque, M.E.; Piuzzi, N.S.; Mannava, S.; Geeslin, A.G.; Murray, I.R.; Dornan, G.J.; Muschler, G.F.; LaPrade, R.F. A call for standardization in platelet-rich plasma preparation protocols and composition reporting: A systematic review of the clinical orthopaedic literature. J. Bone Joint Surg. Am. 2017, 99, 1769–1779. [Google Scholar] [CrossRef]
- Choukroun, J.; Ghanaati, S. Reduction of relative centrifugation force within injectable platelet-rich fibrin (PRF) concentrates advances patients’ own inflammatory cells, platelets and growth factors: The first introduction to the low-speed centrifugation concept. Eur. J. Trauma Emerg. Surg. 2018, 44, 87–95. [Google Scholar] [CrossRef] [PubMed]
- Choukroun, J.; Diss, A.; Simonpieri, A.; Girard, M.-O.; Schoeffler, C.; Dohan, S.L.; Dohan, A.J.J.; Mouhyi, J.; Dohan, D.M. Platelet-rich fibrin (PRF): A second-generation platelet concentrate. Part IV: Clinical effects on tissue healing. Oral Surg. Oral Med. Oral Pathol. Oral Radiol. Endod. 2006, 101, e56–e60. [Google Scholar] [CrossRef]
- Cohen, J. Statistical Power Analysis for the Behavioral Sciences; Routledge: New York, NY, USA, 2013. [Google Scholar] [CrossRef]
- Costa, F.R.; de Souza, S.A.L.; Martins, R.A.; Costa, B.R.; Pires, L.; de Macedo, A.P.; Santos, N.; Huber, S.C.; Santos, G.S.; Kruel, A.; Santos, M.; Lana, J.F.S.D. The role of injectable platelet-rich fibrin in orthopedics: Where do we stand? Curr. Issues Mol. Biol. 2025, 47, 239. [Google Scholar] [CrossRef]
- Dohan, D.M.; Choukroun, J.; Diss, A.; Dohan, S.L.; Dohan, A.J.J.; Mouhyi, J.; Gogly, B. Platelet-rich fibrin (PRF): A second-generation platelet concentrate. Part I: Technological concepts and evolution. Oral Surg. Oral Med. Oral Pathol. Oral Radiol. Endod. 2006, 101, e37–e44. [Google Scholar] [CrossRef]
- Fitzpatrick, J.; Bulsara, M.K.; O’Donnell, J.; Zheng, M.H. Leucocyte-rich platelet-rich plasma treatment of gluteus medius and minimus tendinopathy: A double-blind randomized controlled trial with 2-year follow-up. Am. J. Sports Med. 2019, 47, 1130–1137. [Google Scholar] [CrossRef] [PubMed]
- Fretto, L.J.; Snape, A.J.; Tomlinson, J.E.; Seroogy, J.J.; Wolf, D.L.; LaRochelle, W.J.; Giese, N.A. Mechanism of platelet-derived growth factor (PDGF) AA, AB, and BB binding to alpha and beta PDGF receptor. J. Biol. Chem. 1993, 268, 3625–3631. [Google Scholar] [CrossRef]
- Huber, S.C.; Cunha Júnior, J.L.R.; Montalvão, S.; da Silva, L.Q.; Paffaro, A.U.; da Silva, F.A.R.; Rodrigues, B.L.; Lana, J.F.S.D.; Annichino-Bizzacchi, J.M. In vitro study of the role of thrombin in platelet-rich plasma (PRP) preparation: Utility for gel formation and impact on growth factor release. J. Stem Cells Regen. Med. 2016, 12, 2–9. [Google Scholar] [CrossRef]
- Kobayashi, E.; Flückiger, L.; Fujioka-Kobayashi, M.; Sawada, K.; Sculean, A.; Schaller, B.; Miron, R.J. Comparative release of growth factors from PRP, PRF, and advanced-PRF. Clin. Oral Investig. 2016, 20, 2353–2360. [Google Scholar] [CrossRef]
- Kruel, A.V.S.; Ribeiro, L.L.; Gusmão, P.D.; Huber, S.C.; Lana, J.F.S.D. Orthobiologics in the treatment of hip disorders. World J. Stem Cells 2021, 13, 304–316. [Google Scholar] [CrossRef]
- Lana, J.F.S.D.; Purita, J.; Paulus, C.; Huber, S.C.; Rodrigues, B.L.; Rodrigues, A.A.; Santana, M.H.; Madureira, J.L.; Malheiros Luzo, Â.C.; Belangero, W.D.; Annichino-Bizzacchi, J.M. Contributions for classification of platelet-rich plasma: Proposal of a new classification—MARSPILL. Regen. Med. 2017, 12, 565–574. [Google Scholar] [CrossRef]
- Lana, J.F.S.; Santana, M.H.A.; Belangero, W.D.; Luzo, A.C.M. (Eds.) Platelet-Rich Plasma: Regenerative Medicine, Sports Medicine, Orthopedic, and Recovery of Musculoskeletal Injuries; Springer: Berlin/Heidelberg, Germany, 2013. [Google Scholar] [CrossRef]
- Laver, L.; Filardo, G.; Sanchez, M.; Magalon, J.; Tischer, T.; Abat, F.; Bastos, R.; Cugat, R.; Iosifidis, M.; Kocaoglu, B.; Kon, E.; Marinescu, R.; Ostojic, M.; Beaufils, P.; de Girolamo, L.; ESSKA-ORBIT Group. The use of injectable orthobiologics for knee osteoarthritis: A European ESSKA-ORBIT consensus. Part 1—Blood-derived products (platelet-rich plasma). Knee Surg. Sports Traumatol. Arthrosc. 2024, 32, 783–797. [Google Scholar] [CrossRef] [PubMed]
- Martins, R.A.; Costa, F.R.; Pires, L.; Santos, M.; Santos, G.S.; Lana, J.V.; Costa, B.R.; Santos, N.; de Macedo, A.P.; Kruel, A.; Lana, J.F. Regenerative inflammation: The mechanism explained from the perspective of buffy coat protagonism and macrophage polarization. Int. J. Mol. Sci. 2024, 25, 11329. [Google Scholar] [CrossRef] [PubMed]
- Marx, R.E. Platelet-rich plasma (PRP): What is PRP and what is not PRP? Implant Dent. 2001, 10, 225–228. [Google Scholar] [CrossRef]
- Marx, R.E.; Carlson, E.R.; Eichstaedt, R.M.; Schimmele, S.R.; Strauss, J.E.; Georgeff, K.R. Platelet-rich plasma: Growth factor enhancement for bone grafts. Oral Surg. Oral Med. Oral Pathol. Oral Radiol. Endod. 1998, 85, 638–646. [Google Scholar] [CrossRef] [PubMed]
- Mishra, A.K.; Skrepnik, N.V.; Edwards, S.G.; Jones, G.L.; Sampson, S.; Vermillion, D.A.; Ramsey, M.L.; Karli, D.C.; Rettig, A.C. Efficacy of platelet-rich plasma for chronic tennis elbow: A double-blind, prospective, multicenter, randomized controlled trial of 230 patients. Am. J. Sports Med. 2014, 42, 463–471. [Google Scholar] [CrossRef]
- Narayanaswamy, R.; Patro, B.P.; Jeyaraman, N.; Gangadaran, P.; Rajendran, R.L.; Nallakumarasamy, A.; Jeyaraman, M.; Ramani, P.; Ahn, B.-C. Evolution and clinical advances of platelet-rich fibrin in musculoskeletal regeneration. Bioengineering 2023, 10, 58. [Google Scholar] [CrossRef]
- Oeding, J.F.; Lansdown, D.A.; Leucht, P.; Bosco, J.A., III; Konopka, J.; Lajam, C.M. Influential studies in orthopaedic platelet-rich plasma research are recent and consist of high levels of evidence: A review of the top 50 most cited publications. J. Knee Surg. 2023, 36, 900–910. [Google Scholar] [CrossRef]
- Oeding, J.F.; Varady, N.H.; Fearington, F.W.; Pareek, A.; Strickland, S.M.; Nwachukwu, B.U.; Camp, C.L.; Krych, A.J. Platelet-rich plasma versus alternative injections for osteoarthritis of the knee: A systematic review and statistical fragility index-based meta-analysis of randomized controlled trials. Am. J. Sports Med. 2024, 52, 3147–3160. [Google Scholar] [CrossRef] [PubMed]
- World Health Organization (WHO). Blood Donor Selection: Guidelines on Assessing Donor Suitability for Blood Donation; WHO Press: Geneva, Switzerland, 2012; Available online: https://apps.who.int/iris/handle/10665/76724.
Figure 1.
Summary of blood collection procedures to produce blood-derived orthobiologics.
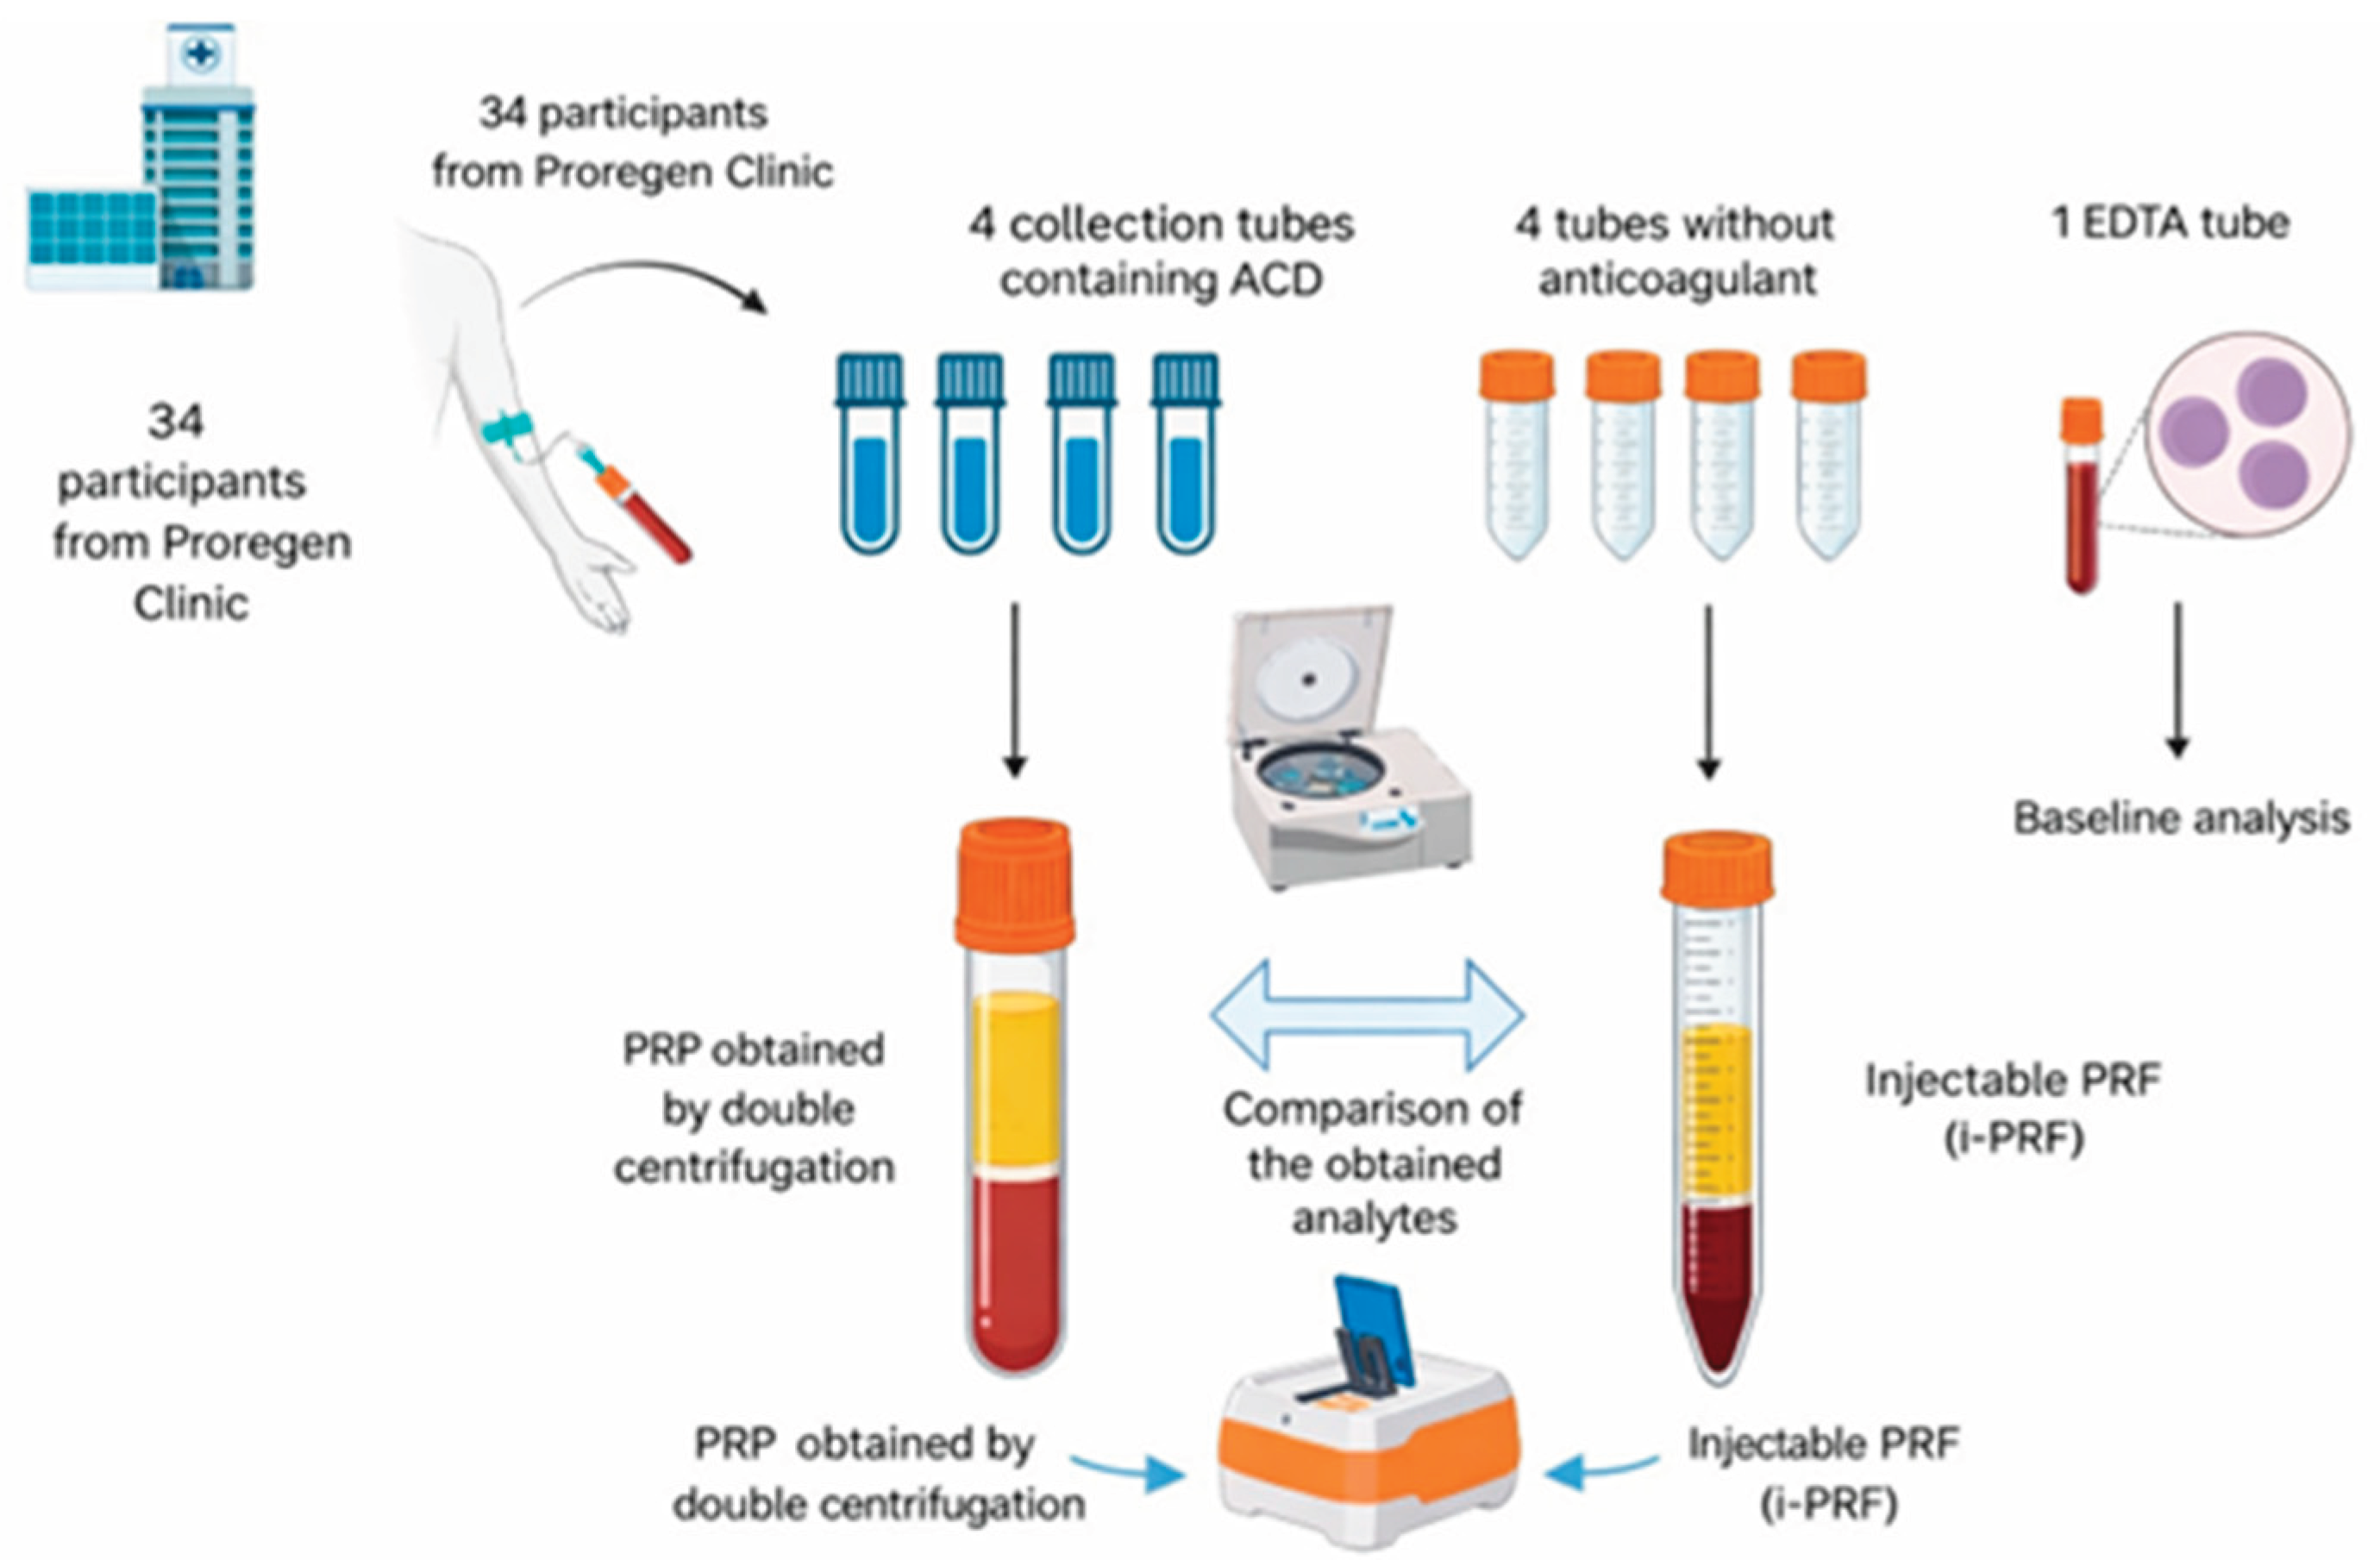
Figure 2.
Box plot showing platelet count across baseline, platelet-rich plasma (PRP), and injectable platelet-rich fibrin (i-PRF). The black square represents the mean, and the median is displayed with the 95% confidence interval (±95% CI).The text continues here.
Figure 2.
Box plot showing platelet count across baseline, platelet-rich plasma (PRP), and injectable platelet-rich fibrin (i-PRF). The black square represents the mean, and the median is displayed with the 95% confidence interval (±95% CI).The text continues here.
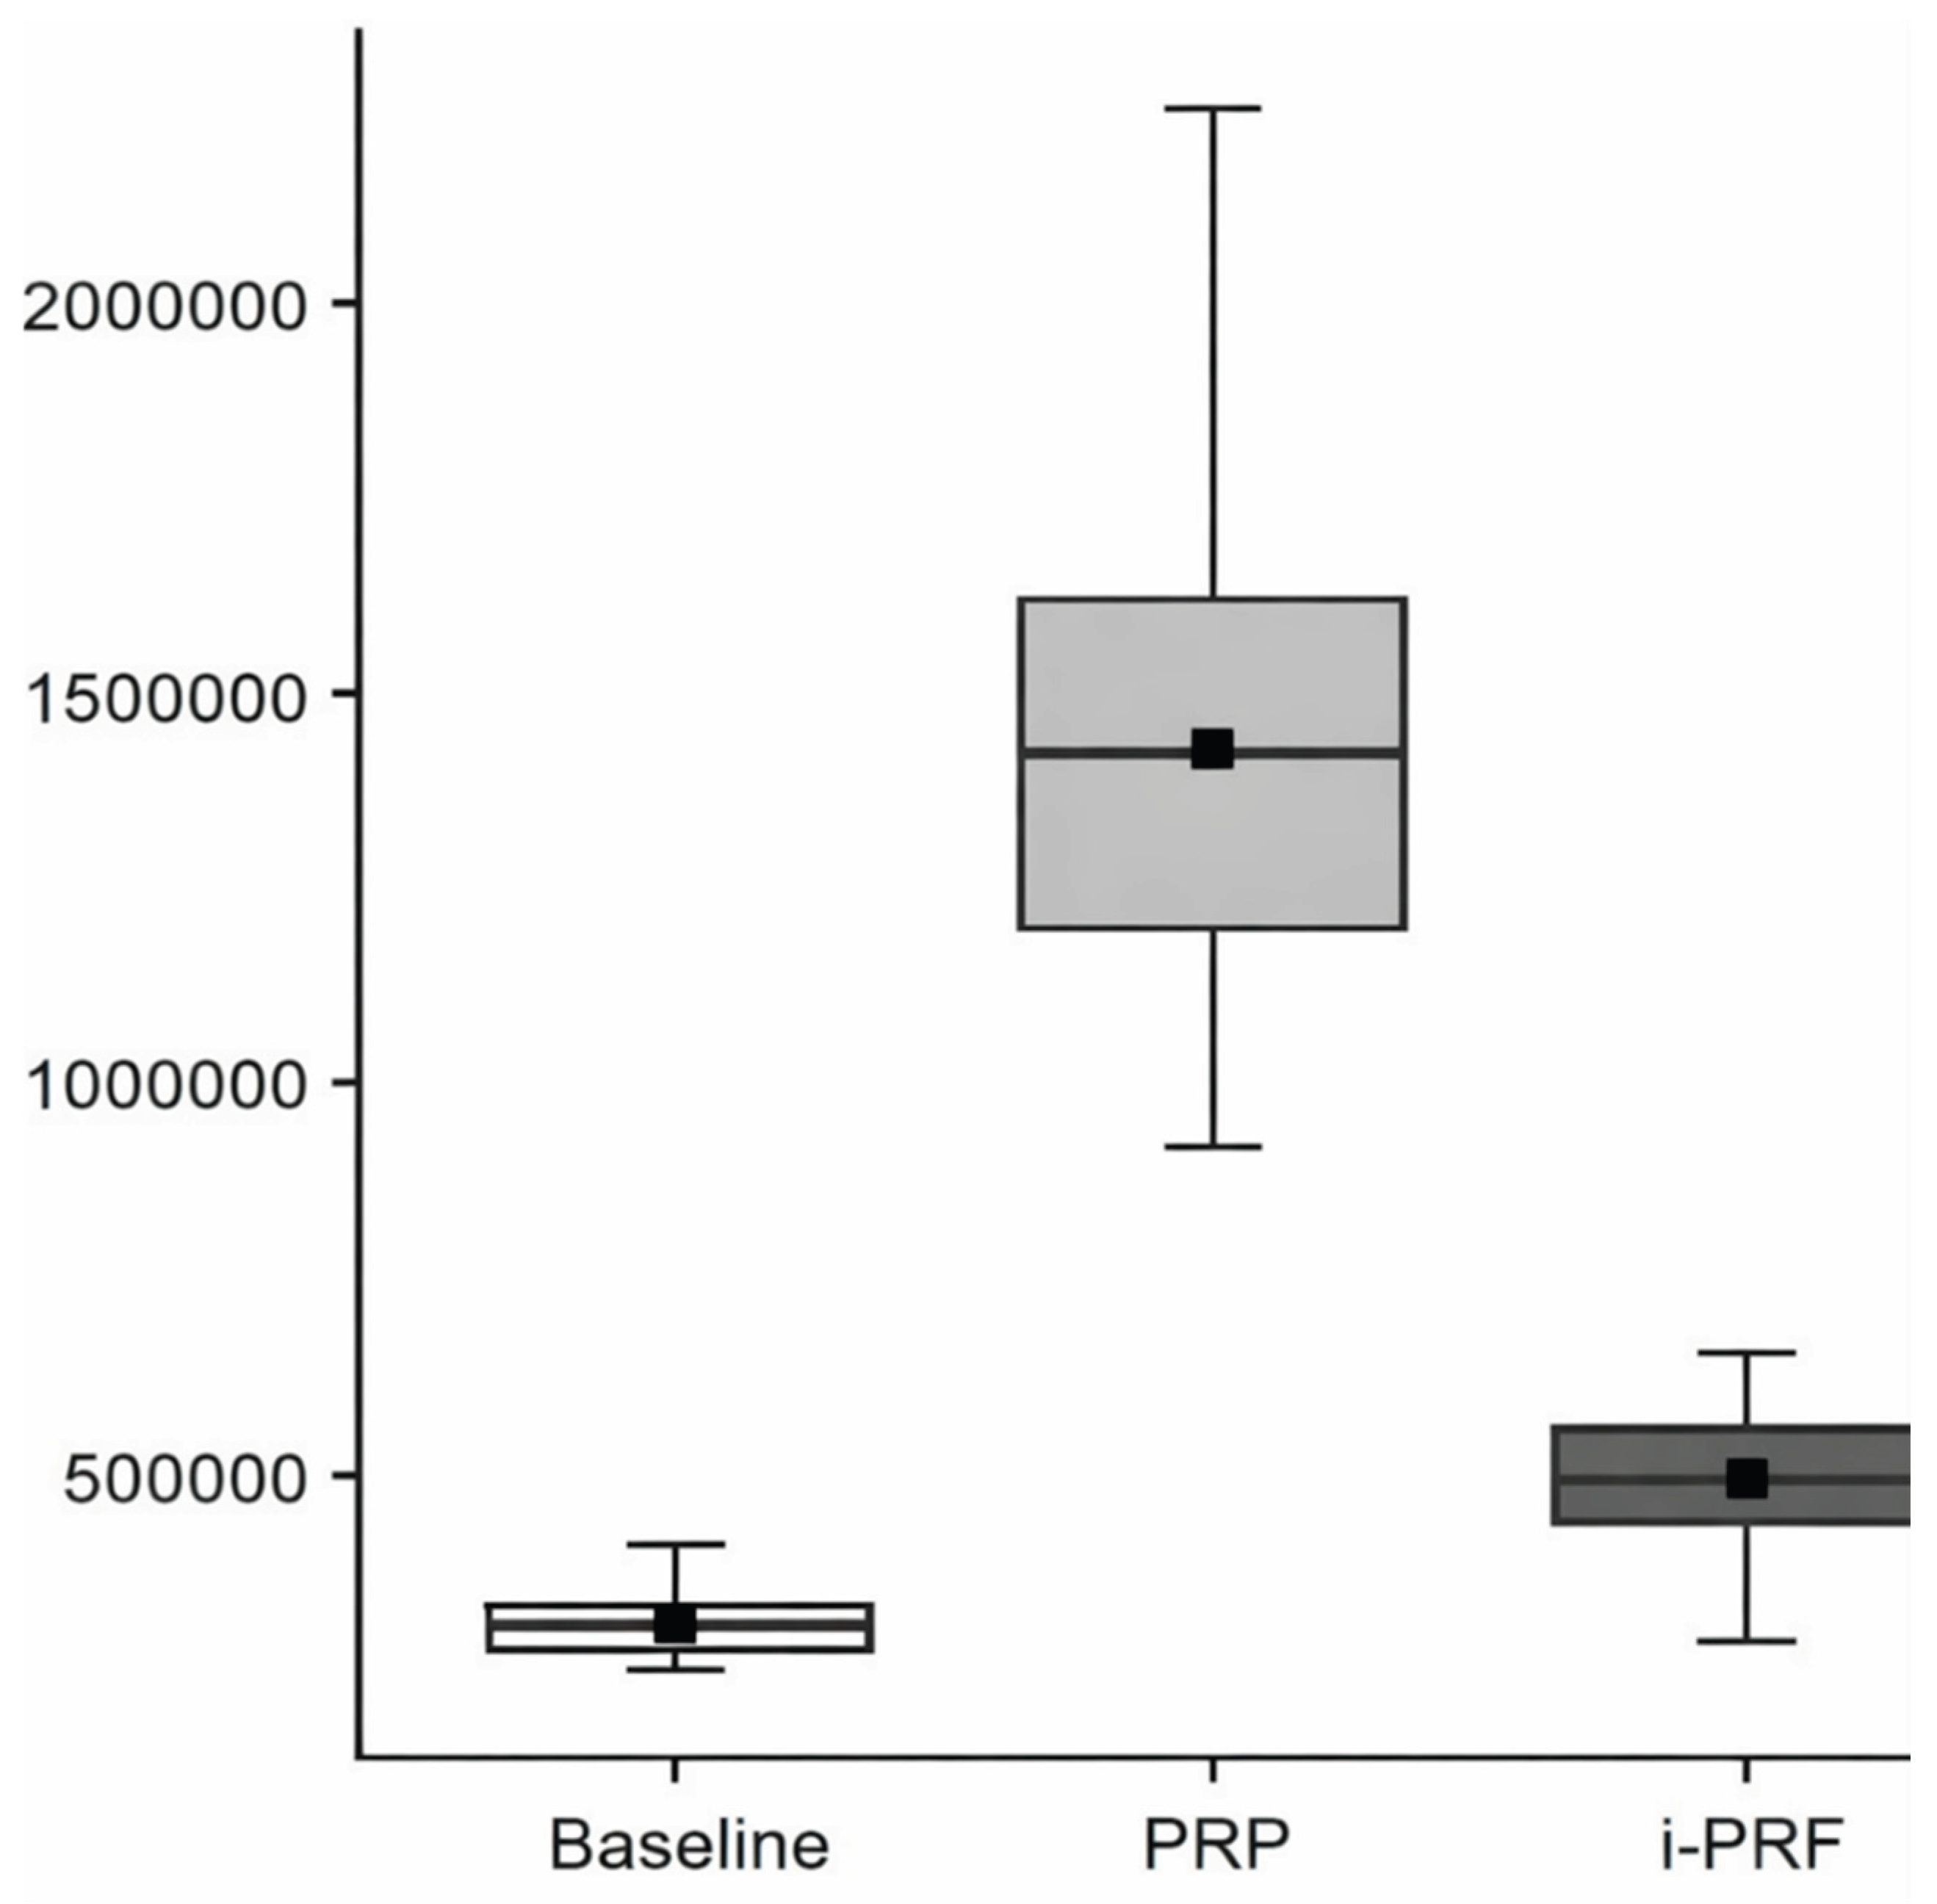
Figure 3.
Box plot of leukocyte counts across Baseline, Platelet-Rich Plasma (PRP), and Injectable Platelet-Rich Fibrin (i-PRF). Displaying the mean (black square) and median with 95% confidence intervals.
Figure 3.
Box plot of leukocyte counts across Baseline, Platelet-Rich Plasma (PRP), and Injectable Platelet-Rich Fibrin (i-PRF). Displaying the mean (black square) and median with 95% confidence intervals.
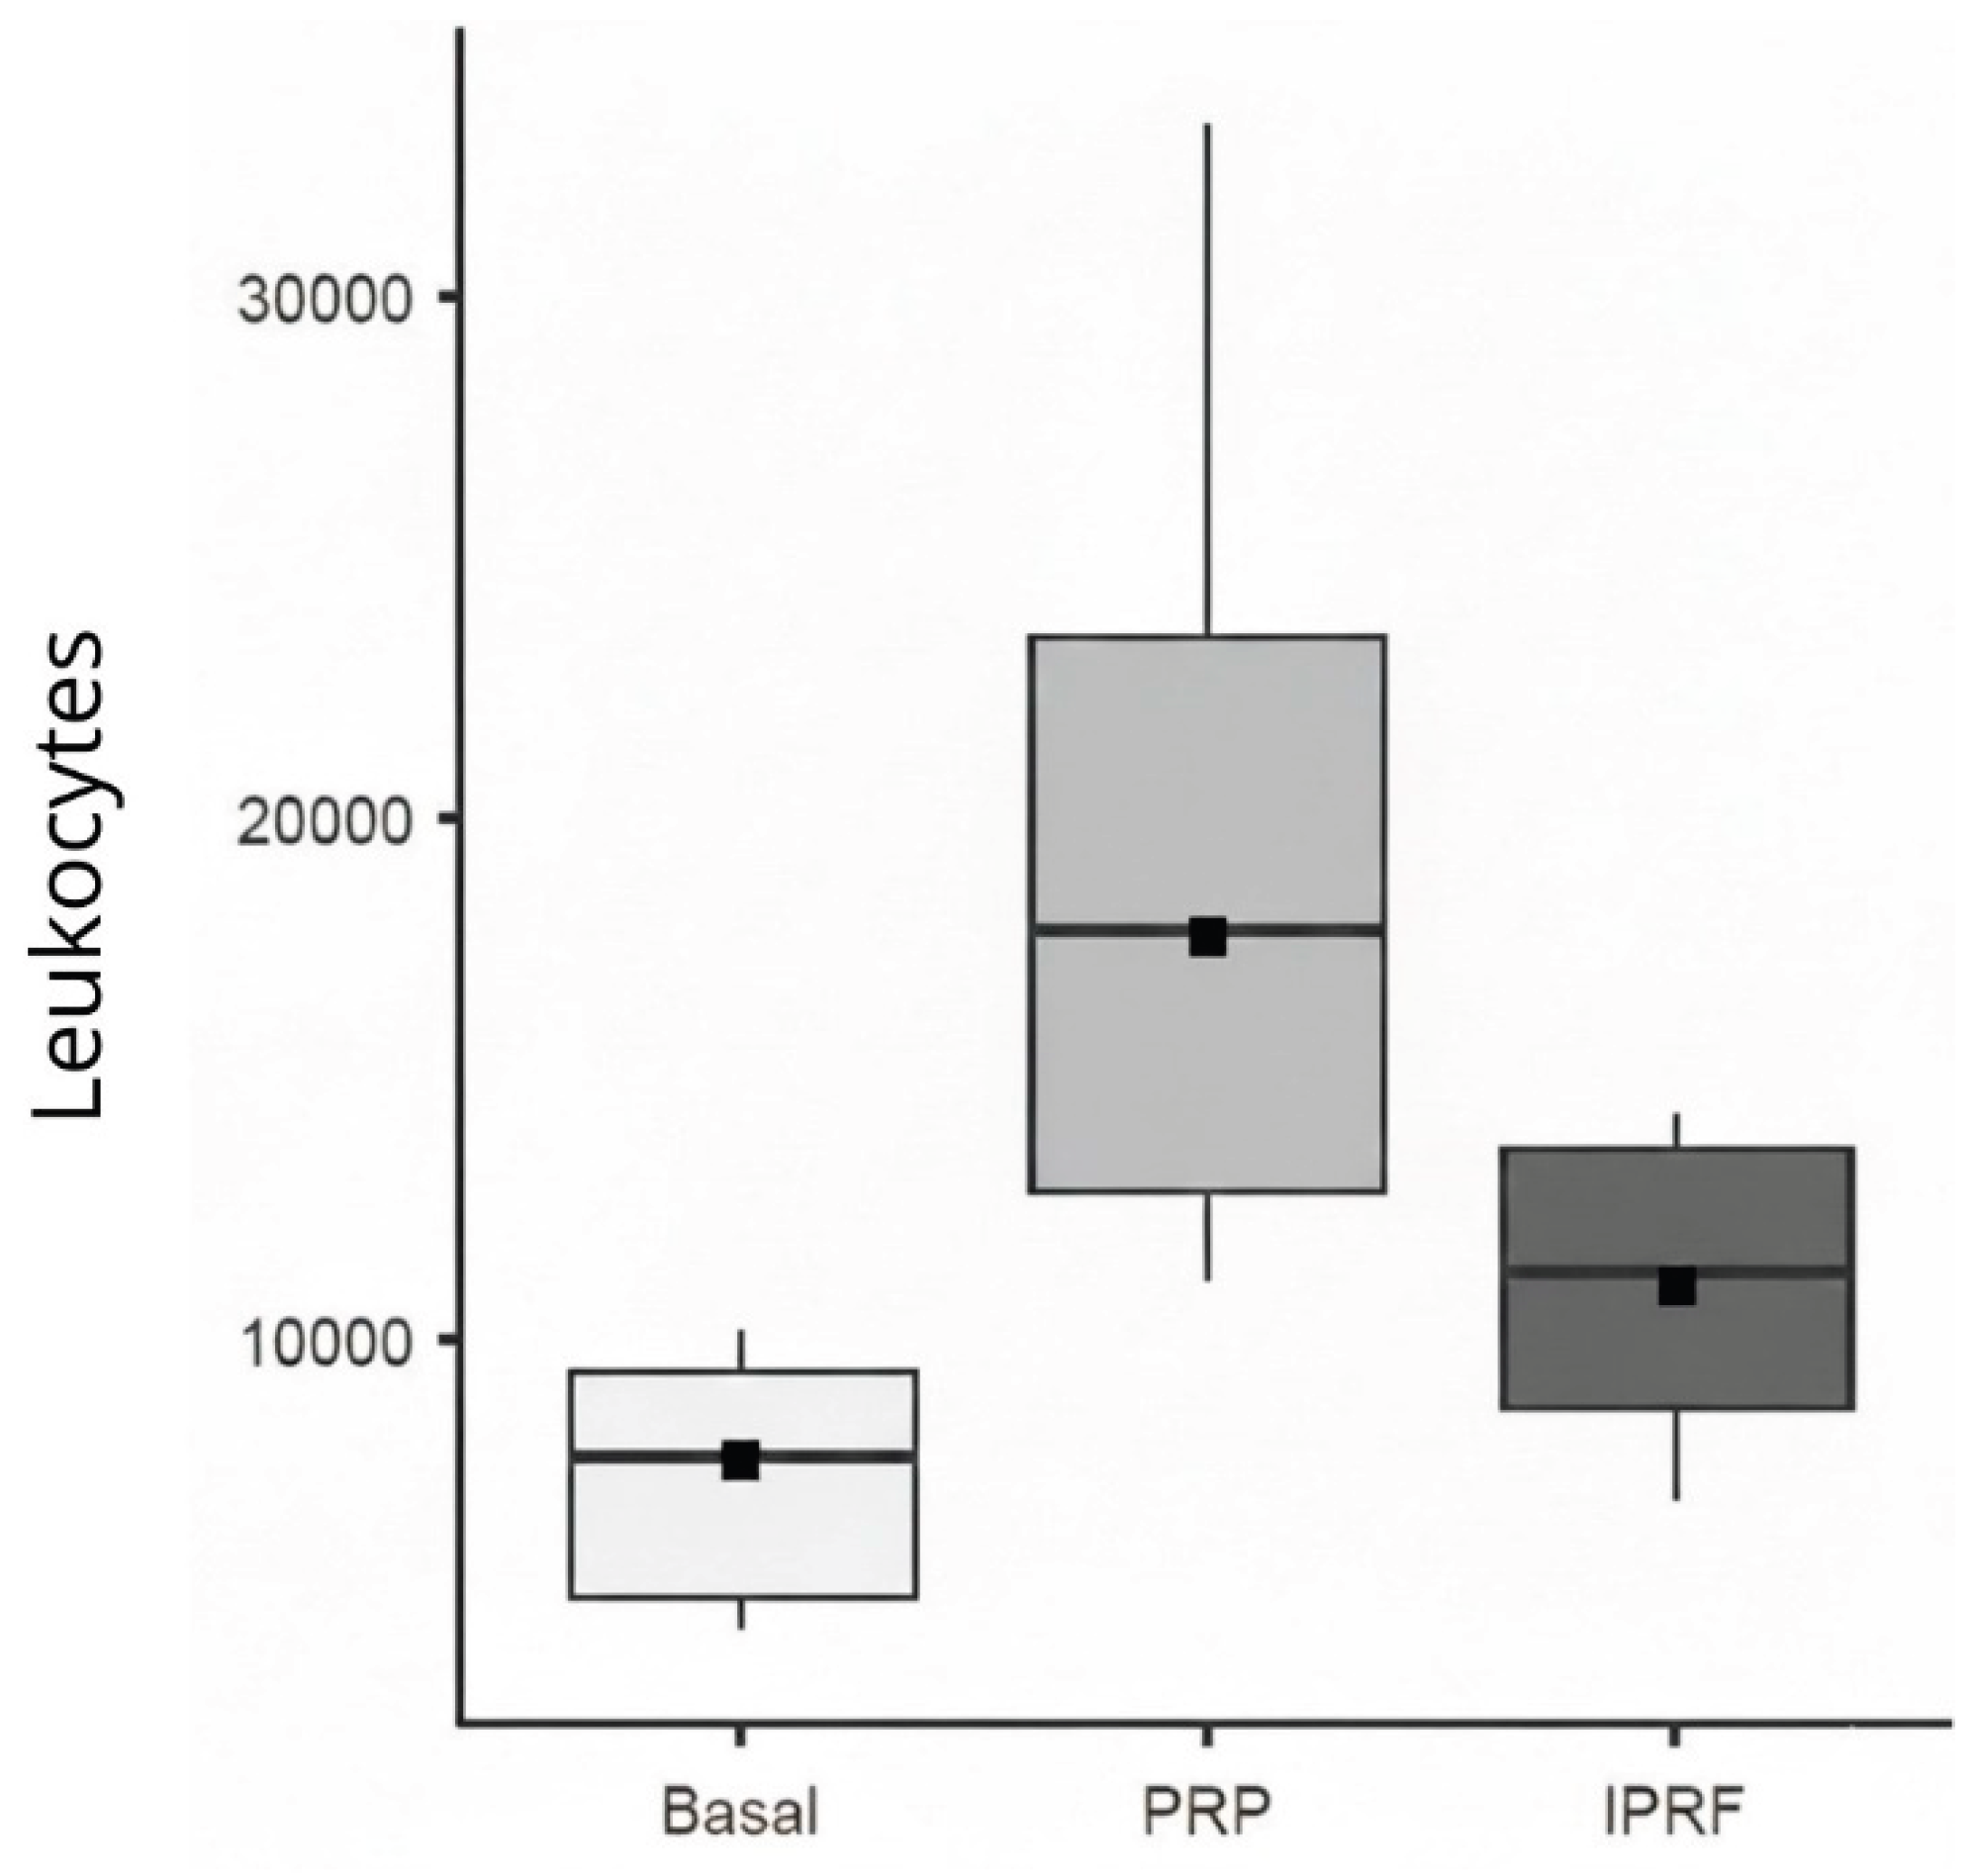
Figure 4.
Box Plot based on the mean (black square) and median (±95% CI) of PDGF-BB counts for Platelet-Rich Plasma (PRP) and Injectable Platelet-Rich Fibrin (i-PRF).
Figure 4.
Box Plot based on the mean (black square) and median (±95% CI) of PDGF-BB counts for Platelet-Rich Plasma (PRP) and Injectable Platelet-Rich Fibrin (i-PRF).
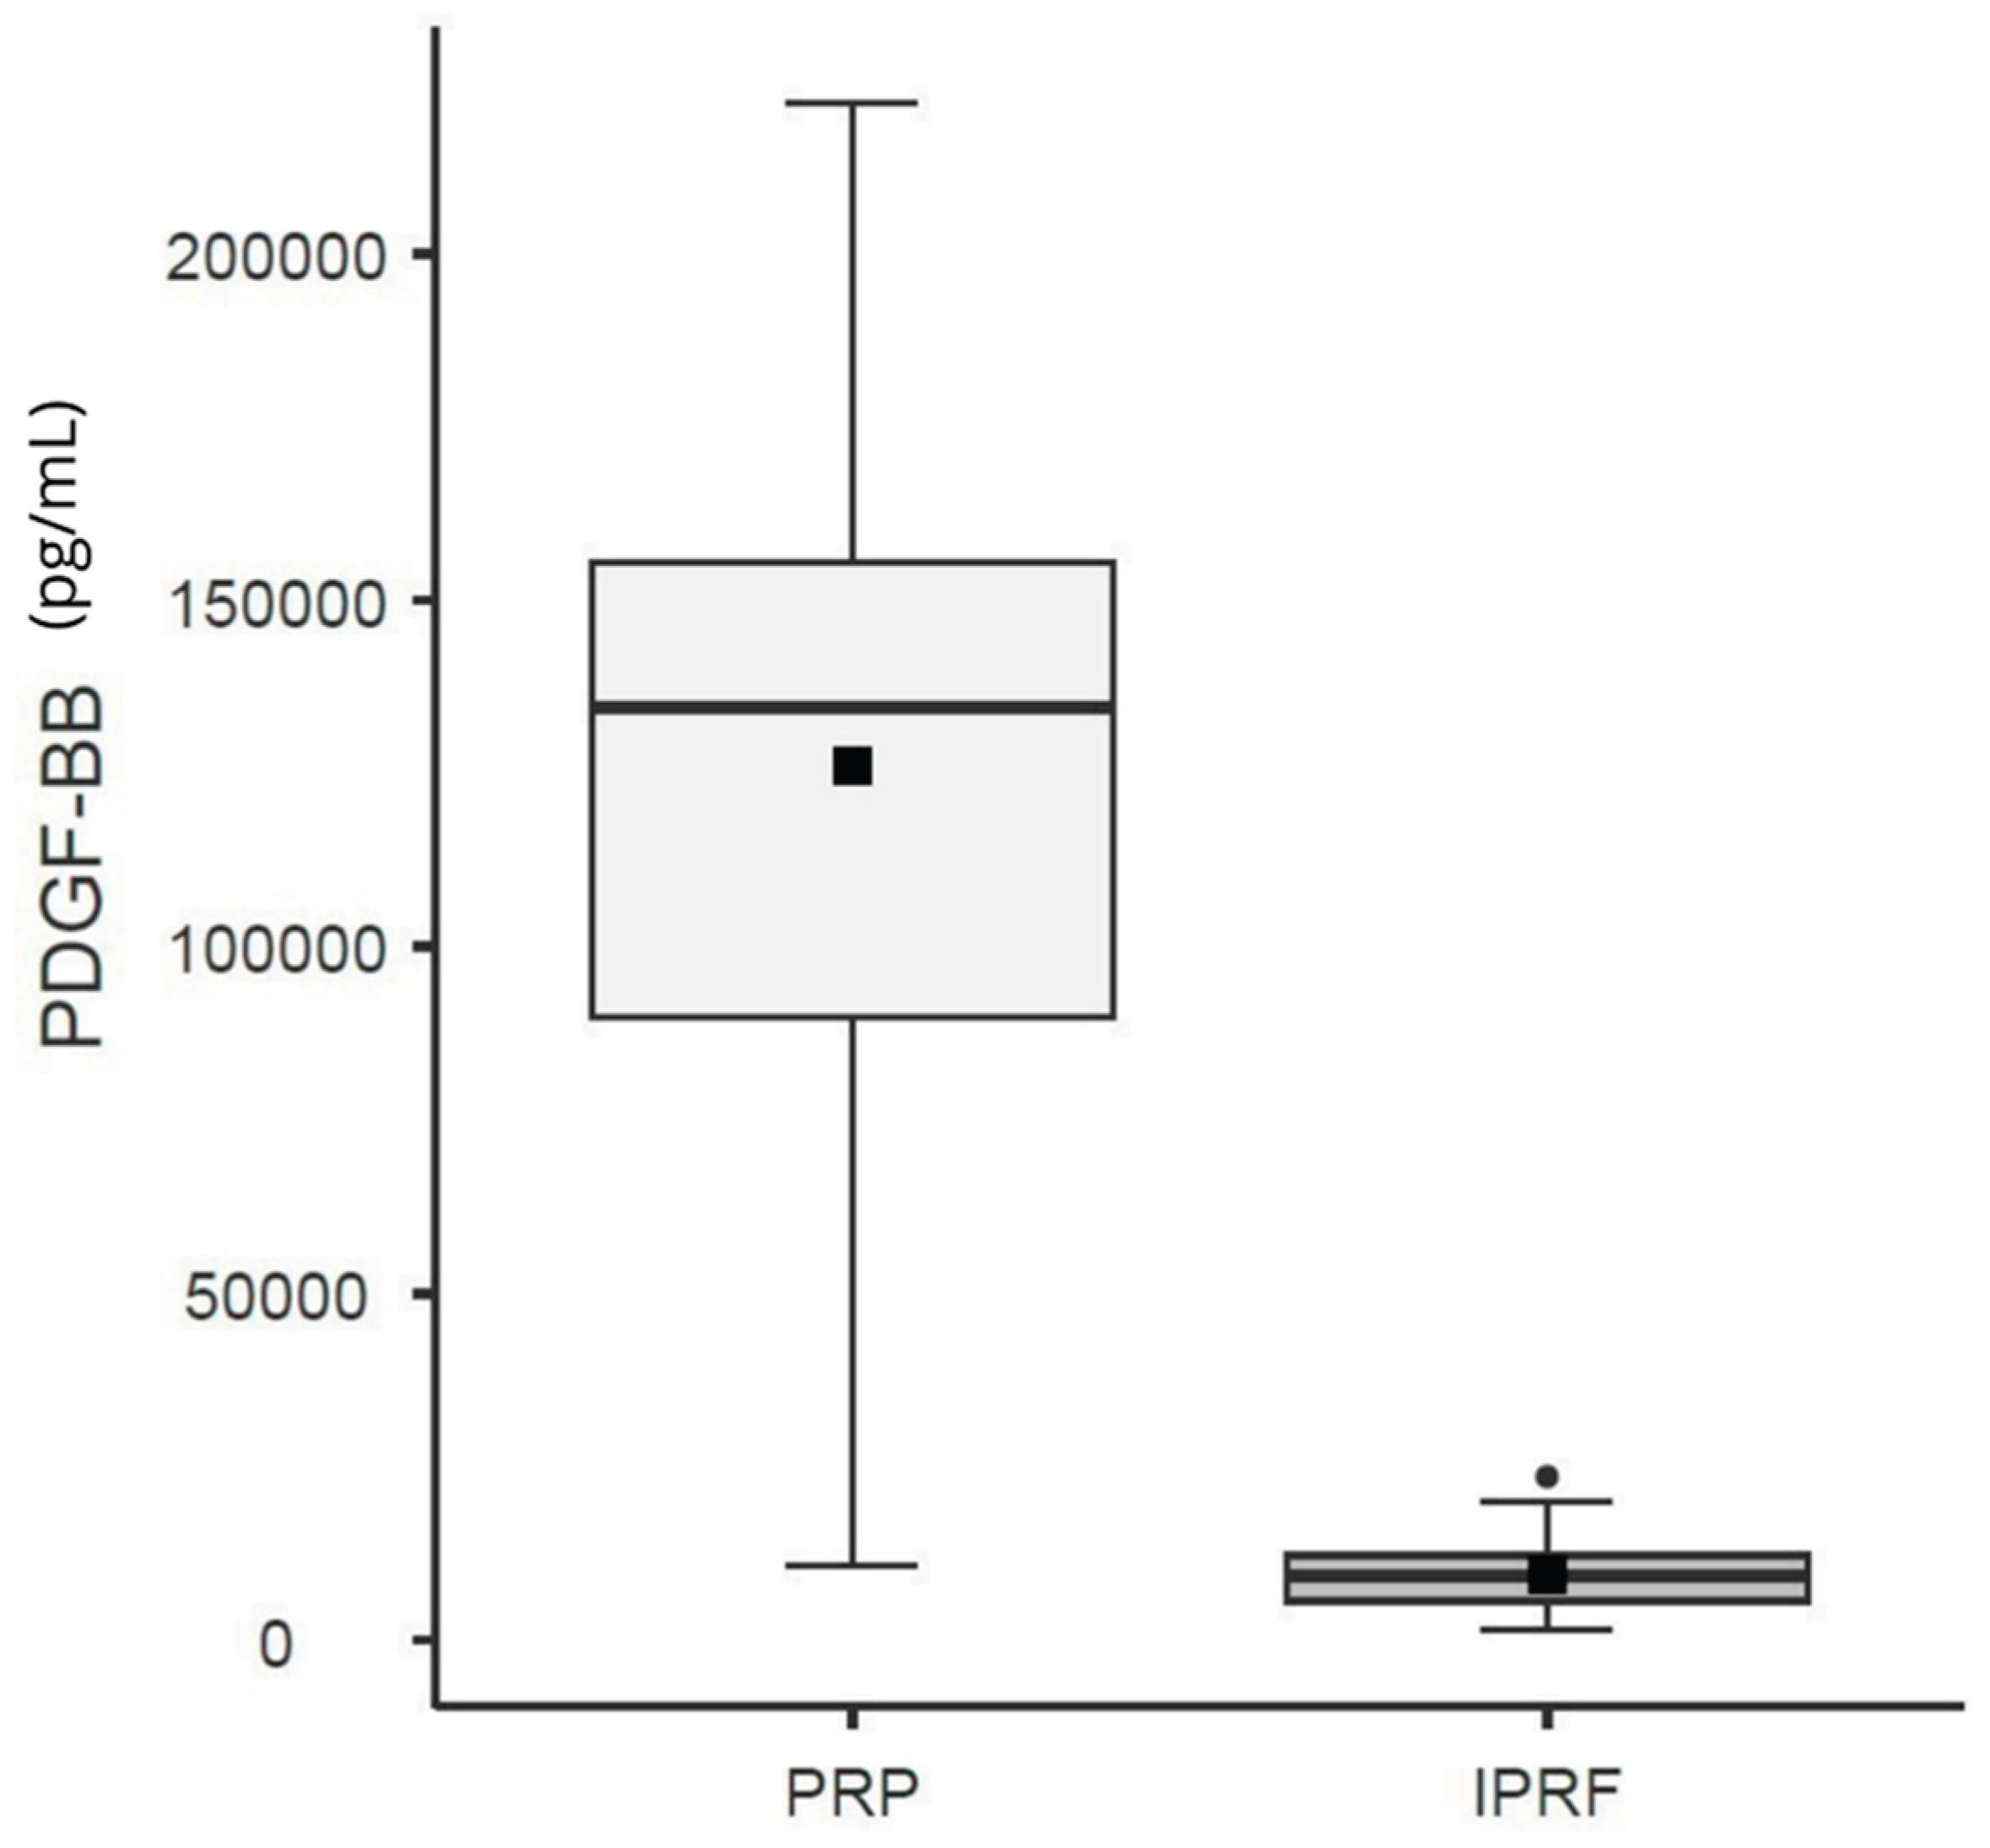
Figure 5.
Box Plot based on the mean (black square) and median (±95% CI) of Volume for Platelet-Rich Plasma (PRP) and Injectable Platelet-Rich Fibrin (i-PRF), segmented by Gender.
Figure 5.
Box Plot based on the mean (black square) and median (±95% CI) of Volume for Platelet-Rich Plasma (PRP) and Injectable Platelet-Rich Fibrin (i-PRF), segmented by Gender.
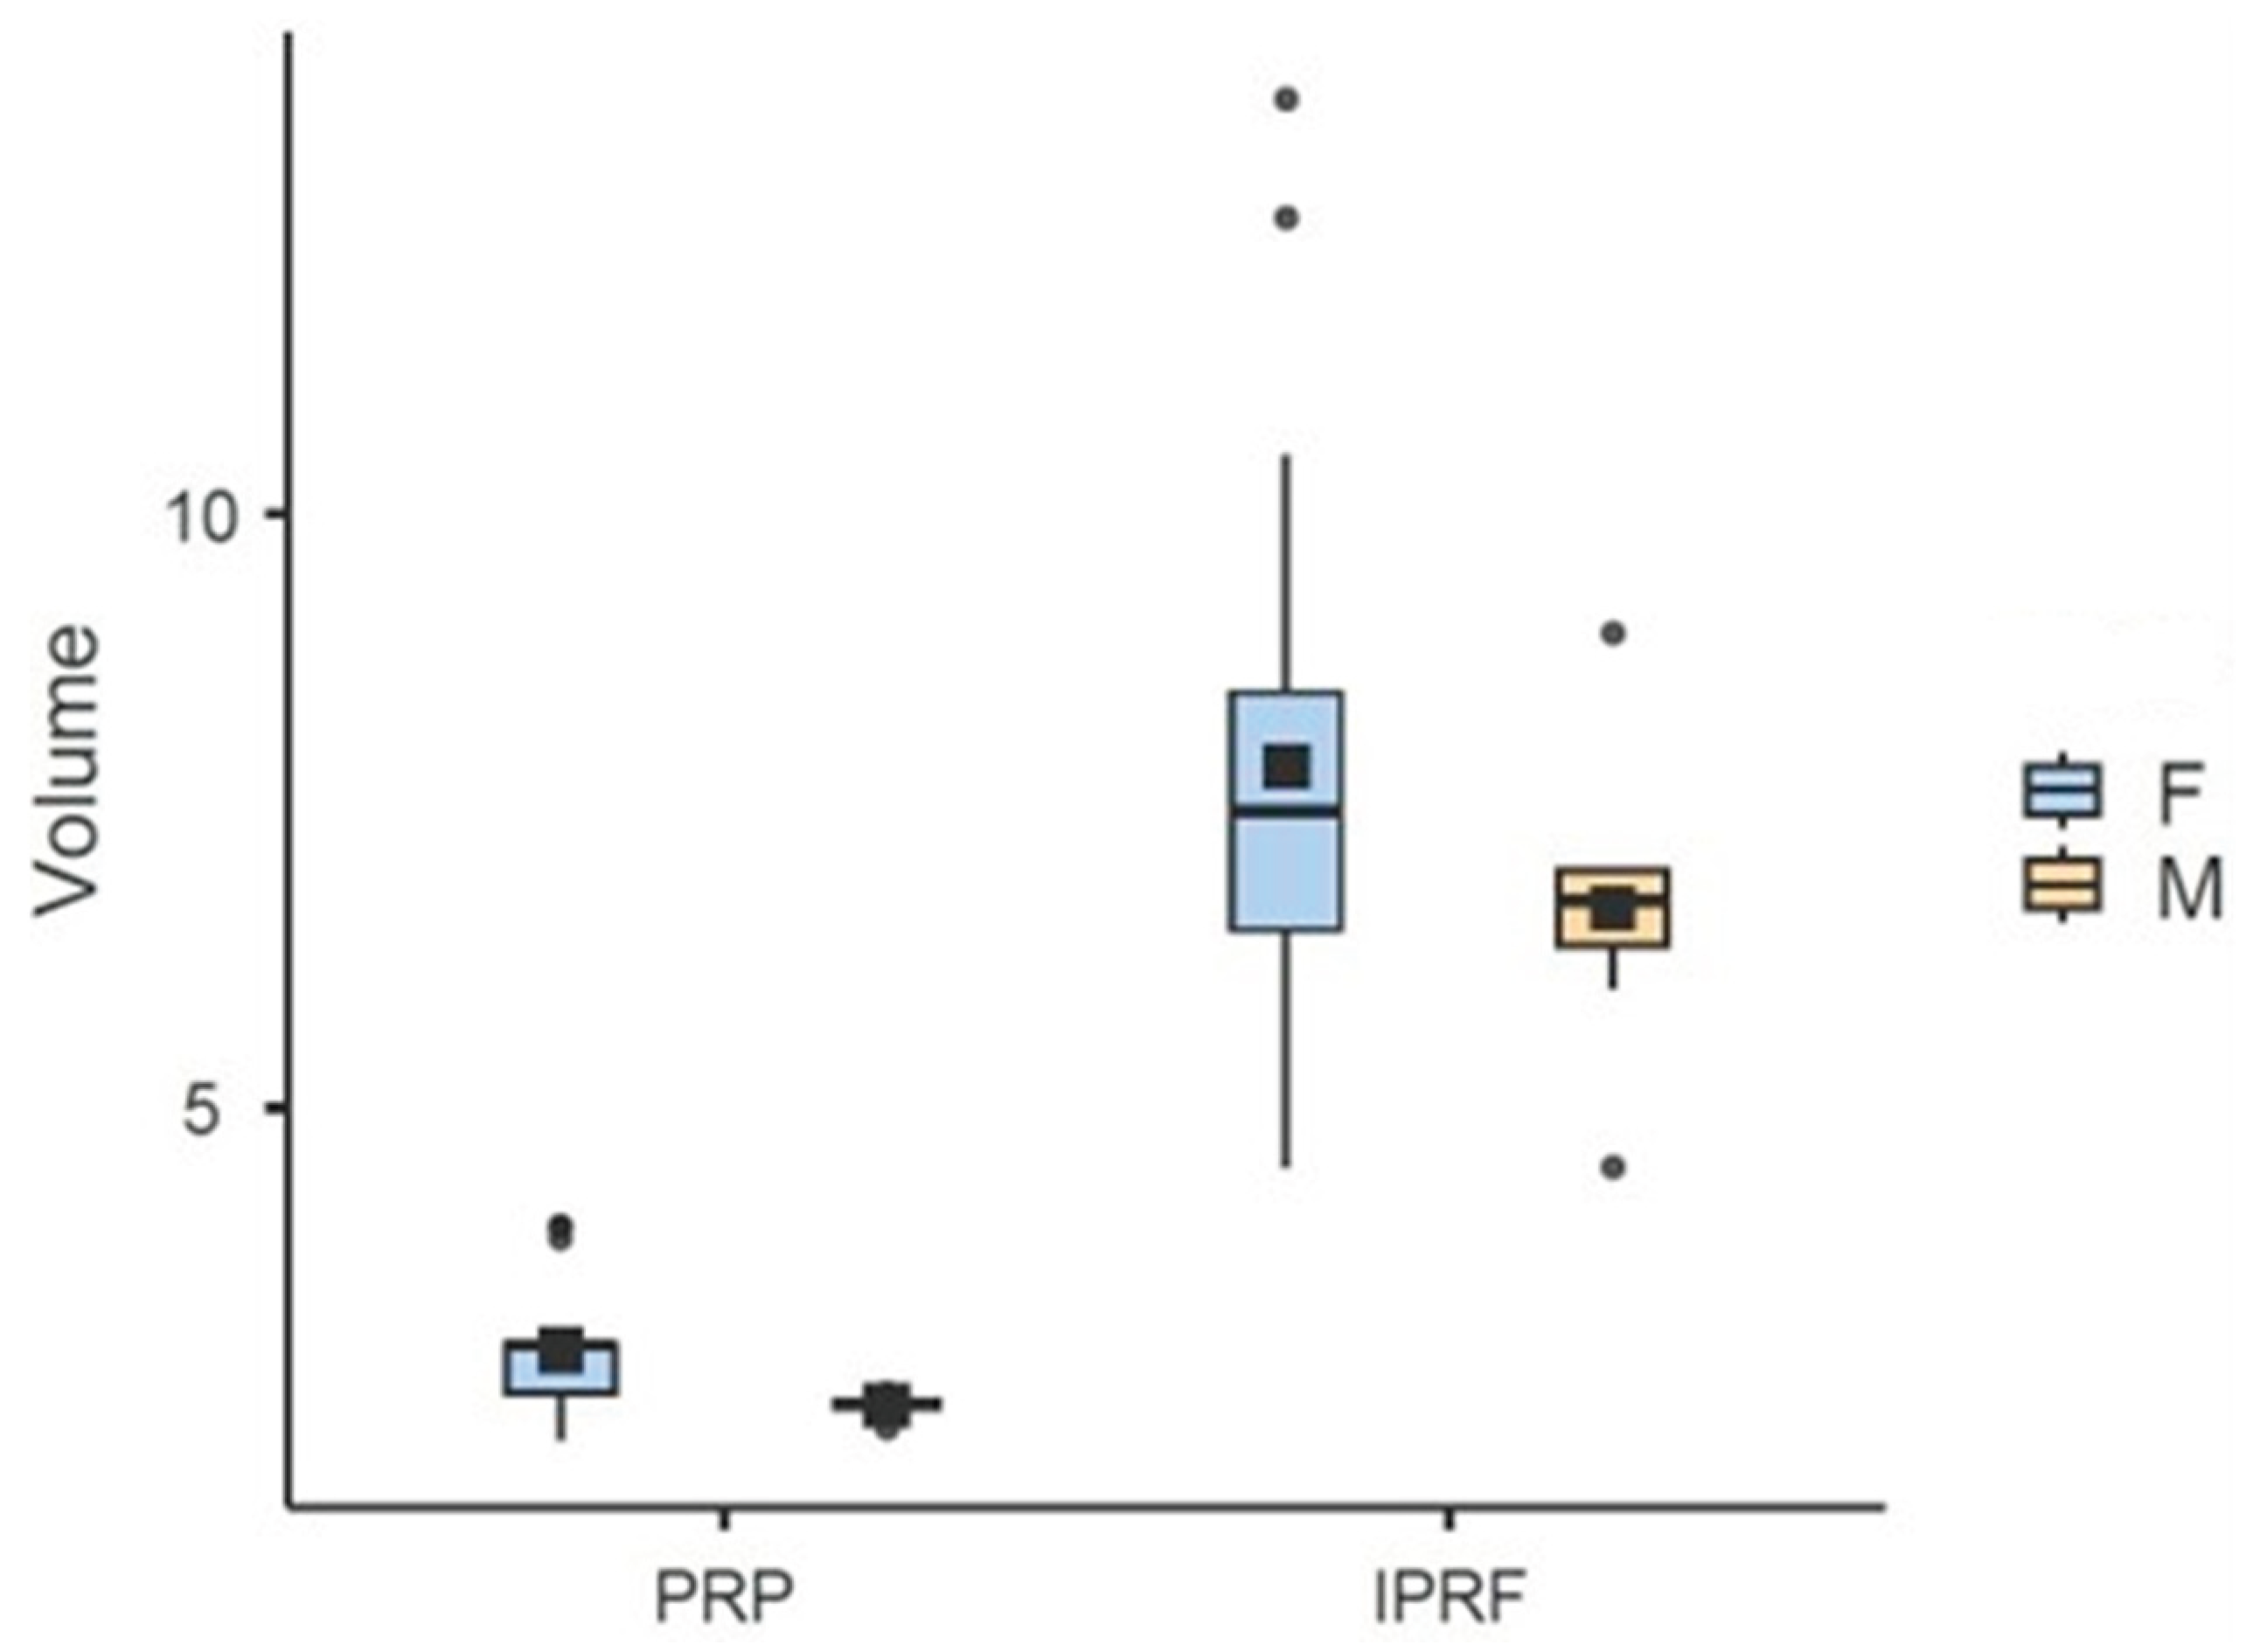
Figure 6.
Box plot of total platelet counts comparing Platelet-Rich Plasma (PRP) and Injectable Platelet-Rich Fibrin (i-PRF), based on the mean (black square) and median with 95% confidence intervals.
Figure 6.
Box plot of total platelet counts comparing Platelet-Rich Plasma (PRP) and Injectable Platelet-Rich Fibrin (i-PRF), based on the mean (black square) and median with 95% confidence intervals.
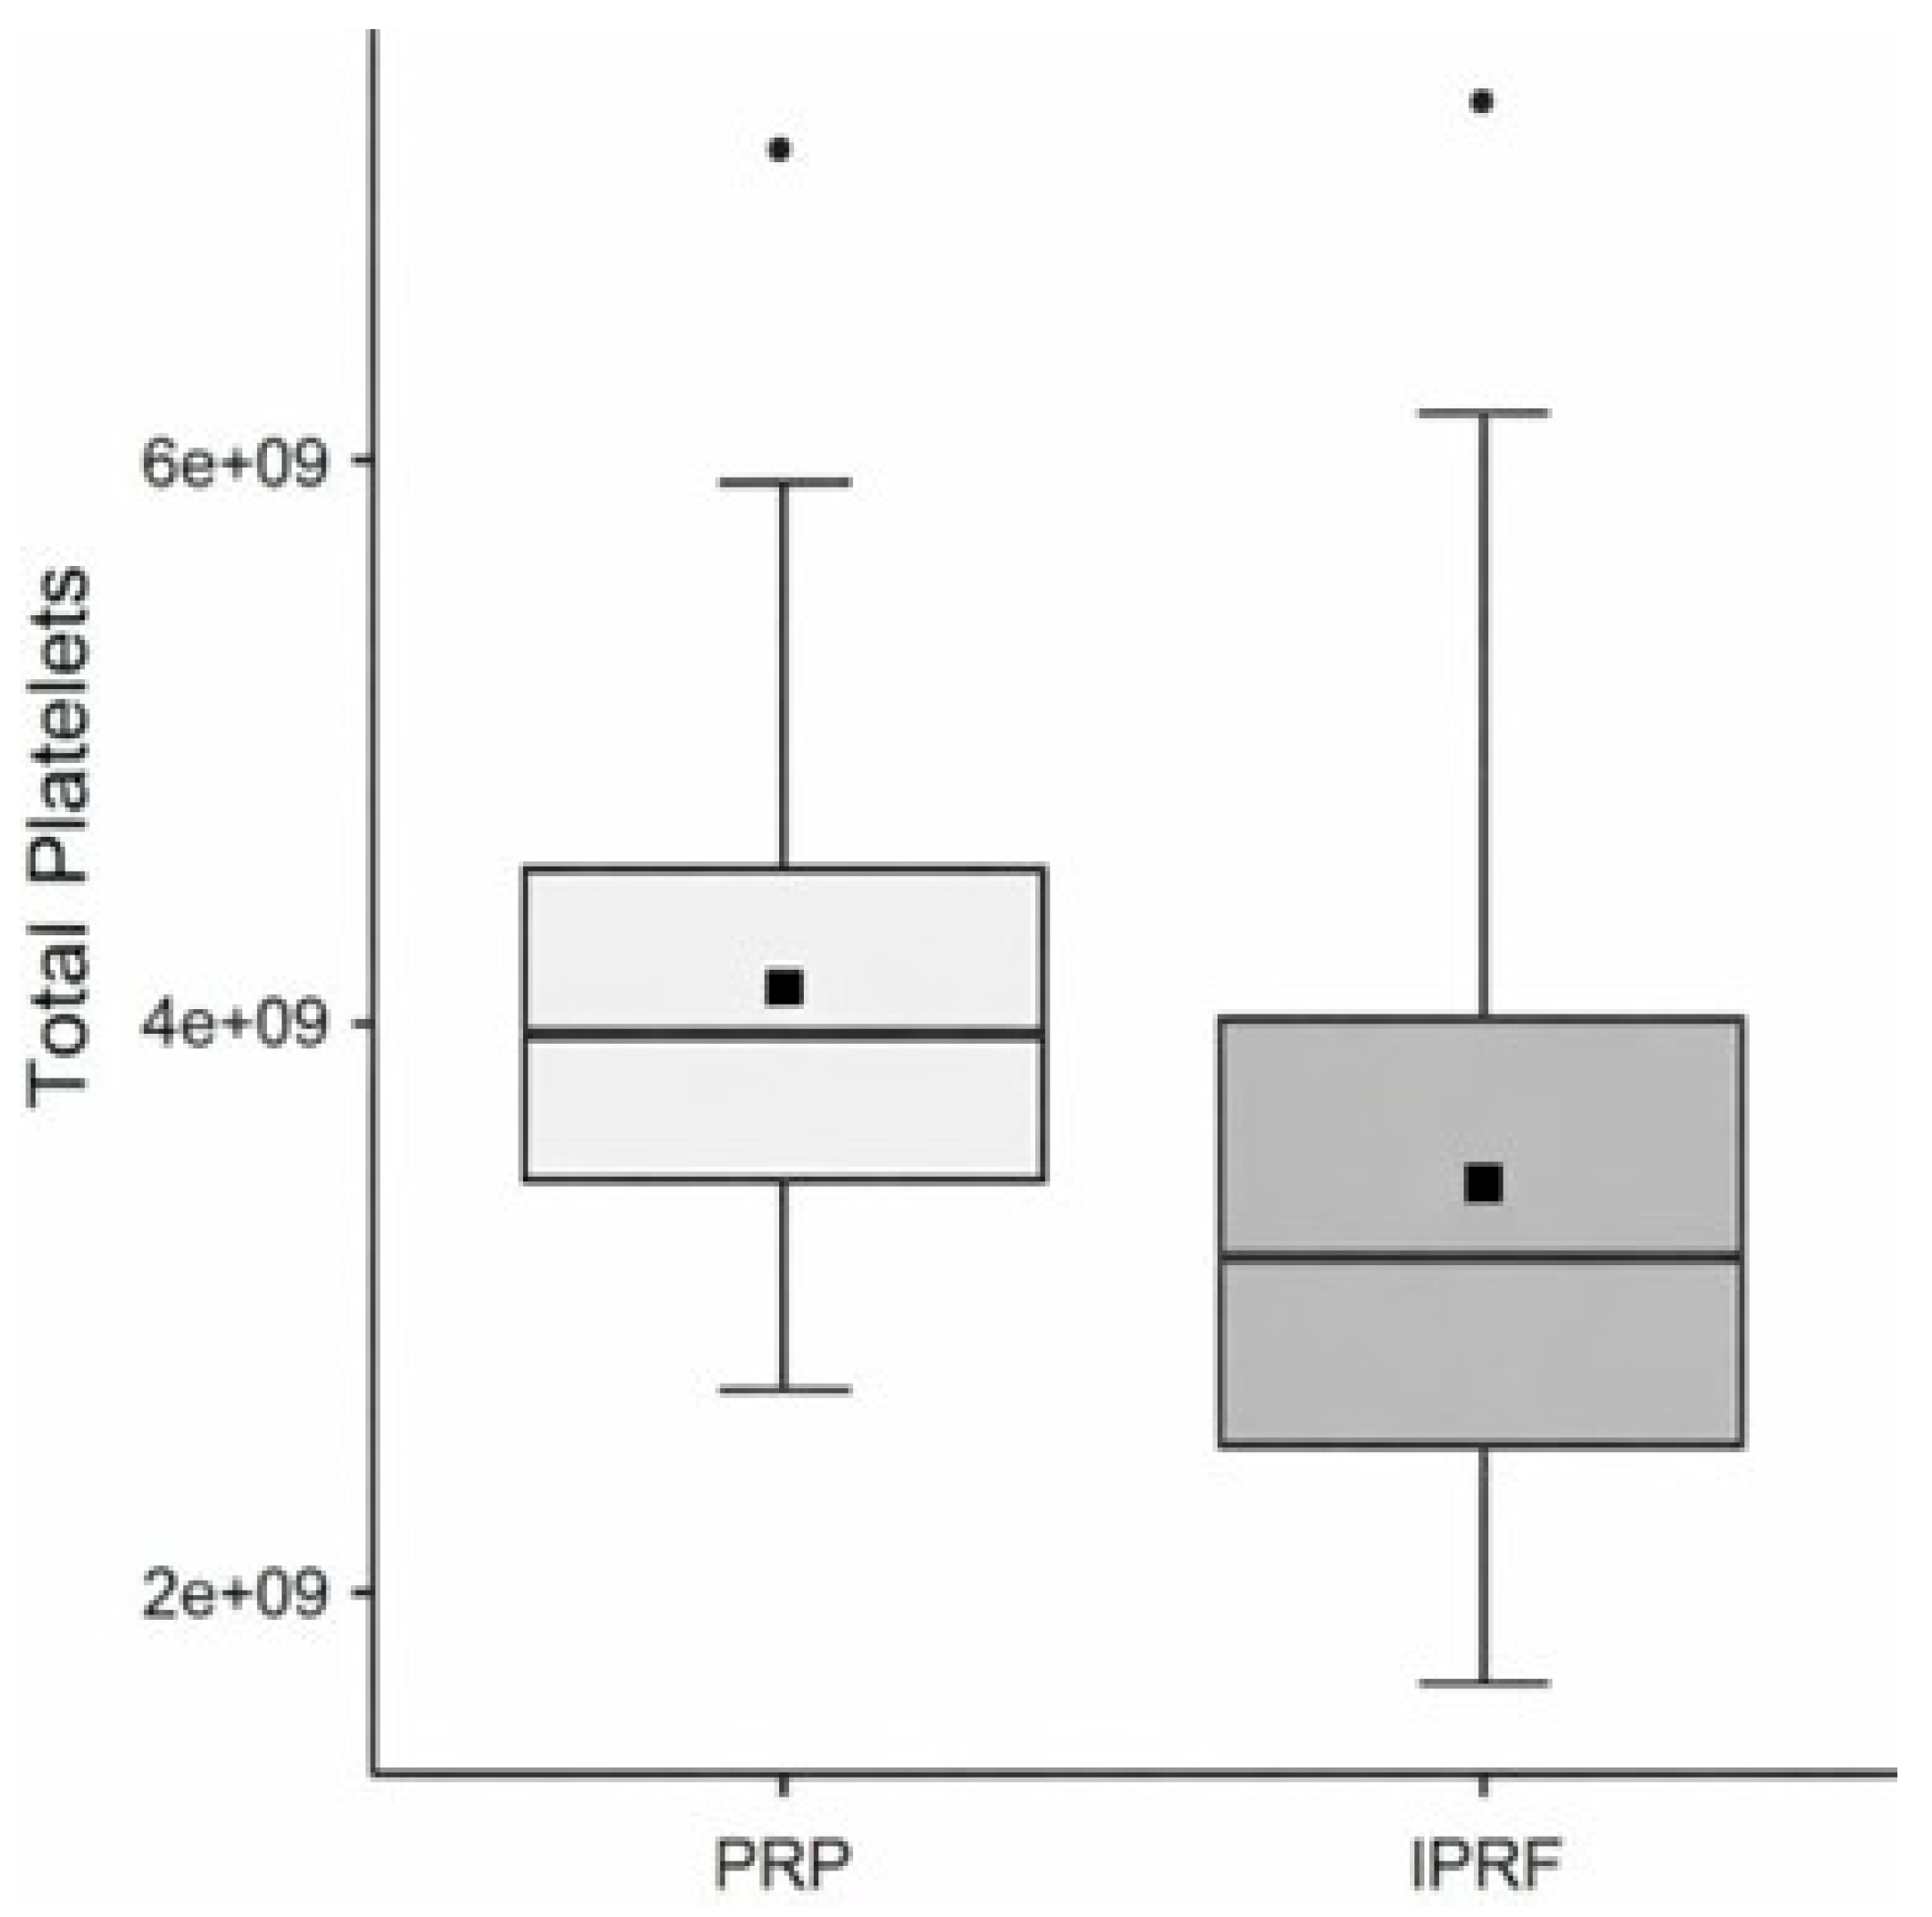
Figure 7.
Box plot based on the mean (black square) and median (±95% CI) of total leukocyte count for platelet-rich plasma (PRP) and injectable platelet-rich fibrin (I-PRF), stratified by comorbidity.
Figure 7.
Box plot based on the mean (black square) and median (±95% CI) of total leukocyte count for platelet-rich plasma (PRP) and injectable platelet-rich fibrin (I-PRF), stratified by comorbidity.
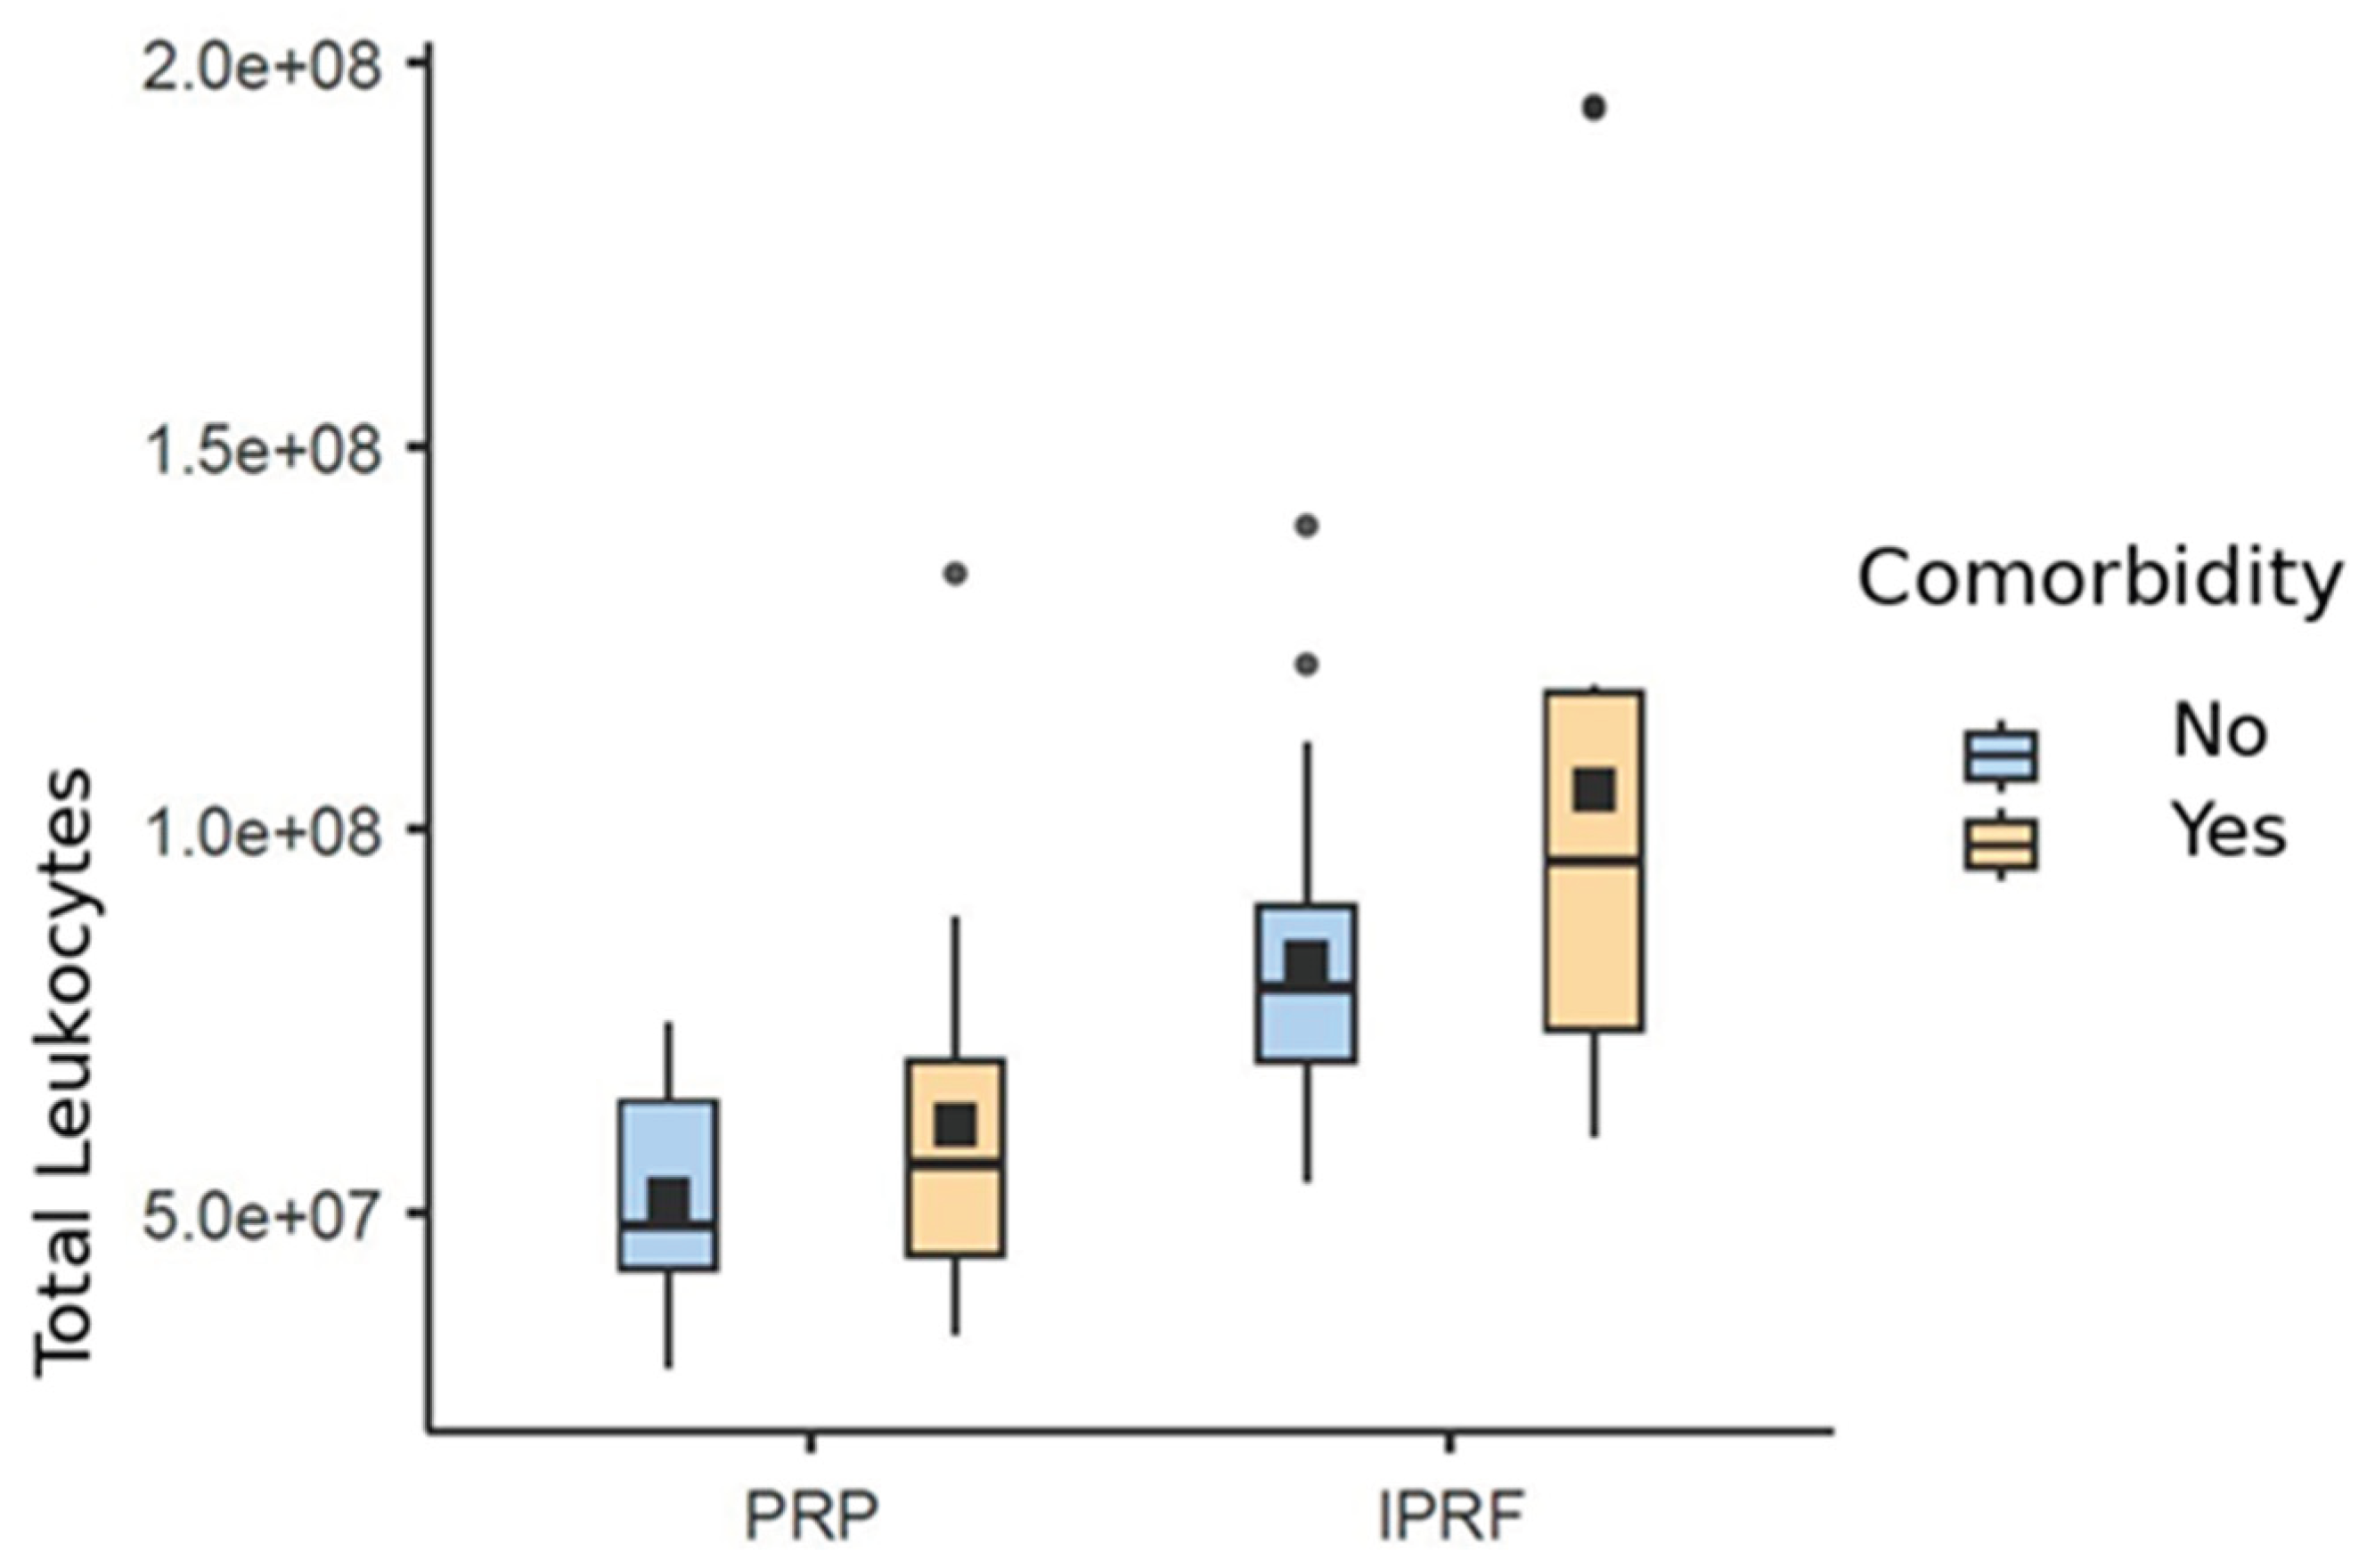

Table 1.
Categorical and descriptive variables of the study participants (n = 34).
| Variable | n (%) or Mean ± SD |
| Sex (female) | 26 (76.5) |
|
Race - Caucasian - Black |
33(97.1) 1(2.9) |
|
BMI category - Normal Weight - Overweight - Obesity Grade I - Obesity Grade II - Morbid Obesity |
14 (41.2) 14 (41.2) 3 (8.8) 2 (5.9) 1 (2.9) |
| Smoking (yes) | 1 (2.9) |
| Alcohol consumption (yes) | 17 (50.0) |
| Regular medication use (yes) | 24 (70.6) |
| Presence of comorbidities (yes) | 12 (35.3) |
| Age (years) | 40.9 ± 9.8 |
| Body weight (kg) | 76.1 ± 16.6 |
| Abdominal circumference (cm) | 86.4 ± 14.1 |
| Body mass index (kg/m²) | 26.8 ± 4.94 |
Data are presented as number (percentage) or mean ± standard deviation (SD). BMI: body mass index.
Table 2.
Description of baseline samples and biological products in terms of cellularity, PDGF-BB concentration, and volume.
Table 2.
Description of baseline samples and biological products in terms of cellularity, PDGF-BB concentration, and volume.
| Variable | Baseline | PRP | i-PRF |
| Platelets (cells/mm³) | 231,706 ± 46,270 | 1,416,824 ± 307,679 | 421,853 ± 101,805 |
| Leukocytes (cells/mm³) | 6,432 ± 1,398 | 19,649 ± 6,524 | 11,904 ± 2,349 |
| PDGF-BB (pg/mL) | — | 126,186 ± 49,414 | 9,471 ± 5,639 |
| Volume (mL) | — | 2.84 ± 0.48 | 7.60 ± 1.97 |
| Total platelets (cells) | — | 4.03 × 10⁹ ± 1.10 × 10⁹ | 3.32 × 10⁹ ± 1.37 × 10⁹ |
| Total leukocytes (cells) | — | 5.51 × 10⁷ ± 2.04 × 10⁷ | 9.07 × 10⁷ ± 3.35 × 10⁷ |
Data are presented as mean ± standard deviation. PRP: platelet-rich plasma; i-PRF: injectable platelet-rich fibrin; PDGF-BB: platelet-derived growth factor-BB.
Table 3.
Regression results and 95% confidence intervals (CI) for associations between platelet count and independent variables. Independent variables included group, sex, comorbidity, alcohol consumption, abdominal circumference, and age.
Table 3.
Regression results and 95% confidence intervals (CI) for associations between platelet count and independent variables. Independent variables included group, sex, comorbidity, alcohol consumption, abdominal circumference, and age.
| Variable | Estimate (B) | 95% CI | z | p-value | η² |
| Intercept | 690,420.4 | 652,336 – 731,807 | 34.24 | <0.001* | — |
| Age (years) | 390.8 | −1,543 – 2,324 | 0.40 | 0.68 | 0.002 |
| Sex (Male vs. Female)ᵃ | 5,131.9 | −37,265 – 49,964 | 0.23 | 0.81 | 0.0008 |
| Comorbidity (Yes vs. No)ᵃ | −6,236.1 | −38,238 – 27,180 | −0.36 | 0.71 | 0.002 |
| Group | |||||
| PRP vs. Baselineᵃ | 1.18 × 10⁶ | 1.08 × 10⁶ – 1.30 × 10⁶ | 21.40 | <0.001* | |
| i-PRF vs. Baselineᵃ | 189,552.2 | 153,973 – 227,174 | 10.22 | <0.001* | 18.2 |
| i-PRF vs. PRPᵃ | −994,458 | −1.11 × 10⁶ – −887,781 | −17.5 | <0.001* | |
| Alcohol consumption (Yes vs. No)ᵃ | −12,353.5 | −43,569 – 18,623 | −0.77 | 0.43 | 0.009 |
| Abdominal circumference (cm) | −41.4 | −1,243 – 1,246 | −0.06 | 0.94 | 0.00006 |
ᵃ Reference category indicated after the variable name. Statistically significant at p < 0.05.
Table 4.
Regression results and 95% confidence intervals (CI) for associations between leukocyte count and independent variables.
Table 4.
Regression results and 95% confidence intervals (CI) for associations between leukocyte count and independent variables.
| Variable | Estimate (B) | 95% CI | z | p-value | η² |
| Intercept | 12,545.4 | 11,836.2 – 13,314.3 | 33.49 | <0.001* | — |
| Age (years) | 17.0 | −34.48 – 69.1 | 0.62 | 0.53 | 0.01 |
| Sex (Male vs. Female)ᵃ | −932.7 | −2,185.0 – 370.5 | −1.47 | 0.14 | 0.07 |
| Comorbidity (Yes vs. No)ᵃ | 976.6 | −5.95 – 2,012.4 | 1.85 | 0.06 | 0.13 |
| Group | |||||
| PRP vs. Baselineᵃ | 13,144.8 | 11,513.1 – 14,931.5 | 15.18 | <0.001* | |
| i-PRF vs. Baselineᵃ | 5,475.0 | 4,396.3 – 6,624.9 | 9.67 | <0.001* | 12.25 |
| i-PRF vs. PRPᵃ | −7,670.0 | −9,617.2 – −5,823.9 | −7.97 | <0.001* | |
| Alcohol consumption (Yes vs. No)ᵃ | 668.5 | −257.2 – 1,601.2 | 1.42 | 0.15 | 0.07 |
| Abdominal circumference (cm) | 30.3 | −6.71 – 69.4 | 1.52 | 0.12 | 0.09 |
Notes: ᵃ Reference category indicated after the variable name. b:beta coefficient. *Statistically significant at p < 0.05.
Table 5.
Negative binomial regression results and 95% confidence intervals (CI) for the associations between PDGF-BB quantification and the independent variables Group, Sex, Comorbidity, Alcohol consumption, and Waist circumference.
Table 5.
Negative binomial regression results and 95% confidence intervals (CI) for the associations between PDGF-BB quantification and the independent variables Group, Sex, Comorbidity, Alcohol consumption, and Waist circumference.
| Variable | Estimate (β)b | 95% CI | z | p |
| Intercept | 10.46 | 10.30 – 10.63 | 126.5 | <0.001* |
| Gender: M–Fa | 0.04 | -0.30 – 0.39 | 0.23 | 0.81 |
| Comorbidity: Yes–Noa | 0.05 | -0.22 – 0.33 | -0.38 | 0.70 |
| Group | ||||
| i-PRF – PRPa | -2.58 | -2.85 - -2.32 | -19.23 | <0.001* |
| Alcohol consumption: Yes–Noa | -0.07 | -0.34 – 0.19 | -0.54 | 0.58 |
| Waist circumference | −0.001 | -0.01 – 0.009 | -0.19 | 0.84 |
Notes: aReference group; bBeta coefficient; * Statistical significance. The variable “Age” was excluded from the statistical model due to multicollinearity.
Table 6.
Regression results and 95% confidence intervals (CI) for the associations between volume quantification (mL) and the independent variables Group, Gender, Comorbidity, Alcohol consumption, and Waist circumference.
Table 6.
Regression results and 95% confidence intervals (CI) for the associations between volume quantification (mL) and the independent variables Group, Gender, Comorbidity, Alcohol consumption, and Waist circumference.
| Variable | Estimate (β)b | 95% CI | z | p | η2 |
| Intercept | 5.03 | 4.76 – 5.33 | 35.35 | <0.001* | - |
| Gender: M–Fa | -0.83 | -1.27 – -0.38 | -3.66 | <0.001* | 0.68 |
| Comorbidity: Yes–Noa | 0.40 | 0.03 – 0.79 | 2.08 | 0.03* | 0.24 |
| Group | |||||
| i-PRF – PRPa | 4.66 | 4.15 – 5.21 | 17.55 | <0.001* | 22.04 |
| Alcohol consumption: Yes–Noa | 0.20 | -0.14 – 0.55 | 1.14 | 0.25 | 0.06 |
| Waist circumference | 0.01 | 0.002 – 0.03 | 2.31 | 0.02* | 0.24 |
Notes: aReference; βb: Beta coefficient; * Statistical significance. The variable “Age” caused multicollinearity and was excluded from the statistical model.
Table 7.
Regression results and 95% confidence intervals (CI) for the associations between total platelet counts and the independent variables Group, Comorbidity, Alcohol consumption, and Waist circumference.
Table 7.
Regression results and 95% confidence intervals (CI) for the associations between total platelet counts and the independent variables Group, Comorbidity, Alcohol consumption, and Waist circumference.
| Variable | Estimate (B) | 95% CI | z | p-value | η² |
| Intercept | 3.70 × 10⁹ | 3.40 × 10⁹ – 4.05 × 10⁹ | 22.40 | <0.001* | — |
| Comorbidity (Yes vs. No)ᵃ | 1.61 × 10⁸ | −4.73 × 10⁸ – 8.47 × 10⁸ | 0.49 | 0.62 | 0.02 |
| Group | |||||
| i-PRF vs. PRPᵃ | −7.50 × 10⁸ | −1.37 × 10⁹ – −1.45 × 10⁸ | −2.41 | 0.01* | 0.72 |
| Alcohol consumption (Yes vs. No)ᵃ | −3.05 × 10⁸ | −6.34 × 10⁸ – 5.73 × 10⁸ | −0.09 | 0.92 | 0.001 |
| Waist circumference (cm) | 1.51 × 10⁷ | −7.81 × 10⁶ – 3.82 × 10⁷ | 1.35 | 0.17 | 0.20 |
Notes: ᵃ Reference category indicated after the variable name. B: beta coefficient. Statistically significant at p < 0.05. Age and sex were excluded from the model due to multicollinearity.
Table 8.
Results of negative binomial regression and 95% confidence intervals (CI) for associations between total leukocyte count and the independent variables Group, Comorbidity, Alcohol consumption, and Abdominal Circumference.
Table 8.
Results of negative binomial regression and 95% confidence intervals (CI) for associations between total leukocyte count and the independent variables Group, Comorbidity, Alcohol consumption, and Abdominal Circumference.
| Variable | Estimate (B)ᵇ | 95% CI | z | p |
| Intercept | 18.09 | 18.01 – 18.16 | 495.4 | <0.001* |
| Comorbidity: Yes–Noᵃ | 0.19 | 0.05 – 0.34 | 2.69 | 0.007* |
| Group | ||||
| I-PRF – PRPᵃ | 0.49 | 0.35 – 0.63 | 7.12 | <0.001* |
| Alcohol consumption: Yes–Noᵃ | 0.11 | −0.02 – 0.25 | 1.60 | 0.10 |
| Abdominal circumference | 0.007 | 0.002 – 0.01 | 3.10 | 0.003* |
Notes: ᵃ Reference category; ᵇ B: Beta coefficient; * Statistical significance. The variables Age and Sex caused multicollinearity and were therefore excluded from the statistical model.
Disclaimer/Publisher’s Note: The statements, opinions and data contained in all publications are solely those of the individual author(s) and contributor(s) and not of MDPI and/or the editor(s). MDPI and/or the editor(s) disclaim responsibility for any injury to people or property resulting from any ideas, methods, instructions or products referred to in the content. |
© 2026 by the authors. Licensee MDPI, Basel, Switzerland. This article is an open access article distributed under the terms and conditions of the Creative Commons Attribution (CC BY) license.
Copyright: This open access article is published under a Creative Commons CC BY 4.0 license, which permit the free download, distribution, and reuse, provided that the author and preprint are cited in any reuse.


