
Submitted:
22 January 2026
Posted:
23 January 2026
You are already at the latest version
Abstract
Background/Objectives: Inter-individual variability in lipid response to dietary modification highlights the need for precision nutrition. Current evidence is fragmented and primarily based on a limited set of historical candidate genes. To address these gaps and facilitate broader discovery, this study investigated whether exome-wide genetic variation is associated with changes in LDL cholesterol (LDL-C) and triglycerides (TAG) following a Mediterranean-style diet. Methods: A longitudinal study was conducted with 51 dyslipidemic patients who underwent a 2–6 month Mediterranean-style dietary intervention. High-depth whole-exome sequencing (mean 112×) was performed, and a two-tier analytical approach was used: an exploratory exome-wide association analysis to identify novel loci, and a targeted gene-level analysis of the 'Plasma Lipoprotein Assembly, Remodeling, and Clearance' pathway to prioritize biologically plausible signals. Results: The intervention resulted in significant reductions in LDL-C (mean -33.4 mg/dL) and TAG (-17.9 mg/dL). genome-wide association study (GWAS) identified top signals in ABCA2 (LDL-C response, p = 2.05 × 10⁻5) and ABCA7 (TAG response, p = 5.48 × 10⁻5). Targeted pathway analysis revealed the strongest gene-level associations for LDL-C change in APOC3, APOC2, and adaptor protein complex subunits AP2A1 and AP2A2 (Simes p = 0.007–0.018; false discovery rate (FDR) = 0.21), while APOB (Simes p = 0.010; FDR = 0.46) was the top signal for TAG change. These loci implicate convergent mechanisms involving triglyceride-rich lipoprotein remodeling and clathrin-dependent receptor trafficking. Conclusions: The results suggest that genetic modulation of dietary lipid response involves distributed effects within biologically coherent pathways rather than single high-impact variants. By combining exploratory genome-wide screening with process-focused gene prioritization, this demonstrates a pragmatic framework for identifying functional candidates to inform genetically guided dietary recommendations.
Keywords:
nutrigenomics
; Mediterranean diet
; whole exome sequencing
; LDL-C
; triglycerides
; lipoprotein metabolism
; gene-diet interactions
1. Introduction
Dyslipidemia remains a central, modifiable driver of atherosclerotic cardiovascular disease risk, and dietary change is a first-line lifestyle strategy to lower low-density lipoprotein cholesterol (LDL-C). Among the most studied dietary patterns, Mediterranean-style diets have shown cardiovascular benefit in both primary and secondary prevention settings [1,2]. However, lipid responses to dietary modification are notably heterogeneous. Under comparable guidance, the degree of improvement varies substantially, with some patients showing little benefit or even paradoxical worsening. This inter-individual variability underscores the rationale for precision nutrition approaches [3].
Nutrigenomics investigates the interaction between diet and genetic variation in shaping disease risk and therapeutic response, with the aim of explaining inter-individual variability in metabolic traits. However, much of the current evidence base remains centered on candidate-gene studies. While interactions have been reported for well-studied loci such as APOE and CETP [4,5], evidence for other loci (e.g., APOA5, ABCG5) remains sparse, limiting inference beyond specific study settings [6,7]. Research often remains constrained to a small set of historical loci, leaving a fragmented evidence base that is difficult to consolidate. Moreover, as current evidence is heavily skewed toward specific populations, generalizability remains a critical gap [8].
To address these limitations, genome-wide approaches are essential for broader, hypothesis-free discovery, enabling the identification of novel variants beyond restricted candidate lists. We conducted an exploratory study to examine whether genetic variation is associated with blood lipid changes in a clinical cohort receiving Mediterranean-style dietary guidance. To capture the full spectrum of variation, we utilized a two-tier strategy: first, an exome-wide analysis of lipid response to facilitate broad locus discovery; and second, a targeted analysis of a priori selected genes defined within the lipoprotein metabolism pathway to enhance sensitivity for biologically plausible signals. We focused primarily on LDL-C response given its central role in atherosclerotic risk, with TAG (triglycerides) analyzed as a secondary lipid trait.
2. Materials and Methods
Ethics and Participants
The study protocol was approved by the Ilia State University Bioethics Committee (Approval No. R/215-24, 01.07.2024) and conducted in accordance with the Declaration of Helsinki. Written informed consent was obtained from all participants, and clinical data were anonymized prior to analysis. Patients identified with elevated LDL cholesterol at an initial visit were enrolled during their subsequent clinical follow-up. Eligible individuals had completed 2–6 months of a prescribed Mediterranean-style diet and had both baseline and follow-up lipid profiles available.
Inclusion criteria comprised informed consent, documented adherence to dietary recommendations, availability of lipid data for baseline and follow-up time points, and euthyroid status. Exclusion criteria included lipid-lowering medication use, bariatric surgery, major weight change, diabetes mellitus, established cardiovascular disease, secondary or hereditary dyslipidemia, pregnancy or lactation, severe comorbidities (e.g., active malignancy, renal failure, or hepatic insufficiency), uncontrolled hypertension, heavy alcohol intake, or any condition impairing participation. A total of 52 participants were included in the analysis.
Clinical Data
LDL cholesterol (LDL-C) and triglycerides were measured in a single certified laboratory (Diacor, Tbilisi, Georgia) at baseline and after dietary intervention. Analysis was performed on venous blood serum using a fully automated Cobas c111 analyzer (Roche Diagnostics). LDL-C was determined using the LDL-Cholesterol Gen.3 kit (Roche Diagnostics , Ref: 7005806190) via a homogeneous enzymatic colorimetric assay. Triglycerides were quantified using the standard Roche Triglycerides kit (Ref: 04657594190) via an enzymatic colorimetric method. The interval between the two assessments was 2–6 months. Reference ranges were defined as <130 mg/dL for LDL-C and <150 mg/dL for triglycerides.
DNA Extraction and Sequencing
Genomic DNA was extracted from peripheral blood using the Qiagen QIAamp DNA Blood Mini Kit (Ref: 51106). DNA purity and concentration were evaluated using Nanodrop spectrophotometry; samples meeting provider requirements were lyophilized and shipped to the sequencing facility. Whole-exome sequencing was performed by BMK Gene (China) using the Agilent SureSelect V6 capture kit. Libraries were prepared according to manufacturer protocols and sequenced on an Illumina NovaSeq platform with paired-end 150 bp reads. Base calling was performed using Illumina Casava v1.8.
Data Processing and Variant Analysis
Low-quality reads were removed if they contained adaptor contamination, more than 10% undetermined bases, or more than 50% low-quality bases. Clean reads were aligned to the human reference genome GRCh38 using BWA-MEM with default parameters. Post-alignment processing followed GATK Best Practices using standard default settings, including duplicate removal (Picard), base-quality score recalibration, and indel realignment. Variant calling was performed using GATK HaplotypeCaller (default configuration), and high-confidence variants were retained following Variant Quality Score Recalibration. Variants were annotated using ANNOVAR with default databases.
Statistical Analysis
Genotype data processing and genome-wide association analyses were conducted using PLINK v2.0 [10]. Downstream statistical analyses were performed in the R computing environment (version 4.1.1). Data management was performed using data.table [11]. Genomic annotations and gene coordinates were retrieved using biomaRt [12], and GWAS diagnostic plots were generated using qqman [13]. Generative AI tools (Gemini, Google) were utilized to assist in the drafting and debugging of R scripts used for data processing and visualization. All scripts used for quality control, genome-wide association analyses, targeted pathway analysis, and figure generation are publicly available and archived on Zenodo (https://doi.org/10.5281/zenodo.18312269).
Variants were filtered based on strict quality control criteria: minor allele frequency (MAF) > 0.01, genotype call rate > 0.90, and Hardy–Weinberg equilibrium p > 1 × 10⁻6. To account for population stratification, linkage disequilibrium (LD) pruning was performed (200-variant window, r2 < 0.1) and principal component analysis (PCA) was conducted. Relatedness was assessed using the KING kinship coefficient [14]; one first-degree relative (kinship > 0.177) was identified and excluded to ensure sample independence prior to association testing.
Genome-wide association analyses were conducted separately for LDL-C and TAG using generalized linear models (GLM) in PLINK 2.0 under an additive genetic model. Linear regression was performed on the Winsorized change in lipid levels (mean ± 3 standard deviations) to minimize the impact of outliers while preserving interpretable effect estimates. All models were adjusted for age and sex. Nominal p-values and Benjamini–Hochberg FDR adjusted p-values are reported for the prioritization of candidate loci.
Targeted Gene Analysis
In addition to the genome-wide analysis, a targeted analysis was performed on genes within the Reactome pathway "Plasma Lipoprotein Assembly, Remodeling, and Clearance" (R-HSA-174824). This gene list was defined a priori as a curated set of genes directly involved in lipoprotein metabolism. Variants mapping to these genes (GRCh38 gene coordinates) were extracted from the post-QC dataset. Variants were further filtered to retain only those with a minor allele count (MAC) > 3 and presence in at least 2 individuals. To provide a gene-level significance metric, p-values for variants within each locus were summarized using the Simes method [15]. This approach tests the global null hypothesis (that at least one variant is associated) and remains valid under the linkage disequilibrium structures typical of genomic data [16]. Gene-level p-values were subsequently adjusted for multiple comparisons using the Benjamini–Hochberg FDR.
3. Results
Sequencing Performance and Data Quality
Whole-exome sequencing produced usable data for all 52 samples, with no exclusions due to sequencing failure or insufficient quality. The mean sequencing depth across target regions was 111.9x, the proportion of bases with Q30 quality was 96.87%, and the mean mapping efficiency was approximately 99.9%. Variant calling identified approximately 135,000–156,000 SNPs per sample. Relatedness assessment identified one first-degree related pair (kinship > 0.177); one individual was excluded to ensure sample independence. Principal component analysis (PCA) on LD-pruned variants demonstrated a homogenous population structure without significant stratification outliers. Consequently, statistical models were adjusted for age and sex to preserve statistical power in this exploratory cohort.
Participant Characteristics
Fifty-one participants were included in the final analysis (28 females, 23 males). Baseline characteristics are summarized in Table 1. Mean age was 48.0 ± 12.7 years, and the mean interval between baseline and follow-up assessments was 5.0 ± 2.2 months; these did not differ by sex (p = 0.158 and p = 0.308, respectively). Baseline LDL-C was 149.5 ± 27.4 mg/dL and decreased to 116.1 ± 22.7 mg/dL at follow-up, with a mean change of -33.4 ± 25.1 mg/dL; LDL measures and change were not significantly different between females and males (all p >= 0.295). In contrast, absolute triglyceride concentrations were significantly higher in males at both baseline and follow-up (p = 0.033 and p = 0.018, respectively). However, the response to the intervention was similar in both groups; the magnitude of triglyceride change did not differ by sex (p = 0.736).
Genome-Wide Association Results
Quantile-quantile (QQ) plots of the observed versus expected p-values demonstrated no evidence of genomic inflation (Figure 1), with genomic control lambda values of 0.987 for LDL-C change and 0.965 for TAG change. Additionally, principal component analysis confirmed that population structure did not significantly bias the observed lipid responses (Figure S1). Full linear model coefficients, including the effects of age and sex covariates, are provided in Table S1.
No individual variant reached the genome-wide significance threshold (p < 5 × 10⁻⁸). However, the top suggestive signals (p < 10⁻5) mapped to loci with established roles in lipid trafficking (Figure 2). For LDL-C change, the strongest associations were observed in UGT2B11 (p = 2.55 × 10⁻6) and ABCA2 (p = 2.05 × 10⁻5), an ATP-binding cassette transporter involved in intracellular sterol homeostasis (Table S2; Supplementary Data). For TAG change, top signals included IMPDH1 (p = 7.56 × 10⁻6) and ABCA7 (p = 5.48 × 10⁻5), a functional homolog of the cholesterol efflux pump ABCA1 (Table S3; Supplementary Data).
Targeted Gene Analysis Results
For the change in LDL-C (Delta-LDL-C), the strongest gene-level association was observed for APOC3 (Simes p = 0.007; FDR = 0.21). Significant associations were also identified in AP2A2 (Simes p = 0.014; FDR = 0.21), AP2A1 (Simes p = 0.018; FDR = 0.21) and APOC2 (Simes p = 0.018; FDR = 0.21). For the change in triglycerides (Delta-TAG), the top association signal was identified in APOB (Simes p = 0.010; FDR = 0.46). Complete lists of all associations are provided in Supplementary Data. While gene-level associations did not reach the strict false discovery rate threshold of FDR-adjusted p < 0.05, nominal associations were observed in multiple loci within the pathway. Figure 3 displays the regional association plots and genotype-stratified boxplots for these loci, illustrating the distribution of lipid changes among genotype groups.
4. Discussion
Principal Findings
In this exploratory study, we examined whether genetic variation contributes to inter-individual differences in lipid response to Mediterranean-style dietary guidance. We identified suggestive exome-wide signals and coherent nominal associations within a curated lipoprotein pathway. Specifically, we observed gene-level signals in APOC3, APOC2, AP2A1, and AP2A variants. Our results support a polygenic model involving biologically coherent lipid metabolic pathways, consistent with current nutrigenetic frameworks [17]. While the absence of significant genome-wide associations is expected in exploratory settings, the absence of genomic inflation indicates that the observed signals reflect real variation suitable for prioritization.
Biological Interpretation
Prioritized loci of diet-induced LDL-C reduction point to two convergent mechanisms: triglyceride-rich lipoprotein (TRL) remodeling and receptor trafficking. Regarding TRL processing, associations were observed in APOC3 and APOC2. APOC3 inhibits LPL activity and delays hepatic uptake of TRL remnants, and loss-of-function variation is associated with reduced remnant cholesterol and lower LDL-C [18,19]. APOC2 is required for LPL activation and efficient TRL lipolysis, a prerequisite for remnant clearance and subsequent LDL particle generation [20]. These opposing roles support a model in which genetic differences in TRL processing modulate LDL-C response. Given that diets rich in monounsaturated and polyunsaturated fatty acids upregulate LPL activity [21], we propose that genetic variation in APOC2 and APOC3 may modulate the magnitude of this diet-induced increase in lipoprotein flux.
Study Design and Analytical Strategy
To maximize discovery, we employed biologically informed hypothesis restriction [24], prioritizing functional pathway coherence over binary significance thresholds [25]. Because baseline lipid levels are already determined by a participant’s genetic profile, treating them as a control variable introduces collider bias. Effectively, adjusting for baseline removes the very genetic pathway we aim to observe, potentially masking or distorting the true gene–diet interaction signal [26,27]. This rigorous statistical approach, supported by high-depth exome sequencing (mean 111.9×), ensures that identified signals reflect genuine biological variation rather than technical artifacts.
Strengths and Limitations
This study combines deep genetic data with a controlled dietary intervention and a biologically informed analytical framework, enabling the investigation of genetic modifiers of lipid response. The use of both exploratory genome-wide screening and process-focused gene prioritization represents a balanced strategy that emphasizes biological coherence while avoiding overinterpretation of single-variant associations. Several limitations should be acknowledged. Dietary exposure was assessed within a clinical intervention setting rather than through detailed quantitative intake measures, and the cohort composition limits inference beyond the studied population. As a result, the identified associations should be interpreted as hypothesis-generating.
5. Conclusions
In conclusion, this study indicates that genetic modulation of lipid responses to dietary intervention is characterized by modest, distributed effects that align with biologically coherent processes rather than single high-impact variants. By integrating exploratory genome-wide analyses with process-focused gene prioritization, we demonstrate a pragmatic framework for interpreting nutrigenomic intervention data under realistic constraints. These findings emphasize the value of biologically informed approaches for advancing our understanding of inter-individual dietary response. Future studies with larger, more ancestrally diverse cohorts and precise dietary intake quantification will be essential for replicating and refining these findings. Ultimately, such work could inform the development of genetically guided dietary recommendations.
Supplementary Materials
The following supporting information can be downloaded at the website of this paper posted on Preprints.org, Figure S1: Population structure and assessment of lipid response confounders; Table S1: Linear model coefficients; Table S2: Top single-variant associations for ΔLDL-C (top 20); Table S3: Top single-variant associations for ΔTAG (top 20). Supplementary Data: Excel file containing the extended top 100 genome-wide association signals and full targeted gene analysis results (Sheets 1–4).
Author Contributions
Conceptualization, S.I., N.C., R.S., V.L. and Z.K.; methodology, S.I., N.C., R.S. and V.L.; software, S.I. and V.L.; validation, S.I., N.C., R.S. and V.L.; formal analysis, S.I., N.C. and V.L.; investigation, S.I., N.C. and D.A.; resources, S.I., N.C. and D.A.; data curation, S.I., N.C. and D.A.; writing—original draft preparation, S.I., N.C. and M.K.; writing—review and editing, M.K., V.L., R.S., D.A. and Z.K.; visualization, S.I., and V.L.; supervision, R.S., V.L. and Z.K.; project administration, S.I.; funding acquisition, S.I. All authors have read and approved the final version of the manuscript and agree to be accountable for all aspects of the work.
Funding
This work was funded by Shota Rustaveli National Science Foundation of Georgia (SRNSFG) under Grant PHDF-22-3124.
Institutional Review Board Statement
The study was conducted in accordance with the Declaration of Helsinki, and approved by the Bioethics Committee of Ilia State University (Approval No. R/215-24, 01.07.2024).
Informed Consent Statement
Informed consent was obtained from all subjects involved in the study.
Data Availability Statement
The analysis code used in this study is publicly available on GitHub (https://github.com/saba966/Nutrigen_LDL_GWAS) and archived on Zenodo (https://doi.org/10.5281/zenodo.18312269). Individual-level genomic and clinical data contain sensitive human information and are therefore not publicly available; de-identified data may be made available from the corresponding author upon reasonable request and subject to ethical approval.
Acknowledgments
During the preparation of this work, the authors used Gemini (Google) for the purpose of assisting with the generation and optimization of R code for statistical analysis. The authors have reviewed and edited the output and take full responsibility for the content of this publication.
Conflicts of Interest
The authors declare no conflicts of interest.
Abbreviations
The following abbreviations are used in this manuscript:
| LDL-C | Low-Density Lipoprotein Cholesterol |
| TAG | Triglycerides |
| GWAS | Genome-Wide Association Study |
| WES | Whole-Exome Sequencing |
| LD | Linkage Disequilibrium |
| FDR | False Discovery Rate |
| MAF | Minor Allele Frequency |
| PCA | Principal Component Analysis |
| QC | Quality Control |
| Quantile-Quantile | |
| TRL | Triglyceride-Rich Lipoprotein |
| LPL | Lipoprotein Lipase |
References
- Delgado-Lista, J.; Alcala-Diaz, J.F.; Torres-Peña, J.D.; Quintana-Navarro, G.M.; Fuentes, F.; Garcia-Rios, A.; Ortiz-Morales, A.M.; I Perez-Caballero, A.; Yubero-Serrano, E.M.; A Rangel-Zuñiga, O.; et al. Long-term secondary prevention of cardiovascular disease with a Mediterranean diet and a low-fat diet (CORDIOPREV): a randomised controlled trial. Lancet 2022, 399, 1876–1885. [CrossRef]
- Estruch, R.; Ros, E.; Salas-Salvadó, J.; Covas, M.-I.; Corella, D.; Arós, F.; Gómez-Gracia, E.; Ruiz-Gutiérrez, V.; Fiol, M.; Lapetra, J.; et al. Primary Prevention of Cardiovascular Disease with a Mediterranean Diet Supplemented with Extra-Virgin Olive Oil or Nuts. N. Engl. J. Med. 2018, 378, e34. [CrossRef]
- Ordovás, J.M.; Ferguson, L.R.; Tai, E.S.; Mathers, J.C. Personalised nutrition and health. BMJ 2018, 361, k2173.
- on behalf of the Food4Me Study; Fallaize, R.; Celis-Morales, C.; Macready, A.L.; Marsaux, C.F.; Forster, H.; O’donovan, C.; Woolhead, C.; San-Cristobal, R.; Kolossa, S.; et al. The effect of the apolipoprotein E genotype on response to personalized dietary advice intervention: findings from the Food4Me randomized controlled trial. Am. J. Clin. Nutr. 2016, 104, 827–836. [CrossRef]
- Qi, Q.; Durst, R.; Schwarzfuchs, D.; Leitersdorf, E.; Shpitzen, S.; Li, Y.; Wu, H.; Champagne, C.M.; Hu, F.B.; Stampfer, M.J.; et al. CETP genotype and changes in lipid levels in response to weight-loss diet intervention in the POUNDS LOST and DIRECT randomized trials. J. Lipid Res. 2015, 56, 713–721. [CrossRef]
- Rudkowska, I.; Dewailly, E.; Hegele, R.A.; Boiteau, V.; Dubé-Linteau, A.; Abdous, B.; Giguere, Y.; Chateau-Degat, M.-L.; Vohl, M.-C. Gene–diet interactions on plasma lipid levels in the Inuit population. Br. J. Nutr. 2012, 109, 953–961. [CrossRef]
- Rajendiran, E.; Lamarche, B.; She, Y.; Ramprasath, V.; Eck, P.; Brassard, D.; Gigleux, I.; Levy, E.; Tremblay, A.; Couture, P.; et al. A combination of single nucleotide polymorphisms is associated with the interindividual variability in the blood lipid response to dietary fatty acid consumption in a randomized clinical trial. Am. J. Clin. Nutr. 2021, 114, 564–577. [CrossRef]
- Sirugo, G.; Williams, S.M.; Tishkoff, S.A. The Missing Diversity in Human Genetic Studies. Cell 2019, 177, 26–31. [CrossRef]
- Wang, K.; Li, M.; Hakonarson, H. ANNOVAR: Functional annotation of genetic variants from high-throughput sequencing data. Nucleic Acids Res. 2010, 38, e164. [CrossRef]
- Chang, C.C.; Chow, C.C.; Tellier, L.C.; Vattikuti, S.; Purcell, S.M.; Lee, J.J. Second-generation PLINK: rising to the challenge of larger and richer datasets. GigaScience 2015, 4, 7. [CrossRef]
- Dowle, M.; Srinivasan, A. data.table: Extension of data.frame; R package version 1.16.4; 2024, .
- Durinck, S.; Spellman, P.T.; Birney, E.; Huber, W. Mapping identifiers for the integration of genomic datasets with the R/Bioconductor package biomaRt. Nat. Protoc. 2009, 4, 1184–1191. [CrossRef]
- Turner, S.D. qqman: an R package for visualizing GWAS results using Q-Q and manhattan plots. J. Open Source Softw. 2018, 3. [CrossRef]
- Manichaikul, A.; Mychaleckyj, J.C.; Rich, S.S.; Daly, K.; Sale, M.; Chen, W.-M. Robust relationship inference in genome-wide association studies. Bioinformatics 2010, 26, 2867–2873. [CrossRef]
- Simes, R.J. An improved Bonferroni procedure for multiple tests of significance. Biometrika 1986, 73, 751–754.
- Benjamini, Y.; Heller, R. Screening for Partial Conjunction Hypotheses. Biometrics 2008, 64, 1215–1222. [CrossRef]
- San-Cristobal, R.; Navas-Carretero, S.; Milagro, F.I.; Martinez, J.A. Beyond candidate genes: Limitations and future directions of nutrigenetic research in complex metabolic diseases. Genes Nutr. 2022, 17, 30.
- Borén, J.; Adiels, M.; Packard, C.J. APOC3 and the regulation of triglyceride-rich lipoprotein metabolism: New insights from human genetics. Front. Endocrinol. 2020, 11, 474.
- Taskinen, M.R.; Adiels, M.; Westerbacka, J.; Borén, J. APOC3 loss-of-function variants reveal mechanisms of triglyceride metabolism and lipoprotein clearance. JCI Insight 2022, 7, e158184.
- Kei, A.A.; Filippatos, T.D.; Tsimihodimos, V.; Elisaf, M.S. Review article: The role of apolipoprotein C-II and apolipoprotein C-III in lipoprotein metabolism and cardiovascular disease. Clin. Biochem. 2012, 45, 16–21.
- Marette, A.; Gavino, V.C.; Nadeau, M.H. Effects of dietary saturated and polyunsaturated fats on adipose tissue lipoprotein lipase activity. Nutr. Res. 1990, 10, 683–695. [CrossRef]
- Sirinian, M.I.; Belleudi, F.; Campagna, F.; Ceridono, M. Adaptor protein ARH is recruited to the plasma membrane by LDL binding and modulates endocytosis of the LDL/LDLR complex. J. Biol. Chem. 2005, 280, 22135–22143.
- Sorrentino, V.; Nelson, J.K.; Maspero, E.; Marques, A.R.A.; Scheer, L.; Polo, S.; Zelcer, N. The LXR-IDOL axis defines a clathrin-, caveolae-, and dynamin-independent endocytic route for LDLR internalization and lysosomal degradation. J. Lipid Res. 2013, 54, 2174–2184. [CrossRef]
- Keathley, S.J.; Miller, J.D.; Vance, D.E. Biologically informed hypothesis restriction and pathway integration in nutrigenomics: Toward reproducible multi-omic models. Front. Nutr. 2021, 8, 789215.
- Kraft, P.; Zeggini, E.; Ioannidis, J.P.A. Replication in genome-wide association studies. Nat. Rev. Genet. 2009, 10, 409–420.
- Aschard, H.; Vilhjálmsson, B.J.; Joshi, A.D.; Price, A.L.; Kraft, P. Adjusting for Heritable Covariates Can Bias Effect Estimates in Genome-Wide Association Studies. Am. J. Hum. Genet. 2015, 96, 329–339. [CrossRef]
- Gauderman, W.J.; Mukherjee, B.; Aschard, H.; Hsu, L.; Lewinger, J.P.; Patel, C.J.; Witte, J.S.; Amos, C.; Tai, C.G.; Conti, D.; et al. Update on the State of the Science for Analytical Methods for Gene-Environment Interactions. Am. J. Epidemiology 2017, 186, 762–770. [CrossRef]
Figure 1.
Quantile–quantile (QQ) plots for exploratory GWAS of lipid response outcomes. ( a ) Observed versus expected −log₁₀(p) values for change in LDL-C (ΔLDL-C), showing a genomic inflation factor (λGC) of 0.992. ( b ) Observed versus expected −log₁₀(p) values for change in triglycerides (ΔTAG), showing a λGC of 0.968.
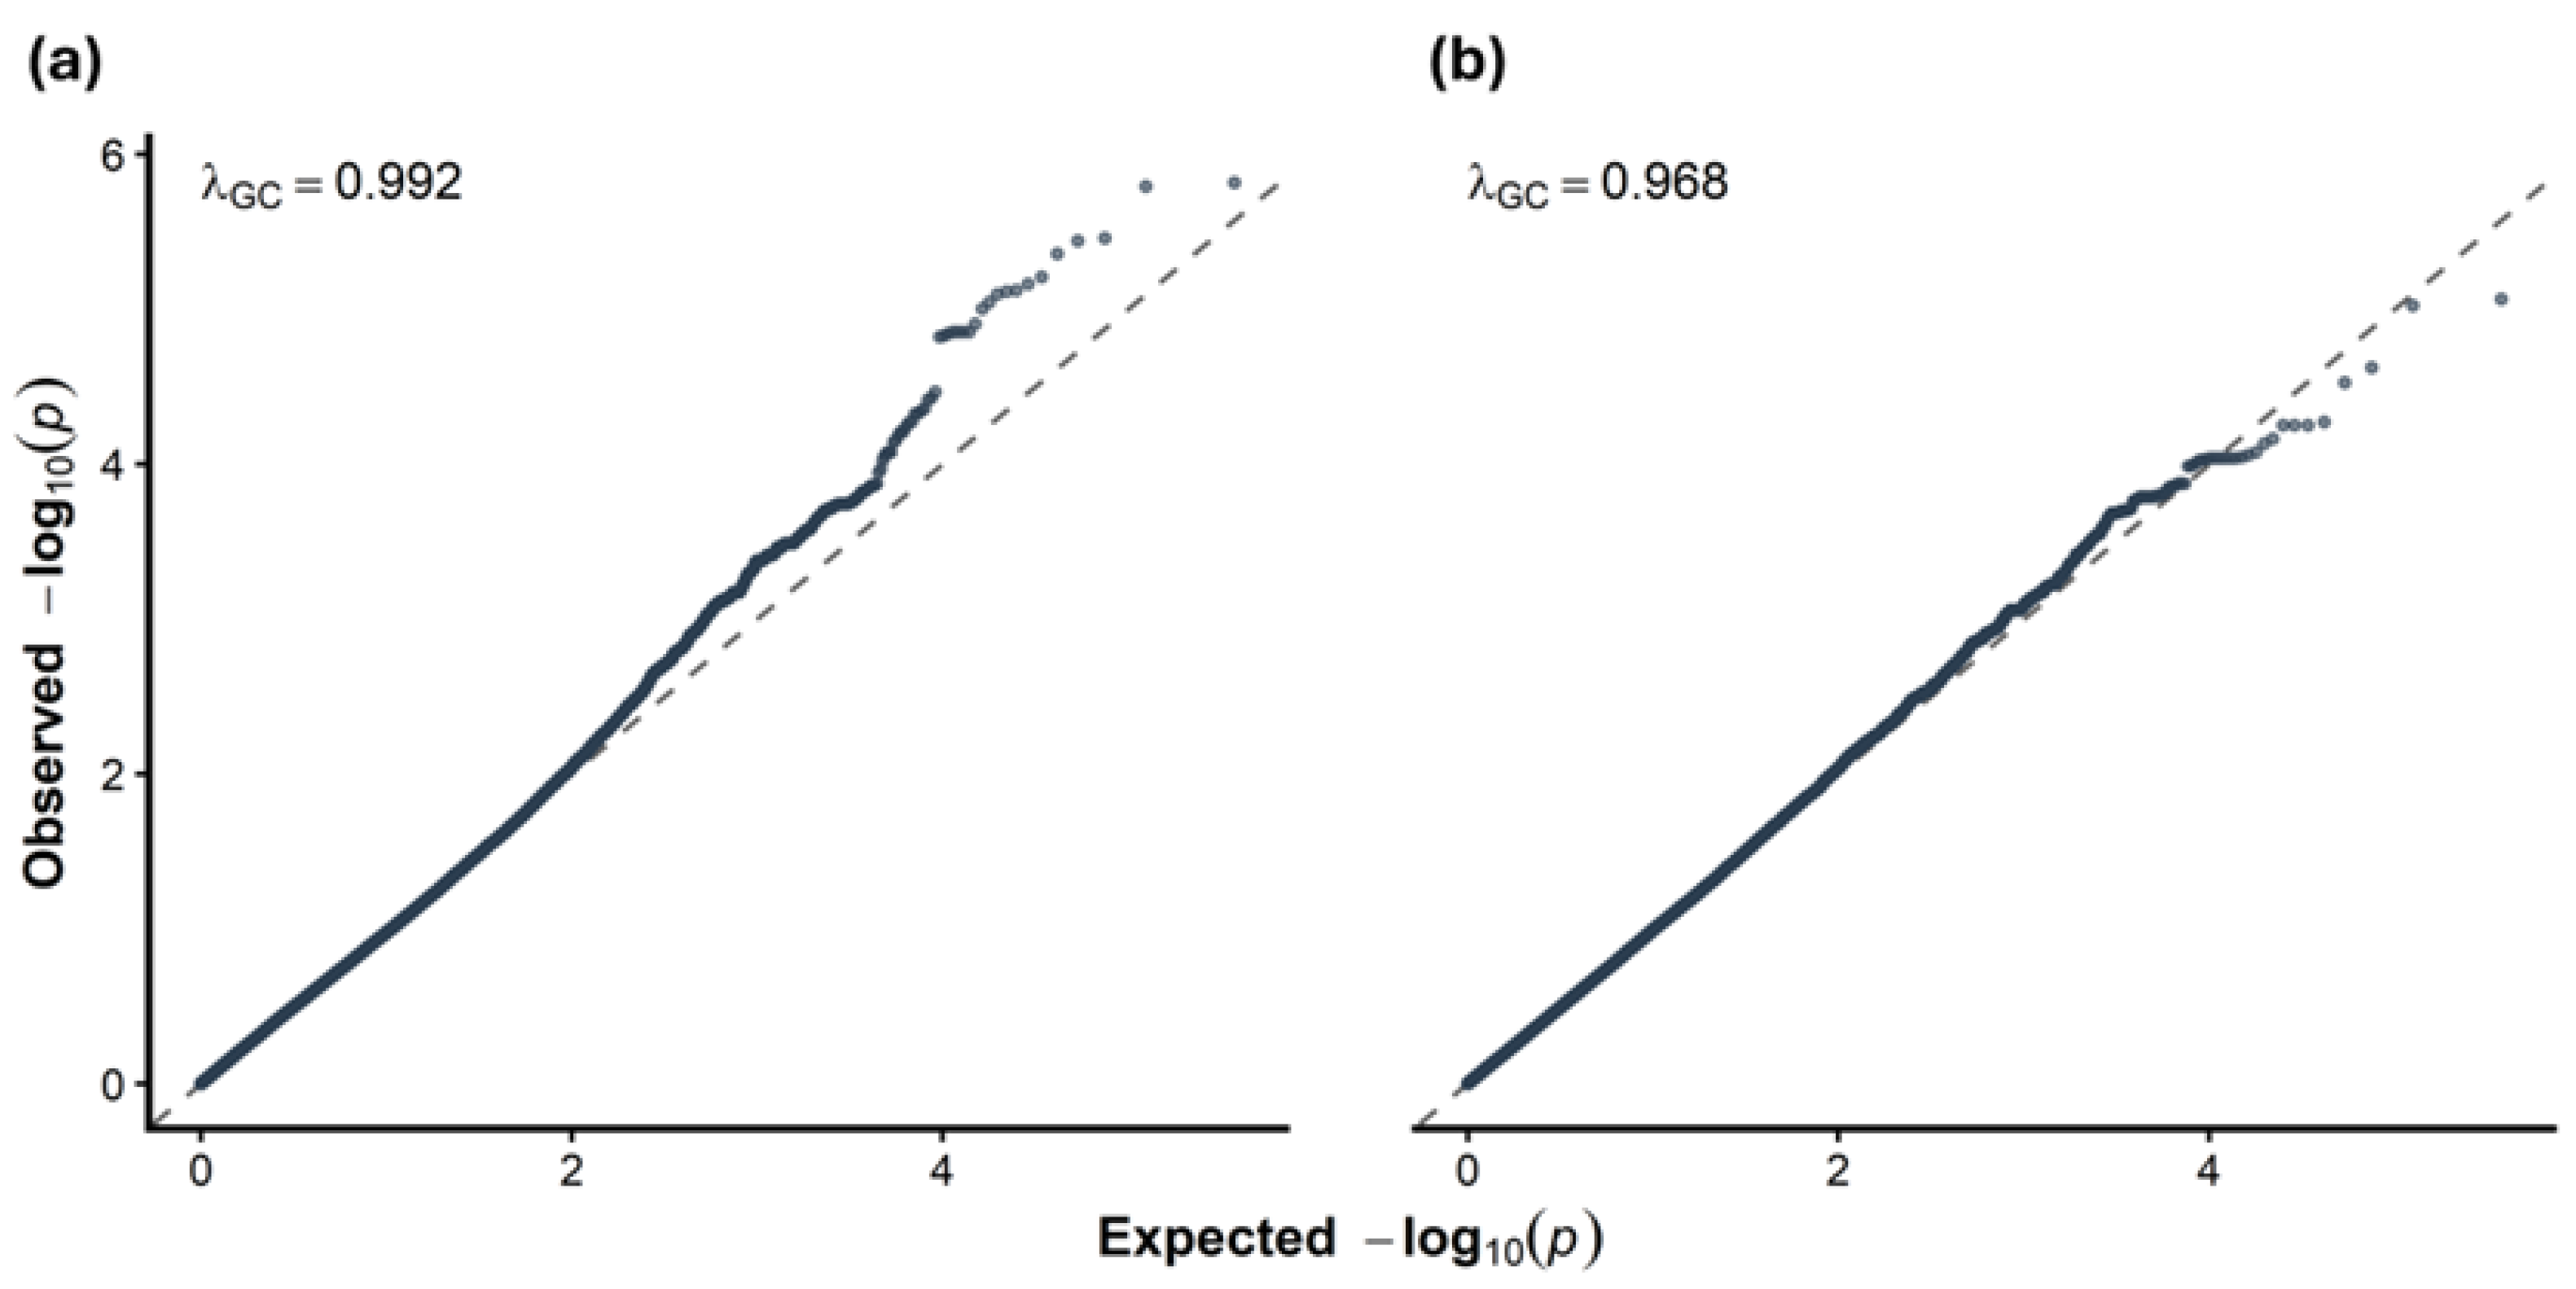
Figure 2.
Manhattan plots for the exploratory GWAS of lipid response outcomes. ( a ) Exploratory GWAS of change in LDL-C (ΔLDL-C). ( b ) Exploratory GWAS of change in triglycerides (ΔTAG). The y-axis displays the −log₁₀(p) value for each variant, and the x-axis represents the chromosomal position (autosomes 1–22). The dashed horizontal line indicates the exploratory (suggestive) significance threshold (p = 1 × 10⁻5).
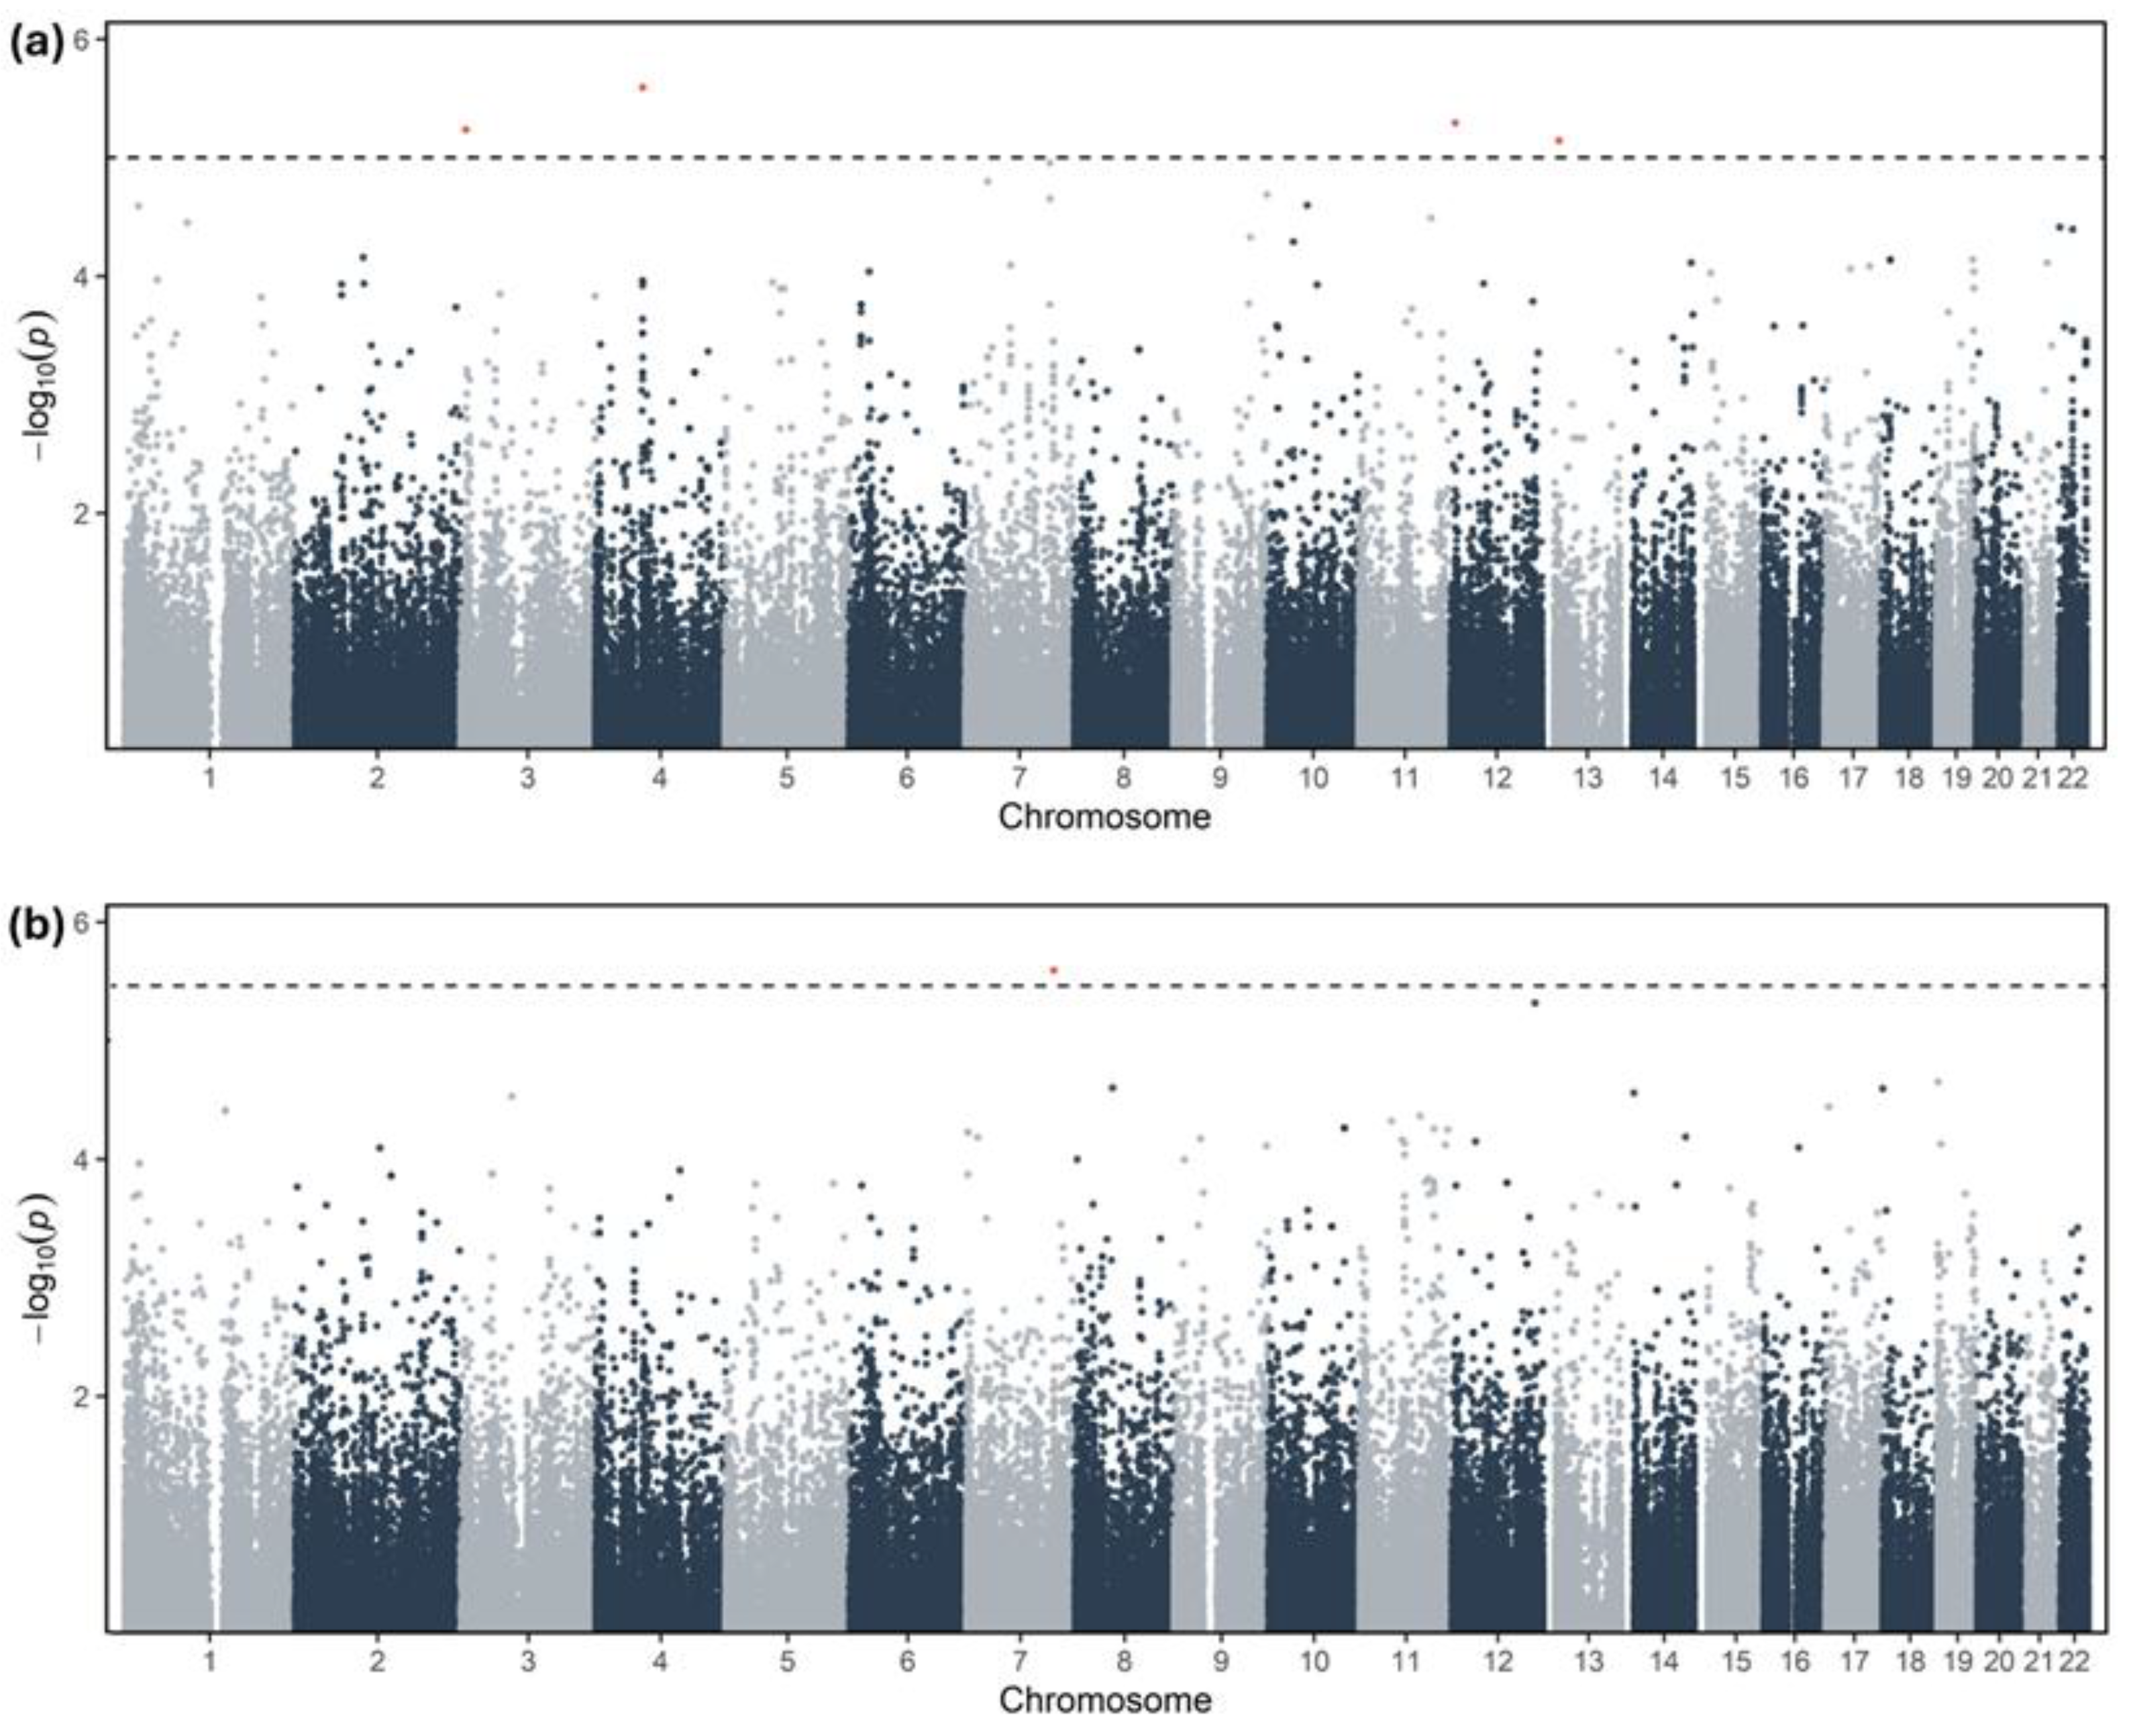
Figure 3.
Regional association signals and genotypic effects for top targeted hits. ( a ) APOC3; ( b ) APOC2; ( c ) AP2A1; ( d ) AP2A2; ( e ) A2M; ( f ) APOB. For each locus, the left panel displays boxplots of the lipid change (ΔLDL-C or ΔTAG) stratified by genotype (0 = homozygous reference, 1 = heterozygous, 2 = homozygous alternate), where diamonds represent the group mean. The right panel shows the regional association plot with the strength of association (−log₁₀p) versus genomic position. The horizontal dashed line indicates the nominal significance threshold (p < 0.05). Points are colored based on linkage disequilibrium (r2) relative to the lead variant.
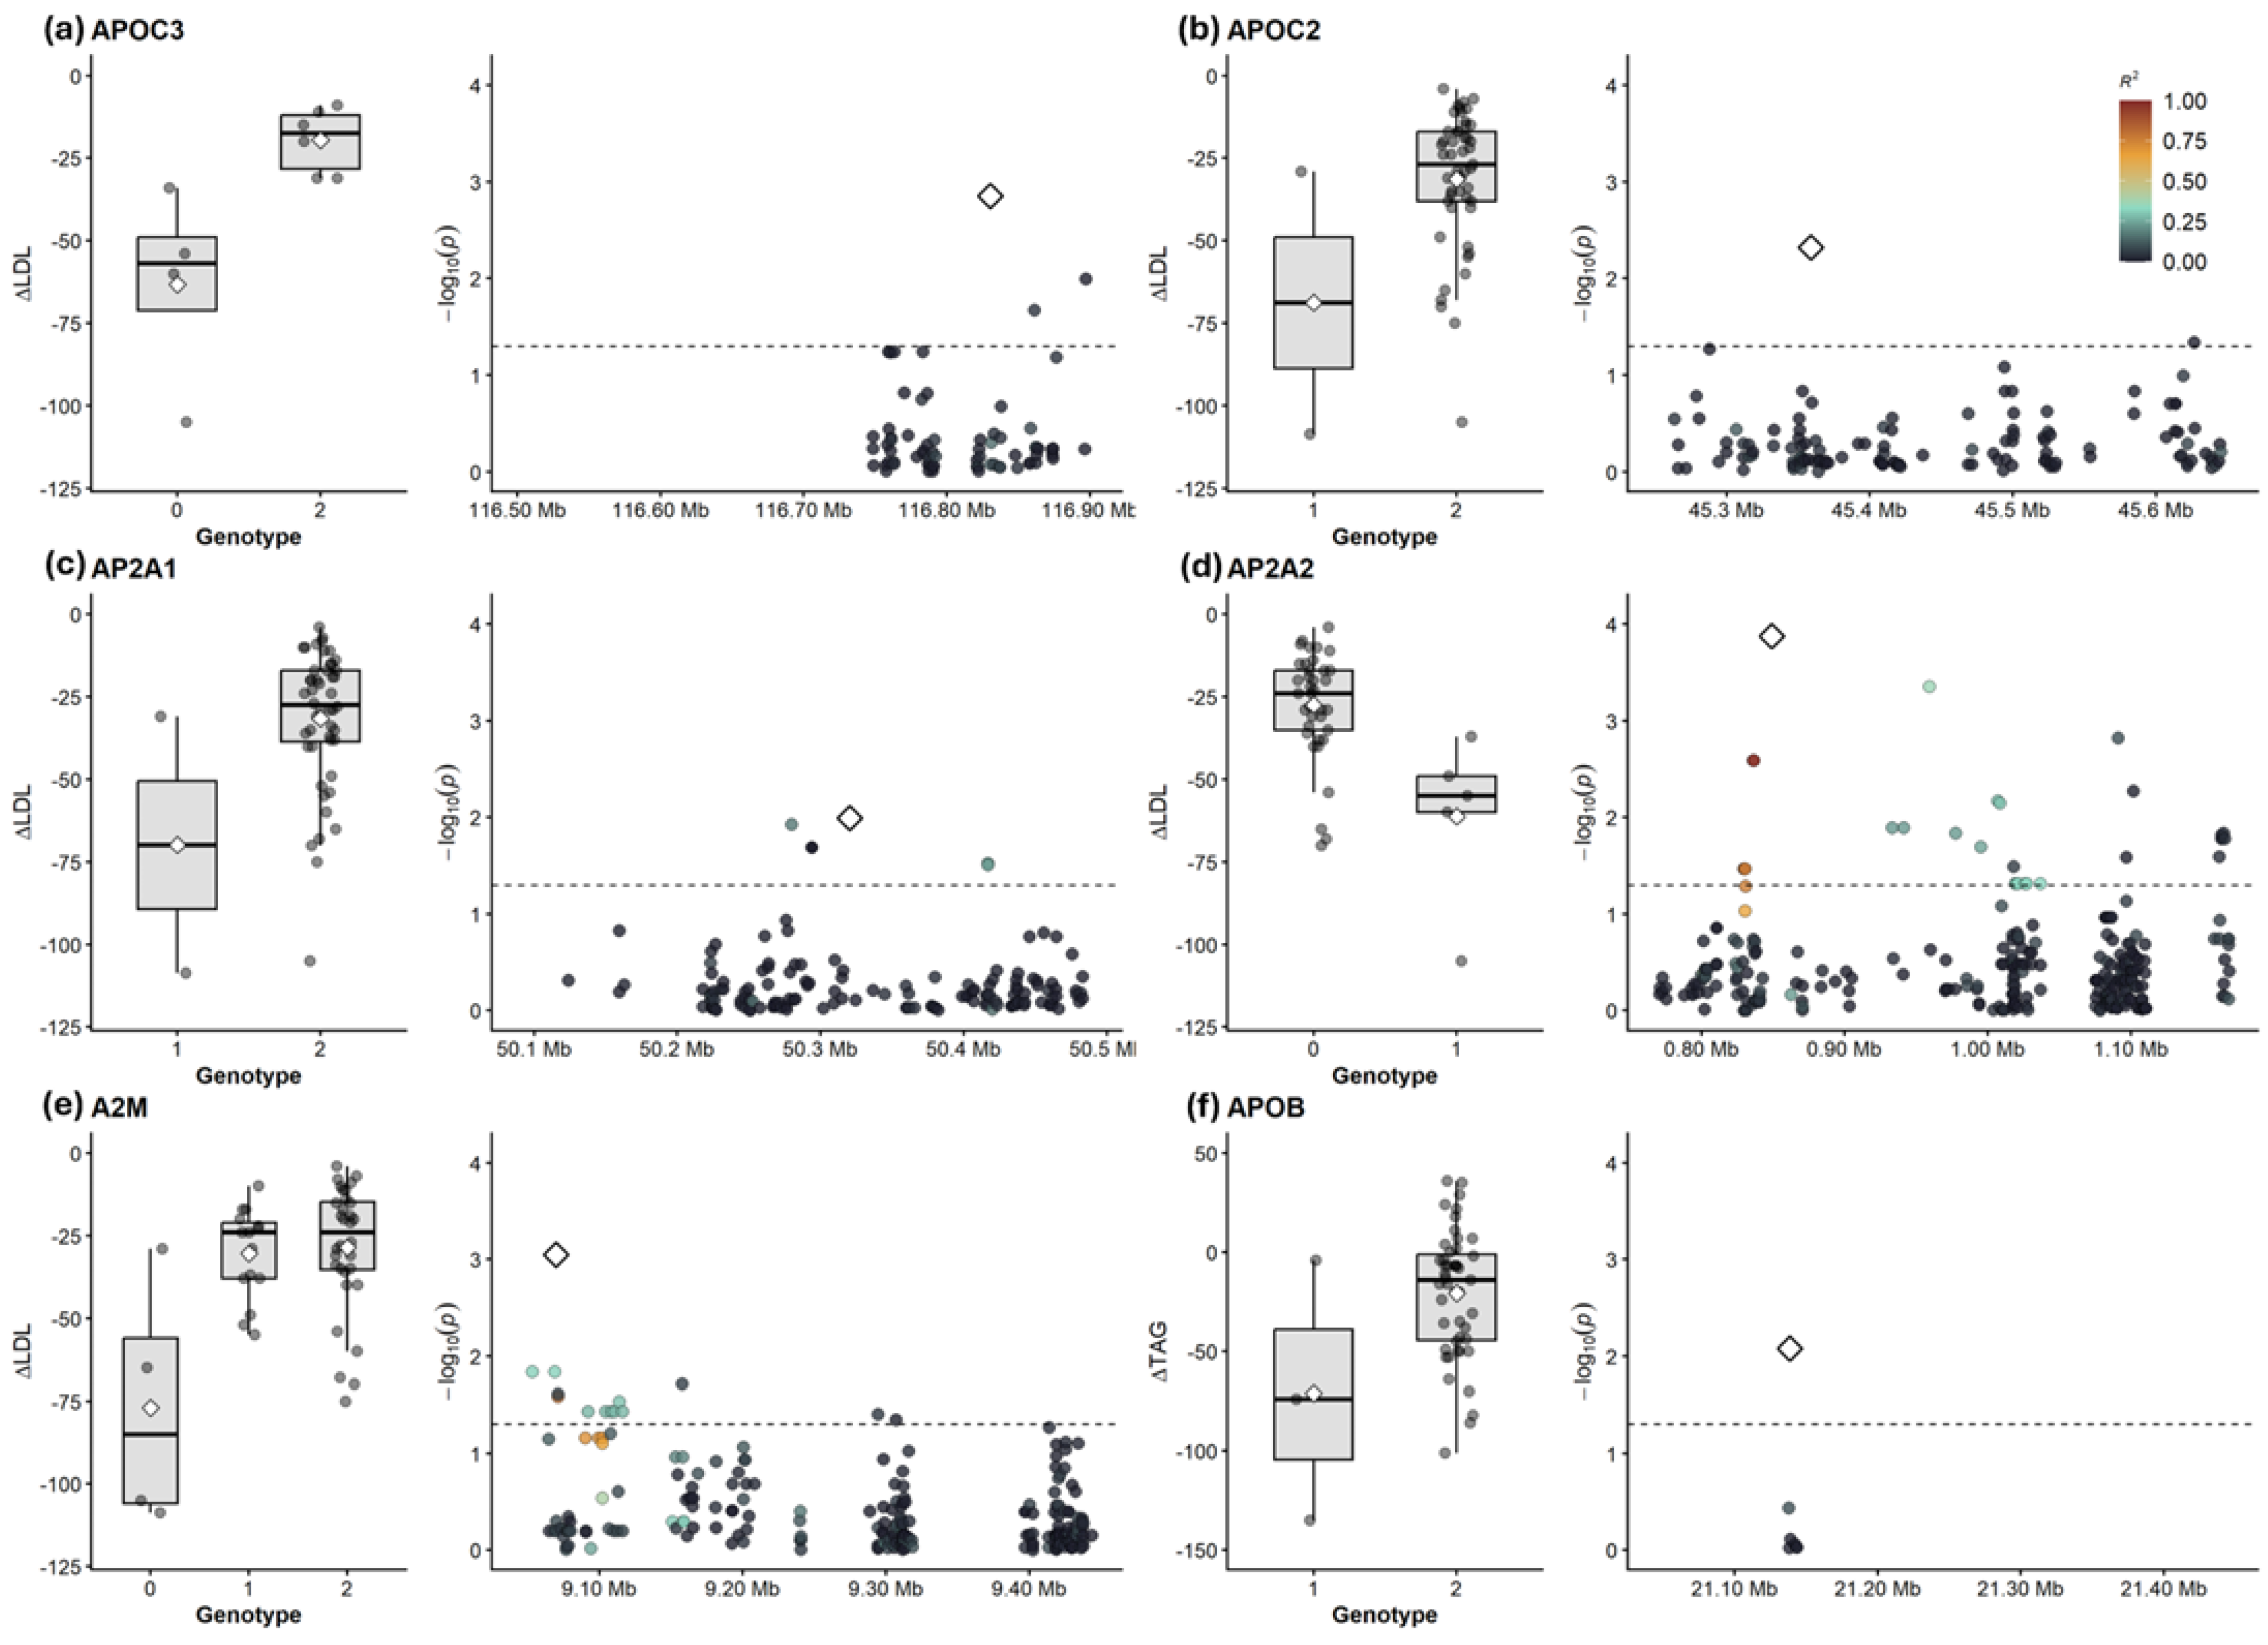

Table 1.
Baseline and Follow-Up Characteristics of Study Participants.
| Overall (N=51) | Female (N=28) | Male (N=23) | P-value | |
| Age (years) | 48.0 ± 12.7 | 50.3 ± 12.5 | 45.2 ± 12.6 | 0.158 |
| Interval (m onths) | 5.0 ± 2.2 | 4.7 ± 2.4 | 5.3 ± 1.9 | 0.308 |
| Baseline LDL-C (mg/dL) | 149.5 ± 27.4 | 149.6 ± 29.1 | 149.3 ± 25.8 | 0.975 |
| Follow-up LDL-C (mg/dL) | 116.1 ± 22.7 | 113.0 ± 21.4 | 119.9 ± 24.2 | 0.295 |
| ΔLDL-C (mg/dL) | -33.4 ± 25.1 | -36.6 ± 23.2 | -29.5 ± 27.2 | 0.328 |
| Baseline TAG (mg/dL) | 148.5 ± 67.0 | 129.4 ± 44.4 | 171.8 ± 82.2 | 0.033 |
| Follow-up TAG (mg/dL) | 130.6 ± 68.0 | 108.8 ± 37.3 | 157.2 ± 86.4 | 0.018 |
| ΔTAG (mg/dL) | -17.9 ± 57.3 | -20.6 ± 28.9 | -14.6 ± 80.2 | 0.736 |
Note: Values are reported as mean ± SD. P values are from Welch’s independent-samples t tests (female vs. male). LDL-C = low-density lipoprotein cholesterol. TAG = triglycerides.
Disclaimer/Publisher’s Note: The statements, opinions and data contained in all publications are solely those of the individual author(s) and contributor(s) and not of MDPI and/or the editor(s). MDPI and/or the editor(s) disclaim responsibility for any injury to people or property resulting from any ideas, methods, instructions or products referred to in the content. |
© 2026 by the authors. Licensee MDPI, Basel, Switzerland. This article is an open access article distributed under the terms and conditions of the Creative Commons Attribution (CC BY) license.
Copyright: This open access article is published under a Creative Commons CC BY 4.0 license, which permit the free download, distribution, and reuse, provided that the author and preprint are cited in any reuse.


