
Submitted:
21 January 2026
Posted:
22 January 2026
You are already at the latest version
Abstract
Background: Mitral annular calcification (MAC) is associated with systemic atherosclerosis and cardiometabolic risk factors. Although hematologic inflammatory indices have been reported to be correlated with MAC, whether these associations persist after accounting for the cardiometabolic context in which MAC occurs remains unclear. Methods: In a prospective, cross-sectional study of consecutive adults, patients with mild MAC were compared to those without MAC. Individuals with major inflammatory conditions, advanced chronic kidney disease, cirrhosis, malignancy, autoimmune/acute inflammatory disorders, significant valvular disease, prosthetic valves/pacing devices, psychiatric disorders, or moderate-severe MAC were excluded. C-reactive protein (CRP) and hematological inflammatory indices including neutrophil-to-lymphocyte ratio (NLR), Systemic Inflammatory Response Index (SIRI), and lymphocyte-to-leukocyte ratio (LLR) were analyzed in relation to MAC status. Results: Among 205 patients, 134 had mild MAC and 71 had no MAC. Patients with MAC were older and displayed higher cardiometabolic burden, including more frequent dysglycemia, higher blood pressure and greater adiposity. In unadjusted comparisons inflammatory markers differed by MAC status: CRP (0.31 mg/dL vs. 0.18 mg/dL, p = 0.002), NLR (2.52 vs. 1.99, p = 0.032) and SIRI (1.27 vs. 1.04, p = 0.039), and LLR (0.26 vs. 0.29, p = 0.032). In multivariable logistic regression models, none of the inflammatory markers remained independently associated with MAC. In contrast, age (ORs 1.056 - 1.063 per year increase, p ≤ 0.001), prediabetes (ORs 2.43 - 3.63, p ≤ 0.001) and type 2 diabetes (OR 5.91 and 6.19, p ≤ 0.001) demonstrate consistent independent associations with MAC across all models. Conclusions: In this cardiometabolic population with mild MAC, inflammatory indices showed unadjusted differences but no independent associations with MAC after comprehensive cardiometabolic adjustment. These findings are most compatible with inflammatory markers primarily reflecting the cardiometabolic milieu in which MAC occurs rather than representing MAC-specific processes. Age and glucose metabolism abnormalities emerged as the dominant independent factors associated with mild MAC reinforcing the central role of metabolic disfunction in MAC pathogenesis.
Keywords:
mitral annular calcification
; inflammation
; cardiovascular disease
; cardiometabolic syndrome
; diabetes
; prediabetes
; neutrophil-to-lymphocyte ratio
1. Introduction
Mitral annular calcification (MAC) is increasingly recognized as more than a localized degenerative process and is strongly associated with systemic atherosclerosis [1,2,3]. Both conditions share common cardiovascular risk factors such as age, obesity, type 2 diabetes (T2D), dyslipidemia, and hypertension. Pathological and clinical studies have shown that MAC frequently coexists with carotid atherosclerosis, coronary artery disease, and aortic atherosclerosis, suggesting that MAC may represent a cardiac manifestation of systemic vascular pathology [4,5,6,7,8,9].
Systemic inflammation (SI) is a key mechanism linking traditional cardiovascular risk factors to atherosclerosis and may also contribute to the development of MAC, by promoting leukocyte recruitment, cytokine release, and vascular smooth muscle cell apoptosis, which together facilitate calcium deposition within the fibrous cardiac skeleton [10,11]. However, current evidence does not clearly establish whether inflammatory activity contributes directly to MAC formation, whether MAC itself triggers a SI response, or whether both processes arise predominantly from shared cardiometabolic determinants [12].
In this context, hematological inflammatory markers such as the neutrophil-to-lymphocyte ratio (NLR) and platelet-to-lymphocyte ratio (PLR) have gained increasing attention due to their accessibility, low cost, and established role as indicators of low-grade SI. NLR has already been shown to correlate with CV morbidity, arterial calcification, and adverse outcomes in various clinical settings [10,13,14]. Other composite scores like SI Response Index (SIRI) and the Systemic Immune-Inflammation Index (SII) have been linked to atherosclerosis and cardiometabolic risk. These markers capture low-grade, subclinical SI using routinely available parameters and are increasingly used in cardiovascular research [15,16,17,18].
Although prior studies have reported associations between MAC and inflammatory markers such as NRL and PLR, these findings were largely derived from populations characterized by advanced age and a high burden of cardiometabolic comorbidities, conditions linked to chronic low-grade inflammation [10,19]. As a result, it remains unclear whether these associations reflect inflammatory processes specific to MAC or rather the broader inflammatory profile accompanying cardiometabolic disease. Therefore, the present study aimed to evaluate the relationship between MAC and CRP and selected hematologic inflammatory indices (like NRL, SIRI, and LLR) in patients with cardiometabolic factors, within the cardiometabolic context in which MAC occurs.
2. Materials and Methods
2.1. Study Population and Design
This was a prospective, cross-sectional observational study conducted in the Internal Medicine Clinic of Saint Spiridon County Clinical Emergency Hospital, Iasi, Romania. During the study period (March 2023-August 2024), all consecutive adult patients (≥ 18 years) attending the clinic for cardiology consultation routinely underwent transthoracic echocardiography as part of standard care, regardless of the underlying diagnosis. From this consecutive series, patients were initially screened for the presence or absence of MAC on two-dimensional echocardiography.
Patients were excluded if they were unable to provide informed consent or if they had hemodynamically significant valvular heart disease (> moderate mitral or aortic regurgitation or stenosis), prosthetic heart valves, temporary or permanent cardiac pacing devices, or a documented psychiatric disorder. To reduce the confounding impact of major SI conditions on hematologic indices and to better characterize low-grade inflammation, individuals with advanced chronic kidney disease (< 30 mL/min/1,73 m2), liver cirrhosis, active malignancy, chronic hematologic disorders, acute inflammatory conditions, or autoimmune diseases were also excluded. Patients with moderate to severe MAC were not included to ensure a homogeneous study population and to avoid the potential hemodynamic consequences of advanced annular calcification on inflammatory markers. Accordingly, the analysis was restricted to patients with mild MAC and those without MAC, allowing a focused evaluation of the relation between early MAC and hematological inflammatory indices in a cardiometabolic risk context.
2.2. Clinical and Laboratory Assessment
Participants underwent a standardized clinical evaluation, including demographic information (age, sex, residential area), cardiovascular history, comorbidities (hypertension, T2D, prediabetes, dyslipidemia, hepatic steatosis, heart failure, atrial fibrillation, prior myocardial infarction, prior stroke), and lifestyle factors (smoking status).
Fasting venous blood samples were obtained from the antecubital vein after a 12-hour fast using standard sterile technique. Hematological parameters were measured from EDTA-anticoagulated samples, while biochemical analyses were performed using routine laboratory methods. Renal function was assessed by estimating glomerular filtration rate (eGFR) using the CKD-EPI equation.
Inflammation-related indices were derived from complete blood count parameters, including NLR, PLR, neutrophil-to-monocyte ratio (NMR), lymphocyte-to-leukocyte ratio (LLR). Two composite indices were also calculated: SIRI, calculated as (neutrophils x monocytes) / lymphocytes, and SII, defined as (neutrophils x platelets) / lymphocytes. These indices were selected due to their availability from routine testing and their established use as markers of low-grade SI in cardiovascular and cardiometabolic research.
Heart failure was defined according to ESC criteria (typical symptoms/signs, elevated natriuretic peptides, and structural or functional cardiac abnormalities) [20]. Both preserved ejection fraction and reduced ejection fraction phenotypes were included. Glucose metabolism status was defined according to contemporary guidelines, with T2D diagnosed by a documented history, fasting plasma glucose ≥ 126 mg/dL, HbA1c ≥ 6.5%, or glucose-lowering treatment. Prediabetes was defined as fasting plasma glucose 100-125 mg/dL and/or HbA1c 5.7-6.4%, in the absence of antidiabetic treatment. Hepatic steatosis was diagnosed by abdominal ultrasonography, based on increased liver echogenicity compared with the renal cortex and vascular blurring.
2.3. Echocardiographic Evaluation and MAC Definition
All patients underwent comprehensive transthoracic echocardiographic evaluation using a Samsung ultrasound system (Samsung Medison, Seoul, South Korea) in accordance with current recommendations. Standard M-mode, two-dimensional, and Doppler imaging techniques were applied. Left ventricular end-systolic and end-diastolic volumes, as well as ejection fraction (LVEF) were calculated using the biplane Simpson’s method from apical four-chamber and apical two-chamber views. Left atrial volumes were assessed according to current echocardiographic recommendations. Valvular regurgitation and stenosis were evaluated using color Doppler imaging, complemented by pulsed- and continuous-wave Doppler recordings.
All examinations were performed by a single experienced operator to minimize interobserver variability, and each measurement was obtained twice in the same view to reduce intraobserver variability.
MAC was defined as a localized, highly echogenic structure at the junction between the atrioventricular groove and the base of the mitral valve leaflets, visualized consistently in the parasternal long-axis, parasternal short-axis, and apical four-chamber views. Only mild MAC was considered for analysis, defined as a focal calcific deposit with maximal thickness < 5 mm, involving less than 1/3 of the annular circumference and confined to the annulus, without extension into the left ventricular inflow tract or extension onto the leaflets or adjacent myocardium. Calcification thickness was measured from the leading to the trailing edge at the site of greatest echodensity.
2.4. Ethical Considerations
The study protocol was approved by the Ethics Committee of the Saint Spiridon Emergency Clinical Hospital (no. 28/9 March 2023) and by the Ethics Committee of the Grigore T. Popa University of Medicine and Pharmacy, Iasi (no. 303/16 May 2023). All participants provided informed consent prior to enrollment, in accordance with the principles of the Declaration of Helsinki.
2.5. Statistical Analysis
Statistical analyses were performed using IBM SPSS Statistics version 29.0 (IBM Corp., Armonk, NY, USA). Data distribution was assessed using the Shapiro-Wilk test. Continuous variables are presented as mean ± standard deviation for normally distributed variables and as median with interquartile range (IQR) for non-normally distributed variables. Categorical variables are expressed as frequencies and percentages. Group comparisons between patients with and without MAC were conducted using appropriate parametric and non-parametric tests: the independent samples t-test for normally distributed continuous variables and the Mann-Whitney U test for non-normal variables. Categorical variables were compared using the chi-square (χ2) test. Trends toward significance were noted for p-values between 0.05 and 0.10. Receiver operating characteristic (ROC) curve analysis was used to descriptively assess the ability of inflammatory markers to differentiate between patients with and without MAC, with calculation of the area under the curve (AUC) and corresponding 95% confidence intervals (CI). Correlations between inflammatory markers and selected clinical and cardiometabolic variables were evaluated using Spearman’s rank correlation coefficients. Multivariable binary logistic regression analyses were performed to assess the assciation between inflammatory markers and MAC after accounting for relevant cardiometabolic and clinic covariates. Results are reported as odds ratios (ORs) with 95% concidence intervals (CI). Model calibration was assessed using the Hosmer-Lemeshow goodness-of-fit test. All test were two-sided, and a p value < 0.05 was considered statistically significant.
3. Results
After applying the including and exclusion criteria, 205 patients were retained for analysis, comprising 134 individuals with mild MAC and 71 individuals without MAC, who formed the MAC and non-MAC groups (Figure 1). The results below summarize clinical and cardiometabolic characteristics followed by the relationship between MAC and inflammatory indices.
3.1. Baseline Characteristics of the Study Population
Baseline clinical, cardiovascular, cardiometabolic, echocardiographic and laboratory characteristics stratified by MAC status are summarized in Table 1. Patients with MAC were significantly older than those without MAC (66.5 vs. 65.0 years, p < 0.001) and exhibited a higher systolic BP (149.1 ± 22.3 mmHg vs. 138.1 ± 17.8 mmHg, p < 0.001), as well as a marked prevalence of arterial hypertension (96.3% vs. 69.0%, p < 0.001). Measures of adiposity, including waist circumference (103.0 cm vs. 97.0 cm, p = 0.021) and BMI (30.7 ± 5.5 kg/m2 vs. 28.7 ± 5.3 kg/m2, p = 0.013) were also significantly greater in the MAC group, while sex distribution and smoking status did not differ between groups (p = 0.203, respectively p = 0.365).
From a cardiometabolic perspective, disturbances in glucose metabolism were more frequent among patients with MAC, with higher prevalence of both prediabetes (54.5% vs. 43.7%, p = 0.004) and T2D (16.4% vs. 5.6%, p = 0.004). Heart failure was substantially more common in the MAC group (91% vs. 53.5%, p < 0.001), whereas the prevalence of coronary artery disease and atrial fibrillation was comparable between groups.
Echocardiographic assessment revealed significant differences in patients with MAC, including increased interventricular septum thickness (p = 0.049), larger left atrial volume (p < 0.001), greater right atrial diameter (p = 0.030), and increased right ventricular basal diameter (p = 0.014). LVEF did not differ between groups, while left ventricular volumes showed only borderline differences.
Laboratory analyses demonstrated higher levels of HbA1c (5.85% vs. 5.60%, p < 0.001), triglycerides (113.5 mg/dL vs. 81.0 mg/dL, p < 0.001), and NT-proBNP (116.0 pg/mL vs. 85.0 pg/mL, p = 0.031) in the MAC group, accompanied by lower HDL-cholesterol concentrations (45.0 mg/dL vs. 53.0 mg/dL, p < 0.001). Renal function, assessed by eGFR, as well as LDL-cholesterol and global hematological parameters, including hemoglobin, total leukocyte count, and platelet count, were similar between groups.
Inflammatory indices (Figure 2) showed modest but statistically significant differences between patients with and without MAC. Patients with MAC exhibited higher NLR (2.52 vs. 1.99, p = 0.032) and SIRI values (1.27 vs. 1.04, p = 0.039), and lower LLR values compared to those without MAC (0.26 vs. 0.29, p = 0.032). In parallel, serum CRP levels were also elevated in the MAC group (0.31 mg/dL vs. 0.18 mg/dL, p = 0.002), whereas NMR, PLR and SII did not differ significantly between groups.
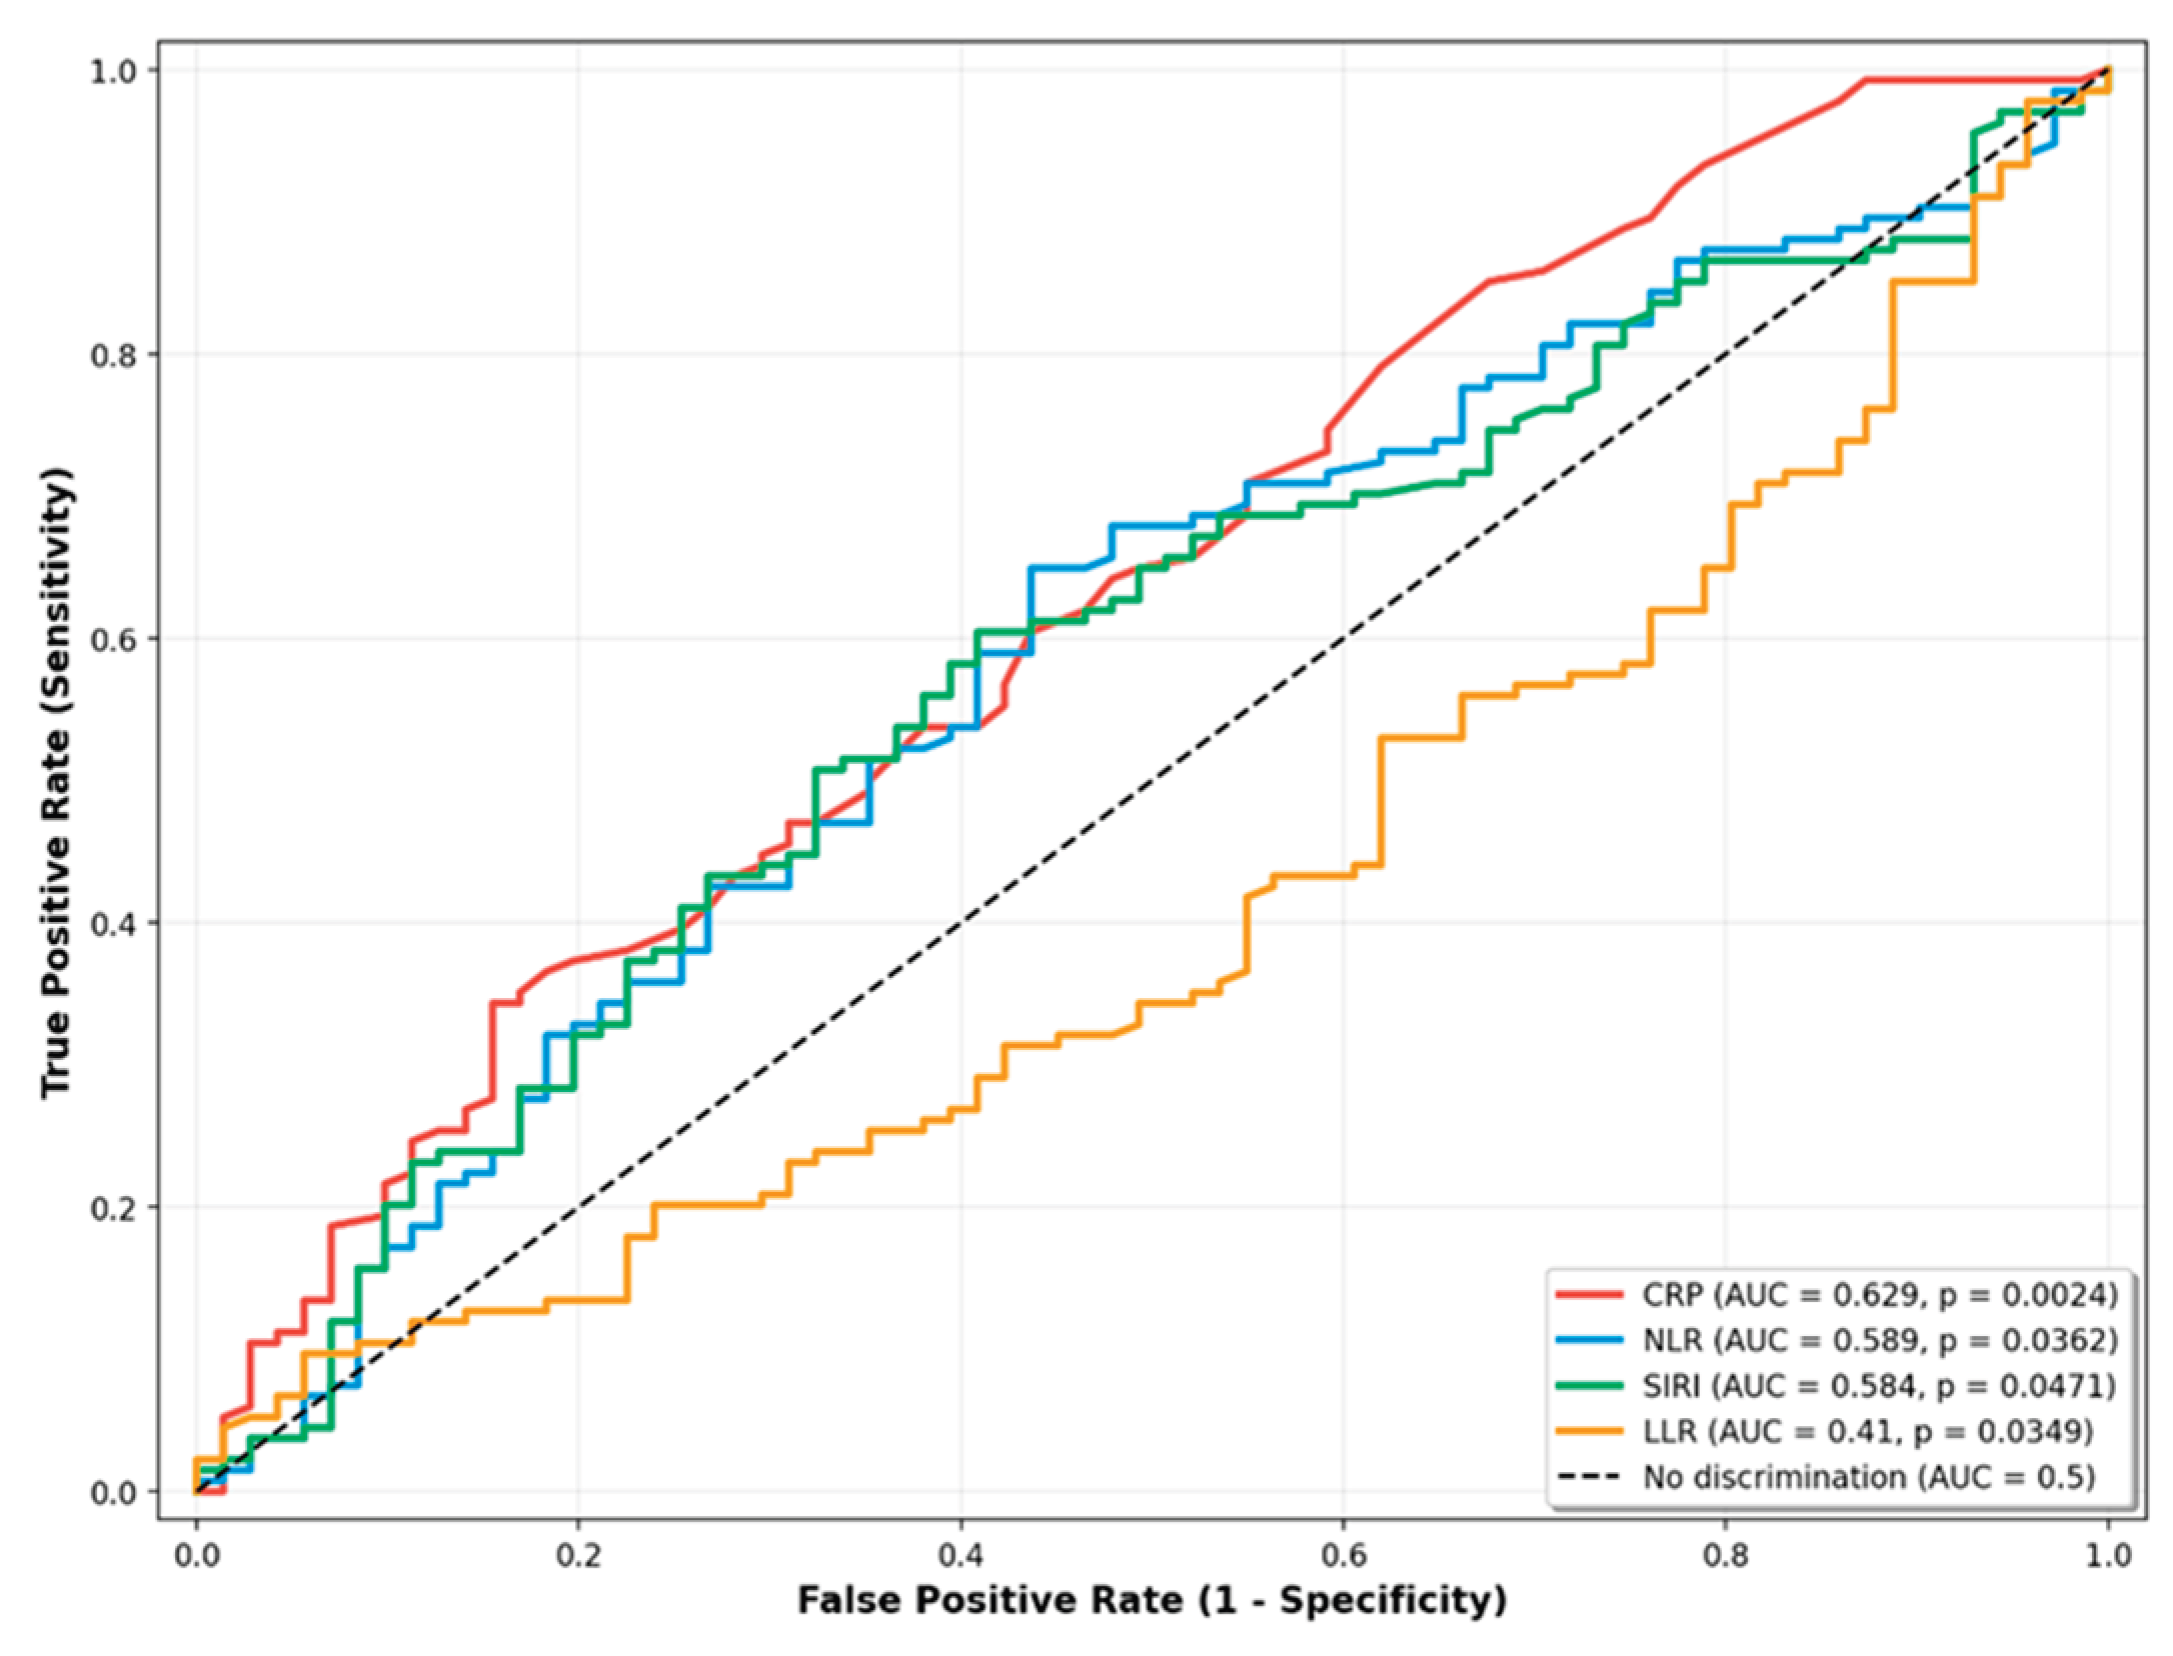
3.2. ROC Analysis of Hematological Inflammatory Markers
In ROC curve analysis CRP demonstrated the highest AUC at 0.629 (95% CI: 0.543 – 0.713), followed by NLR (AUC 0.589; 95% CI: 0.503 – 0.672), and SIRI (AUC 0.584; 95% CI: 0.500 – 0.668). In contrast, the LLR displayed an AUC below 0.5 (0.419; 95% CI: 0.330 – 0.493), consistent with lower values observed in the MAC group.
Figure 3.
ROC curves for inflammatory markers.
3.3. Inflammatory Markers in Relation to Clinical and Cardiometabolic Variables
Because inflammatory indices may be influenced by age, adiposity, glucose metabolism, cardiac dysfunction, and renal impairment, we further explored their relationship with selected clinical and biochemical variables.
Correlations between inflammatory markers and selected clinical variables are presented in Table 2. Spearman correlation analysis showed statistically significant associations between age and all four inflammatory markers, including CRP, NLR, LLR and SIRI. CRP demonstrated significant correlations with BMI, waist circumference, and NT-proBNP levels. NLR was weakly correlated with eGFR, while LLR showed a significant positive correlation with eGFR and negative correlation with age. SIRI was significantly correlated with age, NT-proBNP, and eGFR.
Given the known influence of glucose metabolism on inflammatory markers, we further examined their distribution according to glycemic status (Table 3). Median values and interquartile ranges of CRP, NLR, LLR and SIRI are shown for participants without dysglycemia, with prediabetes, and with T2D. Statistically significant differences across glycemic categories were observed for CRP, NLR and SIRI, whereas LLR showed no significant overall differences between groups.
To assess whether the associations observed in univariable analyses persisted after accounting for relevant clinical and cardiometabolic factors, multivariable logistic regression models were constructed with MAC status as dependent variable (Table 4). Each model included clinically relevant covariates selected a priori, including age, measures of adiposity, glucose metabolism status, heart failure, NT-proBNP levels, and renal function.
After adjustment, none of the inflammatory markers demonstrated a statistically significant association with the presence of MAC. In contrast, age remained significantly associated with MAC in the NLR-, LLR, and SIRI-based models, with ORs ranging from 1.056 to 1.063 per year increase (all p ≤ 0.001). Abnormalities of glucose metabolism were consistently associated with MAC, with prediabetes showing ORs between 2.43 and 3.63, and T2D between 5.91 and 6.19 across applicable models (all p ≤ 0.004). Renal function, expressed as eGFR, was additionally associated with MAC in the NLR- and SIRI-based models (OR 1.03 per 1 mL/min/1.73 m2 increase; p = 0.022 and p = 0.029, respectively).
4. Discussion
In this cross-sectional study of patients with cardiometabolic risk factors, we found that several hematological inflammatory markers (CRP, NLR, SIRI and LLR) differed between patients with and without mild MAC in unadjusted analyses. However, after accounting for age, glucose metabolism abnormalities, and other cardiometabolic factors, none of these inflammatory indices remained independently associated with MAC. In contrast, age and disturbances in glucose metabolism, particularly prediabetes and type 2 diabetes, showed consistent and strong independent associations with the presence of mild MAC.
The observed pattern of results is compatible with at least three interpretations, which our cross-sectional design cannot distinguish. First, inflammatory markers may primarily reflect the cardiometabolic burden (particularly disglycemia, obesity and their metabolic consequences) that accompanies MAC, rather than representing MAC-specific inflammatory processes. This interpretation is supported by the consistent associations we observed between inflammatory indices and cardiometabolic variables, and by the strong independent associations of MAC with age and glucose metabolism disorders. Second, both MAC and elevated inflammatory markers may be parallel consequences of shared cardiometabolic disturbances, particularly chronic hyperglycemia and insulin resistance, without one directly causing the other. Third, the absence of independent associations in multivariable models may reflect insufficient statistical power to detect modest independent effects on inflammation on MAC after adjustment for strongly correlated cardiometabolic variables. The relatively modest differences in inflammatory markers between groups suggest that any independent effect, if present, is small and would require larger samples to detect reliably.
Chronic low-grade inflammation is a well-recognized feature of T2D and the broader cardiometabolic syndrome, conditions that are strongly age-dependent and characterized by sustained exposure to hyperglycemia, excess free fatty acids and insulin resistance [21,22]. These metabolic disturbances promote inflammatory signaling within the vascular wall and have been consistently linked to both arterial and valvular calcification [22,23]. Experimental and human studies suggest that, in this metabolic context, vascular smooth muscle cells undergo phenotypic changes resembling endochondral ossification, with loss of calcification inhibitors and acquisition of osteo-chondrogenic markers [22,24].
Our findings position MAC within this spectrum of metabolically driven calcific disorders. The strong association between MAC and both prediabetes and T2D across all models, combined with the disappearance of inflammatory marker associations after adjustment, are consistent with MAC being a manifestation of chronic metabolic disease, where inflammation is a correlation of the underlying metabolic disturbance [25].
Our findings both confirm and extend previous observations. Varol et al. reported an association between NLR and MAC in a small cohort, demonstrating that NLR was significantly elevated in patients with MAC [10]. Yayla et al. reported that PLR was significantly higher in MAC and independently associated with MAC after adjusting for conventional risk factors such as age, hypertension, LDL-cholesterol, triglycerides [19]. Our study confirms unadjusted differences in inflammatory markers but found these associations did not persist after comprehensive cardiometabolic adjustments. The discrepancies may be explained by strict population selection, restriction to mild MAC, and extensive cardiometabolic adjustment, which together may have attenuated the independent inflammatory signal. In addition, the sample size may have limited the ability to detect modest inflammatory effects after full adjustment. These considerations suggest that the relationship between inflammatory markers and MAC may be complex and potentially different across disease stages, populations and levels of cardiometabolic burden.
A strength of this study is its prospective design, with systemic echocardiographic and laboratory assessment of consecutively evaluated patients, allowing consistent characterization of their cardiometabolic profile. Nevertheless, several limitations should be acknowledged. First, the cross-sectional, single-center design in a tertiary-care referred population implies potential selection bias and limits generalizability to broader settings. Second, the strict exclusion criteria and deliberate focus on mild MAC mean that patients with advanced MAC or major inflammatory comorbidities were not represented, so the findings may not apply across the full spectrum of MAC. Third, our approach was designed to capture predominantly low-grade, subclinical inflammation using simple hematological indices derived from the routine complete blood count; however, we did not assess cytokines or other molecular inflammatory markers. Therefore, the absence of independent associations should be interpreted in the context of early-stage MAC within a cardiometabolic population.
5. Conclusions
In this cross-sectional study of patients with cardiometabolic risk factors and mild MAC, we found that while inflammatory indices showed unadjusted differences between patients with and without MAC, these associations did not persist after accounting for age and metabolic factors, particularly glucose metabolism abnormalities. These findings are most compatible with inflammatory markers primarily reflecting the cardiometabolic milieu in which MAC occurs. Age and disturbances in glucose metabolism emerged as the dominant factors independently associated with MAC, reinforcing the importance of metabolic dysfunction in MAC pathogenesis. Whether targeted anti-inflammatory strategies beyond optimal metabolic control might prevent or modify MAC development remains an important unanswered question requiring prospective interventional studies.
Author Contributions
Conceptualization, P.C.M. and M.F.; methodology, A.F.O. and M.M.G.; software, C.G.D. and P.C.M.; validation, I.D.M., D.M.T., and M.F.; formal analysis, I.D.M. and O.S.; investigation, M.M.G. and P.C.M.; resources, D.E.F.; data curation, O.S. and A.O.; writing—original draft preparation, P.C.M.; writing—review and editing, O.S., M.F., and D.M.T.; visualization, A.O., O.S., and G.C.D.; supervision, I.D.M., and M.F. All authors have read and agreed to the published version of the manuscript.
Funding
This research received no external funding.
Institutional Review Board Statement
The study was conducted in accordance with the Declaration of Helsinki and approved by the Ethics Committee of the Saint Spiridon Emergency Clinical Hospital (no. 28/9 March 2023), and by the Ethics Committee of the Grigore T. Popa University of Medicine and Pharmacy, Iasi (no. 303/16 May 2023).
Informed Consent Statement
Informed consent was obtained from all subjects involved in the study.
Data Availability Statement
Data is contained within the article.
Conflicts of Interest
The authors declare no conflicts of interest.
Abbreviations
The following abbreviations are used in this manuscript:
| AUC | Area Under the Curve |
| BMI | Body Mass Index |
| BP | Blood Pressure |
| CI | Confidence Interval |
| CRP | C-Reactive Protein |
| EDTA | Ethylenediaminetetraacetic Acid |
| HbA1c | Hemoglobin A1c (Glycated Hemoglobin) |
| hs-CRP | High-Sensitivity C-Reactive Protein |
| IQR | Interquartile Range |
| LLR | Lymphocyte-to-Leukocyte Ratio |
| LVEF | Left Ventricular Ejection Fraction |
| MAC | Mitral Annular Calcification |
| NLR | Neutrophil-to-Lymphocyte Ratio |
| NMR | Neutrophil-to-Monocyte Ratio |
| NTproBNP | N-Terminal Pro-B-Type Natriuretic Peptide |
| NYHA | New York Heart Association |
| PLR | Platelet-to-Lymphocyte Ratio |
| ROC | Receiver Operating Characteristic |
| SD | Standard Deviation |
| SIRI | Systemic Inflammation Response Index |
| SII | Systemic Immune-Inflammation Index |
| SI | Systemic Inflammation |
| SPSS | Statistical Package for the Social Sciences |
| T2D | Type 2 Diabetes |
References
- Abramowitz, Y.; Jilaihawi, H.; Chakravarty, T.; Mack, M.J.; Makkar, R.R. Mitral Annulus Calcification. J Am Coll Cardiol 2015, 66, 1934–1941. [Google Scholar] [CrossRef]
- Cavalcanti, L.R.P.; Sá, M.P.B.O.; Perazzo, Á.M.; Escorel Neto, A.C.; Gomes, R.A.F.; Weymann, A.; Zhigalov, K.; Ruhparwar, A.; Lima, R.C. Mitral Annular Calcification: Association with Atherosclerosis and Clinical Implications. Curr Atheroscler Rep 2020, 22, 9. [Google Scholar] [CrossRef] [PubMed]
- Massera, D.; Trivieri, M.G.; Andrews, J.P.M.; Sartori, S.; Abgral, R.; Chapman, A.R.; Jenkins, W.S.A.; Vesey, A.T.; Doris, M.K.; Pawade, T.A.; et al. Disease Activity in Mitral Annular Calcification. Circ Cardiovasc Imaging 2019, 12. [Google Scholar] [CrossRef]
- Willner, N.; Burwash, I.G.; Beauchesne, L.; Chan, V.; Vulesevic, B.; Ascah, K.; Coutinho, T.; Promislow, S.; Stadnick, E.; Chan, K.L.; et al. Natural History of Mitral Annular Calcification and Calcific Mitral Valve Disease. Journal of the American Society of Echocardiography 2022, 35, 925–932. [Google Scholar] [CrossRef]
- Wang, T.K.M.; Griffin, B.P.; Xu, B.; Rodriguez, L.L.; Popovic, Z.B.; Gillinov, M.A.; Pettersson, G.B.; Desai, M.Y. Relationships between Mitral Annular Calcification and Cardiovascular Events: A Meta-analysis. Echocardiography 2020, 37, 1723–1731. [Google Scholar] [CrossRef]
- Kohsaka, S.; Jin, Z.; Rundek, T.; Boden-Albala, B.; Homma, S.; Sacco, R.L.; Di Tullio, M.R. Impact of Mitral Annular Calcification on Cardiovascular Events in a Multiethnic Community. JACC Cardiovasc Imaging 2008, 1, 617–623. [Google Scholar] [CrossRef]
- Moradi, M.; Jahromi, A.S. Prognostic Value of Mitral Annular Calcification in Coronary Atherosclerotic Disease Assessed by Coronary Computed Tomographic Angiography. Journal of Research in Medical Sciences 2024, 29. [Google Scholar] [CrossRef] [PubMed]
- Babul Mia, M.; Rezaul Karim, M.; Hossain, N.; Jahurul Haque, M.; Ahmed Chowdhury, T.; Hoque, S.; History, A. MITRAL ANNULAR CALCIFICATION: A MARKER OF SEVERE CORONARY ARTERY DISEASE IN PATIENTS UNDER 60 YEARS OLD. Med. Res. Chronicles 9 2022. [Google Scholar] [CrossRef]
- Morariu, P.C.; Tanase, D.M.; Iov, D.E.; Sîrbu, O.; Oancea, A.F.; Mircea, C.G.; Chiriac, C.P.; Baroi, G.L.; Morariu, I.-D.; Dascălu, C.G.; et al. Mitral Annular Calcification and Thromboembolic Risk. Life 2023, 13, 1568. [Google Scholar] [CrossRef] [PubMed]
- Varol, E.; Aksoy, F.; Ozaydin, M.; Erdogan, D.; Dogan, A. Association between Neutrophil–Lymphocyte Ratio and Mitral Annular Calcification. Blood Coagulation & Fibrinolysis 2014, 25, 557–560. [Google Scholar] [CrossRef] [PubMed]
- Kanjanauthai, S.; Nasir, K.; Katz, R.; Rivera, J.J.; Takasu, J.; Blumenthal, R.S.; Eng, J.; Budoff, M.J. Relationships of Mitral Annular Calcification to Cardiovascular Risk Factors: The Multi-Ethnic Study of Atherosclerosis (MESA). Atherosclerosis 2010, 213, 558–562. [Google Scholar] [CrossRef] [PubMed]
- Morariu, P.C.; Oancea, A.F.; Gosav, E.M.; Buliga-Finis, O.N.; Cuciureanu, M.; Scripcariu, D.-V.; Sirbu, O.; Godun, M.M.; Floria, D.-E.; Chiriac, P.C.; et al. Rethinking Mitral Annular Calcification and Its Clinical Significance: From Passive Process to Active Pathology. J Pers Med 2024, 14, 900. [Google Scholar] [CrossRef]
- Furman, M.I.; Gore, J.M.; Anderson, F.A.; Budaj, A.; Goodman, S.G.; Avezum, Á.; López-Sendón, J.; Klein, W.; Mukherjee, D.; Eagle, K.A.; et al. Elevated Leukocyte Count and Adverse Hospital Events in Patients with Acute Coronary Syndromes: Findings from the Global Registry of Acute Coronary Events (GRACE). Am Heart J 2004, 147, 42–48. [Google Scholar] [CrossRef] [PubMed]
- Afari, M.E.; Bhat, T. Neutrophil to Lymphocyte Ratio (NLR) and Cardiovascular Diseases: An Update. Expert Rev Cardiovasc Ther 2016, 14, 573–577. [Google Scholar] [CrossRef] [PubMed]
- He, Y.; Li, L.; Zhou, T.; Yang, H.; Liu, T.; Hu, H. Association Between Inflammation Indices Derived From Complete Blood Count and Coronary Artery Calcification. J Inflamm Res 2025, Volume 18, 3807–3816. [Google Scholar] [CrossRef]
- Fu, T.; Deng, T. Associations between Systemic Inflammation Response Index and Abdominal Aortic Calcification: A Cross-Sectional Study. Sci Rep 2025, 15, 35777. [Google Scholar] [CrossRef] [PubMed]
- Wang, H.; Huang, Z.; Wang, J.; Yue, S.; Hou, Y.; Ren, R.; Zhang, Y.; Cheng, Y.; Zhang, R.; Mu, Y. Predictive Value of System Immune-Inflammation Index for the Severity of Coronary Stenosis in Patients with Coronary Heart Disease and Diabetes Mellitus. Sci Rep 2024, 14, 31370. [Google Scholar] [CrossRef]
- Li, M.; Li, M.; Wang, Z.; Zhang, Y. The Combined Effect of the Systemic Immune-Inflammation Index and Aortic Valve Calcification on Major Adverse Cardiovascular Events in Patients with Coronary Heart Disease. J Inflamm Res 2024, Volume 17, 8375–8384. [Google Scholar] [CrossRef]
- Yayla, Ç.; Akboga, M.K.; Canpolat, U.; Gayretli Yayla, K.; Kuyumcu, M.S.; Bayraktar, F.; Suleymanoglu, M.; Aydogdu, S. The Association of the Platelet-to-Lymphocyte Ratio with Mitral Annular Calcification. Scandinavian Cardiovascular Journal 2015, 49, 351–356. [Google Scholar] [CrossRef]
- McDonagh, T.A.; Metra, M.; Adamo, M.; Gardner, R.S.; Baumbach, A.; Böhm, M.; Burri, H.; Butler, J.; Čelutkienė, J.; Chioncel, O.; et al. 2021 ESC Guidelines for the Diagnosis and Treatment of Acute and Chronic Heart Failure. Eur Heart J 2021, 42, 3599–3726. [Google Scholar] [CrossRef]
- Moreno, P.R.; Fuster, V. New Aspects in the Pathogenesis of Diabetic Atherothrombosis. J Am Coll Cardiol 2004, 44, 2293–2300. [Google Scholar] [CrossRef] [PubMed]
- Bessueille, L.; Magne, D. Inflammation: A Culprit for Vascular Calcification in Atherosclerosis and Diabetes. Cellular and Molecular Life Sciences 2015, 72, 2475–2489. [Google Scholar] [CrossRef] [PubMed]
- Donath, M.Y.; Böni-Schnetzler, M.; Ellingsgaard, H.; Halban, P.A.; Ehses, J.A. Cytokine Production by Islets in Health and Diabetes: Cellular Origin, Regulation and Function. Trends in Endocrinology & Metabolism 2010, 21, 261–267. [Google Scholar] [CrossRef]
- Shanahan, C.M.; Cary, N.R.B.; Salisbury, J.R.; Proudfoot, D.; Weissberg, P.L.; Edmonds, M.E. Medial Localization of Mineralization-Regulating Proteins in Association With Mönckeberg’s Sclerosis. Circulation 1999, 100, 2168–2176. [Google Scholar] [CrossRef] [PubMed]
- Grigorescu, E.-D.; Lăcătușu, C.-M.; Floria, M.; Cazac, G.-D.; Onofriescu, A.; Ceasovschih, A.; Crețu, I.; Mihai, B.-M.; Șorodoc, L. Association of Inflammatory and Metabolic Biomarkers with Mitral Annular Calcification in Type 2 Diabetes Patients. J Pers Med 2022, 12, 1484. [Google Scholar] [CrossRef] [PubMed]
Figure 1.
Flowchart of Patient Enrollment and Application of Exclusion Criteria.
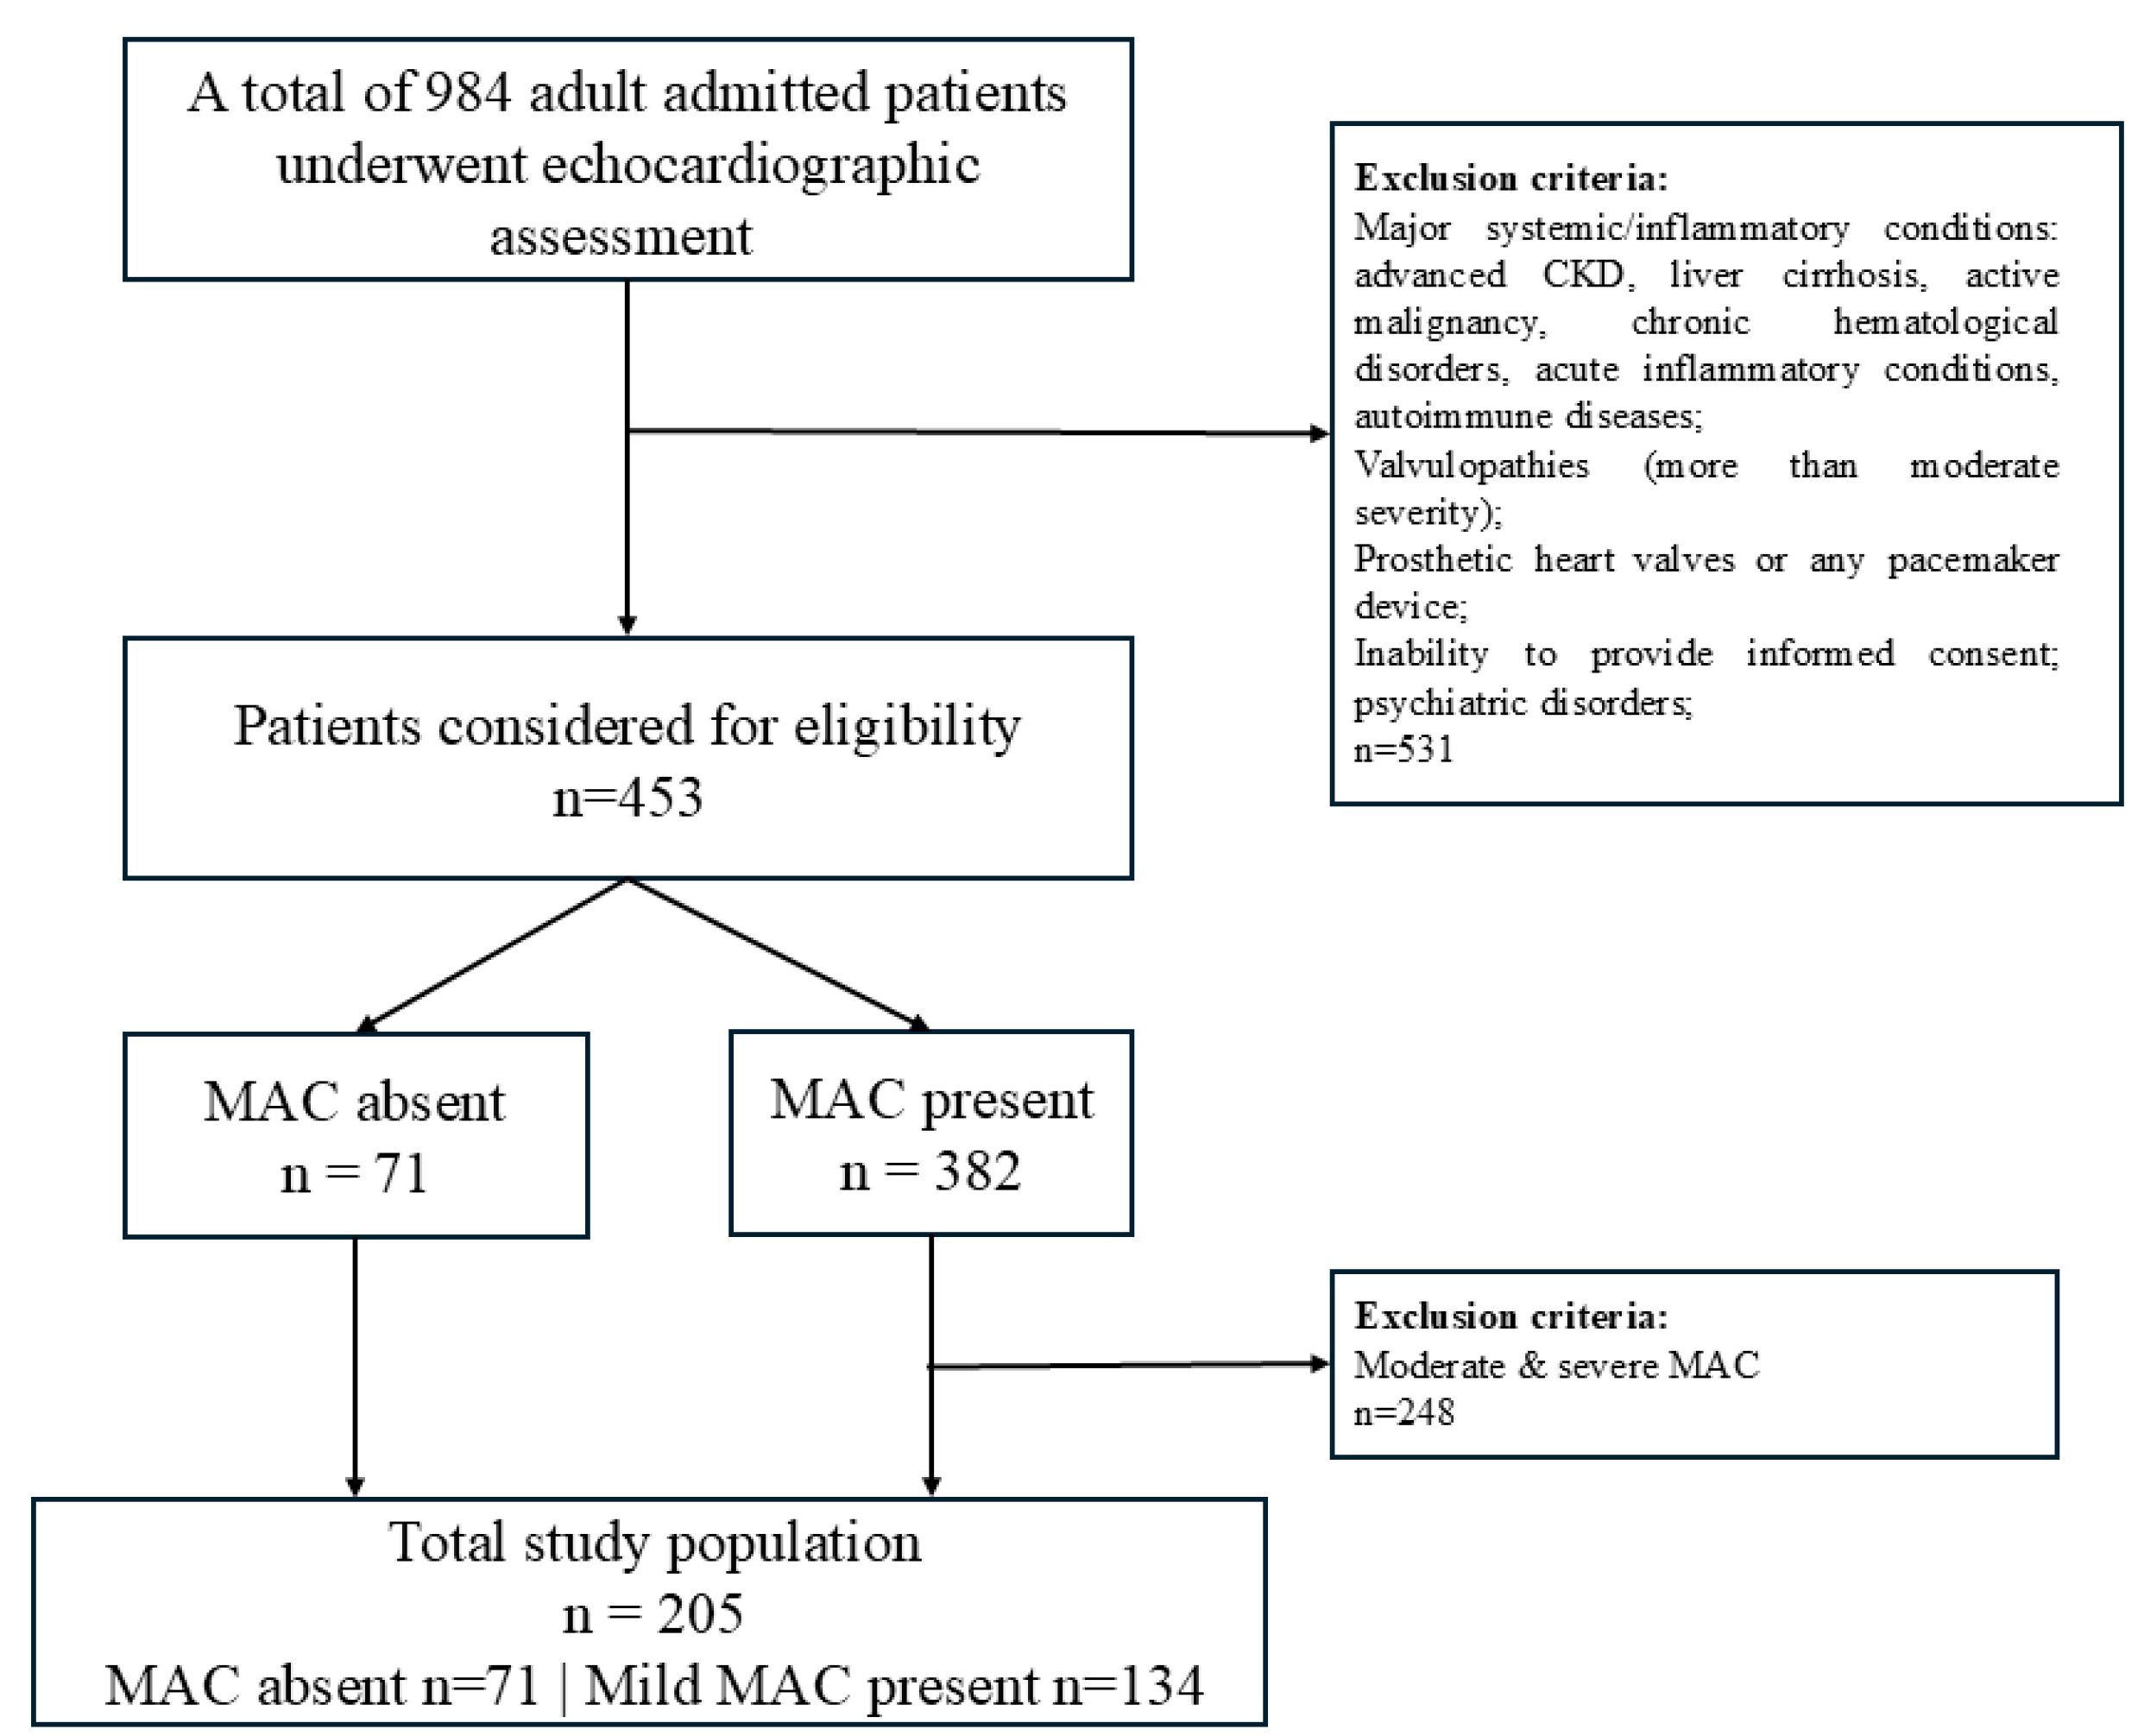
Figure 2.
Distribution of hematological inflammatory markers by MAC status.
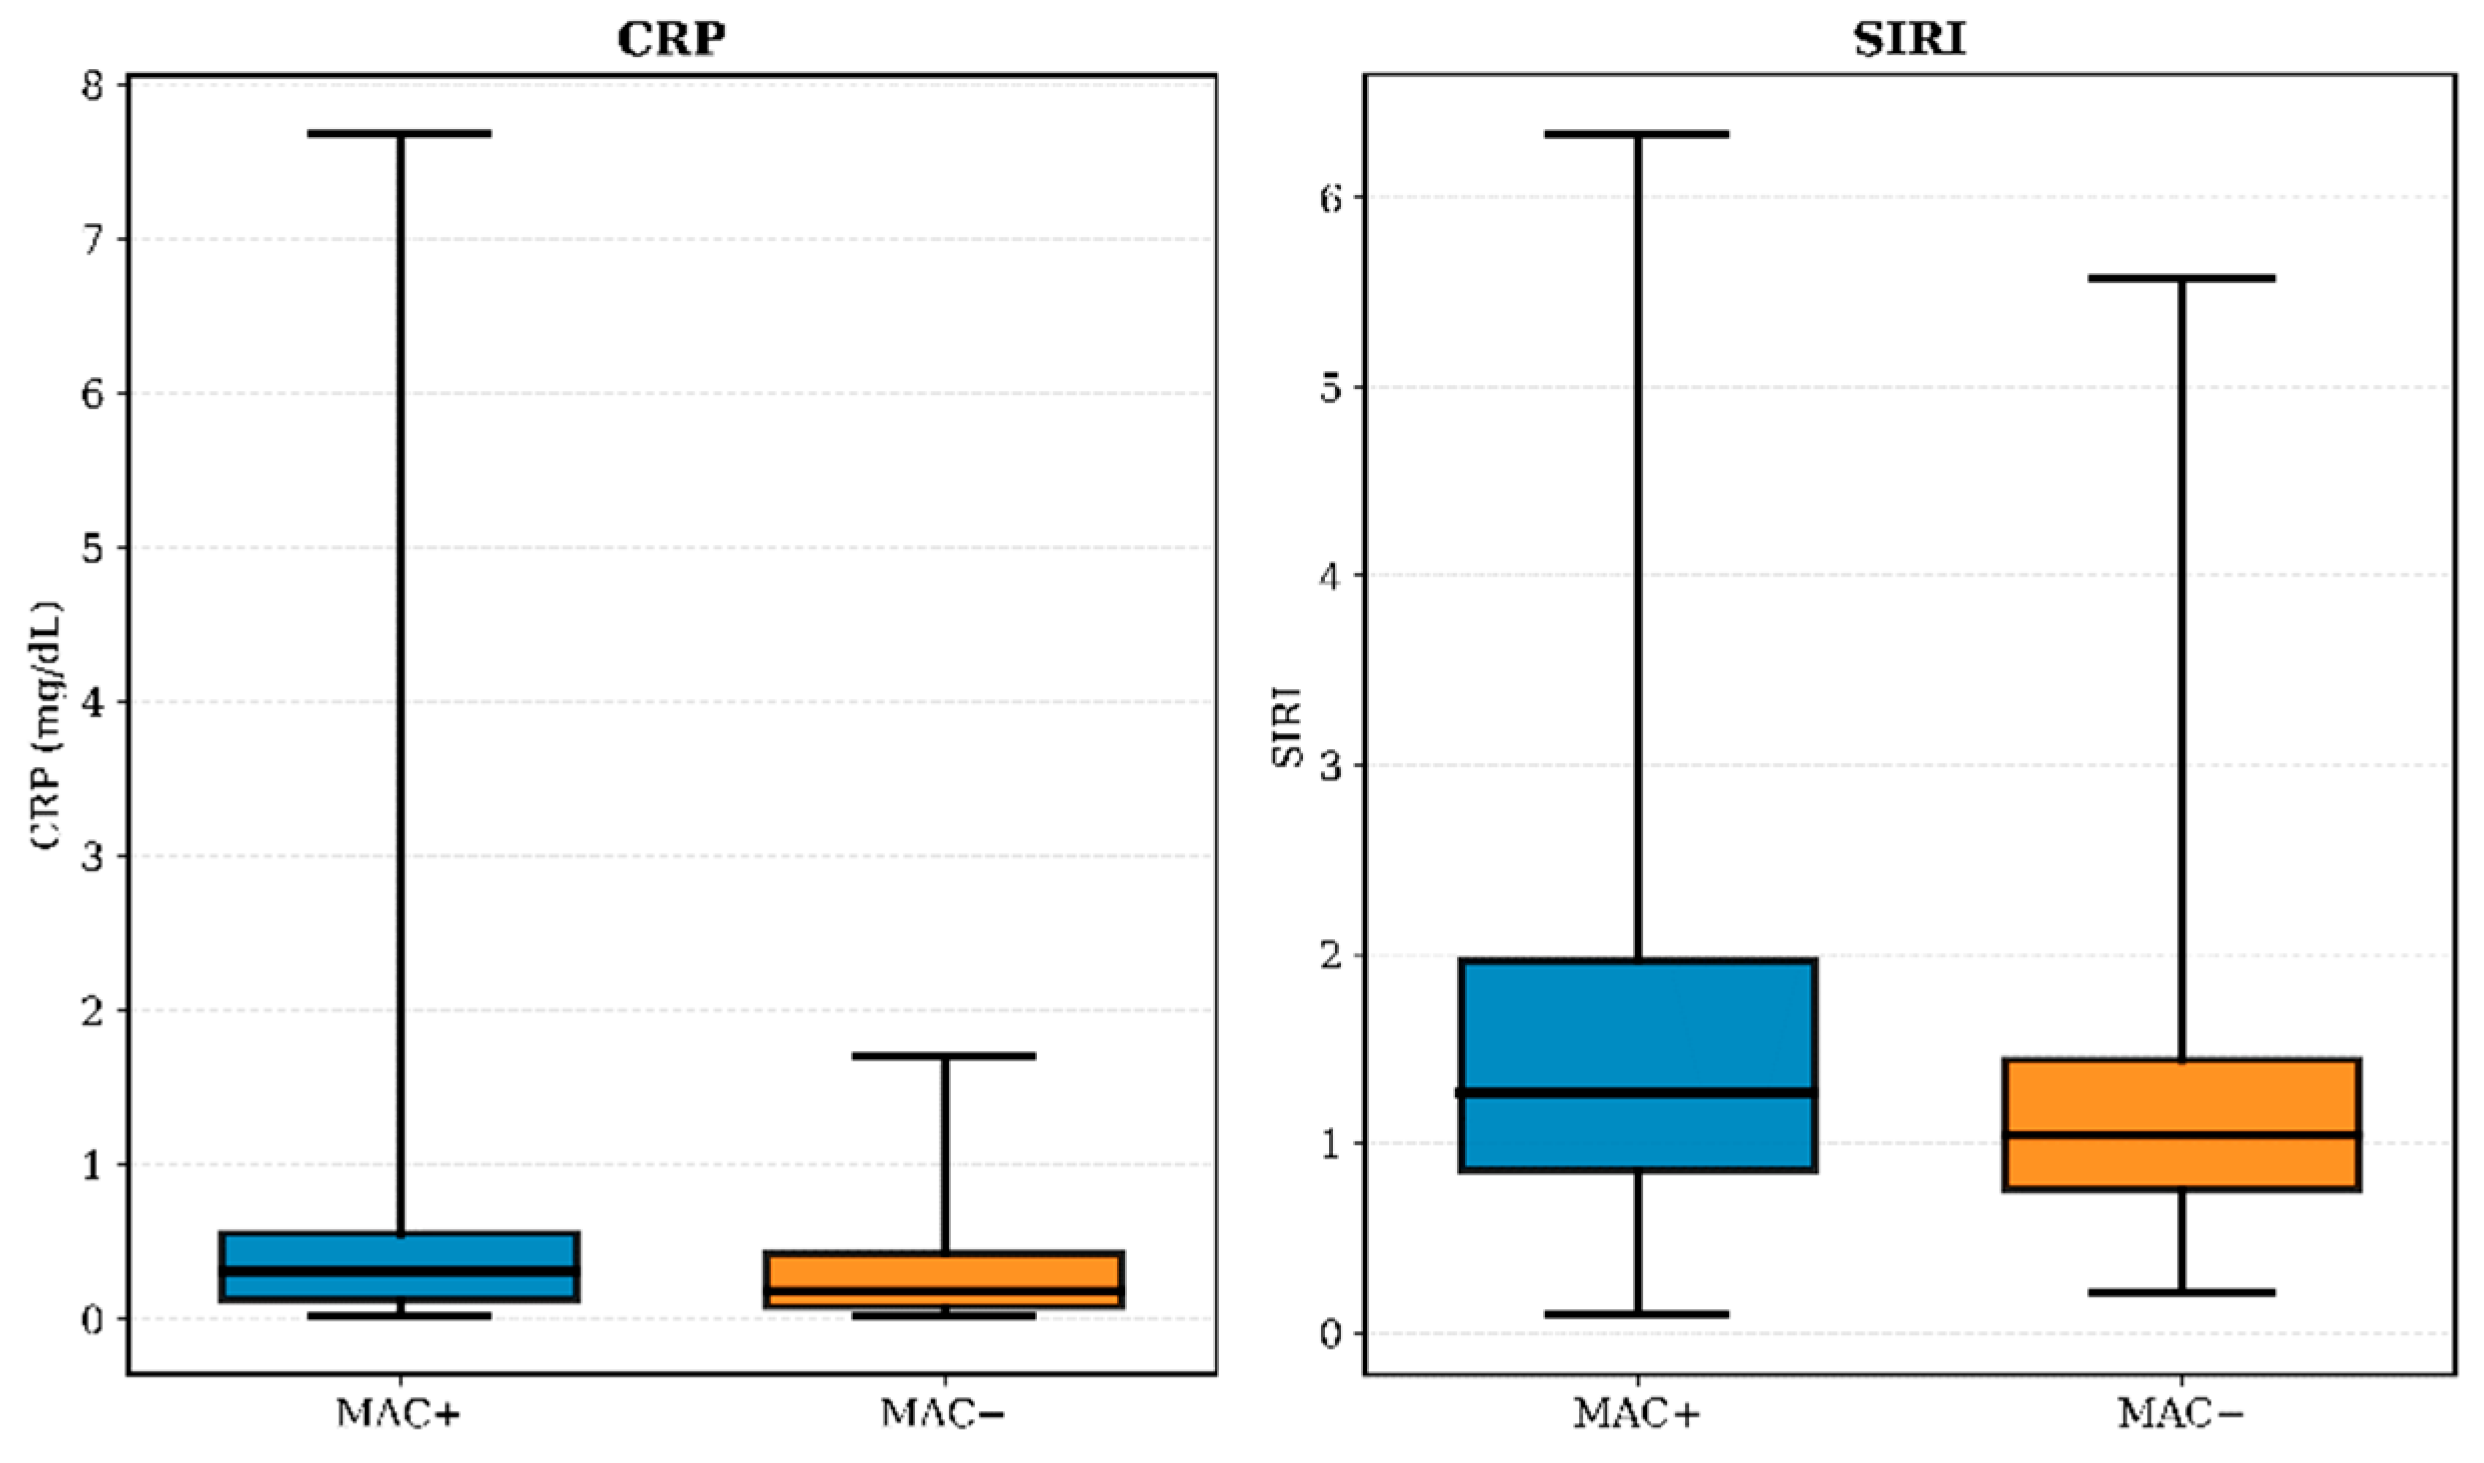
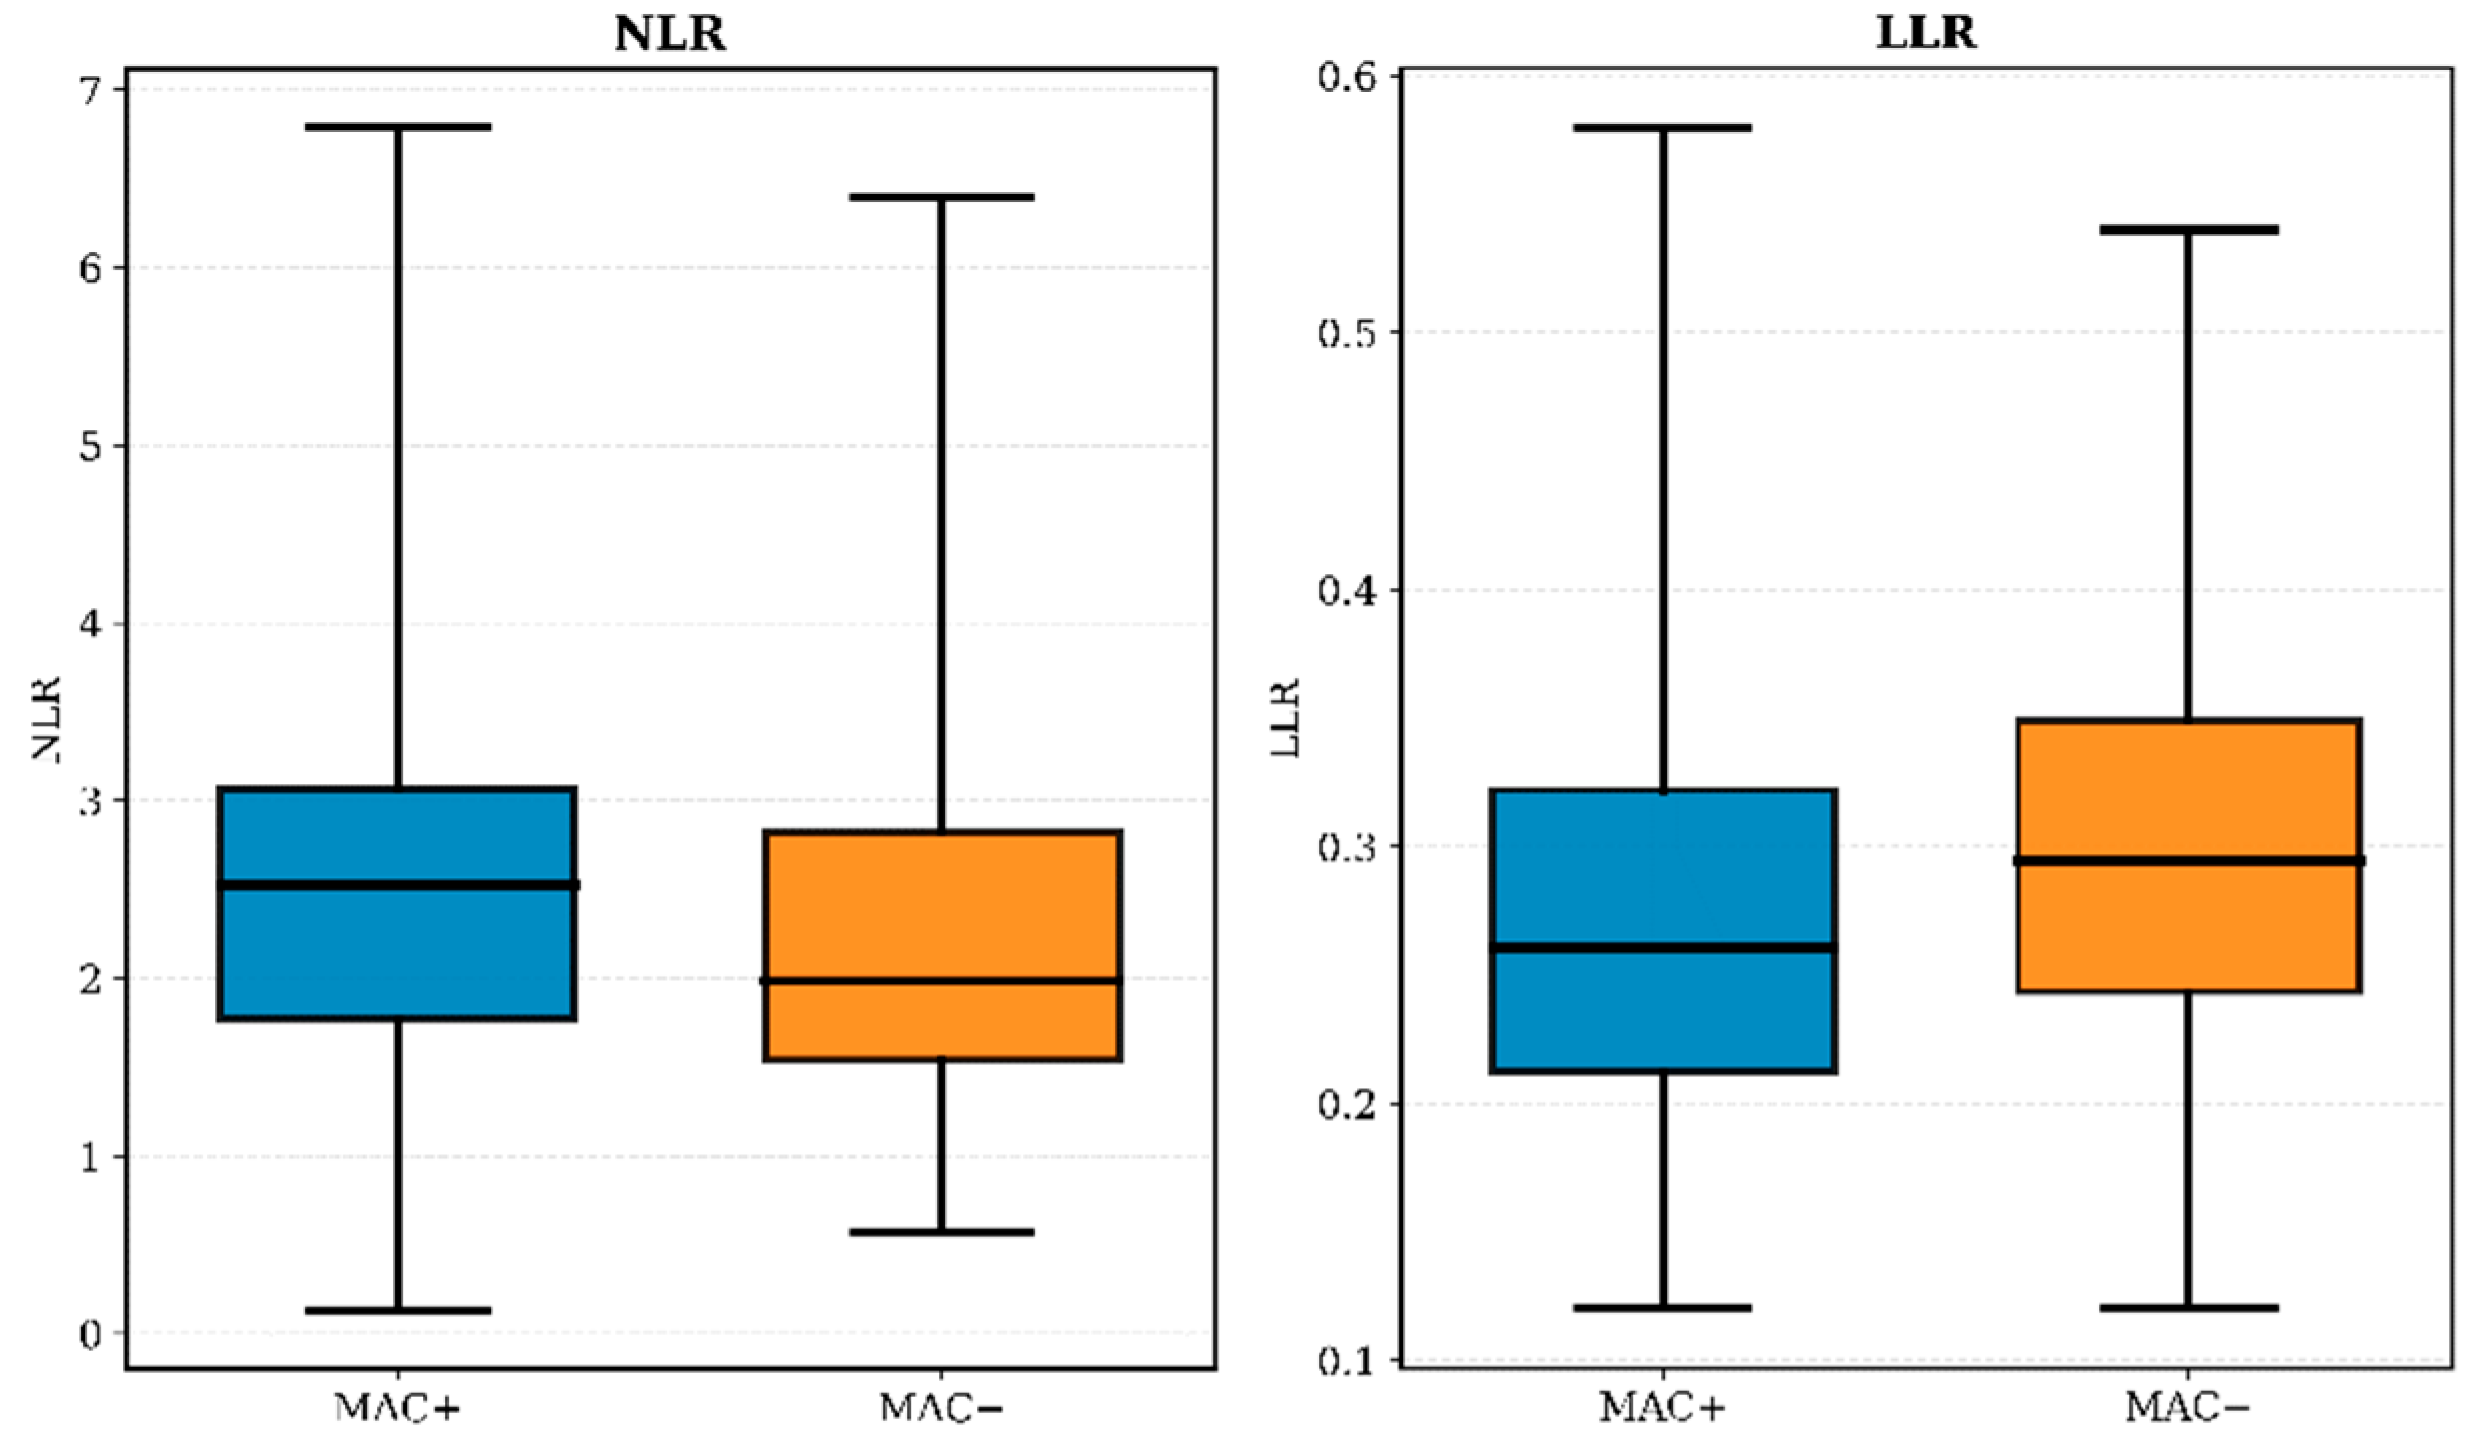

Table 1.
General clinical, biological, and echocardiographic characteristics of patients with (MAC +) and without MAC (MAC -).
Table 1.
General clinical, biological, and echocardiographic characteristics of patients with (MAC +) and without MAC (MAC -).
| Parameter | MAC + (n = 134) | MAC - (n = 71) | Total (n = 205) | Statistical Test | p-value |
|---|---|---|---|---|---|
| Clinical and anthropometric characteristics | |||||
| Age (years) | 66.5 (56.0 – 73.0) | 58.0 (50.0 – 69.0) | 65.0 (54.0 – 72.0) | Mann-Whitney U = 3351.0 |
< 0.001* |
| Sex (female) | 90 (67.2%) | 38 (53.5%) | 128 (59.5%) | χ2 = 1.618 | 0.203 |
| Systolic BP (mmHg) | 149.1 ± 22.3 | 138.1 ± 17.8 | 145.3 ± 21.4 | t = 3.858 | < 0.001* |
| Arterial Hypertension | 129 (96.3%) | 49 (69.0%) | 178 (86.8%) | χ2 = 30.145 | < 0.001* |
| Waist circumference (cm) | 103.0 (92.0 – 114.8) | 97.0 (89.0-108.0) | 102.0 (92.0 – 112.0) | Mann-Whitney U = 3822.5 |
0.021* |
| BMI (kg/m2) | 30.7 ± 5.5 | 28.7 ± 5.3 | 30.0 ± 5.5 | t = 2.520 | 0.013* |
| Smoking status | 52 (38.8%) | 23 (32.4%) | 75 (36.6%) | χ2 = 0.822 | 0.365 |
| Cardiovascular and metabolic comorbidities | |||||
| Hepatic steatosis | 98 (66.4%) | 41 (57.7%) | 130 (63.4%) | χ2 = 1.504 | 0.220 |
| Prediabetes | 73 (54.5%) | 31 (43.7%) | 104 (50.7%) | χ2 = 11.244 | 0.004* |
| Type 2 Diabetes | 22 (16.4%) | 4 (5.6%) | 26 (12.7%) | χ2 = 11.244 | 0.004* |
| Heart failure | 122 (91%) | 38 (53.5%) | 172 (83.9%) | χ2 = 74.231 | < 0.001* |
| NYHA II-III | 115 (85.8%) | 38 (53.5%) | 153 (74.6%) | χ2 = 79.414 | < 0.001* |
| Coronary artery disease | 35 (26.1%) | 16 (22.5%) | 51 (24.9%) | χ2 = 0.319 | 0.572 |
| Atrial fibrillation | 32 (23.9%) | 10 (14.1%) | 42 (20.5%) | χ2 = 3.556 | 0.314 |
| Echocardiographic characteristics | |||||
| IVS (mm) | 11.0 (10.0 – 12.0) | 11.0 (9.0 – 12.0) | 11.0 (10.0 – 12.0) | Mann-Whitney U = 3977.5 |
0.049* |
| PWT (mm) | 11.0 (10.0 – 12.0) | 11.0 (9.0 – 12.0) | 11.0 (10.0 – 12.0) | Mann-Whitney U = 4190.5 |
0.150 |
| LVEDD (mm) | 41.0 (37.0 – 45.0) | 41.0 (36.0 – 46.0) | 41.0 (37.0 – 45.0) | Mann-Whitney U = 4553.0 |
0.613 |
| LVEDV (mL/m2) | 81.5 (69.8 – 97.0) | 76.0 (63.0 – 95.0) | 80.0 (67.5 – 96.5) | Mann-Whitney U = 4022.0 |
0.069+ |
| LVESV (mL/m2) | 35.0 (23.0 – 43.5) | 28.0 (23.0 – 38.0) | 32.0 (23.0 – 42.0) | Mann-Whitney U = 4009.0 |
0.064+ |
| LVEF (%) | 59.0 (54.0 – 65.0) | 60.0 (55.0 – 64.0) | 60.0 (55.0 – 65.0) | Mann-Whitney U = 4278.0 |
0.233 |
| LA volume (mL/m2) | 82.0 (65.8 – 101.3) | 70.0 (58.0 – 84.0) | 76.0 (62.0 – 97.5) | Mann-Whitney U = 3390.5 |
< 0.001* |
| RA diameter (mm) | 58.0 (44.0 – 70.0) | 50.0 (41.0 – 61.0) | 55.0 (42.0 – 67.0) | Mann-Whitney U = 3880.0 |
0.030* |
| RV basal diameter (mm) | 35.0 (32.0 – 38.3) | 33.0 (29.0 – 37.0) | 34.0 (32.0 – 38.0) | Mann-Whitney U = 3769.5 |
0.014* |
| Laboratory characteristics | |||||
| CRP (mg/dL) | 0.31 (0.13 – 0.56) | 0.18 (0.08 – 0.42) | 0.28 (0.12 – 0.5) |
Mann-Whitney
U = 3518.500 |
0.002* |
| Glucose (mg/dL) | 100.5 (90.75 – 113) | 97.0 (86.0 – 105.0) | 99.0 (88.0 – 110.0) | Mann-Whitney U = 4031.5 |
0.073+ |
| HbA1c (%) | 5.85 (5.60 – 6.10) | 5.60 (5.30 – 5.90) | 5.80 (5.40-6.00) | Mann-Whitney U = 3306.5 |
< 0.001* |
| LDL – cholesterol (mg/dL) | 123.51 ± 47.93 | 128.99 ± 43.95 | 125.41 ± 46.56 | t = -0.800 | 0.425 |
| HDL – cholesterol (mg/dL) | 45.0 (37.0 – 54.0) | 53.0 (42.0 – 61.0) | 47.0 (39.0 – 56.0) | Mann-Whitney U = 3390.5 |
<0.001* |
| Triglycerides (mg/dL) | 113.5 (85.0 – 159.3) | 81.0 (63.0 – 133.0) | 106.0 (75.0 – 146.0) | Mann-Whitney U = 3468.0 |
<0.001* |
| NT-proBNP (pg/mL) | 116.0 (61.51 – 353.25) | 85.0 (34.0 – 185.0) | 102.0 (50.4 – 290.5) | Mann-Whitney U = 3885.5 |
0.031* |
| eGFR (mL/min/1.73m2) | 86.7 (72.0-97.2) | 87.5 (73.3-101.4) | 87.4 (72.9-98.4) | Mann-Whitney U = 4354.5 |
0.319 |
| Hemoglobin (g/dL) | 14 (13.2 – 14.9) | 13.6 (13.2 – 14.3) | 13.9 (13.2 – 14.7) | Mann-Whitney U = 4241.500 |
0.202 |
| Leukocytes (x 103 /μL) | 6.8 (5.8 −8.2) | 6.8 (5.3 – 7.9) | 6.8 (5.7 – 8.1) |
Mann-Whitney
U = 4372.000 |
0.341 |
| Neutrophils (x 103 /μL) | 4.2 (3.4 – 5.6) | 4.1 (2.9 – 5) | 4.1 (3.3 – 5.4) |
Mann-Whitney
U = 4134.000 |
0.123 |
| Neutrophils (%) | 63.3 (56 – 67.5) | 60.2 (52.7 – 66.3) | 61.8 (55.1 – 66.7) |
Mann-Whitney
U = 4067.500 |
0.088+ |
| Monocytes (x 103 /μL) | 0.55 (0.43 – 0.69) | 0.51 (0.42 – 0.63) | 0.52 (0.43 – 0.67) |
Mann-Whitney
U = 4375.500 |
0.345 |
| Lymphocytes (x 103 /μL) | 1.74 (1.45– 2.17) | 1.84 (1.49 – 2.34) | 1.75 (1.46 – 2.21) |
Mann-Whitney
U = 4308.500 |
0.267 |
| Lymphocytes (%) | 25.9 (21.8– 31.9) | 29 (23.2 – 34.9) | 26.5 (22.3 – 33.4) |
Mann-Whitney
U = 4014.000 |
0.066+ |
| Platelets (x 103 /μL) | 236.8 ± 60.2 | 240.9 ± 61.0 | 238.2 ± 60.4 | t = -0.462 | 0.645 |
| Hematological inflammatory parameters | |||||
| NLR | 2.52 (1.77 – 3.07) | 1.99 (1.54 – 2.82) | 2.4 (1.67 – 2.95) |
Mann-Whitney
U = 3963.000 |
0.032* |
| NMR | 7.68 (6.32 – 9.55) | 7.35 (6.16 – 9.47) | 7.52 (6.32 – 9.54) |
Mann-Whitney
U = 4488.000 |
0.506 |
| LLR | 0.26 (0.21 – 0.32) | 0.29 (0.24 – 0.35) | 0.27 (0.23 – 0.33) |
Mann-Whitney
U = 3889.000 |
0.032* |
| PLR | 127.78 (103.79 – 166.15) | 130.32 (99.73 – 146.96) | 128.46 (102.85 – 159.96) |
Mann-Whitney
U = 4557.500 |
0.622 |
| SIRI | 1.27 (0.86 – 1.97) | 1.04 (0.76 – 1.44) | 1.19 (0.85 – 1.75) |
Mann-Whitney
U = 3922.000 |
0.039* |
| SII | 68.39 (52.44 – 92.11) | 66.21 (52.13 – 79.02) | 67.62 (52.41 – 85.83) |
Mann-Whitney
U = 4263.000 |
0.222 |
BP – blood pressure; BMI – body mass index; eGFR – estimated glomerular filtration rate; NYHA – New York Heart Association; IVS – interventricular septum; PWT – posterior wall thickness; LVEDD – left ventricular end-diastolic diameter; LVEDV - left ventricular end-diastolic volume; LVESV - left ventricular end-systolic volume; LVEF – left ventricular ejection fraction; LA – left atrium; RA – right atrium; RV – right ventricle; TAPSE – tricuspid annular plane systolic excursion; CRP – C-reactive protein; HDL – high-density lipoprotein; LDL – low-density lipoprotein; NT-proBNP – N-terminal pro-B-type natriuretic peptide; NLR – Neutrophil-to-Lymphocyte Ratio; NMR - Neutrophil-to-Monocyte Ratio; LLR – Lymphocyte-to-Leukocyte Ratio; PLR – Platelet-to-Lymphocyte Ratio; SIRI – Systemic Inflammation Response Index; SII – Systemic Immune-Inflammation Index. + Trend toward significance; * Statistical significance.
Table 2.
Spearman correlations between inflammatory markers and clinical variables.
| Variable | CRP, ρ (p) | NLR, ρ (p) | LLR, ρ (p) | SIRI, ρ (p) |
|---|---|---|---|---|
| Age | 0.162 (0.020*) | 0.177 (0.011*) | -0.191 (0.006*) | 0.184 (0.008*) |
| BMI | 0.322 (<0.001*) | -0.008 (0.908) | 0.026 (0.706) | -0.054 (0.438) |
| Waist circumference | 0.297 (<0.001*) | 0.013 (0.849) | -0.003 (0.967) | -0.008 (0.914) |
| NT-proBNP | 0.260 (<0.001*) | 0.081 (0.247) | -0.110 (0.116) | 0.151 (0.031*) |
| eGFR | -0.102 (0.145) | -0.137 (0.050*) | 0.147 (0.036*) | -0.138 (0.048*) |
CRP – C-reactive protein; NLR – neutrophil-to-lymphocyte ratio; LLR – lymphocyte-to-leukocyte ratio; SIRI – Systemic Inflammation Response Index; BMI – Body Mass Index; NT-proBNP – N-terminal pro-B-type natriuretic peptide; eGFR – estimated glomerular filtration rate. * Statistically significant p-values (p≤0.05).
Table 3.
Inflammatory markers according to glucose metabolism status.
| Marker |
No dysglycemia M ± SD Median (IQR) |
Prediabetes M ± SD Median (IQR) |
Type 2 diabetes M ± SD Median (IQR) |
H (Kruskal-Wallis) | p-value |
| CRP | 0.374 ± 0.790 0.170 (0.090 ÷ 0.430) |
0.624 ± 1.248 0.320 (0.130 ÷ 0.517) |
0.475 ± 0.460 0.395 (0.187 ÷ 0.570) |
7.008 | 0.030* |
| NRL | 2.315 ± 1.141 2.055 (1.553 ÷ 2.691) |
2.580 ± 1.248 2.411 (1.737 ÷ 2.937) |
2.863 ± 1.132 2.998 (2.338 ÷ 3.456) |
7.329 | 0.026* |
| LLR | 0.293 ± 0.085 0.288 (0.240 ÷ 0.348) |
0.276 ± 0.084 0.266 (0.224 ÷ 0.327) |
0.251 ± 0.084 0.235 (0.200 ÷ 0.272) |
5.591 | 0.061 |
| SIRI | 1.223 ± 0.810 0.962 (0.759 ÷ 1.39) |
1.567 ± 1.117 1.211 (0.866 ÷ 1.982) |
1.804 ± 0.902 1.629 (1.199 ÷ 2.584) |
7.320 | 0.026* |
CRP – C-reactive protein; NLR – neutrophil-to-lymphocyte ratio; LLR – lymphocyte-to-leukocyte ratio; SIRI – Systemic Inflammation Response Index. * Statistically significant p-values (p≤0.05).
Table 4.
Multivariable logistic regression models for the association between inflammatory markers and MAC.
Table 4.
Multivariable logistic regression models for the association between inflammatory markers and MAC.
| Variable | Model 1: CRP B |
Model 1: CRP OR (95% CI), p |
Model 2: NRL B | Model 2: NLR OR (95% CI), p |
Model 3: LLR B | Model 3: LLR OR (95% CI), p |
Model 4: SIRI B | Model 4: SIRI OR (95% CI), p |
|---|---|---|---|---|---|---|---|---|
| Inflammatory Index | 1.162 | CRP 3.197 (0.835-12.240), p=0.090 |
0.171 | NLR 1.186 (0.900-1564), p=0.225 | -2.931 | LLR 0.053 (0.001-2.008), p=0.113 |
0.127 | SIRI 1.136 (0.812-1.589), p=0.458 |
| Age (per year) | -0.005 | 0.995 (0.956-1.036), p=0.807 | 0.055 | 1.056 (1.023-1.090), p=0.001* | 0.061 | 1.063 (1.031-1.096), p<0.001* | 0.056 | 1.057 (1.023-1.092), p=0.001* |
| BMI (per kg/m2) | -0.014 | 0.986 (0.851-1.142) p=0.851 | - | - | - | - | - | - |
| Waist circumference | -0.022 | 0.979 (0.936-1.023); p=0.337 | - | - | - | - | - | - |
| Prediabetes vs. none | 0.888 | 2.430 (1.036-5.698), p=0.041* | 1.284 | 3.610 (1.787-7.291), p<0.001* | - | - | 1.288 | 3.625 (1.791-7.336), p<0.001* |
| Type 2 diabetes vs none | 1.776 | 5.906 (1.520-22.937), p=0.010* | 1.818 | 6.160 (2.012-18.866), p=0.001* | - | - | 1.823 | 6.189 (2.023-18.935), p=0.001* |
| Heart failure (present vs absent) | 22.902 | 8.83x10⁹ (-); p=0.997 | - | - | - | - | - | - |
| eGFR (per unit increase) | - | - | 0.028 | 1.029 (1.004-1.054), p=0.022* | 0.020 | 1.020 (0.997-1.043), p=0.083 | 0.027 | 1.027 (1.003-1.052), p=0.029* |
| NT-proBNP (per 1 pg/ml) | -0.001 | 0.999 (0.999-1.000) p=0.099 | - | - | - | - | 0.000 | 1.000 (0.999-1.001); p=0.637 |
| Constant | -19.201 | OR=0.000; p=0.998 | -6.412 | OR=0.002; p=0.001 | -3.983 | OR=0.019; p=0.025 | -6.045 | OR=0.002; p=0.001 |
CRP – C-reactive protein; NLR – neutrophil-to-lymphocyte ratio; LLR – lymphocyte-to-leukocyte ratio; SIRI – Systemic Inflammation Response Index; BMI – body mass index; eGFR – estimated glomerular filtration rate; NT-proBNP – N-terminal pro-B-type natriuretic peptide. * Statistically significant p-values (p≤0.05); - Not included.
Disclaimer/Publisher’s Note: The statements, opinions and data contained in all publications are solely those of the individual author(s) and contributor(s) and not of MDPI and/or the editor(s). MDPI and/or the editor(s) disclaim responsibility for any injury to people or property resulting from any ideas, methods, instructions or products referred to in the content. |
© 2026 by the authors. Licensee MDPI, Basel, Switzerland. This article is an open access article distributed under the terms and conditions of the Creative Commons Attribution (CC BY) license.
Copyright: This open access article is published under a Creative Commons CC BY 4.0 license, which permit the free download, distribution, and reuse, provided that the author and preprint are cited in any reuse.


