Submitted:
21 January 2026
Posted:
22 January 2026
You are already at the latest version
Abstract
Low back pain (LBP) represents an immense economic burden, with a lifetime prevalence of up to 84 %. However, conventional diagnostic methods such as MRI or X-rays provide only limited information about the pathogenesis and specific pain-related functional limitations. Wearable inertial sensors (IMU) and electromyography sensors (EMG) offer an expanded spectrum for the targeted identification and diagnosis of LBP. The aim of the study is to evaluate a selective diagnostic series for the subcategorization of functional deficits and their precise assignment to specific functional deficits. Based on a systematic literature review, an objectively measurable functional LBP assessment was defined that tests fatigue resistance, neuromuscular control, lumbopelvic stability, and global trunk musculature. Subsequently, 38 individuals were recruited in a prospective cross-sectional study and divided into three groups: “healthy,” “mild pain,” and “severe pain.” These individuals underwent an assessment. The two pain groups differed significantly from the symptom-free individuals in all previously defined functional levels. In addition, the two pain groups also differed significantly from each other. The functional assessment, which incorporates IMUs and EMG sensors as a central diagnostic element, is so valuable because it can identify causal relationships between mechanical dysfunctions and the underlying neuromuscular cause, thus enabling individualized therapy.
Keywords:
functional assessment
; low back pain
; Wearable inertial sensors
; electromyography sensors
1. Introduction
In the most developed economies, approximately 75% of jobs and value creation are attributable to the service sector [1]. This sector is dominated by sedentary office work [2], which promotes physical inactivity and, in the medium to long term, general physical deconditioning [3]. Consequently, in service-based societies, back pain is among the most common causes of work incapacity and represents a considerable health burden for affected individuals [4]. Lifetime prevalence is reported to be as high as 84% [5]. In the age cohort between 35 and 50 years, initial degenerative pain and inflammatory processes of the spine frequently occur [6]. This age group is therefore particularly prone to acute back complaints [7]. Owing to the substantial economic impact, pain-related absenteeism in these individuals leads to significant productivity losses and considerable socioeconomic costs [4].
To prevent the chronification of pain, and to derive and evaluate targeted therapeutic exercises, precise determination of functional deficits is essential. Conventional clinical diagnostic methods, such as MRI or radiography, provide only limited information on the pathogenesis of back pain and on specific pain-associated functional restrictions [8]. Visible structural changes of the spine often result in misinterpretation as the primary pain source, even though they are not causative for the symptoms. Patients who undergo MRI in the early phase of pain are more likely to catastrophise their symptoms, which in turn increases the risk of chronicity [9]. In the vast majority of patients (approximately 90–95%), back pain is triggered by muscular tension, postural dysfunction, or psychosocial factors (stress, burden) and cannot be visualised by imaging [10,11]. Nevertheless, recent systematic reviews indicate that imaging has increased over the past 20 years and that at least one third of all imaging procedures are unnecessary [12,13].
Beyond the clinical assessment of musculoskeletal disorders, diagnosing the functional status of pain patients under load - as well as quantifying and classifying functional deficits based on objectively measurable parameters - remains challenging [14].
Descriptions of functional limitation frequently rely on patient-reported, questionnaire-based assessments such as the Oswestry Disability Index and the Roland–Morris Disability Questionnaire [15,16]. A universally accepted diagnostic set-up that measures the functional status of trunk-stabilising musculature under standardised and thus reproducible loading conditions, while providing objective outcome parameters, is lacking [10]. However, recent systematic reviews highlight the relevance of the anatomy and function of the trunk-surrounding musculature - and, in particular, the quality of neuromuscular innervation of the deep autochthonous multifidus muscles - in the development and chronification of back pain [17,18].
At both functional and structural levels, the acute onset and the chronification of low back pain (LBP) can be characterised by distinct changes [19]. Compared with healthy individuals, patients with LBP may exhibit reduced fatigue resistance [20], diminished neuromuscular control [21], altered lumbopelvic stability [22], and lower strength capacity of the trunk-stabilising musculature [23]. Nevertheless, functional deficits need not encompass all four domains but may occur at varying severity and in different combinations, potentially reinforcing one another [24]. Functional tests that mirror everyday loading demands are therefore particularly suitable for specifying these deficits [25].
The continued development of digital technologies—such as inertial measurement units (IMUs), wearable electromyography (EMG), and portable force plates—enables objective, real-time acquisition of biomechanical data during movement. Among others, Shakourisalim et al. and O’Sullivan et al. demonstrated that such objective data possess predictive validity for back pain risk [26,27]. The aim of the present study is to evaluate an objective functional assessment that integrates cost-effective technical devices as a central diagnostic element, differentiates between healthy individuals and those with LBP or at risk, and specifies the corresponding physiological deficit. While existing work frequently focuses on diagnostic descriptions of particular subsystems within functional LBP assessment, this study combines multiple measurement technologies across comprehensive functional test scenarios to illustrate how the linked application of multimodal diagnostic strategies can improve identification of LBP risk patients, stratification, and clinical decision-making in practice [28].
2. Materials and Methods
2.1. Participants
A total of 38 participants (65.8% female) were included in the study. The mean age was 43 years (SD± 11), mean height was 174 cm (SD± 8), and mean weight was 76kg (SD±15). Among these, 29 participants reported nonspecific chronic low back pain, as assessed using the Chronic Pain Grade Questionnaire (CPGQ, see 2.2) developed by Korff [29]. Based on the CPGQ pain intensity scores, participants were stratified into three subgroups: 0 to 10, 11 to 29, and > 29. The general characteristics of the sample are presented in Table 1.
To accommodate both German-and English-speaking participants, the CPGQ was administered in the appropriate language version
Participants were excluded if they were unable to maintain a single-leg-stance for at least 60 seconds, had significant musculoskeletal impairments (e.g., joint replacements, spinal deformities), had severe neurophysiological disorders (e.g., epilepsy), reported acute pain intensity > 8 on a Visual Analogue Scale (VAS).
Recruitment was carried out using flyers and posting in medical offices between October 2024 and January 2025. Only Data sets that included complete execution of all tasks and full sensor recordings were included in the analysis. One participant was excluded due to technical failure during data collection.
2.2. Study Design
This perspective cross-sectional observational study used a purely quantitative data collection approach. Each participant attended a single-day session in a German University Hospital. Prior to data collection, participants underwent a standardized medical screening by a trained physician to ensure eligibility. The Functional Assessment Screening Protocol (Table 2) was based on previous publications of this group and systematic literature research conducted. The complete search strings are provided in “Appendix A”.
Before EMG electrode placement, the skin was prepared by shaving (if needed), scrubbing and disinfecting with 70% alcohol. EMG data were collected bilaterally from the lumbar multifidus (MF) and longissimus thoracis (LT) muscles. To minimize signal crosstalk, electrodes were positioned well within muscle borders, aligned parallel to muscle fibers, set with a 2cm inter-electrode distance. The skin impedance was accepted if less than 55 kΩ. Electrode placement followed SENIAM guidelines and validated procedures ([30]. The MF electrodes were aligned along the anatomical line from the posterior superior iliac spine to the L1-L2 interspace at the L5 spinous process level. The LT electrodes were placed two finger widths lateral to the L1 spinous process. A reference electrode was placed over the right anterior superior iliac spine [30,31].
Four triaxial Inertial Measurement Units (IMU) were affixed to the following anatomical landmarks: Trunk at L3 and S1 levels, Thigh approx. 15 cm above the knee joint space (Figure 1). All sensors’ attachments were performed by certified physiotherapist and sports scientists.
Participants performed the assessments in a standardized sequence to ensure consistent measurement conditions across all subjects (Table 2).
2.3. Experimental Procedures and Measures
At the start of each session, participants were briefed on the study objectives. A medical examination was conducted, including vital signs (heart rate, blood pressure), demographics, physical activity in the past 12 hours, and whether the assessment had an endoprothesis. Followed by a measurement of the body composition using a bioelectrical impedance analysis (TANITA). Prior to the functional assessments participants had to fill out the CPGQ to evaluate the pain intensity over the past three months [29].
Outcomes were derived from synchronized IMU, EMG sensors and force plate-based Center of Pressure (CoP) data. Each task was explained to the participants in detail prior to execution. Participants completed a trial run and were required to demonstrate understanding before official data collection began.
2.3.1. Fatigue Resistance/ Strength Endurance - Gait Analysis
Strength endurance was assessed using a 100-meter walking test. The test subjects were asked to cover the distance at a brisk pace of their choice. The participants wore their usual outdoor shoes. During all walking phases, gait parameters were recorded using IMUs and EMG. The outcome variables included: walking speed, cadence, and gait cycle time, as well as the duration of the stance and swingphase [32].
2.3.2. Neuromuscular Control and Range of Motion (ROM)
The neuromuscular control was assessed using postural control measurements during quiet bipedal stance, single-leg stance (left and right in randomized order), and quiet sitting on a force plate. Each trial lasted 60 s, with a 10 s rest period between trials. All measurements were conducted barefoot with participants hands on hips and eyes open. A visual target was placed 3 m away at a height of 1.7 m. Foot placement was standardized using visual markers, and during single-leg stance the non-supporting leg was not allowed to touch the stance leg. Participants were instructed to maintain an upright and steady trunk posture throughout the trial. The primary outcomes were CoP-track, PSD within the frequency range of 0.02 - 10.0 Hz, and IMU and EMG parameters recorded from the MF and LT muscles (Figure 2).
All functional spinal movements were assessed in a fixed sequence: Flexion, Extension, Lateral flexion (left/right, self-selected order), and Rotation (left/right, self-selected order). Each motion was performed twice, with a 3-second pause in the neutral spinal position between trials. Testing was conducted in both standing and sitting postures (Figure 3 and Figure 4). Adjacent joint movements were restricted through verbal guidance. Trials lasted as long as needed, followed by short rest periods. Movements were recorded using IMU and EMG. Participants were barefoot, with hands crossed over the shoulders and knees extended during standing tests.
2.3.3. Lumbopelvic Stability
Lumbopelvic Stability was assessed using a modified Slump Test. Participants sat upright (defined as anterior rotation of the pelvis, lumbar lordosis, and relaxation of the thorax, hands crossed on the shoulders), with thigh fully supported. Participants then extended each leg five times with dorsiflexed ankles, alternating sides. Subjective Outcome parameters were the ability to maintain upright posture and the presence of pain or neurological symptoms. Additionally objective outcomes were collected IMU, EMG parameter at the MF and LT muscles (Figure 5).
2.3.4. Global Trunk Musculature
Isometric trunk strength assessments were conducted using an Isomed 2000 dynamometer. Participants were seated in an upright position with the hip angle fixed at 90°. The thighs and lower legs were stabilized using device-specific fixation systems to minimize compensatory movements and isolate trunk muscle activity. Prior to the isometric strength trials, participants completed a warm-up phase involving 20 repetitions of dynamic trunk flexion and extension under isokinetic conditions by 60°/sec and ROM 40° (10° - 30°).
For the isometric strength assessment, five standardized joint angle positions were tested. For ventral trunk muscles two angle positions: 1. Neutral starting position; 2. 80° hip flexion. For the dorsal trunk muscles three angle positions: 1. Neutral starting position; 2. 100° hip flexion; 3. 115° hip (Figure 6).
At each angle, participants were instructed to exert maximal voluntary contraction while maintaining the prescribed posture. Outcome parameters included the peak torque (Nm), the average torque (Nm), and the total force output (Nm). All measurements were recorded and stored for further statistical analysis.
2.4. Data Acquisition and Statistical Analysis
2.4.1. EMG and IMU System „Cometa”
Surface EMG (sEMG) was used to capture MF and LT muscle activity during gait, CoP tasks and the slump test. Before EMG recording, each participant was instructed to the imminent task. The electrodes were connected to an EMG data collection system with the wireless apparatus of a Cometa miniwave infinity device and the signals were collected using customized software named EMG and Motion Tools, Inc. software version 7 (Cometa slr, Milan, Italy). Data analysis and processing were performed using the raw EMG signa
Data collection was performed using a custom acquisition setup integrated with MATLAB 2024 (MathWorks Inc., Natick, MA, USA). Raw sensor signals from inertial measurement units (IMUs), electromyography (EMG), and force platforms were imported into MATLAB for preprocessing and parameter extraction. Signal conditioning included filtering, segmentation, and normalization according to established biomechanical standards. Derived parameters—such as kinematic slopes, variability indices, and EMG envelopes—were computed using custom scripts and validated routines. Final statistical analyses, including hypothesis testing and effect size estimation, were conducted using R statistical software (version 4.5.1; R Foundation for Statistical Computing, Vienna, Austria).
2.4.2. CoP Measuring System
CoP data were recorded using modified Wii Balance Boards (sampling frequency 1 kHz; a 14-bit-resolution) [33], which have been validated for CoP measurements [34]. The primary outcome was CoP track length (in cm). Outliers were defined as values exceeding 10e6 or deviating more than 90 Raw data were recorded and structurally stored using custom software developed in LabVIEW 2022. The CoP trajectory was computed following signal preprocessing, including applications of a third-order low-pass Butterworth filter [35]. The cutoff frequency is calculated according to Koltermann et al. [36]. The results were presented as mean values of the total cohort. The significance level was set as α = 0.05.
2.5. Ethic
The research project was approved by the Ethics Committee of Dresden University of Technology (approval number BO-EK-215052022_1) and conducted in accordance with the Declaration of Helsinki. All participants provided their written consent prior to participation after receiving detailed information about the study procedure and data protection guidelines.
3. Results
3.1. Fatigue Resistance/ Strength Endurance - Gait Analysis
Significant differences were observed in both acceleration metrics of the lower extremity and pelvis, as well as in EMG parameters of the MF (Table 3) Fehler! Verweisquelle konnte nicht gefunden werden..
For the accelerometer data, marked increases in dynamic measures were evident with rising pain intensity. In particular, the maximum slope of acceleration at the left thigh (max_slopeR) was approximately 180% higher under high-intensity pain compared with the pain-free condition (p = 0.012; power = 0.759). Similarly, variability along the Z-axis at the left thigh (varL) increased significantly (p = 0.042), as did the maximum slope at the pelvic axis (Pelvis_Acc_X; p = 0.043).
Conversely, EMG parameters of the MF demonstrated a reduction in activity with higher pain intensity. The mean EMG value on the left (meanR) decreased from 0.0009 (pain-free) to 0.0005 (high-intensity pain; p = 0.050), while the area under the curve on the right (aucR) also declined (p = 0.046).
3.2. Neuromuscular Control
During the single-leg stance, increasing pain intensity was associated with greater ranges of fluctuation and a spectral shift toward higher frequencies (Table 4). The spatial fluctuation values increased significantly: the fluctuation area increased by ~175% and the fluctuation ellipse by ~132% from the pain-free to the painful state (p = 0.033 and p = 0.024; power = 0.599 and 0.654, respectively). Spectral energy increased in both the low and high frequency bands (FreqBandEnergy_L: +57%, p = 0.023, Power = 0.661; FreqBandEnergy_H: +87%, p = 0.019, Power = 0.691), with a simultaneous increase in the mean frequency along the X-axis (+66%; p = 0.048, Power = 0.505) and the dominant frequency along the Y-axis (≈+300%; p = 0.049, Power = 0.497). Power along the Y-axis increased (+34%; p = 0.031, Power = 0.608), while power along the X-axis decreased (−52%; p = 0.027, Power = 0.634). Despite the increased range of fluctuation, the total fluctuation distance and speed decreased (−23% and −58%; p = 0.050 and p = 0.040; power = 0.523 and 0.570).
During single-leg stance, pain intensity was associated with significant changes in the minimum EMG envelope and raw signal values, reflecting altered tonic activation patterns (Table 5). The right internal oblique muscle showed a significant increase in its minimum envelope (minENV) from −7.49 in the pain-free state to −0.05 in the low pain state and 0.55 in the high pain state (p = 0.033, power = 0.601). Similarly, the right multifidus showed a progressive increase in minENV (−2.07 → −0.46 → 1.60; p = 0.012, power = 0.755). In contrast, the left multifidus showed the opposite trend, with its minimum envelope decreasing from 2.12 to −0.47 (p = 0.001, power = 0.934), suggesting asymmetric modulation of tonic control.
3.3. Mobility/Bending
In a seated forward bending task (results Table 6) with an additional accelerometry at the lumbar spine, increasing pain intensity was associated with systematic reductions in lumbar and pelvic kinematics and acceleration derived metrics, alongside higher minimal MF activation. At the lumbar spine, peak and range of X axis acceleration decreased from 1.185 to 0.84 (−29%) and from 1.18 to 0.85 (−28%), respectively (LWS_ACC_X_MAX: p = 0.024, power = 0.658; LWS_ACC_X_RANGE: p = 0.030, power = 0.623). Lumbar roll kinematics were likewise reduced (LWS_ROLL_MAX: 78.44 to 60.99, −22%, p = 0.019, power = 0.690; LWS_ROLL_RANGE: 81.93 to 58.26, −29%, p = 0.023, power = 0.665), and the integrated lumbar acceleration (LWS_ACC_X_AREA) declined from 3.02 to 1.92 (−36%; p = 0.037, power = 0.582). Pelvic dynamics showed parallel changes, with decreases in X axis acceleration peak and range (PELVIS_ACC_X_MAX: 0.940 to 0.64, −32%, p = 0.030, power = 0.620; PELVIS_ACC_X_RANGE: 0.93 to 0.64, −31%, p = 0.030, power = 0.623) and in pelvic roll maximum (58.19 to 42.95, −26%; p = 0.028, power = 0.632). The strongest statistical signal was observed for the minimum pelvis pitch (LWS_PELVIS_PITCH_MIN), which fell markedly from 4.47 to 0.06 (≈−99%; p = 0.003, power = 0.905), consistent with a substantial constraint in sagittal plane excursion. In contrast to the kinematic attenuation, the minimum EMG envelope of the MF muscles increased with pain on both sides (right: 3.14 to 6.66, +112%, p = 0.049, power = 0.512; left: 2.79 to 7.99, +186%, p = 0.034, power = 0.598).
During the return from forward flexion to an upright posture (Table 7), pain intensity was associated with pronounced reductions in lumbar and pelvic acceleration profiles and angular excursions, alongside increased thoracic and paraspinal muscle activation. Lumbar acceleration area (LWS_ACC_X_AREA) declined substantially from 4.03 in the pain-free condition to 2.37 under high pain (−41%; p = 0.012, power = 0.753), with a similar trend in a second measure (3.90 to 2.24; p = 0.005, power = 0.845). The minimum pelvis pitch (LWS_PELVIS_PITCH_MIN) exhibited the strongest attenuation, falling from 6.50 to 0.09 (≈−99%; p = 0.009, power = 0.798), while integrated pitch and roll ranges were also reduced (LWS_PELVIS_PITCH_AREA: 216.87 to 125.03, −42%, p = 0.021; LWS_PITCH_AREA: 426.20 to 286.77, −33%, p = 0.031; LWS_ROLL_RANGE: 102.96 to 62.29, −39%, p = 0.031). Pelvic acceleration and roll areas mirrored these reductions (PELVIS_ACC_X_AREA: 2.91 to 1.68, −42%, p = 0.017; PELVIS_THIGH_ROLL_AREA: 175.35 to 117.24, −33%, p = 0.018).
Conversely, EMG metrics indicated heightened muscular engagement with pain. The mean and RMS envelopes of the thoracic ES increased progressively (R_THORACICES_ENV_MEAN: 13.46 to 23.08, +72%, p = 0.035; R_THORACICES_ENV_RMS: 15.51 to 26.43, +70%, p = 0.039), and the duty cycle of the left MF rose from 0.71 to 0.88 (+24%; p = 0.042). Minimal EMG envelope values for the right MF more than doubled (2.33 to 6.02, +158%; p = 0.016), and raw thoracic EMG also increased (p = 0.036).
3.4. Lumbopelbß0ibe Mobility/Bending
During seated straight leg raise test (SSLR) (see Tabelle 8), the left multifidus showed a significant reduction in the minimum envelope (minENV) across groups (1.812 → 0.435 → −0.830 a.u.; p = 0.033, power = 0.60), indicating a progressive shift towards lower minima with increasing pain. This pattern is compatible with impaired tonic support and delayed/insufficient lowlevel activation of the multifidus during hip flexion, aligning with a weakened lumbopelvic control contribution by the deep extensors.
By contrast, right internal oblique and left thoracic erector spinae exhibited progressive increases in mean raw EMG with pain (R_Int_Oblique meanRAW: −1.76×10⁻⁴ → 4.86×10⁻⁴ → 7.21×10⁻⁴; p = 0.051, power = 0.51; L_ThoracicEs meanRAW: −4.92×10⁻⁴ → 3.94×10⁻⁵ → 7.43×10⁻⁴; p = 0.052, power = 0.536). Although these trends are borderline and do not meet conventional significance (α=0.05), they are directionally consistent with compensatory recruitment of superficial trunk muscles during SSLR when MF muscles support is diminished.
Taken together, the SSLR EMG pattern suggests a painrelated reorganization of trunk muscle control characterized by reduced minimal activation of the (left) multifidus and increased mean activation of abdominal/thoracic extensors. This is consistent with a shift of lumbopelvic stabilization from deep to more superficial musculature during the task, which may reflect a compensatory but less efficient control strategy.

Table 8.
Electromyographic Trunk Muscle Responses During the Seated Straight Leg Raise Across Pain Groups.
Table 8.
Electromyographic Trunk Muscle Responses During the Seated Straight Leg Raise Across Pain Groups.
| measurement | term | p value | power | Mean no Pain | Mean Low intensity pain | Mean High-intensity pain |
|---|---|---|---|---|---|---|
| L_Multifidii | minENV | 0.033 | 0.6 | 1.8 | 0.43 | -0.83 |
| R_Int_Oblique | meanRAW | 0.053 | 0.43 | -0.00018 | 0.0004 | 0.000721 |
| L_ThoracicEs | meanRAW | 0.050 | 0.41 | -0.00049 | 3.94E-05 | 0.000743 |
3.5. Core Strength
Peak flexion torque at 0° was higher in the high pain group compared with healthy controls (1.67 vs 1.28 Nm·kg⁻¹; +31%; p = 0.033, power = 0.607), while the comparison at 10° did not reach significance despite a numerically similar trend (1.58 vs 1.24 Nm·kg⁻¹; p = 0.702, power = 0.067). In contrast, peak extension torque was reduced in pain groups at 0° and 15° (0°: 2.62 vs 3.01 Nm·kg⁻¹, −13%; p = 0.029, power = 0.634; 15°: 2.73 vs 3.19 Nm·kg⁻¹, −14%; p = 0.016, power = 0.724), whereas the difference at 30° was not significant (2.82 vs 3.13 Nm·kg⁻¹; p = 0.879, power = 0.053) (Table 9).
4. Discussion
The findings of the present study support and extend existing evidence that patients with low back pain (LBP) can benefit from the application of emerging technologies such as inertial measurement units (IMUs) in combination with electromyographic (EMG) analyses within a functional diagnostic setup [37,38]. Compared with MRI and CT imaging—which provide only static snapshots of the spine and surrounding structures, such as multifidus atrophy—IMU sensors enable to capture kinematic data (acceleration, angular velocity) during real-life movements, while EMG signals simultaneously offer objective information on the electrical activation patterns of the musculature. This combined approach allows the diagnosis of deficits such as delayed anticipatory postural adjustments (APA) or a disturbed flexion–relaxation phenomenon.
Given the complex pathogenesis and diagnostic challenges of LBP—particularly regarding the specification of treatment pathways and subsequent therapy stratification—a functional assessment should comprise analysis of gait phases, evaluation of neuromuscular control during stance, assessment of movement control through flexion and extension bending tasks, measurement of lumbopelvic stability via a modified slump test, and determination of trunk muscle strength capacity. On the one hand, LBP patients frequently exhibit deficits in these subcategories compared with healthy individuals; on the other hand, such a comprehensive diagnostic approach enables highly differentiated specification of neuromuscular deficits.
4.1. Functional Assessment
4.1.1. Fatigue Resistance/Strength Endurance - Gait Analysis
Both the accelerometers positioned at the L3–L5 level and at the pelvis, as well as the EMG analysis of the bilateral multifidus (MF) muscles, revealed significant differences in the LBP group compared with the healthy control group. In the present study, IMU data from LBP patients demonstrated markedly altered movement dynamics, characterised by abrupt changes in acceleration with increasing pain intensity. This finding aligns with the results of Xiaomeng Xu et al., who examined gait phases in LBP patients during the remission phase. They attributed [39] the altered movement amplitudes to reduced MF activity during gait, resulting from increased fatty infiltration and neuromuscular dysfunction of the MF. This loss of stability leads to uncontrolled micro-movements of the spine at the lumbopelvic junction, further perpetuating the pain cycle [40]
Moreover, the duration of MF EMG activity was reduced in the LBP group. Similar findings were reported by Jo Armour Smith et al., who investigated young asymptomatic individuals with a history of prolonged LBP episodes and likewise observed diminished EMG signals of the multifidus compared with healthy subjects. These changes suggest compensatory neuromuscular strategies that aim to stabilise the spine while simultaneously avoiding pain. This may be explained by reduced a pelvic mobility due to increased pain-associated stiffness at the lumbopelvic junction [41,42].
However, these results are in contrast to those of Bryndal et al., who demonstrated consistently higher MF muscle activation throughout the gait cycle in LBP patients compared with healthy participants [43]. The contradictory findings may be attributable to the tendency of LBP patients toward inefficient neuromuscular activation of agonists and antagonists, even during gait. It is conceivable that baseline MF activation is initially higher than in healthy individuals but declines significantly with increasing walking duration and speed due to accelerated fatigue, resulting in a marked decrease in EMG signals over the course of the assessment [44,45]. Furthermore, both pain intensity and pain phase—acute versus chronic—may influence muscle activation and contribute to conflicting study outcomes [46].
4.1.2. Neuromuscular Control
Consistent with previous studies, the pain groups exhibited increased center-of-pressure (CoP) track length and elevated power spectral density (PSD) during unilateral stance [47,48]. Additional significant differences were observed in the IMU sensor metrics as well as in EMG parameters of the multifidus (MF). The rise in spectral energy in both low- and high-frequency bands, together with altered power distribution along the X- and Y-axes, suggests axis-specific reweighting of postural control in LBP patients.
Despite the enlarged sway area, overall sway distance and velocity decreased, indicating reduced displacement amplitude but increased oscillatory frequency. Combined with the altered activation patterns of MF EMG parameters and the shifted minimum and maximum raw signal values of the erector spinae (ES), these findings point to a pain-related reorganisation of trunk muscle activity during postural control, characterised by tonic changes in MF activation and greater involvement of the thoracic ES.
Both the significantly altered acceleration values and the modified sway patterns, along with changes in EMG parameters, may be explained by inconsistent activation and recruitment of the MF [49]. Overall, this pattern reflects a pain-related postural strategy marked by stiffer, higher-frequency control with broader spatial sway and redistribution of force across axes. Consequently, larger muscle groups such as the erector spinae assume movement control, leading to compensatory irregular acceleration patterns of the spine and sudden movements and braking behavior of the body’s center of mass during single-leg stance [47,50].
4.1.3. Mobility Bending
Although the present study included lateral flexion and rotation bending tasks, significant differences between LBP patients and healthy participants were observed only in flexion and extension bending, both in IMU and EMG analyses. The pain group differed significantly in acceleration parameters as well as in MF EMG activity. Altered pelvic tilt combined with reduced MF EMG signals during flexion suggests increased tonic activation and diminished relaxation of the MF during the flexion phase. In contrast, MF EMG signals during extension were characterized by heightened tonic activation of thoracic and deep paraspinal muscles, likely reflecting protective co-contraction during re-extension.
Taken together, these findings indicate a pain-related movement strategy marked by restricted lumbar and pelvic motion and acceleration, accompanied by elevated baseline paraspinal activity consistent with a protective posture. IMU parameters revealed that LBP participants exhibited both a reduced range of motion in both directions and lower overall acceleration throughout the bending trajectory. These deviations may be explained by movement-related fear (kinesiophobia) within the framework of the fear-avoidance model, as well as by insufficient extension strength [51,52].
Additionally, the LBP group demonstrated altered temporal coordination (timing) between movement (IMU) and muscle activation (EMG). While baseline MF EMG tension was elevated, maximum muscle activation was reduced compared with healthy controls [44,53]. On a neuro-muscular level this may reflect inefficient MF activation combined with increased recruitment of the erector spinae [54]. Morphological fatty infiltration of the MF plays a critical role in these recruitment patterns and associated changes in motor control processes, progressively increasing from acute through subacute/recurring to chronic conditions [54].
4.1.4. Lumbar-Pelvic Stability
In the present study, significant group differences were also observed during assessment of lumbopelvic stability using the Sitting Straight Leg Raise (SSLR) test. Analysis of IMU data indicated that the pain-free group was able to maintain stability of the lumbopelvic junction during leg elevation, whereas LBP patients exhibited an immediate posterior pelvic tilt. Bednar et al. attribute lateral pelvic tilt to influence insufficient lumbopelvic control [55,56].
The IMU data were temporally correlated with EMG recordings of the multifidus (MF). At the moment of pelvic tilting, EMG sensors showed a marked signal drop. Furthermore, MF EMG signals demonstrated a delayed onset, lagging behind the movement. Both factors suggest that movement control of the lumbopelvic junction is compensatory shifted from the MF to the superficial back extensors (erector spinae). This less efficient neuromuscular control, combined with inadequate force transmission and increased instability of the lumbopelvic junction, may represent a risk factor for the development of LBP [46,57].
Although both low- and high-intensity pain groups exhibited significantly different values compared with the healthy group, causality in the high-intensity group is likely morphological, associated with advanced MF atrophy and fatty infiltration resulting from prolonged maladaptive loading. In contrast, the significantly altered values in the low-intensity group appear to be primarily attributable to deficits in neural activation [58].
4.1.5. Core Strength
The isometric trunk strength assessment in flexion and extension revealed significantly reduced extension values alongside partially elevated flexion parameters in both pain groups compared with the healthy control group. Consequently, both pain groups deviate from the physiological norm and exhibit an impaired trunk strength balance between flexion and extension—a factor that must be considered a risk for the development and chronification of low back pain. Flexion dominance can be pathologically explained by a neuromuscular compensation strategy involving increased activation of the abdominal musculature (“bracing”) to stabilise the trunk, while extension (lordotic posture) is anticipated as painful. Simultaneously, inhibition of the extensors to avoid nociceptive stimuli may lead to reflexive suppression of deep spinal muscles, particularly the multifidus [56,58,59,60,61].
4.2. Limitations and Future Directions
Given the limited statistical power for some comparisons, the results should be interpreted with caution and confirmed in larger samples with appropriate multiplicity control. Measurement errors cannot be excluded, particularly due to repeated rotational and flexion movements at maximum range of motion. The close proximity of EMG and IMU sensors may have led to occasional contact during test execution, potentially causing artefacts that were erroneously interpreted as significant results. To minimise such misinterpretations, all initial statistical findings were independently reviewed for plausibility by two separate evaluators, and implausible values were excluded from the final analysis.
For improved accuracy, future test setups should include an additional IMU sensor at the thoracolumbar junction (T7–T1) to enable more precise assessment of overall spinal stability. Furthermore, clinical imaging of the spine was not available for the patients analysed in this study; therefore, potential associations between inflammatory factors or other morphological pathologies and MF functional impairment could not be addressed and might be investigated in future research.
Finally, the present assessment was conducted under laboratory conditions. Current evidence suggests that IMU and EMG technologies are suitable for advancing understanding of the functional pathogenesis of LBP. However, future diagnostic setups should leverage AI-based analysis methods and wearable systems that allow continuous monitoring over extended periods in real-life settings. This approach would avoid artificially modelled scenarios typical of laboratory environments and instead capture the natural development of functional deficits.
5. Conclusions
Nevertheless, the integrated application of novel technological devices in combination with functional screening already offers the opportunity to transform LBP diagnostics from a primarily imaging-based approach to a functional paradigm. Incorporating objective measurement data enabled by wearables and technical devices can lead to a deeper understanding of disease mechanisms and pain genesis, fundamentally changing clinical evaluation and also therapeutic strategies.
This is particularly relevant in light of findings by M. O’Keeffe et al., who demonstrated that accurate diagnostic assessment of back pain has therapeutic potential: specifically identifying the causal pain mechanism reduces the need for surgical interventions or further imaging and simultaneously improves both subjective pain experience and patient prognosis [28,62,63]
Although MRI and CT remain indispensable for identifying pathologies as fractures or tumours (among other “red flags”), the combination of EMG and IMU represents a superior tool for diagnosing the mechanical and neuromuscular causes of chronic back pain. The combination the mentioned methods detects causal relationships: IMUs document mechanical dysfunction (e.g., stiffness or instability), while EMG identifies the underlying neuromuscular cause (atrophy, inhibition, or misactivation of the multifidus). This enables individualised therapy planning reaching far beyond subjective pain scales and standardized training programs. The diagnostic tool set is radiation-free, cost-effective, and reliable. Furthermore, they allow the objective re-evaluation of neuromuscular adaptation progress (e.g., following stabilisation training) and provide patients with a direct feedback on muscle activation through biofeedback.
Author Contributions
Conceptualization, P.F. and F.C.W.; methodology, P.F. and F.C.W. and H.K..; software, J.J.K..; formal analysis, J.J.K. and H.K.; data curation, J.J.K and J-J.F. and H.K..; writing—original draft preparation, P.F. and F.C.W. and J.J.K and J-J.F.; writing—review and editing, A.C.D. and H.K.; visualization, J-J.F., and P.F..; supervision, A.C.D.; project administration, A.C.D.. All authors have read and agreed to the published version of the manuscript.
Funding
This research received external funding of Bundesministerium für Bildung und Forschung (BMBF).
Institutional Review Board Statement
The study was conducted in accordance with the Declaration of Helsinki, and approved by the Ethics Committee at TU Dresden (protocol code: BO-EK-215052022_1) on 15 July 2024.
Informed Consent Statement
Informed consent was obtained from all subjects involved in the study.
Data Availability Statement
Not applicable.
Conflicts of Interest
The authors declare no conflicts of interest.
Appendix A
Appendix A.1 Search Strings
Search strategy:
Population: LBP
Intervention: clinical/functional assessments and EMG
Outcome: functional screening
Comparison: n.a.
Setting: RCT, SR, CT
| Identification | ||
| Database | Search Query | Hits |
| PubMed | ((((“Low Back Pain” OR “LBP”) AND (“functional movement screen*” OR “functional assessment” OR “assessment instruments” OR assessment* OR FMS OR “EMG” OR “NRS”)) AND (diagn* OR prevent* OR control)) NOT (therapy OR reha* OR fractur* OR pregnancy OR imag* OR prevalence OR EEG OR effect* OR stress OR question* OR biomark* OR inflam*)) | n = 296 |
| CINAHL | n = 40 | |
| Screening | ||
| Results reviewed for duplicates | n = 312 | |
| Excluded after title abstract screening | n = 213 | |
| full texts checked for suitability | n = 99 | |
| full texts checked for suitability | n = 99 | |
| excluded | reason | case number |
| No access to full text/no full text (too old) | n = 29 | |
| Population | different search terms (no LBP) | n = 35 |
| Intervention | different intervention | n = 12 |
| Outcome | different outcome | n = 13 |
| Studies included in Rewiev | n = 10 |
References
- Duhautois, R; Erhel, C; Guergoat-Larivière, M; Mofakhami, M. More and Better Jobs, But Not for Everyone: Effects of Innovation in French Firms. ILR Rev. 2022, 75, 90–116. [Google Scholar]
- Rose, SJ. The Growth of the Office Economy: Underrecognized Sector in High-Income Economies. Crit Sociol. 2021, 47, 795–805. [Google Scholar] [CrossRef]
- Parry, S; Straker, L. The contribution of office work to sedentary behaviour associated risk. BMC Public Health 2013, 13, 296. [Google Scholar] [CrossRef] [PubMed]
- Ferreira, ML; de, Luca K; Haile, LM; Steinmetz, JD; Culbreth, GT; Cross, M; et al. Global, regional, and national burden of low back pain, 1990–2020, its attributable risk factors, and projections to 2050: a systematic analysis of the Global Burden of Disease Study 2021. Lancet Rheumatol. 2023, 5, e316–e329. [Google Scholar] [CrossRef] [PubMed]
- Violante, FS; Mattioli, S; Bonfiglioli, R. Low-back pain. In Handbook of Clinical Neurology [Internet]; Elsevier, 2015; pp. 397–410. Available online: https://www.sciencedirect.com/science/chapter/handbook/abs/pii/B9780444626271000202?via%3Dihub (accessed on 14 January 2026).
- Hoy, D; March, L; Brooks, P; Blyth, F; Woolf, A; Bain, C; et al. The global burden of low back pain: estimates from the Global Burden of Disease 2010 study. Ann Rheum Dis. 2014, 73, 968–974. [Google Scholar] [CrossRef]
- Schmidt, CO; Raspe, H; Pfingsten, M; Hasenbring, M; Basler, HD; Eich, W; et al. Back Pain in the German Adult Population: Prevalence, Severity, and Sociodemographic Correlates in a Multiregional Survey. Spine 2007, 32, 2005–2011. [Google Scholar] [CrossRef]
- Brinjikji, W; Luetmer, PH; Comstock, B; Bresnahan, BW; Chen, LE; Deyo, RA; et al. Systematic literature review of imaging features of spinal degeneration in asymptomatic populations. AJNR Am J Neuroradiol. 2015, 36, 811–816. [Google Scholar] [CrossRef]
- Webster, BS; Bauer, AZ; Choi, Y; Cifuentes, M; Pransky, GS. Iatrogenic consequences of early magnetic resonance imaging in acute, work-related, disabling low back pain. Spine 2013, 38, 1939–1946. [Google Scholar] [CrossRef]
- Chou, R; Qaseem, A; Owens, DK; Shekelle, P; Clinical Guidelines Committee of the American College of Physicians. Diagnostic imaging for low back pain: advice for high-value health care from the American College of Physicians. Ann Intern Med. 2011, 154, 181–189. [Google Scholar] [CrossRef]
- Hall, AM; Aubrey-Bassler, K; Thorne, B; Maher, CG. Do not routinely offer imaging for uncomplicated low back pain. BMJ. 2021, 372, n291. [Google Scholar] [CrossRef]
- Downie, A; Hancock, M; Jenkins, H; Buchbinder, R; Harris, I; Underwood, M; et al. How common is imaging for low back pain in primary and emergency care? Systematic review and meta-analysis of over 4 million imaging requests across 21 years. Br J Sports Med. 2020, 54, 642–651. [Google Scholar] [CrossRef]
- Jenkins, HJ; Downie, AS; Maher, CG; Moloney, NA; Magnussen, JS; Hancock, MJ. Imaging for low back pain: is clinical use consistent with guidelines? A systematic review and meta-analysis. Spine J Off J North Am Spine Soc. 2018, 18, 2266–2277. [Google Scholar] [CrossRef] [PubMed]
- Sánchez-Zuriaga, D; López-Pascual, J; Garrido-Jaén, D; de Moya, MFP; Prat-Pastor, J. Reliability and validity of a new objective tool for low back pain functional assessment. Spine 2011, 36, 1279–1288. [Google Scholar] [CrossRef] [PubMed]
- Rosenberg, N. Objective Measurement of Musculoskeletal Pain: A Comprehensive Review. Diagnostics 2025, 15, 1581. [Google Scholar] [CrossRef] [PubMed]
- Chu, Y; Zhao, X; Han, J; Su, Y. Physiological Signal-Based Method for Measurement of Pain Intensity. Front Neurosci [Internet]. 26 May 2017, 11. Available online: https://www.frontiersin.org/journals/neuroscience/articles/10.3389/fnins.2017.00279/full (accessed on 14 January 2026).
- Wang, X; Jia, R; Li, J; Zhu, Y; Liu, H; Wang, W; et al. Research Progress on the Mechanism of Lumbarmultifidus Injury and Degeneration. Oxid Med Cell Longev. 2021, 2021, 6629037. [Google Scholar] [CrossRef]
- Abd-Elsayed, A; Kurt, E; Kollenburg, L; Hasoon, J; Wahezi, SE; Storlie, NR. Lumbar Multifidus Dysfunction and Chronic Low Back Pain: Overview, Therapies, and an Update on the Evidence. Pain Pract Off J World Inst Pain. 2025, 25, e70044. [Google Scholar] [CrossRef]
- Foster, NE; Anema, JR; Cherkin, D; Chou, R; Cohen, SP; Gross, DP; et al. Prevention and treatment of low back pain: evidence, challenges, and promising directions. The Lancet 2018, 391, 2368–2383. [Google Scholar] [CrossRef]
- da Silva, RA; Vieira, ER; Cabrera, M; Altimari, LR; Aguiar, AF; Nowotny, AH; et al. Back muscle fatigue of younger and older adults with and without chronic low back pain using two protocols: A case-control study. J Electromyogr Kinesiol Off J Int Soc Electrophysiol Kinesiol. 2015, 25, 928–936. [Google Scholar]
- Abdelaty, EM; Shendy, S; Lotfy, O; Hassan, KA. The difference in multifidus muscle morphology and motor control in non-specific low back pain with clinical lumbar instability and healthy subjects: A case-control study. Physiother Res Int J Res Clin Phys Ther. 2024, 29, e2047. [Google Scholar] [CrossRef]
- Jung, SH; Hwang, UJ; Ahn, SH; Kim, HA; Kim, JH; Kwon, OY. Lumbopelvic motor control function between patients with chronic low back pain and healthy controls: a useful distinguishing tool: The STROBE study. Medicine (Baltimore) 2020, 99, e19621. [Google Scholar]
- Behennah, J; Conway, R; Fisher, J; Osborne, N; Steele, J. The relationship between balance performance, lumbar extension strength, trunk extension endurance, and pain in participants with chronic low back pain, and those without. Clin Biomech. 2018, 53, 22–30. [Google Scholar]
- van Dieën, JH; Reeves, NP; Kawchuk, G; van Dillen, LR; Hodges, PW. Motor Control Changes in Low Back Pain: Divergence in Presentations and Mechanisms. J Orthop Sports Phys Ther. 2019, 42, 11. [Google Scholar] [CrossRef] [PubMed]
- O’Sullivan, PB; Caneiro, JP; O’Keeffe, M; Smith, A; Dankaerts, W; Fersum, K; et al. Cognitive Functional Therapy: An Integrated Behavioral Approach for the Targeted Management of Disabling Low Back Pain. Phys Ther. 2018, 98, 408–423. [Google Scholar] [CrossRef] [PubMed]
- Shakourisalim, M; Martinez, KB; Golabchi, A; Tavakoli, M; Rouhani, H. Estimation of lower back muscle force in a lifting task using wearable IMUs. J Biomech. 2024, 167, 112077. [Google Scholar] [CrossRef]
- O’Sullivan, P; Caneiro, JP; O’Keeffe, M; O’Sullivan, K. Unraveling the Complexity of Low Back Pain. J Orthop Sports Phys Ther. 2016, 46, 932–937. [Google Scholar] [CrossRef]
- Kumar, R; Marla, K; Sporn, K; Paladugu, P; Khanna, A; Gowda, C; et al. Emerging Diagnostic Approaches for Musculoskeletal Disorders: Advances in Imaging, Biomarkers, and Clinical Assessment. Diagnostics [Internet]. 27 June 2025, 15. Available online: https://www.mdpi.com/2075-4418/15/13/1648 (accessed on 14 January 2026).
- Klasen, BW; Hallner, D; Schaub, C; Willburger, R; Hasenbring, M. Validation and reliability of the German version of the Chronic Pain Grade questionnaire in primary care back pain patients. Psycho-Soc Med. 2004, 1, Doc07. [Google Scholar]
- Ekstrom, RA; Osborn, RW; Hauer, PL. Surface electromyographic analysis of the low back muscles during rehabilitation exercises. J Orthop Sports Phys Ther. 2008, 38, 736–745. [Google Scholar]
- Hermens, HJ; Freriks, B; Disselhorst-Klug, C; Rau, G. Development of recommendations for SEMG sensors and sensor placement procedures. J Electromyogr Kinesiol Off J Int Soc Electrophysiol Kinesiol. 2000, 10, 361–374. [Google Scholar]
- Phothirook, P; Amatachaya, S; Peungsuwan, P; Phothirook, P; Amatachaya, S; Peungsuwan, P. Muscle Activity and Co-Activation of Gait Cycle during Walking in Water and on Land in People with Spastic Cerebral Palsy. Int J Environ Res Public Health [Internet]. 19 Jan 2023, 20. Available online: https://www.mdpi.com/1660-4601/20/3/1854 (accessed on 19 January 2026).
- Koltermann, JJ; Gerber, M. Quantification of the Dependence of the Measurement Error on the Quantization of the A/D Converter for Center of Pressure Measurements. Biomechanics 2022, 2, 309–318. [Google Scholar] [CrossRef]
- Clark, RA; Bryant, AL; Pua, Y; McCrory, P; Bennell, K; Hunt, M. Validity and reliability of the Nintendo Wii Balance Board for assessment of standing balance. Gait Posture 2010, 31, 307–310. [Google Scholar] [CrossRef]
- Koltermann, JJ; Beck, H; Beck, M; Beck, H; Beck, M. Investigation of the Correlation between Factors Influencing the Spectrum of Center of Pressure Measurements Using Dynamic Controlled Models of the Upright Stand and Subject Measurements. Appl Sci [Internet]. 28 May 2020, 10. Available online: https://www.mdpi.com/2076-3417/10/11/3741 (accessed on 14 January 2026).
- Koltermann, JJ; Gerber, M; Beck, H; Beck, M. Validation of Different Filters for Center of Pressure Measurements by a Cross-Section Study. Technologies [Internet]. 2019, 7. Available online: https://www.mdpi.com/2227-7080/7/4/68 (accessed on 14 January 2026).
- Kongsted, A; Kent, P; Quicke, JG; Skou, ST; Hill, JC. Risk-stratified and stepped models of care for back pain and osteoarthritis: are we heading towards a common model? Pain Rep. 2020, 5, e843. [Google Scholar] [CrossRef] [PubMed]
- Tagliaferri, SD; Miller, CT; Owen, PJ; Mitchell, UH; Brisby, H; Fitzgibbon, B; et al. Domains of Chronic Low Back Pain and Assessing Treatment Effectiveness: A Clinical Perspective. Pain Pract Off J World Inst Pain. 2020, 20, 211–225. [Google Scholar]
- Xu, X; Sekiguchi, Y; Honda, K; Izumi, SI. Motion analysis of 3D multi-segmental spine during gait in symptom remission people with low back pain: a pilot study. BMC Musculoskelet Disord. 2025, 26, 269. [Google Scholar] [CrossRef]
- Smith, JA; Kulig, K. Altered Multifidus Recruitment During Walking in Young Asymptomatic Individuals With a History of Low Back Pain. J Orthop Sports Phys Ther. 2016, 46, 365–374. [Google Scholar] [CrossRef] [PubMed]
- Al-Eisa, E; Egan, D; Deluzio, K; Wassersug, R. Effects of pelvic asymmetry and low back pain on trunk kinematics during sitting: a comparison with standing. Spine 2006, 31, E135–E143. [Google Scholar] [CrossRef]
- Yu, Q; Huang, H; Zhang, Z; Hu, X; Li, W; Li, L; et al. The association between pelvic asymmetry and non-specific chronic low back pain as assessed by the global postural system. BMC Musculoskelet Disord. 2020, 21, 596. [Google Scholar]
- Bryndal, A; Nawos-Wysocki, W; Grochulska, A; Łosiński, K; Glowinski, S. Effects of gait speed on paraspinal muscle activation: an sEMG analysis of the multifidus and erector spinae. PeerJ. 2025, 13, e19244. [Google Scholar] [CrossRef]
- Danneels, LA; Coorevits, PL; Cools, AM; Vanderstraeten, GG; Cambier, DC; Witvrouw, EE; et al. Differences in electromyographic activity in the multifidus muscle and the iliocostalis lumborum between healthy subjects and patients with sub-acute and chronic low back pain. Eur Spine J Off Publ Eur Spine Soc Eur Spinal Deform Soc Eur Sect Cerv Spine Res Soc. 2002, 11, 13–19. [Google Scholar]
- Zhang, S; Xu, Y; Han, X; Wu, W; Tang, Y; Wang, C. Functional and Morphological Changes in the Deep Lumbar Multifidus Using Electromyography and Ultrasound. Sci Rep. 2018, 8, 6539. [Google Scholar]
- Wattananon, P; Ibrahim, AA; Rujirek, N; Kongoun, S; Klahan, K; Richards, J. Motor unit behavior of lumbar multifidus during a forward trunk bending task performed under different speeds and loads in asymptomatic participants. Sci Rep. 2025, 15, 44822. [Google Scholar] [CrossRef]
- Ruhe, A; Fejer, R; Walker, B. Center of pressure excursion as a measure of balance performance in patients with non-specific low back pain compared to healthy controls: a systematic review of the literature. Eur Spine J Off Publ Eur Spine Soc Eur Spinal Deform Soc Eur Sect Cerv Spine Res Soc. 2011, 20, 358–368. [Google Scholar]
- Koltermann, JJ; Floessel, P; Hammerschmidt, F; Disch, AC; Koltermann, JJ; Floessel, P; et al. A Statistical and AI Analysis of the Frequency Spectrum in the Measurement of the Center of Pressure Track in the Seated Position in Healthy Subjects and Subjects with Low Back Pain. Sensors [Internet]. 9 May 2024, 24. Available online: https://www.mdpi.com/1424-8220/24/10/3011 (accessed on 14 January 2026).
- Hodges, PW; Richardson, CA. Inefficient muscular stabilization of the lumbar spine associated with low back pain. A motor control evaluation of transversus abdominis. Spine 1996, 21, 2640–2650. [Google Scholar] [PubMed]
- van Dieën, JH; Cholewicki, J; Radebold, A. Trunk muscle recruitment patterns in patients with low back pain enhance the stability of the lumbar spine. Spine 2003, 28, 834–841. [Google Scholar] [CrossRef] [PubMed]
- Naqvi, Waqar M; Vaidya, Laukik; Kumar, Kiran. Impact of low back pain on fear of movement and functional activities. Int J Res Pharm Sci. 2020, 11, 4830–4835. [Google Scholar] [CrossRef]
- Zhou, T; Salman, D; McGregor, AlisonH. Recent clinical practice guidelines for the management of low back pain: a global comparison. BMC Musculoskelet Disord. 2024, 25, 344. [Google Scholar] [CrossRef]
- Paoletti, M; Belli, A; Palma, L; Paniccia, M; Tombolini, F; Ruggiero, A; et al. Data acquired by wearable sensors for the evaluation of the flexion-relaxation phenomenon. Data Brief. 2020, 31, 105957. [Google Scholar] [CrossRef]
- Hodges, PW; Danneels, L. Changes in Structure and Function of the Back Muscles in Low Back Pain: Different Time Points, Observations, and Mechanisms. J Orthop Sports Phys Ther. 2019, 49, 464–476. [Google Scholar] [CrossRef]
- Bednar, DA; Bednar, ED. Internal lumbar disc derangement with instability catch from monosegmental discopathy. The forgotten mechanical and kinetic surgical back pain syndrome. Clin Neurol Neurosurg. 2022, 212, 107033. [Google Scholar]
- Sheeran, L; Al-Amri, M; Sparkes, V; Davies, JL; Sheeran, L; Al-Amri, M; et al. Assessment of Spinal and Pelvic Kinematics Using Inertial Measurement Units in Clinical Subgroups of Persistent Non-Specific Low Back Pain. Sensors [Internet]. 26 Mar 2024, 24. Available online: https://www.mdpi.com/1424-8220/24/7/2127 (accessed on 15 January 2026).
- Sorensen, CJ; Johnson, MB; Norton, BJ; Callaghan, JP; Van Dillen, LR. Asymmetry of lumbopelvic movement patterns during active hip abduction is a risk factor for low back pain development during standing. Hum Mov Sci. 2016, 50, 38–46. [Google Scholar] [CrossRef]
- Faur, C; Patrascu, JM; Haragus, H; Anglitoiu, B. Correlation between multifidus fatty atrophy and lumbar disc degeneration in low back pain. BMC Musculoskelet Disord. 2019, 20, 414. [Google Scholar] [CrossRef]
- Lee, JH; Hoshino, Y; Nakamura, K; Kariya, Y; Saita, K; Ito, K. Trunk muscle weakness as a risk factor for low back pain. A 5-year prospective study. Spine 1999, 24, 54–57. [Google Scholar] [CrossRef]
- Dvir, Z; Keating, JL. Trunk Extension Effort in Patients with Chronic Low Back Dysfunction. Spine 2003, 28, 685. [Google Scholar] [CrossRef]
- Reyes-Ferrada, W; Chirosa-Rios, L; Rodriguez-Perea, A; Jerez-Mayorga, D; Chirosa-Rios, I. Isokinetic Trunk Strength in Acute Low Back Pain Patients Compared to Healthy Subjects: A Systematic Review. Int J Environ Res Public Health 2021, 18, 2576. [Google Scholar] [CrossRef]
- O’Keeffe, M; Ferreira, GE; Harris, IA; Darlow, B; Buchbinder, R; Traeger, AC; et al. Effect of diagnostic labelling on management intentions for non-specific low back pain: A randomized scenario-based experiment. Eur J Pain Lond Engl. 2022, 26, 1532–1545. [Google Scholar] [CrossRef]
- Wirth, B; Schweinhardt, P. Personalized assessment and management of non-specific low back pain. Eur J Pain. 2024, 28, 181–198. [Google Scholar] [CrossRef]
Figure 1.
Preparing IMUs and EMG sensors setup.
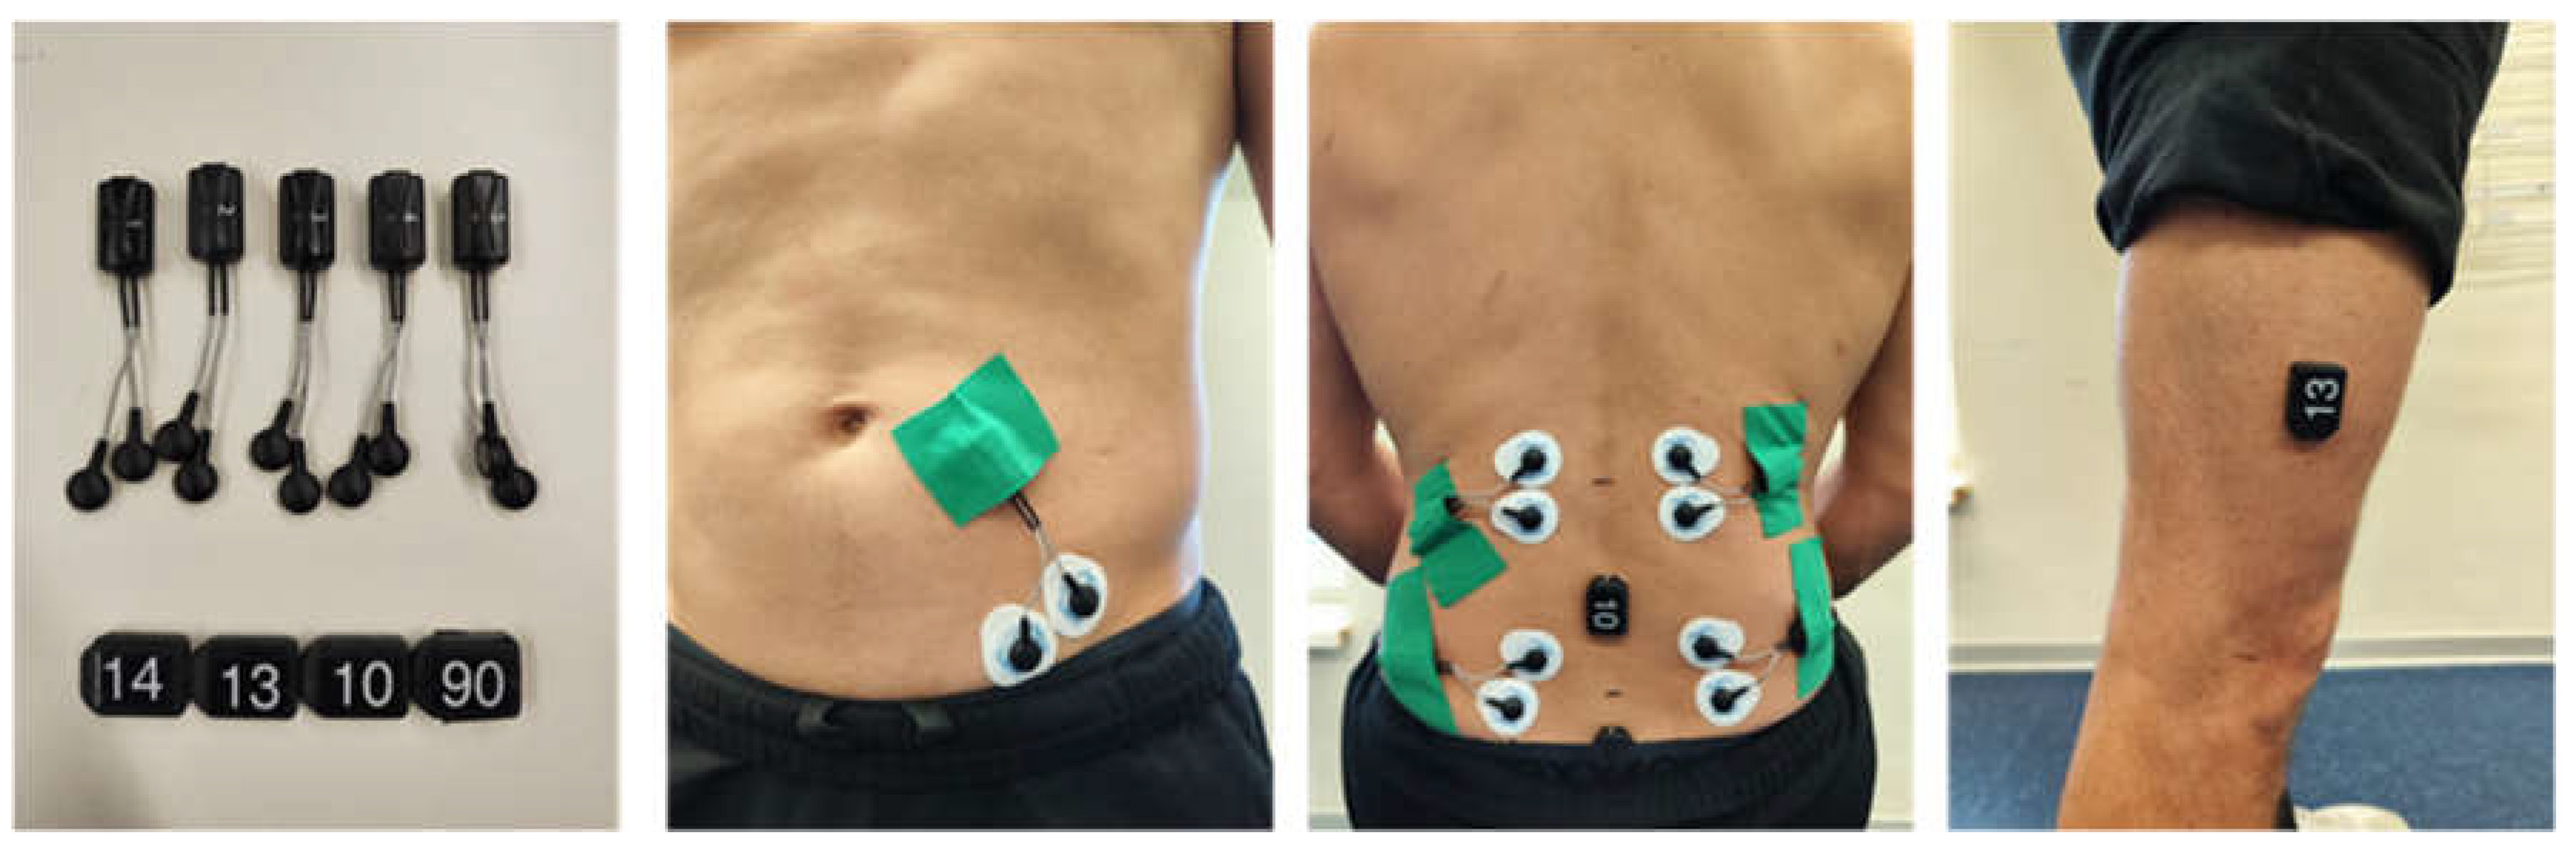
Figure 2.
Assessment of postural control for the analysis of neuromuscular control ability in a standing position.
Figure 2.
Assessment of postural control for the analysis of neuromuscular control ability in a standing position.
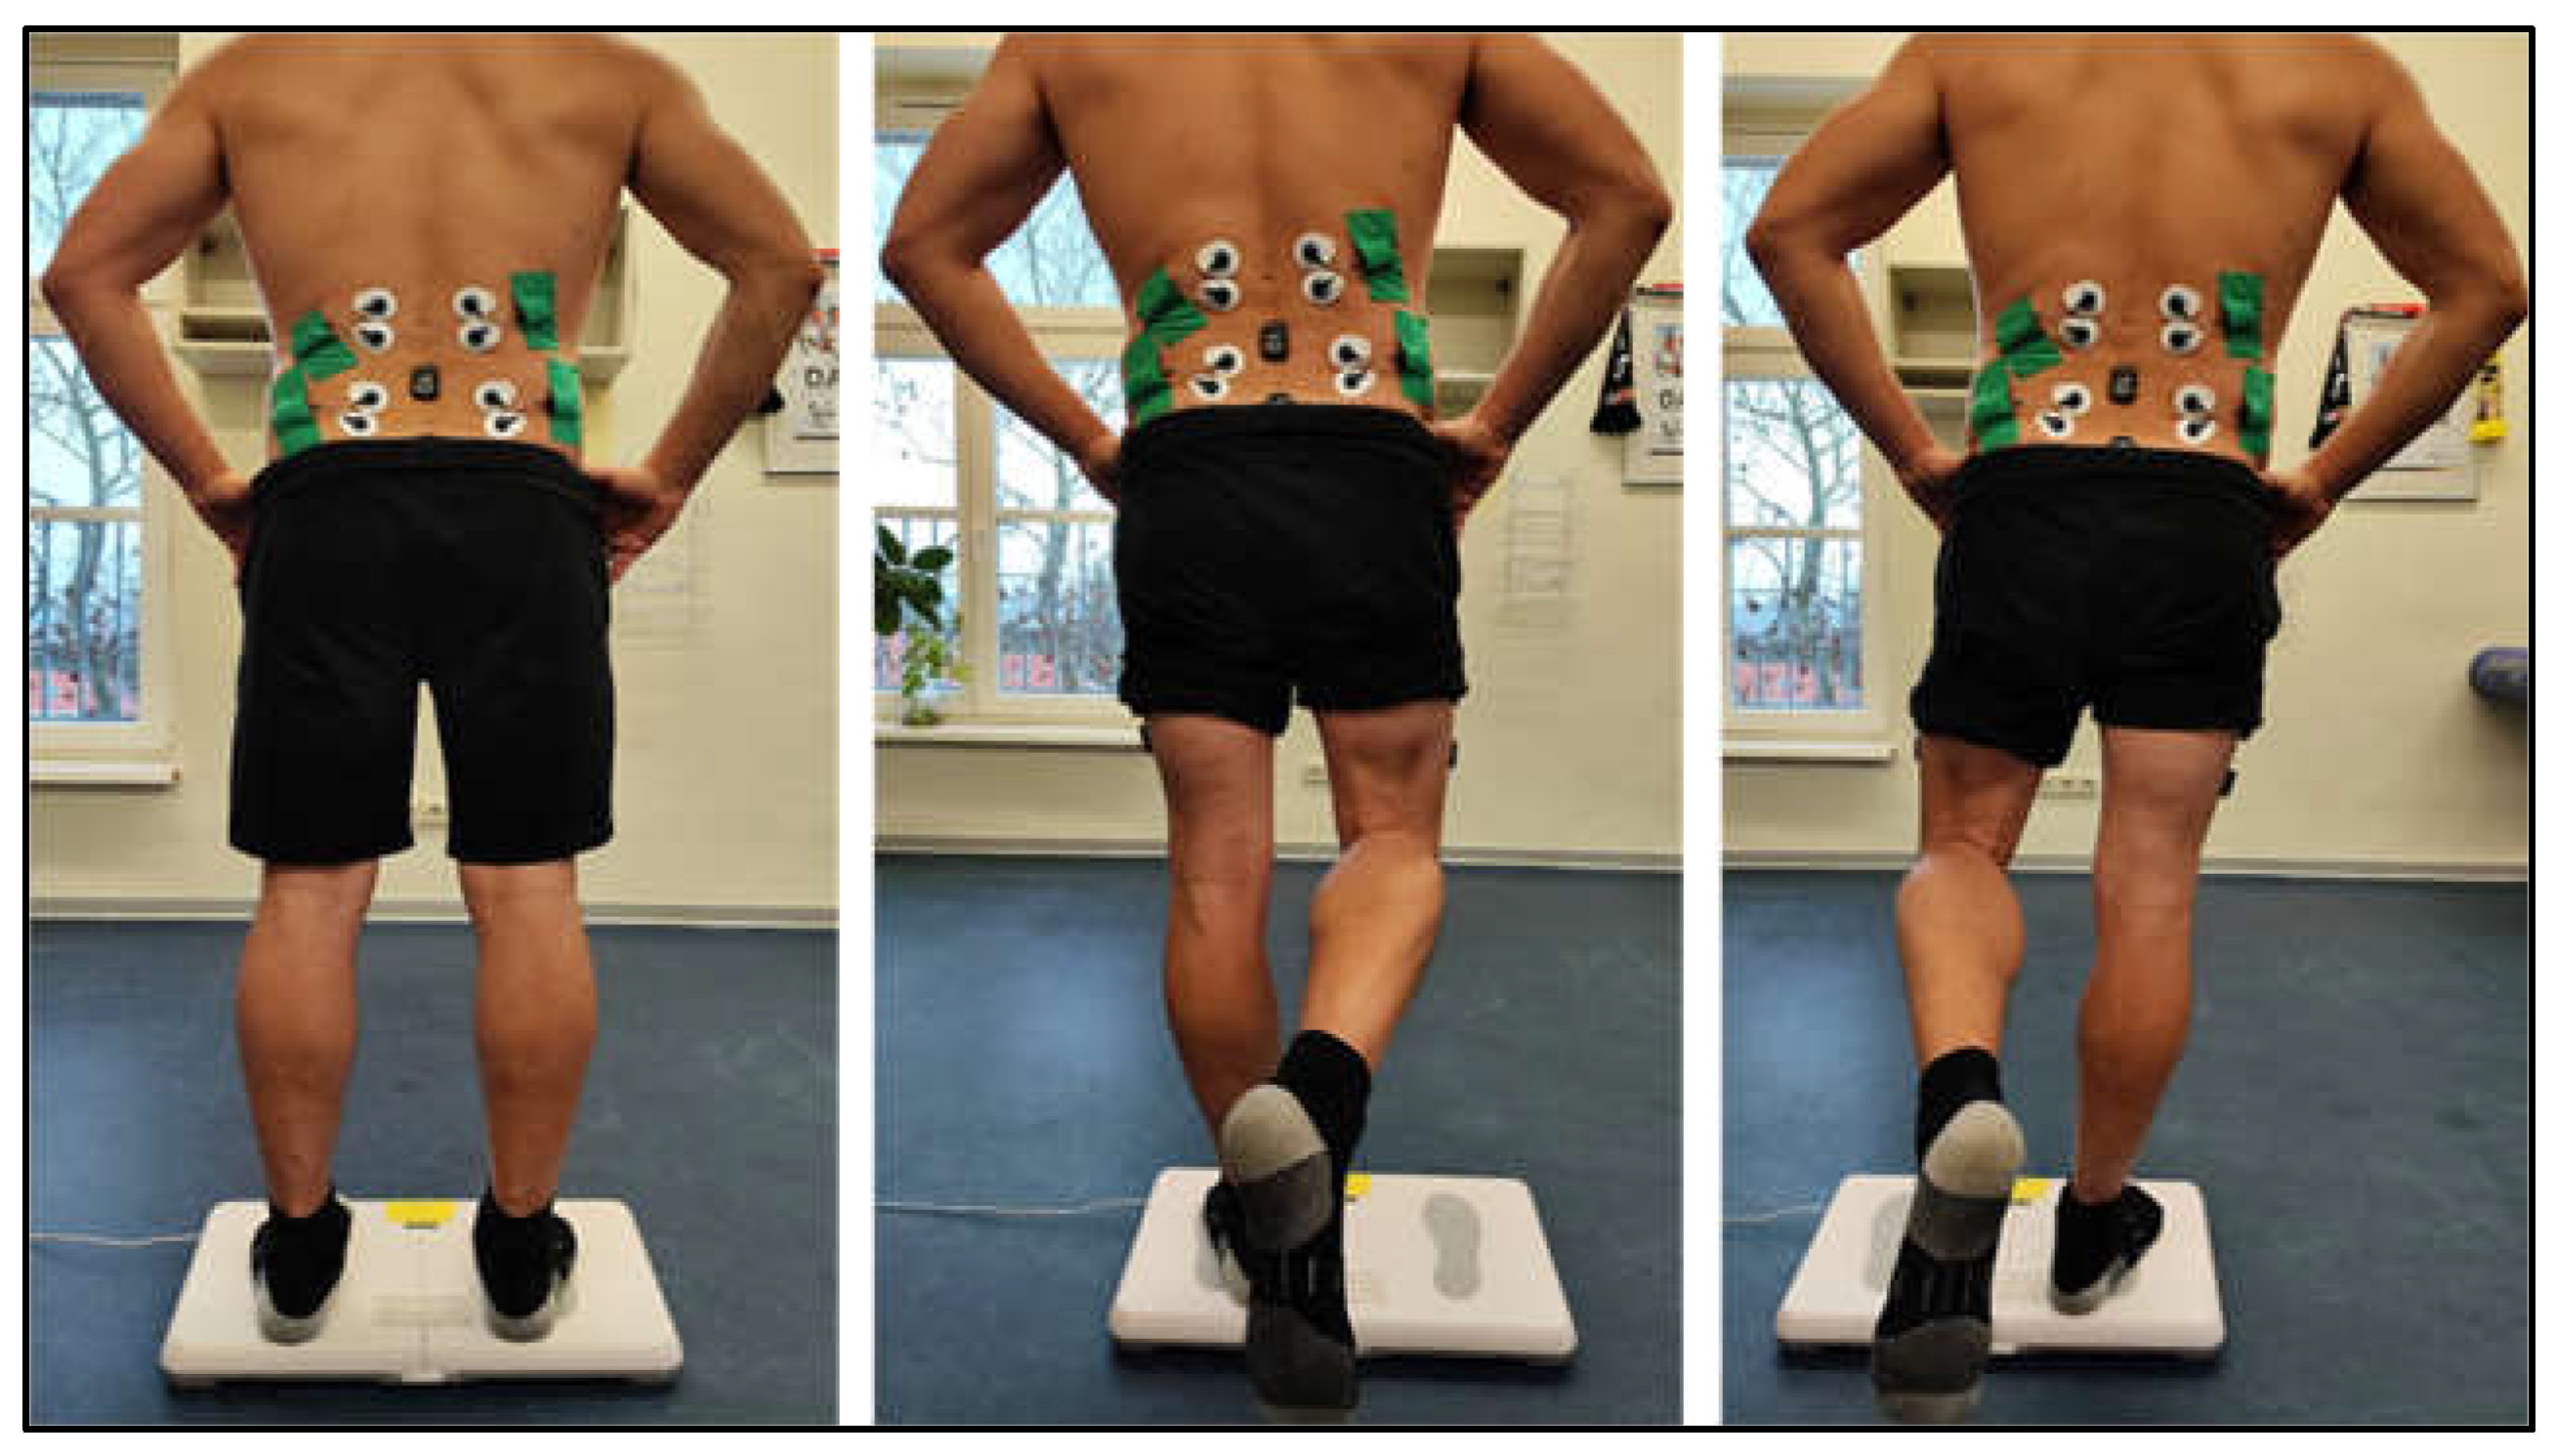
Figure 3.
Assessment of functional spinal movements in stance.

Figure 4.
Assessment of functional spinal movements seated position on the balance board.
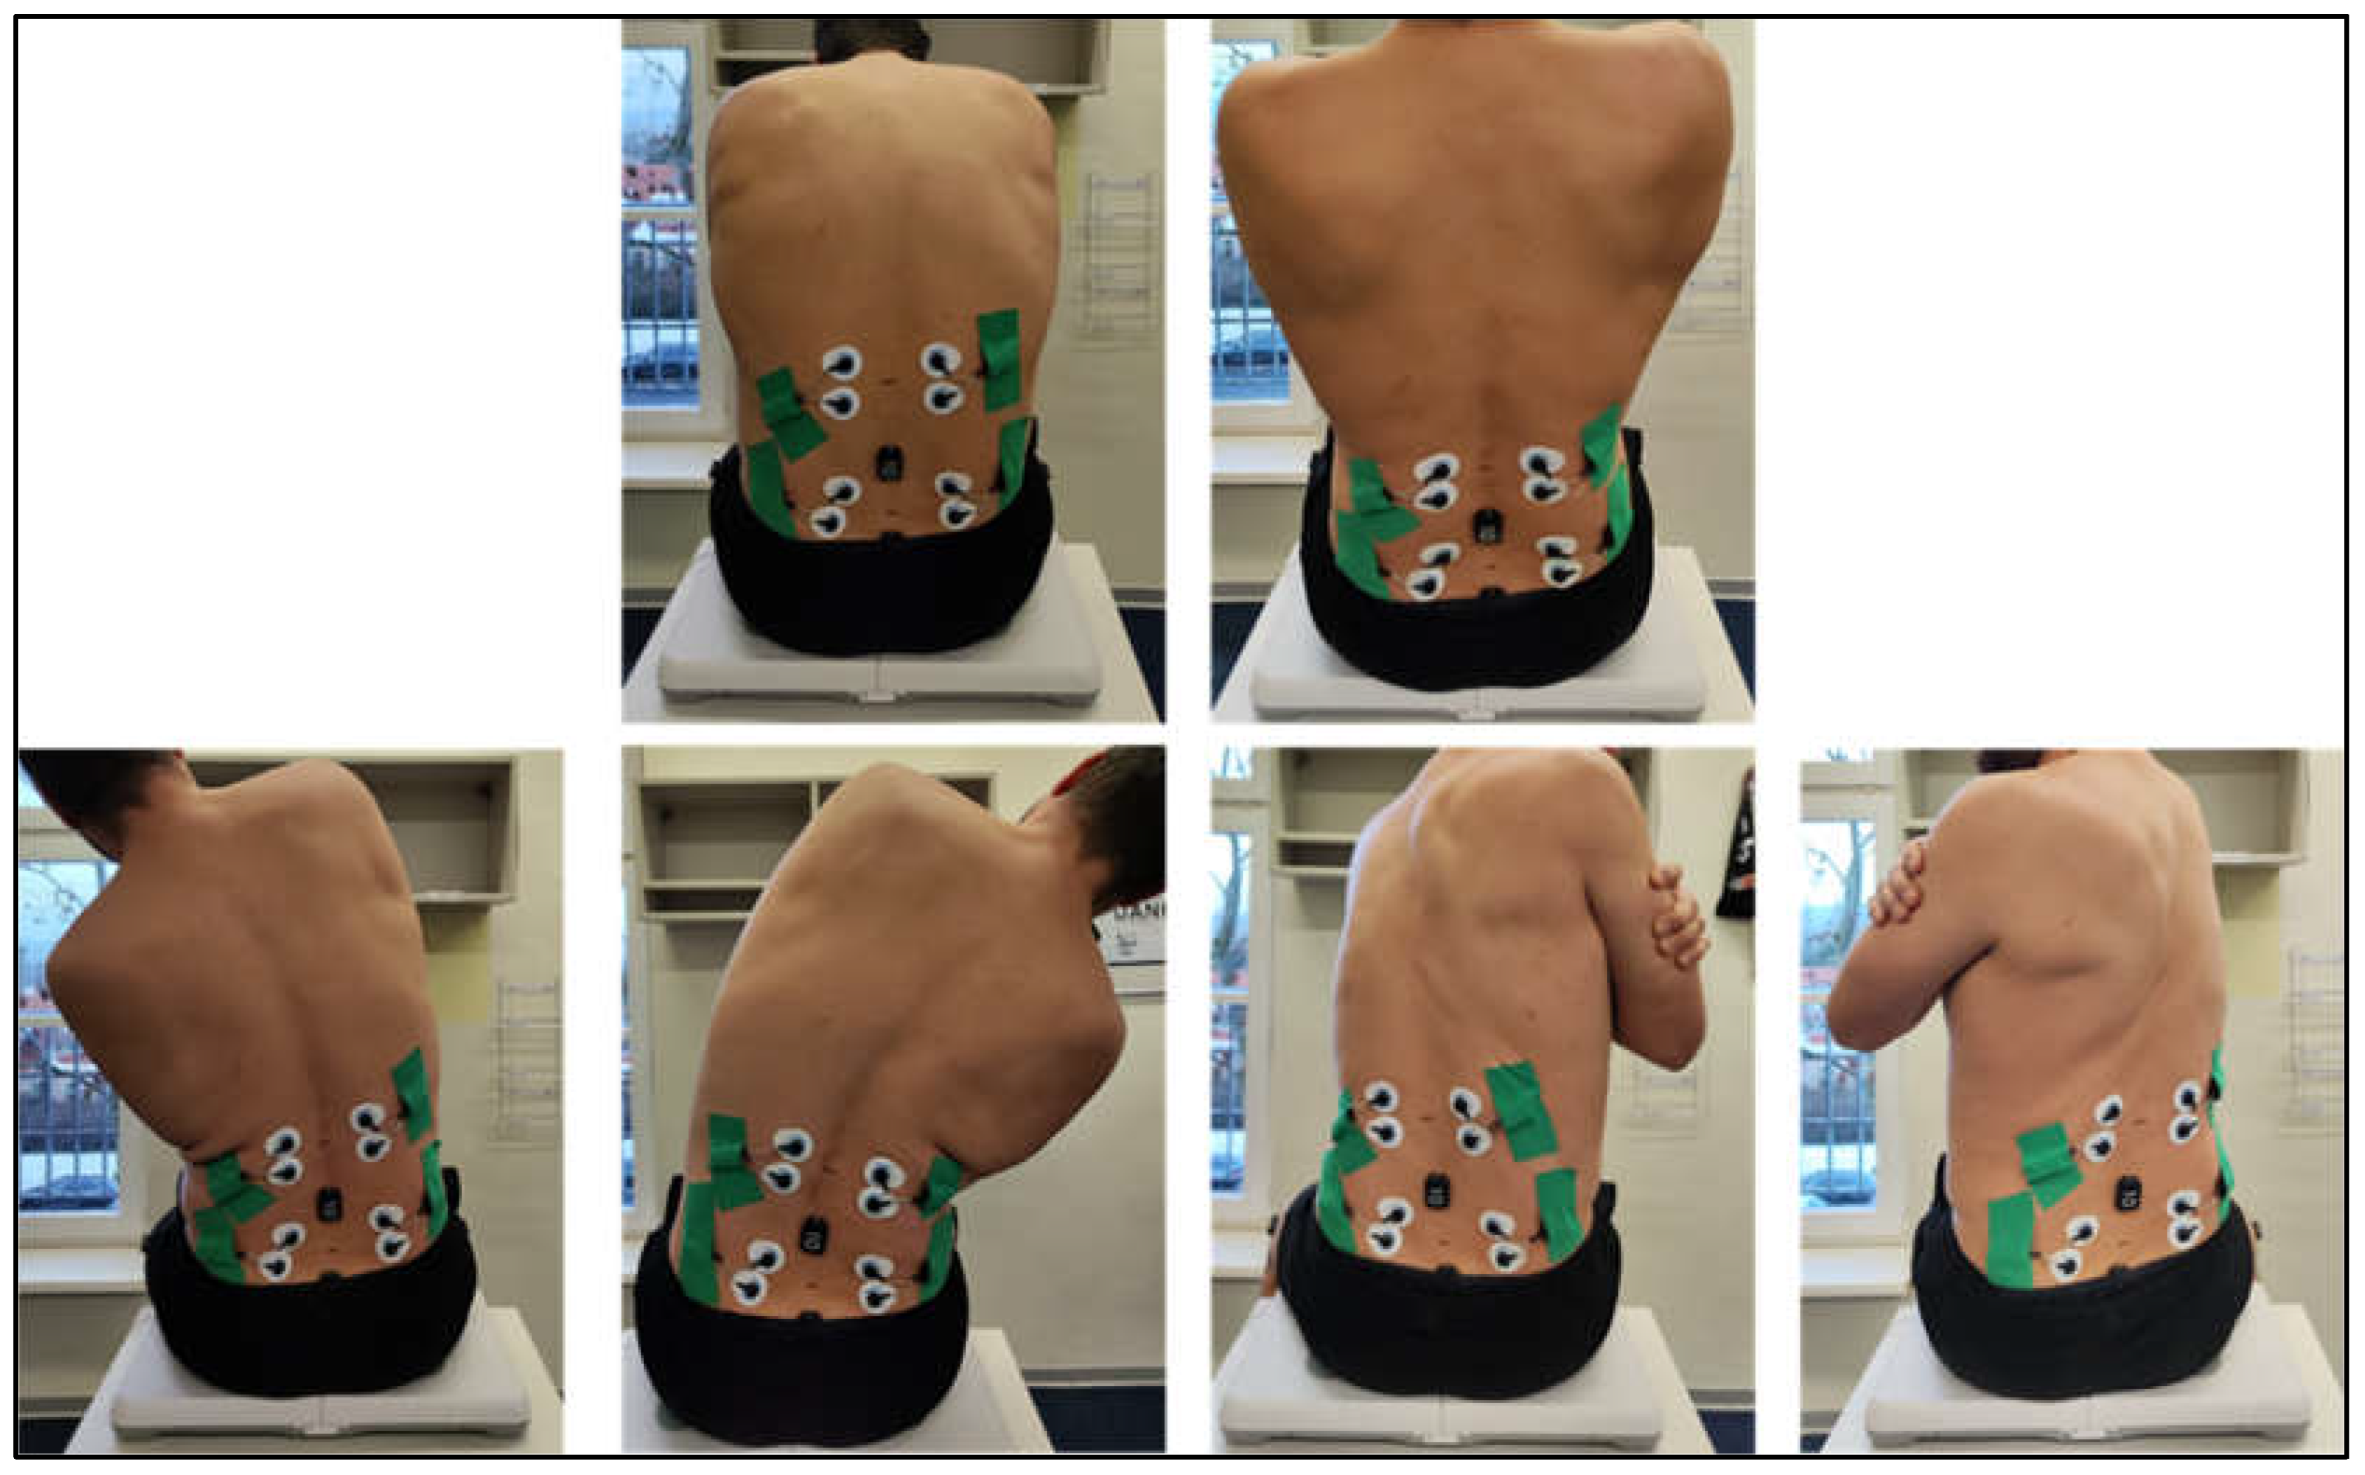
Figure 5.
Assessment of functional lumbopelvic Stability in seated position.
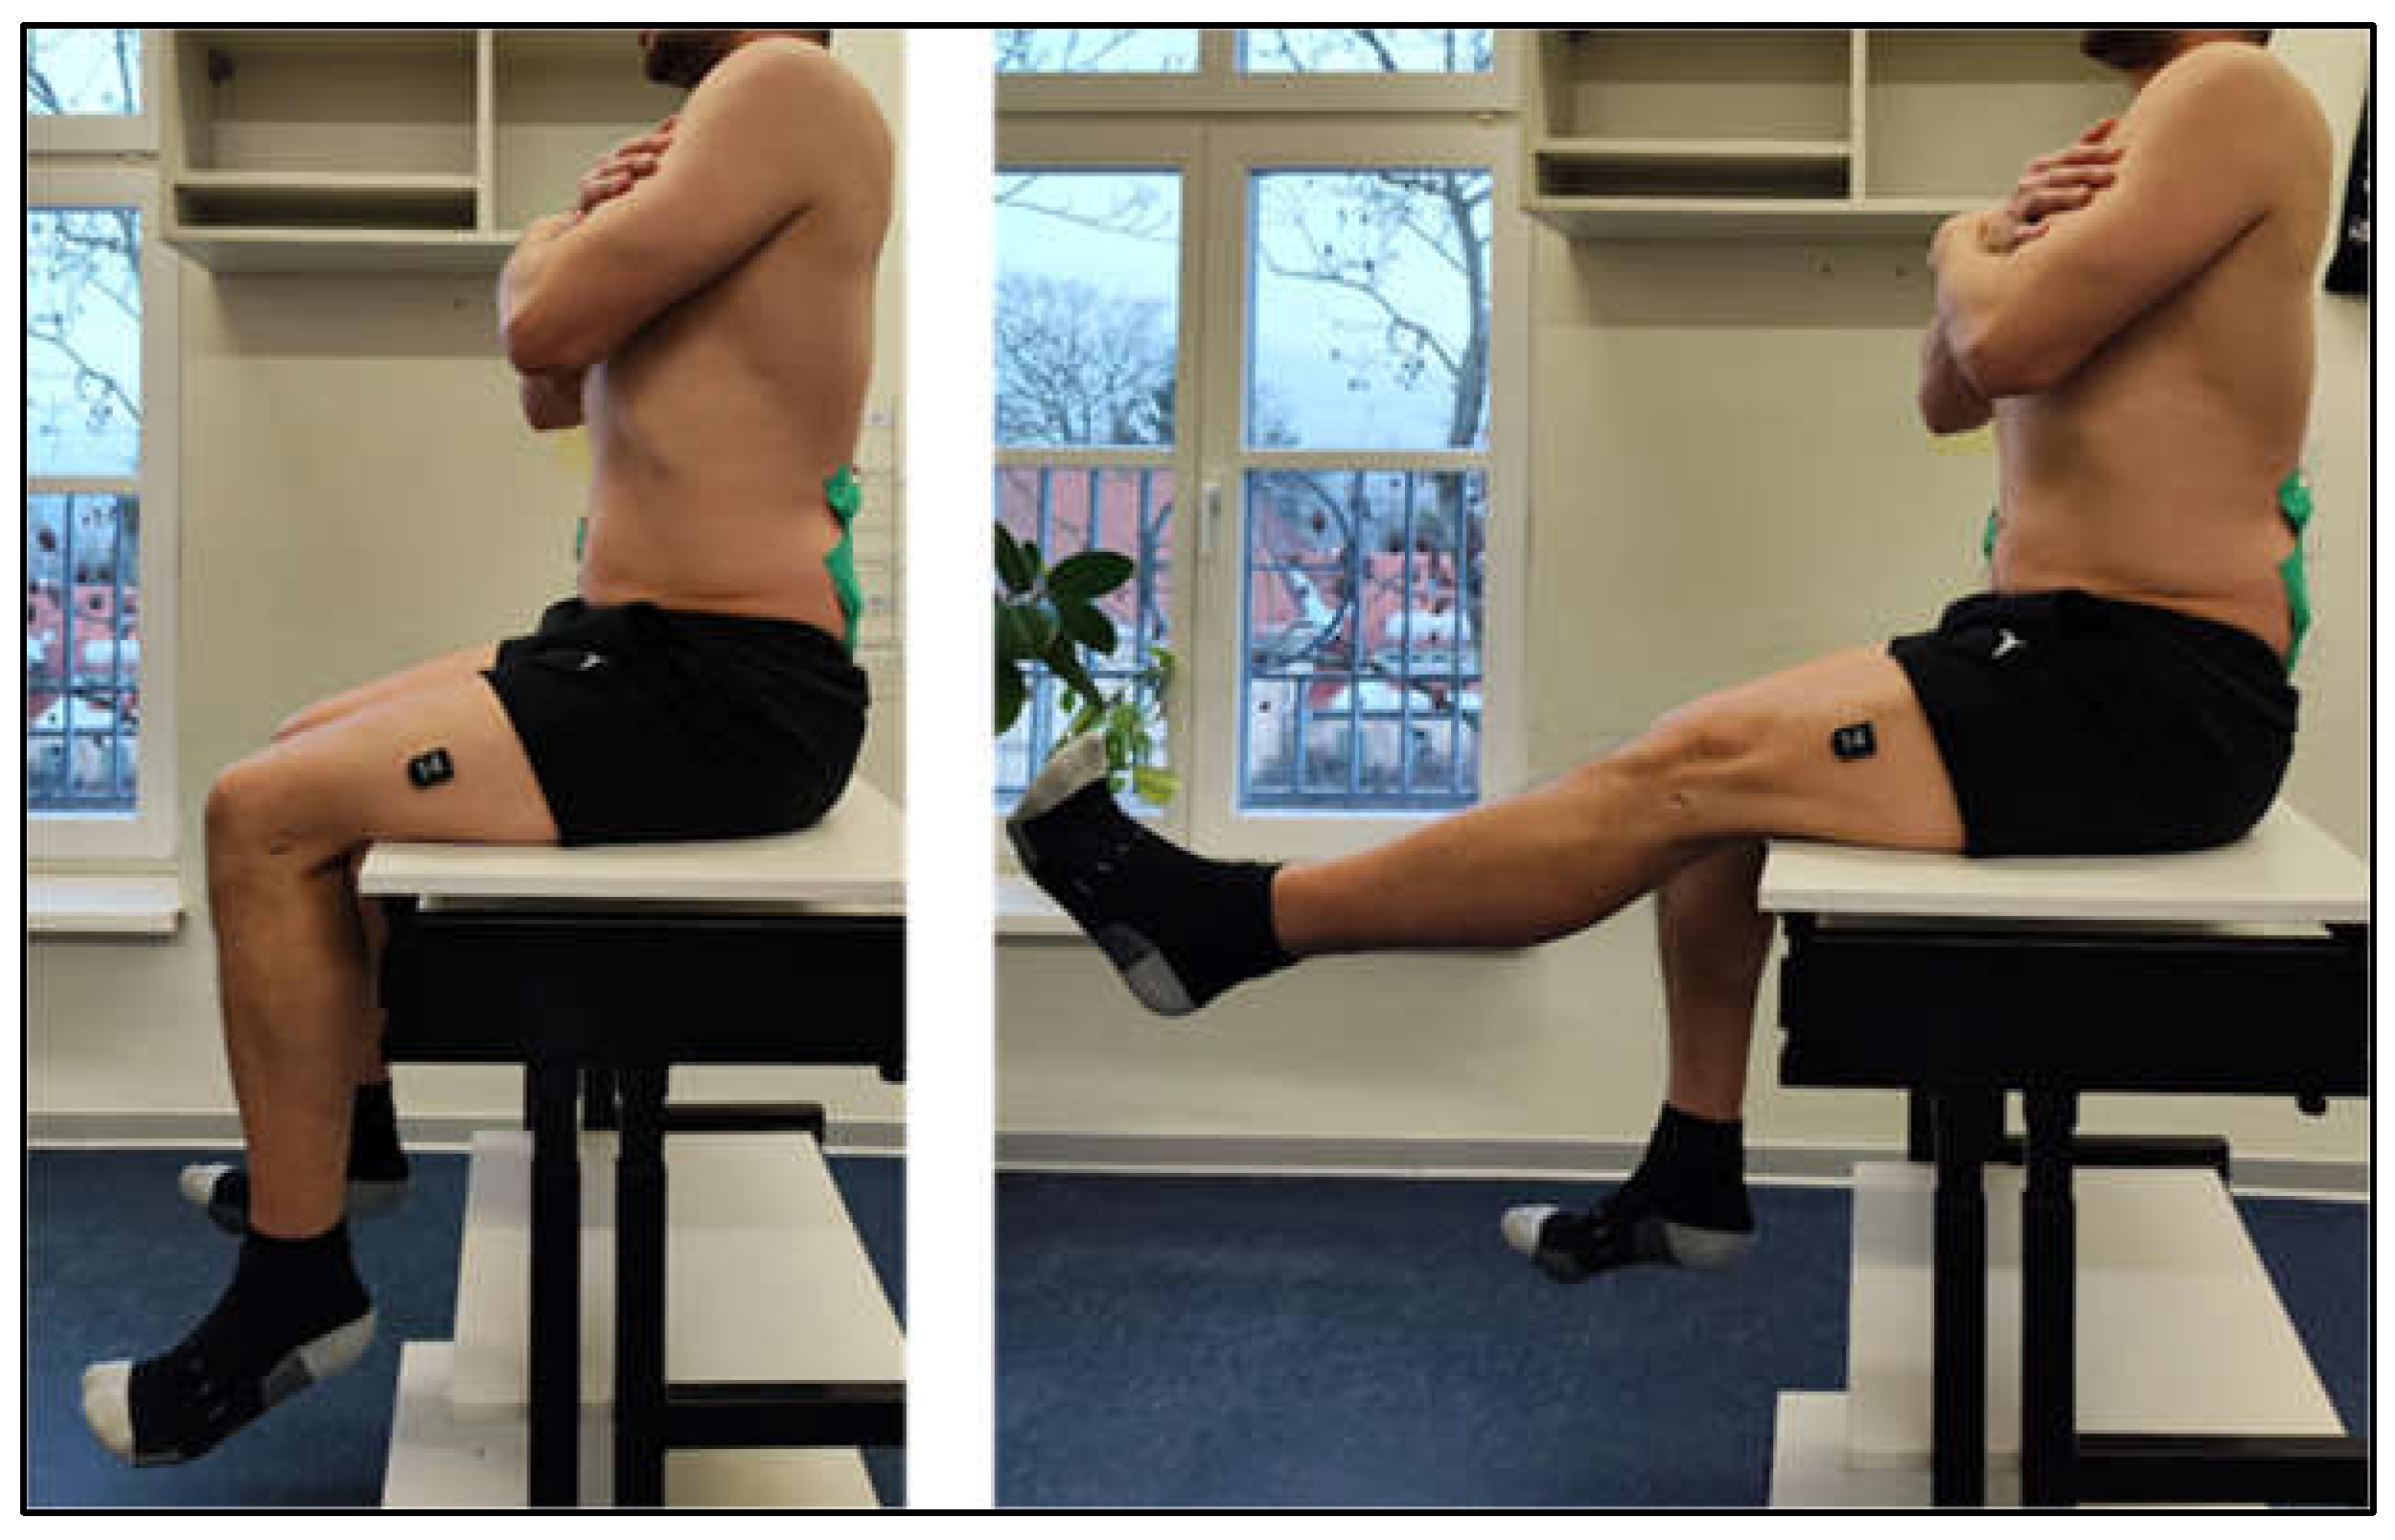
Figure 6.
Assessment of isometric trunk strength in seated position.
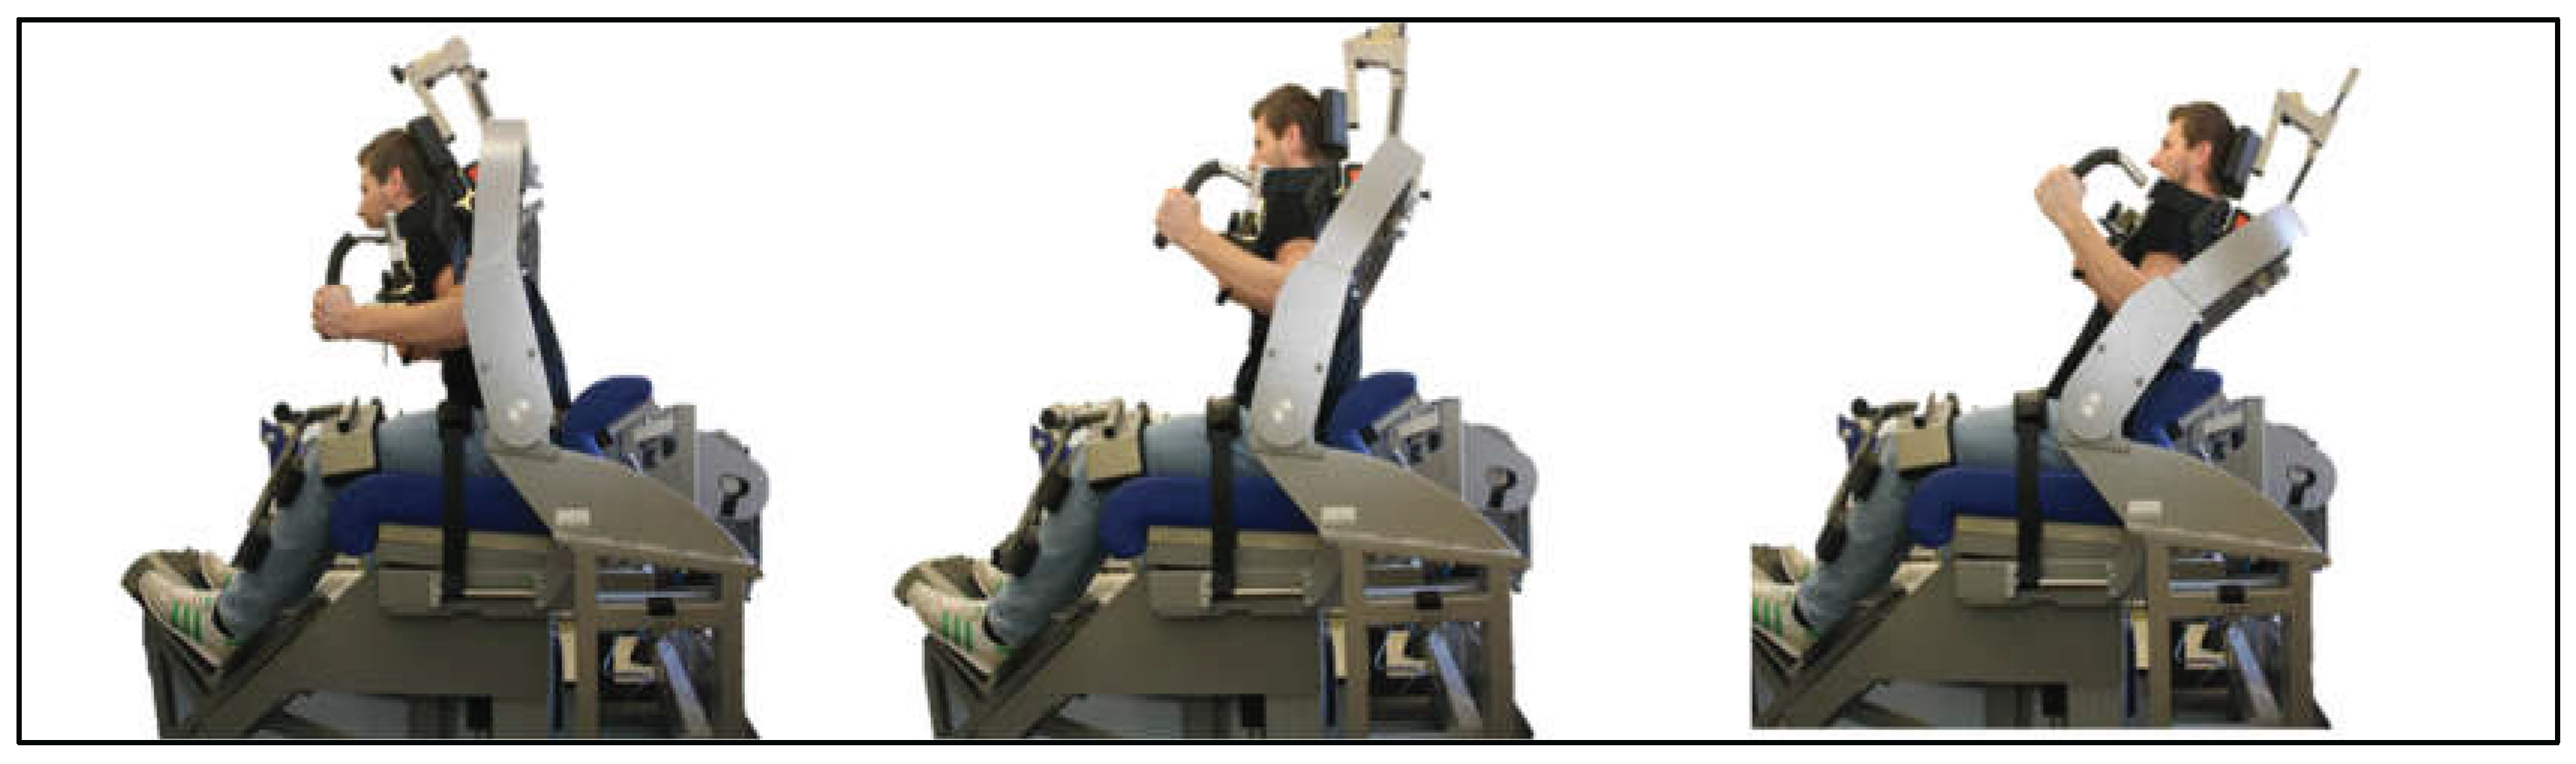
Table 1.
Anthropometric data of the Study Sample.
| Group | Male [n] | Height [cm] | Weight [kg] | Age [years] |
|---|---|---|---|---|
| no Pain | 2 | 1760(2.8) | 82.5(13.4) | 34.0(7.1) |
| Low-intensity pain | 6 | 181.3 (5.9) | 89.6(19.8) | 40.1(8.3) |
| High-intensity pain | 5 | 182.8(7.8) | 87.0(13.2) | 40.2(7.2) |
| Group | Female [n] | Height [cm] | Weight [kg] | Age [years] |
| no Pain | 7 | 170.5(5.2) | 66.9(8.0) | 44.7(11.1) |
| Low-intensity pain | 8 | 169.6(6.8) | 69.2(11.6) | 46.8(16.1) |
| High-intensity pain | 10 | 167.4 (4.1) | 70.06(13.2) | 45.7(10.4) |
Table 2.
Functional Assessment Screening Protocol.
| Functional Level | Assessment | Technical Equipment |
|---|---|---|
| fatigue resistance/ Strength Endurance |
100m Gait test; | EMG and IMU |
| Mobility and neuromuscular control (CoP) | 60 s bipedal and monopedal (left and right) stance with eyes open; Spinal ROM tests while standing and sitting, every movement twice: flexion/extension, lateral bending and rotation; 60 s upright sitting with eyes open |
CoP- force plate EMG and IMU |
| Lumbo-pelvine Stability | modified slump test | EMG and IMU |
| global trunk musculature | 5x 6 s isometric trunk strength measurements in the sagittal plane in different flexion angular positions of the hip: 90°, 80°, 105° and 120° | IsoMed 2000- Ferstl GmbH |
Table 3.
Overview of the significant measurement results across the three pain groups in the gait analysis.
Table 3.
Overview of the significant measurement results across the three pain groups in the gait analysis.
| Position | Measurement | p.value | power | Mean no Pain | Mean Low intensity pain | Mean High-intensity pain |
|---|---|---|---|---|---|---|
| Pelvis_Acc_X | max_slopeR | 0.043 | 0.558 | 0.02 | 0.02 | 0.035 |
| R_Multifidii | max_slopeL | 0.049 | 0.488 | 0.02 | 0.03 | 0.03 |
| Pelvis_Acc_X | max_steigungR | 0.043 | 0.558 | 0.02 | 0.02 | 0.035 |
| Left_Thigh_Acc_Z | varL | 0.042 | 0.562 | 0.03 | 0.04 | 0.063 |
| Left_Thigh_Acc_Z | max_slopeR | 0.012 | 0.759 | 0.01 | 0.02 | 0.028 |
| Left_Thigh_Acc_Z | max_steigungR | 0.012 | 0.759 | 0.01 | 0.02 | 0.02 |
| L_Multifidii | meanR | 0.05 | 0.505 | 0.0009 | 0.0007 | 0.0005 |
| R_Multifidii | aucR | 0.046 | 0.509 | 0.07 | 0.07 | 0.05 |
Table 4.
Overview of the significant measurement results across the three pain groups in the gait analysis.
Table 4.
Overview of the significant measurement results across the three pain groups in the gait analysis.
| Measurement | p value | power | Mean no Pain | Mean Low intensity pain | Mean High-intensity pain |
|---|---|---|---|---|---|
| FreqBandEnergy_L | 0.023 | 0.661 | 2.54E+14 | 2.7E+14 | 3.98E+14 |
| AreaTrembling | 0.033 | 0.599 | 1.53E+14 | 4.46E+14 | 4.2E+14 |
| SwayArea_Ellipse | 0.024 | 0.654 | 1.99E+14 | 4.3E+14 | 4.61E+14 |
| MeanFreq_X | 0.048 | 0.505 | 2.30E+14 | 3.34E+14 | 3.82E+14 |
| Power_Y | 0.031 | 0.608 | 1.99E+14 | 2.3E+14 | 2.67E+14 |
| Power_X | 0.027 | 0.634 | 3.6E+14 | 2.94E+14 | 1.72E+14 |
| DistanceTrembling | 0.05 | 0.523 | 5.0E+14 | 4.58E+14 | 3.87E+14 |
| FreqBandEnergy_H | 0.019 | 0.691 | 3.06E+14 | 3.89E+14 | 5.72E+14 |
| VelocityTrembling | 0.04 | 0.57 | 3.88E+14 | 3.07E+14 | 1.65E+14 |
| DominantFreq_Y | 0.049 | 0.497 | 152587890.6 | 3.33E+08 | 6.1E+08 |
Table 5.
EMG of trunk muscles during single-leg stance across pain conditions: minimum envelope and raw values (means, uncorrected p values, and post-hoc power).
Table 5.
EMG of trunk muscles during single-leg stance across pain conditions: minimum envelope and raw values (means, uncorrected p values, and post-hoc power).
| Position | measurement | p value | power | Mean no Pain | Mean Low intensity pain | Mean High-intensity pain |
|---|---|---|---|---|---|---|
| R_Int_Oblique | minENV | 0.033 | 0.60 | -7.48 | -0.05 | 0.54 |
| L_Multifidii | minENV | 0.001 | 0.93 | 2.12 | 0.81 | -0.47 |
| R_ThoracicEs | minRAW | 0.055 | 0.47 | -81.22 | -102.67 | -166.51 |
| R_ThoracicEs | maxRAW | 0.052 | 0.48 | 76.29 | 109.66 | 181.36 |
| L_ThoracicEs | minRAW | 0.047 | 0.53 | -96.84 | -83.80 | -163.481 |
| R_Multifidii | minENV | 0.012 | 0.75 | -2.07 | -0.45 | 1.60 |
Table 6.
Evaluation of bending movement in a seated position: the upper body is bent forward from an upright position into extension.
Table 6.
Evaluation of bending movement in a seated position: the upper body is bent forward from an upright position into extension.
| measurement | p value | power | Mean no Pain | Mean Low intensity pain | Mean High-intensity pain |
|---|---|---|---|---|---|
| LWS_Acc_X_max | 0.024 | 0.658 | 1.185 | 0.92 | 0.84 |
| LWS_Acc_X_range | 0.03 | 0.623 | 1.18 | 0.94 | 0.85 |
| LWS_roll_max | 0.019 | 0.69 | 78.44 | 68.40 | 60.99 |
| LWS_roll_range | 0.023 | 0.665 | 81.93 | 65.67 | 58.26 |
| Pelvis_Acc_X_max | 0.03 | 0.62 | 0.940 | 0.68 | 0.64 |
| Pelvis_Acc_X_range | 0.03 | 0.623 | 0.93 | 0.68 | 0.64 |
| Pelvis_roll_max | 0.028 | 0.632 | 58.19 | 47.66 | 42.95 |
| R_Multifidii_env_min | 0.049 | 0.512 | 3.14 | 3.20 | 6.66 |
| L_Multifidii_env_min | 0.034 | 0.598 | 2.79 | 3.38 | 7.99 |
| LWS_Acc_X_area | 0.037 | 0.582 | 3.02 | 2.34 | 1.92 |
| lws_pelvis_pitch_min | 0.003 | 0.905 | 4.47 | 0.43 | 0.06 |
Table 7.
Evaluation of bendings in a seated position: the upper body is raised from the flexion position into extension.
Table 7.
Evaluation of bendings in a seated position: the upper body is raised from the flexion position into extension.
| measurement | p value | power | Mean no Pain | Mean Low intensity pain | Mean High-intensity pain |
|---|---|---|---|---|---|
| LWS_Acc_X_area | 0.012 | 0.753 | 4.03 | 2.66 | 2.37 |
| lws_pelvis_pitch_min | 0.009 | 0.798 | 6.5 | 1.99 | 0.09 |
| R_ThoracicEs_env_mean | 0.035 | 0.594 | 13.46 | 18.02 | 23.08 |
| R_ThoracicEs_env_RMS | 0.039 | 0.576 | 15.51 | 21.55 | 26.43 |
| L_Multifidii_DutyCycle | 0.042 | 0.563 | 0.71 | 0.77 | 0.88 |
| LWS_Acc_X_area | 0.005 | 0.845 | 3.90 | 2.82 | 2.24 |
| LWS_Acc_Y_min | 0.029 | 0.626 | -0.12 | -0.06 | -0.041 |
| lws_pelvis_pitch_area | 0.021 | 0.681 | 216.87 | 123.89 | 125.03 |
| LWS_pitch_area | 0.031 | 0.613 | 426.20 | 342.91 | 286.77 |
| LWS_roll_range | 0.031 | 0.617 | 102.96 | 65.04 | 62.29 |
| Pelvis_Acc_X_area | 0.017 | 0.711 | 2.91 | 2.18 | 1.68 |
| pelvis_thigh_roll_area | 0.018 | 0.705 | 175.35 | 125.86 | 117.24 |
| R_Multifidii_env_min | 0.016 | 0.719 | 2.33 | 2.48 | 6.02 |
| R_ThoracicEs_raw_mean | 0.036 | 0.587 | 0.00 | 0.007 | 0.016 |
Table 9.
Isometric trunk strength normalised to Body Mass Across Pain Conditions.
| Measurement | p value | power | Mean no Pain | Mean Low intensity pain | Mean High-intensity pain |
|---|---|---|---|---|---|
| Nm/ kg | Nm/ kg | Nm/ kg | |||
| flex_max_0 | 0.033 | 0.607 | 1.28 | 1.31 | 1.67 |
| flex_max_10 | 0.702 | 0.067 | 1.24 | 1.22 | 1.58 |
| ext_max_0 | 0.029 | 0.634 | 3.01 | 2.68 | 2.62 |
| ext_max_15 | 0.016 | 0.724 | 3.19 | 2.78 | 2.73 |
| ext_max_30 | 0.879 | 0.053 | 3.13 | 2.71 | 2.82 |
Disclaimer/Publisher’s Note: The statements, opinions and data contained in all publications are solely those of the individual author(s) and contributor(s) and not of MDPI and/or the editor(s). MDPI and/or the editor(s) disclaim responsibility for any injury to people or property resulting from any ideas, methods, instructions or products referred to in the content. |
© 2026 by the authors. Licensee MDPI, Basel, Switzerland. This article is an open access article distributed under the terms and conditions of the Creative Commons Attribution (CC BY) license (http://creativecommons.org/licenses/by/4.0/).
Copyright: This open access article is published under a Creative Commons CC BY 4.0 license, which permit the free download, distribution, and reuse, provided that the author and preprint are cited in any reuse.


