
Submitted:
21 January 2026
Posted:
22 January 2026
You are already at the latest version
Abstract
Survival rates for metastatic Ewing sarcoma (EwS) have remained persistently low over recent decades, highlighting the need for more effective chemotherapeutic options. Potential targets may be found within the Neuropeptide Y (NPY) signalling pathway that has been implicated in EwS cell survival. However, confounding factors include hypoxia that modulates NPY signalling, dipeptidyl peptidase-4 (DPP4/CD26) that cleaves NPY and interactions via NPY signalling from infiltrating immune cells. We investigated these interactions in A673 and SK-ES-1 EwS cell lines and THP-1 monocytes to identify therapeutic targets suitable for drug repurposing. Both EwS cell lines secreted NPY into conditioned media and extracellular vesicles. Recombinant NPY enhanced viability of both A673 and SK-ES-1 cells, however the NPY1R antagonist BMS-193885 reduced viability in A673 cells only. Recombinant DPP4 widely promoted EwS viability and, under hypoxic conditions, it increased cell metabolism. The DPP4 inhibitor linagliptin, which is used clinically, consistently suppressed EwS viability with elevated sensitivity under hypoxia, where there was increased cell death of SK-ES-1 cells. Conversely, in THP-1 monocytes NPY suppressed metabolism, BMS-193885 increased live-cell staining and DPP4 induced cell death. These findings suggest that NPY and DPP4 enhance EwS survival through autocrine/paracrine signalling while reducing monocyte viability. Thus, targeting NPY/DPP4 signalling may provide therapeutic benefit by directly suppressing EwS growth and enhancing efficacy of immunotherapy.
Keywords:
BMS-193885
; dipeptidyl peptidase-4
; ewing sarcoma
; hypoxia
; linagliptin
; neuropeptide Y
1. Introduction
Ewing sarcoma (EwS) is the second most common primary bone cancer after osteosarcoma, making up 14% of all primary bone tumours and ~1% of all childhood cancers [1]. Five-year survival rates for Ewing sarcoma (EwS) are around 70–80% in non-metastatic cases, dropping to 20–25% when distant metastases are present [2]. Approximately 20–30% of patients present with metastatic disease [3] and metastasis of EwS tumours remains the most important factor in determining patient survival [4].
EwS was previously thought to have a neural histogenesis related to primitive neuroectodermal tumours [5], but it is now well established that EwS has an origin in mesenchymal stem cells (MSCs) [6]. The trigger for EwS formation comes from a chromosomal translocation event that in 85% of cases occurs between Ewing sarcoma breakpoint region 1 (EWSR1) and Friend leukaemia virus integration 1 (FLI1) resulting in the EWS-FLI1 fusion oncogene which drives many of the pathways associated with the disease [7] including those associated with proliferation and survival [7,8].
Current treatments for EwS rely upon combined radiotherapy, surgery and chemotherapy [9]. Dose-intensive chemotherapy with vincristine, doxorubicin, cyclophosphamide, ifosfamide, and etoposide have proven effective against early stage, non-metastatic EwS [10].
However, it has proven far more challenging to find chemotherapeutic treatments for metastatic EwS, with several potential treatments reaching Phase II and Phase III clinical trials [11,12], only to prove ineffective against the metastatic illness. The current situation underscores a requirement for new targets that might enable more effective management.
One signalling pathway that has received recent attention involves extracellular neuropeptide Y (NPY). Serum levels of NPY have been found elevated in patients with EwS [13], while hypoxia and increased expression of NPY in EwS cells has been linked to metastasis [14,15]. NPY acts upon cell surface NPY receptors with a modulating role for Dipeptidyl peptidase-4 (DPP4, also known as CD26) which cleaves NPY and controls signalling as specific receptors have different binding affinities for the full length and cleaved NPY molecule [13].
Exogenous NPY also drives changes in macrophage activity by promoting migration [16] and infiltration [17] but M1 inactivation [18], and a switch towards M2 polarisation [20] too. NPY release by macrophages has been reported [21] and NPY is involved in crosstalk between different cell types, for example between adipocytes and macrophages [19]. This raises the intriguing possibility is that NPY signalling may be involved in crosstalk between EwS cells and macrophages. Such crosstalk between different cell populations may offer a potential explanation for why EwS has an immunosuppressive tumour microenvironment allowing for tumour immune escape that has stifled attempts at immunotherapy [21,22].
Drug repurposing minimizes the need for expensive clinical trials and offers a practical strategy to bridge the gap from “bench to bedside” in a more cost-effective and timely manner, which would be particularly desirable for rare diseases such as EwS. Indeed, there are several repurposed drugs that have shown encouraging results in slowing cancer progression. Thalidomide, originally developed as a treatment for morning sickness, is now used to treat multiple myeloma, where it has been shown to improve progression free survival [23]. The beta-blocker Propranolol is effective against a broad range of cancer cells in vitro and in vivo and has been clinically associated with a decrease in all cancer mortality [24]. Mebendazole was developed as an anti-parasitic treatment that has since been shown to be effective against breast cancer cells in vitro and in vivo [25] and reached Phase 2a clinical trials for the treatment of gastrointestinal cancer [26]. The diabetes medication Metformin may also have some beneficial effects in treating cancer [27,28]. These examples demonstrate that that drug repurposing is a potentially valuable strategy for cancer treatment, providing a sound rationale for attempting such an approach with EwS.
In this study, we conducted an in-depth analysis of the NPY–DPP4 axis in two widely used EwS cell lines to determine whether targeting this signalling pathway could reduce EwS cell viability and potentially lead to improved therapeutic strategies. Specifically, we investigate NPY1R receptor antagonists developed for the treatment of obesity [29] and gliptins, which are medicines developed to treat diabetes by inhibition of DPP4 [30]. We also investigate the effects of NPY and DPP4 upon THP-1 monocytes to identify potential interactions between EwS cells that could explain the immunosuppressive mechanisms reflected in EwS tumours [22] and discuss what the implications are of this for future immunotherapeutic options.
2. Results
2.1. Neuropeptide Y Release from EwS Cells
NPY transcript levels were quantified by qPCR and normalized to β-actin (ACTB) using the ΔΔCt method. NPY transcript expression did not differ between normoxic and hypoxic conditions in either A673 or SK-ES-1 cells. Consistent with this, A673 cells released low levels of NPY into conditioned media (40.7 ± 24.6 pg/mL) under normoxia, with no significant change in hypoxia (Figure 1A; n = 9 from three independent experiments). In contrast, SK-ES-1 cells secreted markedly higher levels of NPY (337.9 ± 132.4 pg/mL under normoxia), which decreased to 257.0 ± 113.6 pg/mL in hypoxia. NPY/protein values were reduced by approximately 50% under hypoxic conditions (Figure 2B, p < 0.01; n = 8 from three independent experiments). These data indicate that NPY transcript levels do not predict NPY protein secretion and that SK-ES-1 cells exhibit hypoxia-sensitive NPY release.
To assess whether hypoxia alters the mode of NPY release, extracellular vesicle (EV)-associated NPY was quantified by ELISA and normalized to EV protein content. In A673 cells, EV-associated NPY/protein (0.006 ng/ng) was unchanged by hypoxia (Figure 2C; n = 5). In SK-ES-1 cells, EV-associated NPY/protein decreased by 43% from 0.0148 ng/ng under normoxia to 0.0083 ng/ng in hypoxia (Figure 2D; p < 0.05; n = 3), indicating reduced NPY output rather than altered release mechanisms.
2.2. Effects of rhNPY Treatment
Next, we investigated the impact of the NPY axis activation. Treatment with 1ng/mL rhNPY for 48 hours in serum free media increased Calcein-AM live cell staining of A673 cells in normoxia by 6.2% (Figure 2A, p < 0.01, Mann-Whitney test) and in hypoxia by 7.6% (Figure 2B, p < 0.01, t-test) compared to non-treated controls. Similarly, live cell staining in SK-ES-1 in normoxia was increased by 5.8% (Figure 2C, p < 0.05, t-test), and in hypoxia by 8.7% (Figure 2D, p < 0.05, t-test, n = 25 per condition from three independent experiments).
The remaining effects of rhNPY were cell line and hypoxia-specific. Under normoxic conditions, rhNPY increased the proportion of A673 cells in S phase (Figure 2E; p < 0.05, t-test; n = 3 independent experiments), whereas SK-ES-1 cells were more responsive in hypoxia, exhibiting a higher proportion of cells in G1 phase. (Figure 2F; p < 0.05, t-test; n = 3 independent experiments). rhNPY also enhanced transwell migration of EwS cell lines in a hypoxia-dependent manner, increasing migration of A673 cells under normoxia (Figure 3G; p < 0.01; n = 8 from two independent experiments) and SK-ES-1 cells under hypoxia (Figure 3H; p < 0.05; n = 12 from three independent experiments). Thus, exogenous rhNPY increases EwS cell viability as well as modulating the cell cycle and migration, suggesting autocrine effects for endogenously secreted NPY.
2.3. Cell-Specific Impact of NPY1R Activation
NPY1R and NPY5R transcript expression were measured by qPCR and normalised to ACTB with the ΔΔCt method. NPY1R was unaltered by hypoxia in both cell lines (Supplementary Figure S3A,B); NPY5R was unchanged in A673 cells (Supp. Figure S3C) but was decreased by hypoxia in SK-ES-1 cells (Supp. Figure S3D). Immunofluorescent labelling revealed punctate staining for NPY1R protein in A673 cells in both normoxia (Supp. Figure S3E) and hypoxia (Supp. Figure S3F), however no labelling for NPY1R was detected on SK-ES-1 cells.
Concordant with the expression of NPY1R in A673 cells, treatment with the NPY1R antagonist BMS-193885 decreased crystal violet (CV) staining of A673 cells in normoxia by 16% (Supp. Figure S3G, p < 0.001, Mann-Whitney test, n = 25 from three independent experiments), decreased metabolism of A673 cells in normoxia only, by 12% (Supp. Figure S3H, p < 0.01, t-test, n = 10 from two independent experiments), with no similar effects on SK-ES-1 cells.
Thus, the effects of pharmacological NPY1R inhibition are limited, suggesting that targeting NPY1R may confer clinical benefit only in NPY1R-expressing EwS subtypes under normoxic conditions.
2.4. DPP4 Expression and Activity in EwS Cells
DPP4 transcript expression was also measured. Hypoxia increased DPP4 transcript expression in A673 cells 3.96-fold (Figure 3A, p < 0.01, t-test, n = 3 independent replicates), with no effect in SK-ES-1 cells (Figure 3B). DPP4 activity in cell lysates and cell conditioned media (CM) was quantified via enzymatic assay and normalised to protein from corresponding lysates. DPP4 activity in A673 cell lysates under normoxia was 7.2 + 4.7 μU/μg, with no change in hypoxia (Figure 3C, n = 9 from three independent experiments). DPP4 activity in SK-ES-1 cell lysates was 6.5 + 3.0 μU/μg in normoxia and decreased by 50% to 3.3 + 3.0 μU/μg in hypoxia (Figure 3D, p < 0.05, t-test, n = 9 from three independent experiments). DPP4 activity in A673 CM was 2.1 + 2.8 μU/μg in normoxia with no significant change in hypoxia (Figure 3E), whereas in SK-ES-1 CM, DPP4 activity was 2.9 + 2.7 μU/μg in normoxia and was 77% lower in hypoxia at 0.7 + 1.0 μU/μg (Figure 3F, p < 0.05, Mann-Whitney test, n = 9 from three independent experiments). No DPP4 activity was detectable in EV samples. DPP4 protein measured by ELISA and normalised to corresponding protein samples was not found in EVs from A673 cells cultured under normoxia but increased to 6.1 + 6.7e-5 ng/ng in hypoxia (Figure 3G, p < 0.05, Mann Whitney test, n = 5 independent experiments). In SK-ES-1 EVs there was 1.7 + 2.9 e-4 ng/ng in normoxia, but no significant difference was found in hypoxia (Figure 3H, n = 3 independent experiments). Thus, hypoxia-induced increases in DPP4 transcript expression in A673 cells correlate with increased DPP4 protein levels in A673 EVs, however DPP4 enzymatic activity is regulated independently of these in a cell-specific manner.
2.5. Effect of Exogenous rhDPP4
Live-cell staining of EwS cells was consistently increased by rhDPP4 treatment. In A673 cells, staining increased by 8.9% under normoxia (Figure 4A; p < 0.001, t-test; n = 13–15 per condition from three independent experiments) and by 7.3% under hypoxia (Figure 4B; p < 0.05, t-test; n = 10 per condition from two independent experiments). In SK-ES-1 cells, rhDPP4 increased live-cell staining by 4.0% under normoxia (Figure 4C; p < 0.05, Mann–Whitney test; n = 14–15 per condition from three independent experiments) and by 7.4% under hypoxia (Figure 4D; p < 0.05, t-test; n = 10 per condition from two independent experiments).
rhDPP4 had no effect on cellular metabolism under normoxic conditions. However, under hypoxia, rhDPP4 increased metabolism by 19.2% in A673 cells (Figure 4E; p < 0.01, t-test; n = 10 per condition from two independent experiments) and by 15.2% in SK-ES-1 cells (Figure 4F; p < 0.01, t-test; n = 10 per condition from two independent experiments). rhDPP4 did not affect transwell migration. A cell line–specific effect was observed in which hypoxia sensitized A673 cells to rhDPP4, resulting in an increased proportion of cells in S phase (Figure 4G; p < 0.05, t-test; n = 3 independent experiments), indicating increased proliferation.
Collectively, these data indicate that DPP4 supports EwS cell survival under both normoxic and hypoxic conditions, with hypoxia-specific effects on metabolism but no increase in invasive potential.
2.6. Effect of DPP4 Inhibition on EwS Cell Viability
The DPP4 inhibitor linagliptin (LG) consistently and significantly decreased the total number of EwS cells in culture (assessed by crystal violet staining). For A673 cells, LG decreased CV staining by 8.3% in normoxia (Figure 5A, p < 0.05, Mann-Whitney test, n = 15 per condition from three independent replicates) and by 9.3% in hypoxia (Figure 5B, p < 0.01, t-test, n = 10 per condition from two independent replicates). For SK-ES-1 cells, LG decreased CV staining by 9.1% in normoxia (Figure 5C, p < 0.05, t-test, n = 15 per condition from three independent replicates and 6.0% in hypoxia (Figure 5D, p < 0.05, t-test, n = 10 per condition from two independent replicates).
The proportion of dead cells (stained with ethidium homodimer-1) in SK-ES-1 cultures treated with LG in hypoxia was increased 28.2% (Figure 5E, p < 0.001, t-test, n = 10 per condition from two independent replicates). Interestingly, there were no changes in the proportion of dead cells in A673 cells or on SK-ES-1 cells in normoxia. These data demonstrate consistent effects of LG on reducing EwS cell number with cell and condition specific effects on cell survival.
2.7. Role of DPP4 and NPY in THP-1 Monocytes
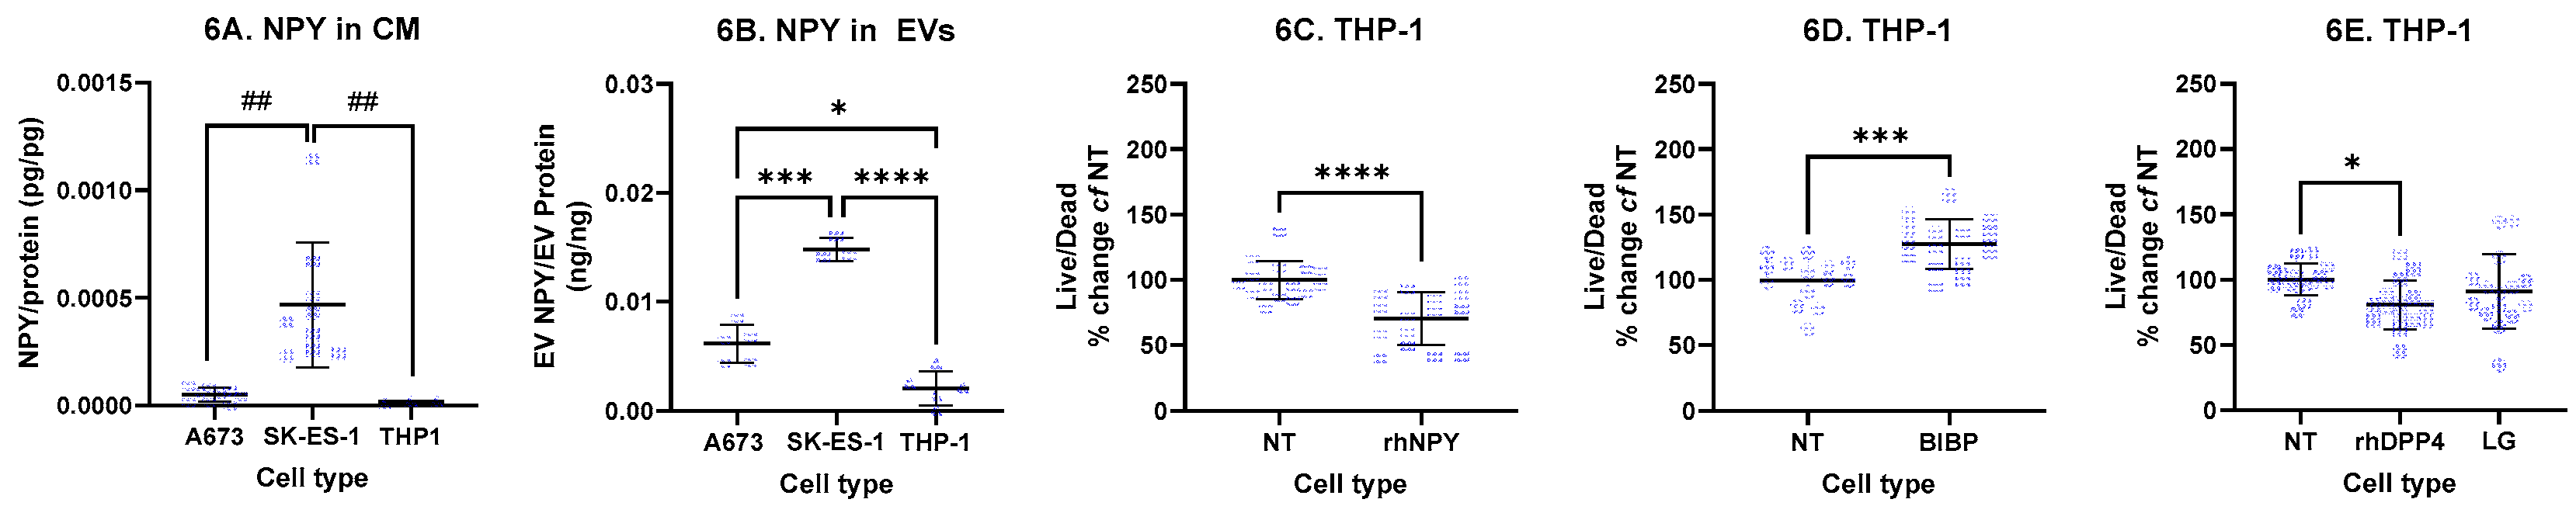
In THP-1 cells, NPY transcript levels were unchanged following exposure to either hypoxia or LPS. Consistent with this, NPY protein levels in THP-1 cell lysates, conditioned media (CM), and extracellular vesicles (EVs) remained uniformly low. Basal NPY secretion into CM was 1.2 + 0.7 pg/mL, and when normalized to total protein, secretion from THP-1 cells was significantly lower than that from SK-ES-1 cells (Figure 8a). NPY secretion via EVs from THP-1 cells was also significantly lower compared with those from either A673 or SK-ES-1 cells (Figure 8b).
In THP-1 cell lysates, DPP4 protein levels were 7.2 + 3.2 ng/ng of DPP4/total protein and were not altered by hypoxia or LPS treatment, while DPP4 enzymatic activity was below the limit of detection. Despite this, DPP4 activity was measurable in THP-1 CM at 2.1 + 1.3 uU/ug/ul which was not significantly altered under hypoxia and was not significantly different to basal secreted DPP4 activity from A673 or SK-ES-1 cells. DPP4/protein levels in THP-1-derived EVs were 1.1e-4 + 2.1e-4 ng/ng of DPP4/EV protein and were not significantly different from those in EVs derived from A673 or SK-ES-1 cells. DPP4 enzymatic activity was not detectable in THP-1-derived EVs. These results indicate low level secretion of active DPP4 from THP-1 cells.
THP-1 viability, assessed using the live/dead assay, was decreased by recombinant human NPY (rhNPY) (Figure 8c) and increased by the NPY1R antagonist BIBP 3226 (Figure 8d). This is consistent with NPY1R transcript expression, which was present in THP-1 cells under normoxia and did not change under hypoxia. Transcripts for other NPY receptors were below the ddCT threshold (data not shown). Although exogenous rhDPP4 also reduced THP-1 viability, inhibition of endogenous DPP4 with linagliptin had no effect (Figure 8e), likely reflecting insufficient endogenous DPP4 activity to inhibit.
Collectively, these findings indicate that Ewing sarcoma cells, rather than monocytes, are the predominant source of NPY and DPP4. In contrast to their effects on EwS cells, where viability is increased, these factors act to reduce THP-1 monocyte viability.
Figure 6.
Effects of NPY-DPP4 signalling upon THP-1 monocytes. (A) NPY was measured in cell-conditioned media (CM) and normalised to total protein, revealing higher NPY secretion by SK-ES-1 cells compared with either A673 or THP-1 cells. (## = p <0.01, Kruskal-Wallis with Dunn’s multiple comparison test). (B) NPY measured from extracellular vesicles (EVs) and normalised to total EV protein revealed higher NPY secretion into EVs from both A673 and SK-ES-1 cells compared to THP-1 cells (* = p<0.05, *** = p<0.001, **** = p<0.0001, ANOVA with Dunnett’s multiple comparison test). (C) THP-1 viability was decreased with 1ng/mL rhNPY (**** = p<0.0001, t-test). (D) Conversely, pharmacological blockade of NPY1R with BIBP 32226 increased THP-1 viability (*** = p<0.001, t-test). (E) 20U/mL rhDPP4 decreased THP-1 viability (* = p<0.05, ANOVA with Dunnett’s multiple comparison tests), while blockade of endogenous DPP4 with 1ng/mL linagliptin had no effect (n = 15 wells per condition from three independent experiments). NT – nontreated controls.
3. Discussion
The principal aim of this study was to investigate the NPY-DPP4 signalling axis in Ewing sarcoma (EwS) and its interaction with monocytes, with the ultimate goal of identifying potential therapeutic targets that could be used for treatment with repurposed drugs. To distinguish effects that are cell-specific from those broadly applicable, we used two EwS cell lines, A673 and SK-ES-1, which are transcriptionally equidistant to primary EwS tumours (Supplementary Table S1). Experiments were conducted in both normoxia and hypoxia, given the known modulatory effects of hypoxia on NPY signalling [31,32].
We observed that both EwS cell lines secrete NPY, either directly into conditioned medium (CM) or via extracellular vesicles (EVs), suggesting autocrine signalling. Secretion from A673 cells is a novel finding, which aligns with previous reports of SK-ES-1 secretion [14]. This may contribute to maintaining EwS cell viability. The association of NPY with EVs is particularly noteworthy, as it may stabilize NPY against enzymatic degradation by DPP4, prolonging its bioavailability. This is consistent with clinical observations of a very short systemic NPY half-life [33]. Exogenous rhNPY consistently increased EwS cell viability in both normoxia and hypoxia, with specific effects on the cell cycle: increasing S-phase cells in A673 while decreasing G2-phase cells, suggesting accumulation of viable cells in the synthesis phase. This finding corresponds to a previous study on SK-N-BE neuroblastoma cells, where NPY also increased the proportion of cells in S-phase [34].
DPP4 was also secreted by both EwS cell lines into CM and EVs. Basal levels were similar across cell types, but hypoxia induced cell-specific alterations: in SK-ES-1, hypoxia decreased DPP4 activity, whereas in A673, transcript expression increased, but without corresponding enzymatic activity. This disconnect suggests multiple roles for DPP4: enzymatically active DPP4 in CM can cleave NPY, whereas EV-bound DPP4 is inactive, potentially regulating EV uptake and intercellular signalling rather than enzymatic processing. Exogenous rhDPP4 increased live cell staining while inhibition of endogenous DPP4 with linagliptin consistently decreased EwS cell number and viability, particularly under hypoxia in SK-ES-1 cells, highlighting DPP4 as a potential therapeutic target.
The NPY1R receptor was expressed in both EwS cell lines, but its functional role differed. Blockade with BMS-193885 reduced total A673 cell number but had no effect on SK-ES-1 cells, suggesting differential receptor utilization. SK-ES-1 cells likely rely on NPY5R for NPY-mediated effects, in line with reports linking NPY5R to metastasis in this line [15]. These results indicate that therapeutic targeting of NPY signalling must account for receptor expression heterogeneity across EwS subtypes.
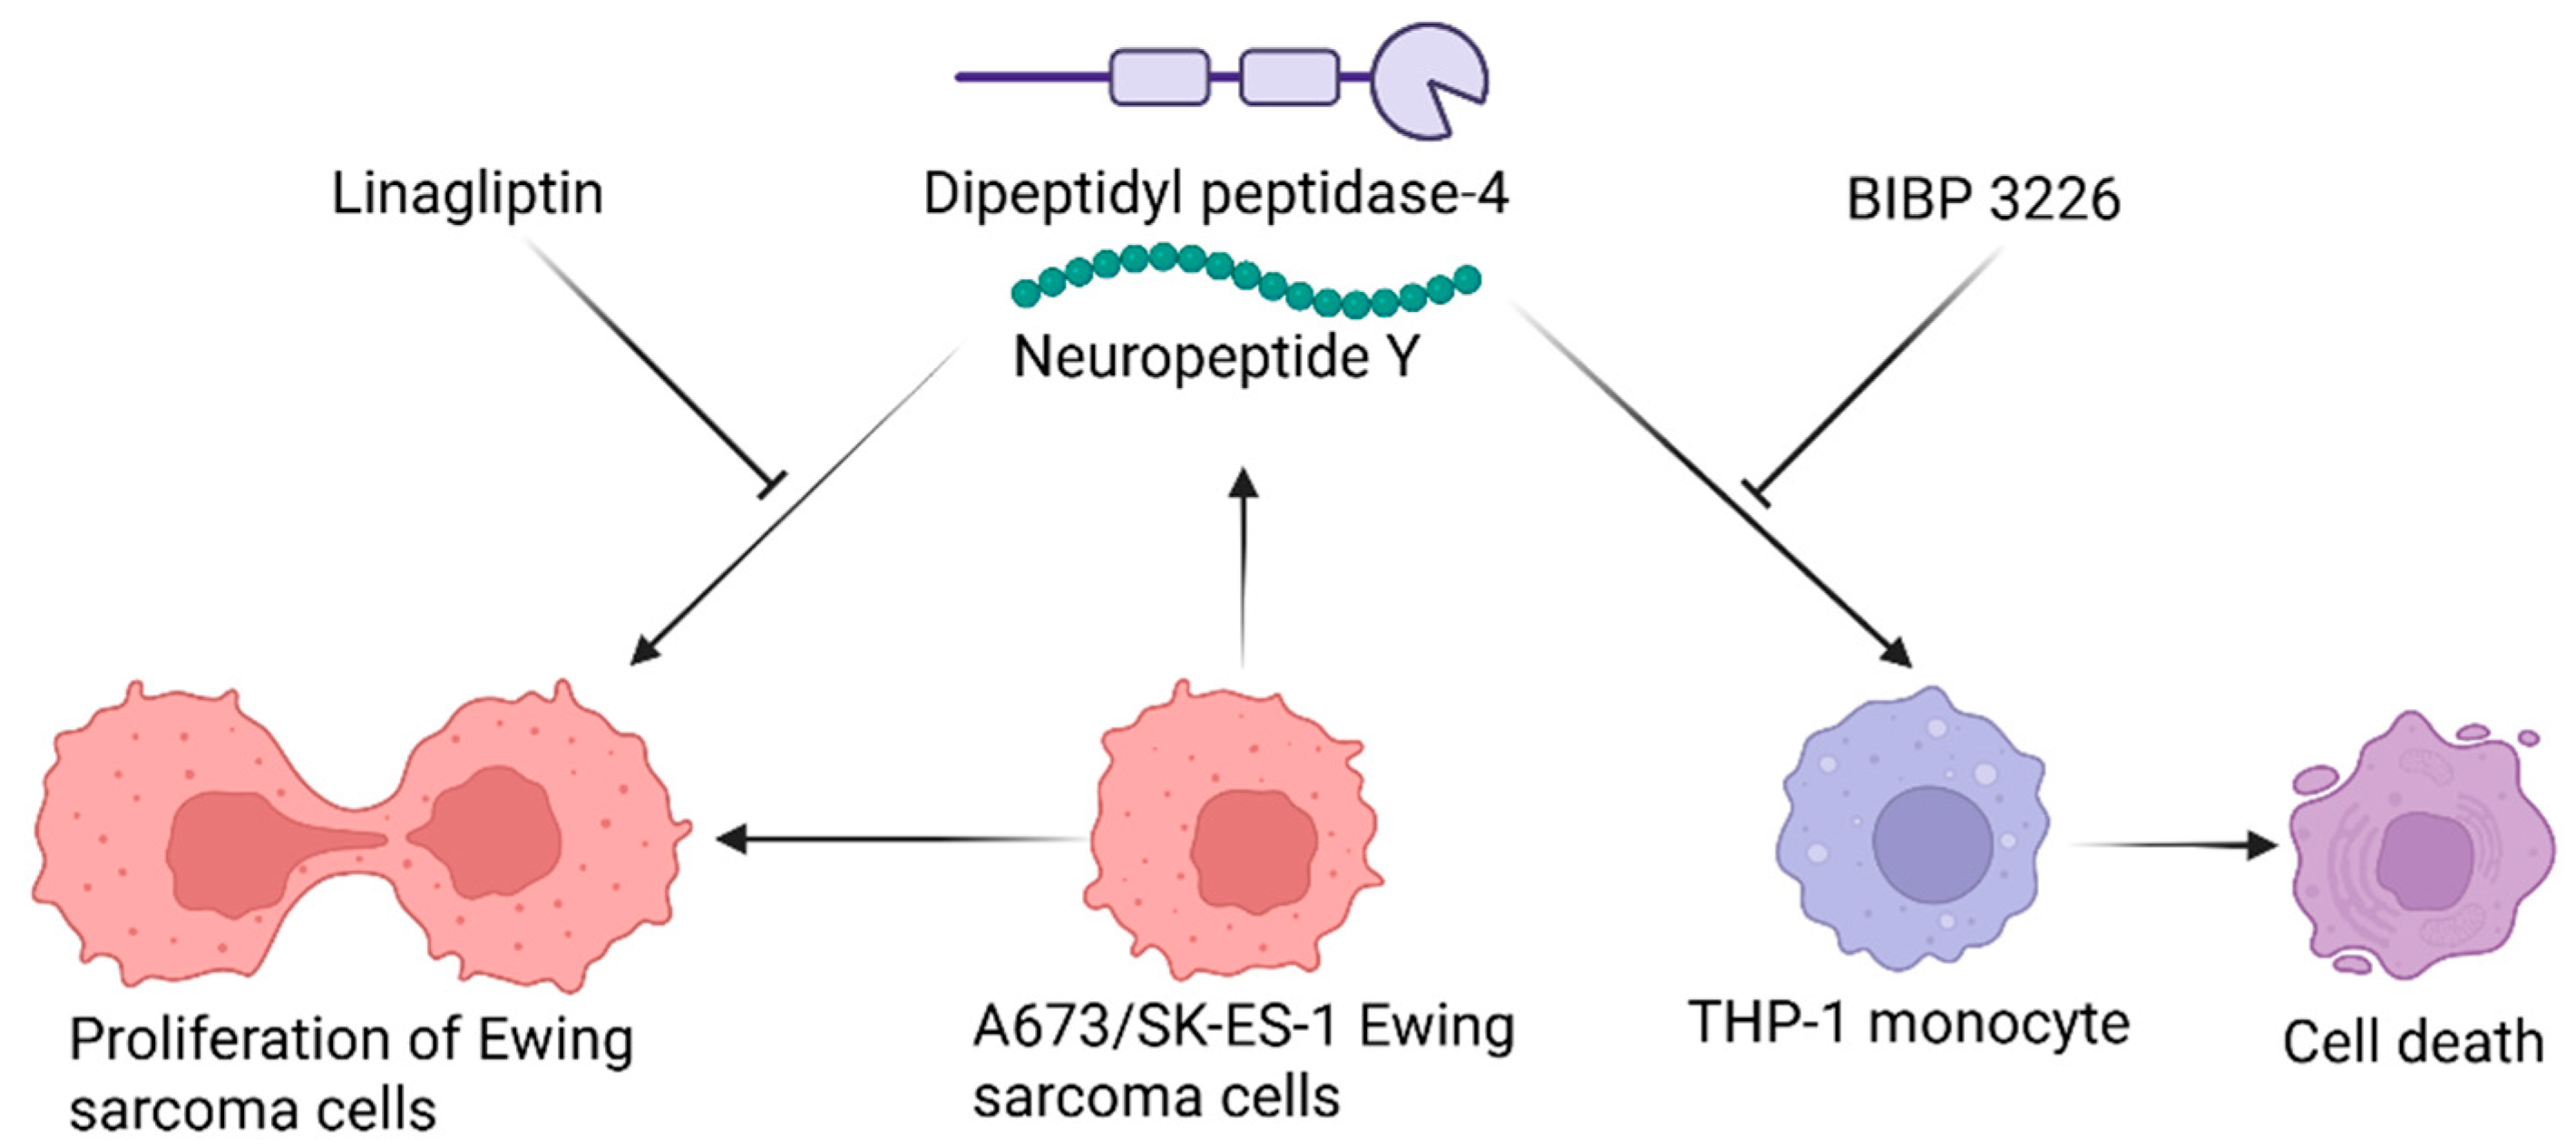
Our data indicate that EwS cells secrete factors, including NPY and DPP4, that actively decrease the viability of THP-1 monocytes. rhNPY and rhDPP4 reduced THP-1 viability, whereas blockade of NPY1R increased it. These findings suggest that EwS cells may create an immunologically cold microenvironment by suppressing monocyte survival, contributing to poor immune infiltration in EwS tumours. Thus, targeting the NPY-DPP4 axis could have dual therapeutic benefits: reducing EwS cell viability while enhancing monocyte survival, potentially improving immune-mediated tumour control.
These findings identify several potential avenues for drug repurposing in EwS. Linagliptin consistently reduced EwS cell number and viability, particularly under hypoxia, suggesting potential utility of DPP4 inhibition in treating EwS tumours. Pharmacological inhibition of NPY1R with re-purposed obesity treatments protects monocytes. Coupled with DPP4 inhibition this could offer a dual strategy to counter both tumour progression and immune evasion.
The presence of NPY and DPP4 in EVs, their autocrine signalling functions, and the differential effects under hypoxia emphasize the need for nuanced therapeutic strategies that account for microenvironmental heterogeneity and receptor-specific signalling.
This study demonstrates that the NPY-DPP4 axis plays a multifaceted role in EwS biology, regulating cell viability, metabolism, and immune interactions in a cell- and hypoxia-dependent manner. Autocrine NPY and DPP4 signalling, coupled with EV-mediated persistence in biological fluids, may drive tumour progression and immune evasion. Therapeutic targeting of this pathway, through DPP4 inhibitors or NPY receptor antagonists, holds promise for both direct tumour suppression and enhancement of immune response in EwS.
Summary Figure.
Ewing sarcoma (EwS) cells exhibit responses to NPY and DPP4 that are opposite to those observed in THP-1 monocytes. A673 and SK-ES-1 EwS cells both secrete DPP4 and NPY; treatment with DPP4 and NPY contributing towards EwS viability, that can be inhibited with linagliptin. Conversely, DPP4 and NPY decrease the viability of THP-1 monocytes, while pharmacological blockade of the NPY sensitive NPY1 receptor with BIBP 3226 increases THP-1 viability. This study provides evidence for discrete targets in the NPY-DPP4-NPY1R signalling pathway that can independently modulate EwS cell and monocyte viability. Created in BioRender. Rumney, R. (2025) https://BioRender.com/g0e7bjt
4. Materials and Methods
Celligner
The Celligner tool (https://depmap.org/portal/celligner/) [35] at the Cancer Dependency Map (DepMap) portal was used to identify the cell lines that most closely resemble the primary EwS tumour. Celligner used cell line RNAseq gene expression data from the DepMap Public 21Q1 file “DepMap DMC 21Q1 CCLE_expression_full.csv” and tumour gene expression data from the Treehouse Tumour Compendium V10 Public PolyA dataset available from the XENA browser.
Cell Culture Assays
Celligner [35] was used to calculate transcriptional distances between cell lines and specific tumour types to indicate the level of similarity (Supplementary Table S1). SK-ES-1 cells were selected for use as a bone derived EwS cell line transcriptionally close to primary EwS tumours which has previously been demonstrated to express the EWS-FLI1 transcript [14], and has featured in several recent high-profile studies into the roles of both NPY and DPP4 [13,15,31,36]. A673 cells were chosen as a comparator due to their highly similar transcriptional distance from the EwS tumour to that of SK-ES-1 cells. Although A673 cells were originally described as a rhabdomyosarcoma cell line, these have since been confirmed to be an extra-skeletal EwS that expresses the EWS-FLI1 fusion oncogene [37]. Because A673 cells had the most similar transcriptional distance from EwS tumours compared to SK-ES-1 cells, we selected A673 cells as the comparator cell type. Using more than one cell line in subsequent experiments allowed us to distinguish between results that are cell line specific and results that may apply to EwS more generally.
A673 and SK-ES-1 cells from ATCC were maintained as recommended by the supplier in 10% Foetal Bovine Serum FBS in DMEM and 15% FBS in McCoy’s 5A media respectively (https://www.atcc.org/products/crl-1598, https://www.atcc.org/products/htb-86) with 100U/mL penicillin, 100µg/mL streptomycin at 37°C. THP-1 cells were maintained as recommended by the supplier in RPMI-1640 with 0.05mM β-mercaptoethanol and 10% FBS (THP-1 - TIB-202 | ATCC). Each stock of heat inactivated FBS (E.U.-approved, South America Origin, Gibco™, SKU 11550356, batch #2337973H) was sterile filtered through a 500 mL volume Filtropur V50, 0.1 µm pore size (Sarstedt, Nümbrecht, Germany) and stored in 50mL aliquots at -80°C before use.
For all experiments, EwS cells were seeded in media with FBS at a density of 60,000/cm2 allowed to attach for 24 hours at 37°C and 5% CO2. In a preliminary analysis, NPY protein and DPP4 activity were quantified in serial dilutions of heat inactivated FBS, to establish the levels of each in cell free media. We found that medium containing 2.5% FBS had 12.9ng/mL NPY, 5% FBS 27.8ng/mL NPY, 10% FBS (equivalent to the ATCC recommended culture conditions for A673 cells) had 51.6ng/mL NPY, while 15% FBS (equivalent to the ATCC recommended culture conditions for SK-ES-1 cells) contained 96.4ng/mL NPY. Serum Neuropeptide Y (NPY) in healthy humans is typically ~0.6ng/mL, while that of EwS patients is elevated to ~1ng/mL [13], so even at the lowest concentration of FBS tested, the concentration of NPY protein was over 12 times higher than in EwS patient serum and 20 times higher than in healthy human serum.
DPP4 enzymatic activity was quantified from serial dilutions of heat inactivated FBS in cell free media. DPP4 activity in 2.5% FBS was 3.81 + 0.85 µU/mL, in 5% FBS it was 8.1 + 1.49 µU/mL, in 10% FBS it was 14.85 + 0.89 µU/mL, and in 15% FBS it was 20.63 + 1.67 µU/mL. DPP4 activity in human serum has been reported at being between 20 to 25U/L [40,41,42]. Therefore, due to the potentially confounding presence of NPY and DPP4 in FBS, all experiments had to be carried out using media containing Knockout Serum Replacement (KSR) (Invitrogen, Paisley, UK) in place of FBS. THP-1 cells were seeded at 20,000 per well in 96 well plates directly with KSR containing media. Treatments included 1ng/mL Neuropeptide Y (NPY) (NM_000905) Human Recombinant Protein (CAT#: TP761100, Origene, Herford, Germany) corresponding to serum concentrations reported from patients with EwS between 0.940 ng/mL to 1.212 ng/mL [13]; 20U/mL DPP4 (ab79138, AbCam, Cambridge, UK) corresponding to previous reports of 20 to 25U/mL in human serum [40,41,42]; 1ng/mL linagliptin (provided by Boehringer Ingelheim) corresponding to the recommended IC50 for the inhibition of DPP-4 activity [43], 5.9nM BMS-193885 (B5063, Merck, Gillingham, UK) corresponding to the IC50 for NPY1R inhibition [31] and 7.2nM BIBP 3226 trifluoroacetate [42]. All treatments were maintained for 48 hours prior to analysis.
Cell Number Determination
For crystal violet (CV) assays, plates containing cells were fixed in 70% ice cold ethanol and air dried prior to staining with 0.5% w/v CV (Fisher Scientific, Loughborough, UK) in 20% methanol [43] solution for 20 minutes on an orbital shaker. Dye was removed and plates rinsed with dH2O until clear. Plates were air dried and cell-bound CV solubilised in 100% methanol and optical density recorded at 590nm.
Cell Viability Assay
The live/dead assay was carried out using the Invitrogen LIVE/DEAD™ Viability/Cytotoxicity Kit (Fisher Scientific, Loughborough, UK), for mammalian cells using the Fluorescence Microplate Protocol at Ex494/Em517 nm for Calcein and Ex528/Em617 nm for Ethidium homodimer-1 in the presence of DNA. Live/Dead data was normalised to baseline controls.
Migration Assay
Migration assays were carried out using transwell inserts for 24 well plates with an 8µm pore size (#83.3932.800, Sarstedt, Leicester, UK) in accordance with protocols previously established specifically for EwS cells [44]. EwS cells were seeded into transwells at 60,000/cm2 in 24 well plates directly above treatment media with 10 µg/mL mitomycin C (BP2531, Fisher Scientific, UK) to prevent proliferation from confounding the results of the migration assay over a 24 h period. Transwells were wiped on the inside with cotton wool, fixed with 10% neutral buffered formalin for 20 minutes and quantified following CV staining. After images were captured, CV staining in transwells was solubilised in 100% methanol and optical density recorded at 590nm.
All plate reader assays were carried out using a SpectraMax i3x multi-mode microplate reader (Molecular Devices, Wokingham, United Kingdom).
Cell Cycle Analysis
For cell cycle analysis, paired cultures of cells grown in serum free media under normoxia and hypoxia were harvested and fixed simultaneously then stained with FxCycle PI/RNase solution (Fisher Scientific) following manufacturer’s instructions. Flow Cytometry was carried out on a Beckman-Coulter Flow Cytometer with data analysis in CytExpert and Floreada.io (https://floreada.io/).
RNA Extraction, cDNA Synthesis and qPCR Analysis
Total RNA was extracted from cells using the RNEasy Plus Universal Mini kit (Qiagen 73404) according to the kit manufacturer’s instructions. RNA quality and concentration were measured using a NanoDrop 1000 Spectrophotometer (Thermo Scientific). RNA integrity was assessed using electrophoresis of 100 ng of total RNA in a 1% agarose gel (Sigma A4718) in TAE buffer and visualisation of ribosomal RNA bands. Total RNA samples were converted to cDNA using SuperScript VILO cDNA Synthesis Kit (Invitrogen 11754050) as per manufacturer instructions.
For qPCR, amplifications were performed in duplicates using 25 ng of cDNA per reaction with Applied Biosystems™ PowerTrack™ SYBR Green Master Mix (Fisher Scientific, Loughborough, UK) forward and reverse primers (Table 1) (Eurofins) and DEPC treated water (Fisher Scientific, BP561) as per manufacturer instructions, on 96 well plates using the QuantStudio™ 5 Real-Time PCR System. Data was normalised to ACTB with the ΔΔCT method.
Immunofluorescent Labelling
5mm glass coverslips (CS) with cells were fixed for 20 minutes at room temperature (RT) in 4% paraformaldehyde in PBS (pH 7.4). CS were rinsed with PBS prior to incubation with 0.1% Triton X-100 in PBS, then incubated for one hour in blocking buffer at room temperature (1% Bovine serum albumin (BSA), 10% normal goat serum (NGS), 0.1% Tween in PBS). CS were incubated with primary antibody against neuropeptide Y receptor type 1 (ab91262, AbCam, UK) at 5µg/mL in blocking buffer overnight at 4°C. After rinsing, CS were incubated with 10ng/mL secondary antibody (Goat anti-rabbit Alexa 488) in blocking buffer for one hour at RT. CS were rinsed with PBS-tween and incubated with phalloidin red (1:40) and Hoechst (1:1000) at RT for 5 minutes before rinsing with PBS and mounting with Invitrogen prolong diamond antifade mounting agent.
NPY and DPP4 Protein Assays
Cell conditioned media (CM) was collected from flasks, centrifuged at 300g for 5 minutes to pellet down any non-adherent cells and sterile filtered through 0.2µm syringe filter. Extracellular vesicles (EVs) were isolated from CM following filtration through an 0.8µm syringe filter, then using the exoEasy Maxi Kit (#76064, Qiagen, Manchester, UK) according to the manufacturer’s instructions. CM, EVs and cell lysates were snap frozen in liquid nitrogen immediately after collection for subsequent measurement of NPY and DPP4 protein and DPP4 enzymatic activity. NPY protein was quantified using the Human Neuropeptide Y (NPY) ELISA (#EZHNPY-25K, Merck, Gillingham, UK). DPP4 protein was quantified using the Human DPPIV/CD26 ELISA Kit (#RAB0147-1KT, Merck, Gillingham, UK). DPP-4 activity was measured with the Fluorometric Dipeptidyl peptidase IV Activity Assay Kit (ab204722, AbCam, Cambridge, UK). All assays were carried out according to the manufacturer’s protocols using a SpectraMax i3x multi-mode microplate reader (Molecular Devices, Wokingham, United Kingdom). All data was normalised to protein measured with the Pierce™ BCA Protein Assay Kits (Fisher Scientific, Loughborough, UK).
5. Conclusion
In conclusion, NPY and DPP4 are driving A673 and SK-ES-1 EwS cell viability, and inhibition of these signalling pathways with linagliptin is sufficient to reduce cell viability, making this a promising candidate for repurposing and future EwS clinical trials.
Supplementary Materials
The following supporting information can be downloaded at the website of this paper posted on Preprints.org.
Author Contributions
Conceptualization, R.M.H.R.; methodology, R.M.H.R. and D.C.G.; formal analysis, R.M.H.R.; investigation, R.M.H.R.; data curation, R.M.H.R.; writing—original draft preparation, R.M.H.R.; writing—review and editing R.M.H.R., and D.C.G., project administration, R.M.H.R., and D.C.G.; funding acquisition, R.M.H.R., and D.C.G. All authors have read and agreed to the published version of the manuscript.
Funding
This work received funding from The Children’s Cancer and Leukaemia Group and Little Princess Trust Project Grant (Award Reference CCLGA 2020 15).
Institutional Review Board Statement
Not applicable.
Informed Consent Statement
Not applicable.
Data Availability Statement
All data are presented in the manuscript.
Acknowledgments
We thank Boehringer Ingelheim for providing us with pure Linagliptin for use in this study.
Conflicts of Interest
The authors declare no conflicts of interest
Abbreviations
The following abbreviations are used in this manuscript:
| DPP4 | Dipeptidyl peptidase-4 |
| EwS | Ewing sarcoma |
| LG | Linagliptin |
| NPY | Neuropeptide Y |
| NPY1R | Neuropeptide Y receptor 1 |
| NPY5R | Neuropeptide Y receptor 5 |
References
- Ebrahimpour, A; Chehrassan, M; Sadighi, M; Looha, MA; Karimi, A; Akbari, A; et al. The Survival and Incidence Rate of Ewing Sarcoma; a National Population-based Study in Iran (2008-2015). Archives of Bone and Joint Surgery [Internet] 2020, 8(3), 391. [Google Scholar] [PubMed]
- Whelan, J; McTiernan, A; Cooper, N; Wong, YK; Francis, M; Vernon, S; et al. Incidence and survival of malignant bone sarcomas in England 1979-2007. Int J Cancer [Internet] 2012, 131(4). Available online: https://onlinelibrary.wiley.com/doi/10.1002/ijc.26426. [CrossRef] [PubMed]
- Zöllner, SK; Amatruda, JF; Bauer, S; Collaud, S; de Álava, E; Dubois, SG; et al. Ewing Sarcoma—Diagnosis, Treatment, Clinical Challenges and Future Perspectives. J Clin Med [Internet] 2021, 10(8). [Google Scholar] [CrossRef] [PubMed]
- Li, W; Dong, S; Lin, Y; Wu, H; Chen, M; Qin, C; et al. A tool for predicting overall survival in patients with Ewing sarcoma: a multicenter retrospective study. BMC Cancer 2022, 22(1), 914. Available online: https://link.springer.com/articles/10.1186/s12885-022-09796-7. [CrossRef]
- Cavazzana, AO; Miser, JS; Jefferson, J; Triche, TJ. Experimental evidence for a neural origin of Ewing’s sarcoma of bone. Am J Pathol [Internet] 1987, 127(3), 507. Available online: https://pmc.ncbi.nlm.nih.gov/articles/PMC1899764/.
- Riggi, N; Suvà, ML; Suvà, D; Cironi, L; Provero, P; Tercier, S; et al. EWS-FLI-1 expression triggers a ewing’s sarcoma initiation program in primary human mesenchymal stem cells. Cancer Res. 2008. [Google Scholar] [CrossRef]
- Erkizan, H V.; Uversky, VN; Toretsky, JA. Oncogenic partnerships: EWS-FLI1 protein interactions initiate key pathways of Ewing’s sarcoma. Clinical Cancer Research [Internet] 2010, 16(16), 4077–83. [Google Scholar] [CrossRef]
- Mackintosh, C; Madoz-Gúrpide, J; Ordóñez, JL; Osuna, D; Herrero-Martín, D. The molecular pathogenesis of Ewing’s sarcoma. Cancer Biol Ther [Internet] 2010, 9(9), 653–65. Available online: https://www.tandfonline.com/doi/pdf/10.4161/cbt.9.9.11511.
- Hesla, AC; Papakonstantinou, A; Tsagkozis, P. Current Status of Management and Outcome for Patients with Ewing Sarcoma. Cancers 2021, Vol 13, Page 1202 [Internet]. 2021, 13(6), 1202. Available online: https://www.mdpi.com/2072-6694/13/6/1202/htm.
- Brennan, B; Kirton, L; Marec-Bérard, P; Gaspar, N; Laurence, V; Martín-Broto, J; et al. Comparison of two chemotherapy regimens in patients with newly diagnosed Ewing sarcoma (EE2012): an open-label, randomised, phase 3 trial. The Lancet [Internet] 2022, 400(10362), 1513–21. Available online: https://www.thelancet.com/action/showFullText?pii=S0140673622017901. [CrossRef]
- DuBois, SG; Krailo, MD; Glade-Bender, J; Buxton, A; Laack, N; Randall, RL; et al. Randomized Phase III Trial of Ganitumab with Interval-Compressed Chemotherapy for Patients with Newly Diagnosed Metastatic Ewing Sarcoma: A Report from the Children’s Oncology Group. Journal of Clinical Oncology [Internet] 2023, 41(11), 2098–107. Available online: https://ascopubs.org/doi/pdf/10.1200/JCO.22.01815. [CrossRef] [PubMed]
- Choy, E; Butrynski, JE; Harmon, DC; Morgan, JA; George, S; Wagner, AJ; et al. Phase II study of olaparib in patients with refractory Ewing sarcoma following failure of standard chemotherapy. BMC Cancer 2014, 14(1), 813. Available online: https://link.springer.com/articles/10.1186/1471-2407-14-813. [CrossRef] [PubMed]
- Tilan, JU; Krailo, M; Barkauskas, DA; Galli, S; Mtaweh, H; Long, J; et al. Systemic levels of neuropeptide Y and dipeptidyl peptidase activity in patients with Ewing sarcoma--associations with tumor phenotype and survival. Cancer [Internet] 2015, 121(5), 697–707. Available online: https://pubmed.ncbi.nlm.nih.gov/25387699/. [CrossRef] [PubMed]
- Hong, SH; Tilan, JU; Galli, S; Izycka-Swieszewska, E; Polk, T; Horton, M; et al. High neuropeptide Y release associates with Ewing sarcoma bone dissemination - in vivo model of site-specific metastases. Oncotarget [Internet] 2015, 6(9), 7151–65. Available online: https://pubmed.ncbi.nlm.nih.gov/25714031/. [CrossRef]
- Lu, C; Mahajan, A; Hong, SHH; Galli, S; Zhu, S; Tilan, JU; et al. Hypoxia-activated neuropeptide Y/Y5 receptor/RhoA pathway triggers chromosomal instability and bone metastasis in Ewing sarcoma. Nat Commun [Internet] 2022, 13(1). [Google Scholar] [CrossRef]
- Wu, W; Peng, S; Shi, Y; Li, L; Song, Z; Lin, S. NPY promotes macrophage migration by upregulating matrix metalloproteinase-8 expression. J Cell Physiol [Internet] 2021, 236(3), 1903–12. Available online: https://pubmed.ncbi.nlm.nih.gov/32710469/. [CrossRef]
- Choi, B; Shin, MK; Kim, EY; Park, JE; Lee, H; Kim, SW; et al. Elevated Neuropeptide y in endothelial dysfunction promotes macrophage infiltration and smooth muscle foam cell formation. In Front Immunol [Internet]; 2019; 10(JULY). Available online: https://pubmed.ncbi.nlm.nih.gov/31379881/.
- Tan, RZ; Li, JC; Zhu, BW; Huang, XR; Wang, HL; Jia, J; et al. Neuropeptide Y protects kidney from acute kidney injury by inactivating M1 macrophages via the Y1R-NF-κB-Mincle-dependent mechanism. Int J Biol Sci [Internet] 2023, 19(2), 521–36. Available online: https://pubmed.ncbi.nlm.nih.gov/36632461/. [CrossRef]
- Profumo, E; Maggi, E; Arese, M; Di Cristofano, C; Salvati, B; Saso, L; et al. Neuropeptide Y Promotes Human M2 Macrophage Polarization and Enhances p62/SQSTM1-Dependent Autophagy and NRF2 Activation. Int J Mol Sci [Internet] 2022, 23(21). [Google Scholar] [CrossRef]
- Singer, K; Morris, DL; Oatmen, KE; Wang, T; DelProposto, J; Mergian, T; et al. Neuropeptide Y Is Produced by Adipose Tissue Macrophages and Regulates Obesity-Induced Inflammation. PLoS One [Internet] 2013, 8(3), 57929. [Google Scholar]
- Morales, E; Olson, M; Iglesias, F; Dahiya, S; Luetkens, T; Atanackovic, D. Role of immunotherapy in Ewing sarcoma. J Immunother Cancer [Internet] 2020, 8(2), e000653. Available online: https://pmc.ncbi.nlm.nih.gov/articles/PMC7725096/. [CrossRef]
- Kumar, RR; Agarwal, N; Shree, A; Gorain, JK; Rahul, E; Ganguly, S; et al. Decoding the immune landscape in Ewing sarcoma pathogenesis: The role of tumor infiltrating immune cells and immune milieu. J Bone Oncol [Internet] 2025, 52, 100678. Available online: https://www.sciencedirect.com/science/article/pii/S2212137425000193. [CrossRef]
- Palumbo, A; Facon, T; Sonneveld, P; Bladè, J; Offidani, M; Gay, F; et al. Thalidomide for treatment of multiple myeloma: 10 years later. Blood [Internet] 2008, 111(8), 3968–77. [Google Scholar] [CrossRef] [PubMed]
- Pantziarka, P; Bouche, G; Sukhatme, V; Meheus, L; Rooman, I; Sukhatme, VP. Repurposing Drugs in Oncology (ReDO)—Propranolol as an anti-cancer agent. Ecancermedicalscience [Internet] 2016, 10, 680. Available online: https://pmc.ncbi.nlm.nih.gov/articles/PMC5102691/. [CrossRef] [PubMed]
- Joe, NS; Godet, I; Milki, N; Ain, NUI; Oza, HH; Riggins, GJ; et al. Mebendazole prevents distant organ metastases in part by decreasing ITGβ4 expression and cancer stemness. Breast Cancer Research 2022 24:1 [Internet]. 2022, 24(1), 1–18. Available online: https://breast-cancer-research.biomedcentral.com/articles/10.1186/s13058-022-01591-3.
- Mansoori, S; Fryknäs, M; Alvfors, C; Loskog, A; Larsson, R; Nygren, P. A phase 2a clinical study on the safety and efficacy of individualized dosed mebendazole in patients with advanced gastrointestinal cancer. Scientific Reports 2021, 11(1), 1–8. Available online: https://www.nature.com/articles/s41598-021-88433-y. [CrossRef]
- Morales, DR; Morris, AD. Metformin in cancer treatment and prevention. Annu Rev Med [Internet] 2015, 66, 17–29. Available online: https://www.annualreviews.org/content/journals/10.1146/annurev-med-062613-093128. [CrossRef]
- Saraei, P; Asadi, I; Kakar, MA; Moradi-Kor, N. The beneficial effects of metformin on cancer prevention and therapy: a comprehensive review of recent advances. Cancer Manag Res [Internet] 2019, 11, 3295. Available online: https://pmc.ncbi.nlm.nih.gov/articles/PMC6497052/. [CrossRef]
- Antal-Zimanyi, I; Bruce, MA; LeBoulluec, KL; Iben, LG; Mattson, GK; McGovern, RT; et al. Pharmacological characterization and appetite suppressive properties of BMS-193885, a novel and selective neuropeptide Y1 receptor antagonist. Eur J Pharmacol. 2008, 590(1–3), 224–32. [Google Scholar] [CrossRef]
- Doupis, J; Veves, A. DPP4 Inhibitors: a new approach in diabetes treatment. Advances in Therapy 2008, 2008 25 25(7), 627–43. Available online: https://link.springer.com/article/10.1007/s12325-008-0076-1. [CrossRef]
- Tilan, JU; Lu, C; Galli, S; Izycka-Swieszewska, E; Earnest, JP; Shabbir, A; et al. Hypoxia shifts activity of neuropeptide Y in Ewing sarcoma from growth-inhibitory to growth-promoting effects. Oncotarget 2013. [Google Scholar] [CrossRef]
- Medeiros, PJ; Pascetta, SA; Kirsh, SM; Al-Khazraji, BK; Uniacke, J. Expression of hypoxia inducible factor-dependent neuropeptide Y receptors Y1 and Y5 sensitizes hypoxic cells to NPY stimulation. Journal of Biological Chemistry [Internet] 2022, 298(3), 101645. Available online: http://www.jbc.org/article/S0021925822000850/fulltext. [CrossRef]
- Pernow, J; Lundberg, JM; Kaijser, L. Vasoconstrictor effects in vivo and plasma disappearance rate of neuropeptide Y in man. Life Sci. 1987, 40(1), 47–54. [Google Scholar] [CrossRef]
- Kitlinska, J; Abe, K; Kuo, L; Pons, J; Yu, M; Li, L; et al. Differential Effects of Neuropeptide Y on the Growth and Vascularization of Neural Crest–Derived Tumors. Cancer Res [Internet] 2005, 65(5), 1719–28. [Google Scholar] [CrossRef]
- Warren, A; Chen, Y; Jones, A; Shibue, T; Hahn, WC; Boehm, JS; et al. Global computational alignment of tumor and cell line transcriptional profiles. Nature Communications 2021, 12(1), 1–12. Available online: https://www.nature.com/articles/s41467-020-20294-x. [CrossRef]
- Ko«, M; Waser, B; Reubi, JC. High Expression of Neuropeptide Y1 Receptors in Ewing Sarcoma Tumors. 9 Aug 2025. Available online: www.aacrjournals.org.
- Chaturvedi, A; Hoffman, LM; Welm, AL; Lessnick, SL; Beckerle, MC. The EWS/FLI Oncogene Drives Changes in Cellular Morphology, Adhesion, and Migration in Ewing Sarcoma. Genes Cancer [Internet] 2012, 3(2), 102–16. [Google Scholar] [CrossRef]
- Firneisz, G; Varga, T; Lengyel, G; Fehér, J; Ghyczy, D; Wichmann, B; et al. Serum dipeptidyl peptidase-4 activity in insulin resistant patients with non-alcoholic fatty liver disease: a novel liver disease biomarker. PLoS One [Internet] 2010, 5(8). Available online: https://pubmed.ncbi.nlm.nih.gov/20805868/. [CrossRef]
- Varga, T; Somogyi, A; Barna, G; Wichmann, B; Nagy, G; Rácz, K; et al. Higher serum DPP-4 enzyme activity and decreased lymphocyte CD26 expression in type 1 diabetes. Pathol Oncol Res [Internet] 2011, 17(4), 925–30. Available online: https://pubmed.ncbi.nlm.nih.gov/21785903/. [CrossRef]
- Penaforte-Saboia, JG; Couri, CEB; Albuquerque, NV; Silva, VLL; Olegario, NB da C; Fernandes, VO; et al. Emerging roles of dipeptidyl peptidase-4 inhibitors in delaying the progression of type 1 diabetes mellitus [Internet]. Diabetes Metab Syndr Obes 2021, 14, 565–73. Available online: https://pubmed.ncbi.nlm.nih.gov/33603422/. [CrossRef] [PubMed]
- Sortino, MA; Sinagra, T; Canonico, PL. Linagliptin: A thorough Characterization beyond Its Clinical Efficacy. Front Endocrinol (Lausanne) [Internet] 2013, 4. [Google Scholar] [CrossRef] [PubMed]
- Pheng, LH; Regoli, D. Receptors for NPY in peripheral tissues: Bioassays. Life Sci [Internet] 2000, 67(8), 847–62. Available online: https://www.sciencedirect.com/science/article/abs/pii/S0024320500006792. [CrossRef] [PubMed]
- Feoktistova, M; Geserick, P; Leverkus, M. Crystal violet assay for determining viability of cultured cells. Cold Spring Harb Protoc [Internet] 2016, 2016(4), pdb.prot087379. Available online: http://cshprotocols.cshlp.org/content/2016/4/pdb.prot087379.full. [CrossRef]
- Cidre-Aranaz, F. Analysis of Migration and Invasion in Ewing Sarcoma. Methods Mol Biol [Internet] 2021, 2226, 167–79. Available online: https://pubmed.ncbi.nlm.nih.gov/33326101/.
Figure 1.
NPY secretion by EwS cells. NPY was quantified from A673 and SK-ES-1 cells after 48 hours in serum free media in normoxia and hypoxia. NPY protein expression in cell conditioned media (CM) was quantified from (A) A673 and (B) SK-ES-1 cells (** = p < 0.01, t-test). NPY protein expression was quantified from extracellular vesicles (EVs) from (C) A673 and (D) SK-ES-1 cells (* = p < 0.05, t-test). NT – nontreated controls.
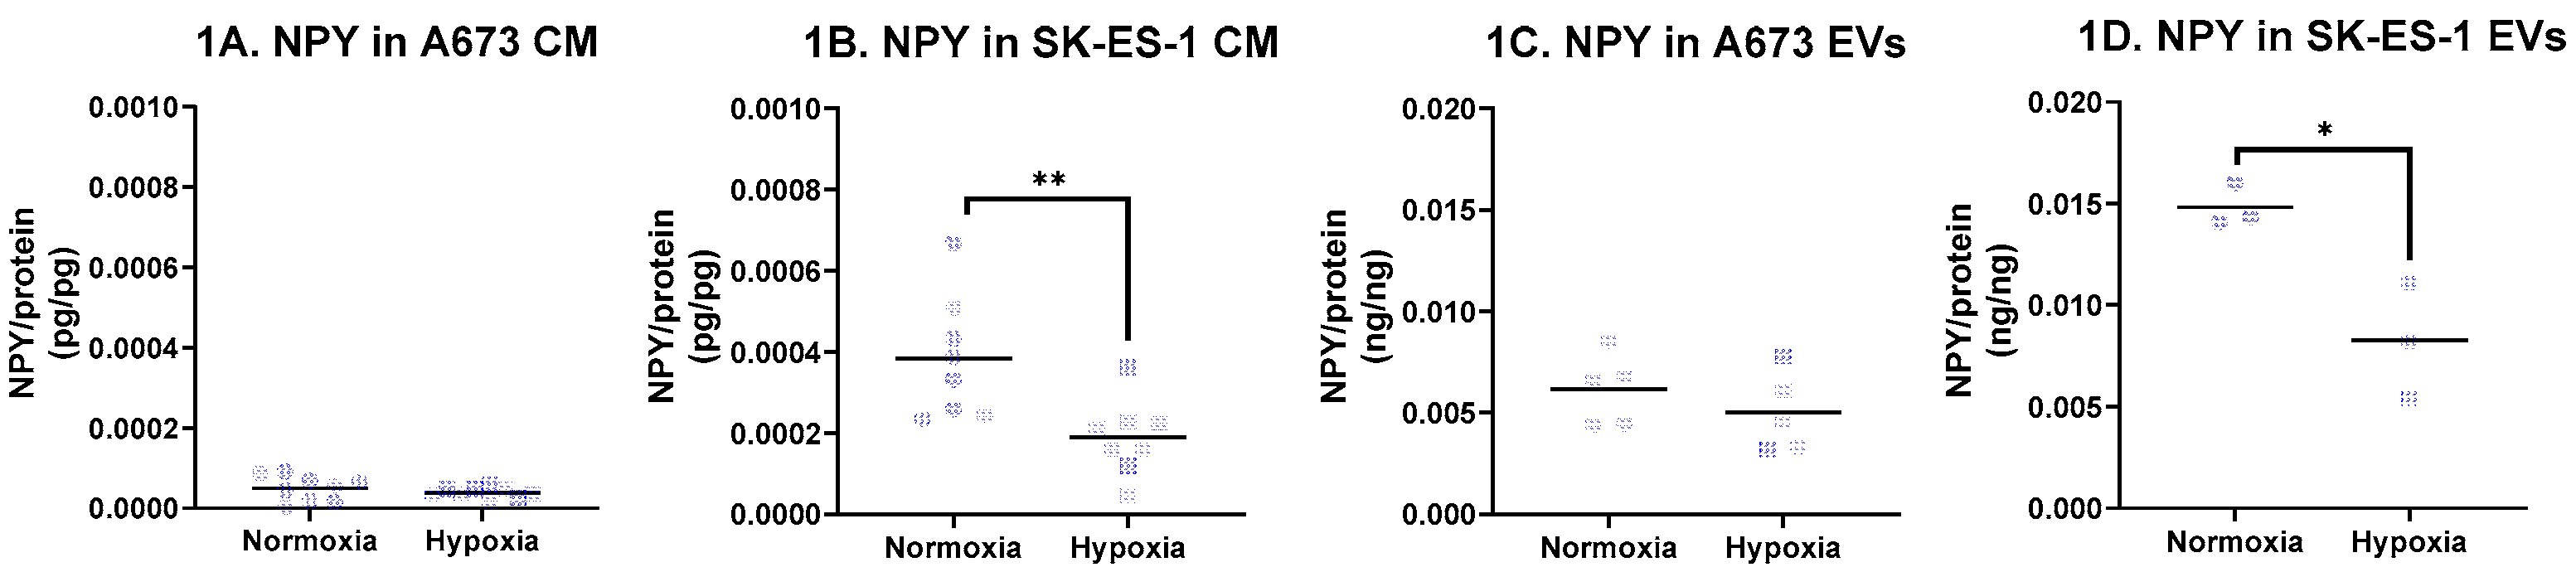
Figure 2.
Effects of rhNPY upon EwS cells. A673 and SK-ES-1 cells were treated with 1 ng/mL rhNPY for 48 h under normoxic or hypoxic conditions in serum-free media. Live-cell staining was assessed using Calcein-AM in (A) A673 normoxia, (B) A673 hypoxia, (C) SK-ES-1 normoxia, and (D) SK-ES-1 hypoxia (n = 25 per condition from three independent experiments). rhNPY increased the proportion of (E) A673 cells in S phase under normoxia and (F) SK-ES-1 cells in G1 phase under hypoxia (n = 3 independent experiments). rhNPY also enhanced Transwell migration of (G) A673 cells under normoxia (n = 8 per condition from two independent experiments) and (H) SK-ES-1 cells under hypoxia (n = 12 per condition from three independent experiments) (*p < 0.05, **p < 0.01, ***p < 0.001, t-test; ##p < 0.01, Mann–Whitney test). NT – nontreated controls.
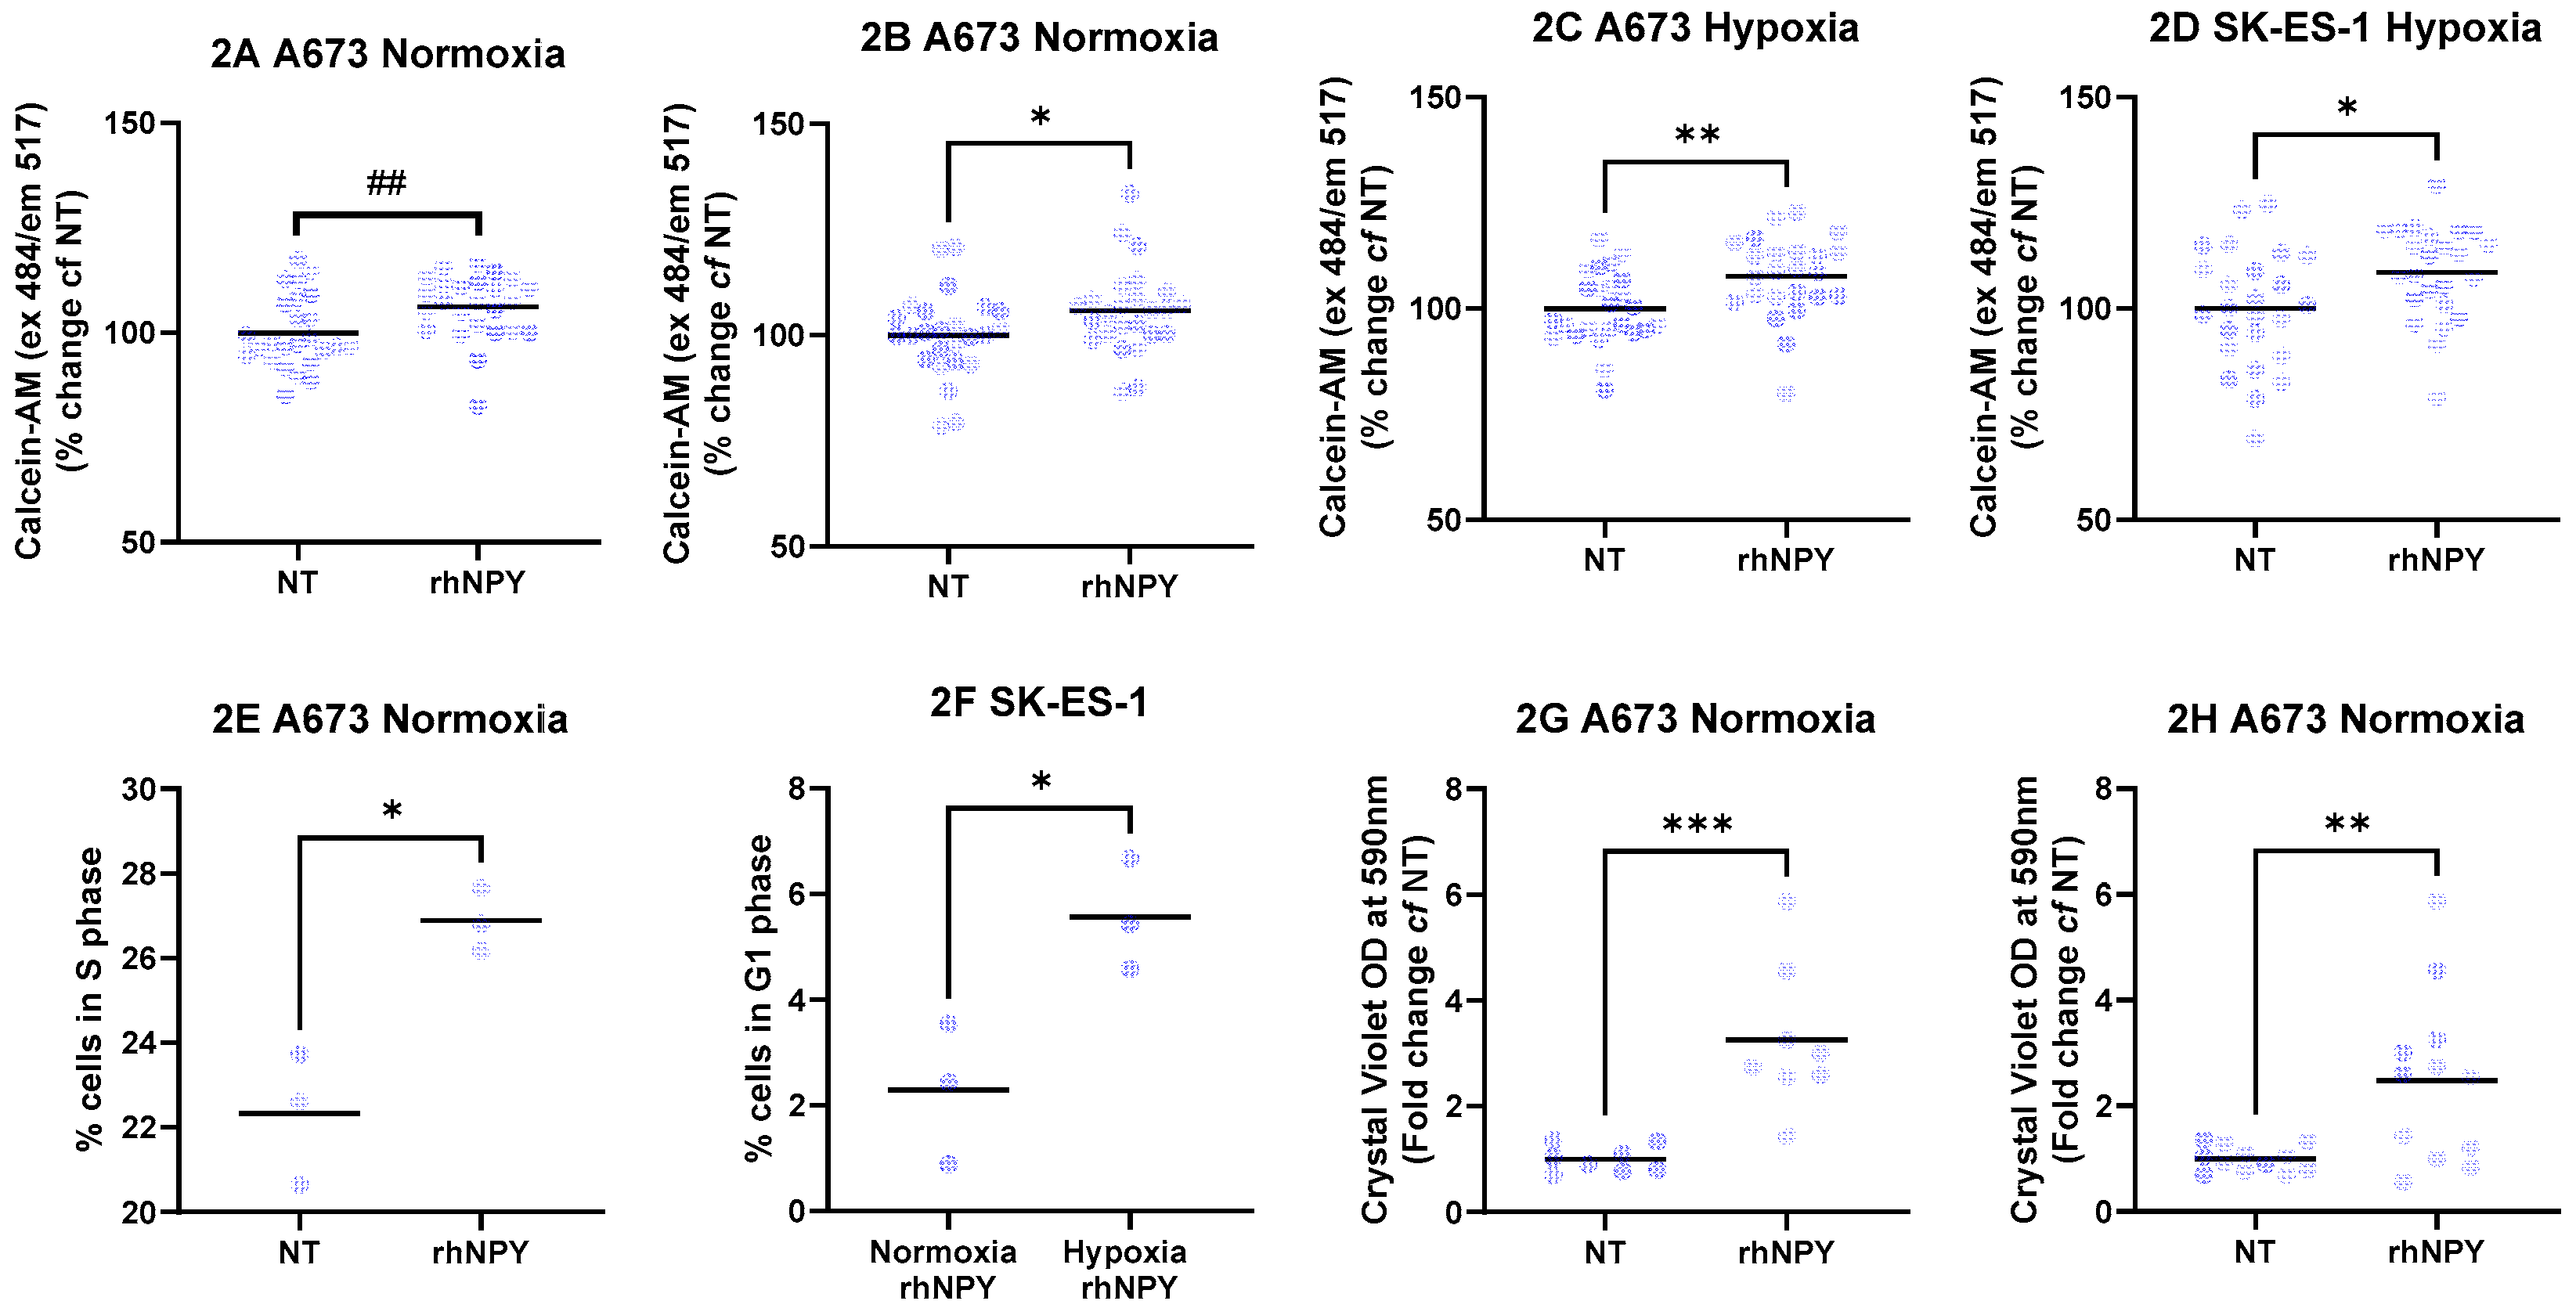
Figure 3.
DPP4 expression. Transcript expression of DPP4, protein expression of DPP4 and enzymatic activity of DPP4 were quantified from A673 and SK-ES-1 after 48 hours in serum free media in normoxia and hypoxia. DPP4 expression in (A) A673 cells and (B) SK-ES-1 cells in normoxia and hypoxia (** = p < 0.01, t-test). DPP4 enzymatic activity in lysates from (C) A673 cells and (D) SK-ES-1 cells in normoxia and hypoxia (* = p < 0.05, t-test). DPP4 enzyme activity in cell conditioned media (CM) from (E) A673 and (F) SK-ES-1 cells in normoxia and hypoxia (# = p < 0.05, Mann-Whitney test). DPP4 protein in extracellular vesicles (EVs) from (G) A673 and (H) SK-ES-1 cells in normoxia and hypoxia (# = p < 0.05, Mann-Whitney test). NT – nontreated controls.
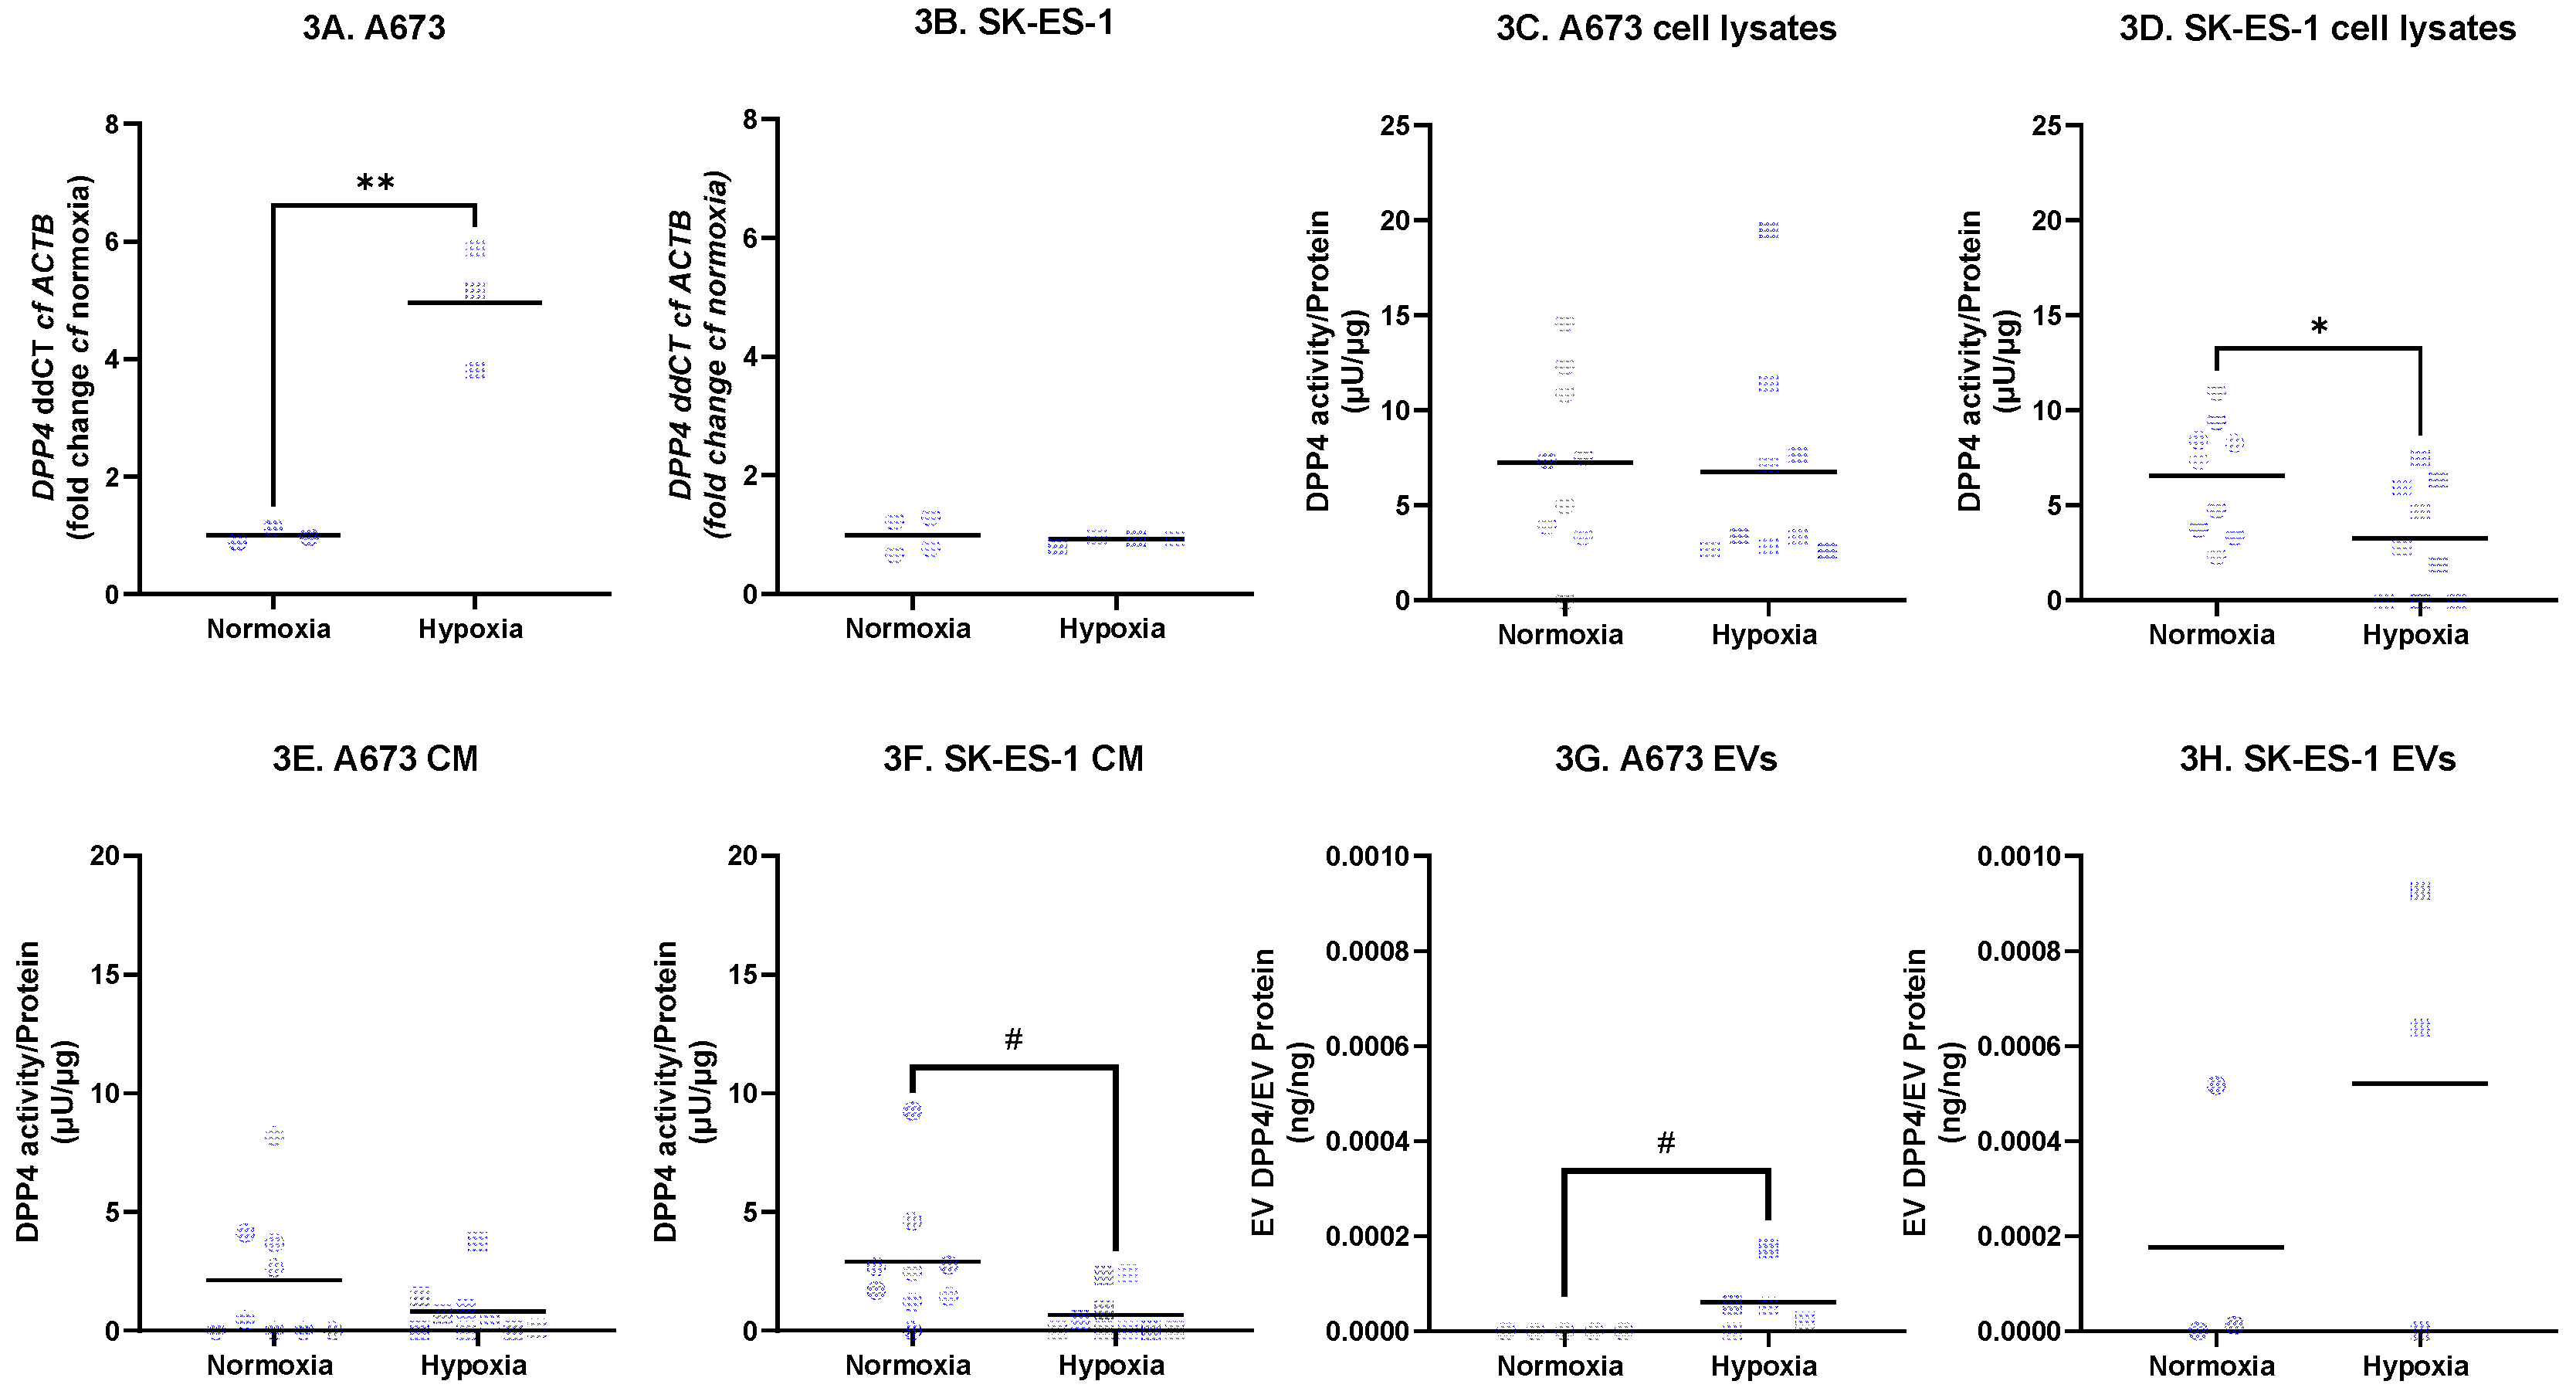
Figure 4.
Effects of rhDPP4. A673 and SK-ES-1 cells were treated with 20U/mL rhDPP4 in normoxia and hypoxia for 48 hours. The effect of rhDPP4 upon NADH metabolism by (E) A673 cells and (F) SK-ES-1 cells in hypoxia (** = p < 0.01, t-test). NT – nontreated controls.
Figure 4.
Effects of rhDPP4. A673 and SK-ES-1 cells were treated with 20U/mL rhDPP4 in normoxia and hypoxia for 48 hours. The effect of rhDPP4 upon NADH metabolism by (E) A673 cells and (F) SK-ES-1 cells in hypoxia (** = p < 0.01, t-test). NT – nontreated controls.
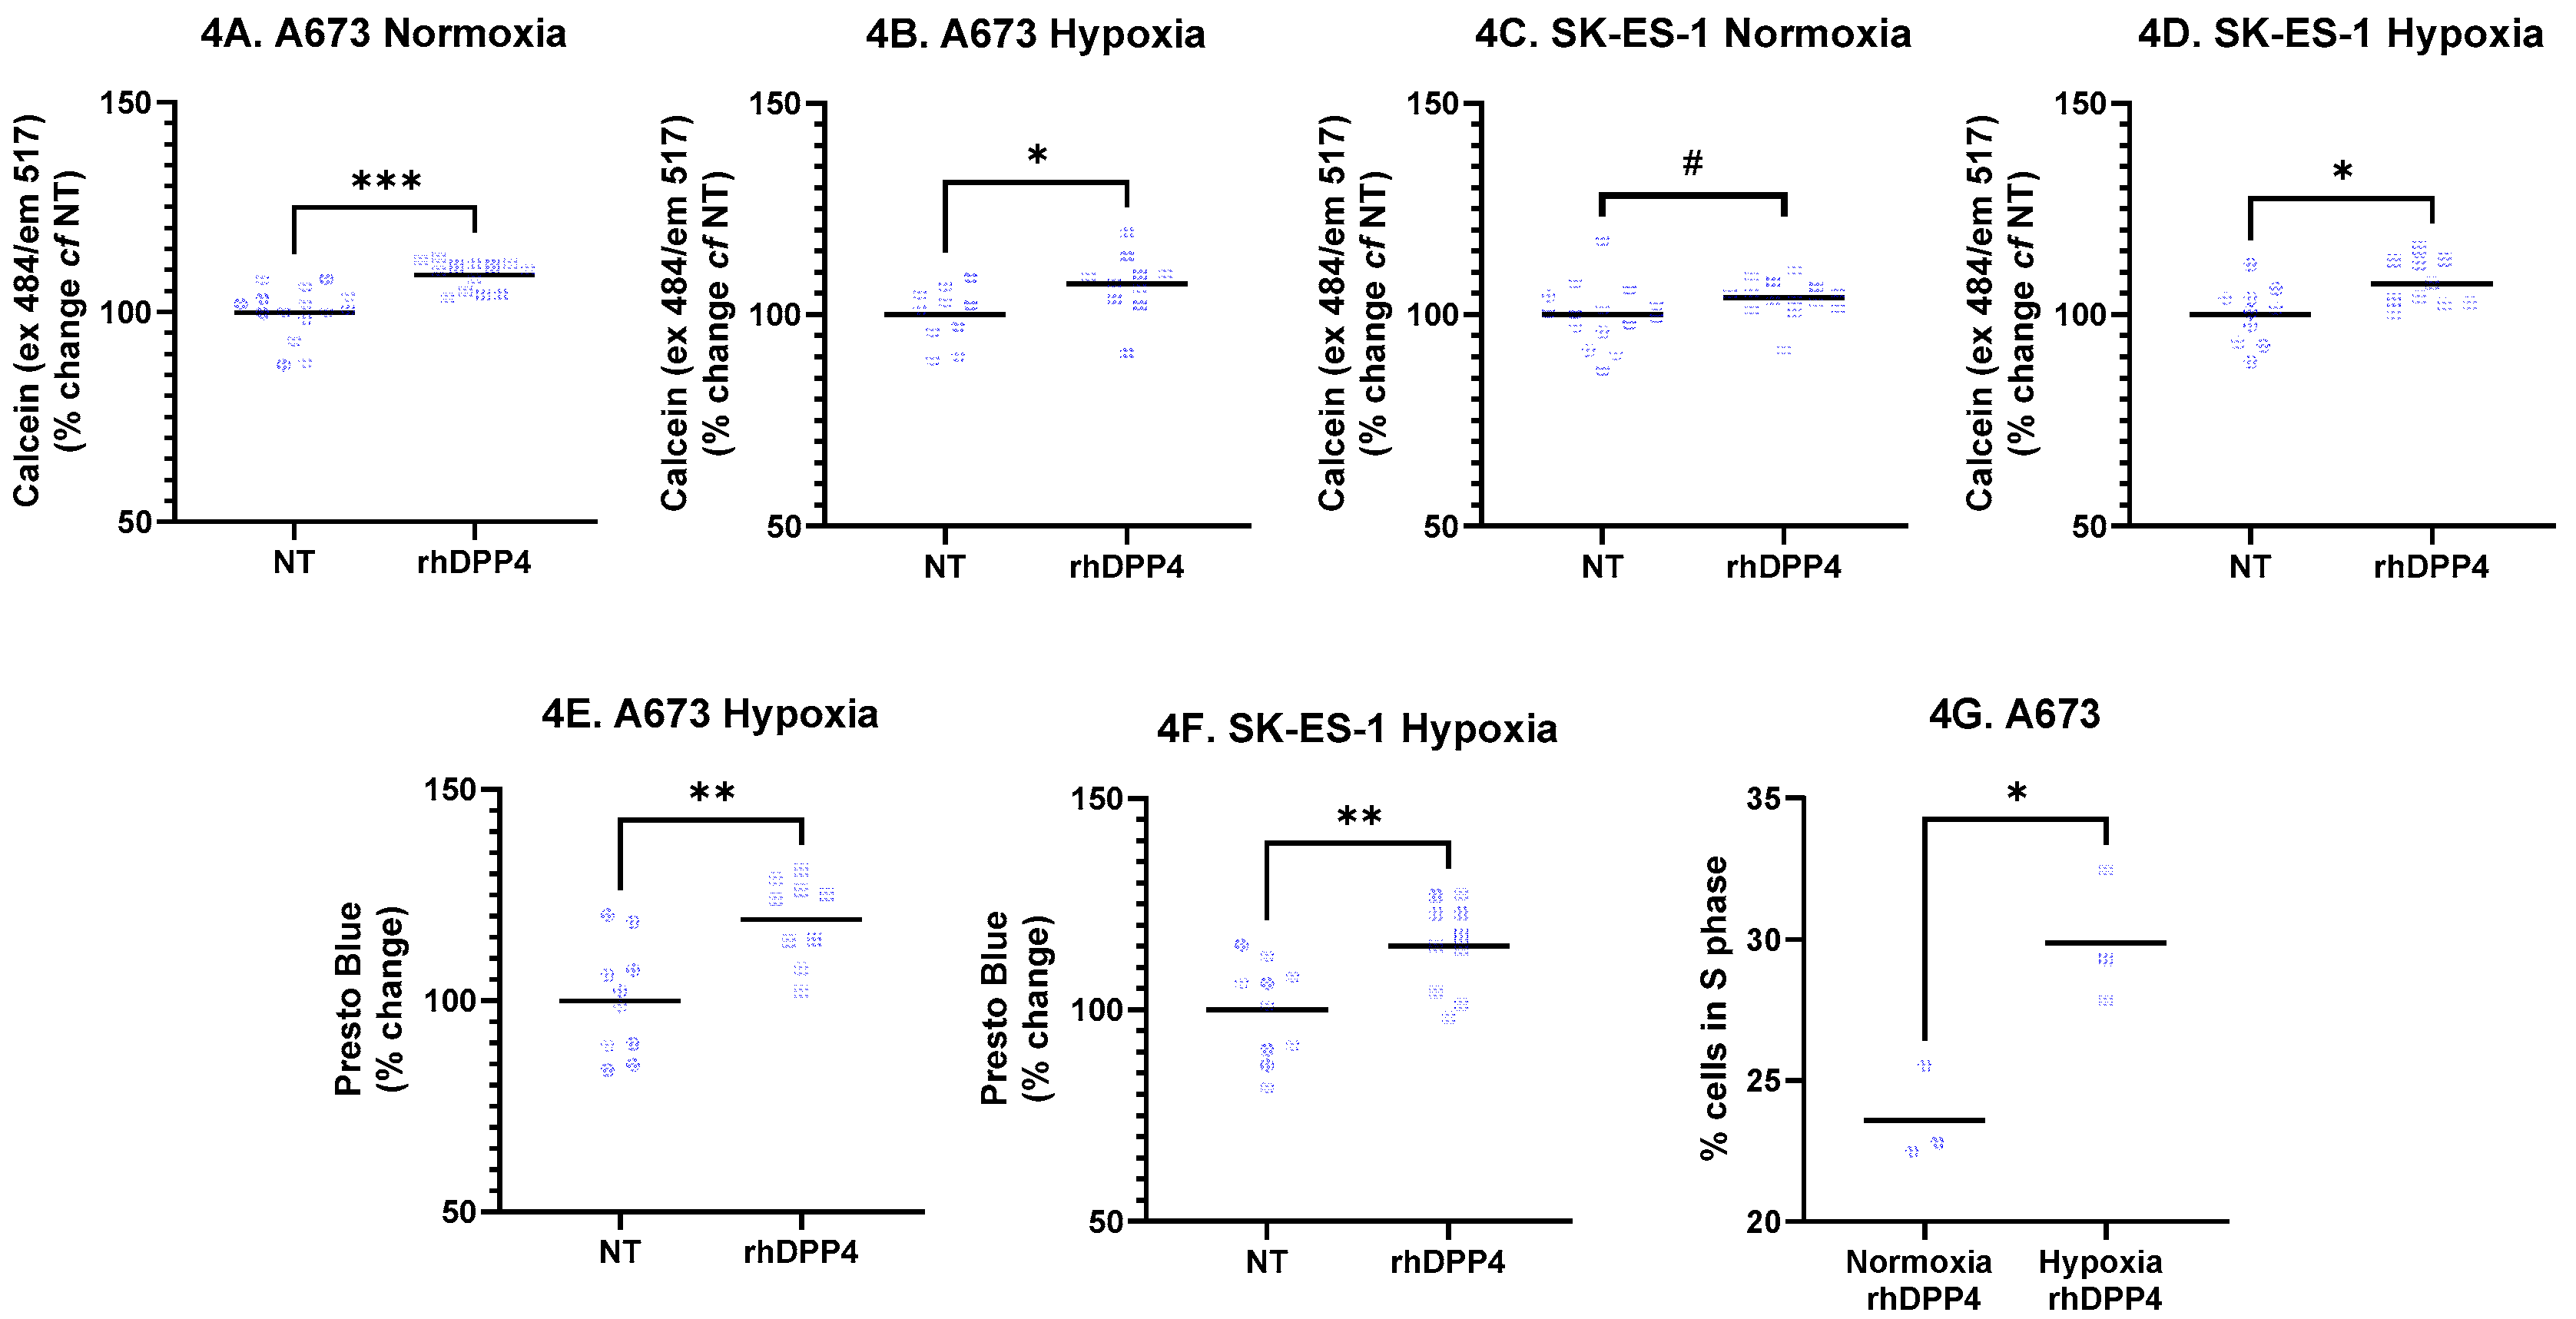
Figure 5.
Effect of DPP4 inhibition. A673 and SK-ES-1 cells were treated with 1ng/mL linagliptin (LG) in normoxia and hypoxia for 48 hours. Crystal violet staining was quantified from A673 cells in (A) normoxia and (B) hypoxia, and SK-ES-1 cells in (C) normoxia and (D) hypoxia (* = p < 0.05, ** = p < 001, t-test, # = p<0.05, Mann-Whitney test). Cell death was quantified from (E) SK-ES-1 cells in hypoxia with the cell death marker Ethidium homodimer-1 (*** = p < 0.001, t-test). NT – nontreated controls.
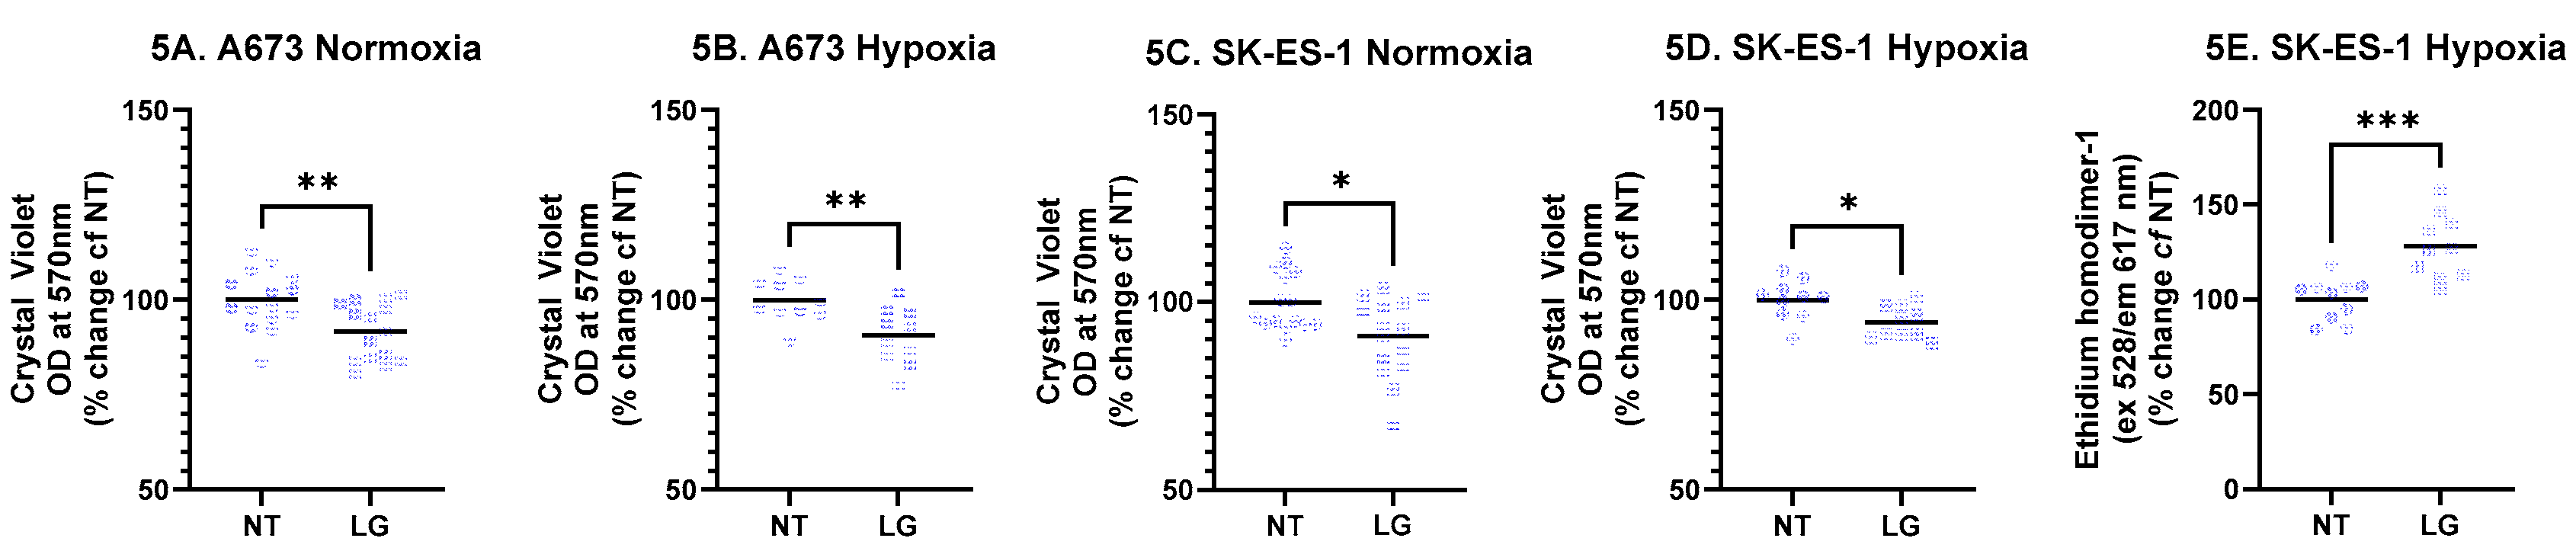

Table 1.
Primer Sequences.
| Target | 5’ to 3’ sequence |
|---|---|
| ACTB forward | AGC CTT CCT TCC TGG GCA T |
| ACTB reverse | CTT CAT TGT GCT GGG TGC C |
| DPP4 forward | TCT GTG GTG GTC TCC AAA CG |
| DPP4 reverse | GGA TTC ACA GCT CCT GCC TTT |
| NPY forward | GTT CCC AGA ACT CGG CTT GA |
| NPY reverse | GCA GAA TTC AGC ACA GTG GC |
| NPY1R forward | CCA CTC TCC TCT TGG TGC TG |
| NPY1R reverse | GAG CCA GCA GAC TGC AAA TG |
| NPY5R forward | CTG GAT CAG TGG ATG TTT GGC |
| NPY5R reverse | GGA AGG GGA GAA CAG ATG GC |
Disclaimer/Publisher’s Note: The statements, opinions and data contained in all publications are solely those of the individual author(s) and contributor(s) and not of MDPI and/or the editor(s). MDPI and/or the editor(s) disclaim responsibility for any injury to people or property resulting from any ideas, methods, instructions or products referred to in the content. |
© 2026 by the authors. Licensee MDPI, Basel, Switzerland. This article is an open access article distributed under the terms and conditions of the Creative Commons Attribution (CC BY) license (http://creativecommons.org/licenses/by/4.0/).
Copyright: This open access article is published under a Creative Commons CC BY 4.0 license, which permit the free download, distribution, and reuse, provided that the author and preprint are cited in any reuse.


