
Submitted:
21 January 2026
Posted:
21 January 2026
You are already at the latest version
Abstract
Canada’s fossil fuel production is highly subsidized despite the pollution. In the Province of Alberta subsidies for oil and gas total approximately CAD$1.78 billion/year. This study quantifies the impacts of shifting fossil-fuel subsides towards solar photovoltaic (PV) capital investments. Although solar is already the lowest-cost form of electricity, such a subsidy shift would accelerate the renewable energy transition. This study found such a shift would enable installation of 1.53 GW of new solar PV capacity annually with the current investment tax credit (ITC) or 1.07 GW without it. These new solar PV systems can generate 2.02 TWh/year of clean electricity, if ITC is applied on capital investments and 1.41 TWh/year without it. The solar electricity is cost-competitive with natural gas generation, with levelized costs ranging from $49.01 to $61.97 CAD/MWh with ITC ($63.62 to $80.45 CAD/MWh w/o ITC) across Alberta. High-solar-resource locations in Alberta including Lethbridge ($49.01 CAD/MWh) and Calgary ($49.28 CAD/MWh) achieve lower costs than natural gas ($51.80 CAD/MWh). This excludes carbon externalities, fuel price volatility, and the long-term operational subsidies required to maintain fossil fuel competitiveness, suggesting that solar PV is already an economically rational alternative. Shifting Alberta’s fossil fuel subsidies is a solution for Canada's 2050 net-zero commitments. Solar-fossil fuel generation parity would be achieved by 2040 with ITC credits or 2045 without it. The subsidy redirection can reduce Alberta's grid emission intensity from the current 450 kg-CO₂e/MWh to 68.8 kg-CO₂e/MWh (with ITC) or 119.2 kg-CO₂e/MWh (without ITC) by 2050, representing reductions of 84.7% and 73.5%, respectively.
Keywords:
fossil fuels
; greenhouse gas emissions
; climate change
; subsidies
; solar photovoltaics
; energy transition
; energy economics
1. Introduction
Fossil fuel combustion for energy has well-established mechanisms of harm of the environment, climate, and human health (Silva et al., 2021). The most prominent fossil-fuel-related pollutant, carbon dioxide (CO2), is a potent greenhouse gas (Kweku et al., 2018) responsible for most of anthropogenic global warming (i.e., over 79% in the U.S. (US EPA, 2017)). The earth’s warming is causing increases in the severity of weather conditions, ‘natural’ disasters, and climate extremes (Allan et al., 2023). Of humanity’s carbon emissions, 25% is absorbed by oceans, leading to acidification damaging marine biodiversity and introducing pollutants into the food chain, affecting marine life and human health (Falkenberg et al., 2020). Additionally, rising sea levels threaten 10% of the global population with flooding, storm surges, and land loss (Cazenave and Cozannet, 2014). Economic losses from climate destabilization have exceeded $1.3 trillion USD in the past decade (Montgomery, 2024). By 2050, climate change is projected to even more significantly impact the economy, globally, the economic losses from climate change by 2050 are expected to decrease GDP by 11% to 14%, amounting to US$23 trillion annually (Raihan, 2023). Fossil fuels also emit other hazardous air pollutants, including sulfur dioxide, nitrogen oxides, particulate matter, and mercury, which are linked to severe health issues such as asthma, cancer, heart disease, and neurodevelopment disorders, including permanent brain damage in children (Kotcher et al., 2019). Overall it is clear CO2 and other fossil-fuel pollution is directly responsible for human mortality (Bressler, 2021; Caiazzo et al., 2013; McGeehin and Mirabelli, 2001; Pearce and Parncutt, 2023; Vohra et al., 2021).
Although large countries like the U.S. and Russia dominate fossil fuel production and thus are responsible for the bulk of the externalities, even countries with good environmental reputations are responsible for a substantial negative impact. For example, Canada plays a prominent positive role on the world stage (Bricker, 2024), yet ranks the fourth-largest in crude oil and the fifth-largest producer of natural gas (Canadian Centre for Energy Information, 2025). Fossil fuels make up 77% of Canada’s total energy supply (Canadian Centre for Energy Information, 2025).The oil and gas sector alone, made up 31% of the nation’s GHG emissions, and are increasing (by 21% over the past two decades)(Canadian Centre for Energy Information, 2025). Alberta, the epicenter of Canada’s fossil fuel sector, produces 84% of the nation’s crude oil and 61% of its natural gas (Canada Energy Regulator, 2024).
Counter to its positive image (Bricker, 2024), Canada’s fossil fuel production and thus pollution is actually highly subsidized. Canada remains the leading G20 country in public funding of fossil fuels in respect to GDP (Onifade, 2022) despite international commitments to transition to cleaner energy. Careful analysis of Canada’ commitments transposed on real world energy use show that Canada will not meet its goals and commitments without massive aggressive renewable energy deployment (Rana and Pearce, 2025). Canada signed on to agreements such as the Paris Agreement (Environment and Climate Change Canada, 2016), the Glasgow Climate Pact (Natural Resources Canada, 2022), and the COP26 Statement of International Public Support for the Clean Energy Transition (Government of Canada, 2021), yet Canadian subsidies to fossil fuel companies are often provided through royalty structures, tax provisions, and research grants (Onifade, 2022). Fossil fuel subsidies lack transparency, preventing businesses, financial institutions, and citizens from evaluating their cost-effectiveness (Environmental Defence and Gass, 2019). Alberta alone allocates billions of dollars annually to fossil fuel subsidies, which are projected to dominate public energy funding until at least 2026 (Environmental Defence and Gass, 2019). The persistent financial support for fossil fuels hides a market failure and neglects conservation and societal values (Porket, 2003), while also undermining the adoption of cleaner technologies (Environmental Defence and Gass, 2019), and leads to an inefficient market and resistance to the public (Mead, 1979). The economic and social impacts of the reliance on fossil fuels to drive the Canadian economy are profoundly negative. Despite subsidies to the fossil fuel industry, energy poverty affects 20% of Canadians, with two million living in high-energy-poverty municipalities (Riva et al., 2024). Moreover, the boom-and-bust nature of fossil fuel markets contributes to price volatility, driving inflation and reducing affordability for Canadian households (Kelly, 2024).
A key pathway to transition away from externality-laden fossil fuel dependence is the adoption of renewable energy, particularly solar photovoltaic (PV) technologies that convert sunlight directly to electricity (Izam et al., 2022). Solar PV has experienced remarkable cost reductions, with module prices dropping by 93% between 2009 to 2023% (IRENA, 2024). PV costs have dropped so far it is now the lowest cost form of generating electricity in most countries (IEA, 2023). Solar PV is specifically efficient in sunny regions, advantageous for Alberta, that ranges from 8 hours to 18 hours per day (Solbak, 2016) (Current Results, 2025), where its cost-effectiveness and scalability make it a viable alternative to fossil fuels (Ram et al., 2018). Alberta has more than enough land, particularly when agrivoltaics (combining agriculture and PV for increased crop yields) is considered (Jamil and Pearce, 2023). Such a transition could involve repurposing existing oil and gas sites for solar PV infrastructure and expanding the province’s renewable energy capacity to eliminate the need for fossil fuels (Rana and Pearce, 2025). Previous case studies, have focused on reducing or eliminating fossil fuel subsidies to promote the adoption of solar energy and the reduction of GHG emissions including: (i) Lebanon, Saudi Arabia, South Africa, Tunisia (Matsuo and Schmidt, 2017), (ii) the European Union (Sampedro et al., 2017), and (iii) Malaysia (Yusoff and Bekhet, 2016).
If fossil fuel subsidies are transferred to solar photovoltaics, would Canada’s twin problems of energy price volatility and energy-related carbon emissions can be solved? To answer that question, this study explores the more granular potential for transitioning Alberta’s massive oil and gas subsidies to solar PV. Specifically, this shift is modeled using the Solar Alone-objective Advisor (SAMA) simulation. The resulting PV energy generation are estimated. This analysis is further refined through comparing the levelized cost of electricity (LCOE) to assess potential financial performance and savings for the solar PV industry and Albertan residents, respectively. Finally, the carbon emissions are quantified and compared for both subsidy approaches.
2. Methods
2.1. Subsidy Monetary Allocation
The data used in the analysis, covering both federal and provincial subsidies, were extracted from the following third-party organizations: (i) International Institute for Sustainable Development (Kelly, 2024), (ii) Environmental Defense (Environmental Defence and Gass, 2019), (iii) Global Subsidies Initiative (Corkal et al., 2020). These data are derived from the following reports: (Environmental Defence and Gass, 2019), (Corkal, 2021), (Corkal et al., 2020), (McKenzie et al., 2022), and (Levin, 2024). All data were then analyzed to determine validity, allocation to Alberta and ability to transfer the subsidy to solar PV. The methodology for determining the subsidies transferred from the Albertan fossil fuel industry to solar PV aimed to estimate the initial capital investment and future operating expenses of the transition. The evaluation was based on two main criteria: reported and geographic quantifiability.
The flow diagrams below (Figure 1) outline the process for selecting appropriate subsidy groups used in the methods and calculations of this paper.
Initially, subsidies were selected for the case study if they were clearly quantified within financial reporting. Subsidies that lacked a clearly defined financial structure, such as tax provisions, unavailability of data, policy and cross-sector overlap, were excluded from the case study due to their unquantifiable nature.
Furthermore, subsidies were classified through two mechanisms of public funding: federal and provincial subsidies. Both federal and provincial subsidies were considered in the case study, and the pool of public funding. The provincial government subsidy for fossil fuels per year, FP, is:
where,
FP,i = The i-th fossil fuel subsidies funded by the provincial government [$/yr]
Ti = The quantified value of the i-th tax reduction or exemption funded by the provincial government [$/yr]
Ri = The quantified value of the i-th legacy royalty adjustment program funded by the provincial government [$/yr]
Ci = The quantified value of the i-th carbon capture and sequestration program funded by the provincial government [$/yr]
Ai = The quantified value of the i-th Alberta innovates program funded by the provincial government [$/yr]
Ei = The quantified value of the i-th emission reduction Alberta funded by the provincial government [$/yr]
EDi = The quantified value of the i-th Energy Diversification Act Program funded by the provincial government [$/yr]
Ii = The quantified value of the i-th direct industrial infrastructure development funded by the provincial government [$/yr]
Mi = The quantified value of the i-th modernized royalty framework funded by the provincial government [$/yr]
Oi = The quantified value of the i-th’s year other programs and projects funding provided by the provincial government [$/yr].
The federal subsidies (FF) per year are given by:
where,
FF,i = The i-th fossil fuel subsidies funded by the federal government [$/yr]
EVi = The quantified value of the i-th electric vehicle and alternative fuel infrastructure framework funded by the federal government [$/yr]
EIi = The quantified value of the i-th energy innovation program funded by the federal government [$/yr]
Li = The quantified value of the i-th low carbon economy program funded by the federal government [$/yr]
Wi = The quantified value of the i-th western economic diversification Canada program funded by the federal government [$/yr]
Si = The quantified value of the i-th strategic innovation program funded by the federal government [$/yr]
Additionally, subsidies were included based on geographic allocation. Federal subsidies that were distributed across multiple provinces needed to clearly define a quantifiable share allocated to Alberta in order to be included in this case study. This allocation was quantified either through explicitly stated percentages in the reports or by identifying direct funds tied to specific companies, locations, or operations within Alberta. The monetary value allocated to Alberta’s fossil fuel industry, ,was then calculated as follows:
where,
FG,i = The quantified value of the i-th subsidy allocated to Alberta funded by the federal government
XAi = The quantified composition of the i-th subsidy allocated to the Albertan industry [%]
Afterwards both the provincial and federal subsidies allocated portions towards Alberta were summed together. This contributes to the total public funding the Albertan fossil fuel industry receives annually, that is quantifiable. Thus the total subsidies in Alberta are:
The subsidies detailed in Supplementary Information are summarized by type in Table 1.
To determine the capital investment required to transition to solar PV, one year of public funding was determined for simplicity. Due to the fluctuation in fossil fuel public funding in the past decade, a three-year average was taken to determine the capital investment for the infrastructure for solar PV. The subsidized capital expenditure, CAPEXG, is
where,
FT,n = The calculated transferable public funding at year n [$/yr]
Due to the inconsistency of public funding and data availability post the COVID-19 pandemic, the three-year average was based on the most consistent pre-pandemic data: 2017/2018, 2018/2019, and 2019/2020. These years represent the most recent financial commitments and records of subsidies prior to the pandemic’s disruption.
2.2. Subsidy Geographic Allocation
To determine the allocation of subsidies to specific locations, the methodology primarily relied on the geographic distribution of previous subsidies. This was assessed based on the operational location of the subsidized activity or the headquarters of the company receiving the subsidy. By anchoring allocations to these existing patterns, the approach provides a realistic framework to stabilize economic operations and support employment transitions, addressing the loss of jobs in the fossil fuel industry while fostering growth in the solar PV industry.
Table 2 illustrates the amount of fossil fuel subsidies allocated to each location to finance capital expenditures for the solar PV transition. The subsidies were averaged across the years between 2017-18 to 2019-20. The locations of the subsidies were based off where the majority of the revenue was earned through public funding. Locations that did not have a specified singular location were appointed to Lethbridge; the region with the most solar potential in Alberta (Urban, 2018). Hence, Lethbridge was awarded the majority of subsidies for capital expenditure due to the lack of information within Canadian public funding for fossil fuels. Sturgeon received an average of $346 million CAD annually, due the private institutions Alberta Petroleum Marketing Commission (APMC) and Canadian Natural Resources Limited (CNRL) borrowing from the provincial government to finance the Northwest Redwater Sturgeon Refinery.
2.3. Subsidy Transfer Simulation
To determine what PV system size is equal to average annual subsidies in Alberta from 2017-2020, PV simulations and analysis are conducted according to the models in SAMA software (Ali Sadat et al., 2023; Sadat and Pearce, 2024). The power generation of PV (PPV) in kW is modeled using Eq.6, in which the NPV is the number of PV modules, fPV represents the derating factor for PV modules, stands for the rated capacity of the PV array at STC conditions in kW, POA (t) is the plane of array irradiance in W/m2 at time step t, POASTC is POA at STC conditions and is the PV temperature coefficient. TModule at time step t is calculated using Eq.7 in °C with TRef of 25 °C, where TAmb is the ambient temperature in °C, and Tnoct is the nominal operating module temperature in °C.
The input data for these simulations are listed in Table 3.
2.4. Investment Tax Credit (ITC)
The government of Canada provides a 30% refundable tax credit on the capital cost of solar PV systems through the Clean Technology Investment Tax Credit (CT ITC) (Schoeck, 2023). This paper incorporates two scenarios regarding tax credit.
In the first scenario, the $1.78 billion in redirected fossil fuel subsidies serves as the primary capital investment, representing 70% CAPEX for solar PV infrastructure. These investments then qualify for the existing 30% CT ITC, which provides an additional $0.76 billion in federal support. This layered funding approach demonstrates how repurposing fossil fuel subsidies can be amplified by maintaining current solar support mechanisms, resulting in total investment capital of $2.54 billion, effectively 1.43 times the original redirected subsidy amount. This scenario represents a policy framework where fossil fuel subsidies are redirected while existing renewable energy incentives remain in place to maximize deployment.
The second scenario examines what would occur if only the $1.78 billion in redirected fossil fuel subsidies were available for solar PV investment, without the additional ITC benefit. This scenario isolates the impact of the subsidy transfer itself, showing the deployment potential achievable through redirected fossil fuel funding alone, without leveraging existing ITC.2.5 Parity Point
The number of years required for the solar PV industry to reach the production level of the fossil fuel (FF) industry was analyzed if current subsidies are being redirected into solar PV capital investment. This represents the time required for cumulative solar PV generation (funded by redirected fossil fuel subsidies and general production growth) to equal the annual fossil fuel energy production in Alberta.
The annual solar PV generation capacity added each year from converted subsidies () is calculated from Equation 8, where is solar PV generation at location i based on the SAMA software calculations, all in [TWh/year].
Consequently, this paper presents a mathematical model to analyze the transition from fossil fuel to renewable energy generation in Alberta, considering both capacity shifting and sector growth dynamics. The model accounts for total electricity demand growth while maintaining the constraint that all growth originates from the renewable energy sector. In 2024, Alberta approximately generated 88.827 TWh electricity (T0), 81% of which (F0=71.95 TWh) comes from fossil fuels and 19% (R0=16.877 TWh) from renewables (wind, solar, and hydro) (AESO, 2025). Total solar generation in Alberta was 2.882 TWh (S0), with other types renewable energy generation share of 13.995 TWh (O0) in 2024 (AESO, 2025).
In this model it is assumed that fossil fuel subsidies are shifted into capital investment in solar PV. The annual generation shift from fossil fuels to solar is called ΔS here as calculated above. It is also assumes that total electricity generation growths by gtotal which is considered 2.6% based on average change in Alberta Internal Load (AIL) (AESO, 2025). Since the primary objective is transitioning from fossil fuels to renewable energy, it was assumed that all electricity generation growth will come exclusively from all renewable sources (wind, solar, and hydro). As solar capacity expands by ΔS, fossil fuel generation will decrease proportionally and will not experience any growth during this transition period. As a result, solar generation increases through two mechanisms: capacity shifted from fossil fuels (ΔS) and proportional share of total generation growth (αs×ΔG(t)) where αs is solar share within renewables and ΔG(t) is total generation growth annually applied only on renewables calculated in Equation.10. Therefore Equation 9 calculates cumulative solar generation capacity at year t in TWh (, starting from initial capacity S₀ in TWh.
In equation 10, total electricity generation is calculated based on growth rate of gtotal using equation 11 where T(t) is total generation in year .
Fossil fuel generation decreases only through capacity shifting, with no organic growth as modeled in equation 12:
Other renewables grow only through their proportional share of total generation growth, modeled in equation 13, where is other renewables share within renewables. Logically .
Solar-fossil fuel parity () is when cumulative solar PV generation (S) equals the annual fossil fuel production (), calculated from Equation 14.
2.6. Emission Evolution
This study also investigates amount of carbon emissions avoided by redirecting fossil fuels subsides into PV investments. Equation 15 represents the grid carbon intensity in year (GI(t)) in kg CO₂e/TWh in which E(t) is total grid emissions in year in kg CO₂e.
Initial grid intensity of 450kg CO2e/MWh (GI0 = 400,000,000 kg CO₂e/TWh)(Arcus Power Corps, 2024) and solar lifecycle emission factor of 40 kg CO2e/MWh (EFsolar=40,000,000 kg CO₂e/TWh (Stages, 2012), representing manufacturing, installation, and end-of-life impacts, amortized per MWh of generation capacity) was considered for calculations.
The dynamic fossil fuel emission factor is calculated by :.
The emission change from capacity shift is calculated using Equation 17. The term represents emissions eliminated from fossil generation and the term represents lifecycle emissions incurred from new solar installation.
Emission change from generation growth (ΔEgrowth(t)) is calculated from :
Fossil operational emissions after shift is calculated from Equation 19.
Then total emissions at year is represented by:
Finally, annually CO2 from capacity shifting () can be calculated from:
2.7. Levelized cost of electricity (LCOE)
To evaluate the economic competitiveness of solar PV systems relative to fossil fuel generation, LCOE is calculated for both combined cycle gas turbine (CCGT) and simple cycle gas turbine (SCGT) plants using the methodology outlined by (NREL, 2025) in Equation 22. The LCOE calculation incorporates four primary cost components: capital expenditure (CAPEX), fixed operating and maintenance costs, variable operating and maintenance costs, and fuel costs. CAPEXs are set at $1,645,000/MW for CCGT and $1,480,000/MW for SCGT (IESO, 2024), with the capital recovery factor (CRF) determined according to Equation 23 (Ali Sadat et al., 2023) based on real discount rate (ir) calculated using Equation 24 and life time of project (n). In equation 17, is nominal discount rate and f is inflation rate. Fixed operating and maintenance expenses () are $46,000/MW·yr for CCGT and $36,000/MW·yr for SCGT (IESO, 2024).
The denominator of the LCOE formula uses 8,760 hours per year and a capacity factor (CF) of 60% for CCGT and 35% for SCGT (AESO, 2025). Variable operating and maintenance costs () are $3/MWh for CCGT and $9/MWh for SCGT (IESO, 2024). Fuel costs () are determined based AESO report mentioning gas unit marginal cost of 15.89 $/MWh for CCGT and 44.82 $/MWh for SCGT (AESO, 2025).
The net present cost (NPC) of the PV system considering the real discount rate of ir in the lifetime of n is calculated using Eq.25, in which, ICost is the initial investment at the start of the project in $, (i) is the maintenance and operation costs at year i in $, and (i) stands for the replacement costs of PV system components (PV modules and inverters) at year i in $.
LCOE of the PV system (LCOEPV) is the total life cycle cost of PV (NPC) divided by its total energy (MWh) during the lifetime (n), which is determined using Eq.26 (Lai and McCulloch, 2017).
3. Results
This study determines that there are $1.78 billion CAD available fossil fuels subsidies that can be transferred to fund the transition into a potential solar PV powered province. The primary recipients of these funds were Lethbridge and Sturgeon, chosen for their strategic importance. Lethbridge was prioritized due to its high solar energy potential (Urban, 2018), while Sturgeon received subsidies based on the existing Sturgeon Refinery program (Environmental Defence and Gass, 2019). The decision to maintain subsidy allocations to the same locations as the fossil fuel industry was made to minimize job losses in local communities by offering jobs to go from fossil fuels to the solar industry while minimizing additional education and training (Meyer et al., 2023). This shift is expected to generate significant employment opportunities in Lethbridge, however, which absorbed all subsidies not tied to specific locations.
Figure 2 presents the LCOE for solar PV systems across various Alberta locations under two scenarios. The average LCOE is 56.79 CAD/MWh when the 30% ITC is applied and 73.72 CAD/MWh without the ITC.
Using the methodology described in Section 2.6, the LCOE for natural gas generation technologies was calculated based on Alberta-specific capital costs, operational parameters, and fuel prices. CCGT exhibit an LCOE of 42.25 CAD/MWh, while SCGT have an LCOE of 88.10 CAD/MWh. According to the (AESO, 2025), combined cycle systems contributed 19% of total electricity generation and simple cycle systems contributed 5% in 2024. Applying these generation shares as weights yields a weighted average LCOE of 51.80 CAD/MWh for natural gas-fired generation.
Geographic analysis reveals competitive solar economics across Alberta's major centers when the ITC is applied. Lethbridge and Calgary, benefiting from high solar irradiance and large population centers, achieve the lowest LCOE values at 49.01 and 49.28 CAD/MWh respectively, both undercutting the natural gas weighted average of 51.80 CAD/MWh. Fort Saskatchewan and Strathcona, serving Edmonton-area industrial loads, demonstrate LCOE values only 6-8% above the natural gas average. Even northern locations like Fort McMurray and Cold Lake remain economically competitive, operating between the baseload CCGT cost (42.25 CAD/MWh) and the expensive simple cycle cost (88.10 CAD/MWh), directly displacing higher-cost peaking generation during daytime hours when solar production and electricity demand both peak.
Table 4 shows annual subsidized solar PV power generation by location if fossil fuel subsidies were switch to solar. Lethbridge, which was assumed to receive the largest proportion of redirected fossil fuel subsidies, would generate 1.560 TWh annually if ITC is incorporated, contributing to a total solar PV output of 2.016 TWh across all locations. if ITC is not considered, Lethbridge's production drops to 1.092 TWh, with total system-wide generation falling to 1.412 TWh. Converting all available fossil fuel subsidies to solar PV investment would enable the installation of 1.532 GW of new solar capacity annually with the ITC or 1.07 GW annually without the ITC.
If renewable investments benefit from a 30% tax credit that amplifies redirected fossil fuel subsidies, the energy transition exhibits accelerated deployment trajectories across all metrics. Figure 3a illustrates the absolute generation mix evolution, where total electricity generation increases from approximately 90 TWh to 170 TWh over the 25-year period, representing an 89% growth in overall electricity demand. The enhanced investment framework enables fossil fuel generation to decline substantially from 72 TWh to 20 TWh, while solar and other renewables experience robust absolute growth. This pattern demonstrates that the tax credit mechanism successfully facilitates both demand growth accommodation and fossil fuel displacement simultaneously. Figure 3b examines the transition through percentage composition of the generation mix, revealing critical inflection points in the energy transition timeline. The renewable crossover occurs around 2033, when total renewables surpass fossil fuels at the 50% threshold. Subsequently, renewable share climbs steadily to nearly 90% by 2050, while fossil fuel dependence contracts to approximately 10%. Notably, solar achieves generation parity with fossil fuels in 2040, when solar reaches 32% share as fossil fuel contribution diminishes to 30%. This timeline reflects the accelerated deployment enabled by the enhanced capital availability under the tax credit scenario. Figure 3c presents the renewable generation breakdown in absolute terms, showing total renewable output expanding from 17 TWh in 2024 to 154 TWh by 2050, an eight-fold increase facilitated by the amplified investment capital. Solar generation exhibits particularly dramatic expansion from near-zero to approximately 70 TWh, while other renewables demonstrate steady growth from 15 TWh to 84 TWh. The pronounced solar growth trajectory underscores the effectiveness of the enhanced investment mechanism in accelerating photovoltaic deployment at scale. The tax credit enhancement in thus demonstrates how policy mechanisms can substantially accelerate renewable energy deployment while maintaining economic viability throughout the transition period.
If renewable investments proceed without the 30% ITC), the energy transition follows a more gradual deployment trajectory, relying solely on redirected fossil fuel subsidies at their original value without tax credit amplification. Figure 4a illustrates the absolute generation mix evolution. Without ITC enhancement, fossil fuel generation declines more gradually from 72 TWh to 35 TWh, while renewable sources accommodate the majority of demand growth. The extended timeline to 2050 demonstrates that achieving deep decarbonization without tax credit enhancement requires a longer transition period but remains economically viable through sustained base-level investment. Figure 4b examines the percentage composition of the generation mix, revealing a delayed but steady renewable transition. The renewable crossover occurs around 2035, when total renewables surpass fossil fuels at the 50% threshold, identical timing to when tax credits for solar PV is considered despite the absence of tax credits. However, the transition pace differs notably in later years, with renewables reaching approximately 80% by 2050 compared to fossil fuels declining to 20%. Solar fossil fuel parity occurs in 2045 where solar reaches 29% of total share compared to 28% of fossil fuels. Solar energy demonstrates consistent but more moderate growth from 4% in 2024 to 32% by 2050, indicating that without ITC enhancement, solar deployment proceeds at a steadier but less aggressive pace compared to when ITC is incorporated. Figure 4c presents the renewable generation breakdown in absolute terms, showing total renewable output expanding from approximately 17 TWh in 2024 to 138 TWh by 2050, representing more than an eleven-fold increase achieved through base-level investment without tax credit amplification. Solar generation exhibits substantial expansion from near-zero to approximately 54 TWh by 2050, while other renewables grow from about 15 TWh to 84 TWh. The more prominent role of other renewables in this scenario suggests that without enhanced solar investment incentives, the renewable portfolio maintains greater diversification.
Table 5 presents the NPC and O&M costs for solar PV systems across the ten subsidy allocation locations in Alberta over the 25-year project lifetime. The NPC represents the total lifetime cost of the solar infrastructure, including initial capital investment and all future costs discounted to present value.
The economic analysis reveals a critical feature of the ITC mechanism: the ITC scenario results in higher total system costs because it enables larger installations. When the 30% ITC is applied, the total available capital increases, allowing for installation of 30% more solar capacity. simultaneously, the O&M costs scaling proportionally with system size where with ITC, O&M costs are higher in absolute terms because larger systems require more maintenance activities. Consequently, NPC values increase with-ITC scenario across all locations. For example, Lethbridge shows an NPC of $1.91 billion with ITC compared to $1.74 billion without, reflecting the construction of a larger solar array (1,147 MW versus 803 MW).
This apparent paradox (higher costs yielding lower LCOE) demonstrates the economics of scale in solar deployment. While the total project cost increases by 30% with the ITC (matching the capacity increase), the cost per unit of installed capacity actually decreases. The larger installations benefit from economies of scale in procurement, installation efficiency, and optimized project management. This translates to the LCOE reduction from 73.72 CAD/MWh (without ITC) to 56.79 CAD/MWh (with ITC) shown in Figure 2, despite the higher absolute expenditure.
Geographic variation in project scale remains substantial. Lethbridge dominates with 78% of total capital investment in both scenarios, driven by superior solar irradiance and strategic concentration of subsidy allocation. Sturgeon represents the second-largest installation at $497 million NPC (with ITC), reflecting historical subsidy patterns tied to refinery operations. Fort Saskatchewan and Strathcona, serving industrial load centers, also represent significant installations in the $40-48 million range.
The economic structure revealed demonstrates that the ITC functions as a capital multiplier rather than a cost reducer. By enabling 30% larger installations for the same level of government subsidy expenditure ($1.78 billion), the ITC generates 30% more renewable energy capacity and annual generation. This leverage effect is particularly valuable for policy: the government's initial cash subsidy commitment remains constant, but the ITC amplifies the impact by attracting additional private investment through the tax credit mechanism.
Solar PV receives a one-time capital subsidy, after which the systems generate electricity for 25+ years with only O&M costs and no fuel expenses. Even accounting for the higher NPC with ITC, the resulting generation costs remain competitive: average solar LCOE of 56.79 CAD/MWh is comparable with natural gas generation LCOE of 51.80 CAD/MWh.
Figure 5 illustrates the potential impact of redirecting fossil fuel subsidies into solar PV investments on Alberta's grid emissions, as modeled in Section 2.6. Alberta's baseline grid emission intensity in 2024 was 450 kg CO₂e/MWh. Under the proposed subsidy redirection policy, this intensity could be reduced to 68.8 kg CO₂e/MWh (with ITC) or 119.2 kg CO₂e/MWh (without ITC) by 2050, representing reductions of 84.7% and 73.5%, respectively. The capacity shift generates substantial avoided emissions: an average of 0.38 Mt CO₂e/year with ITC and 0.31 Mt CO₂e/year without ITC. Over the full 2024–2050 analysis period, cumulative avoided emissions reach 10.29 Mt CO₂e with ITC and 8.37 Mt CO₂e without ITC. The 1.92 Mt CO₂e difference between scenarios demonstrates the additional climate benefit of strengthening solar investment incentives through tax credits.
4. Discussion
4.1. Interpretation of Results
This case study proves that transitioning to solar PV through the lens of public funding for fossil fuels is economically viable and reduces LCOE. This in turn can reduce the economic barriers for energy-based organizations bottom line and Albertan resident utility costs. Additionally, Alberta has a strong solar potential, with the factor of providing Lethbridge with the majority of funds and solar PV infrastructure. The energy replacement timeline is compatible with Canada’s net-zero targets of 2050, while it assumes no advancements in solar PV technology, compound annual investing or further reductions in LCOE (Environment and Climate Change Canada, 2016).
4.2. Political and Institutional Barriers
Challenges that are faced with this initiative are the persistence of fossil fuels through political and institutional factors. First of all, Alberta has a large dependance on oil and gas for provincial revenue (Environmental Defence and Gass, 2019). The royalties from oil and gas represent a significant portion of the provincial income, supporting public services and infrastructure (Environmental Defence and Gass, 2019).
Economic dependency creates a strong movement to resist subsidy removals leading to public backlash and political resistance, particularly given the strong influence of the oil and gas sector in provincial politics. Such resistance could result in leadership changes or attempts to renegotiate energy policies to favor fossil fuel dependence, further delaying progress. Furthermore, industry lobbying can occur pushing the financial support to fossil fuels and delaying climate reforms.
Due to the federal and provincial political system and environment, policymakers prioritize short-term economic stability over long-term sustainability leading to supporting existing frameworks and transitions occur over long periods.
4.3. Stakeholder Impacts
4.3.1. Government Implications
The government's updated projections show substantially improved prospects for the energy transition. With solar PV projected to surpass fossil fuel production in 16 years (2040, with ITC) or 21 years (2045, without ITC), this timeline aligns with Canada's international commitments, including the Paris Agreement's goal of achieving net-zero emissions by 2050 (Environment and Climate Change Canada, 2016). This accelerated pathway strengthens Canada's credibility and positions the country as a serious climate leader, rather than exposing it to criticism for delayed action. By demonstrating meaningful progress toward decarbonization, Canada can showcase genuine leadership in the clean energy transition while maintaining its international standing on climate commitments.
While the expedited transition projects a progressive and sustainable image, the economic and social impacts on Canada, particularly Alberta, remain significant. Alberta, as the epicenter of the nation's oil and gas industry, will still face job losses and economic disruption as subsidies shift away from fossil fuel production (Onifade, 2022), though the accelerated timeline may allow for more structured workforce transition planning and retraining opportunities (Meyer et al., 2023). In this way Alberta could follow the example of the U.S., where as the coal industry became uncompetitive economically, coal workers could earn more money in the solar industry, which grew to employ far more workers (Louie and Pearce, 2016).
The concentration of solar PV development in Lethbridge as a regional hub could still create economic disparities. As employment opportunities shift toward Lethbridge, other regions reliant on fossil fuel production may experience economic stagnation and outmigration, increasing inequalities across the province. This risk remains: transitioning from dependence on fossil fuels in dispersed regions to reliance on solar energy in specific locations, rather than fostering a balanced and diversified energy economy across Alberta. Policymakers must therefore prioritize distributed solar development and strategic investment in multiple regions to mitigate regional inequalities and support equitable economic transitions across the province.
4.3.2. Fossil Fuel Industry Implications
The removal of subsidies from fossil fuel industry would have significant financial implications, primarily by increasing production costs and limiting expansion. Higher input costs would likely drive-up gas prices, reducing the competitiveness of Canadian oil and gas both internationally and domestically. Domestically, higher prices could accelerate a consumer shift toward renewable energy, further eroding demand for fossil fuels and compounding the industry's challenges.
The loss of subsidies would also lead to stranded assets, including unexploited reserves and decommissioned infrastructure, forcing companies to write off these investments as financial losses. Smaller or heavily indebted companies would face an increased risk of bankruptcy or might need to rely on mergers and acquisitions to survive.
Additionally, the fossil fuel industry would face growing pressure from both the government and the public to decarbonize, aligning operations with climate targets. This transition would require significant investment in carbon-reducing technologies, such as CCUS, which could further strain resources and profitability.
The absence of public funding would also exacerbate price volatility, making the energy market less predictable and impacting broader economic stability. This instability would raise questions about the long-term viability of the fossil fuel industry, particularly as reliance on oil and gas diminishes in favor of cleaner, more sustainable energy sources.
4.3.3. Solar PV Industry Implications
The solar PV industry stands to gain significant benefits from this scenario. The transition enables mass adoption, grid expansion, increased public funding, and enhanced public perception of solar energy as a viable and sustainable alternative. The industry's LCOE positions it advantageously, allowing solar PV providers to offer lower prices for Albertan residents while maintaining reasonable margins.
This rapid growth may introduce challenges, however, including the development of regional dependencies, where certain areas, like Lethbridge, dominate solar PV production. This could lead to increased competition among companies within these regions or create unfair advantages for companies already established in highly subsidized areas.
4.4. Comparing Real World Examples
After analyzing Impacts of Energy Subsidy Reforms on the Industrial Energy Structures in the Malaysian Economy: A Computable General Equilibrium Approach (Yusoff and Bekhet, 2016), several similarities emerge regarding the effects of removing fossil fuel subsidies. In Malaysia, the removal of these subsidies led to a reduction in fuel consumption, which in turn decreased fuel production over time. The subsidy removal in Malaysia promoted the substitution of electricity and gas for crude oil and petroleum products, encouraging a transition to renewable energy for electricity generation. Similarly, the redirection of subsidies in this case promotes greater adoption of solar energy.
An example of Germany’s focus on transitioning from nuclear and fossil fuels to renewables through long-term, decentralized reforms highlights several dissimilarities. Analyzing The German Energiewende – What’s happening? Introducing the special issue (Quitzow et al., 2016) reveals that, following the shift to renewable energy, electricity costs rose significantly for households and small businesses. Additionally, delays in expanding transmission grids created bottlenecks that hindered economic recovery. Furthermore, an increase in coal use within the energy mix, driven by low carbon pricing and market mechanisms, led to fluctuations in CO2 emissions.
4.5. Policy Implementations
There are various policy changes that can help accelerate the transition of solar PV to match the production of fossil fuels. Increasing the funding for subsidies can directly increase the PV power generation and reduce utility costs for residents and increase bottom line for organizations. Governments can also address high upfront installation costs by offering low-interest or no-interest loans, allowing to spread expenses over time to promote rapid expansion. Bulk-purchase rebates can be implement to incentivize rapid expansion in urban and rural communities.
Governmental bodies can implement household or private investments in solar energy without needing to install systems on their property or own the infrastructure, incentivizing adoption in less-exposed regions. Streamlining permitting and regulatory processes for deployment can reduce delays and capital costs, ultimately allowing more approved projects. Introducing tax incentives can access the private sector, while the promotion of green bonds can encourage both private and institutional investments in solar PV development.
4.6. Energy Equity
One of the most concerning issues with energy in Canada is energy poverty within rural and Indigenous communities (Riva et al., 2024). In response to significant job losses in the fossil fuel industry, vocational retraining programs, relocation grants, and wage replacement grants should be considered to support affected workers.
Lethbridge currently receives a disproportionate share of investment, employment, and regional revenue. This concentration poses a risk of regional boom in Lethbridge, potentially leading to economic disparity and inequity across other Albertan regions.
To mitigate these risks, future capital expenditures should be directed toward high-employment or low-income areas, with increased public funding for community-owned enterprises.
4.7. Climate Resilience
Alongside the environmental benefits of transitioning from fossil fuels to solar PV, there are also advantages in terms of resilience to increasing extreme climate events. Specifically, the proposed distribution solar system is more reliable than fossil fuel-based grid in maintain essential services during wildfires, which are frequent in Alberta (Galvan et al., 2020). This enhances local energy security during climate-related outages and natural disasters.
4.8. Limitations of Study
There are several limitations to determining the allocation to capital investment and operating costs for solar PV infrastructure and management. This includes a lack of transparency in government reporting, potentially incomplete data from third-party organizations, and the exclusion of unquantifiable subsidies, all of which contribute to an incomplete dataset. This lead to a smaller subsidy value and generalized locations such as Lethbridge, from vague reporting in usage, federal distribution, and regional application. Post-pandemic financial reporting, public funding strategies, and policy frameworks potentially have differed from pre-pandemic patterns, introducing additional uncertainty.
Furthermore, only subsidies with confirmed Alberta-specific allocations were considered, excluding various federal subsidies tied to Alberta, but lacked specification. This narrows the data set and underestimates the potential value for subsidies allocated to solar PV.
Redirecting all subsidies to capital expenditures for solar PV may overlook potential political constraints and environmental considerations affecting the accuracy of the data set. Some subsidies are subject to policy or industry constraints that limit their transferability. Additionally, certain subsidies are allocated to environmental remediation efforts (e.g. oil sands tailings management), transitional technologies (e.g. carbon capture and methane reduction), or green technologies (e.g. hydrogen production and concentrated solar power) aimed at mitigating the harm caused by fossil fuels. While the primary goal of this paper is to redirect public funding to solar energy, the most cost-effective renewable energy source, it is important to recognize that environmental remediation costs could potentially be integrated into the operational expenses of solar companies to ensure a balanced and pragmatic approach. Lastly, using a three-year average does not represent long-term trends and patterns that can be beneficial to represent broader patterns.
The Albera Solar Parity and emission model developed in this paper has several key limitations that simplify the complex reality of energy transition. First, it assumes a constant annual fossil-to-solar capacity shift regardless of technological, economic, or political changes, which may not reflect real-world variability in investment, policy support, or market conditions. Second, the model maintains fixed proportional shares of renewables throughout the transition period, ignoring the fact that different renewable technologies (wind, hydro, solar) have distinct growth trajectories, resource constraints, and deployment rates that could shift these ratios significantly over time. Third, it assumes all electricity demand growth (2.6% annually) comes exclusively from renewables while fossil fuel generation only decreases through capacity shifting, which simplifies the dynamics of baseload power requirements, grid stability concerns, and the intermittency challenges of renewable energy that may necessitate continued fossil fuel or energy storage infrastructure. Finally, it assumes linear subsidy redirection without considering diminishing returns, economies of scale, technological learning curves, or the potential for policy changes that could accelerate or decelerate the transition, making the predicted timeline highly sensitive to these unmodeled factors.
5. Conclusions
Redirecting Alberta’s fossil fuel subsides towards solar PV capital investment was shown to be technically and economically viable. Approximately $1.78 billion CAD in annual fossil fuel subsidies could be transferred into solar PV deployment, enabling the installation of 1.53 GW of new solar PV capacity annually with the ITC or 1.07 GW without it. These new solar PV systems can generate 2.02 TWh of clean electricity annually, if ITC is applied on capital investments and 1.41 TWh without it. Solar PV can achieve a competitive LCOE ranging from 49.01 to 61.97 CAD/MWh with ITC (63.62 to 80.45 CAD/MWh w/o ITC) across Alberta.
Solar PV is cost-competitive with natural gas generation. With ITC, solar LCOE averages 56.79 CAD/MWh, while natural gas generation exhibits a weighted average LCOE of 51.80 CAD/MWh. Notably, high-solar-resource locations including Lethbridge (49.01 CAD/MWh) and Calgary (49.28 CAD/MWh) achieve lower LCOEs than the natural gas average when the ITC is applied, while other major industrial centers remain within 6 to 8% of gas-fired generation costs. This near parity is achieved without accounting for carbon externalities, fuel price volatility, or the long-term operational subsidies required to maintain fossil fuel competitiveness, suggesting that solar PV represents an economically rational alternative even under current market conditions.
Furthermore, the idea of shifting Alberta’s fossil fuel subsidies is an extremely beneficial solution for Canada's 2050 net-zero commitments under the Paris Agreement, positioning the Alberta as a leader in decarbonization. Solar-fossil fuel generation parity would be achieved by 2040 with tax credits or 2045 without them. The subsidy redirection can reduce Alberta's grid emission intensity from the current 450 kg CO₂e/MWh to 68.8 kg CO₂e/MWh (with ITC) or 119.2 kg CO₂e/MWh (without ITC) by 2050, representing reductions of 84.7% and 73.5%, respectively. This transition would bring substantial avoided emissions: an average of 0.38 Mt CO₂e per year with ITC (0.31 Mt CO₂e per year without ITC) where over the full analysis period (up to 2050), cumulative avoided emissions can reach 10.29 Mt CO₂e with ITC (8.37 Mt CO₂e without ITC).
Data Statement
All data available upon request.
Acknowledgments
This work was supported by the Natural Sciences and Engineering Research Council of Canada and the Thompson Endowment.
| 1 | If the optimum tilt angle was not found on solarific.co, the nearest city tilt angle was chosen. |
| 2 | CAD to USD ratio of 0.7 is considered at time of analysis (January 2025). |
| 3 | This rate is for the future of project over its lifetime (next 25 years) as future costs are converted to the present. |
| 4 | Real discount rate (Ali Sadat et al., 2023; Lilienthal, 2005; “Real Discount Rate,” 2023) is used for calculating the net present costs. In real discount rate, inflation is excluded from the economic analysis, meaning all costs are expressed as real costs in constant dollars. Inflation rate is considered uniform across all costs. The inflation rate is the expected inflation rate for the future of project. |
References
- AESO, 2025. AESO 2024 Annual Market Statistics.
- Ali Sadat, S.; Takahashi, J.; Pearce, J.M. A Free and open-source microgrid optimization tool: SAMA the solar alone Multi-Objective Advisor. Energy Conversion and Management 2023, 298, 117686. [Google Scholar] [CrossRef]
- Allan, R.P., Arias, P.A., Berger, S., Canadell, J.G., Cassou, C., Chen, D., Cherchi, A., Connors, S.L., Coppola, E., Cruz, F.A., 2023. Intergovernmental panel on climate change (IPCC). Summary for policymakers, in: Climate Change 2021: The Physical Science Basis. Contribution of Working Group I to the Sixth Assessment Report of the Intergovernmental Panel on Climate Change. Cambridge University Press, pp. 3–32.
- Arcus Power Corps, 2024. Alberta Shines: Dissecting the Record Low Emission Intensity in Electricity Grids [WWW Document]. Decentralised Energy Canada. URL https://www.deassociation.ca/newsfeed/alberta-shines-dissecting-the-record-low-emission-intensity-in-electricity-grids (accessed 10.15.25).
- Bank of Canada, 2025. Bank of Canada reduces policy rate by 50 basis points to 3¼% [WWW Document]. URL https://www.bankofcanada.ca/2024/12/fad-press-release-2024-12-11/ (accessed 1.11.25).
- Bank of Canada, 2023. Monetary Policy Report.
- Bressler, R.D. The mortality cost of carbon. Nat Commun 2021, 12, 4467. [Google Scholar] [CrossRef]
- Bricker, D., 2024. Canada Viewed as Most Positive Leader on World Stage Ipsos [WWW Document]. Ipsos. URL https://www.ipsos.com/en-ca/halifax-report-2024-influence (accessed 8.29.25).
- Caiazzo, F.; Ashok, A.; Waitz, I.A.; Yim, S.H.L.; Barrett, S.R.H. Air pollution and early deaths in the United States. Part I: Quantifying the impact of major sectors in 2005. Atmospheric Environment 2013, 79, 198–208. [Google Scholar] [CrossRef]
- Canada Energy Regulator, 2024. Provincial and Territorial Energy Profiles – Alberta [WWW Document]. URL https://www.cer-rec.gc.ca/en/data-analysis/energy-markets/provincial-territorial-energy-profiles/provincial-territorial-energy-profiles-alberta.html (accessed 8.21.25).
- Canadian Centre for Energy Information, 2025. Energy Fact Book, 2024-2025 [WWW Document]. URL https://energy-information.canada.ca/en/energy-facts (accessed 8.21.25).
- Cazenave, A.; Cozannet, G.L. Sea level rise and its coastal impacts. Earth’s Future 2014, 2, 15–34. [Google Scholar] [CrossRef]
- Corkal, V., 2021. Federal fossil fuel subsidies in Canada: COVID.
- Corkal, V., Levin, J., Gass, P., 2020. Canada’s federal fossil fuel subsidies in 2020. International Institute for Sustainable Development Winnipeg, MB, Canada.
- Current Results, 2025. Annual Sunshine in Alberta [WWW Document]. URL https://www.currentresults.com/Weather/Canada/Alberta/sunshine-annual-average.php (accessed 8.21.25).
- Environment and Climate Change Canada, 2016. The Paris Agreement. Government of Canada.
- Environmental Defence, Gass, P., 2019. Doubling Down With Taxpayer Dollars. URL https://environmentaldefence.ca/report/doubling-down-with-taxpayer-dollars/ (accessed 8.21.25).
- Falkenberg, L.J.; Bellerby, R.G.J.; Connell, S.D.; Fleming, L.E.; Maycock, B.; Russell, B.D.; Sullivan, F.J.; Dupont, S. Ocean Acidification and Human Health. IJERPH 2020, 17, 4563. [Google Scholar] [CrossRef]
- Galvan, E.; Mandal, P.; Sang, Y. Networked microgrids with roof-top solar PV and battery energy storage to improve distribution grids resilience to natural disasters. International Journal of Electrical Power & Energy Systems 2020, 123, 106239. [Google Scholar] [CrossRef]
- Government of Canada, 2021. Canada’s Achievements at COP26 [WWW Document]. URL https://www.canada.ca/en/services/environment/weather/climatechange/canada-international-action/un-climate-change-conference/cop26-summit/achievements-at-cop26.html (accessed 8.21.25).
- IEA, 2023. Renewables– Analysis [WWW Document]. URL https://www.iea.org/reports/renewables-2024 (accessed 8.21.25).
- IESO, 2024. Annual Planning Outlook : Resource Costs and Trends.
- IRENA. RENEWABLE POWER GENERATION COSTS IN 2023. 2024. [Google Scholar]
- Izam, N.S.M.N.; Itam, Z.; Sing, W.L.; Syamsir, A. Sustainable Development Perspectives of Solar Energy Technologies with Focus on Solar Photovoltaic—A Review. Energies 2022, 15, 2790. [Google Scholar] [CrossRef]
- Jamil, U.; Pearce, J.M. Energy Policy for Agrivoltaics in Alberta Canada. Energies 2023, 16, 53. [Google Scholar] [CrossRef]
- Kelly, J. How Fossil Fuels Drive Inflation and Make Life Less Affordable for Canadians; International Institute for Sustainable Development (IISD), 17 July 2024. [Google Scholar]
- Kotcher, J.; Maibach, E.; Choi, W.-T. Fossil fuels are harming our brains: identifying key messages about the health effects of air pollution from fossil fuels. BMC Public Health 2019, 19, 1079. [Google Scholar] [CrossRef]
- Kweku, D.; Bismark, O.; Maxwell, A.; Desmond, K.; Danso, K.; Oti-Mensah, E.; Quachie, A.; Adormaa, B. Greenhouse Effect: Greenhouse Gases and Their Impact on Global Warming. JSRR 2018, 17, 1–9. [Google Scholar] [CrossRef]
- Lai, C.S.; McCulloch, M.D. Levelized cost of electricity for solar photovoltaic and electrical energy storage. Applied energy 2017, 190, 191–203. [Google Scholar] [CrossRef]
- Levin, J., 2024. Canada’s Fossil Fuel Funding in 2023 (Media Backgrounder). Environmental Defence.
- Lilienthal, P. HOMER® micropower optimization model; National Renewable Energy Lab. (NREL): Golden, CO (United States), 2005. [Google Scholar]
- Louie, E.P.; Pearce, J.M. Retraining investment for U.S. transition from coal to solar photovoltaic employment. Energy Economics 2016, 57, 295–302. [Google Scholar] [CrossRef]
- Matsuo, T.; Schmidt, T.S. Hybridizing low-carbon technology deployment policy and fossil fuel subsidy reform: a climate finance perspective. Environ. Res. Lett. 2017, 12, 014002. [Google Scholar] [CrossRef]
- McGeehin, M.A.; Mirabelli, M. The potential impacts of climate variability and change on temperature-related morbidity and mortality in the United States. Environmental Health Perspectives 2001, 109, 185–189. [Google Scholar] [CrossRef]
- McKenzie, J., Beedell, E., Corkal, V., 2022. Blocking Ambition: Fossil Fuel Subsidies in Alberta, British Columbia, Saskatchewan, and Newfoundland and Labrador. International Institute for Sustainable Development.
- Mead, W.J. The performance of government in energy regulations. The American Economic Review 1979, 69, 352–356. [Google Scholar]
- Meyer, T.K.; Hunsberger, C.; Pearce, J.M. Retraining investment for Alberta’s oil and gas workers for green jobs in the solar industry. Carb Neutrality 2023, 2, 28. [Google Scholar] [CrossRef]
- Montgomery, H. Final call: Climate change and us. Journal of the Royal College of Physicians of Edinburgh 2024, 54, 101–104. [Google Scholar] [CrossRef]
- Natural Resources Canada, 2022. Guidelines for Canada’s International Support for the Clean Energy Transition [WWW Document]. URL https://natural-resources.canada.ca/climate-change/guidelines-canada-s-international-support-clean-energy-transition (accessed 8.21.25).
- NREL, 2025. Simple Levelized Cost of Energy (LCOE) Calculator Documentation Energy Systems Analysis [WWW Document]. URL https://www.nrel.gov/analysis/tech-lcoe-documentation (accessed 10.11.25).
- NREL, 2024. System Advisor Model (SAM) [WWW Document]. URL https://github.com/NREL/SAM.
- NSRDB, 2025. National Solar Radiation Database [WWW Document]. URL https://nsrdb.nrel.gov/ (accessed 8.25.25).
- Onifade, T.T., 2022. Fossil Fuel Subsidies in Canada: Governance Implications in the Net-Zero Transition. Canada Climateb Law Initiative.
- Pearce, J.M.; Parncutt, R. Quantifying Global Greenhouse Gas Emissions in Human Deaths to Guide Energy Policy. Energies 2023, 16, 6074. [Google Scholar] [CrossRef]
- Porket, J.L. THE PROS AND CONS OF GOVERNMENT REGULATION. Economic Affairs 2003, 23, 48–54. [Google Scholar] [CrossRef]
- Quitzow, L.; Canzler, W.; Grundmann, P.; Leibenath, M.; Moss, T.; Rave, T. The German Energiewende – What’s happening? Introducing the special issue. Utilities Policy 2016, 41, 163–171. [Google Scholar] [CrossRef]
- Raihan, A. A review of the global climate change impacts, adaptation strategies, and mitigation options in the socio-economic and environmental sectors. JESCAE 2023, 2, 36–58. [Google Scholar] [CrossRef]
- Ram, M.; Child, M.; Aghahosseini, A.; Bogdanov, D.; Lohrmann, A.; Breyer, C. A comparative analysis of electricity generation costs from renewable, fossil fuel and nuclear sources in G20 countries for the period 2015-2030. Journal of Cleaner Production 2018, 199, 687–704. [Google Scholar] [CrossRef]
- Ramasamy, V., Zuboy, J., Woodhouse, M., O’Shaughnessy, E., Feldman, D., Desai, J., Walker, A., Margolis, R., Basore, P., 2023. US Solar Photovoltaic System and Energy Storage Cost Benchmarks, With Minimum Sustainable Price Analysis: Q1 2023. National Renewable Energy Laboratory (NREL), Golden, CO (United States).
- Rana, S.; Pearce, JoshuaM. Potential paths to Canada’s climate commitments through strategic solar photovoltaic deployment. e-Prime - Advances in Electrical Engineering, Electronics and Energy 2025, 12, 101001. [Google Scholar] [CrossRef]
- Real Discount Rate [WWW Document], 2023. URL https://homerenergy.com/products/pro/docs/3.15/real_discount_rate.html (accessed 7.24.24).
- Riva, M.; Grubbs, E.; Breau, S. The geography of energy poverty in Canada: Spatial clustering and inequalities at the municipal level. Energy Policy 2024, 195, 114298. [Google Scholar] [CrossRef]
- Sadat, S.A.; Pearce, J.M. The threat of economic grid defection in the US with solar photovoltaic, battery and generator hybrid systems. Solar Energy 2024, 282, 112910. [Google Scholar] [CrossRef]
- Sampedro, J.; Arto, I.; González-Eguino, M. Implications of Switching Fossil Fuel Subsidies to Solar: A Case Study for the European Union. Sustainability 2017, 10, 50. [Google Scholar] [CrossRef]
- Schoeck, M., 2023. Canada formalizes 30% federal ITC credit, other incentives. pv magazine International. URL https://www.pv-magazine.com/2023/03/31/canada-formalizes-30-federal-itc-credit-other-incentives/ (accessed 7.28.25).
- Silva, L.F.O.; Santosh, M.; Schindler, M.; Gasparotto, J.; Dotto, G.L.; Oliveira, M.L.S.; Hochella, M.F., Jr. Nanoparticles in fossil and mineral fuel sectors and their impact on environment and human health: A review and perspective. Gondwana Research 2021, 92, 184–201. [Google Scholar] [CrossRef]
- Solarific, 2025a. Solar Panel Angles for Calgary, Alberta, CA [WWW Document]. URL https://solarific.co (accessed 1.11.25).
- Solarific, 2025b. Solar Panel Angles for Wood Buffalo, Alberta, CA [WWW Document]. URL https://solarific.co (accessed 1.11.25).
- Solarific, 2025c. Solar Panel Angles for Cold Lake, Alberta, CA [WWW Document]. URL https://solarific.co (accessed 1.11.25).
- Solarific, 2025d. Solar Panel Angles for Edmonton, Alberta, CA [WWW Document]. URL https://solarific.co (accessed 1.11.25).
- Solarific, 2025e. Solar Panel Angles for Fort Saskatchewan, Alberta, CA [WWW Document]. URL https://solarific.co (accessed 1.11.25).
- Solarific, 2025f. Solar Panel Angles for Bonnyville, Alberta, CA [WWW Document]. URL https://solarific.co (accessed 1.11.25).
- Solarific, 2025g. Solar Panel Angles for Lethbridge, Alberta, CA [WWW Document]. URL https://solarific.co (accessed 1.11.25).
- Solarific, 2025h. Solar Panel Angles for Red Deer, Alberta, CA [WWW Document]. URL https://solarific.co (accessed 1.11.25).
- Solbak, V., 2016. Solar Energy for Public Buildings in Alberta.
- Stages, L.C. Life cycle greenhouse gas emissions from solar photovoltaics. J. Ind. Ecol 2012, 16, S122. [Google Scholar]
- Urban, R., 2018. Solar Energy Maps Canada (Every Province). Energy Hub.
- US EPA, O., 2017. Inventory of U.S. Greenhouse Gas Emissions and Sinks [WWW Document]. URL https://www.epa.gov/ghgemissions/inventory-us-greenhouse-gas-emissions-and-sinks (accessed 8.21.25).
- Vohra, K.; Vodonos, A.; Schwartz, J.; Marais, E.A.; Sulprizio, M.P.; Mickley, L.J. Global mortality from outdoor fine particle pollution generated by fossil fuel combustion: Results from GEOS-Chem. Environmental Research 2021, 195, 110754. [Google Scholar] [CrossRef]
- Yusoff, N.Y.B.M.; Bekhet, H.A. Impacts of Energy Subsidy Reforms on the Industrial Energy Structures in the Malaysian Economy: A Computable General Equilibrium Approach. International Journal of Energy Economics and Policy 2016, 6, 88–97. [Google Scholar]
Figure 1.
Flow Diagram of Selecting Appropriate Subsidies to Transfer to Solar PV.
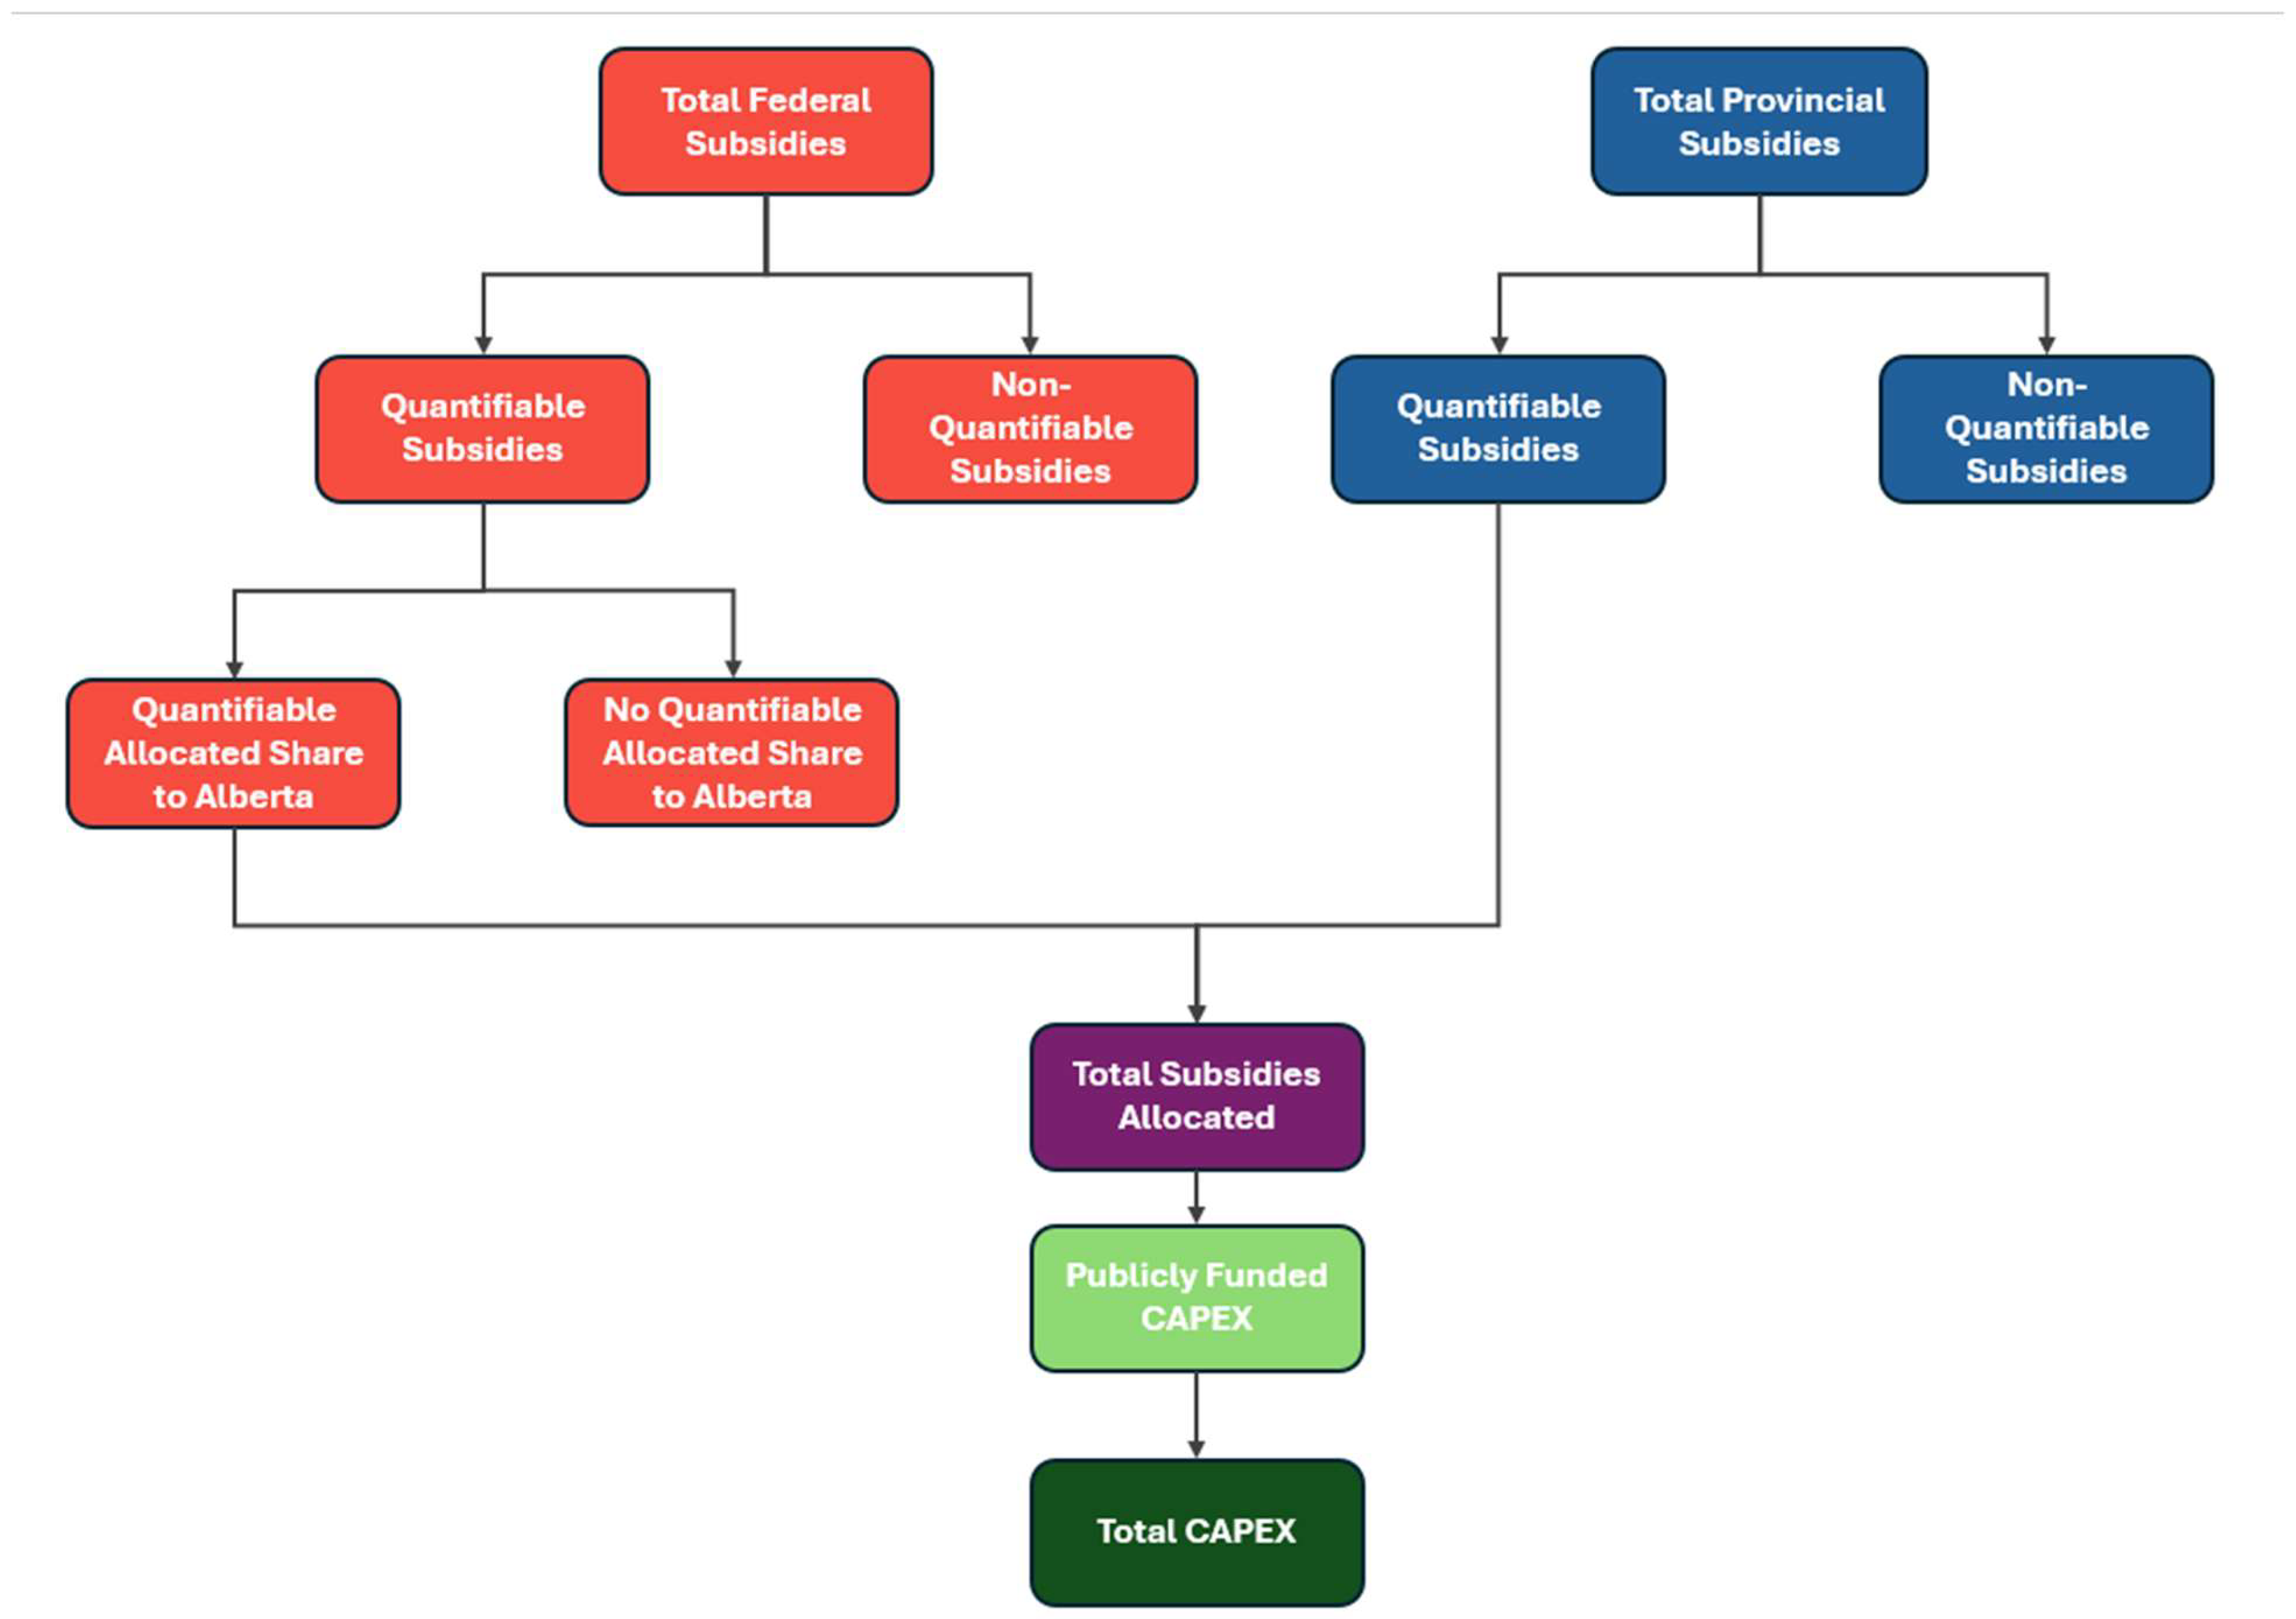
Figure 1.
Solar PV LCOE in various Alberta locations.
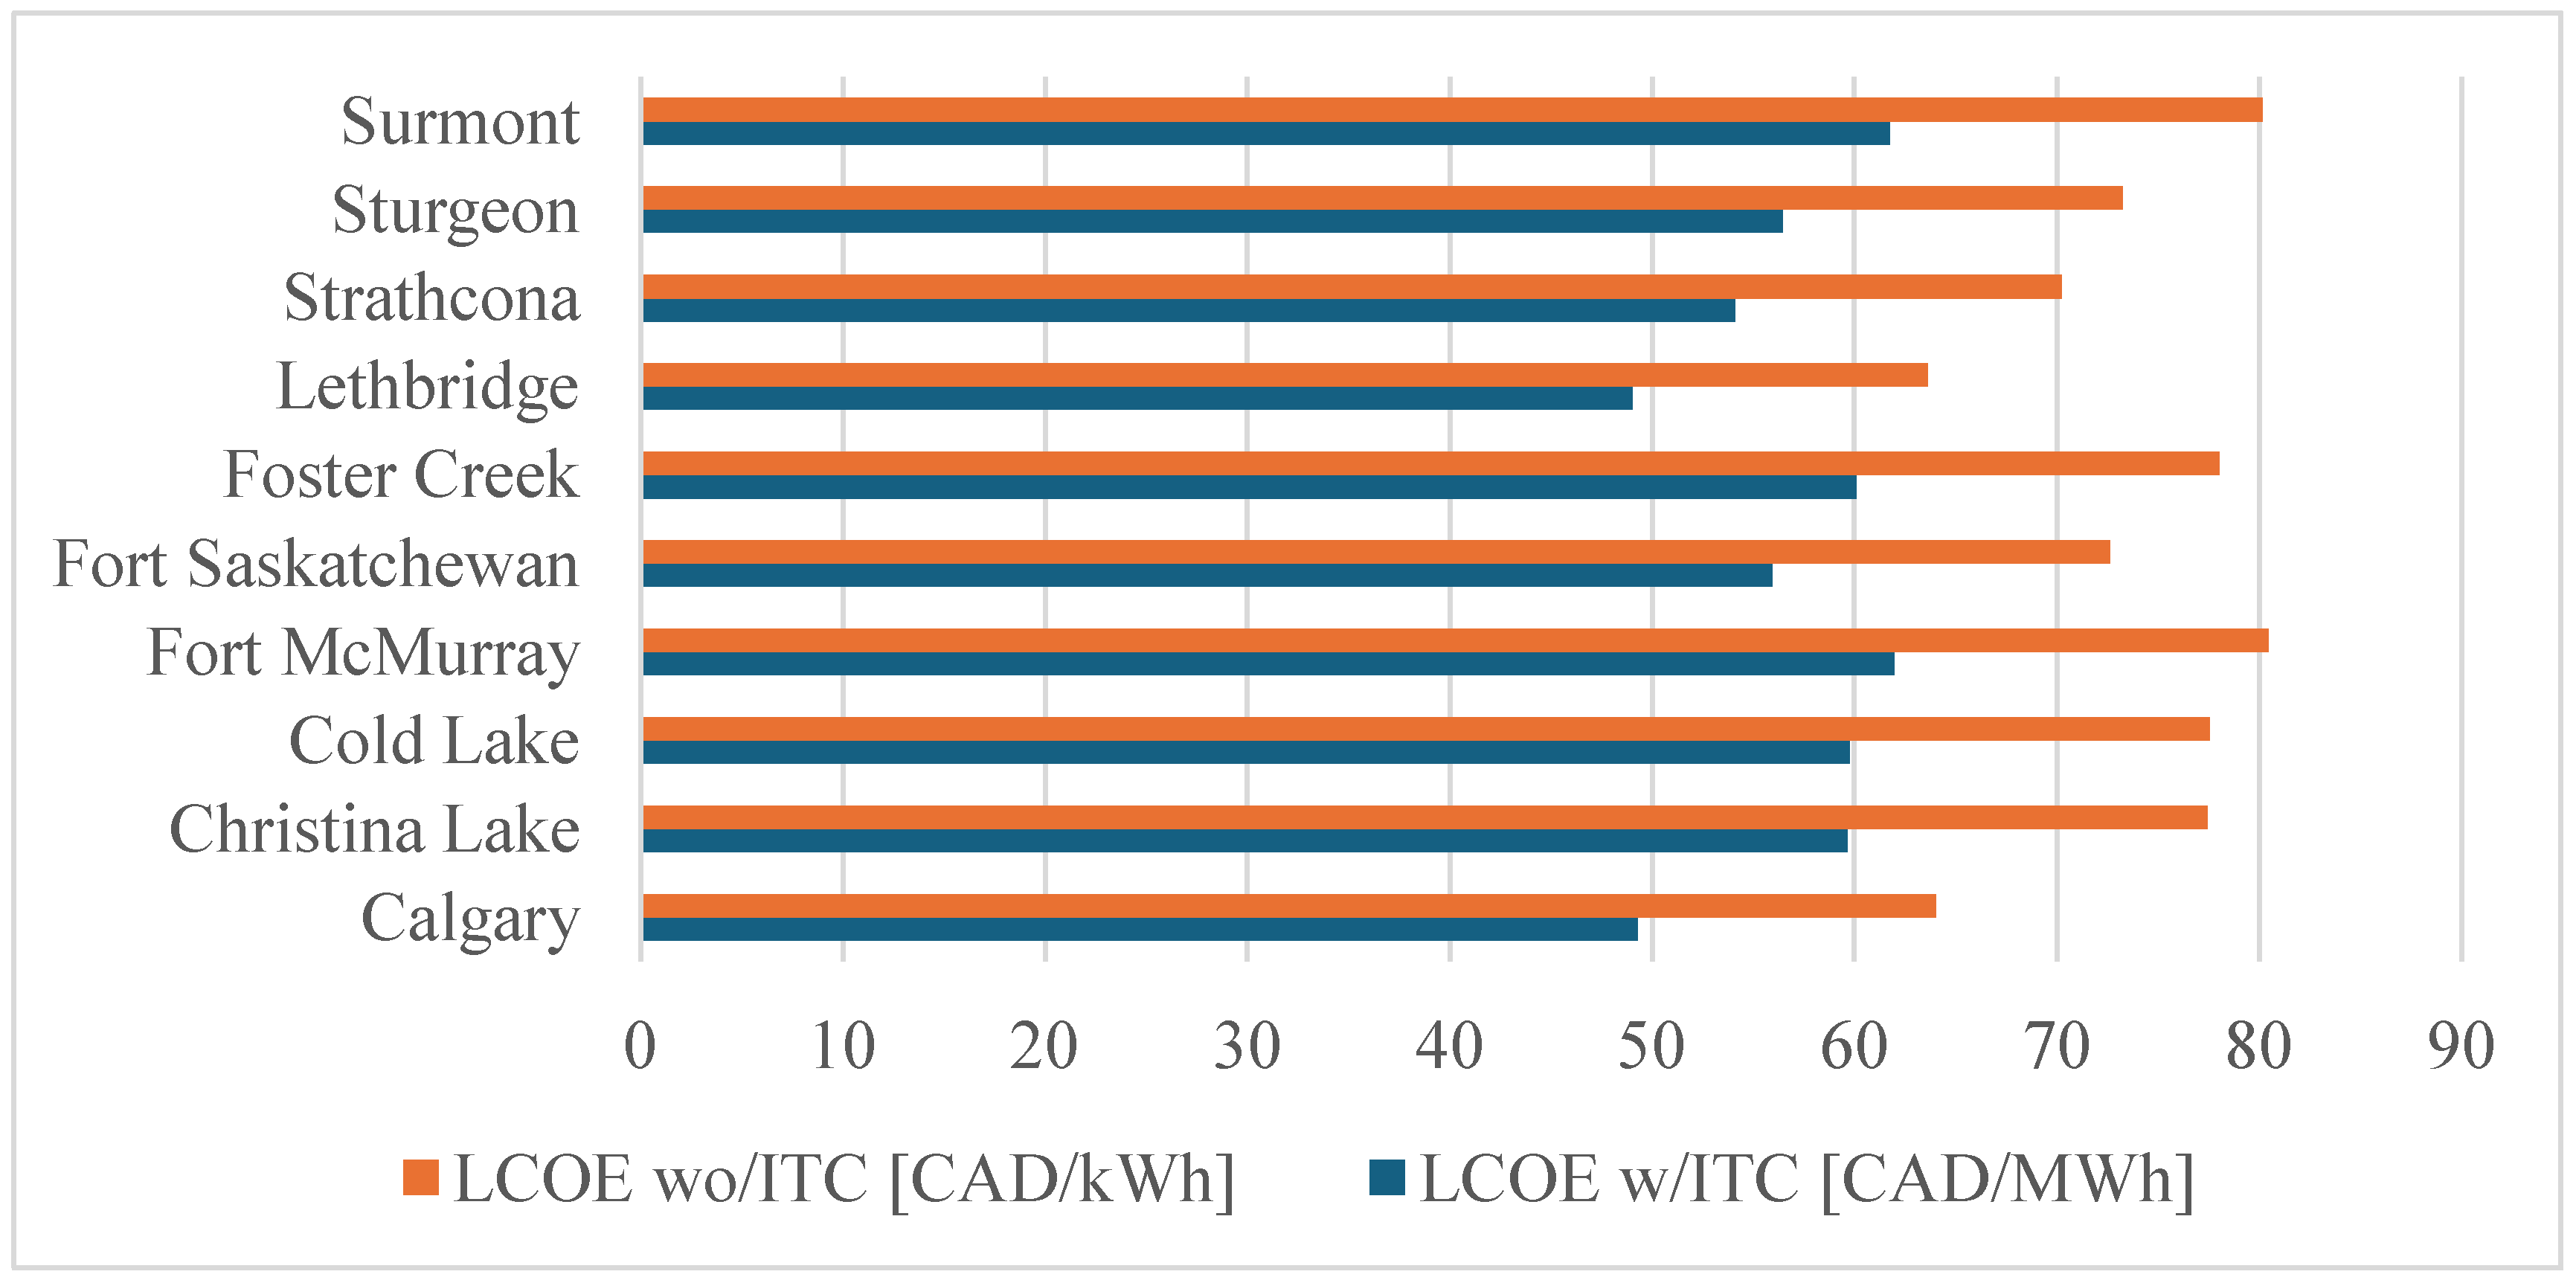
Figure 2.
Energy Transition in Alberta-ITC considered.
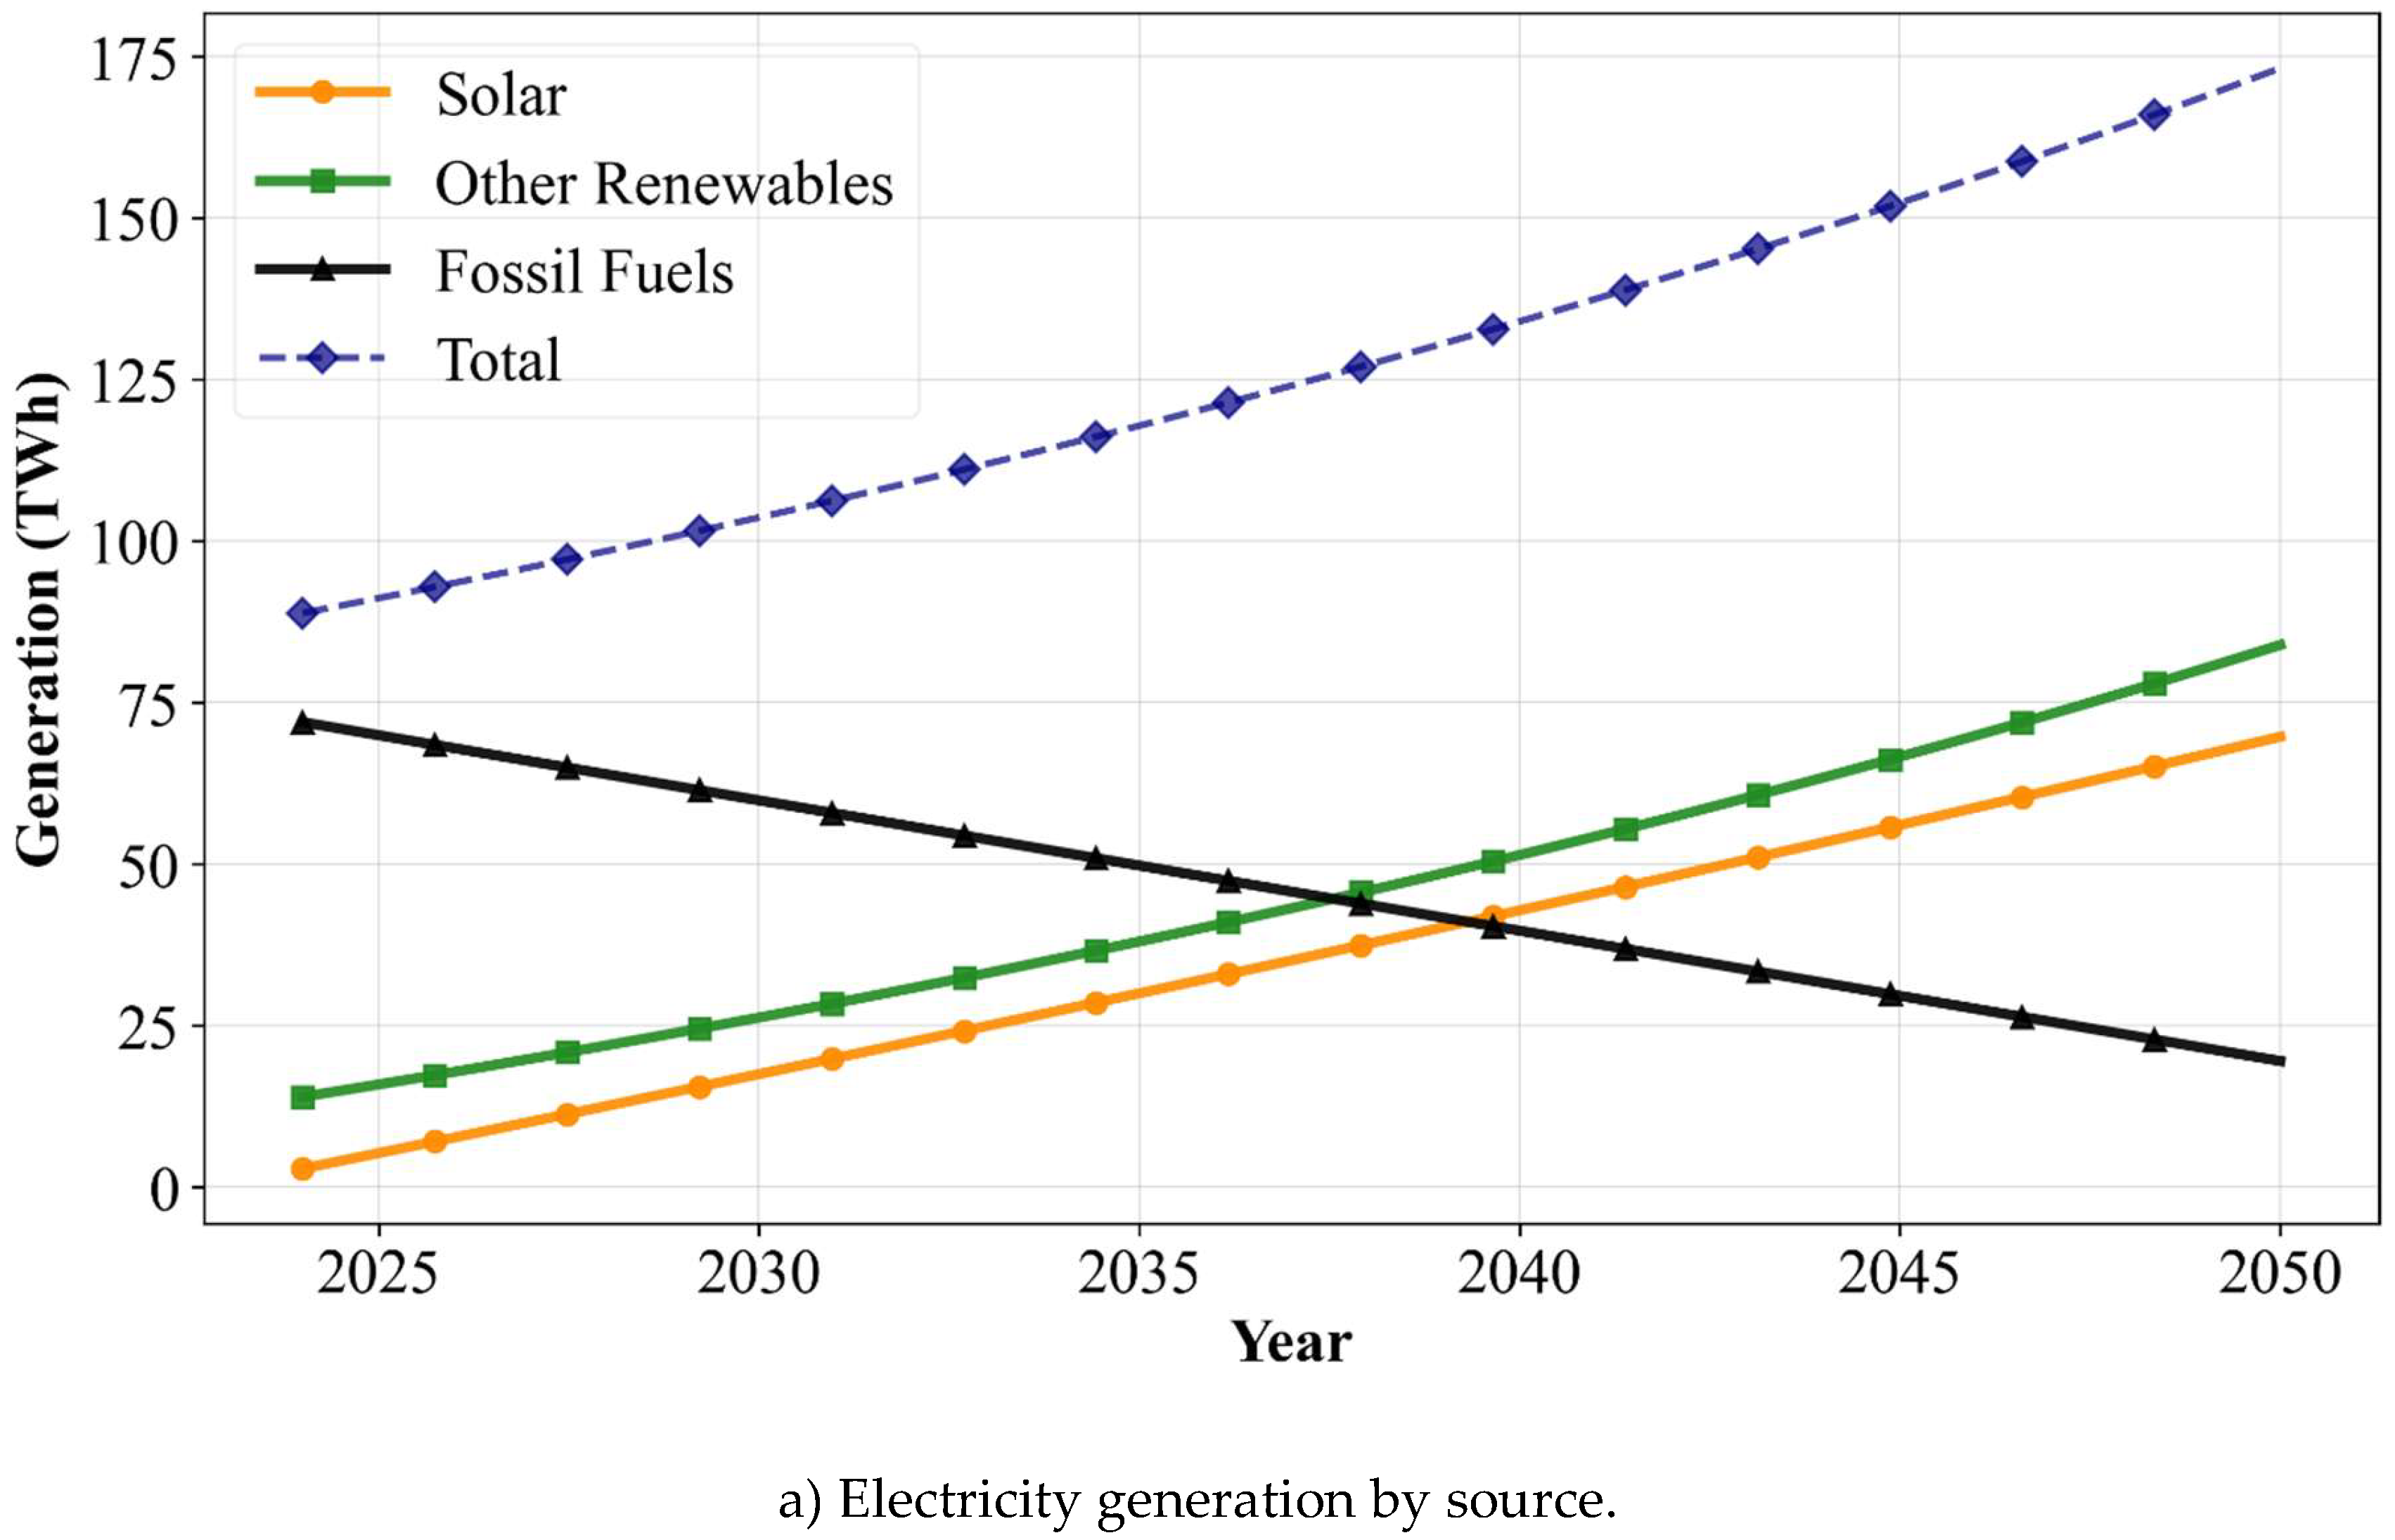
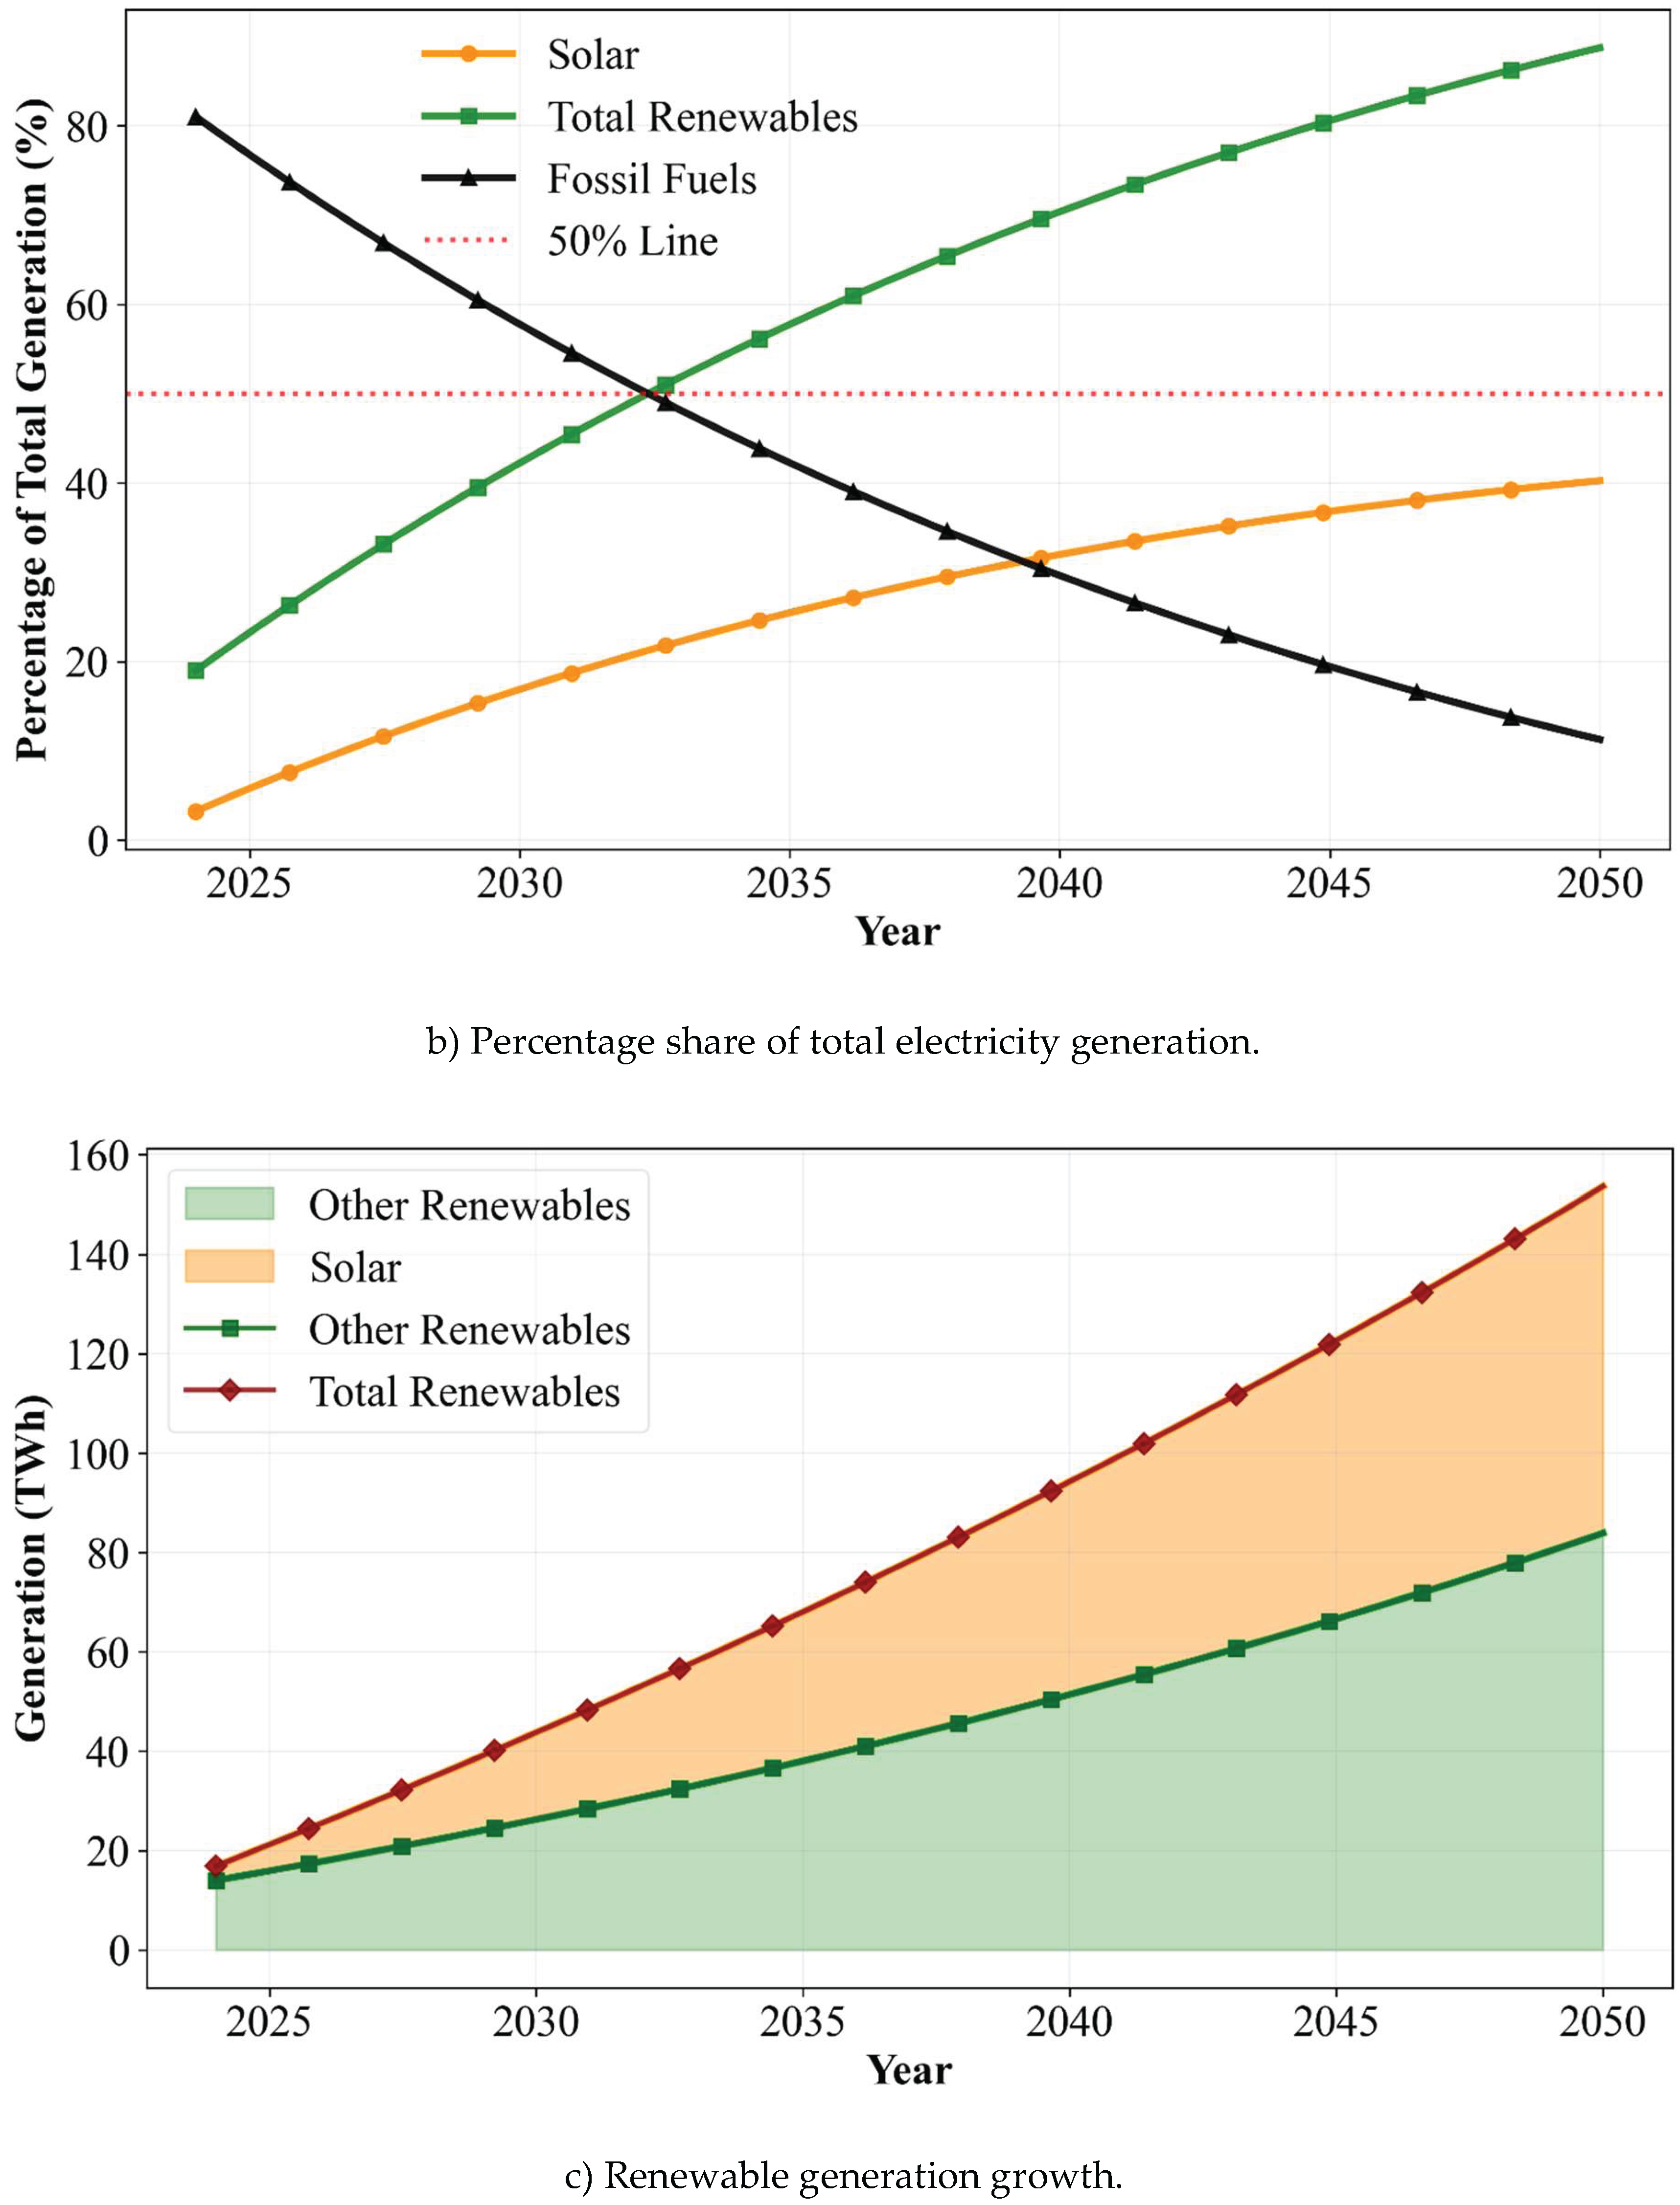
Figure 3.
Energy Transition in Alberta-ITC not considered.
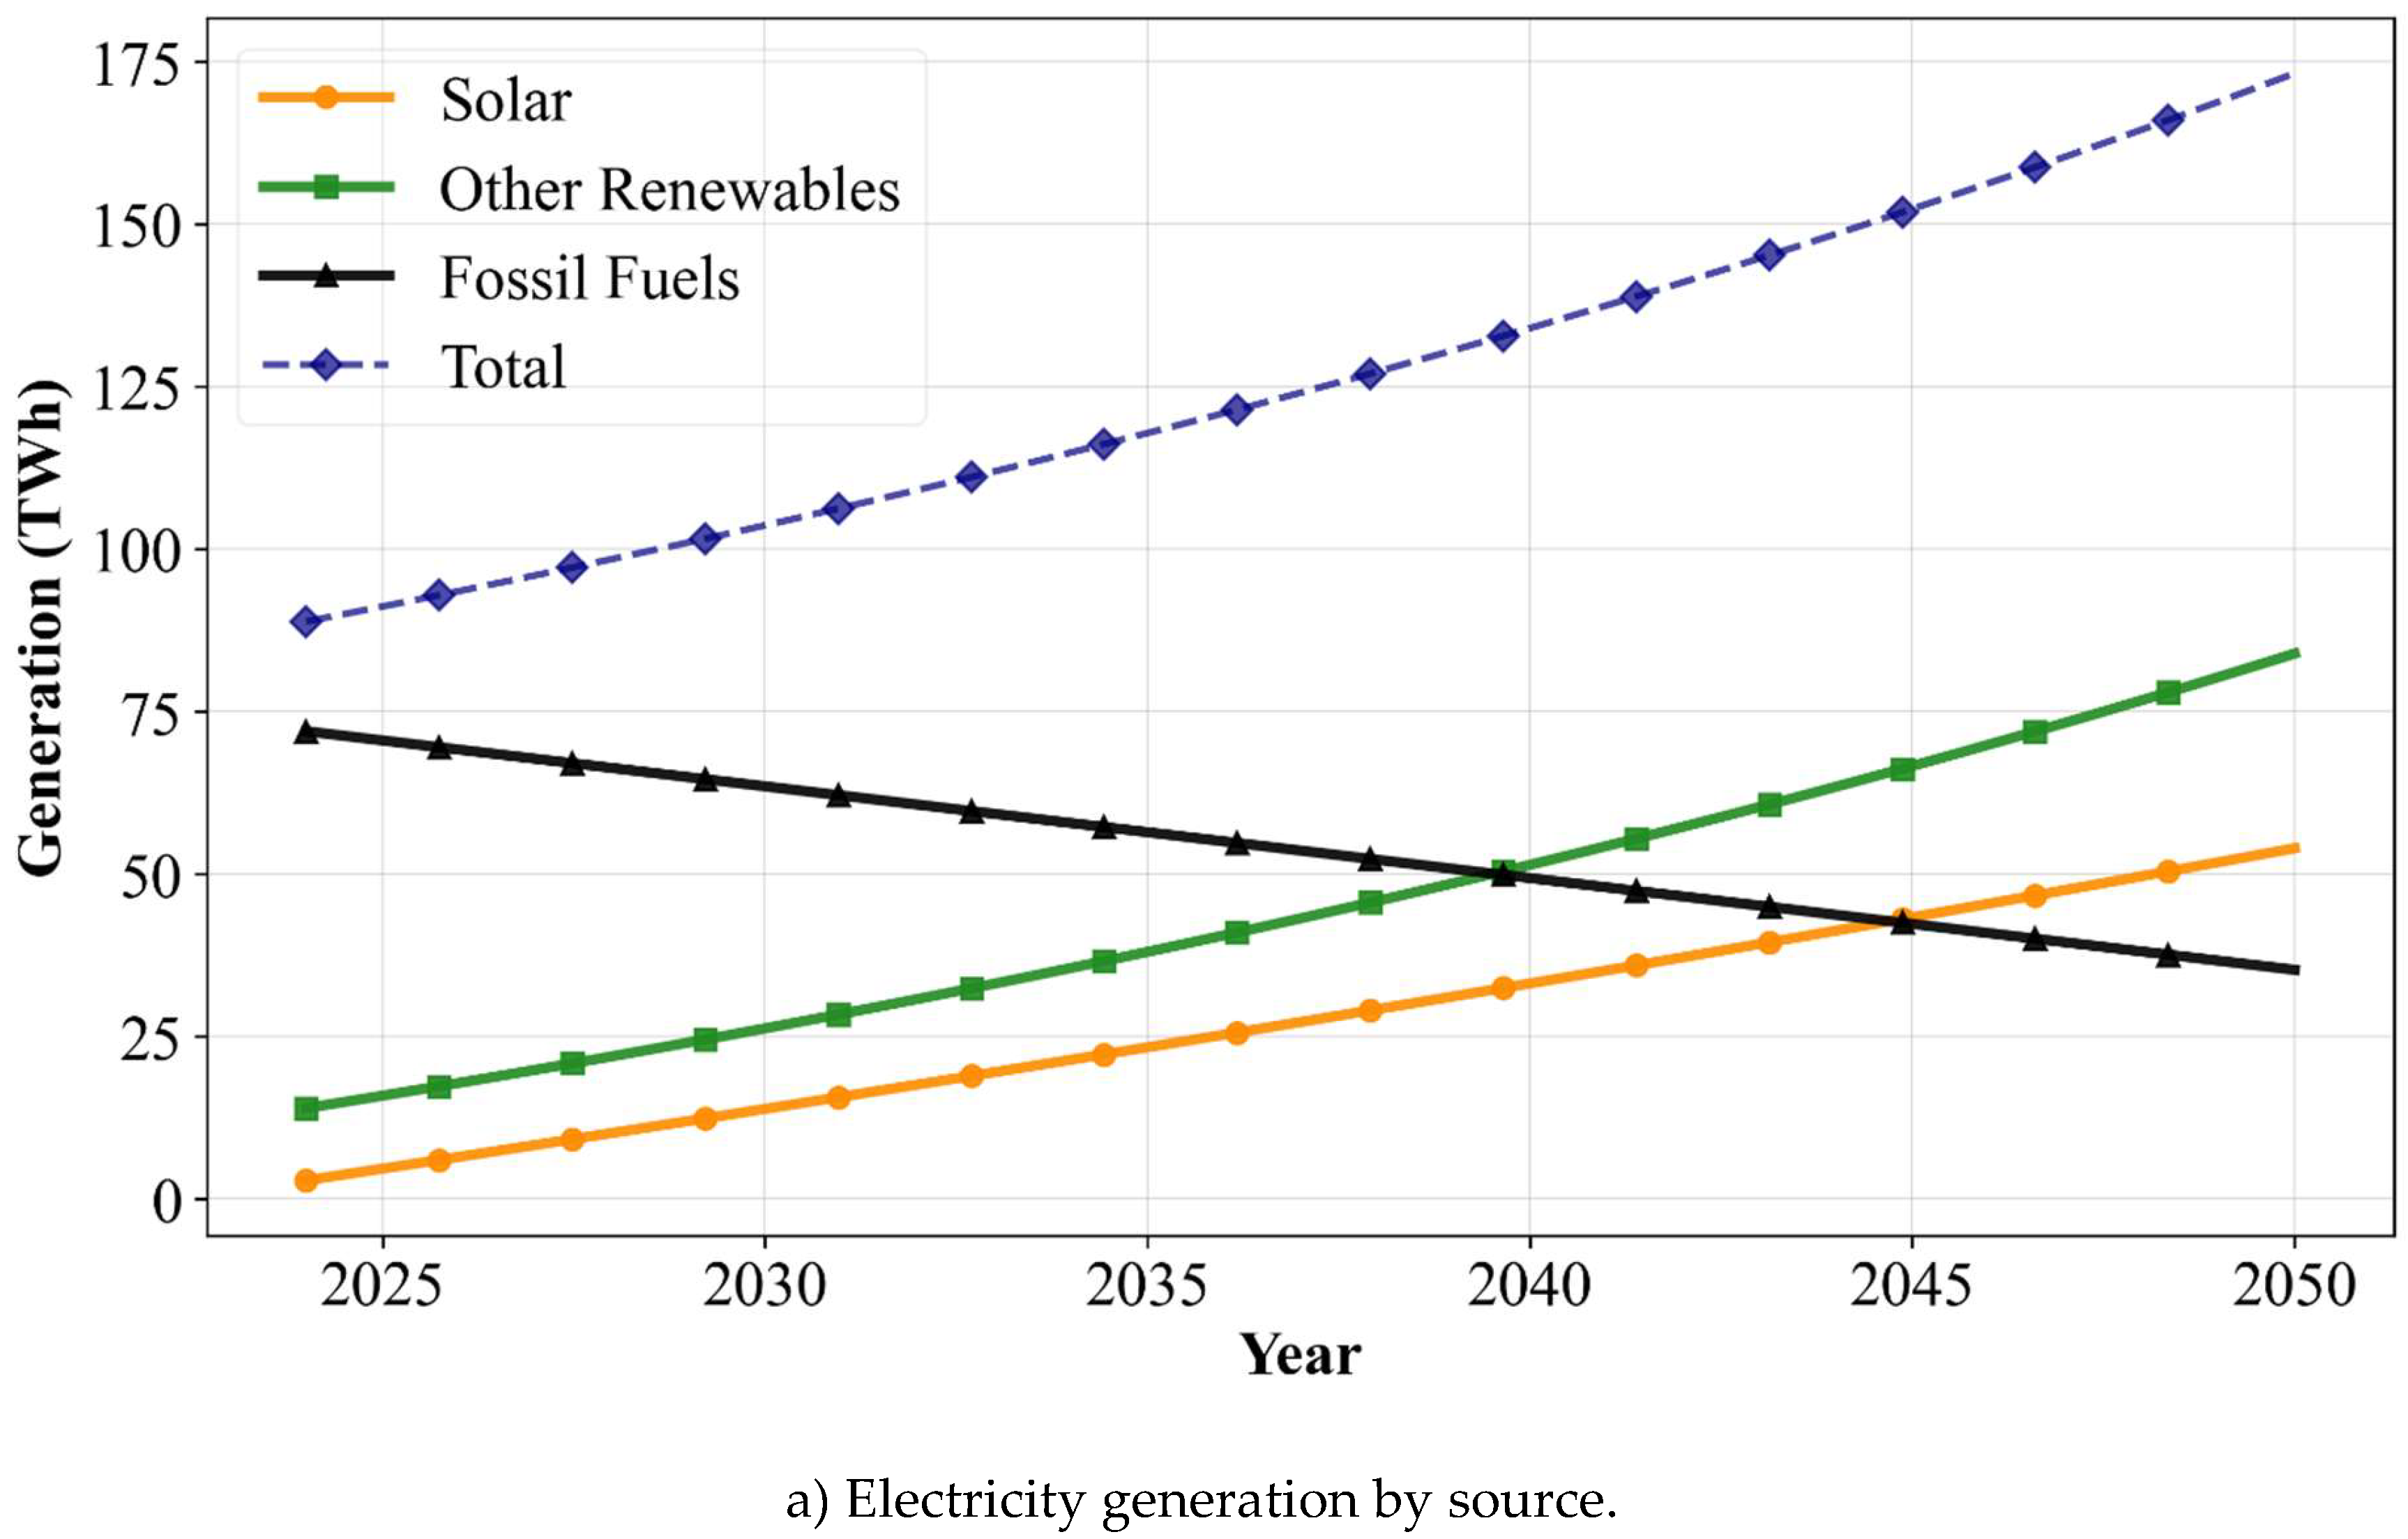
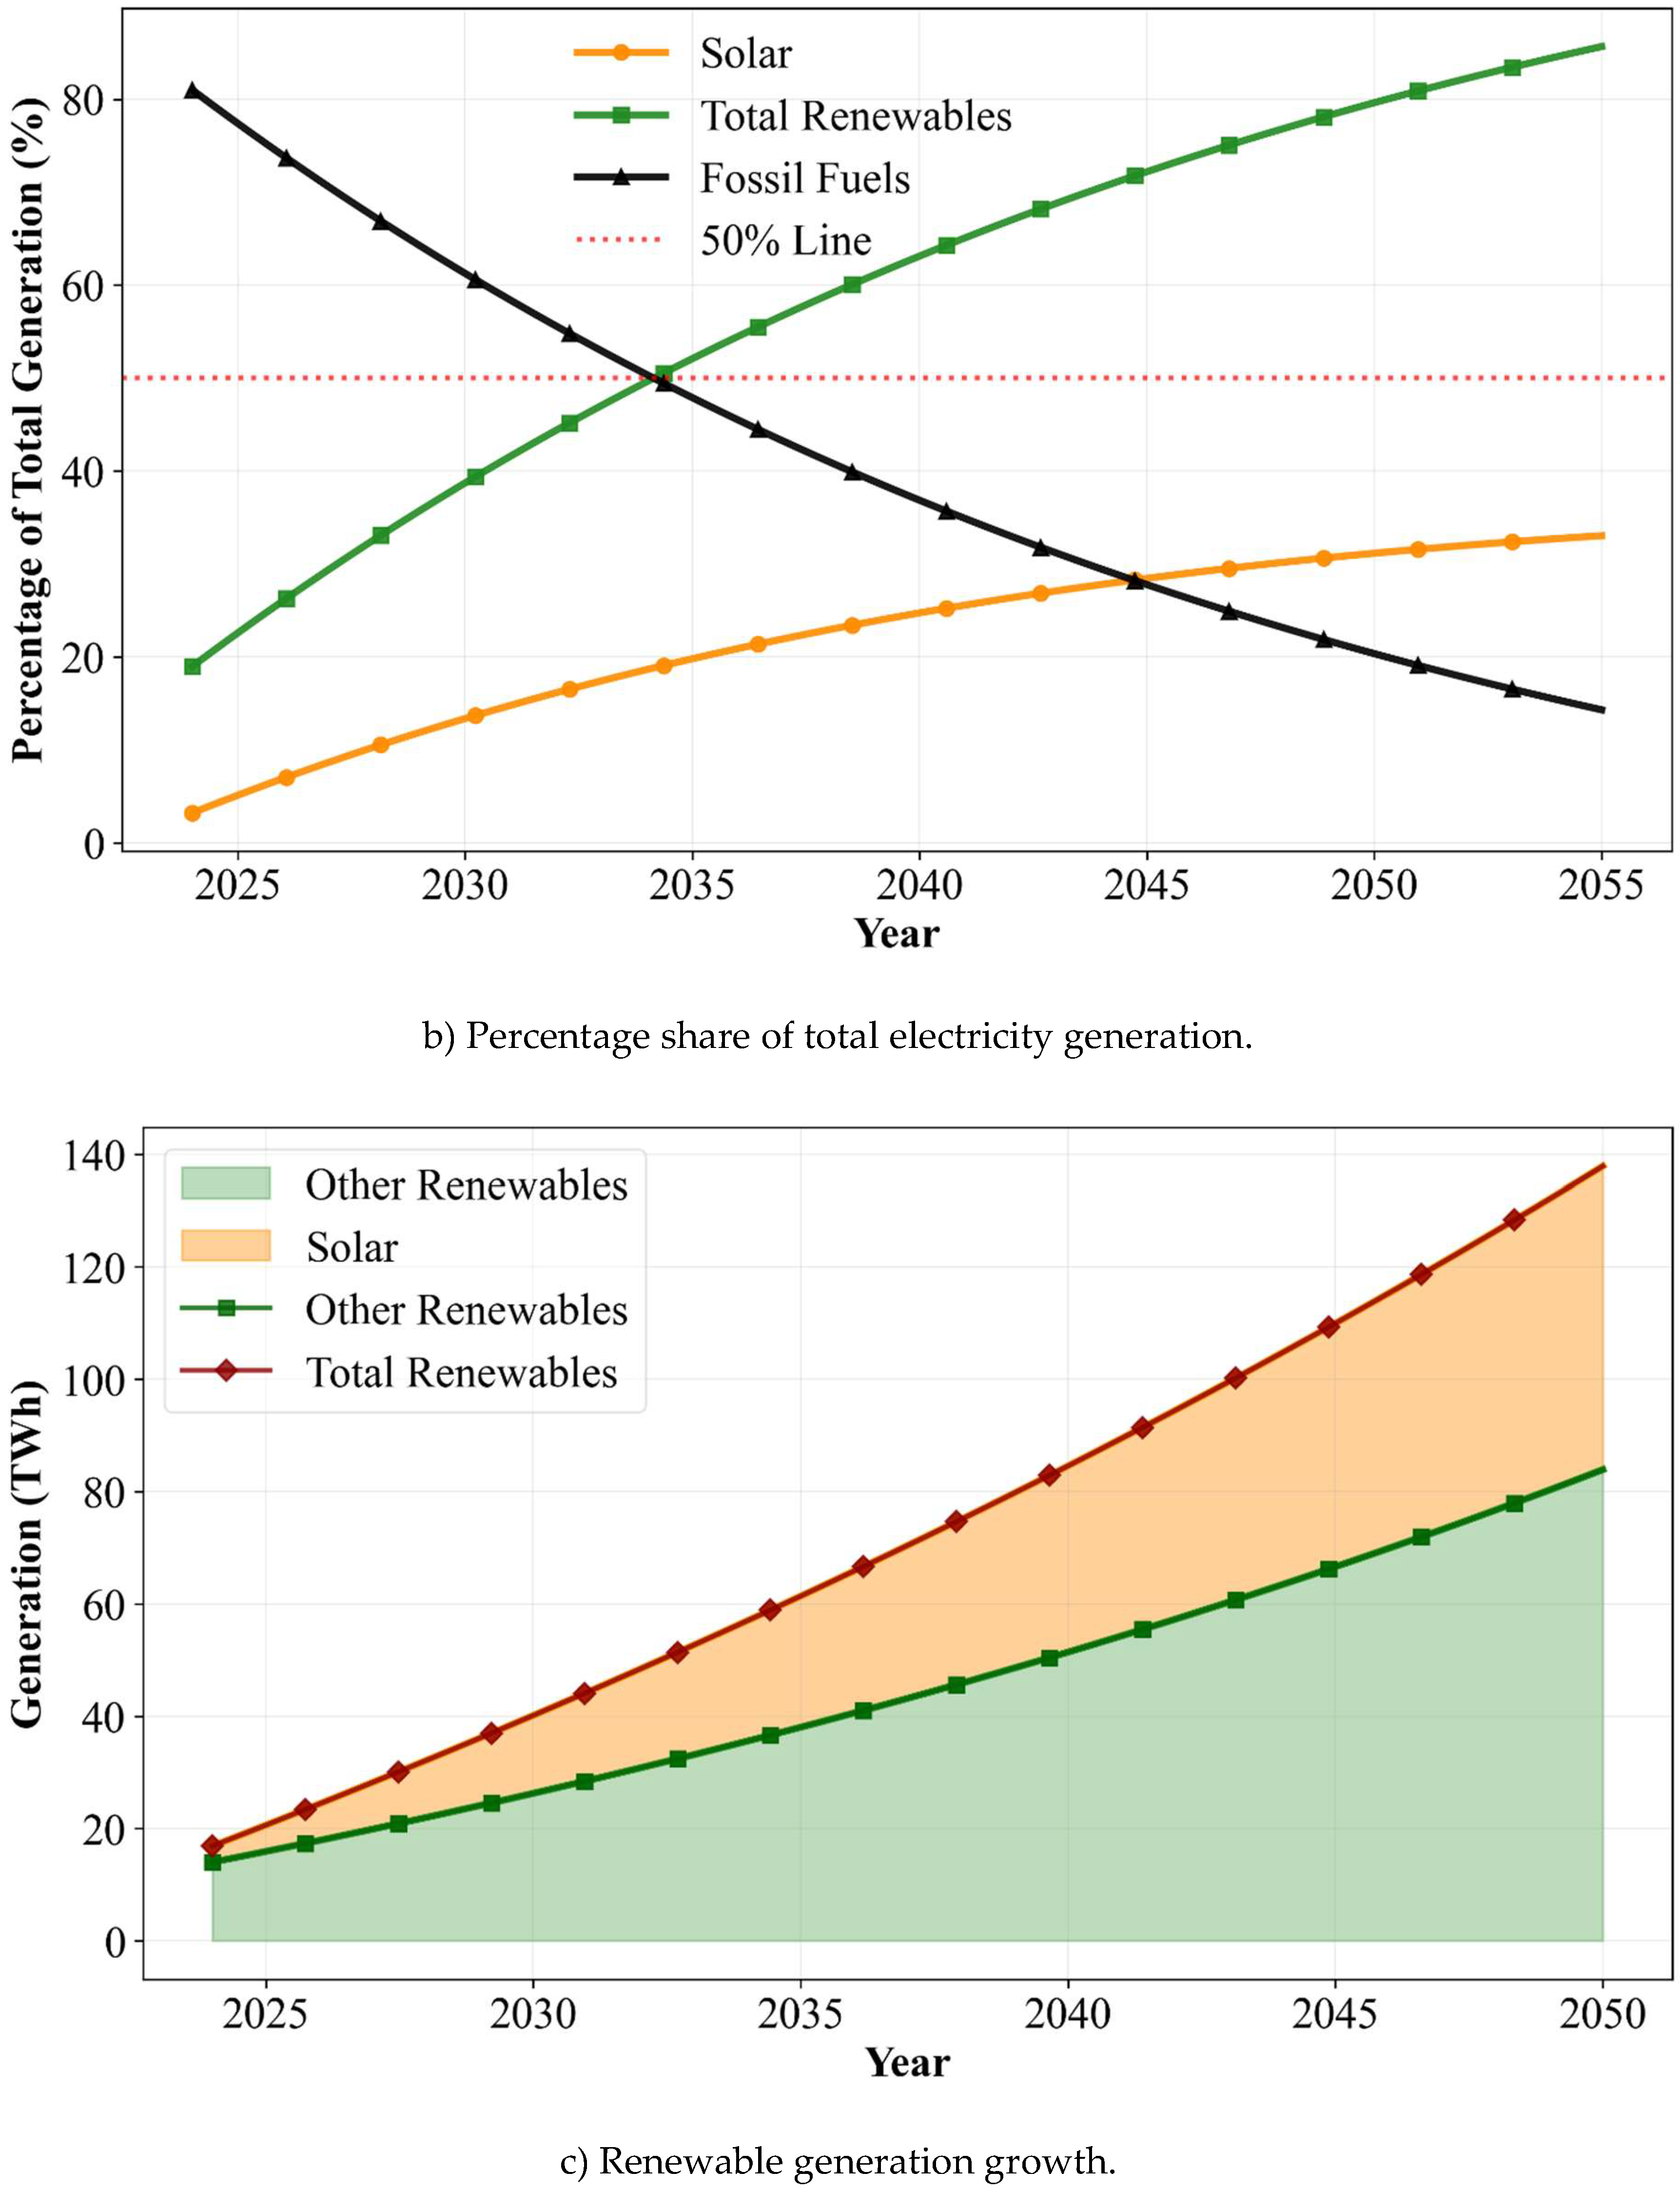
Figure 5.
Emission evolution by shifting subsidies into solar PV investments.
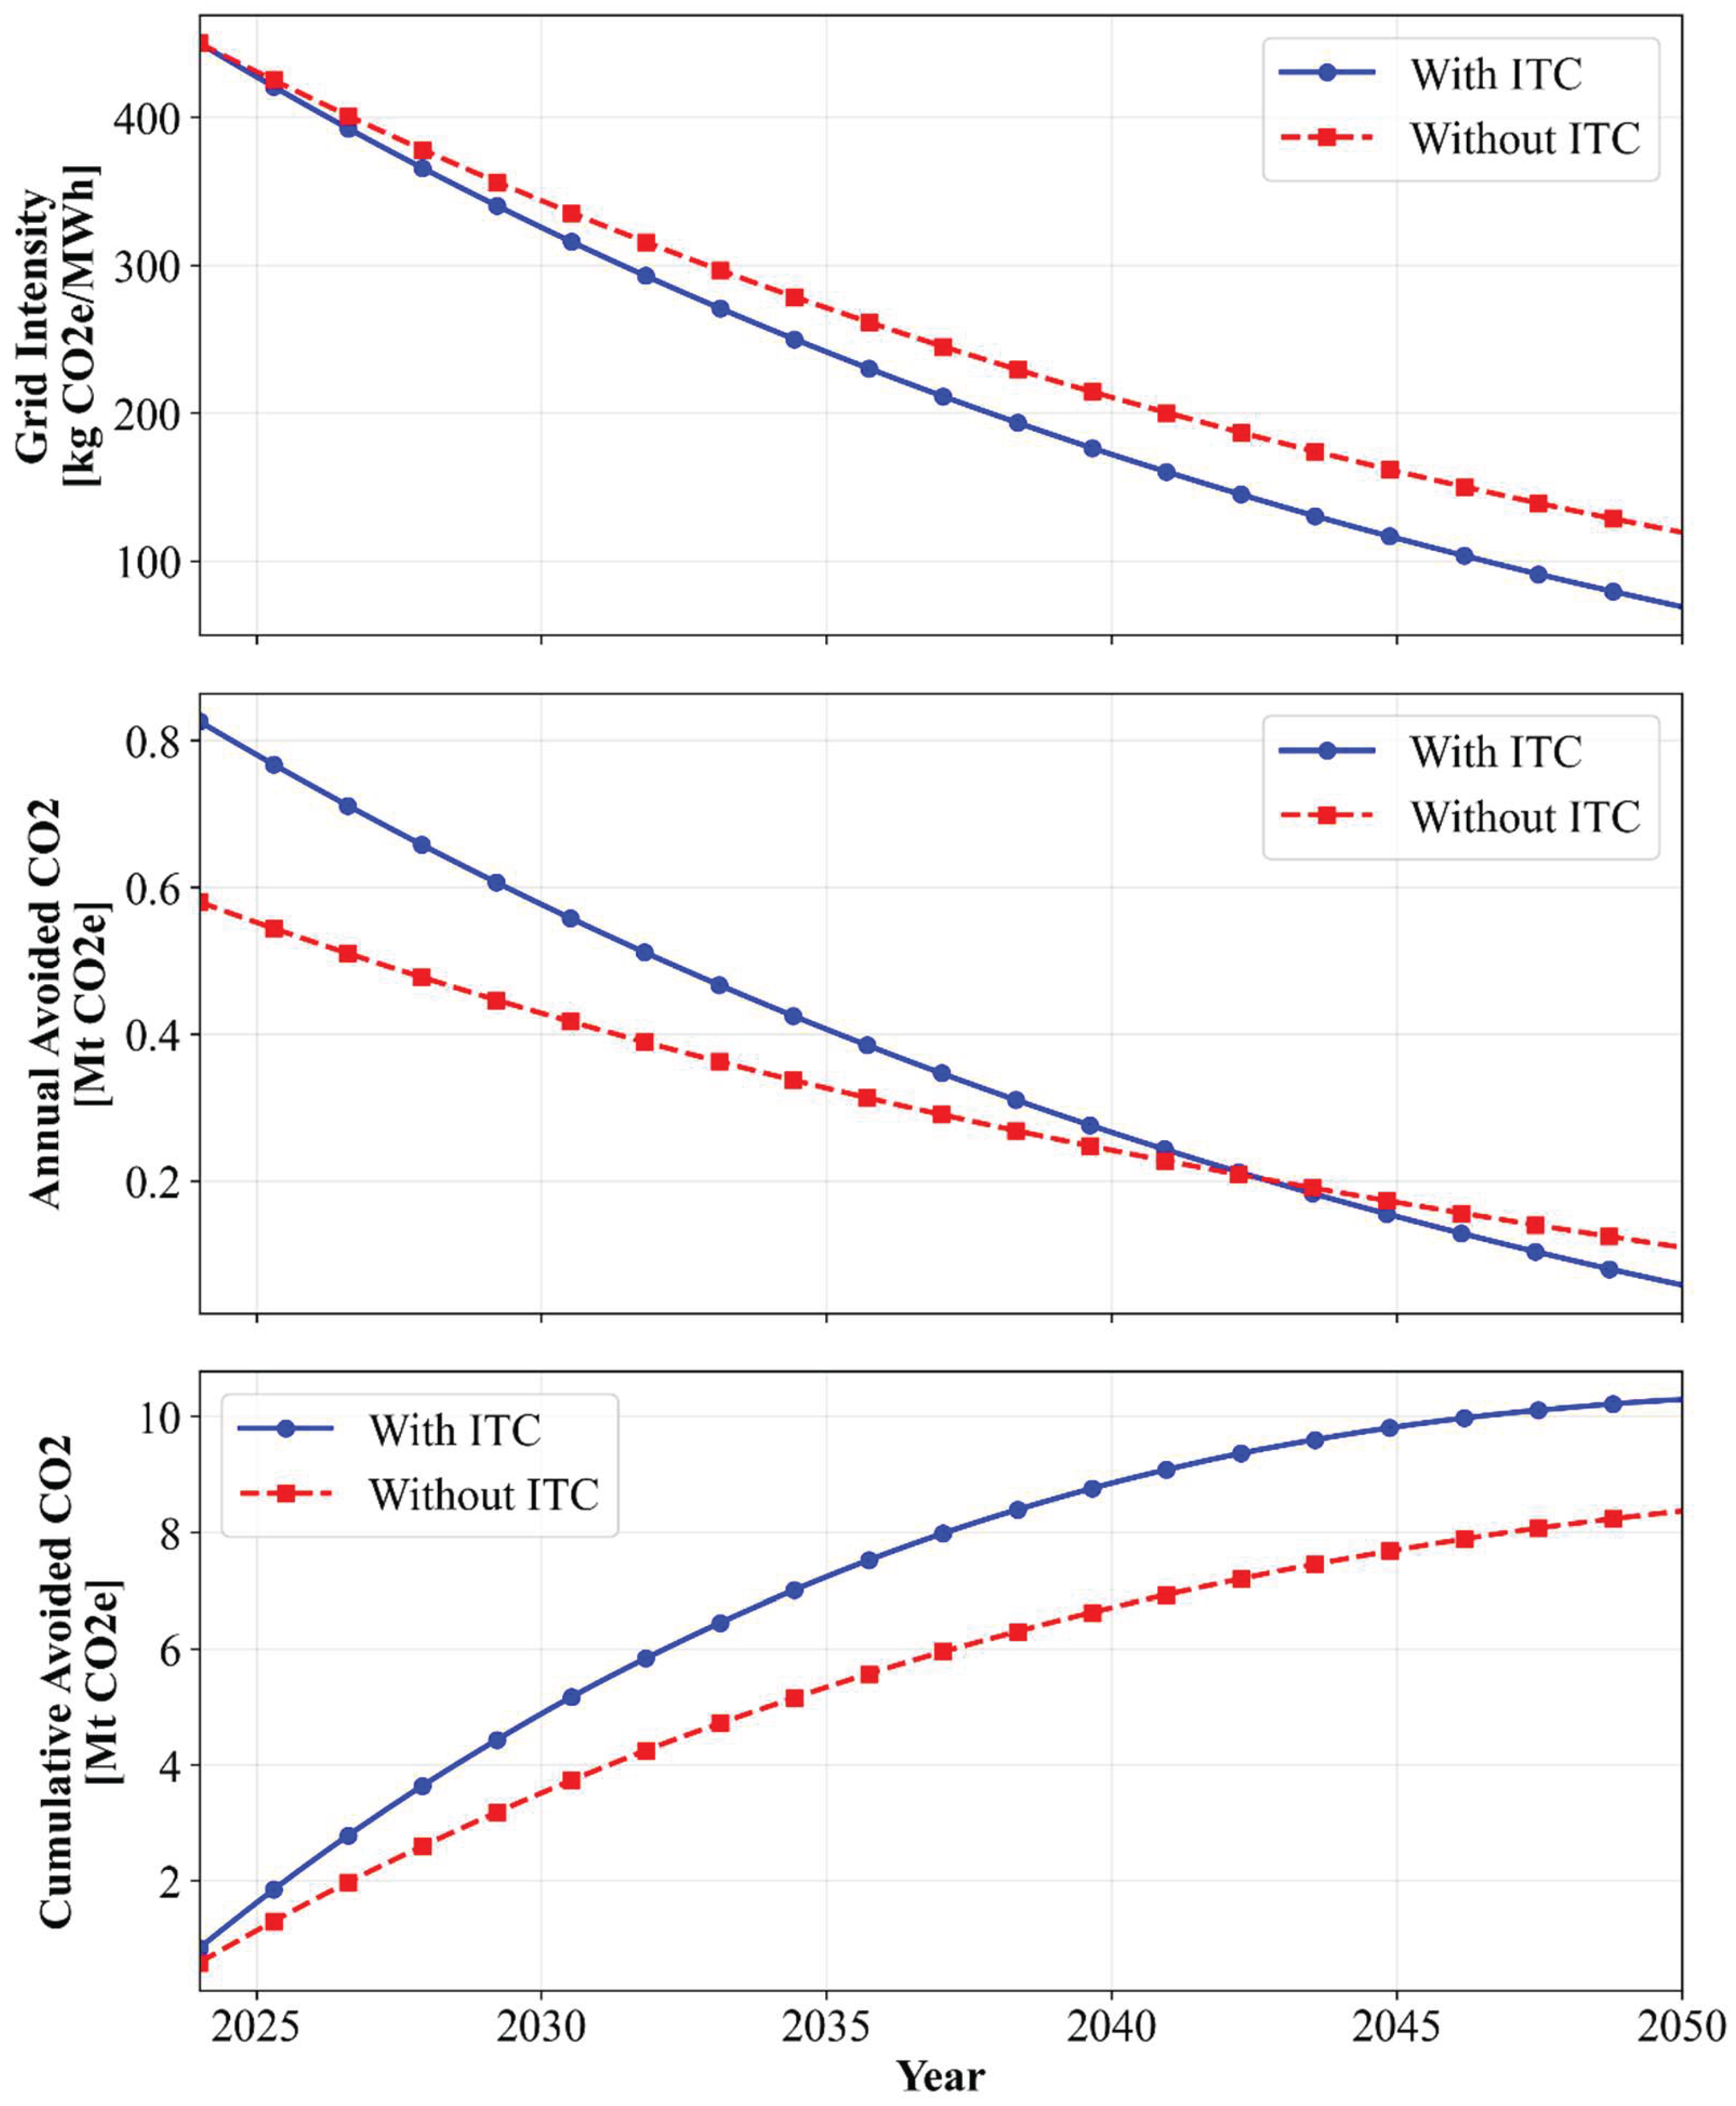

Table 1.
Summary of Fossil fuel subsidies in Alberta by type.
| Program Category | Key Programs | Active Period | Peak Annual Funding | Total Funding |
|---|---|---|---|---|
| Legacy Royalty Adjustments (P) | Natural Gas Deep Drilling, Shale Gas, Horizontal Oil | 2016-2019 | ~$1.46B (2019) | ~$3.5B |
| Sturgeon Refinery (P) | North West Redwater Toll Commitment | 2018-2022 | $976M (2021) | ~$3.7B |
| Energy Diversification (P) | Partial Upgrading, Petrochemical Infrastructure | 2019-2025 | $292M (2021-2025) | ~$1.42B |
| Carbon Capture & Sequestration (P) | Shell Quest, CCS Initiative | 2015-2021 | ~$309M (2015) | ~$930M |
| Tax Expenditures (P) | Fuel User Programs, Farm Fuel Benefit | 2016-2019 | $302.5M (2016) | ~$848M |
| Federal Programs (F) | Business Development Bank, Strategic Innovation | 2019-2020 | ~$626M (2019) | ~$626M |
| Coal Phase-out (P) | Coal phase-out agreements | 2017-2023 | $97M annually | ~$582M |
| Innovation Programs (P) | Water Tech, Clean Tech, Emissions Reduction, Energy efficiency |
2016-2023 | ~$143.5M (2017) | ~$220M |
| Oil Sands Innovation (P) | Innovation Fund | 2019-2022 | $80M (2020-2022) | ~$280M |
| Petrochemical Incentives (P) | Heartland & Kuwait Corp complexes | 2019-2024 | $100M annually | ~$500M |
| Provincial (P) | ~$12B total funding ~$626M total funding |
|||
| Federal (F) | ||||
Table 2.
Geographic Solar PV Transferred Subsidies.
| Location | Subsidy Amount (CAD/year) |
|---|---|
| Calgary | 4,166,666.67 |
| Christina Lake | 12,333,333.33 |
| Cold Lake | 3,333,333.33 |
| Fort McMurray | 16,200,000 |
| Fort Saskatchewan | 28,000,000 |
| Foster Creek | 3,333,333.33 |
| Lethbridge | 1,329,993,67 |
| Strathcona | 33,333,333.33 |
| Sturgeon | 346,000,000 |
| Surmont | 833,333.33 |
| Total | 1,777,527,000 |
Table 3.
Input parameters for SAMA simulations.
| Type | Data | Specifications | Value | Unit | Ref. |
|---|---|---|---|---|---|
| Meteorological | Irradiation (GHI, DNI, DHI) |
Obtained from NSRDB | - | W/m2 | (NSRDB, 2025) |
| Tilt angle1 | Calgary | 47.5 | (Solarific, 2025a) | ||
| Christina Lake | 53.2 | (Solarific, 2025b) | |||
| Cold Lake | 50.5 | (Solarific, 2025c) | |||
| Edmonton | 49.7 | (Solarific, 2025d) | |||
| Fort McMurray | 53.2 | (Solarific, 2025b) | |||
| Fort Saskatchewan | 49.8 | (Solarific, 2025e) | |||
| Foster Creek | 50.3 | (Solarific, 2025f) | |||
| Lindbergh | 49.7 | (Solarific, 2025d) | |||
| N/A-Lethbridge | 40.9 | (Solarific, 2025g) | |||
| Red Deer | 48.6 | (Solarific, 2025h) | |||
| Strathcona | 49.7 | (Solarific, 2025d) | |||
| Sturgeon | 49.7 | (Solarific, 2025d) | |||
| Surmont | 53.2 | (Solarific, 2025b) | |||
| Soiling | Losses in percentage | 5% | % | (NREL, 2024) | |
| Temperature | Obtained from NSRDB | - | °C | (NSRDB, 2025) | |
| Cost | PV and inverter | Total | 1657 | CAD/kW | (Ramasamy et al., 2023)2 |
| Module | 531 | ||||
| Inverter | 68 | ||||
| Structural BOS | 183 | ||||
| Electrical BOS | 251 | ||||
| Fieldwork | 337 | ||||
| Officework | 94 | ||||
| Other | 191 | ||||
| Maintenance costs | PV system | 23.69 | CAD/kWdc/year | ||
| Economic | Nominal Discount Rate (January 2025) 3 | 3.25 | % | (Bank of Canada, 2025) | |
| Expected inflation rate4 | 2 | (Bank of Canada, 2023) |
Table 4.
Subsidized PV system size and annual output per location.
| Location | Size of PV with ITC [kW] |
Size of PV without ITC [kW] |
PV Generation with ITC [GWh/yr] |
PV Generation without CT ITC [GWh] |
|---|---|---|---|---|
| Calgary | 3591.95 | 2514.37 | 4.861 | 3.403 |
| Christina Lake | 10632.18 | 7442.53 | 11.889 | 8.322 |
| Cold Lake | 2873.56 | 2011.49 | 3.209 | 2.246 |
| Fort McMurray | 13965.52 | 9775.86 | 15,030 | 10.521 |
| Fort Saskatchewan | 24137.93 | 16896.55 | 28.788 | 20.152 |
| Foster Creek | 2873.56 | 2011.49 | 3.189 | 2.232 |
| Lethbridge | 1146546.26 | 802582.4 | 1,560.424 | 1,092.297 |
| Strathcona | 28735.63 | 20114.94 | 35.441 | 24.809 |
| Sturgeon | 298275.86 | 208793.1 | 352.572 | 246.800 |
| Surmont | 718.39 | 502.87 | 0.776 | 0.543 |
| Total | 1532350.84 | 1072645.6 | 2,016.179 | 1,411.326 |
Table 5.
Economic performance proposed PV system in each location.
| Location | NPC w/ITC [CAD] | NPC wo/ITC [CAD] | O&M w/ITC [CAD] | O&M wo/ITC [CAD] |
|---|---|---|---|---|
| Calgary | 5,989,148 | 5,442,407 | 1,822,478 | 1,275,737 |
| Christina Lake | 17,727,866 | 16,109,514 | 5,394,538 | 3,776,178 |
| Cold Lake | 4,791,308 | 4,353,913 | 1,457,982 | 1,020,586 |
| Fort McMurray | 23,285,805 | 21,160,056 | 7,085,802 | 4,960,059 |
| Fort Saskatchewan | 40,247,061 | 36,572,940 | 12,247,062 | 8,572,943 |
| Foster Creek | 4,791,312 | 4,353,913 | 1,457,982 | 1,020,586 |
| Lethbridge | 1,911,726,380 | 1,737,206,603 | 581,732,718 | 407,212,912 |
| Strathcona | 47,913,167 | 43,539,214 | 14,579,836 | 10,205,884 |
| Sturgeon | 497,338,703 | 451,937,087 | 151,338,706 | 105,937,093 |
| Surmont | 1,197,828 | 1,088,473 | 364,496 | 255,145 |
Disclaimer/Publisher’s Note: The statements, opinions and data contained in all publications are solely those of the individual author(s) and contributor(s) and not of MDPI and/or the editor(s). MDPI and/or the editor(s) disclaim responsibility for any injury to people or property resulting from any ideas, methods, instructions or products referred to in the content. |
© 2026 by the authors. Licensee MDPI, Basel, Switzerland. This article is an open access article distributed under the terms and conditions of the Creative Commons Attribution (CC BY) license (http://creativecommons.org/licenses/by/4.0/).
Copyright: This open access article is published under a Creative Commons CC BY 4.0 license, which permit the free download, distribution, and reuse, provided that the author and preprint are cited in any reuse.


