
Submitted:
20 January 2026
Posted:
21 January 2026
You are already at the latest version
Abstract
Background :Mas-related G-protein-coupled receptor b4 (Mrgprb4)-lineage neurons in the peripheral nervous system, were a type of C fibers in the hairy skin. Our prior work demonstrated that these neurons respond to both noxious and innocuous mechanical and thermal stimuli. Ablating them eliminates the pleasant sensation elicited by gentle pressure on the mouse nape. However, their potential role in mitigating pain and pain-related negative emotions in response to somatic stimuli remains unclear.
Methods:Animal experiments investigated the pivotal role of Mrgprb4-lineage neurons in mediating the analgesic and anxiolytic effects of transcutaneous electrical nerve stimulation (TENS) applied to the Zusanli (ST36) acupoint. In vivo calcium imaging of lumbar 4 dorsal root ganglia (DRG) neurons in Mrgprb4-GCaMP6s transgenic mice characterized neuronal encode of distinct TENS intensities. Mechanical pain thresholds and anxiety-like behaviors were assessed in a CFA-induced mouse model of comorbid chronic pain and anxiety. To simulate TENS, optogenetic stimulation was applied to the ST36 acupoint in Mrgprb4-ChR2 mice; intrathecal viral injection specifically ablated L3-L5 Mrgprb4-lineage neurons, and TENS effects were evaluated with their gain- or loss-of-function manipulation.
Results: 0.5 mA TENS on ST36 ameliorated pain and anxiety-like behaviors in model mice and activated Mrgprb4-lineage neurons. Photostimulation on ST36 induced analgesic and anxiolytic effect in comorbidity of chronic pain and anxiety model of Mrgprb4-ChR2 mice. Ablating these neurons attenuated the therapeutic effects of 0.5 mA TENS in model mice.
Conclusion:These genetic engineering-assisted findings may deepen our understanding of the analgesic and anxiolytic effect and mechanism of somatic stimulation and further improve the clinical efficacy.
Keywords:
transcutaneous electrical nerve stimulation
; Mrgprb4-lineage neurons
; chronic pain
; anxiety
; Complete Freund’s Adjuvant
1. Introduction
Pain represents a grave global public health challenge, severely threatening human well-being. Chronic pain afflicts 37% of the population in developed nations and 41% in developing ones, with over half of sufferers experience emotional comorbidities, particularly anxiety, are prevalent, creating a vicious cycle that severely undermines patients’ physical and mental quality of life [1,2,3,4,5]. A deeper understanding of the neural mechanisms driving this comorbidity is crucial to uncovering novel therapeutic directions for chronic pain. Previous research has demonstrated that the majority of C-afferents are polymodal nociceptors actively involved in pain transmission. Furthermore, ablation of mas-related G-protein-coupled receptor D neurons reduces behavioral sensitivity to noxious mechanical stimuli in mice [6,7,8]. After knocking out the transient receptor potential vanilloid 1 (TRPV1) channel, mechanical hyperalgesia in arthritis model mice is alleviated [9]. Meanwhile, electroacupuncture (EA) alleviates pain in Complete Freund’s Adjuvant (CFA) model mice specifically through the TRPV1 signaling pathway in the brain [10,11]. Our previous research has revealed that mas-related G-protein-coupled receptor b4 (Mrgprb4)-lineage neurons, which specifically innervate hairy skin and belong to the C-fiber population, are a polymodal group indispensable for transmitting pleasant sensations [12,13]. Furthermore, Mrgprb4-lineage neurons are required for dopamine release during sexual behavior in female mice and are involved in brain reward [14]. More interestingly, ablation of Mrgprb4-lineage neurons did not alter the pain threshold or motor function, much less lead to noxious pain behaviors [14].
In current clinical practice, a combination therapy of analgesics and anti-anxiety/depression drugs is widely adopted for managing chronic pain comorbid with anxiety [15]. While this regimen can mitigate patients’ pain and associated negative emotions to some degree, its efficacy remains dose-dependent and is accompanied by notable adverse reactions, including gastrointestinal and hepatorenal function impairments, as well as drug dependence [16]. Consequently, there is an urgent need to develop safer, more effective therapeutic strategies for the comorbidity of chronic pain and anxiety and to further elucidate the underlying therapeutic targets. The analgesic effect of transcutaneous electrical nerve stimulation (TENS) is well-established, demonstrating significant efficacy in relieving diverse chronic pain conditions such as inflammatory pain, low back pain, postoperative incisional pain, and fibromyalgia [17,18,19,20,21,22]. It produces acupuncture-like effects with distinct advantages and minimal obvious adverse reactions. Furthermore, as an emerging physical therapy modality, TENS has demonstrated unique potential for intervening in anxiety and depression [23]. Previously published studies have established its efficacy in treating anxiety disorders during and after surgery [24,25,26], however, evidence supporting TENS’s anti-anxiety effects from basic research remains limited [26]. Zusanli (ST36) is a prominently selected point for managing pain syndromes and emotional disorders. Two research demonstrate that TENS or EA applied at ST36 significantly reduces postoperative opioid analgesic requirements and elevates TRPV1 expression levels to attenuate pain and depression [11,27]. Mrgprb4-lineage neurons transmit pleasant sensations induced by mild pressure and could represent key peripheral polymodal receptors enabling TENS function [12]. Whether the mechanism underlying TENS alleviation of anxiety-like behaviors accompanying chronic pain involves Mrgprb4-lineage neurons remains unknown.
Employing genetically engineered mouse models alongside genetic manipulation, viral strategies, and behavioral assessments, we selectively activated or ablated Mrgprb4-lineage neurons to determine whether these neurons mediate the regulation of chronic pain and anxiety comorbidity by TENS applied at ST36. This study’s findings will provide novel insights and valuable references for therapeutic targets addressing this comorbidity and further enhance clinical outcomes.
2. Materials and Methods
2.1. Animals
All animal experiments strictly adhered to the National Institutes of Health Guide for the Care and Use of Laboratory Animals. The Animal Ethics Committee at the Institute of Acupuncture and Moxibustion, China Academy of Chinese Medical Sciences, rigorously reviewed and formally approved all experimental protocols.
We conducted experiments using C57BL/6J mice (obtained from SPF Biotechnology Co. Ltd., License No: SCXK- [Jing]-2019-0010). Mrgprb4Cre-tdTomato transgenic strains were generated by Shanghai Model Organisms Center, Inc.). Mouse lines of Ai96 (RCL-GCaMP6s mice) (no.028866) and Ai32(RCL-ChR2/EYFP mice) (no. 024109) were purchased from The Jackson Laboratory. Subjects included both male and female mice aged 8 weeks; gender exerted no significant influence on the experimental outcomes.
Housed within standard animal facilities, mice were given ad libitum access to food and water. They experienced a consistent 12-hour light-dark cycle (dark phase: 8:00 pm to 8:00 am), with ambient temperature maintained at 23°C ± 0.5°C, humidity controlled between 60% and 70%, and environmental noise kept below 60 dB. All animals acclimated to these conditions for seven full days prior to experimentation. Crucially, all experiments were performed by experimenters rigorously blinded to the specific genotype of the mice.
A mouse model of chronic pain and anxiety comorbidity (designated CFA mice) was successfully established via subcutaneous administration of Complete Freund’s Adjuvant (CFA) into the hind paw. Under isoflurane inhalation anesthesia, precisely 25 μL of CFA was meticulously injected subcutaneously into the right hind paw of each mouse. The needle penetrated approximately 0.5 cm deep, and the injection process deliberately spanned over 30 seconds. Upon needle withdrawal, the injection site was promptly compressed with a sterile cotton ball to prevent solution leakage. Following CFA injection, the hind paw exhibited marked redness and swelling, accompanied by distinct behavioral manifestations like persistent foot shaking, vigorous licking, and pronounced lameness; concurrently, the mechanical pain threshold showed a significant reduction. Control mice received an equal volume (25 μl) of sterile 0.9% saline injected into the right hind paw using an identical protocol. After thorough disinfection with iodophor, all mice were carefully returned to their home cages for attentive post-procedural care.
2.2. Intrathecal Injection
Mrgprb4-Cre;GCaMP6s mice were anesthetized by intraperitoneal administration of 1.25% tribromoethanol (0.2 mL/10 g body weight; Aibei Biotechnology, Nanjing, China). Core body temperature was maintained at approximately 37 °C using a heating pad. A 1 cm skin incision was made over the lumbar region to expose the T11-T12 intervertebral space. Under stereomicroscopic guidance (OLYMPUS SZ51, Tokyo, Japan), the intervertebral membrane and underlying dura mater were carefully exposed using fine forceps. A 0.2 mm diameter catheter connected to a microinjection system was stereotaxically inserted 5 mm caudally into the T11-T12 intervertebral space. Subsequently, 5 μL of either AAV9 (rAAV-CMV-DIO-taCasp3-T2A-TEVp; BrainCase Inc., BC-0128, 1.1×10¹³ GC/mL) or sterile 0.9% saline was infused into the intrathecal space at a constant rate of 1.2 μL/min. The surgical incision was closed 10 minutes post-injection. Animals were monitored during postoperative recovery. Behavioral assessments were conducted ≥3 weeks following intrathecal injection.
2.3. Measurement of Hind Paw Thickness
Hind paw thickness measurements were obtained using a digital caliper. To prevent stress responses from compromising experimental outcomes, paw thickness was assessed while mice were carefully maintained under 0.5-1% isoflurane anesthesia (R510-22-10, RWD). The mouse’s hind paw was gently positioned horizontally. The operator then precisely aligned the caliper jaws with the peak swelling point on the dorsum of the foot and recorded the measurement.
2.4. Mechanical Pain Threshold Detection
The mechanical threshold was assessed using sequentially ascending calibrated von Frey filaments (0.008 g, 0.02 g, 0.04 g, 0.07 g, 0.16 g, 0.4 g, 0.6 g, 1.0 g, 1.4 g; (Touch Test® Sensory Evaluators, Shanghai RuiShi), commencing with the 0.008 g filament. Filaments were applied perpendicularly to the skin with sufficient force to produce slight bending, only during periods of mouse stillness. Positive responses were defined as paw withdrawal, paw licking, or escape behavior. Each filament underwent five consecutive applications; the minimal filament eliciting reflexive paw withdrawal on at least three of five trials was designated the paw withdrawal threshold, consistent with established methodology [28].
2.5. Transcutaneous Electrical Nerve Stimulation Applications
The ST36 point was identified using an experimental acupuncture atlas [29]. Located at the posterolateral aspect of the knee joint, approximately 5 mm below the fibular head, ST36 served as the target site. Mice received induction anesthesia with 2% isoflurane, followed by maintenance at 1% concentration. Positioned supine on the operating table, each mouse had a 4-mm diameter silver wire electrode secured over the right ST36 point. TENS intervention commenced on the first post-modeling day. The electrode, connected to a HANS-200A electroacupuncture instrument, delivered TENS as depicted in Figure 1B. A sufficient quantity of conductive paste coated the electrode slice surface to ensure optimal conductivity. Stimulation parameters were: 10 Hz frequency, 0.5 mA / 2.0 mA intensity, administered for 10 minutes per session, once daily, over 7 consecutive days.
2.6. Open Field Test
Animals were acclimated to both their testing environment and equipment before behavioral assessments commenced. Throughout testing, the experimenter remained blind to each animal’s genotype until after behavioral analysis concluded. Stress and anxiety-like behaviors were quantified using an open-field apparatus (L40 × W40 × H30 cm) [28]. Following a 10-minute adaptation period within the experimental room, each mouse was gently placed in the center of the open-field arena. The apparatus floor was divided into 16 equal squares, designating the middle four squares as the center zone. A digital video camera recorded each animal’s movements for 5 minutes, specifically tracking the total distance traveled and time spent within the center zone. The mice’s motion trails were subsequently analyzed using Any-maze software (version 7, Stoelting).
2.7. In Vivo Ca2+ Imaging of L4 DRG
As previously described [12], endotracheal intubation and exposure of the L4 DRG were performed (Figure S1A-C). Intracellular calcium concentration shifts were captured using a laser-scanning confocal microscope (Leica Stellaris 8, Germany), with changes visualized through fluctuating fluorescein intensity within the neurons. Before imaging, mice were secured prone on a custom-designed microscope stage. The spinal column was firmly stabilized using a pair of customized spinal clamps to eliminate movement artifacts (Figure S1D) and guarantee the L4 DRG remained fully exposed, free from blood exudation obscuring the field, consistent with prior methodology [30,31,32]. During imaging sessions, adult male or female Mrgprb4Cre; GCaMP6s mice received anesthesia via tracheal intubation (0.5-1% isoflurane, R510-22-10, RWD) following L4 DRG exposure. Supplemental 0.5% isoflurane was administered intratracheally when necessary to prevent muscle twitching during recording if anesthesia was proved insufficient. Ointment was applied to the animals’ eyes to prevent drying.
Imaging was conducted using a Leica 10× air objective at 1× magnification. Following localization of the dorsal root ganglion (DRG) field under microscopy (Figure S1E), L4 DRG thickness was determined along the Z-axis, with subsequent adjustment of X and Y planes to ensure complete inclusion of the L4 DRG within the imaging field. Time-lapse z-stacks of intact DRG were acquired at 512 × 512 resolution. Individual frames comprised 6–12 z-stacks (contingent upon DRG-to-objective lens alignment), with 9 frames captured for mechanical stimuli and 20 frames for thermal stimuli. A 488 nm excitation wavelength was employed at 5% laser power, with bidirectional image acquisition at 400 Hz scan speed. Neuronal activation triggers GCaMP binding to intracellular Ca2+, yielding green fluorescence for imaging (Figure S1F). Live imaging spanned 9 consecutive frames: frames 1–3 recorded baseline fluorescence intensity (pre-stimulation), frames 4–6 documented stimulation-phase intensity, and frames 7–9 captured post-stimulation recovery.
Transcutaneous electrical nerve stimulation (TENS) was then administered at randomized intensities (0.1, 0.3, 0.5, 1.0, 1.5, 2.0 mA; 10 Hz, 1 ms pulse width) at ST36, with 1–2 minute interstimulus intervals. Core body temperature was maintained at 37.0 ± 0.5 °C via heating pad with rectal thermometry (DC Temperature Controller, FSH, USA), while respiratory parameters underwent real-time monitoring (Small animal anesthesia system, SomnoSuite, Kent Scientific).
2.8. Optogenetics
The hair in the right ST36 area of the mice was removed in advance. Under maintained isoflurane inhalation anesthesia, the right ST36 area was subjected to blue light stimulus. The optical fiber was positioned 5 - 7 mm above the skin surface. Parameters: 473 nm, 10 Hz, 30 mW, 1 ms, 10 min per time, once a day, for 7 consecutive days. The body temperature of the mice was maintained at 37.0 ± 0.5 °C with a heating pad.
2.9. Immunofluorescence
Animals were deeply anesthetized with a Tribromoethanol solution, and the blood was cleared from all tissues by perfusing saline through the vascular system. Mice were then perfusion - fixed using 4% paraformaldehyde (PFA). Tissues were then collected and post - fixed in 4% PFA accordingly (DRG: 2 h, skin: 2 - 3 h). All tissues were cryoprotected in 30% sucrose for a minimum of 48 h. Subsequently, the tissues were embedded and sectioned on a freezing microtome (LEICA CM 1950, Germany) (DRG: 20 μm, skin: 30 μm). Sections were washed in PBS (3×10 minutes) and then blocked in PBS containing 3% goat serum and 0.5% Triton X - 100 for 1 hour at room temperature. Chicken anti - GFP (1:500, Abcam, #ab13970) was used as the primary antibody. Anti - GFP antibodies were used to label the expression of GCaMP6s in Mrgprb4 - GCaMP6s mice or ChR2 in Mrgprb4 - ChR2 mice. The secondary antibody was goat anti - chicken IgG - Alexa - Fluor 488 (1:600, Invitrogen, A11039). DAPI - containing media (ZLI - 9600, ZSGB - BIO) or glycerin was used to coverslip the tissue. The DRG sections were imaged with full - spectral scanning for confocal microscopy (OLYMPUS FV1200, Tokyo, Japan).
2.10. Quantification of Calcium Imaging
Calcium imaging data analysis was performed by Image J (National Institutes of Health). After importing the collected raw data into Image J, the activated neurons were manually circled and the relative fluorescence intensity of the neurons was exported. The calcium signal transients are expressed as Δ F / F0 = (Ft-F0) / F0. Ft represented the maximum fluorescence intensity of cells during stimulation (4-6 frames) and F0 represented the maximum fluorescence intensity of cells at baseline (1-3 frames) before intervention. Activation in neurons was defined as an increase in Δ F / F0 ≥ 30% [30]. Calcium imaging data processors were mutually blinded to the experimental operator to reduce selection and bias.
2.11. Statistical Analysis
All data were presented as mean ± standard error of the mean (S.E.M). Statistical analyses were performed using GraphPad Prism 8.0 software (GraphPad Software, Inc., La Jolla, CA, USA). Figures were prepared with bioRender (https://BioRender.com), GraphPad Prism 8.0. Two-tailed unpaired or paired t tests were used to compare the two groups. Multiple groups were compared using one-way ANOVA or two-way ANOVA followed by Bonferroni post hoc tests. Data that did not conform to a normal distribution were analyzed using non-parametric tests. The number of mice and the statistical tests used for individual experiments were included in the Fig. legends. p < 0.05 was considered statistically significant in all tests.
3. Results
3.1. Effects of TENS ST36 on Hind Paw Thickness and Mechanical Pain Threshold in CFA Mice
Healthy C57BL/6J mice were used to establish comorbidity models of chronic pain and anxiety induced by intraplantar injection of CFA (Figure 1A). Their littermate mice were injected with an equal dose of saline as the control group. Before CFA injection, paw thickness, mechanical pain thresholds, and the time spent in the central area were recorded as the baseline. After CFA injection, paw thickness and mechanical pain thresholds were assessed. Mechanical pain thresholds were measured on days 1, 3, 5, and 7 after TENS (Figure 1A). On day 7, paw thickness was measured and open - field tests were conducted. Additionally, paw thickness and mechanical pain thresholds were recorded in each group on day 14. TENS stimulation was applied to the right ST36 acupoint using a HANS - 200A. The stimulation parameters were set as follows: 10 Hz, 0.5 mA, or 2.0 mA, 10 minutes per session, once a day, for 7 days (Figure 1A and Figure 1B).
The hind paw thickness and mechanical pain threshold of mice in each group were observed, as shown in Figure 1. There was no significant difference in the baseline between the groups. The paw swelling of mice in each group was obvious after CFA injection (Figure 1C). Moreover, mechanical hyperalgesia was observed in CFA mice, and the mechanical pain threshold decreased significantly (Figure 1D).
After 7 days of TENS intervention, compared with the CFA group, the paw thickness in the 0.5 mA TENS group decreased significantly, while that in the 2.0 mA TENS group did not show a significant decrease (Figure 1C). The paw thickness in the 0.5 mA TENS group was significantly lower than that in the CFA group. There was no statistically significant difference in paw thickness between the CFA group and the TENS group on day 14.
When comparing within each time - point group, the mechanical pain threshold of mice in each group showed no significant change after 1 and 3 days of TENS intervention (Figure 1D). Compared with the CFA group and the 2.0 mA TENS group, the mechanical pain threshold in the 0.5 mA TENS group increased on day 5 and showed a significant increase on day 7. After the completion of the intervention, compared to the CFA group and the 2.0 mA TENS group, the mechanical pain threshold in the 0.5 mA TENS group was significantly higher on day 14. Global comparisons between groups demonstrated that the mechanical pain threshold in the 0.5 mA TENS group was significantly higher compared to the CFA and 2.0 mA TENS groups (Figure 1D).
Furthermore, the area under the curve (AUC) was employed to visually assess the impact of TENS on mechanical pain thresholds. As shown in Figure 1E, the analgesic effect was significantly more pronounced in the 0.5 mA TENS group compared with both the CFA group and the 2.0 mA TENS group. These data suggest that 0.5 mA TENS can reduce paw thickness and elevate mechanical pain thresholds in CFA mice, exhibiting a superior efficacy to that of 2.0 mA TENS.
3.2. Effects of TENS ST36 on Anxiety-Like Behaviors in CFA Mice
To assess anxiety-like behavior in mice, we employed the open field test. As illustrated in Figure 2, baseline measurements showed no significant differences across all groups. By day 7, mice in the CFA group exhibited pronounced anxiety-like behavior, demonstrating a statistically significant reduction in both time spent within the central area and the proportion of central area distance traveled relative to their baseline (Figure 2A,B,D). The 2.0 mA TENS group also displayed a significant decrease in central area time, while the 0.5 mA TENS group showed no significant change. Intergroup comparisons revealed that the CFA group spent significantly less time in the central area than the Saline group (Figure 2B). Notably, the 0.5 mA TENS group showed a significant increase in both central area time and the central area distance proportion compared to the CFA group (Figure 2B,D). Furthermore, the 0.5 mA TENS group spent significantly more time in the central area than the 2.0 mA TENS group. Total distance traveled remained consistent across all groups (Figure 2C). Collectively, these findings demonstrate that 0.5 mA TENS effectively alleviates CFA-induced anxiety-like behaviors in mice.
3.3. Responses of L4 DRG Mrgprb4-Lineage Neurons to Diverse TENS Stimulation In Vivo Ca2+ Imaging
To investigate the responses of Mrgprb4-lineage neurons to varying TENS intensities, Mrgprb4-GCaMP6s mice underwent in vivo Ca2+ imaging of L4 DRG (Figure S2A). The flow chart depicting in vivo imaging and TENS stimulation at ST36 appears in Figure S2B. Briefly, TENS activated Mrgprb4-lineage neurons across all tested intensities, with no significant difference in the response ratio ((Figure 3A,B). Compared to 0.1 mA and 0.3 mA TENS, markedly higher fluorescence intensity was observed with 0.5 mA, 1.0 mA, 1.5 mA, and 2.0 mA TENS ((Figure 3C). Furthermore, fluorescence intensity progressively increased from 0.1 mA to 0.5 mA TENS but gradually decreased from 0.5 mA to 2.0 mA TENS ((Figure 3D). Therefore, 0.5 mA emerged as the optimal intensity for activating Mrgprb4-lineage neurons. Post-experiment, L4 DRG and skin samples were harvested for immunofluorescence staining. As Figure 3E illustrates, Mrgprb4-lineage neurons and positive neurons and/or fibers were observed in both the L4 DRG and the hairy skin, confirming the successful establishment of the Mrgprb4-GCaMP6s mouse model.
3.4. Effects of Mrgprb4-Lineage Neurons Activated by Blue Light on Hind Paw Thickness and Mechanical Pain Threshold of CFA Mice
Healthy Mrgprb4Cre; RosaChR2-eYFP mice underwent a 3-day adaptation period, followed by a subcutaneous injection of 25 μl CFA into their right plantar. ChR2-eYFP expression was specific to Mrgprb4-lineage neurons (Figure S3C). To simulate TENS, blue light (473 nm, 30 mW, 10 Hz, 10 min/day) irradiated the ST36 acupoint. Mechanical pain thresholds were assessed on days 1, 3, 5, and 7 post-light exposure (Figure 4A). Baseline thresholds showed no significant difference between groups, and paw swelling was evident in all mice after modeling (Figure 4B). Intraplantar CFA injection induced mechanical hyperalgesia, significantly lowering the mechanical pain threshold, whereas saline injection caused no significant change (Figure 4C). Following seven days of blue light intervention, paw thickness significantly decreased in the blue light group compared to the CFA group (Figure 4B); however, by day 14, paw thickness in the blue light group significantly increased relative to the CFA group (Figure 4B). Within time points, the blue light group exhibited a trend towards an elevated mechanical pain threshold on day 3 and significant increases on days 5 and 7 compared to the CFA group (Figure 4C). Post-intervention, the blue light group also showed a significantly increased mechanical pain threshold on day 14 compared to the CFA group. Overall, global comparisons confirmed the mechanical pain threshold was significantly higher in the blue light group versus CFA groups (Figure 4C). Furthermore, AUC analysis visually demonstrated blue light’s significant analgesic effect relative to the CFA group (Figure 4D). These findings indicate that blue light activation of Mrgprb4 lineage neurons reduces paw thickness and elevates mechanical pain thresholds in CFA-treated mice.
3.5. Effects of Mrgprb4-Lineage Neuron Activated by Blue Light on Anxiety-Like Behaviors of CFA Mice
As shown in Figure 5, there was no significant difference in Baseline among all groups. On day 7, compared with the Baseline, the CFA group exhibited anxiety-like behaviors, with a statistically significant decrease in the time spent in the central area (Figure 5A-B). Comparison among groups showed that time in central area in the CFA group was significantly reduced compared with the Saline group (Figure 5B). Compared with the CFA group, the time in central area of the Blue light group was significantly increased (Figure 5B). There was no significant difference observed in either the total distance of motion or the proportion of the central area to the total distance (Figure 5C-D). These data indicate that Blue light could relieve the anxiety-like behaviors associated with CFA mice.
3.6. Effects of Virus Ablation of Mrgprb4-Lineage Neurons on Hind Paw Thickness and Mechanical Pain Threshold of CFA Mice
To evaluate the impact of DRG Mrgprb4-lineage neurons on mechanical pain thresholds and anxiety-like behaviors, after seven days of adaptive feeding, we first generated Mrgprb4Cre; RosaChR2-EYFP mice. This involved intrathecal injection of a Cre-dependent taCasp3 virus to ablate Mrgprb4-lineage neurons, creating ABL mice (Figure 6A). Littermate control (CON) mice received an equivalent volume of 0.9% saline (Figure 6A). Subsequently, TENS and behavioral testing commenced in both ABL and CON mice at least 21 days post-intrathecal surgery (Figure 6B). Immunofluorescence staining assessed the expression of Mrgprb4-lineage neurons and fibers within the L3-L5 DRGs and ST36 regions of these mice. Strikingly, immunofluorescence revealed a significant reduction in Mrgprb4-lineage neurons within the L3-L5 DRGs of ABL mice compared to CON mice. Ablation efficiency reached 45.97%, 47.55%, and 44.27% (Figure S3A-B). Furthermore, Mrgprb4-positive fiber density in the ST36 region skin of ABL mice appeared strikingly low (Figure S3C). These results confirm the successful generation of the ABL mouse.
The effects of 0.5 mA TENS applied at ST36 on paw thickness and mechanical pain threshold in ABL and CON mice are depicted in Figure 6C-E. Mechanical pain thresholds were assessed on days 1, 3, 5, and 7 post-TENS administration ((Figure 6C). Baseline measurements revealed no significant intergroup differences (Figure 6D-E). Following modeling, all groups developed marked paw swelling (Figure 6D) and exhibited significantly reduced mechanical pain thresholds ((Figure 6E). After 7 days of TENS intervention, the CON+CFA+0.5 mA TENS group showed significantly diminished paw thickness compared to the CON+CFA group (Figure 6D). Similarly, the ABL+CFA+0.5 mA TENS group demonstrated substantially lower paw thickness than the ABL+CFA group (Figure 6D). However, the ABL+CFA+0.5 mA TENS group displayed significantly greater hind paw swelling than the CON+CFA+0.5 mA TENS group (Figure 6D). By day 14, the CON+CFA+0.5 mA TENS group maintained significantly reduced paw thickness relative to the CON+CFA group (Figure 6D). Concurrently, the ABL+CFA+0.5 mA TENS group continued to exhibit significantly more pronounced swelling than the CON+CFA+0.5 mA TENS group (Figure 6D). Compared within each time point group, the mechanical pain threshold of mice in each group had no significant change after day 1 and 3 of intervention (Figure 6E). Compared with the CON+CFA group, the mechanical pain threshold in the CON+CFA+0.5 mA TENS group was significantly increased on day 5 and 7 of intervention (Figure 6E). Compared with ABL+CFA group, the mechanical pain threshold of ABL+CFA+0.5 mA TENS group had no significant change on day 5, whereas an increasing trend was observed on day 7 (Figure 6E, P=0.08). After the completion of the intervention, there was no significant change in mechanical pain threshold on day 14 (Figure 6E). Global comparisons between groups demonstrated that the mechanical pain threshold in the CON+CFA+0.5 mA TENS group was significantly increased compared to the CON+CFA group (Figure 6E). Compared with the ABL+CFA group, the mechanical pain threshold of ABL+CFA+0.5 mA TENS group tended to be increased (Figure 6E,p=0.07). Compared with the CON+CFA+0.5 mA TENS group, the mechanical pain threshold of the ABL+CFA+0.5 mA TENS group was significantly decreased (Figure 6E). Furthermore, AUC was employed to visually evaluate the impact of Mrgprb4-lineage neurons ablation on mechanical pain thresholds as shown in Figure 6F-G. There was no statistically significant difference in the AUC between the CON+CFA group and the ABL+CFA group, indicating that ablation of Mrgprb4-lineage neurons had no substantial impact on the CFA model (Figure 6F). Compared with the CON+CFA+0.5 mA TENS group, the analgesic effect was significantly attenuated in the ABL+CFA+0.5 mA TENS group (Figure 6G). These data suggest that the analgesic efficacy of 0.5 mA TENS is compromised following the ablation of Mrgprb4-lineage neurons.
3.7. Effects of Virus Ablation of Mrgprb4-Lineage Neurons on Anxiety-Like Behaviors in CFA Mice
As shown in Figure 7, Baseline measurements revealed no significant differences among all groups. By day 7, relative to Baseline, the CON+CFA group demonstrated pronounced anxiety-like behaviors, evidenced by a statistically significant decrease in both the time spent in the central area and the proportion of central area to total distance (Figure 7A-B, 7D). In contrast, the ABL+CFA group showed a significant decrease only in central area time, while the proportion of central area distance exhibited a tendency to increase (Figure 7A-B, 7D). Compared to the CON+CFA group, the CON+CFA+0.5 mA TENS group displayed a significantly increased central area residence time. Furthermore, relative to the ABL+CFA group, the ABL+CFA+0.5 mA TENS group exhibited a tendency towards increased central area time (Figure 7B, p=0.058). However, the central area time in the ABL+CFA+0.5 mA TENS group was not significantly increased compared to the CON+CFA+0.5 mA TENS group. Compared to the CON+CFA group, the proportion of central area distance to total distance was significantly increased in the CON+CFA+0.5 mA TENS group (Figure 7D). Importantly, the total distance traveled showed no statistical differences across any groups (Figure 7C). Collectively, these findings indicate that viral ablation of Mrgprb4-lineage neurons abolished the ability of TENS to alleviate anxiety-like behaviors.
4. Discussion
This study employed transgenic mice and a CFA-induced model of chronic pain and anxiety comorbidity. Utilizing in vivo Ca2+ imaging, genetic manipulation, viral strategies, and behavioral assessments, our research demonstrated that 0.5 mA TENS applied to ST36 significantly ameliorated both pain and anxiety-like behaviors in the comorbidity model. Simultaneously, in vivo Ca2+ imaging confirmed a substantial proportion of Mrgprb4-lineage neurons were activated by this specific TENS intensity. Photostimulation targeting ST36 replicated these analgesic and anxiolytic effects by selectively activating Mrgprb4-lineage neurons. Conversely, viral ablation of these neurons markedly attenuated the analgesic benefits of 0.5 mA TENS and failed to alleviate anxiety-like behaviors. Collectively, these findings indicate that the therapeutic regulation of chronic pain and anxiety comorbidity by 0.5 mA TENS critically requires the functional involvement of Mrgprb4-lineage neurons.
TENS is a non-invasive therapy applied to the skin surface, delivering appropriate intensity and frequency electrical currents through electrodes attached to the patient’s skin. This stimulates the nervous system to produce therapeutic effects [33,34]. TENS produces acupuncture-like effects, sharing similar underlying mechanisms with acupuncture. While TENS activates Aβ, Aδ, and C fibers, the specific fiber types engaged depend critically on the stimulation frequency and intensity [35,36,37,38]. Research demonstrates that low-frequency TENS primarily activates C fibers [37], whereas high-frequency TENS (90-130 Hz) mainly stimulates Aβ fibers [38]. Han Qingjian et al. confirmed that high-frequency (100 Hz) TENS selectively activates Aβ fibers [39]. TENS demonstrates remarkable efficacy in alleviating chronic pain conditions like inflammatory pain, low back pain, postoperative incisional pain, and fibromyalgia, without significant adverse effects even during long-term use [17,18,20,21,22]. Pain relief often occurs immediately following TENS treatment, with the analgesic effect persisting for several hours [40]. Notably, low-frequency (10 Hz) TENS exhibits a markedly more prolonged analgesic effect compared to high-frequency (130 Hz) TENS [19]. Furthermore, 0.5 mA EA demonstrates superior efficacy in alleviating inflammatory edema and hyperalgesia [41]. Additionally, early research has confirmed the effectiveness of TENS in treating anxiety disorders during and after surgery [24,25,26]. The ST36 acupoint is commonly used for treating pain and anxiety disorders. TENS stimulation at the ST36 acupoint can significantly alleviate postoperative opioid analgesic requirement and opioid-related side effects [27,42]. Therefore, TENS holds significant clinical application potential and value in the treatment of chronic pain comorbid with anxiety.
The CFA-induced inflammatory pain model is the most commonly used animal model for studying comorbidity of chronic pain and anxiety [43,44]. This model can induce persistent mechanical pain sensitivity behavior by subcutaneous injection of CFA into the hind paw of mice [45]. Studies have shown that mice injected with CFA exhibited anxiety-like behaviors on the 7th day, primarily manifested as a notable reduction in the time spent in the central area during an open-field test [46].
The analgesic effects of TENS may be mediated through the gate-control theory or the endogenous analgesic system. According to the classical gate-control theory, the excitation of large-diameter afferent fibers (thick fibers) prompts substantia gelatinosa cells in the spinal dorsal horn to release inhibitory neurotransmitters. These neurotransmitters, through presynaptic inhibition of T cells, close the “gate” and thereby exert an analgesic effect. Conversely, the excitation of small-diameter afferent fibers (thin fibers) relieves the inhibition on T cells, opening the “gate” and eliciting pain [47]. TENS, developed under the guidance of this theory, is generally believed to produce its segmental analgesic effect by activating thick fibers, which in turn inhibit the transmission of nociceptive information mediated by thin fibers, leading to the closure of the “gate” [38] . However, with the deepening of understanding and technological innovations in the field of neuroscience, the mechanisms of pain modulation in the spinal cord are far more complex than what the traditional gate-control theory describes. Lu and Perl et al. discovered a specific pathway where low-threshold C-fibers regulate the input of nociceptive C-fibers through inhibitory interneurons, demonstrating that C-fibers can also close the pain “gate” [48] . In our study, utilizing in vivo Ca2+ imaging, we have demonstrated that Mrgprb4-lineage neurons are polymodal, encompassing both C-low-threshold mechanoreceptors and C-high-threshold mechanoreceptors [12]. Intriguingly, as Figure 3 reveals, Mrgprb4-lineage neurons specifically innervating the hairy skin are activated by TENS, with 0.5 mA emerging as the optimal stimulation intensity. Therefore, applying 0.5 mA TENS stimulation at the ST36 acupoint can effectively close the pain “gate” mechanism by activating Mrgprb4-lineage specific fiber terminals in the skin, thus generating a potent analgesic effect.
In addition, the analgesic effects of TENS may stem from activation of the endogenous analgesic system. TENS can stimulate the release of endogenous analgesic substances within the central nervous system, such as opioid peptides and 5-hydroxytryptamine (5-HT) [42,49,50]. Studies demonstrate that low-frequency TENS enhances the release of enkephalins and endorphins, effectively alleviating pain [49]. Furthermore, low-frequency TENS elevates 5-HT content in the spinal cord of arthritis model animals, reducing inflammation-induced mechanical hyperalgesia [50]. Low-frequency TENS effectively combats hyperalgesia by curbing the release of glutamate and substance P within the spinal dorsal horn [51,52,53,54]. Furthermore, the TENS protocol employed in this experiment utilized repeated stimulation; continuous application over 7 days yielded significant and remarkably long-lasting analgesic effects [55,56].
Dopamine (DA) plays a crucial regulatory role in reward processing, modulation of pain perception, and the pathophysiological mechanisms underlying affective disorders [57]. Reduced synthesis or dysfunction of DA can lead to anxiety-like behaviors [57]. Studies have demonstrated the presence of synaptic connections between Mrgprb4-lineage neurons and spinoparabrachial (SPB) neurons that express G protein-coupled receptor 83 (Gpr83) [14,58] . Abdus-Saboor I et al. found that blue light activation of Mrgprb4 lineage neurons conveys sensory information through Gpr83+ SPB to the parabrachial nucleus and ultimately reaches the nucleus accumbens, triggering DA release and inducing lordosis-like posture in female mice to facilitate mounting by male mice [14] . Inactivation of Mrgprb4-lineage neurons, however, converts mating behavior into aggressive behavior and is associated with decreased DA release. Additionally, chemogenetic activation of Mrgprb4 neurons induces conditioned place preference in mice, indicating that such activation has positive reinforcing or anti-anxiety effects [59,60]. Notably, activated Mrgprb4-lineage neurons are integral to the brain’s reward circuitry. Consequently, applying 0.5 mA TENS at ST36 effectively alleviates anxiety-like behaviors induced by CFA injection through the activation of Mrgprb4-lineage neurons, thereby inducing dopamine release in the nucleus accumbens. Our findings reveal that ablating Mrgprb4-lineage neurons diminishes TENS’s anti-anxiety effects, demonstrating that these neurons play a crucial role in mediating TENS’s therapeutic action against anxiety.
5. Conclusion
Based on compelling evidence that polymodal Mrgprb4-lineage neurons mediate pleasant sensation, this study further reveals these neurons mediate the regulatory effects of TENS at ST36 on comorbid chronic pain and anxiety (Figure 8). These results offer valuable novel insights and references for therapeutic targets addressing these co-occurring disorders and may significantly improve clinical efficacy.
Limitations of the Study
Future studies will delve deeper into how TENS at ST36 modulates the thermal pain threshold in CFA mice. Moreover, our paradigm’s in vivo calcium imaging currently lacks the millisecond-level temporal resolution needed to capture neuronal encoding characteristics during TENS stimuli. This study establishes that the regulatory effect of TENS ST36 on chronic pain and anxiety comorbidity critically depends on polymodal Mrgprb4-lineage neurons. Consequently, future research must elucidate the intrinsic mechanisms connecting chronic pain pathogenesis with anxiety, thereby clarifying TENS’s therapeutic mechanisms and pinpointing potential molecular targets for its application in comorbidity of chronic pain and anxiety.
Supplementary Materials
The following supporting information can be downloaded at the website of this paper posted on Preprints.org.
Author Contributions
K.L., B.Z., and X.Y.G. conceived and designed the research. L.H.D., H.Y.C and K.L. drafted and revised the manuscript. L.H.D., H.Y.C, H.S., and X.L. performed the experiments. L.H.D., J.M.Z. and H.S. helped to analyze the data and interpreted the results of the experiments. L.H.D. and J.M.Z. prepared the Figs. X.Y.G., Y.L., and K.L. set up an experimental platform for calcium imaging. S.Y.W was in charge of the genetic mouse. All authors approved the final edited version of the manuscript.
Funding
This work was supported by the National Natural Science Foundation of China No. 82174513, 82230123, the Scientific and Technological Innovation Project of China Academy of Chinese Medical Sciences (No. CIZJS2025016) and the Fundamental Research Funds for the Central public welfare research institutes No. ZZ-JQ2023003.
Institutional Review Board Statement
Ethics approval and consent to participate. This protocol was approved by All experimental procedures were reviewed and approved by the Animal Ethics Committee, Institute of Acupuncture and Moxibustion, China Academy of Chinese Medical Sciences (Approval number: Y2020-04-09-7).
Consent for Publication
We declare that the Publisher has the Authors’ permission to publish the relevant contribution.
Data Availability Statement
All the data supporting the findings of this study are available within the article and from the corresponding author upon reasonable request.
Acknowledgments
We thank China Shanghai Model Organisms Center, Inc. for supporting and maintaining the transgenic mice. Special thanks to BioRender.com for providing the platform to create the schematic figures in this study. Figure.8 created in BioRender. Cheng, H. (2026) https://BioRender.com/o04hmz0.
Conflicts of Interest
K.L serves as a member of the Youth Editorial Board of Chinese Medicine. The author was not involved in the review or decision-making process for this manuscript. The authors declare no other conflicts of interest.
Abbreviations
| TRPV1 | Transient receptor potential vanilloid 1 |
| EA | Electroacupuncture |
| CFA | Complete Freund’s Adjuvant |
| Mrgprb4 | Mas-related G-protein-coupled receptor b4 |
| TENS | Transcutaneous electrical nerve stimulation |
| ST36 | Zusanli |
| DRG | Dorsal root ganglia |
| AUC | Area under the curve |
| 5-HT | 5-hydroxytryptamine |
| DA | Dopamine |
| SPB | Spinoparabrachial |
| Gpr83 | G protein-coupled receptor 83 |
References
- Price, D.D. Psychological and neural mechanisms of the affective dimension of pain. Science 2000, 288, 1769–1772. [Google Scholar] [CrossRef] [PubMed]
- Bouhassira, D. Neuropathic pain: Definition, assessment and epidemiology. Rev Neurol (Paris) 2019, 175, 16–25. [Google Scholar] [CrossRef] [PubMed]
- Bandelow, B. Generalized Anxiety Disorder and Pain. Mod Trends Pharmacopsychiatry 2015, 30, 153–165. [Google Scholar] [CrossRef]
- Velly, A.M.; Mohit, S. Epidemiology of pain and relation to psychiatric disorders. Prog Neuropsychopharmacol Biol Psychiatry 2018, 87, 159–167. [Google Scholar] [CrossRef]
- Tsang, A.; Von Korff, M.; Lee, S.; Alonso, J.; Karam, E.; Angermeyer, M.C.; Borges, G.L.; Bromet, E.J.; Demytteneare, K.; de Girolamo, G.; et al. Common chronic pain conditions in developed and developing countries: gender and age differences and comorbidity with depression-anxiety disorders. J Pain 2008, 9, 883–891. [Google Scholar] [CrossRef] [PubMed]
- Jones, J.; Correll, D.J.; Lechner, S.M.; Jazic, I.; Miao, X.; Shaw, D.; Simard, C.; Osteen, J.D.; Hare, B.; Beaton, A.; et al. Selective Inhibition of Na(V)1.8 with VX-548 for Acute Pain. N Engl J Med 2023, 389, 393–405. [Google Scholar] [CrossRef] [PubMed]
- Mecum, N.E.; Russell, R.; Lee, J.; Sullivan, C.; Meng, I.D. Optogenetic Inhibition of Nav1.8 Expressing Corneal Afferents Reduces Persistent Dry Eye Pain. Invest Ophthalmol Vis Sci 2021, 62, 15. [Google Scholar] [CrossRef] [PubMed]
- Zhang, B.Y.; Zhang, Y.L.; Sun, Q.; Zhang, P.A.; Wang, X.X.; Xu, G.Y.; Hu, J.; Zhang, H.H. Alpha-lipoic acid downregulates TRPV1 receptor via NF-κB and attenuates neuropathic pain in rats with diabetes. CNS Neurosci Ther 2020, 26, 762–772. [Google Scholar] [CrossRef]
- Barton, N.J.; McQueen, D.S.; Thomson, D.; Gauldie, S.D.; Wilson, A.W.; Salter, D.M.; Chessell, I.P. Attenuation of experimental arthritis in TRPV1R knockout mice. Exp Mol Pathol 2006, 81, 166–170. [Google Scholar] [CrossRef]
- Cavanaugh, D.J.; Lee, H.; Lo, L.; Shields, S.D.; Zylka, M.J.; Basbaum, A.I.; Anderson, D.J. Distinct subsets of unmyelinated primary sensory fibers mediate behavioral responses to noxious thermal and mechanical stimuli. Proc Natl Acad Sci U S A 2009, 106, 9075–9080. [Google Scholar] [CrossRef]
- Liao, H.Y.; Lin, Y.W. Electroacupuncture Attenuates Chronic Inflammatory Pain and Depression Comorbidity through Transient Receptor Potential V1 in the Brain. Am J Chin Med 2021, 49, 1417–1435. [Google Scholar] [CrossRef]
- Du, L.; Cheng, H.; Cui, X.; Cao, Q.; Li, X.; Wang, S.; Wang, X.; Liu, Y.; Zhu, B.; Gao, X.; et al. Mrgprb4-lineage neurons indispensable in pressure induced pleasant sensation are polymodal. iScience 2025, 28, 111940. [Google Scholar] [CrossRef]
- Kun Liu, B.Z. Significance of pleasant touch and state-of-the-art neuroscience technologies in acupuncture research. Acupuncture and Herbal Medicine 2023, 3, 55–58. [Google Scholar]
- Elias, L.J.; Succi, I.K.; Schaffler, M.D.; Foster, W.; Gradwell, M.A.; Bohic, M.; Fushiki, A.; Upadhyay, A.; Ejoh, L.L.; Schwark, R.; et al. Touch neurons underlying dopaminergic pleasurable touch and sexual receptivity. Cell 2023, 186, 577–590.e516. [Google Scholar] [CrossRef]
- Hylands-White, N.; Duarte, R.V.; Raphael, J.H. An overview of treatment approaches for chronic pain management. Rheumatol Int 2017, 37, 29–42. [Google Scholar] [CrossRef]
- Rocchio, R.J.; Ward, K.E. Intranasal Ketamine for Acute Pain. Clin J Pain 2021, 37, 295–300. [Google Scholar] [CrossRef] [PubMed]
- Dailey, D.L.; Vance, C.G.T.; Rakel, B.A.; Zimmerman, M.B.; Embree, J.; Merriwether, E.N.; Geasland, K.M.; Chimenti, R.; Williams, J.M.; Golchha, M.; et al. Transcutaneous Electrical Nerve Stimulation Reduces Movement-Evoked Pain and Fatigue: A Randomized, Controlled Trial. Arthritis Rheumatol 2020, 72, 824–836. [Google Scholar] [CrossRef] [PubMed]
- Dailey, D.L.; Rakel, B.A.; Vance, C.G.T.; Liebano, R.E.; Amrit, A.S.; Bush, H.M.; Lee, K.S.; Lee, J.E.; Sluka, K.A. Transcutaneous electrical nerve stimulation reduces pain, fatigue and hyperalgesia while restoring central inhibition in primary fibromyalgia. Pain 2013, 154, 2554–2562. [Google Scholar] [CrossRef] [PubMed]
- Sabino, G.S.; Santos, C.M.; Francischi, J.N.; de Resende, M.A. Release of endogenous opioids following transcutaneous electric nerve stimulation in an experimental model of acute inflammatory pain. J Pain 2008, 9, 157–163. [Google Scholar] [CrossRef]
- DeSantana, J.M.; Santana-Filho, V.J.; Guerra, D.R.; Sluka, K.A.; Gurgel, R.Q.; da Silva, W.M., Jr. Hypoalgesic effect of the transcutaneous electrical nerve stimulation following inguinal herniorrhaphy: a randomized, controlled trial. J Pain 2008, 9, 623–629. [Google Scholar] [CrossRef]
- Osiri, M.; Welch, V.; Brosseau, L.; Shea, B.; McGowan, J.; Tugwell, P.; Wells, G. Transcutaneous electrical nerve stimulation for knee osteoarthritis. Cochrane Database Syst Rev 2000, Cd002823. [Google Scholar] [CrossRef]
- Schuster, G.D.; Infante, M.C. Pain relief after low back surgery: the efficacy of transcutaneous electrical nerve stimulation. Pain 1980, 8, 299–302. [Google Scholar] [CrossRef]
- Tanaka, M.; Vécsei, L. From Lab to Life: Exploring Cutting-Edge Models for Neurological and Psychiatric Disorders. Biomedicines 2024, 12. [Google Scholar] [CrossRef] [PubMed]
- Cebalo, N.; Negovetić Vranić, D.; Bašić Kes, V. The Effect of Transcutaneous Electric Nerve Stimulation (TENS) on Anxiety and Fear in Children Aged 9-14 Years. Acta Stomatol Croat 2020, 54, 412–419. [Google Scholar] [CrossRef] [PubMed]
- Ferrara, J.; Stamey, W.; Strutt, A.M.; Adam, O.R.; Jankovic, J. Transcutaneous electrical stimulation (TENS) for psychogenic movement disorders. J Neuropsychiatry Clin Neurosci 2011, 23, 141–148. [Google Scholar] [CrossRef] [PubMed]
- Al-Zamil, M.; Minenko, I.A.; Kulikova, N.G.; Mansur, N.; Nuvakhova, M.B.; Khripunova, O.V.; Shurygina, I.P.; Topolyanskaya, S.V.; Trefilova, V.V.; Petrova, M.M.; et al. Efficiency of Direct Transcutaneous Electroneurostimulation of the Median Nerve in the Regression of Residual Neurological Symptoms after Carpal Tunnel Decompression Surgery. Biomedicines 2023, 11. [Google Scholar] [CrossRef] [PubMed]
- Chen, L.; Tang, J.; White, P.F.; Sloninsky, A.; Wender, R.H.; Naruse, R.; Kariger, R. The effect of location of transcutaneous electrical nerve stimulation on postoperative opioid analgesic requirement: acupoint versus nonacupoint stimulation. Anesth Analg 1998, 87, 1129–1134. [Google Scholar]
- Liu, B.; Qiao, L.; Liu, K.; Liu, J.; Piccinni-Ash, T.J.; Chen, Z.F. Molecular and neural basis of pleasant touch sensation. Science 2022, 376, 483–491. [Google Scholar] [CrossRef]
- Zhongren, L. China Press of Traditional Chinese Medicine. In Experimental Acupuncturology; Beijing, China, 2003. [Google Scholar]
- Gao, X.; Han, S.; Huang, Q.; He, S.Q.; Ford, N.C.; Zheng, Q.; Chen, Z.; Yu, S.; Dong, X.; Guan, Y. Calcium imaging in population of dorsal root ganglion neurons unravels novel mechanisms of visceral pain sensitization and referred somatic hypersensitivity. Pain 2021, 162, 1068–1081. [Google Scholar] [CrossRef]
- Chen, Z.; Huang, Q.; Song, X.; Ford, N.C.; Zhang, C.; Xu, Q.; Lay, M.; He, S.Q.; Dong, X.; Hanani, M.; et al. Purinergic signaling between neurons and satellite glial cells of mouse dorsal root ganglia modulates neuronal excitability in vivo. Pain 2022, 163, 1636–1647. [Google Scholar] [CrossRef]
- Liu, K.; Liu, Y.; Li, X.; Wang, S.; Wang, X.; Zhang, Z.; Gao, X. In Vivo Calcium Imaging of Dorsal Root Ganglia Neurons’ Response to Somatic and Visceral Stimuli. J Vis Exp 2024. [Google Scholar] [CrossRef]
- Lampe, G.N. Introduction to the use of transcutaneous electrical nerve stimulation devices. Phys Ther 1978, 58, 1450–1454. [Google Scholar] [CrossRef] [PubMed]
- Smith, T.J.; Wang, E.J.; Loprinzi, C.L. Cutaneous Electroanalgesia for Relief of Chronic and Neuropathic Pain. N Engl J Med 2023, 389, 158–164. [Google Scholar] [CrossRef] [PubMed]
- Masson, E.A.; Veves, A.; Fernando, D.; Boulton, A.J. Current perception thresholds: a new, quick, and reproducible method for the assessment of peripheral neuropathy in diabetes mellitus. Diabetologia 1989, 32, 724–728. [Google Scholar] [CrossRef] [PubMed]
- Reeve, A.J.; Walker, K.; Urban, L.; Fox, A. Excitatory effects of galanin in the spinal cord of intact, anaesthetized rats. Neurosci Lett 2000, 295, 25–28. [Google Scholar] [CrossRef] [PubMed]
- Dufour, A.; Guergova, S.; Pebayle, T.; Touzalin-Chretien, P. On the selective activation of unmyelinated C-fibers using sinusoidal electrical stimulation: an ERP study. Clin Neurophysiol 2011, 122, 1042–1047. [Google Scholar] [CrossRef]
- Wright, A. Exploring the evidence for using TENS to relieve pain. Nurs Times 2012, 108, 20–23. [Google Scholar] [PubMed]
- Liu, S.; Long, S.S.; Li, F.; Yang, H.; Pu, S.; Du, D.; Luo, X.; Zhang, Y.Q.; Han, Q. Neural basis of transcutaneous electrical nerve stimulation for neuropathic pain relief. Neuron 2025, 113, 3616–3631.e3616. [Google Scholar] [CrossRef] [PubMed]
- Sjölund, BH; EM, L.J. Transcutaneous and implanted electric stimulation of peripheral nerves. In Management of Pain; Lea & Febiger: Philadelphia, 1990; pp. 1852–1861 p. [Google Scholar]
- Lee, J.H.; Choi, Y.H.; Choi, B.T. The anti-inflammatory effects of 2 Hz electroacupuncture with different intensities on acute carrageenan-induced inflammation in the rat paw. Int J Mol Med 2005, 16, 99–102. [Google Scholar] [CrossRef]
- Guo Zi, W.N.; Ru, Ye; Tiancheng, Sun; Shuang, Qiu; Xiaomei, Shao; Xiaochang, Ge; Lu, Guan; Junfang, Fang; Jianqiao, Fang; Junying, Du. Map activation of various brain regions using different frequencies of electroacupuncture ST36, utilizing the Fos-CreER strategy. Acupuncture and Herbal Medicine 2024, 4, 386–398. [Google Scholar]
- Li, Y.J.; Du, W.J.; Liu, R.; Zan, G.Y.; Ye, B.L.; Li, Q.; Sheng, Z.H.; Yuan, Y.W.; Song, Y.J.; Liu, J.G.; et al. Paraventricular nucleus-central amygdala oxytocinergic projection modulates pain-related anxiety-like behaviors in mice. CNS Neurosci Ther 2023, 29, 3493–3506. [Google Scholar] [CrossRef]
- Guo, H.; Hu, W.C.; Xian, H.; Shi, Y.X.; Liu, Y.Y.; Ma, S.B.; Pan, K.Q.; Wu, S.X.; Xu, L.Y.; Luo, C.; et al. CCL2 Potentiates Inflammation Pain and Related Anxiety-Like Behavior Through NMDA Signaling in Anterior Cingulate Cortex. Mol Neurobiol 2024, 61, 4976–4991. [Google Scholar] [CrossRef]
- McCarson, K.E.; Fehrenbacher, J.C. Models of Inflammation: Carrageenan- or Complete Freund’s Adjuvant (CFA)-Induced Edema and Hypersensitivity in the Rat. Curr Protoc 2021, 1, e202. [Google Scholar] [CrossRef] [PubMed]
- Chen, J.; Song, Y.; Yang, J.; Zhang, Y.; Zhao, P.; Zhu, X.J.; Su, H.C. The contribution of TNF-α in the amygdala to anxiety in mice with persistent inflammatory pain. Neurosci Lett 2013, 541, 275–280. [Google Scholar] [CrossRef] [PubMed]
- Melzack, R.; Wall, P.D. Pain mechanisms: a new theory. Science 1965, 150, 971–979. [Google Scholar] [CrossRef] [PubMed]
- Lu, Y.; Perl, E.R. A specific inhibitory pathway between substantia gelatinosa neurons receiving direct C-fiber input. J Neurosci 2003, 23, 8752–8758. [Google Scholar] [CrossRef]
- Han, J.S. Acupuncture: neuropeptide release produced by electrical stimulation of different frequencies. Trends Neurosci 2003, 26, 17–22. [Google Scholar] [CrossRef]
- Sluka, K.A.; Lisi, T.L.; Westlund, K.N. Increased release of serotonin in the spinal cord during low, but not high, frequency transcutaneous electric nerve stimulation in rats with joint inflammation. Arch Phys Med Rehabil 2006, 87, 1137–1140. [Google Scholar] [CrossRef]
- Rokugo, T.; Takeuchi, T.; Ito, H. A histochemical study of substance P in the rat spinal cord: effect of transcutaneous electrical nerve stimulation. J Nippon Med Sch 2002, 69, 428–433. [Google Scholar] [CrossRef]
- Sluka, K.A.; Vance, C.G.; Lisi, T.L. High-frequency, but not low-frequency, transcutaneous electrical nerve stimulation reduces aspartate and glutamate release in the spinal cord dorsal horn. J Neurochem 2005, 95, 1794–1801. [Google Scholar] [CrossRef]
- Chen, Y.W.; Tzeng, J.I.; Lin, M.F.; Hung, C.H.; Hsieh, P.L.; Wang, J.J. High-frequency transcutaneous electrical nerve stimulation attenuates postsurgical pain and inhibits excess substance P in rat dorsal root ganglion. Reg Anesth Pain Med 2014, 39, 322–328. [Google Scholar] [CrossRef]
- Chen, Y.W.; Tzeng, J.I.; Lin, M.F.; Hung, C.H.; Wang, J.J. Transcutaneous electrical nerve stimulation attenuates postsurgical allodynia and suppresses spinal substance P and proinflammatory cytokine release in rats. Phys Ther 2015, 95, 76–85. [Google Scholar] [CrossRef] [PubMed]
- Sluka, K.A.; Bailey, K.; Bogush, J.; Olson, R.; Ricketts, A. Treatment with either high or low frequency TENS reduces the secondary hyperalgesia observed after injection of kaolin and carrageenan into the knee joint. Pain 1998, 77, 97–102. [Google Scholar] [CrossRef] [PubMed]
- Price, D.D.; Hu, J.W.; Dubner, R.; Gracely, R.H. Peripheral suppression of first pain and central summation of second pain evoked by noxious heat pulses. Pain 1977, 3, 57–68. [Google Scholar] [CrossRef]
- Zarrindast, M.R.; Khakpai, F. The Modulatory Role of Dopamine in Anxiety-like Behavior. Arch Iran Med 2015, 18, 591–603. [Google Scholar]
- Choi, S.; Hachisuka, J.; Brett, M.A.; Magee, A.R.; Omori, Y.; Iqbal, N.U.; Zhang, D.; DeLisle, M.M.; Wolfson, R.L.; Bai, L.; et al. Parallel ascending spinal pathways for affective touch and pain. Nature 2020, 587, 258–263. [Google Scholar] [CrossRef] [PubMed]
- Tzschentke, T.M. Measuring reward with the conditioned place preference (CPP) paradigm: update of the last decade. Addict Biol 2007, 12, 227–462. [Google Scholar] [CrossRef] [PubMed]
- Vrontou, S.; Wong, A.M.; Rau, K.K.; Koerber, H.R.; Anderson, D.J. Genetic identification of C fibres that detect massage-like stroking of hairy skin in vivo. Nature 2013, 493, 669–673. [Google Scholar] [CrossRef]
Figure 1.
Effects of TENS ST36 on hind paw thickness and mechanical pain threshold in CFA mice. A Timeline of the CFA injection, transcutaneous electrical nerve stimulation (TENS), and behavioral testing to study the analgesic and anxiolytic effects of TENS (10Hz, 0.5 mA / 2.0 mA) treatment in CFA mice. B Schematic of TENS at the ST36 sites. C Time course of TENS on hind paw thickness of CFA mice (N=12). D Time course of TENS on mechanical pain thresholds of CFA mice (N=12). Yellow shadow is used to TENS stimuli. E The AUC statistics of each group. All data are shown as mean ± S.E.M. C–D by two-way repeated measures ANOVA with Bonferroni post hoc test. Statistical symbols in different colors are represented to denote different groups. Compared with Baseline, ***p < 0.001; Compared between groups at each time point, #p < 0.05,##p < 0.01,###p < 0.001; Compared with CFA+0.5 mA TENS group, ▲▲p < 0.01,▲▲▲▲p < 0.0001. (E) by one-way repeated measures ANOVA with Bonferroni post hoc test, ##p < 0.01.
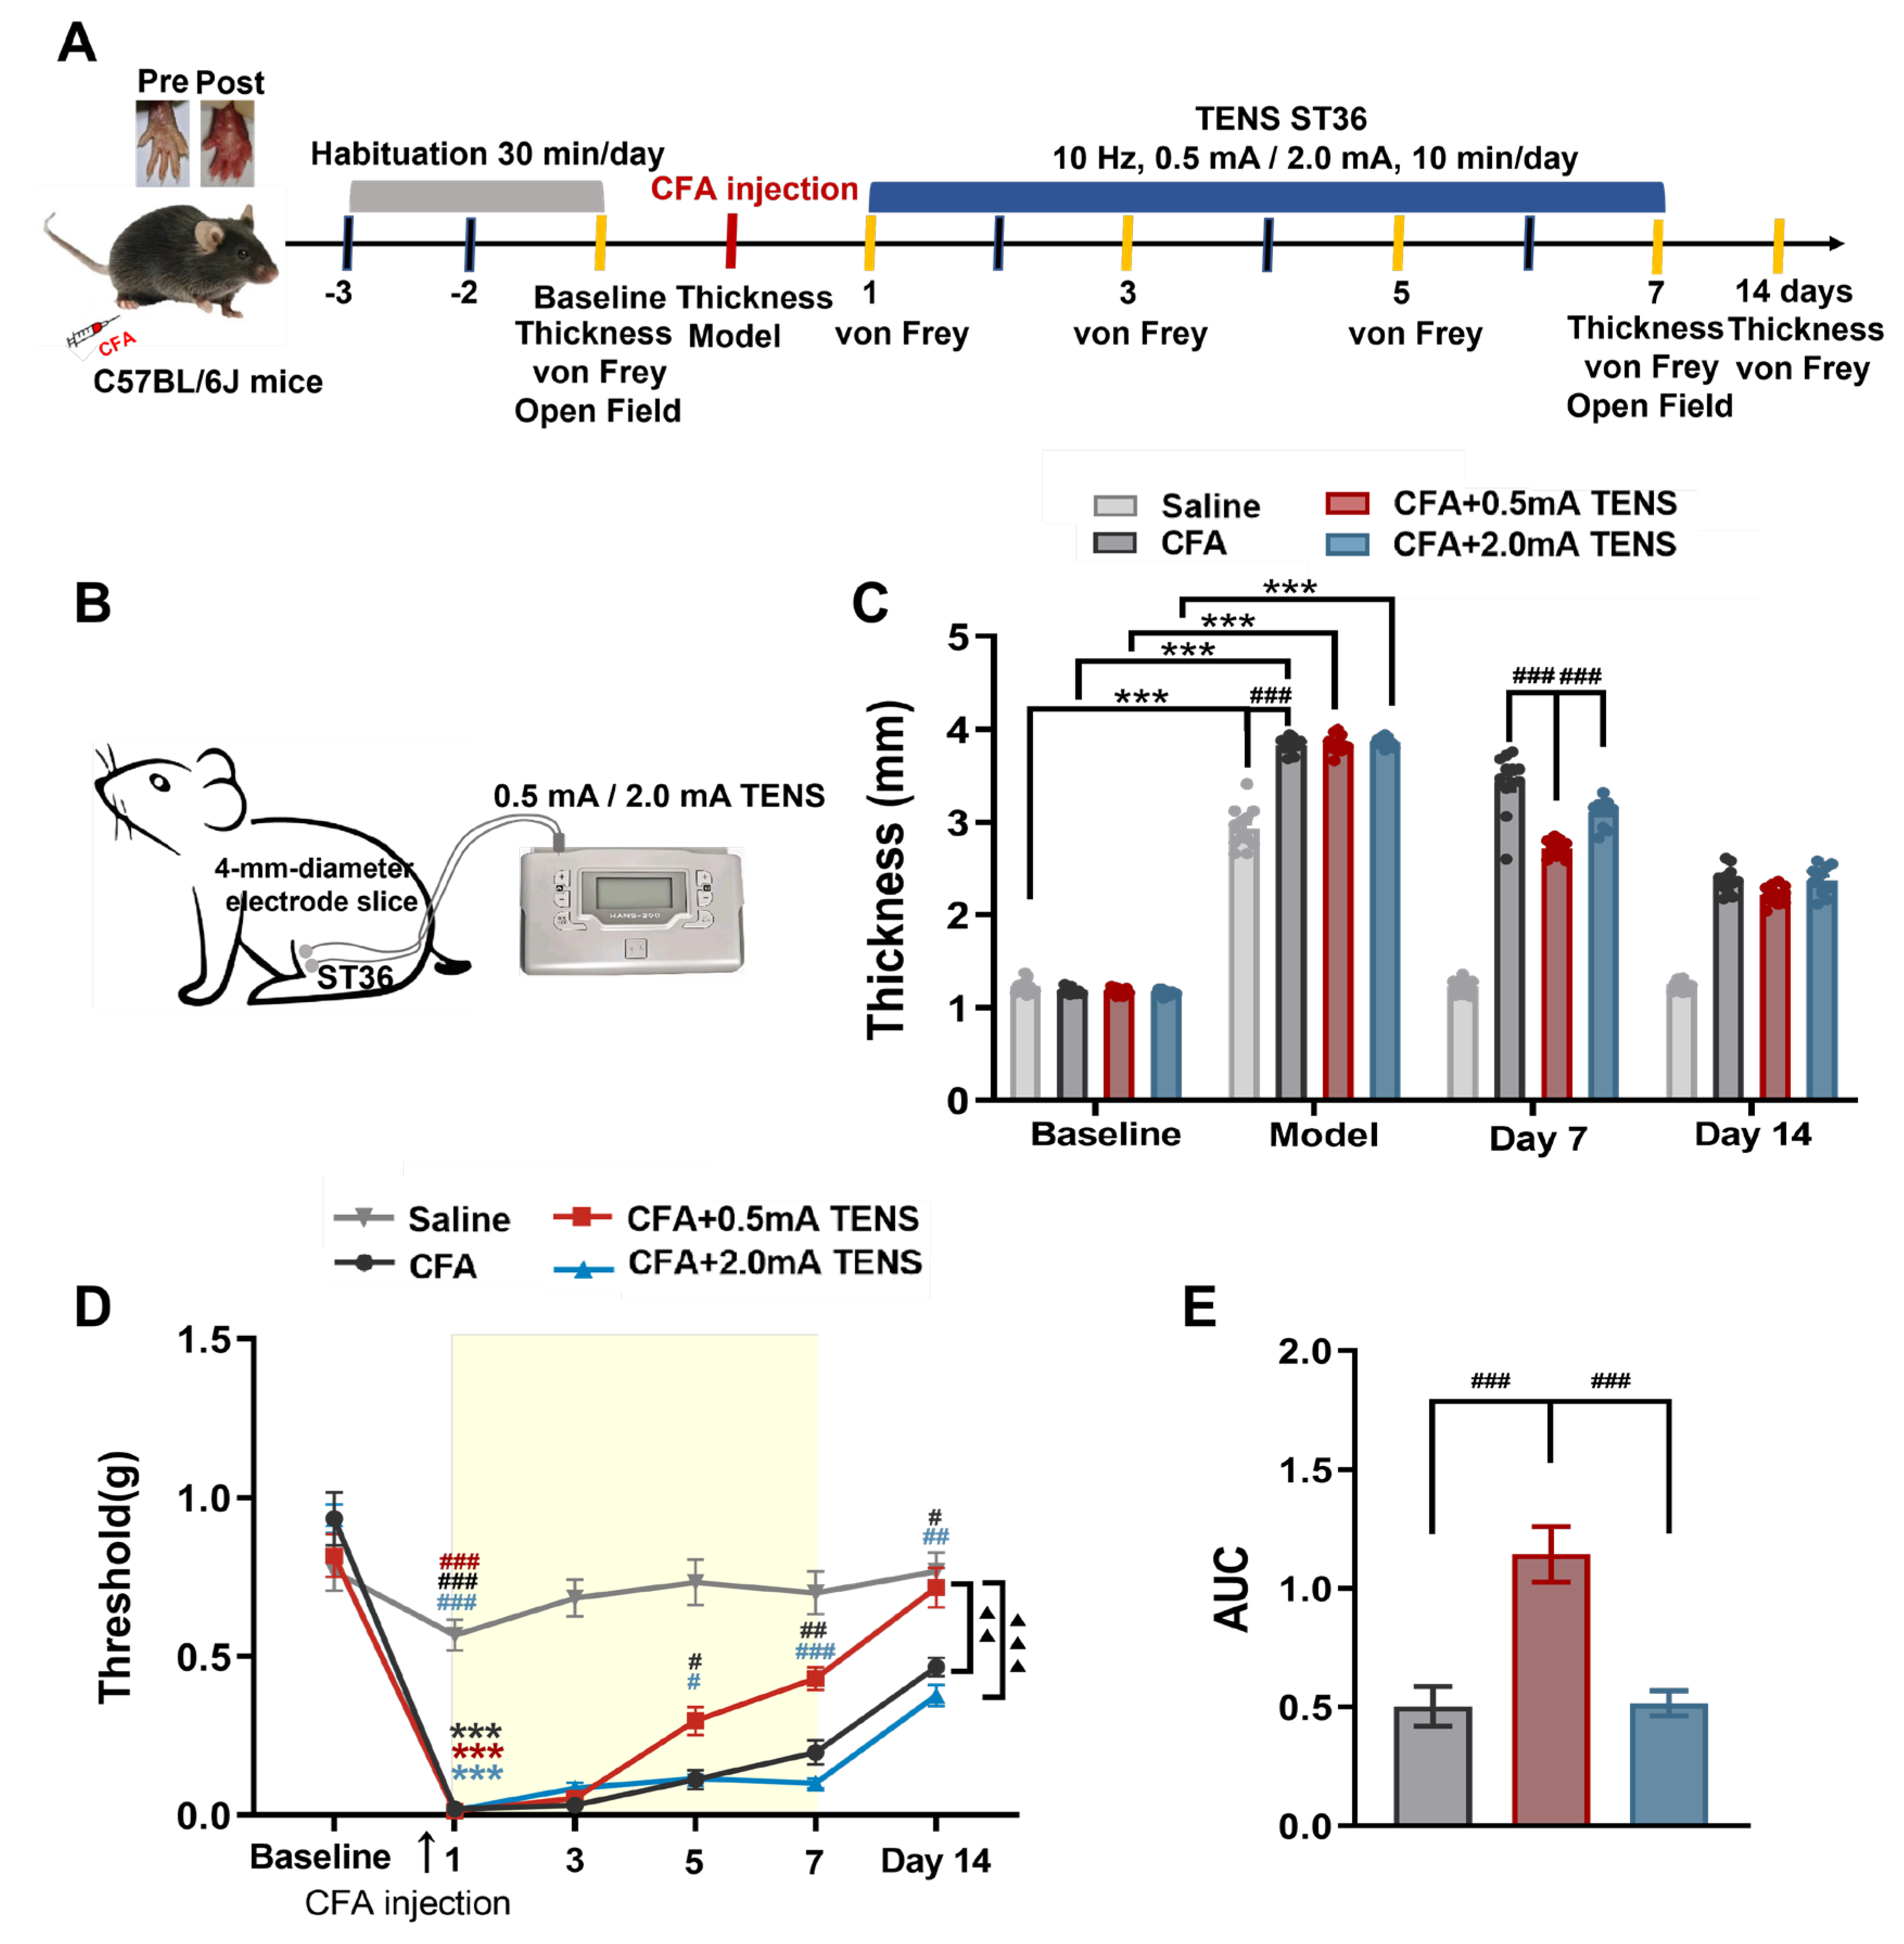
Figure 2.
Effects of TENS ST36 on anxiety-like behaviors in CFA mice. A Representative animal tracks of the four groups in the open filed test. B The time in central area of mice in each group (N=12). C The total distance of mice in each group (N=12). D The proportion of the central area to the total distance in each group of mice (N=12). All data are shown as mean ± S.E.M. B–D by two-way ANOVA with Bonferroni post hoc test. Compared within each group, *p < 0.05, ***p < 0.001; Comparisons across all groups, ##p < 0.01, ###p < 0.001.
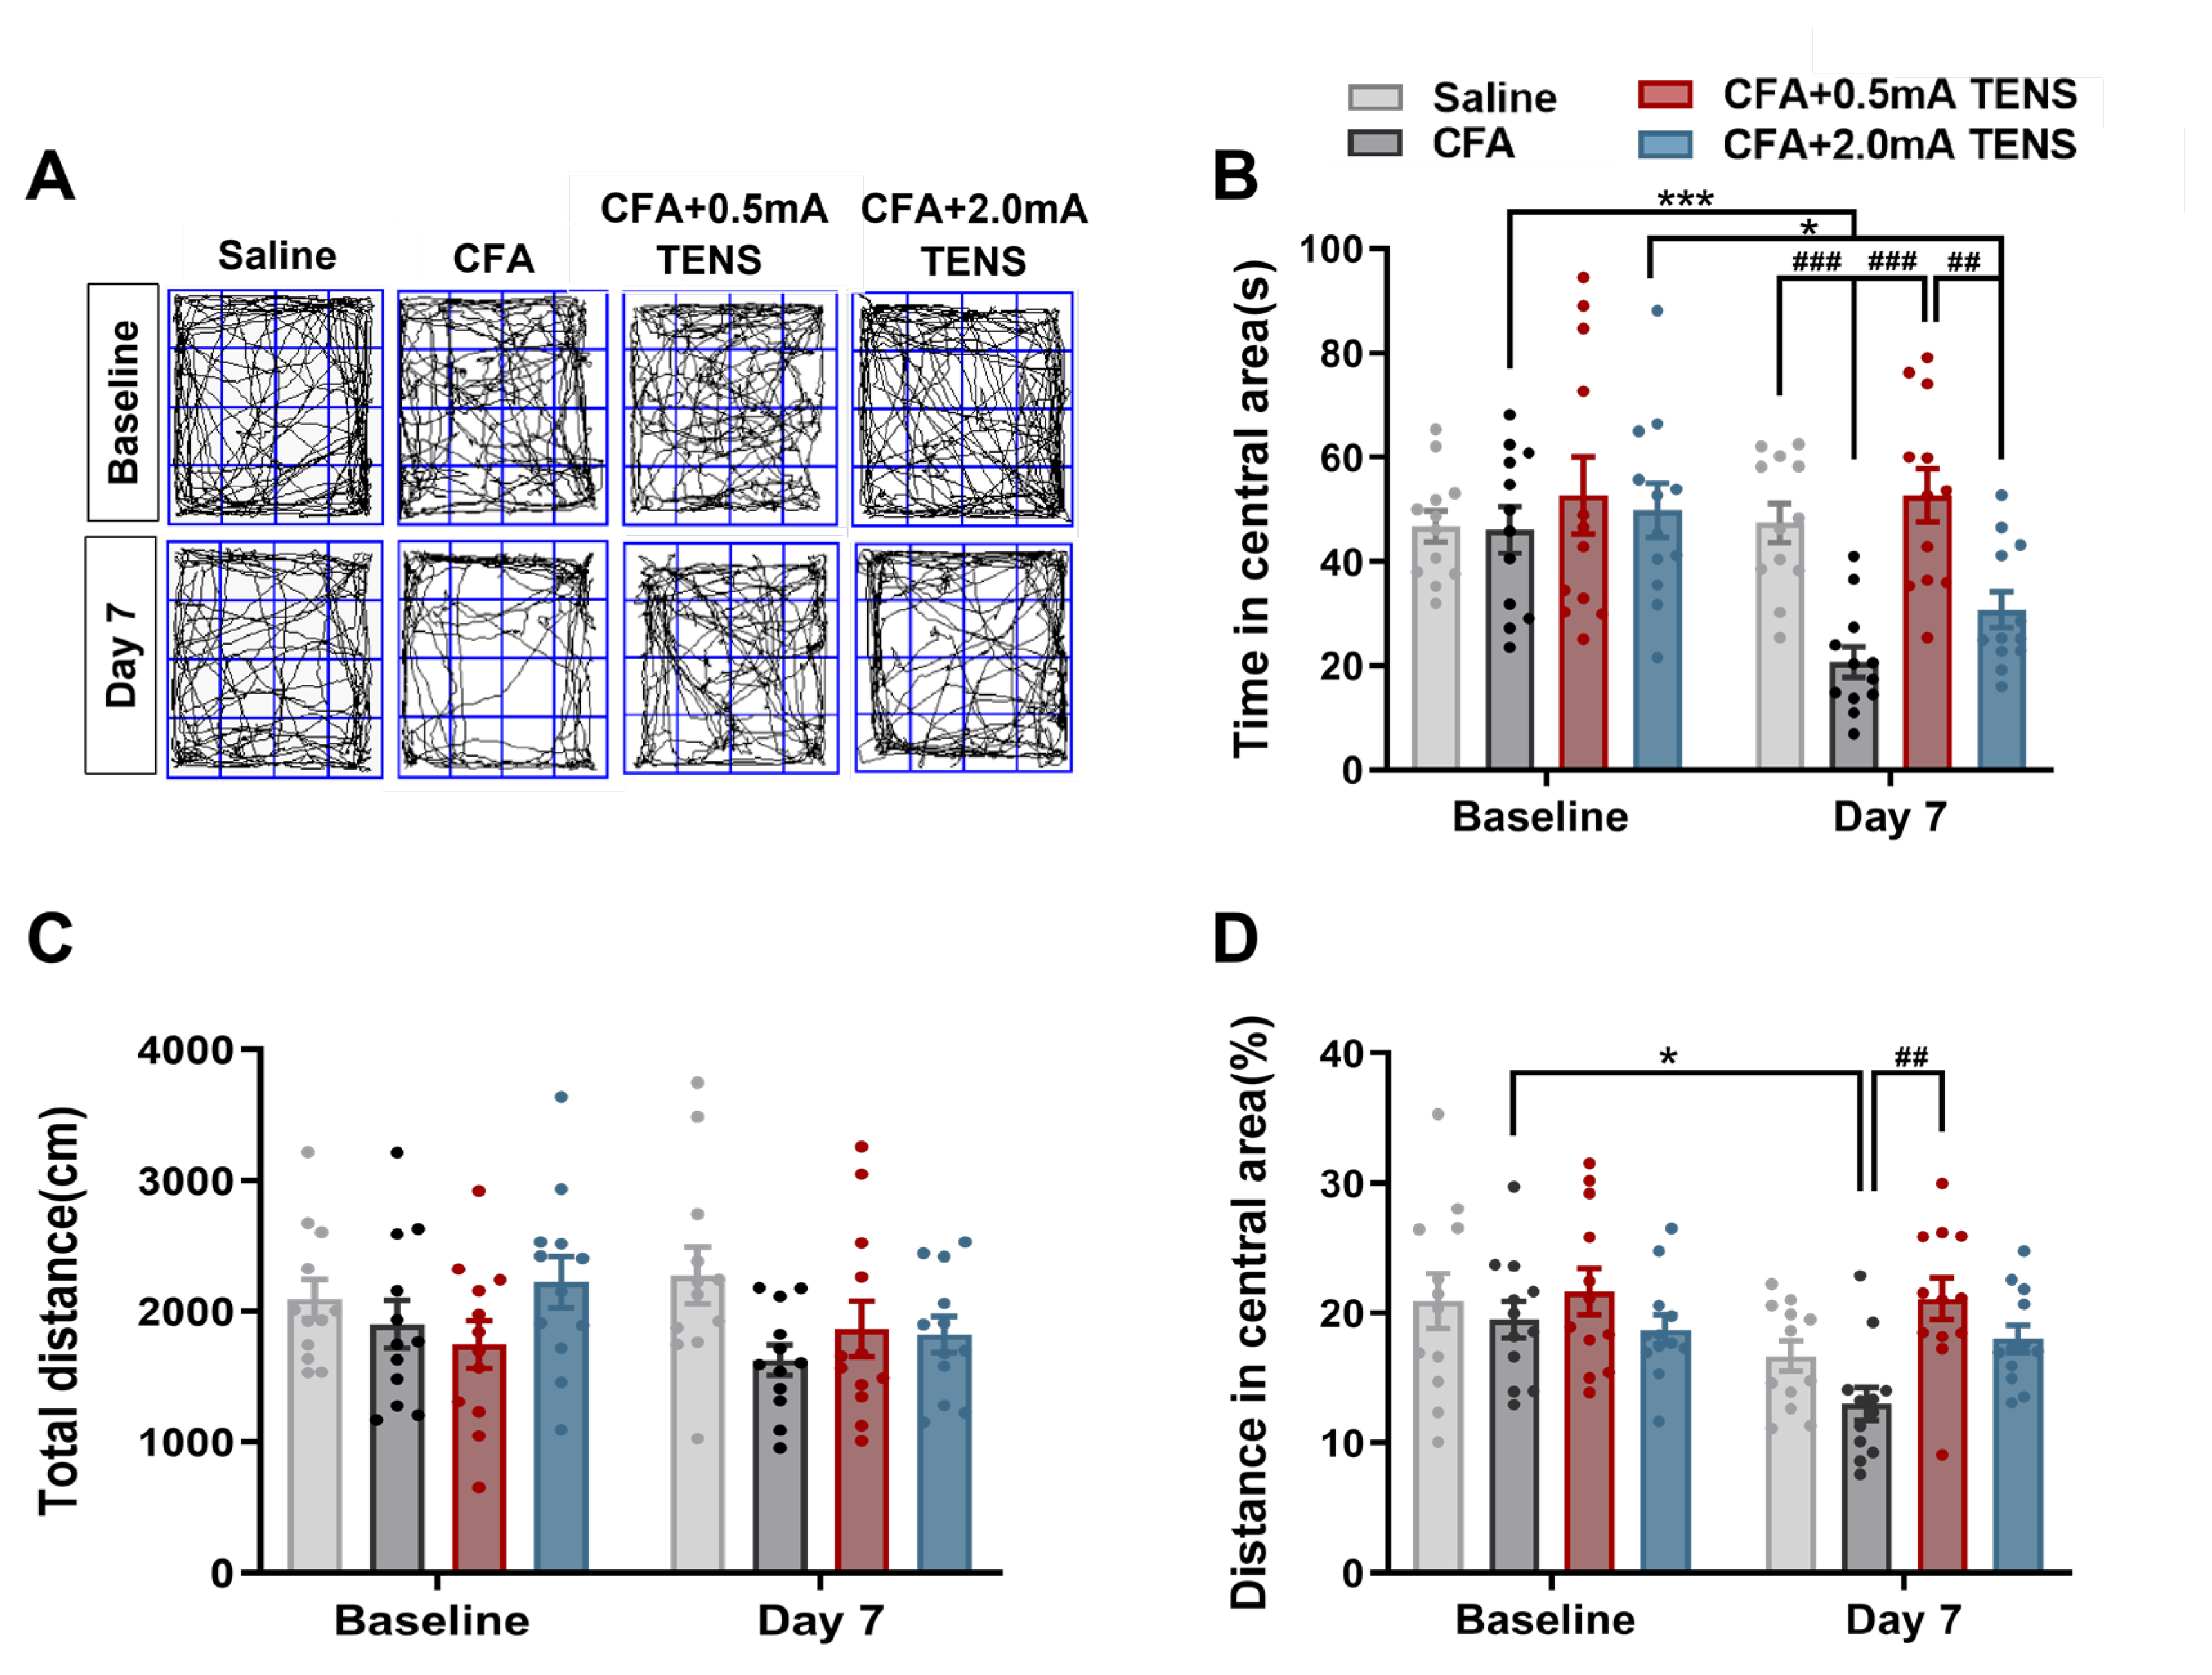
Figure 3.
Responses of L4 DRG Mrgprb4-lineage neurons to diverse TENS stimulation in vivo Ca2+ imaging. A Representative images of Mrgprb4-lineage neuronal calcium transients to TENS stimuli (0.1 mA, 0.3 mA, 0.5 mA, 1.0 mA, 1.5 mA, and 2.0 mA) observed during in vivo Ca2+ imaging of one L4 DRG (the white outline indicates the DRG border). Right: Heatmaps of calcium signals in a single mouse DRG under diverse TENS stimuli (total recorded cells = 200). The numbers of Mrgprb4-lineage neurons activated by TENS stimulation of 0.1 mA, 0.3 mA, 0.5 mA, 1.0 mA, 1.5 mA, and 2.0 mA were 94, 82, 122, 137, 124, and 85, respectively. Scale bar, 100 μm. B The proportion of Mrgprb4-lineage neurons activated by TENS stimulation at varying intensities. Each pair of open circles represents an individual mouse. N= 5 mice. C Quantification of Ca2+ responses in cells responding to diverse TENS stimuli. Violin plots show median (black lines) and data distributions. N= 5 mice (total recorded cells = 622). D Median fluorescence intensity of Mrgprb4-lineage neurons in response to TENS stimulation at varying intensities. E Representative images of GFP+ cells in the Mrgprb4Cre; RosaChR2-EYFP mice. Immunohistochemistry was performed on L4 DRG and skin from Mrgprb4Cre; RosaChR2-EYFP mice. White arrows indicate examples of GFP+ cells. Dashed lines indicate the boundary between the epidermis and dermis layers. Scale bar, 100µm. All data are shown as mean ± S.E.M. B–C by one-way repeated measures ANOVA with Bonferroni post hoc test, **p < 0.01, ***p < 0.001.
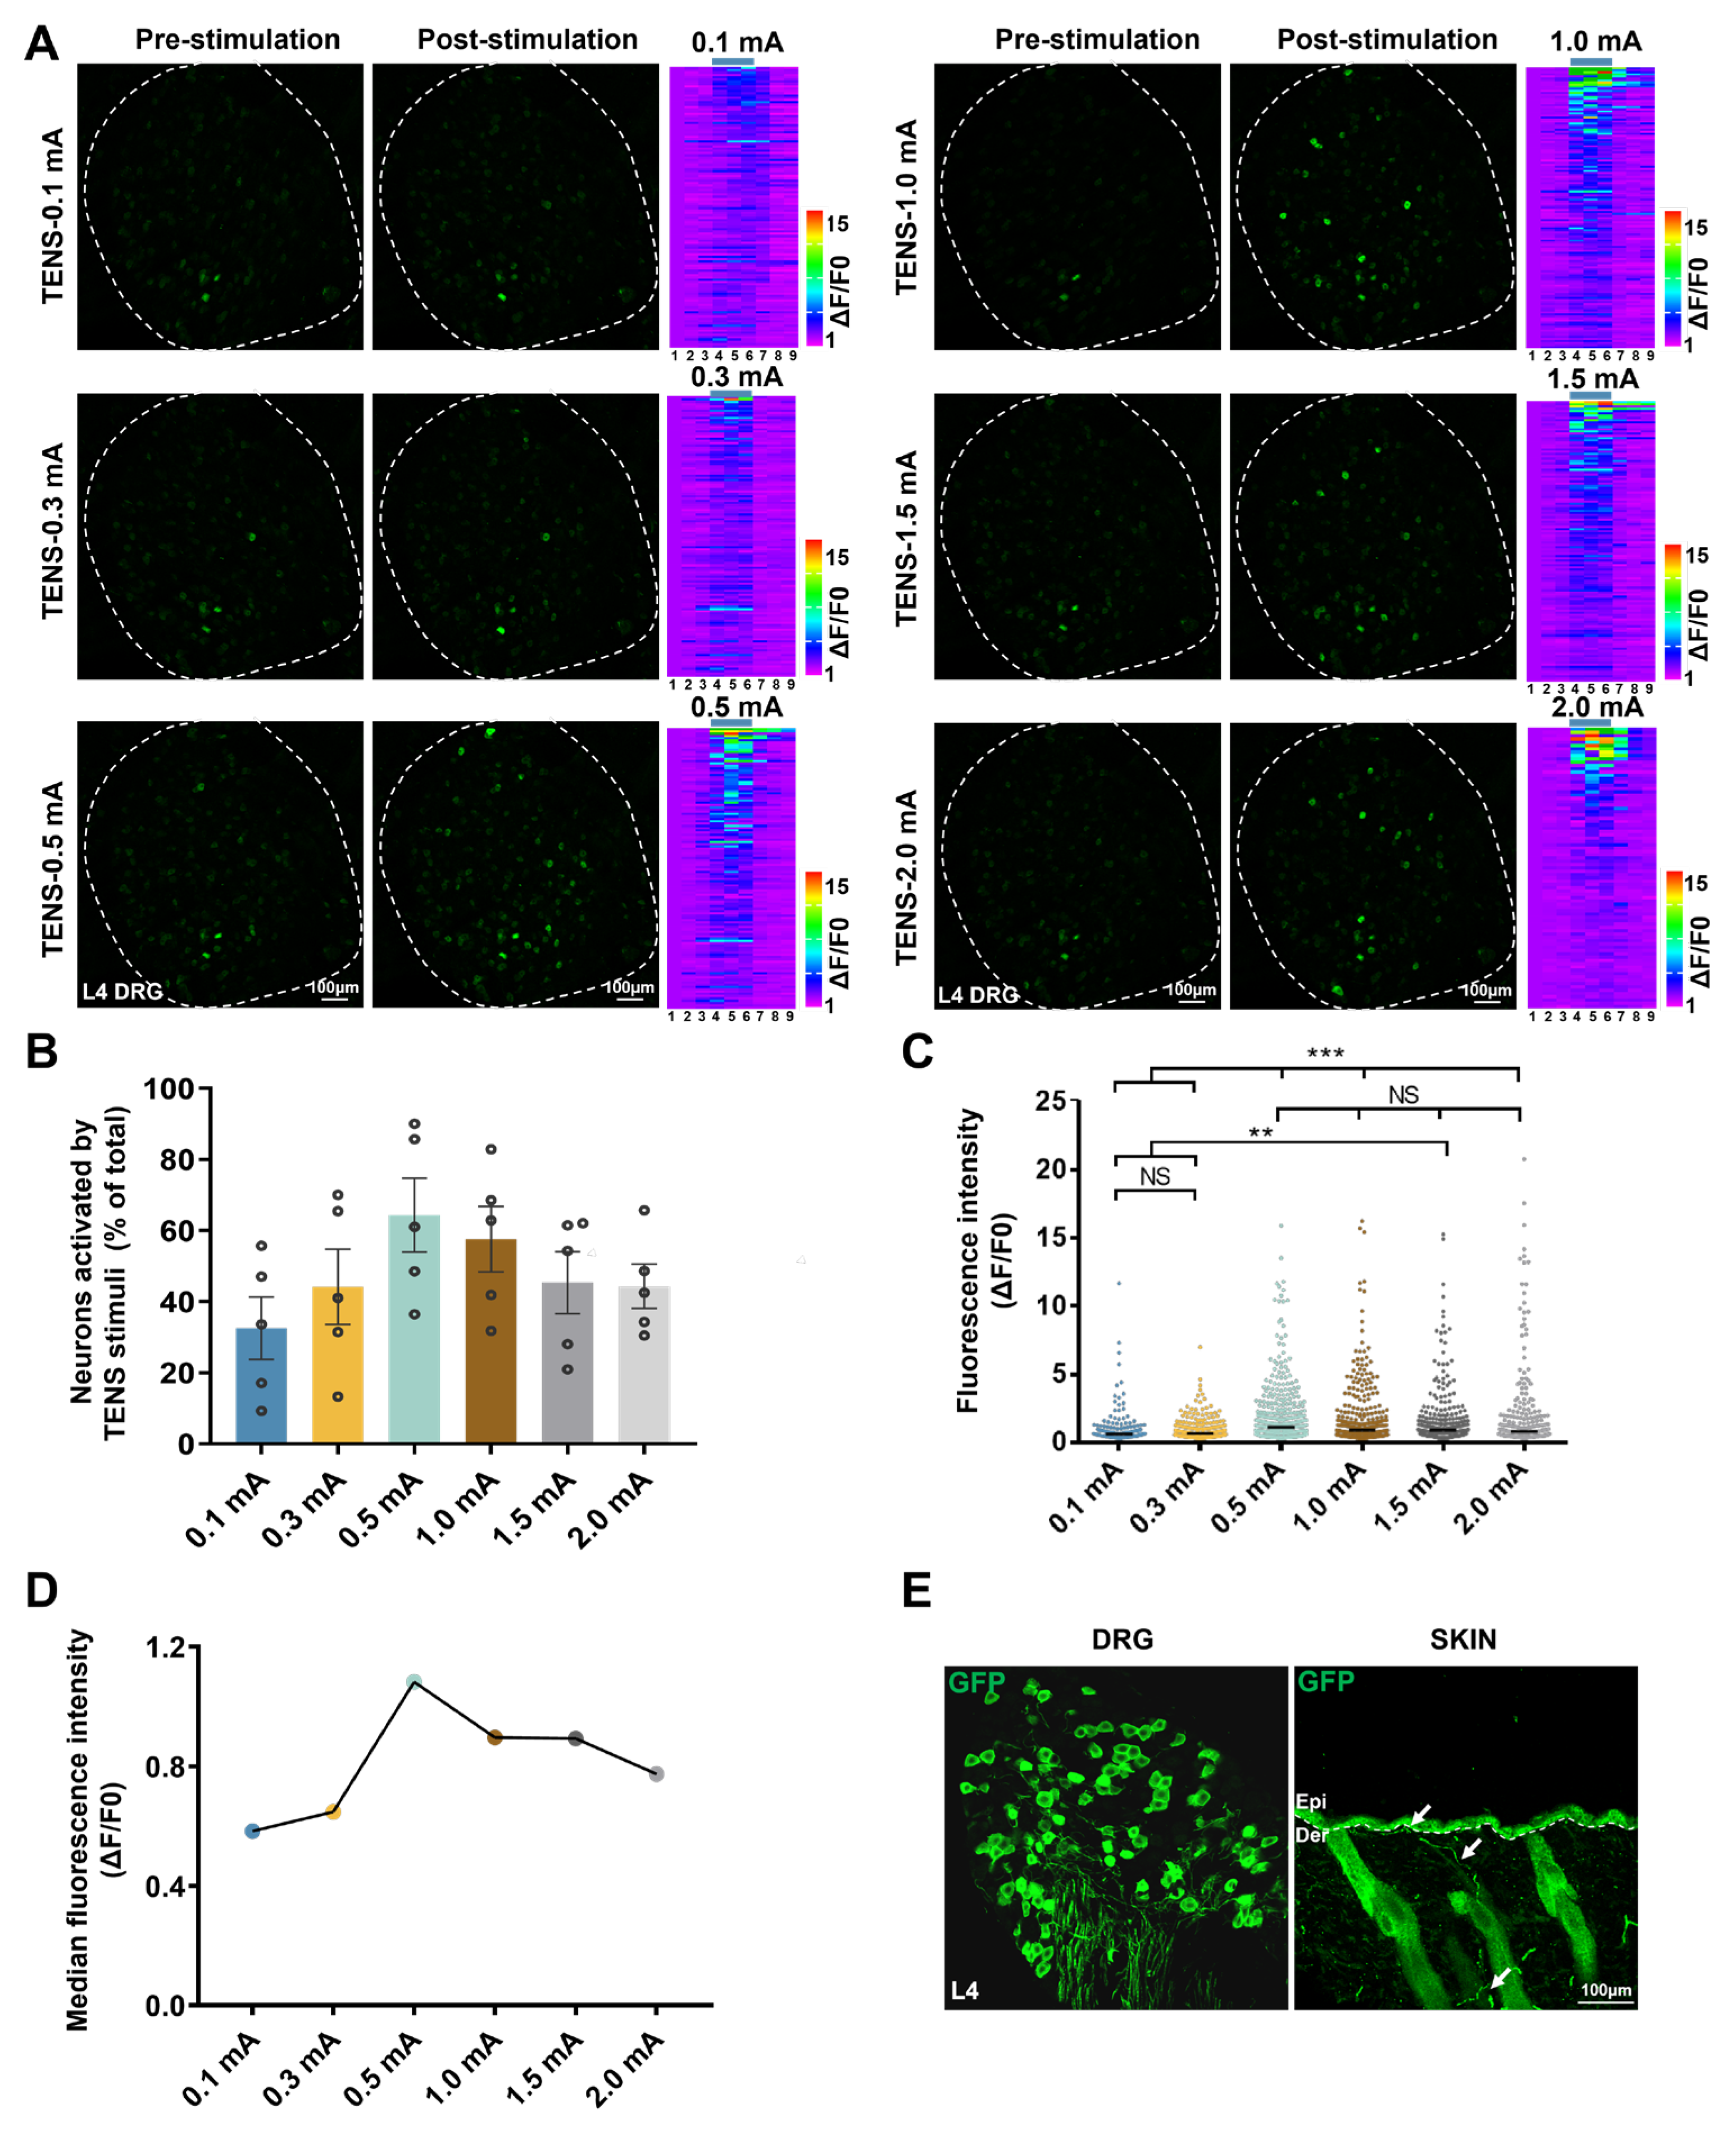
Figure 4.
Effects of Mrgprb4-lineage neurons activated by Blue light on hind paw thickness and mechanical pain threshold of CFA mice. A Timeline of the CFA injection, TENS, and behavioral testing to study the analgesic and anxiolytic effects of TENS (10Hz, 0.5 mA / 2.0 mA) treatment in CFA mice. B Time course of TENS on hind paw thickness of CFA mice (N=12). C Time course of TENS on mechanical pain thresholds of CFA mice (N=12). Yellow shadow is used to TENS stimuli. D The AUC statistics of each group. All data are shown as mean ± S.E.M. C–D by two-way repeated measures ANOVA with Bonferroni post hoc test. Statistical symbols in different colors are represented to denote different groups. Compared with Baseline, ***p < 0.001; Compared between groups at each time point, #p < 0.05,##p < 0.01,###P < 0.001; Compared with CFA+0.5 mA TENS group, ▲▲p < 0.01,▲▲▲▲p < 0.0001. E by one-way repeated measures ANOVA with Bonferroni post hoc test, ## p < 0.01.
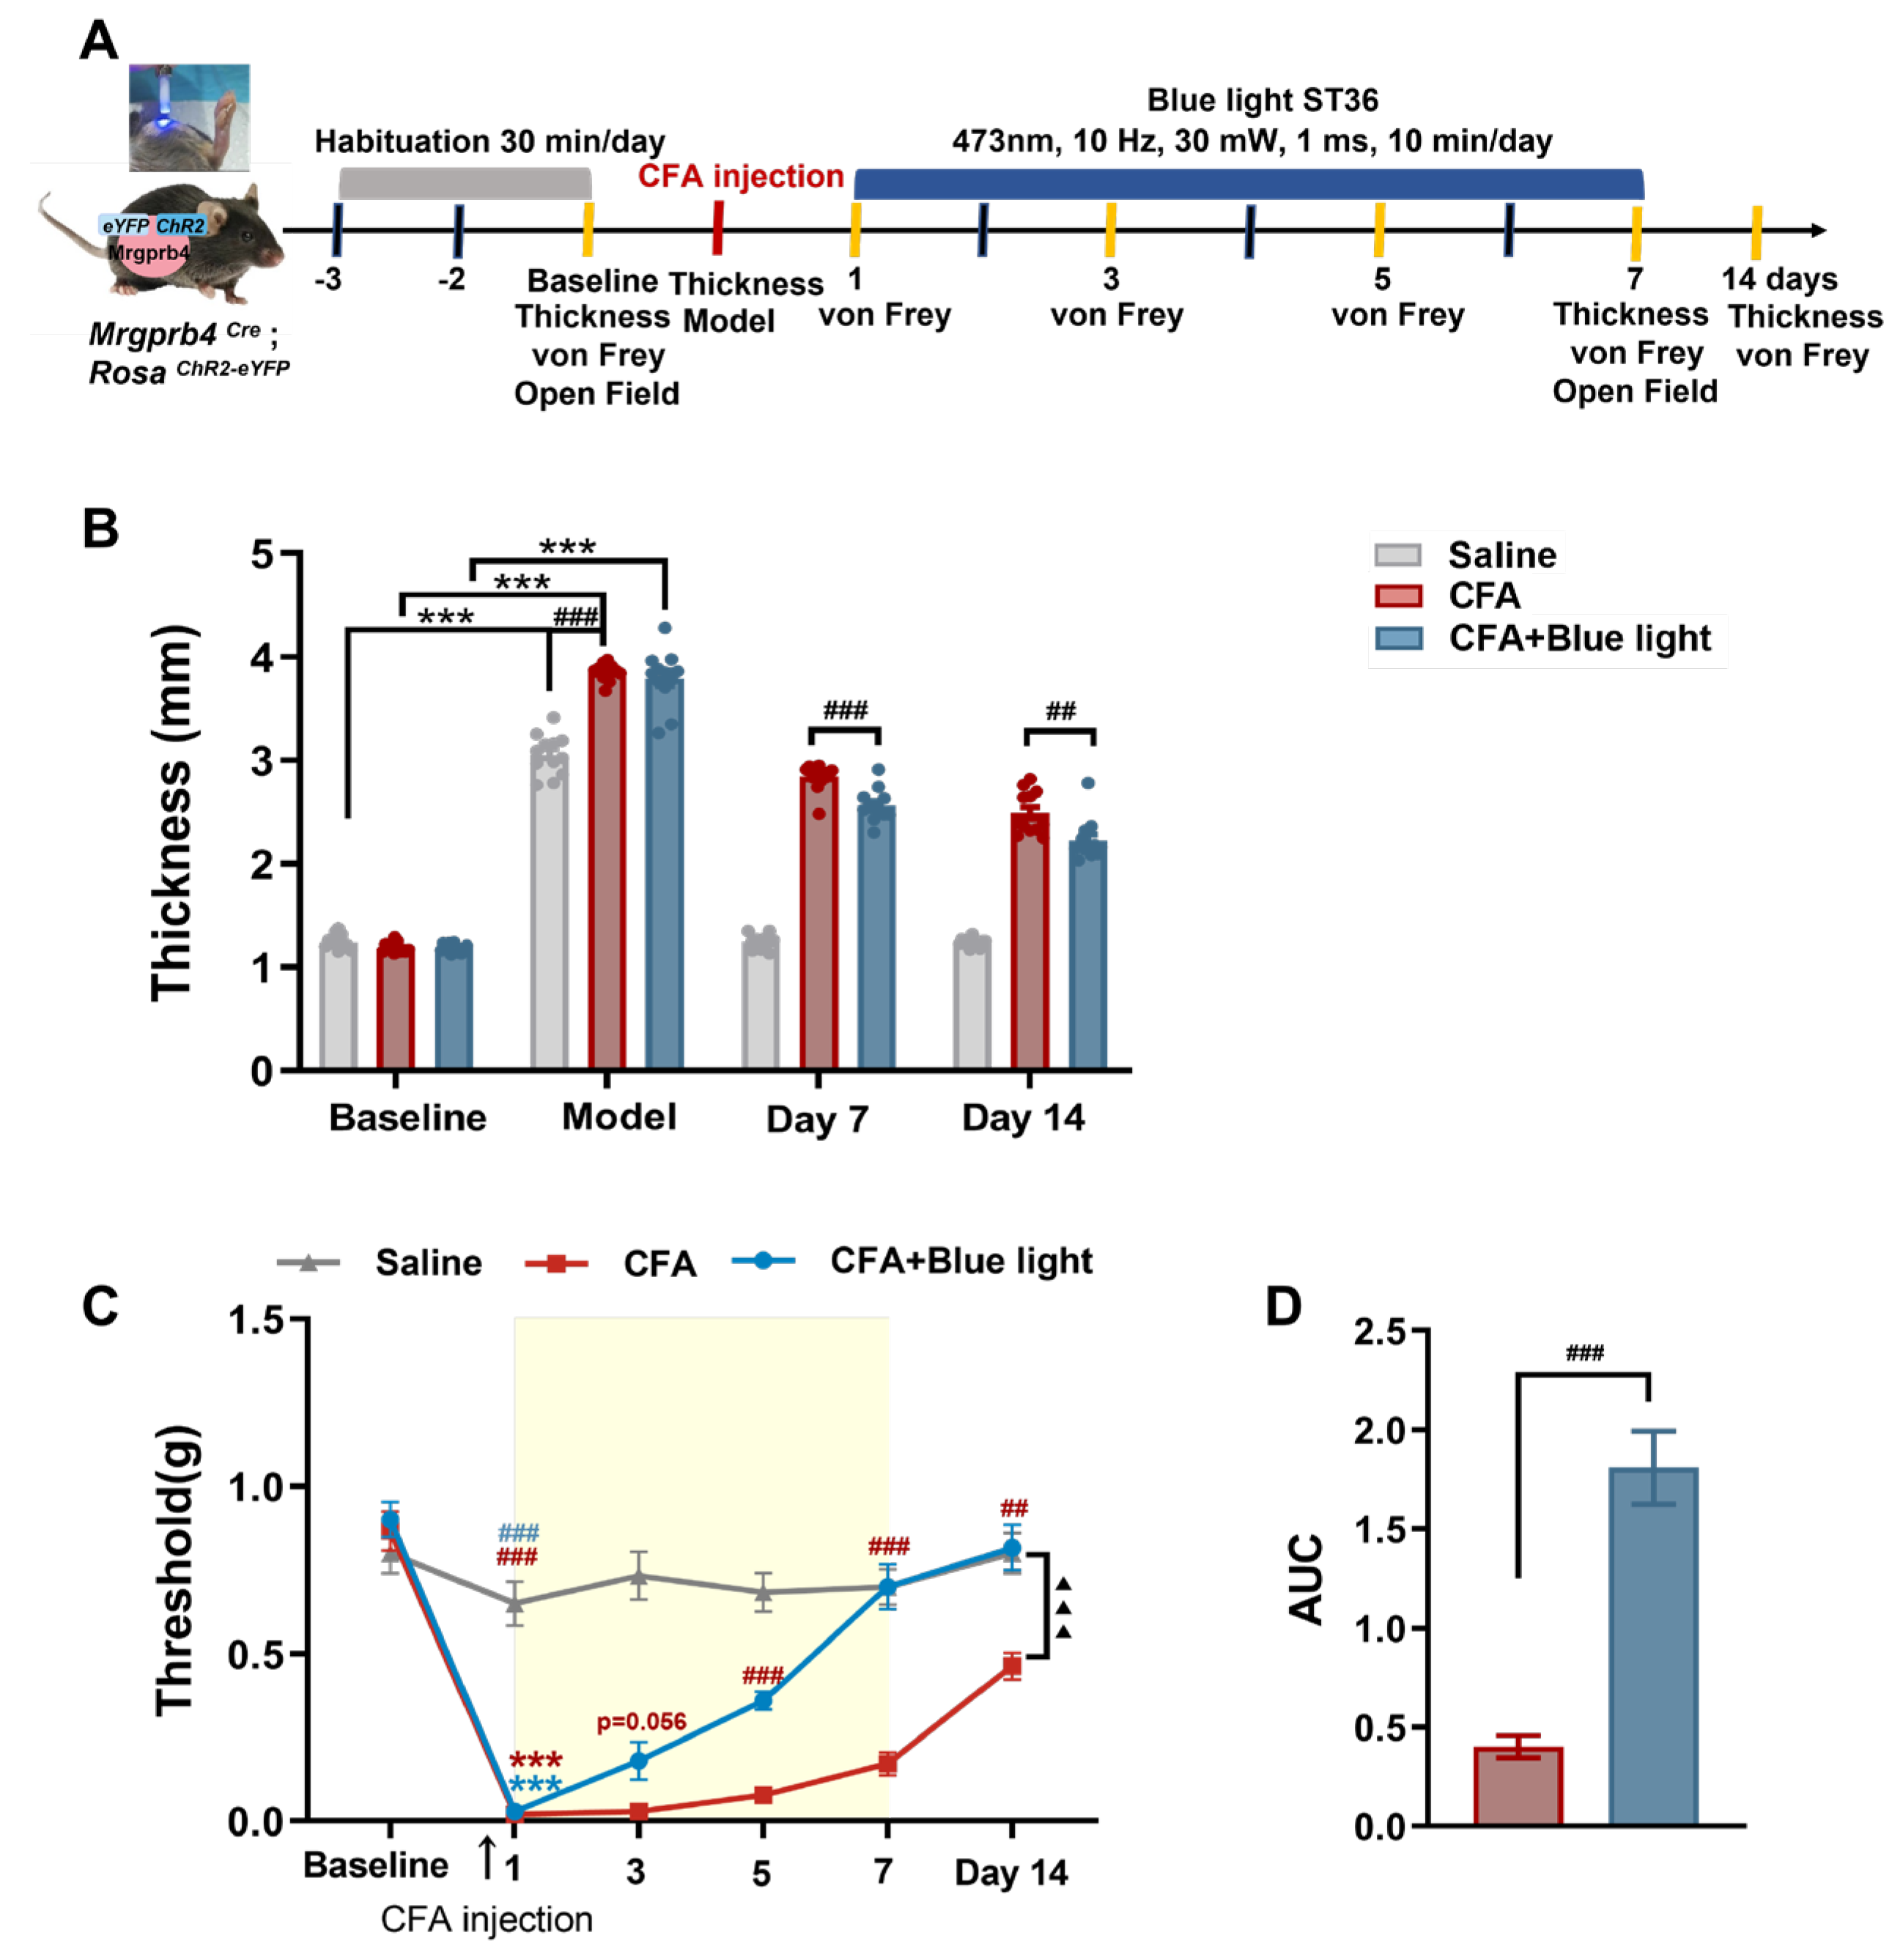
Figure 5.
Effects of Mrgprb4-lineage neuron activated by Blue light on anxiety-like behaviors of CFA mice. A Representative animal tracks of the three groups in the open filed test. B The time in central area of mice in each group (N=12). C The total distance of mice in each group (N=12). D The proportion of the central area to the total distance in each group of mice (N=12).All data are shown as mean ± S.E.M. B-D by two-way ANOVA with Bonferroni post hoc test. Compared within each group, **p < 0.01; Comparisons across all groups, ##p < 0.01.
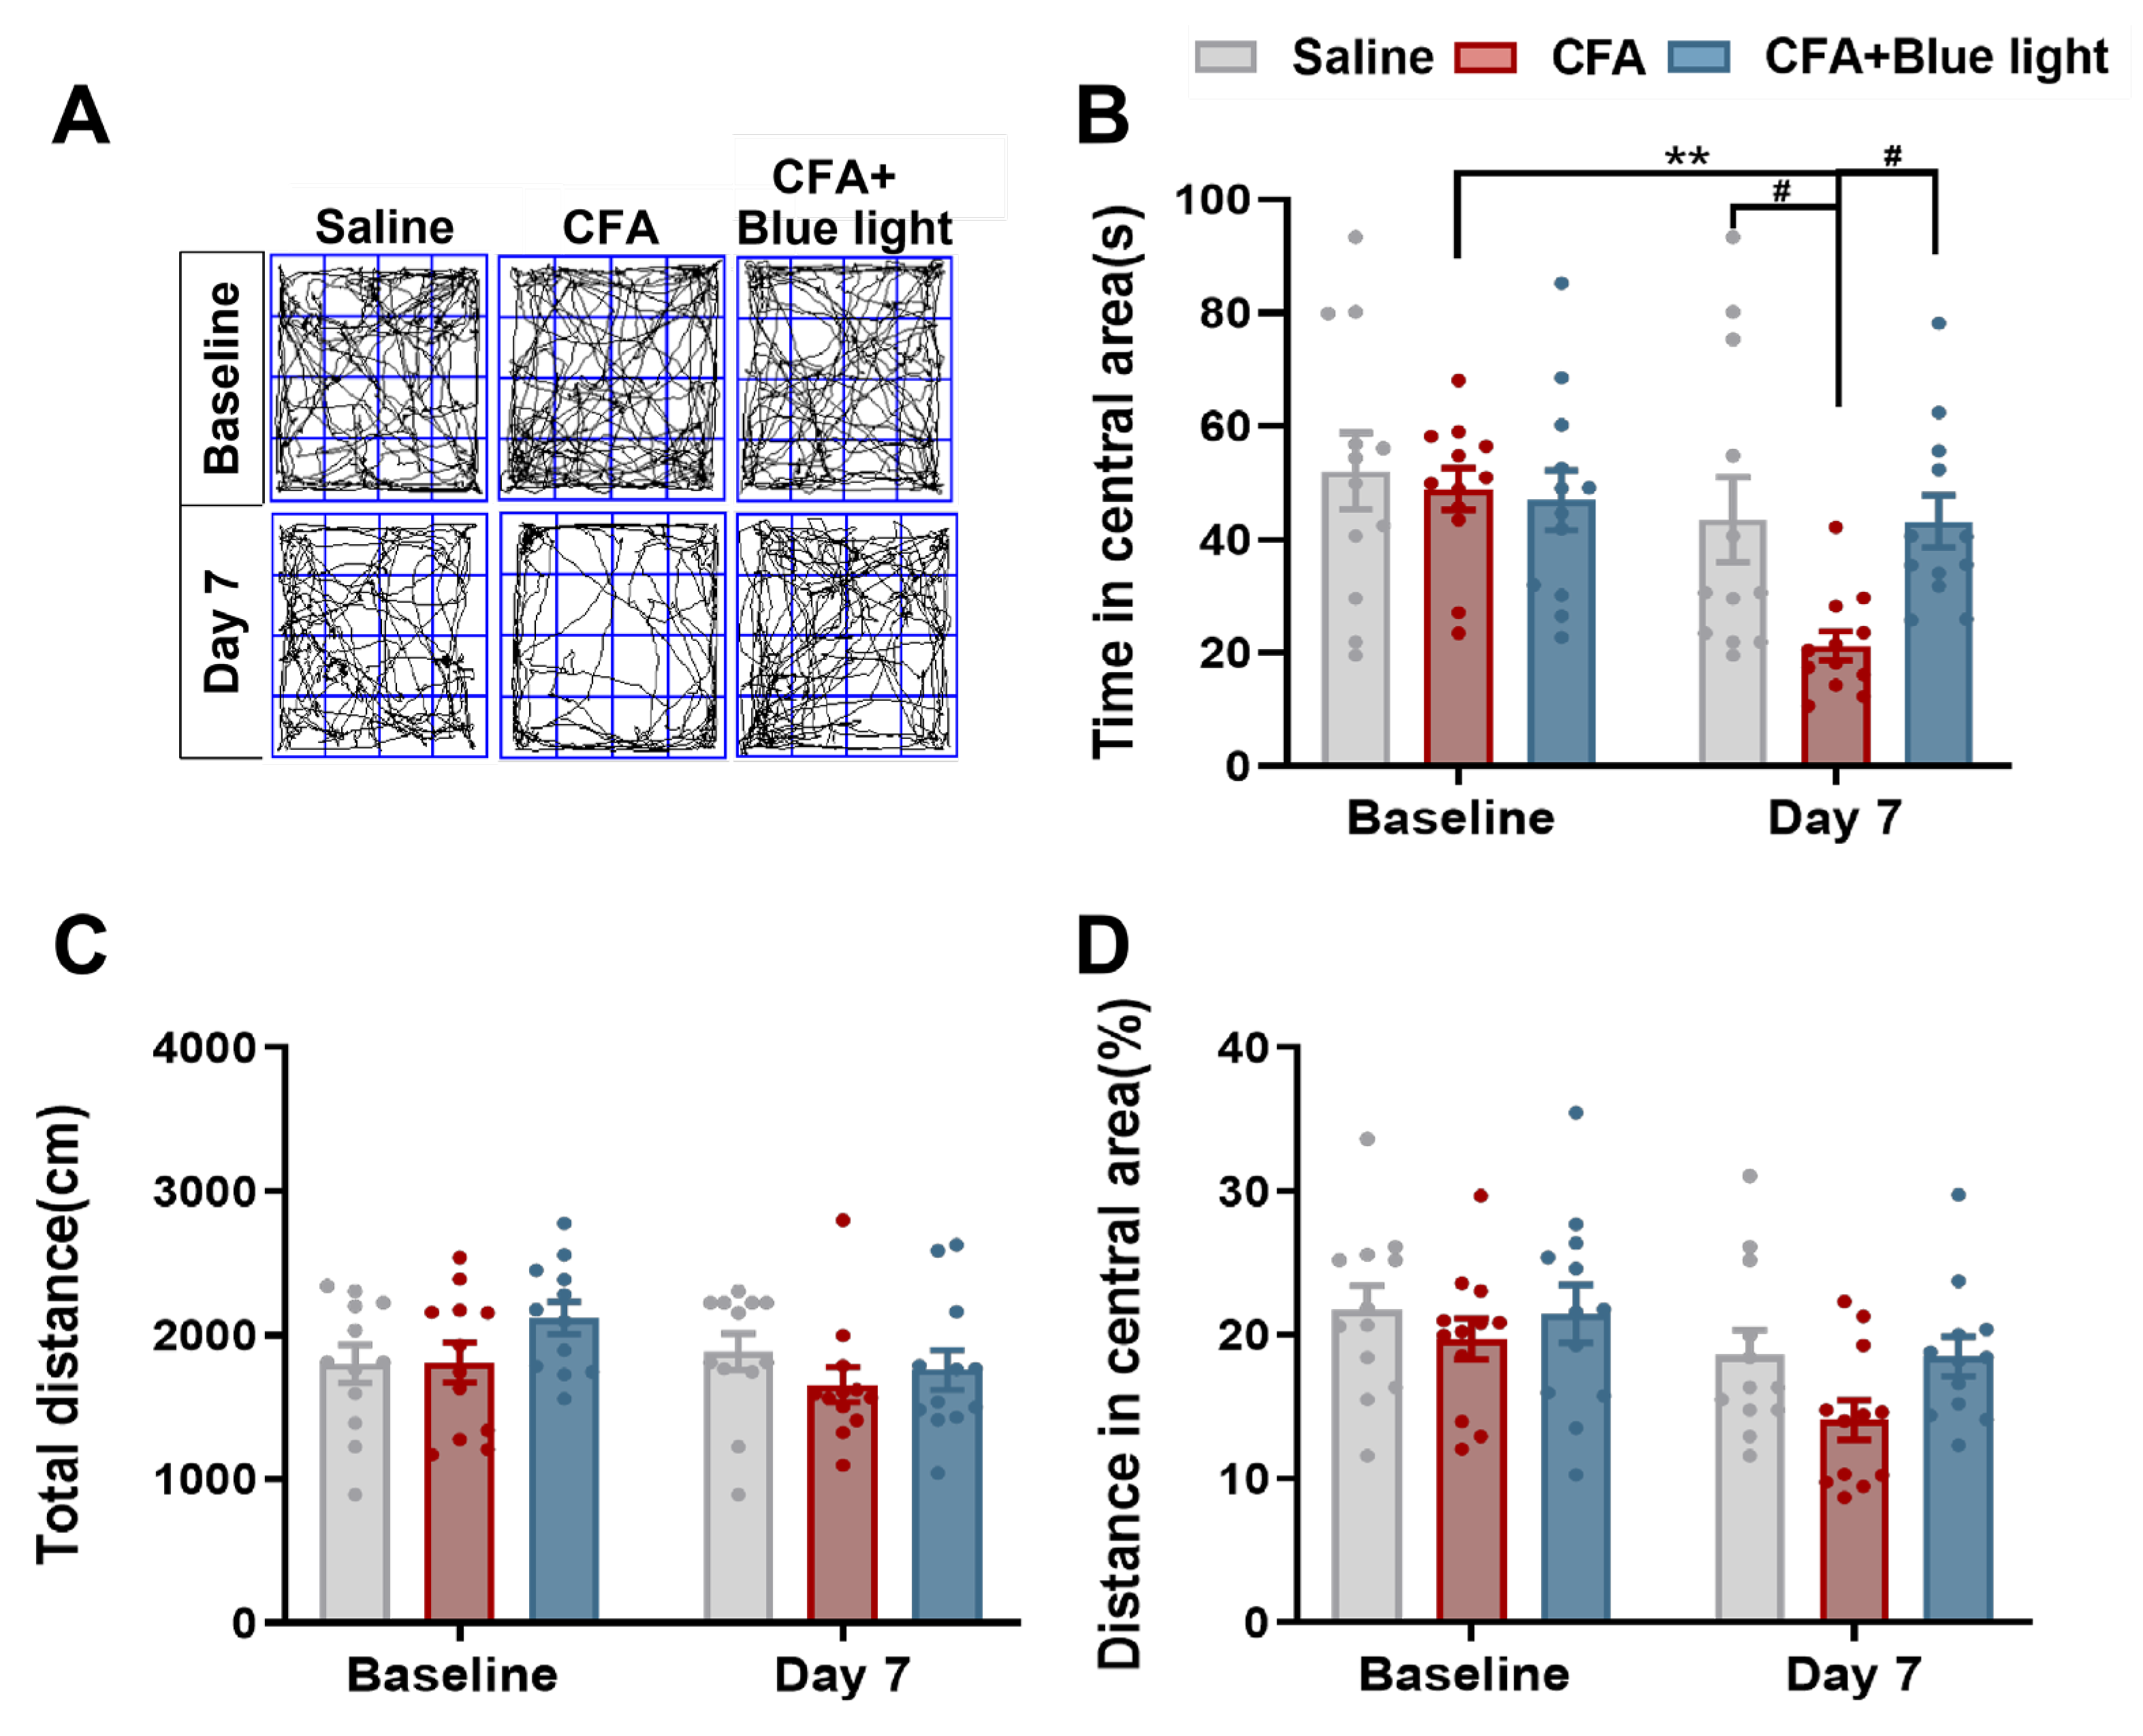
Figure 6.
Effects of virus ablation of Mrgprb4-lineage neurons on hind paw thickness and mechanical pain threshold of CFA mice. A Diagram showing the Mrgprb4-lineage neurons’ virus ablation strategy. ChR2-eYFP is expressed in Mrgprb4-lineage neurons. Intrathecal injection with rAAV-CMV-DIO-taCasp3-T2A-TEVp or Saline in Mrgprb4Cre; RosaChR2-eYFP mice. B Diagram showing the experimental procedure. Adaptive feed on day 0, injection of taCasp3 or saline on day 7, and TENS or behavioral test on day 28. C Timeline of the CFA injection, TENS, and behavioral testing to study the analgesic and anxiolytic effects of TENS (10Hz, 0.5 mA) treatment in CFA mice. D Time course of TENS on hind paw thickness of CFA mice (N=10-12). E Time course of TENS on mechanical pain thresholds of CFA mice (N=10-12). Yellow shadow is used to TENS stimuli. F-G The AUC statistics of each group. All data are shown as mean ± S.E.M. D–E by two-way repeated measures ANOVA with Bonferroni post hoc test. Statistical symbols in different colors are represented to denote different groups. Compared with Baseline, ***p < 0.001; Compared between groups at each time point, #p < 0.05,##p < 0.01,###p < 0.001; Comparisons across all groups, ▲▲p < 0.01,▲▲▲▲p < 0.0001. F-G by unpaired t test, #p < 0.05.
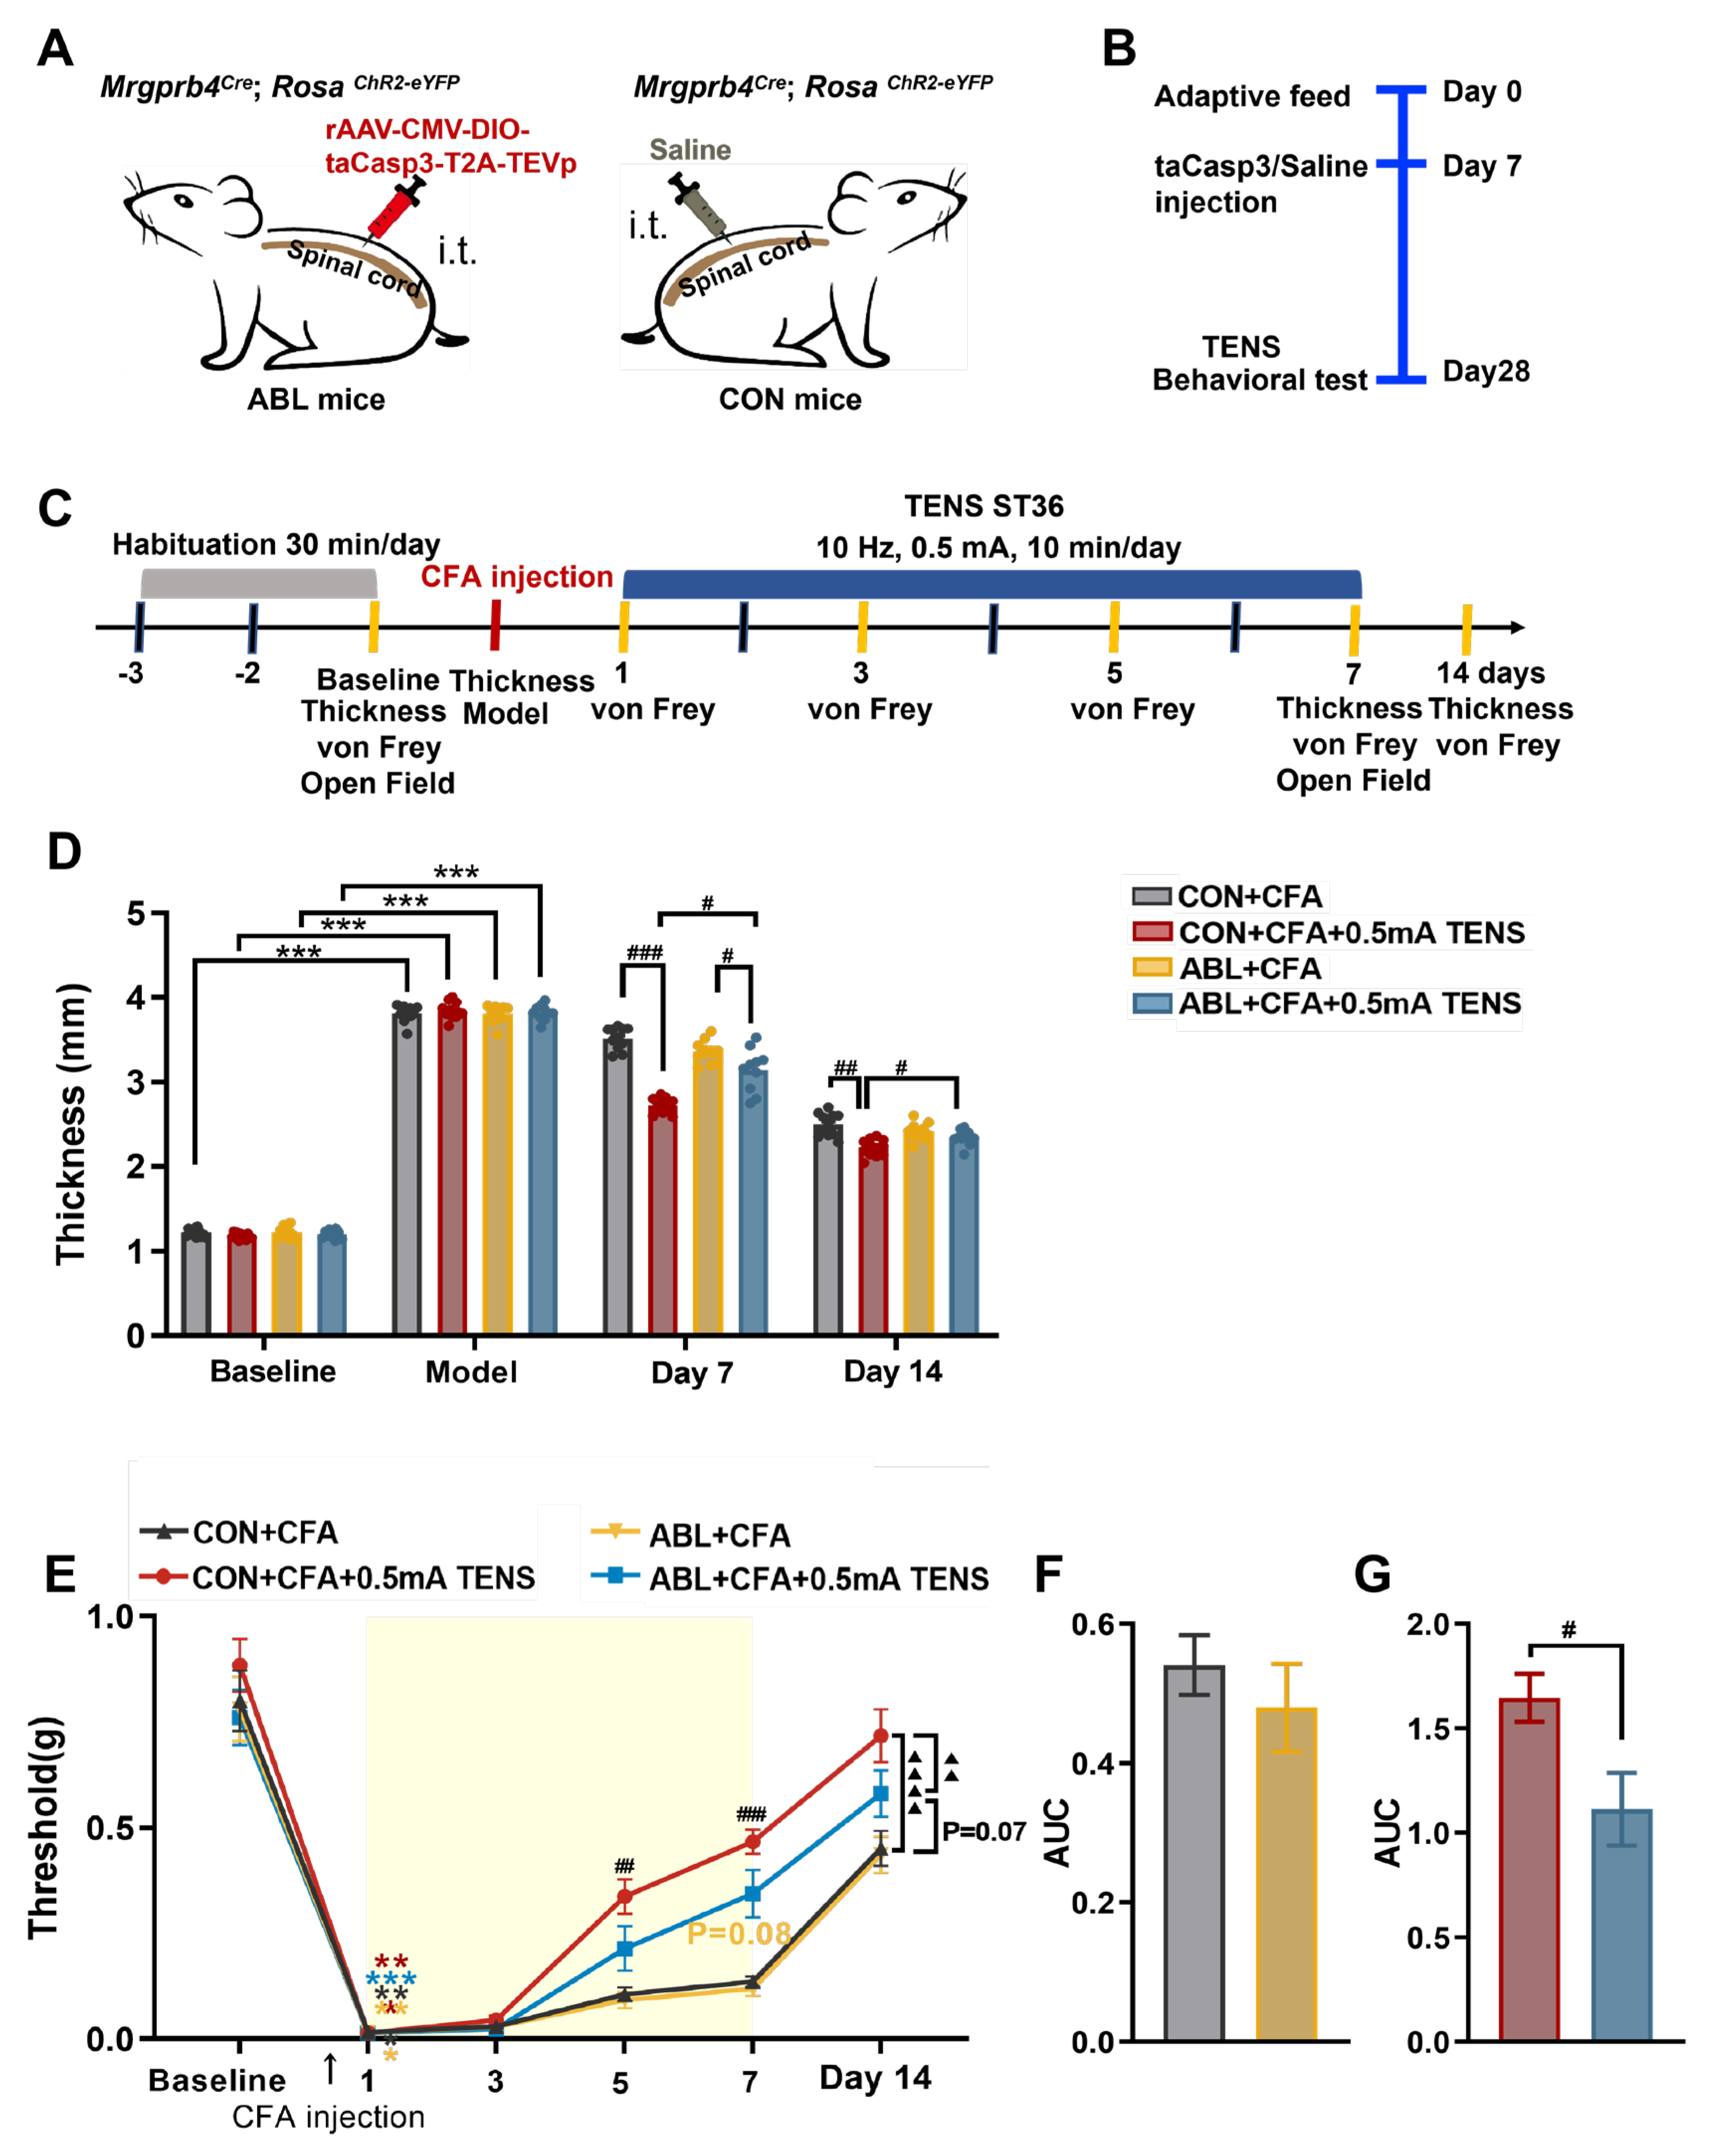
Figure 7.
Effects of virus ablation of Mrgprb4-lineage neurons on anxiety-like behaviors in CFA mice. A Representative animal tracks of the four groups in the open filed test. B The time in central area of mice in each group (N=10-12). C The total distance of mice in each group (N=10-12). D The proportion of the central area to the total distance in each group of mice (N=10-12). All data are shown as mean ± S.E.M. B-D by two-way ANOVA with Bonferroni post hoc test. Compared within each group, ** p < 0.01, *** p < 0.001; Comparisons across all groups, ## p < 0.01.
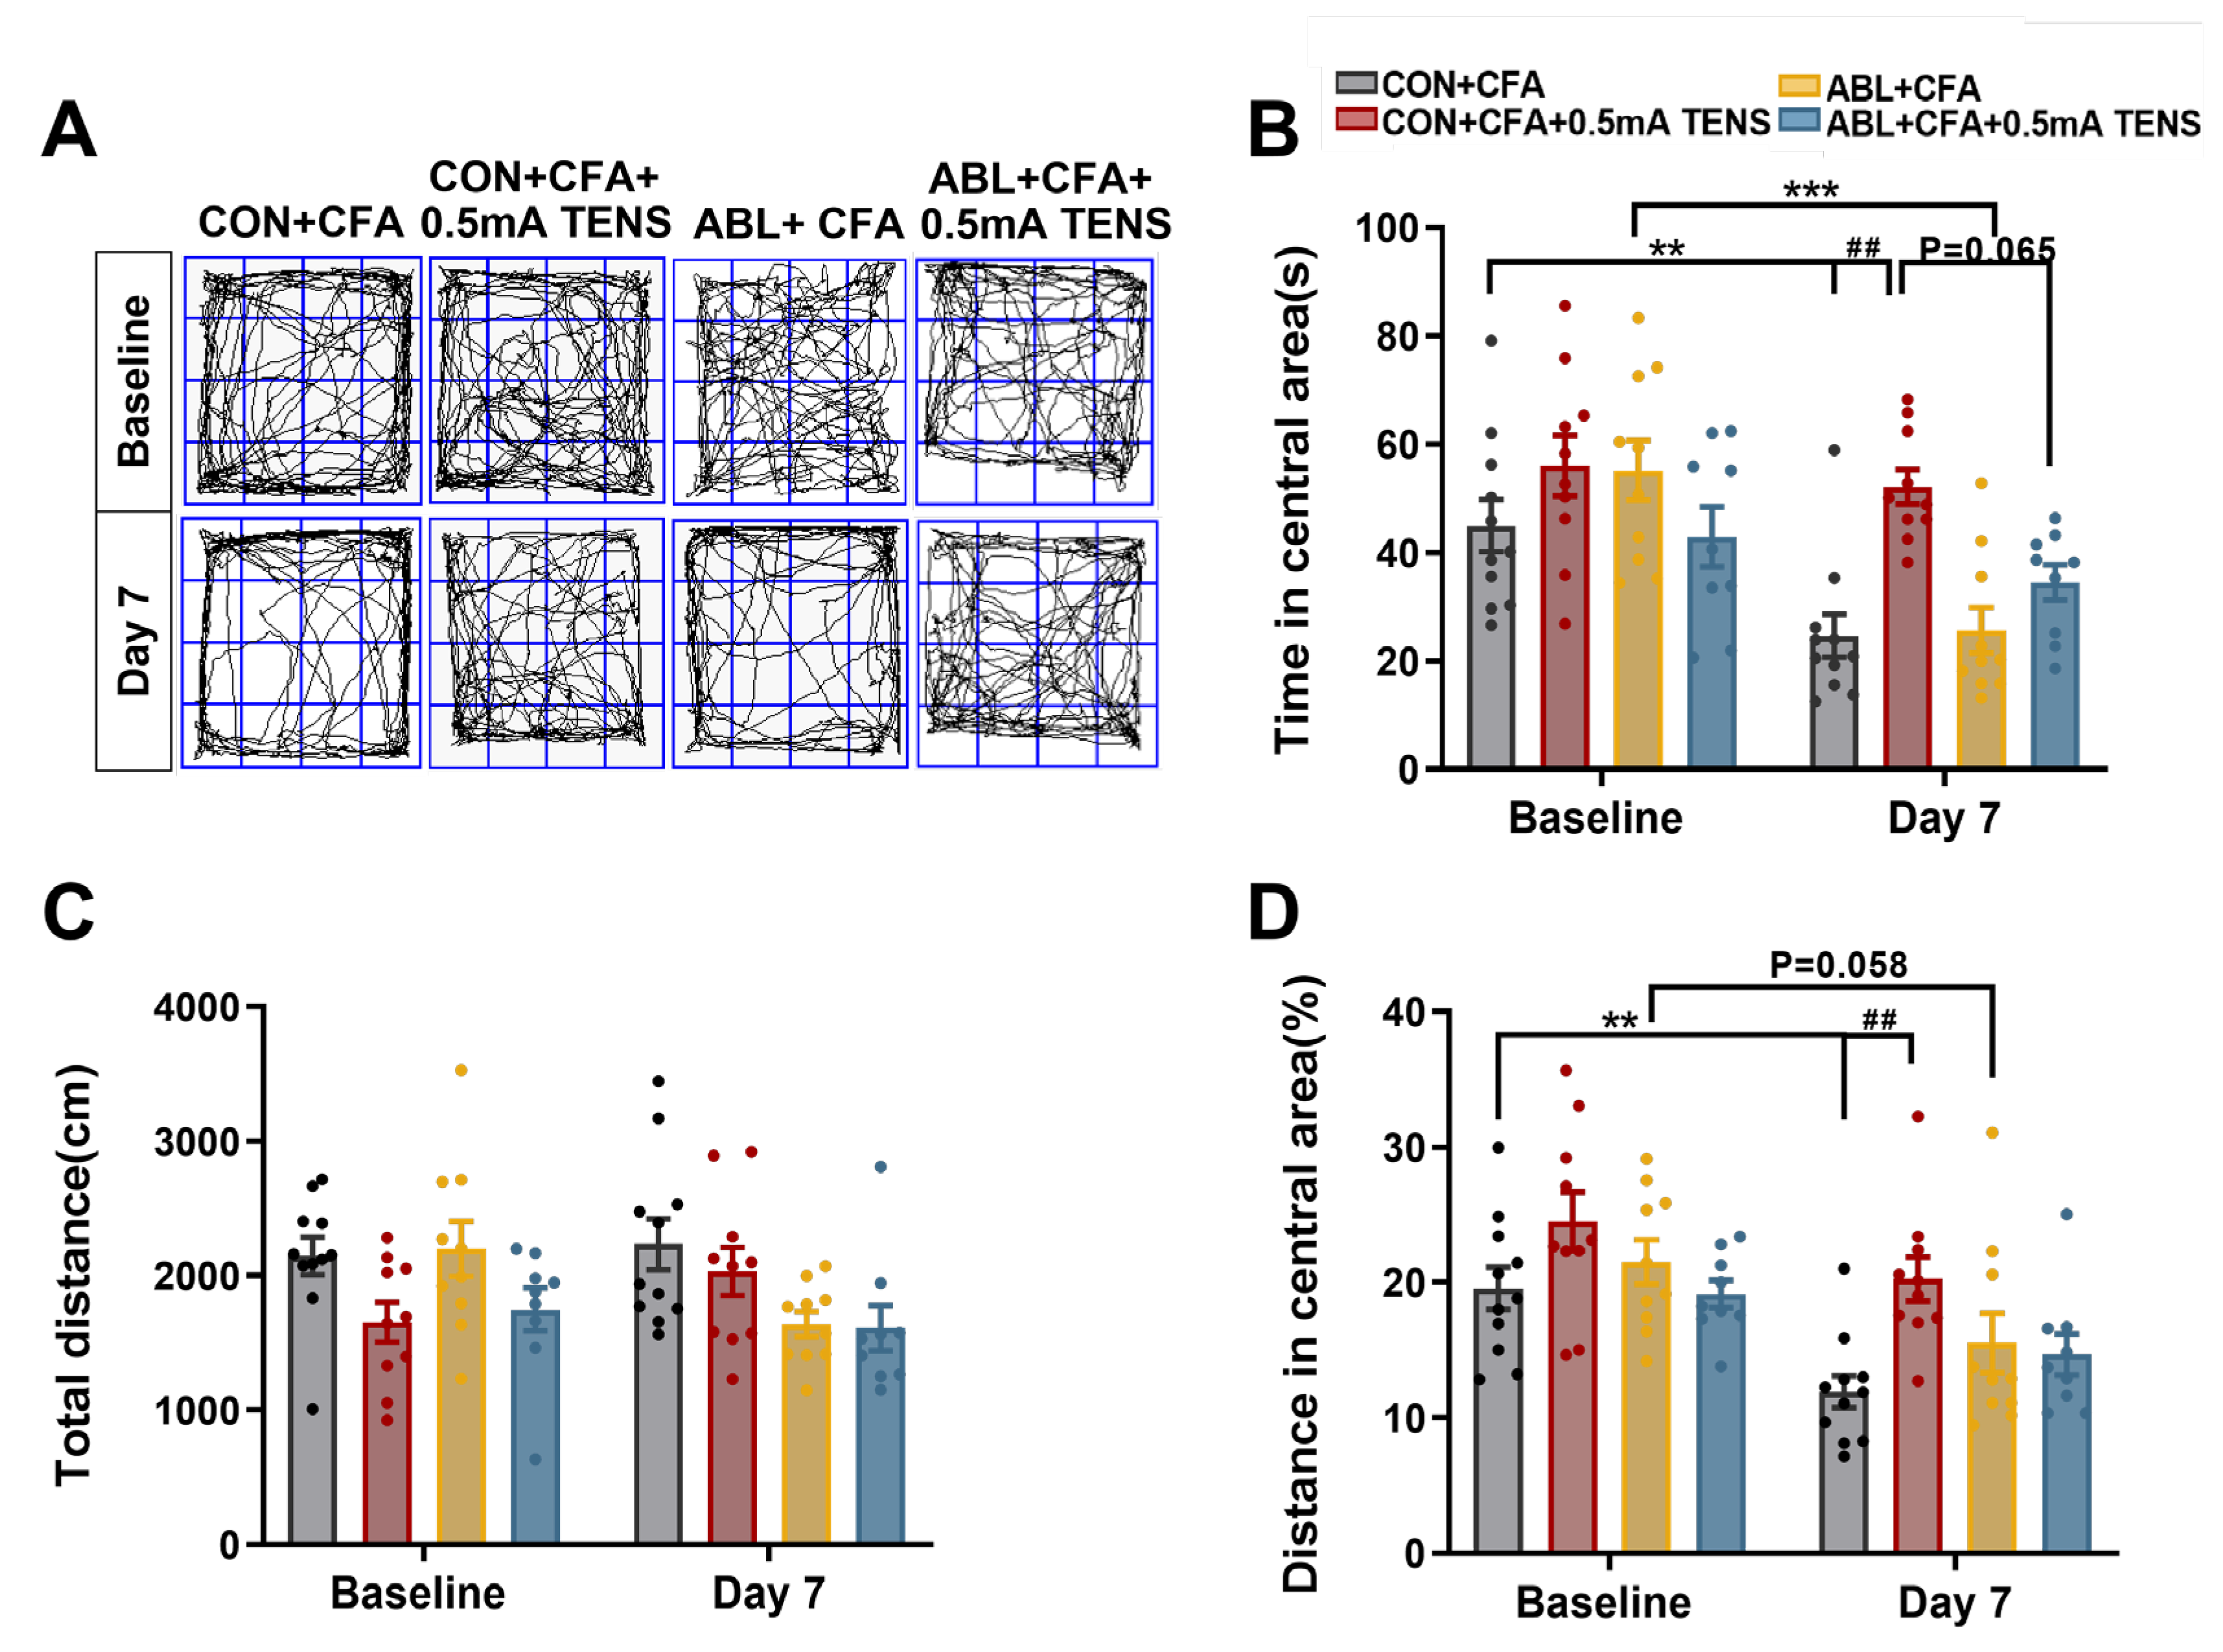
Figure 8.
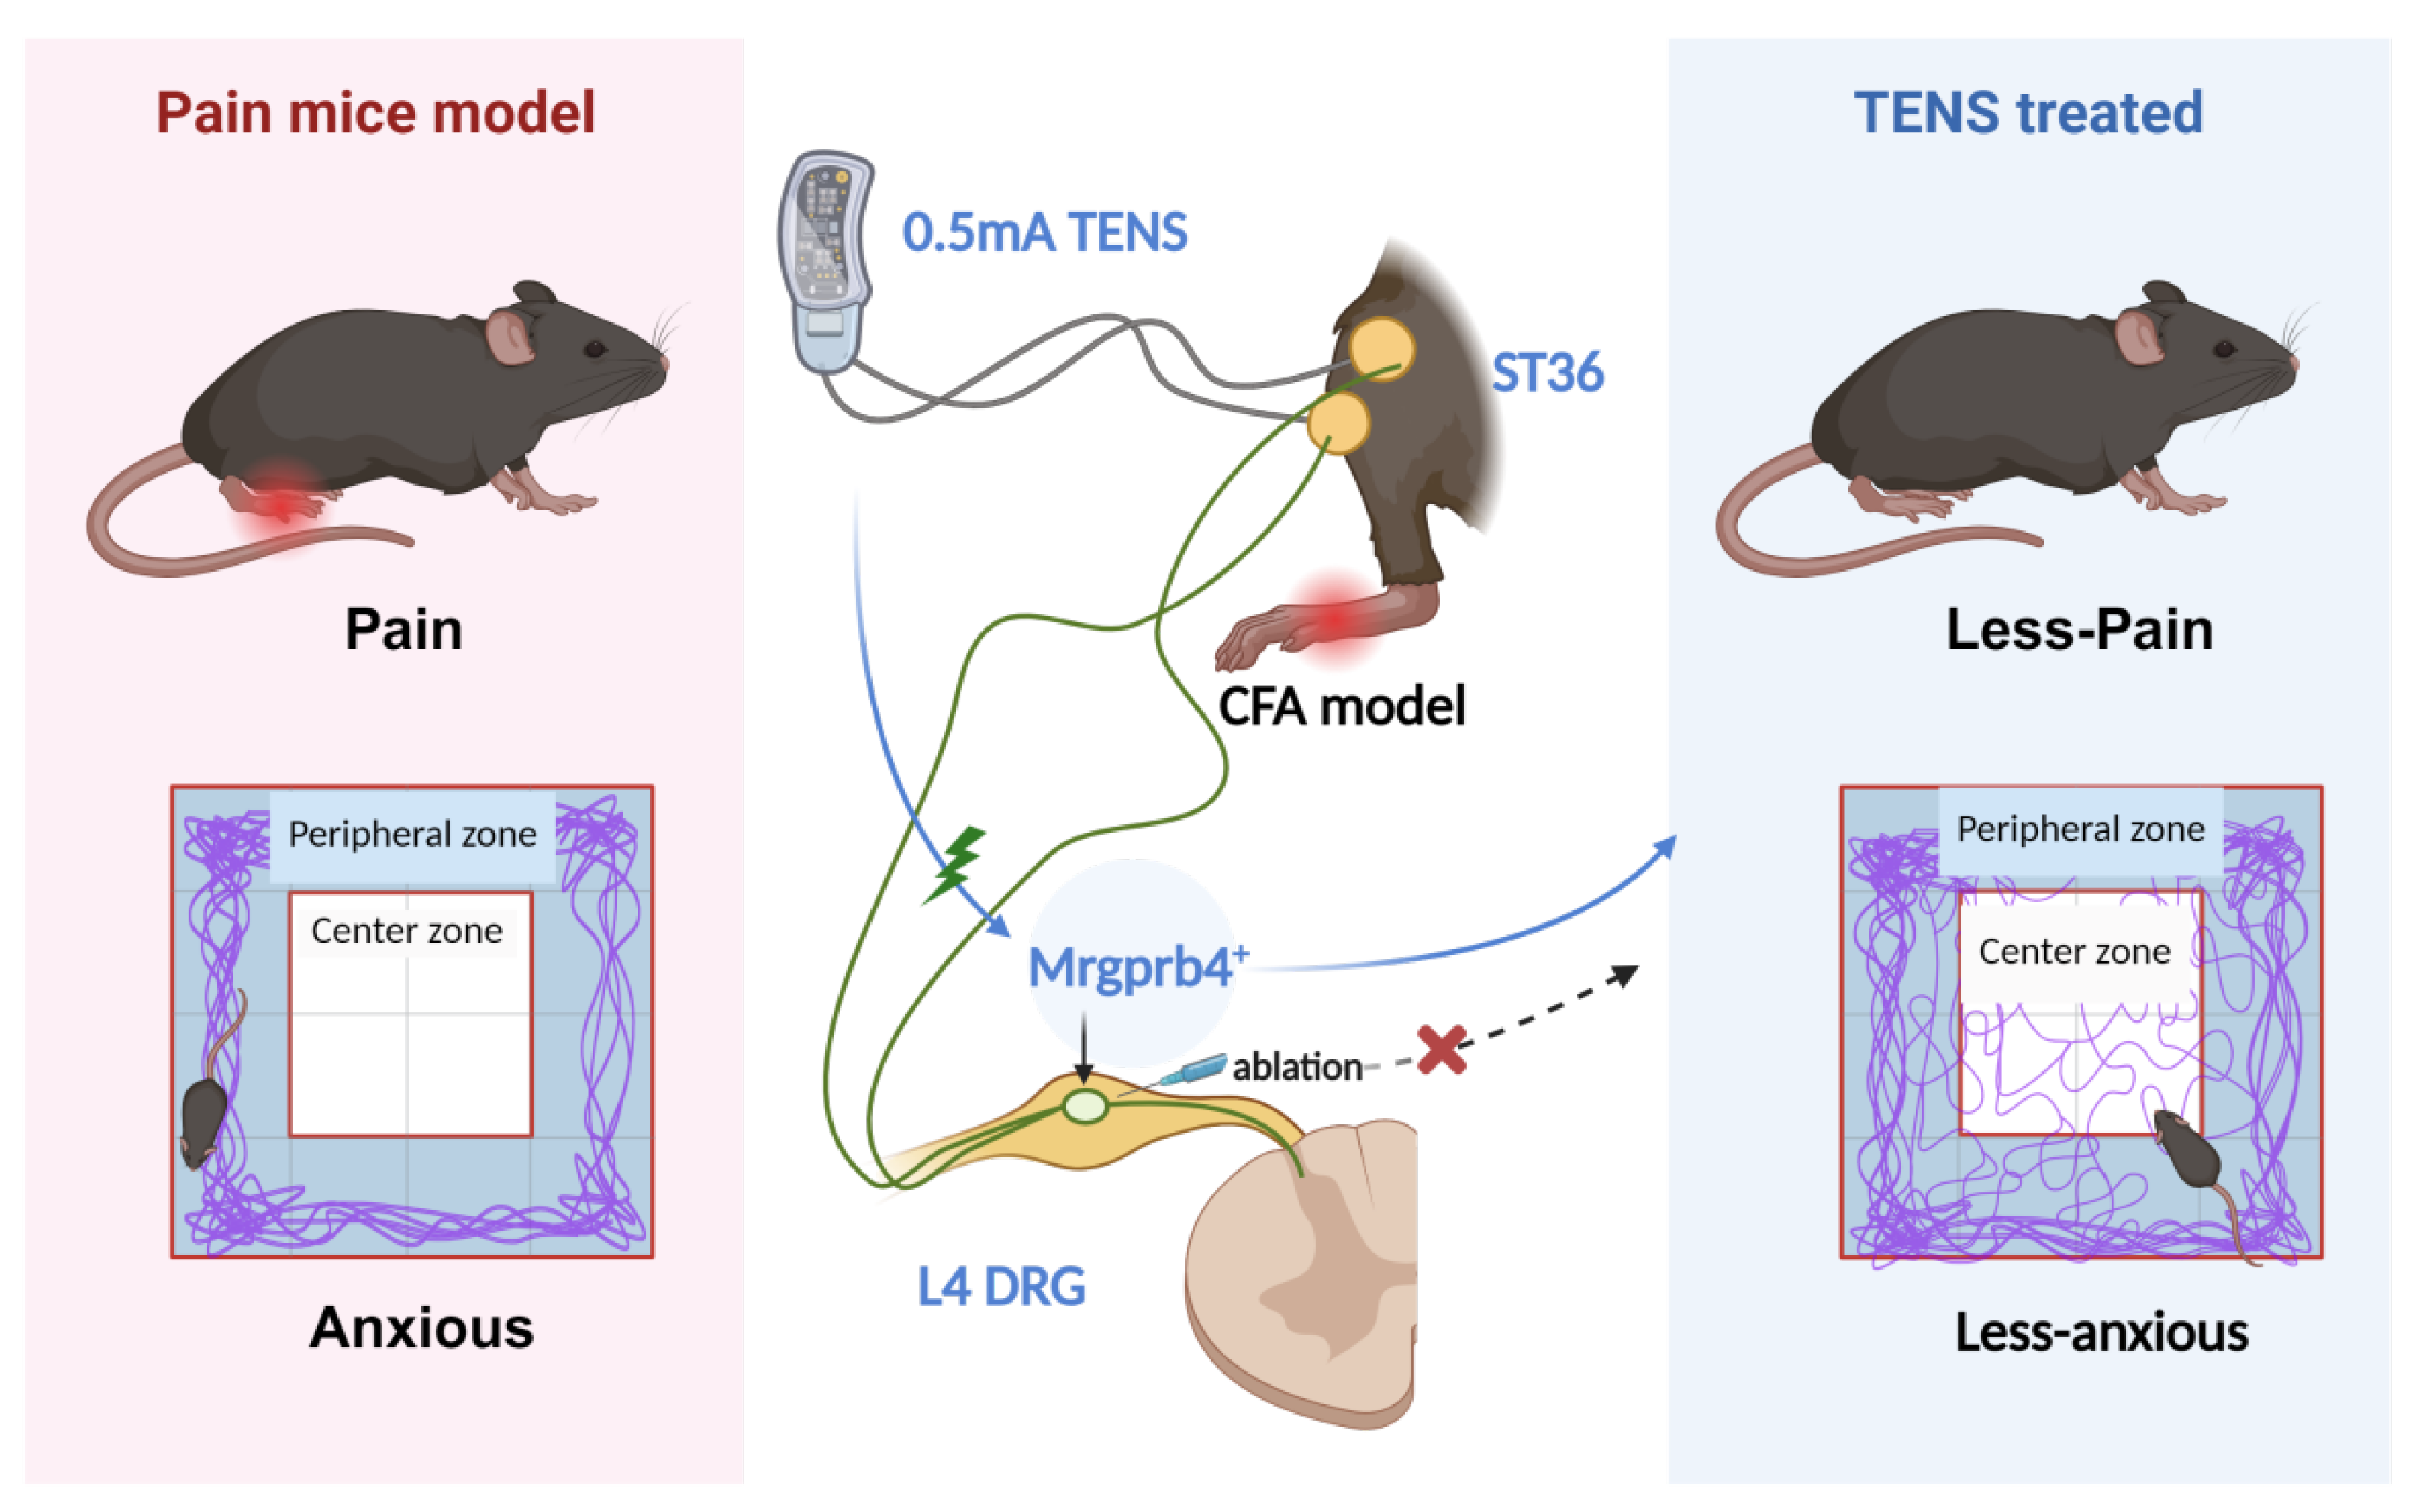
This schematic diagram depicts the role of Mrgprb4-lineage neurons in TENS-induced analgesia within a CFA-induced inflammatory pain model. Activation of Mrgprb4 neurons in the dorsal root ganglion (DRG) by 0.5 mA TENS alleviates pain and anxiety-like behaviors in mice. Chemogenetic ablation of Mrgprb4 neurons in the L4 DRG, however, significantly abrogates the therapeutic effects of 0.5 mA TENS, confirming the crucial contribution of this neuronal lineage to TENS-mediated pain relief.
Figure 8.
This schematic diagram depicts the role of Mrgprb4-lineage neurons in TENS-induced analgesia within a CFA-induced inflammatory pain model. Activation of Mrgprb4 neurons in the dorsal root ganglion (DRG) by 0.5 mA TENS alleviates pain and anxiety-like behaviors in mice. Chemogenetic ablation of Mrgprb4 neurons in the L4 DRG, however, significantly abrogates the therapeutic effects of 0.5 mA TENS, confirming the crucial contribution of this neuronal lineage to TENS-mediated pain relief.
Disclaimer/Publisher’s Note: The statements, opinions and data contained in all publications are solely those of the individual author(s) and contributor(s) and not of MDPI and/or the editor(s). MDPI and/or the editor(s) disclaim responsibility for any injury to people or property resulting from any ideas, methods, instructions or products referred to in the content. |
© 2026 by the authors. Licensee MDPI, Basel, Switzerland. This article is an open access article distributed under the terms and conditions of the Creative Commons Attribution (CC BY) license (http://creativecommons.org/licenses/by/4.0/).
Copyright: This open access article is published under a Creative Commons CC BY 4.0 license, which permit the free download, distribution, and reuse, provided that the author and preprint are cited in any reuse.


