
Submitted:
20 January 2026
Posted:
22 January 2026
You are already at the latest version
Abstract
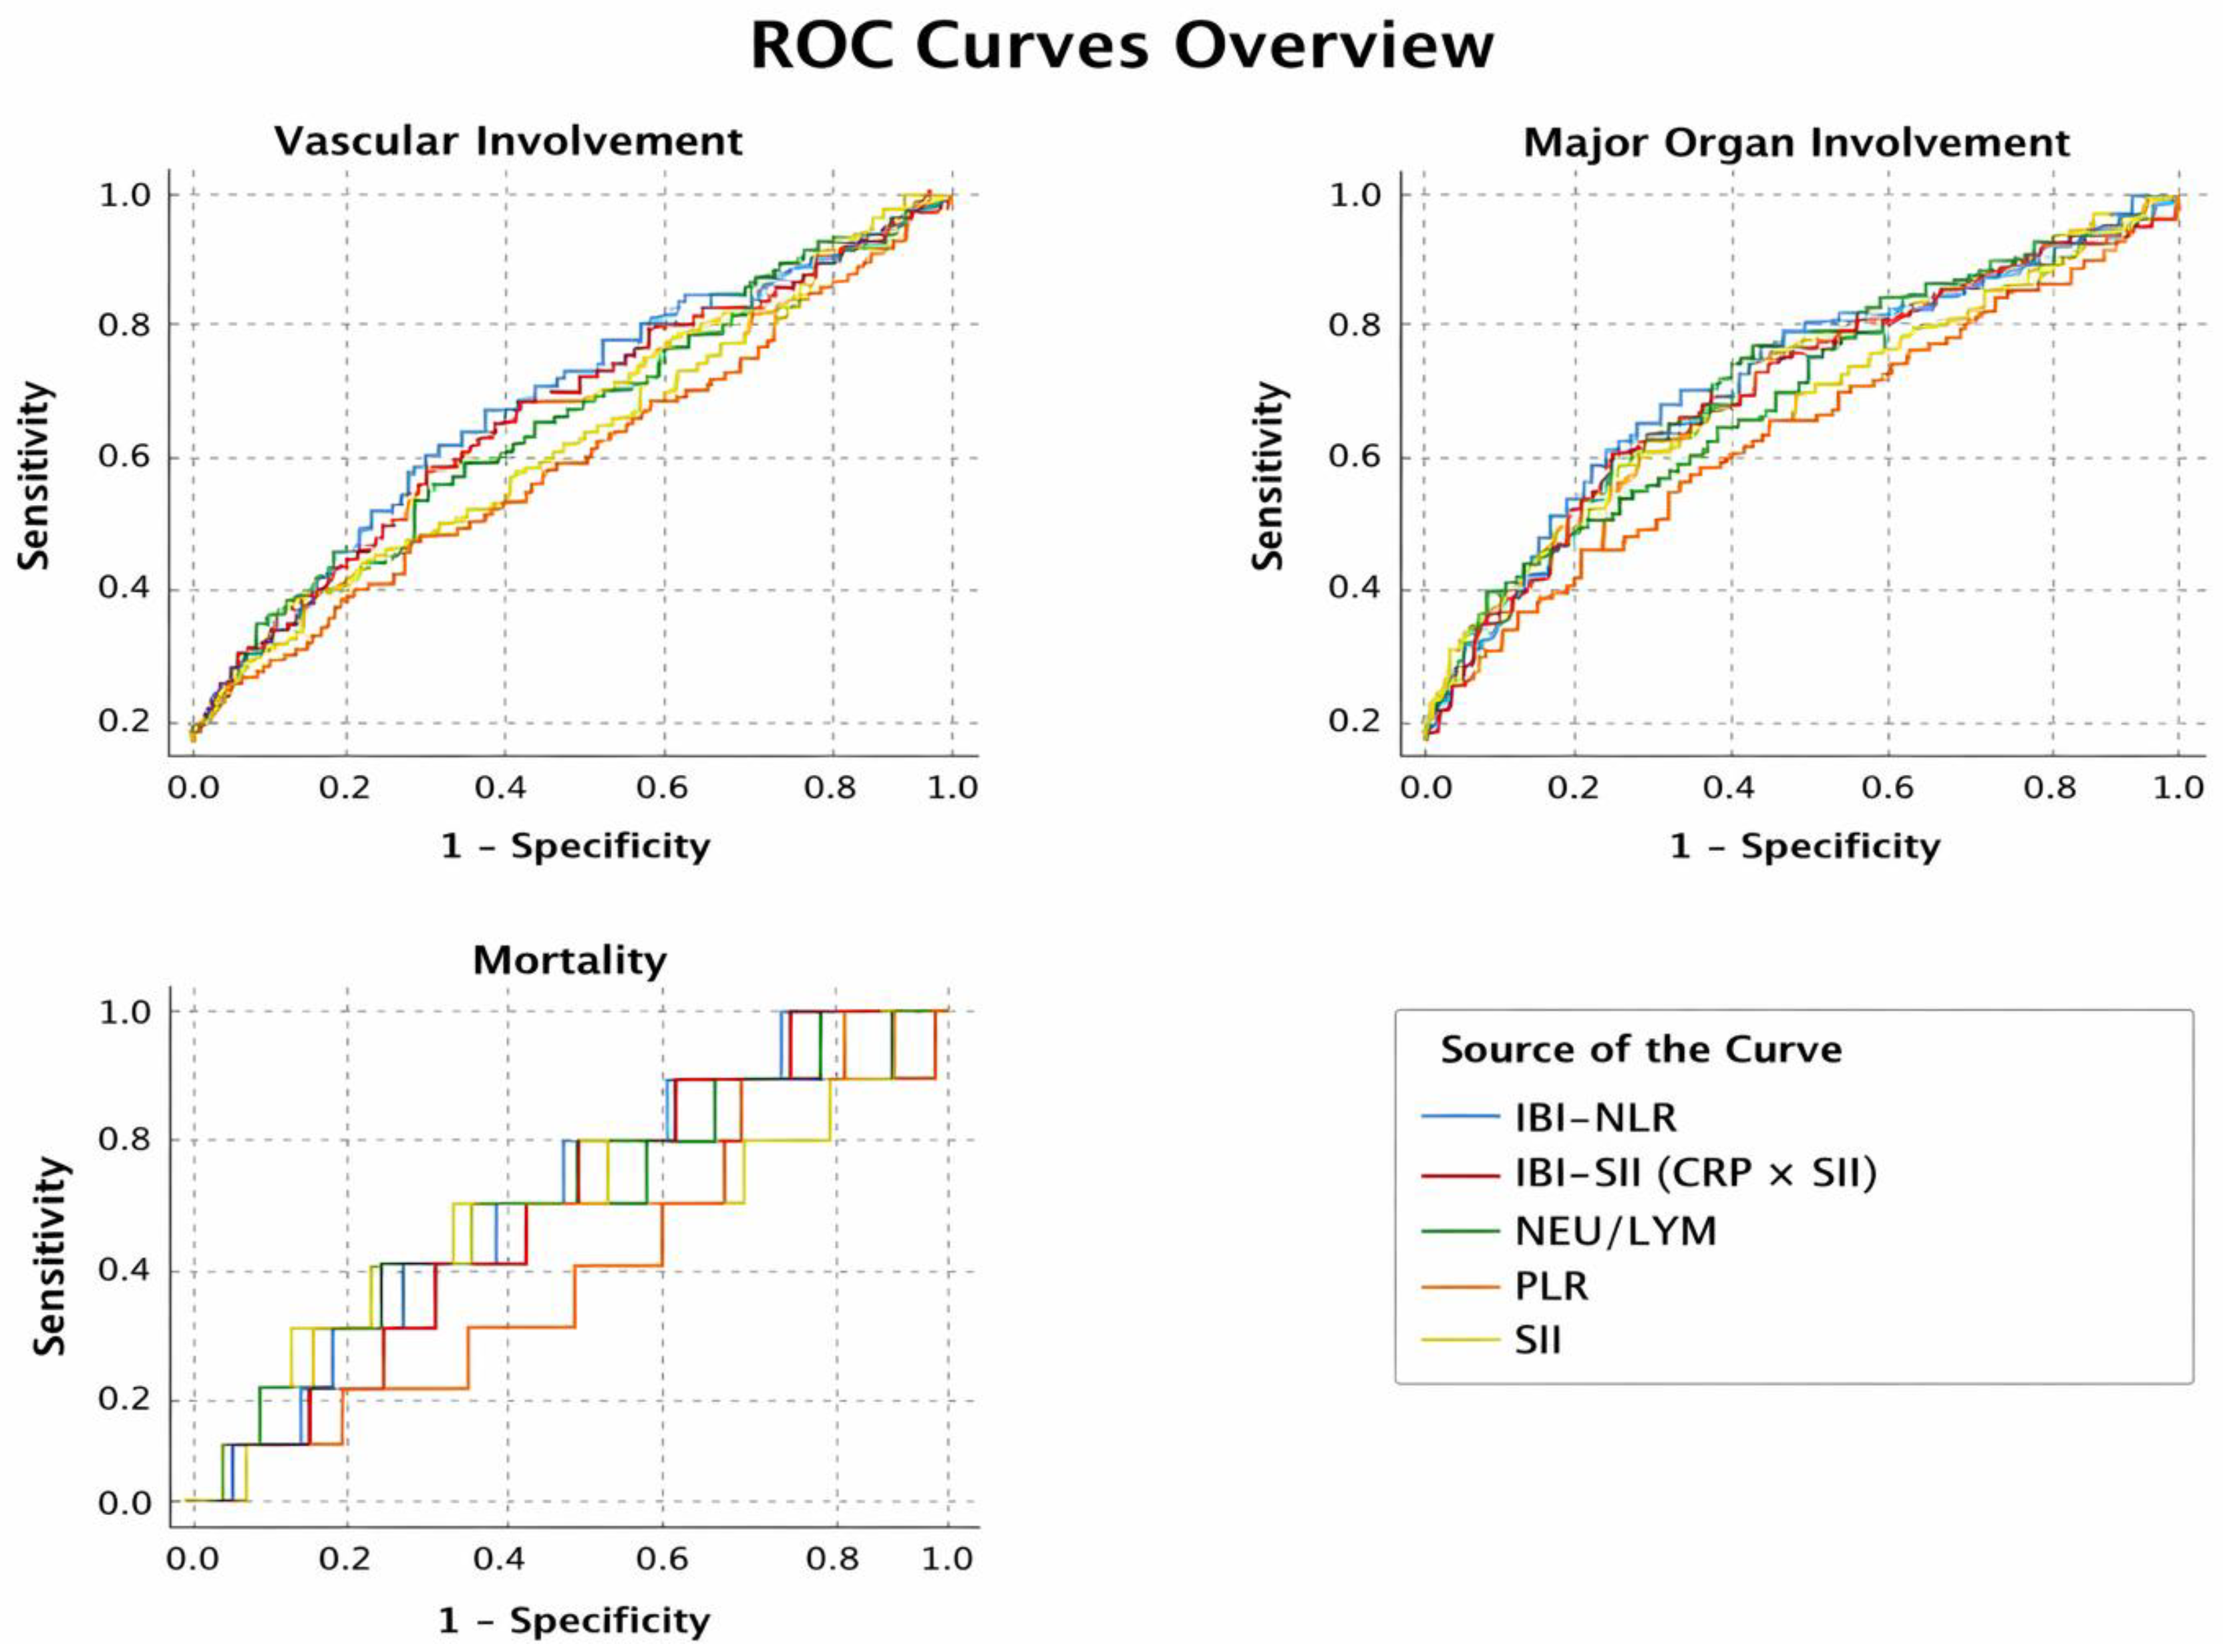
Background: Behçet’s disease is a multisystem inflammatory disorder with a variable clinical course. This study evaluated the association between inflammatory indices, clinical involvement, and mortality. Methods: This retrospective study included 444 patients with BD. Clinical characteristics and laboratory data were systematically retrieved from electronic medical record system. Inflammatory indices (NLR, PLR, SII) were calculated to reflect systemic inflammation. In addition, CRP-based composite indices (IBI-NLR and IBI-SII) were derived to integrate cellular and acute-phase inflammatory responses. Disease manifestations, major organ involvement, comorbidities, and mortality were recorded to comprehensively assess disease burden and clinical outcomes. Results: In multivariable analysis, vascular involvement was associated with increased ESR level (OR=1.013, 95% CI: 1.002–1.024, p=0.018), and male sex (OR=3.22, 95% CI: 1.83–5.67, p<0.001;). ROC analysis showed the highest discriminatory performance for vascular involvement, with IBI-NLR (AUC=0.624, p<0.001), IBI-SII (AUC=0.609, p=0.001) and NLR (AUC=0.597, p=0.004). Moreover, NLR (AUC=0.571, p=0.017), IBI-NLR (AUC=0.576, p=0.010), and IBI-SII (AUC=0.562, p=0.036) had modest discrimination for major organ involvement. In contrast, inflammatory indexes were not predictive for mortality (p > 0.05 for all). Mortality was independently associated with higher creatinine (OR=1.086, p=0.048), higher ESR (OR=1.023, p=0.046), and lower uric acid levels (OR=0.454, p=0.002). Conclusions: Inflammatory indices may not predict mortality in BD but can help identify vascular and major organ involvement. Male sex and ESR level are associated more severe disease, while mortality is associated with renal dysfunction and systemic inflammation in BD.
Keywords:
1. Introduction
2. Materials and Methods
Study Overview
Data Collection
Inclusion Criteria
Exclusion Criteria
3. Results
4. Discussion
5. Conclusions
Supplementary Materials
Author Contributions
Funding
Institutional Review Board Statement
Informed Consent Statement
Data Availability Statement
Acknowledgments
Conflicts of Interest
References
- Sakane, T.; Takeno, M.; Suzuki, N.; Inaba, G. Behçet’s disease. New England Journal of Medicine 1999, 341(17), 1284–1291. [Google Scholar] [CrossRef] [PubMed]
- Yazici, H.; Seyahi, E.; Hatemi, G.; Yazici, Y. Behçet syndrome: A contemporary view. Nature Reviews Rheumatology 2018, 14(2), 107–119. [Google Scholar] [CrossRef] [PubMed]
- Davatchi, F.; Chams-Davatchi, C.; Shams, H.; Shahram, F.; Nadji, A.; Akhlaghi, M.; Ghodsi, Z. Behçet’s disease: Epidemiology, clinical manifestations, and diagnosis. Expert Review of Clinical Immunology 2017, 13(1), 57–65. [Google Scholar] [CrossRef] [PubMed]
- International Team for the Revision of the International Criteria for Behçet’s Disease (ITR-ICBD). The International Criteria for Behçet’s Disease (ICBD): A collaborative study of 27 countries on the sensitivity and specificity of the new criteria. Journal of European Academy of Dermatology and Venereology 2014, 28(3), 338–347. [Google Scholar] [CrossRef] [PubMed]
- Guthrie, G.J.K.; Charles, K.A.; Roxburgh, C.S.D.; Horgan, P.G.; McMillan, D.C.; Clarke, S.J. The systemic inflammation-based neutrophil–lymphocyte ratio: Experience in patients with cancer. Critical Reviews in Oncology/Hematology 2013, 88(1), 218–230. [Google Scholar] [CrossRef] [PubMed]
- Yang, R.; Chang, Q.; Meng, X.; Gao, N.; Wang, W. Prognostic value of systemic immune-inflammation index in cancer: A meta-analysis. Journal of Cancer 2018, 9(18), 3295–3302. [Google Scholar] [CrossRef] [PubMed]
- Fest, J.; Ruiter, T.R.; Groot Koerkamp, B.; Rizopoulos, D.; Ikram, M.A.; van Eijck, C.H.J.; Stricker, B.H. The neutrophil-to-lymphocyte ratio is associated with mortality in the general population. European Journal of Epidemiology 2018, 34(5), 463–470. [Google Scholar] [CrossRef] [PubMed]
- Zahorec, R. Ratio of neutrophil to lymphocyte counts—Rapid and simple parameter of systemic inflammation and stress in critically ill. Bratislavské Lekárske Listy 2001, 102(1), 5–14. [Google Scholar] [PubMed]
- Gasparyan, A.Y.; Ayvazyan, L.; Mukanova, U.; Yessirkepov, M.; Kitas, G.D. The platelet-to-lymphocyte ratio as an inflammatory marker in rheumatic diseases. Annals of Laboratory Medicine 2019, 39(4), 345–357. [Google Scholar] [CrossRef] [PubMed]
- Hu, B.; Yang, X.R.; Xu, Y.; Sun, Y.F.; Sun, C.; Guo, W.; Zhou, J. Systemic immune-inflammation index predicts prognosis of patients after curative resection for hepatocellular carcinoma. Clinical Cancer Research 2014, 20(23), 6212–6222. [Google Scholar] [CrossRef] [PubMed]
- Chen, Z.; Shao, Y.; Fan, M.; Zhuang, Q.; Wang, K.; Cao, W.; Xu, X. Prognostic significance of C-reactive protein–based inflammatory indices in solid tumors. Oncotarget 2018, 9(30), 21370–21380. [Google Scholar] [CrossRef]
- Kural-Seyahi, E.; Fresko, I.; Seyahi, N.; Ozyazgan, Y.; Mat, C.; Hamuryudan, V.; Yazici, H. The long-term mortality and morbidity of Behçet syndrome: A 2-decade outcome survey of 387 patients followed at a dedicated center. Medicine (Baltimore) 2003, 82(1), 60–76. [Google Scholar] [CrossRef] [PubMed]
- Seyahi, E. Behçet’s disease: How to diagnose and treat vascular involvement. Best Practice & Research Clinical Rheumatology 2019, 33(6), 101491. [Google Scholar] [CrossRef]
- Hatemi, G.; Christensen, R.; Bang, D.; Bodaghi, B.; Celik, A.F.; Fortune, F.; Yazici, H. 2018 update of the EULAR recommendations for the management of Behçet’s syndrome. Annals of the Rheumatic Diseases 2018, 77(6), 808–818. [Google Scholar] [CrossRef] [PubMed]
- Pearson, T.A.; Mensah, G.A.; Alexander, R.W.; Anderson, J.L.; Cannon, R.O.; Criqui, M.; Vinicor, F. Markers of inflammation and cardiovascular disease: Application to clinical and public health practice. Circulation 2003, 107(3), 499–511. [Google Scholar] [CrossRef] [PubMed]
- Furman, D.; Campisi, J.; Verdin, E.; Carrera-Bastos, P.; Targ, S.; Franceschi, C.; Slavich, G.M. Chronic inflammation in the etiology of disease across the life span. Nature Medicine 2019, 25(12), 1822–1832. [Google Scholar] [CrossRef] [PubMed]

| Variables | Total | Female (n=178) |
Male (n=266) |
p value |
|---|---|---|---|---|
| Oral aphthae, n (%) | 437 (98.4) | 174 (97.8) | 263 (98.9) | 0.446 |
| Genital ulcer, n (%) | 329 (74.1) | 138 (77.5) | 191 (71.8) | 0.186 |
| Uveitis, n (%) | 183 (41.2) | 68 (38.2) | 115 (43.2) | 0.325 |
| ELL, n (%) | 102 (23.0) | 47 (26.4) | 55 (20.7) | 0.169 |
| Acneiform lesions, n (%) | 272 (61.4) | 102 (57.3) | 170 (64.2) | 0.164 |
| Vascular involvement, n (%) | 90 (20.3) | 18 (10.1) | 72 (27.1) | 0.001 |
| Major organ involvements, n (%) | 138 (31.1) | 36 (20.2) | 102 (38.3) | 0.001 |
| Exitus (Mortality) , n (%) | 13 (2.9) | 6 (3.4) | 7 (2.6) | 0.776 |
| Variables | No vascular involvement (n = 354) |
Vascular involvement (n = 90) |
p value† |
|---|---|---|---|
| WBC (×10⁹/L) | 8.04 (0.86–21.01) | 9.07 (1.04–27.26) | .006 |
| Neutrophils (×10⁹/L) | 4.93 (0.27–42.00) | 5.93 (1.22–25.00) | .004 |
| Lymphocytes (×10⁹/L) | 2.09 (0.13–29.33) | 1.89 (0.11–5.03) | .075 |
| Platelets (×10⁹/L) | 286 (29.6–2353) | 272 (119–815) | .527 |
| Hemoglobin (g/dL) | 13.8 (4.1–1415) | 14.3 (8.6–16.8) | .093 |
| Creatinine (mg/dL) | 0.80 (0.40–31.0) | 0.82 (0.38–16.0) | .018 |
| Urea (mg/dL) | 26.0 (0.41–345) | 28.0 (0.51–58.0) | .173 |
| ALT (U/L) | 18 (0.18–142) | 18.5 (3–194) | .235 |
| GGT (U/L) | 18 (2–177) | 25 (1–288) | .010 |
| Uric acid (mg/dL) | 4.4 (0.40–54.0) | 4.8 (0.80–54.0) | .003 |
| CRP (mg/L) | 4.62 (0.01–241) | 7.83 (0.01–175) | .001 |
| ESR (mm/hour) | 17 (1-88) | 22.5 (3-143) | .009 |
| NLR | 2.29 (0.12–30.79) | 2.87 (0.84–105.25) | .004 |
| PLR | 136.6 (8.8–2102) | 147.4 (49.2–5418) | .319 |
| SII | 650.3 (34.6–8220) | 733.3 (174.6–52827) | .044 |
| IBI-NLR | 11.91 (0.02–2479.8) | 27.65 (0.01–1870.2) | .0001 |
| IBI-SII | 3557 (4.9–952924) | 7461 (3.0–1114655) | .001 |
| Variables | No major organ involvement (n = 306) | Major organ involvement (n = 138) | p value† |
|---|---|---|---|
| WBC (×10⁹/L) | 8.04 (0.86–21.01) | 8.67 (1.04–27.26) | .003 |
| Neutrophils (×10⁹/L) | 4.93 (0.27–42.00) | 5.40 (1.22–25.00) | .010 |
| Lymphocytes (×10⁹/L) | 2.09 (0.13–29.33) | 2.03 (0.11–5.03) | .226 |
| Platelets (×10⁹/L) | 286.5 (29.6–2353) | 263 (119–815) | .106 |
| Hemoglobin (g/dL) | 13.8 (4.1–17.6) | 14.1 (4.6–1415) | .401 |
| Creatinine (mg/dL) | 0.79 (0.40–31.0) | 0.82 (0.38–27.0) | .001 |
| Urea (mg/dL) | 26.0 (0.41–345) | 29.0 (0.51–85.0) | .004 |
| ALT (U/L) | 18 (2–142) | 19 (0.18–194) | .141 |
| GGT (U/L) | 17 (2–177) | 25 (1–288) | .005 |
| Uric acid (mg/dL) | 4.4 (0.40–49.0) | 4.8 (0.80–54.0) | .010 |
| CRP (mg/L) | 4.83 (0.04–241.0) | 6.61 (0.01–175.0) | .136 |
| ESR (mm/hour) | 17 (1-88) | 21.5 (1-143) | .030 |
| NLR | 2.30 (0.12–30.79) | 2.66 (0.76–105.25) | .017 |
| PLR | 137.8 (8.8–2102) | 136.7 (39.3–5418) | .911 |
| SII | 660.6 (34.6–8220) | 695.7 (161.3–52827) | .234 |
| IBI-NLR | 12.19 (0.06–2479.8) | 20.69 (0.01–1870.2) | .010 |
| IBI-SII | 3591 (44.1–95292) | 5723 (3-1114655) | .036 |
| Variables | Alive (n = 431) | Deceased (n = 13) | p value† |
|---|---|---|---|
| WBC (×10⁹/L) | 8.10 (0.86–27.26) | 8.80 (4.46–15.92) | .246 |
| Neutrophils (×10⁹/L) | 5.01 (0.27–42.00) | 5.89 (2.34–11.58) | .285 |
| Lymphocytes (×10⁹/L) | 2.07 (0.11–29.33) | 2.43 (1.28–4.47) | .268 |
| Platelets (×10⁹/L) | 284 (29.6–2353) | 298 (162–529) | .559 |
| Hemoglobin (g/dL) | 13.9 (4.1–1415) | 12.2 (10.0–16.6) | .110 |
| Creatinine (mg/dL) | 0.80 (0.38–31.0) | 1.00 (0.49–27.0) | .007 |
| Urea (mg/dL) | 26.5 (0.41–345) | 28.0 (14–54) | .551 |
| ALT (U/L) | 18 (0.18–194) | 16 (8–38) | .329 |
| GGT (U/L) | 19 (1–288) | 12 (6–116) | .185 |
| Uric acid (mg/dL) | 4.6 (0.40–54.0) | 3.0 (0.64–6.60) | .001 |
| CRP (mg/L) | 5.40 (0.01–241) | 5.60 (3.08–34.0) | .980 |
| ESR (mm/hour) | 18 (1-143) | 32 (9-88) | .003 |
| NLR | 2.36 (0.12–105.25) | 2.30 (1.29–5.48) | .994 |
| PLR | 137.7 (8.8–5418) | 125.4 (49.2–263.2) | .636 |
| SII | 673.5 (34.6–52827) | 795.1 (293.5–2237.4) | .780 |
| IBI-NLR | 13.50 (0.01–2479.8) | 13.51 (4.26–114.3) | .810 |
| IBI-SII | 3983 (3.0–1114655) | 4552 (1269–38163) | .684 |
| Inflammatory Indexes | Mortality AUC (95% CI) | p value | Major Organ Involvement AUC (95% CI) | p value | Vascular Involvement AUC (95% CI) | p value |
|---|---|---|---|---|---|---|
| NLR (NEU/LYM) | 0.501 (0.335–0.666) | 0.994 | 0.571 (0.512–0.629) | 0.017 | 0.597 (0.528–0.666) | 0.004 |
| PLR | 0.462 (0.328–0.595) | 0.636 | 0.503 (0.443–0.564) | 0.911 | 0.534 (0.463–0.605) | 0.319 |
| SII | 0.523 (0.346–0.700) | 0.780 | 0.535 (0.476–0.595) | 0.234 | 0.569 (0.498–0.639) | 0.044 |
| IBI-NLR (CRP × NLR) | 0.520 (0.389–0.650) | 0.810 | 0.576 (0.516–0.636) | 0.010 | 0.624 (0.555–0.692) | <0.001 |
| IBI-SII (CRP × SII) | 0.533 (0.408–0.659) | 0.684 | 0.562 (0.502–0.622) | 0.036 | 0.609 (0.539–0.679) | 0.001 |
| Markers | Outcomes | Cut-off (≥) | Sensitivity | Specificity | Youden |
| NLR (NEU/LYM) | Mortality | 1.35–1.37 | 0.846 | 0.102 | ~0.12 |
| Major organ involvement | ≈ 1.35 | 0.920 | 0.114 | 0.034 | |
| Vascular involvement | ≈ 1.35 | 0.933 | 0.114 | 0.047 | |
| PLR | Mortality | 107.8–108.2 | 0.846 | 0.269 | ~0.12 |
| Major organ involvement | ≈ 107.8 | 0.696 | 0.269 | −0.035 | |
| Vascular involvement | ≈ 107.8 | 0.700 | 0.278 | −0.022 | |
| SII | Mortality | 358–361 | 0.846 | 0.148 | ~0.13 |
| Major organ involvement | ≈ 358–361 | 0.848 | 0.147 | −0.005 | |
| Vascular involvement | ≈ 358–361 | 0.856 | 0.147 | 0.003 | |
| IBI-NLR | Mortality | 4.26–4.28 | 0.923 | 0.100 | ~0.12 |
| Major organ involvement | ≈ 4.9–5.1 | 0.877 | 0.154 | 0.031 | |
| Vascular involvement | ≈ 4.9–5.1 | 0.922 | 0.154 | 0.076 | |
| IBI-SII (CRP × SII) | Mortality | 1,816–1,828 | 0.846 | 0.278 | ~0.12 |
| Major organ involvement | ≈ 1,816–1,828 | 0.761 | 0.294 | 0.055 | |
| Vascular involvement | ≈ 1,816–1,828 | 0.846 | 0.278 | 0.124 |
| Variables | Univariate OR (95% CI) | p value | Multivariable OR (95% CI) | p value |
| Gender (M/F) | 0.775 (0.256-2.345) | 0.652 | ||
| Vascular involvement | 0.709 (0.154–3.256) | 0.658 | — | — |
| Major organ involvement | 0.394 (0.086–1.804) | 0.230 | — | — |
| Uric acid | 0.352 (0.223–0.555) | <0.001 | 0.454 (0.278–0.741) | 0.002 |
| Creatinine | 1.171 (1.088–1.259) | <0.001 | 1.086 (1.001–1.179) | 0.048 |
| ESR (ESH) | 1.026 (1.006–1.047) | 0.010 | 1.023 (1.000–1.046) | 0.046 |
| Hemoglobin | 0.815 (0.630–1.054) | 0.119 | — | — |
| Platelet count | 1.001 (0.998–1.003) | 0.659 | — | — |
| NLR (NEU/LYM) | 0.949 (0.743–1.212) | 0.674 | — | — |
| PLR | 0.997 (0.988–1.005) | 0.444 | — | — |
| SII (per 100 units) | 0.994 (0.951–1.039) | 0.805 | — | — |
| IBI-NLR (per 100 units) | 0.718 (0.299–1.723) | 0.458 | — | — |
| IBI-SII (CRP×SII per 1000 units) | 0.991 (0.965–1.017) | 0.483 | — | — |
| Variables | Univariate OR (95% CI) | p value | Multivariable OR (95% CI) | p value |
|---|---|---|---|---|
| Gender (M/F) | 2.453 (1.578-3.815) | 0.0001 | 3.223 (1.833-5.668) | 0.0001 |
| Uric acid | 1.026 (0.987–1.066) | 0.195 | — | — |
| Creatinine | 0.986 (0.906–1.074) | 0.749 | — | — |
| ESR (ESH) | 1.018 (1.007–1.029) | 0.001 | 1.013 (1.002–1.024) | 0.018 |
| Platelet count | 1.000 (0.998–1.002) | 0.928 | — | — |
| Hemoglobin | 0.998 (0.989–1.008) | 0.721 | — | — |
| NLR (NEU/LYM) | 1.082 (1.013–1.155) | 0.019 | — | — |
| PLR | 1.001 (1.000–1.002) | 0.079 | — | — |
| SII (per 100 units) | 1.023 (1.003–1.044) | 0.027 | — | — |
| IBI-NLR (per 100 units) | 1.106 (1.023–1.195) | 0.011 | ||
| IBI-SII (CRP×SII per 1000 units) | 1.003 (1.001–1.005) | 0.007 | 1.001 (0.999-1.004) | 0.295 |
| Variables | Univariate OR (95% CI) | p value | Multivariable OR (95% CI) | p value |
|---|---|---|---|---|
| Gender (M/F) | 2.453 (1.578-3.815) | 0.001 | 2.429 (1.554-3.797) | 0.001 |
| Uric acid | 1.032 (0.993–1.074) | 0.109 | — | — |
| Creatinine | 1.001 (0.936–1.070) | 0.979 | — | — |
| ESR (ESH) | 1.013 (1.004–1.023) | 0.007 | 1.011 (1.001–1.023) | 0.039 |
| Platelet count | 1.000 (0.998–1.002) | 0.928 | — | — |
| Hemoglobin | 0.998 (0.989–1.008) | 0.721 | — | — |
| NLR (NEU/LYM) | 1.069 (1.003–1.138) | 0.039 | — | — |
| PLR | 1.001 (1.000–1.002) | 0.158 | — | — |
| SII (per 100 units) | 1.020 (1.000–1.040) | 0.051 | — | — |
| IBI-NLR (per 100 units) | 1.073 (0.995–1.157) | 0.067 | — | — |
| IBI-SII (CRP×SII per 1000 units) | 1.002 (1.000–1.004) | 0.039 | 1.001 (0.999–1.003) | 0.527 |
Disclaimer/Publisher’s Note: The statements, opinions and data contained in all publications are solely those of the individual author(s) and contributor(s) and not of MDPI and/or the editor(s). MDPI and/or the editor(s) disclaim responsibility for any injury to people or property resulting from any ideas, methods, instructions or products referred to in the content. |
© 2026 by the authors. Licensee MDPI, Basel, Switzerland. This article is an open access article distributed under the terms and conditions of the Creative Commons Attribution (CC BY) license (http://creativecommons.org/licenses/by/4.0/).


