
Submitted:
20 January 2026
Posted:
21 January 2026
You are already at the latest version
Abstract
Background: Currently, the duration of tourniquet time in total knee arthroplasty is chosen by the surgeons and varies between 0 and 120 minutes. Studies evaluating the effect of tourniquet time in this operation are lacking. The purpose of this study was, therefore, to determine whether the duration of tourniquet-induced limb ischemia during total knee arthroplasty influences reperfusion injury, resulting in pain, swelling and the release of proinflammatory markers. Methods: In 40 patients undergoing total knee arthroplasty, tourniquet was applied for up to 30 minutes (group A, short tourniquet) or 90-120 minutes (group B, long tourniquet). Postoperative pain and swelling served as primary outcome parameters. The levels of pro- and anti-inflammatory markers (D-dimers, C3a, C5a, TAT, fetuin-A, PAI-I/tPA complexes, CK-MM, IP10, M-CSF, MIG, MIP-1α, and sC5b9) before surgery and 4 hours, 24 hours and 48 hours after surgery, were used as secondary outcome parameters. Results: Patients in group B, with the long tourniquet time, required patient-controlled intravenous analgesia more frequently than group A patients (47% versus 5%, group B vs. group A, p < 0.0001). However, there were no differences in numeric rating pain scale (NRS) scores and calf circumference between groups A and B. In group B, a significantly higher increase of C3a levels between 4 h and 48 h, a significantly higher increase for MIG between 4 h and 48 h as well as 24 h and 48 h, and a significantly higher increase in M-CSF levels between 24 h and 48 h were observed when compared to group A. Conclusions: Tourniquet times between 90 and 120 minutes, despite currently being accepted in the clinical setting, were associated with an increased need for intravenous analgesia and higher increase of the pro-inflammatory markers C3a, MIG, and M-CSF, suggesting a more pronounced ischemia/reperfusion injury with tourniquet times longer than 90 minutes.
Keywords:
total knee arthroplasty
; tourniquet
; ischemia/reperfusion injury
; pain
; markers of inflammation
Background
Total knee arthroplasty (TKA) is a surgery to replace the knee joint by a prosthesis, in the majority of cases due to osteoarthritis. This type of surgery can be done with the use of a tourniquet to restrict blood flow to the affected limb and, therefore, have better vision in the operative field. The tourniquet can be applied for a short (only during cementation) or a long (during the whole procedure) time period, both are accepted in clinical practice with no consensus on benefits and harms. Ischemia created by a tourniquet leads to ischemia/reperfusion injury (IRI), a process that results in an increased release of proinflammatory factors after re-opening the tourniquet. IRI can lead to serious local complications such as edema and subsequent necrosis of the skeletal muscle due to compartment syndrome. In severe cases also systemic consequences can occur, including acute respiratory distress syndrome (ARDS) or even multiorgan failure [1].
In our study, a set of proinflammatory mediators, growth factors, cytokines and complement activation were investigated. Those were complement factor 3a (C3a), complement factor 5a (C5a), interferon-gamma induced protein (IP10), macrophage inflammatory protein 1 alpha (MIP-1α), the soluble terminal complement complex sC5b-9, creatine kinase MM (CK-MM), D-dimers, thrombin-antithrombin complexes (TAT), complexes of plasminogen activator inhibitor 1 (PAI-I) with tissue-type plasminogen activator (t-PA), macrophage colony stimulating factor (M-CSF), monokine induced by gamma interferon (MIG), and fetuin-A. The last three are supposed to have protective effects in IRI, whereas the other markers were reported to aggravate IRI.
Patients and Methods
To assess the effect of tourniquet duration on IRI, a randomized single-blinded case-control study was performed, in which short (<30 min, group A) and long (90-120 min, group B) application of a tourniquet were compared in TKA. Group A served as the control group, patients in group B as cases. The hypothesis was that a longer tourniquet time leads to higher IRI.
The primary outcomes were pain and swelling. As secondary outcomes, the levels of pro- and anti-inflammatory markers in the plasma of the patients were investigated. The study was approved by the local ethics committee and registered on ISRCTN.
To test our hypothesis, the consent to participate was obtained from 40 patients scheduled for TKA at our hospital, between May 2, 2018, and November 15, 2021. There is currently no data available allowing a formal sample size calculation, so that the number of participants was determined by the authors who planned the study. The trial ended when 40 patients were recruited. All eligible patients were asked by the surgeon who saw them at the consultations if they wanted to participate or by telephone by one of the authors when they were scheduled for surgery. Inclusion criteria were age between 18 and 90 years with a planned TKA. Exclusion criteria were acute traumatic injury/infection, pregnancy/breastfeeding, patients who had elevated infection parameters one day before surgery (leukocyte count Lc > 10.5*109/L, CRP >10 mg/dl), and patients who took steroids or other medications that affect the immune system. If CRP (and/or Lc) were only moderately elevated (Lc <12*109/L, CRP <15 mg/dl), a clinical assessment for infection was performed. If this showed no evidence of infection, elevated Lc and CRP were interpreted as being caused by the osteoarthritis and these patients were included in the study. Patients were then randomized electronically into two groups right before surgery: Group A with a short tourniquet time (max. 30 min, only during cementation) and group B with a long tourniquet time (90-120 min, during the whole surgery). As tourniquet, the Automatic Tourniquet System ATS 4000, Zimmer, USA, was applied. Right before surgery, the surgeon was handed out a sealed envelope with the assigned group of the patient and used the tourniquet accordingly. It was inflated to 350 mmHg, or systolic blood pressure plus 100 mmHg, depending on the surgeon’s choice. The surgery team was not blinded to long- or short tourniquet application since this is technically not feasible. Patients, hospital- and laboratory staff outside surgery were blinded since they had no access to the assignment to the groups. All procedures, except for duration of the tourniquet, did not differ between the groups.
Blood samples were collected and the calf circumference measured before surgery and 4 hours, 24 hours and 48 hours after surgery. Measuring the calf circumference was done 15 cm underneath the distal patella pole. Data collection ended 48 hours after surgery.
The following clinical data of each patient were collected: sex, age (at the day of surgery), body mass index (BMI), American Society of Anesthesiologist classification (ASA-score), pain scores before and after surgery (numeric rating scale NRS 0 to 10 after 4 h, 24 h, 48 h), duration of surgery, systolic blood pressure before tourniquet inflation, tourniquet pressure, tourniquet time, intraoperative blood loss, application of tranexamic acid, the need for patient controlled intravenous analgesia (PCIA), and calculated equipotent doses of per os morphine and PCIA. To evaluate the markers of IRI, the following laboratory data of each patient were collected: D-dimers, C5a, TAT, fetuin-A, PAI-1/tPA complexes, CK-MM, and C3a by ELISA; IP10, M-CSF, MIG, MIP-1α and sC5b-9 were quantified with a Bio-Plex assay from Bio-Rad. For patients 1-20, the following additional markers were measured in plasma: PDGF, TNF-alpha, MCP-1, G-CSF, GM-CSF, CTACK, Eotaxin, GRO-alpha, HGF, IFN-alpha2, IFN-gamma, IL-1ra, IL-2Ralpha, IL-1beta, IL-6, IL-7, IL-8, IL-9, IL-13, IL-16, IL-18, LIF, MIF, MIP-1beta, RANTES, SCF, SCGF-beta, SDF-1alpha, TNF-beta, TRAIL, bFGF, VEGF with the Bio-Plex assay from Bio-Rad. The concentration of the markers was calculated by creating a standard curve using GraphPad Prism (Version 10) from the ELISA. Concentrations of the markers measured with the Bio-Plex multiplex suspension array technique were calculated directly by the machine based on a 5-parameter logistic regression algorithm. All randomized participants were included in calculations.
We compared epidemiological data using Student’s t-test, one-way ANOVA for multiple comparisons, and contingency table for categorial data. For blood loss, since data did not show a Gaussian distribution, the Man-Whitney-U-Test was used. Because of the quite different baseline levels in our patients, which had underlying diseases and were often elderly, we calculated the increase of proinflammatory markers over time, expressed as the slope between data points. To obtain the x-fold increase or decrease compared to baseline (BL) before surgery, all data were normalized by division through the BL values. The same calculations were then done with normalization to the 4 h values to check for later increase or decrease. To take the dynamics of our data into account, the linear slope of the graphs from the 4 h to the 48 h sample (without 24 h) were assessed, normalized to BL, and same was done for the 24 h to the 48 h sample, normalized to 4 h. To check for differences, the calculated slopes were compared using Student’s t-test with p ≤ 0.05 considered as statistically significant. Missing data occurred during data collection and completely at random; calculations were done without those values.
For pain medication, the doses of the opioids from immediately postoperative to 48 h after surgery were totaled. Intraoperative medication during anesthesia was not considered. Equipotent doses of per os morphine and PCIA were calculated and added up to compare the different patients with each other. The dose was multiplied by 1.5 for Oxycodone and by 11 for intravenous hydromorphone from the PCIA [2]. Other pain medications were not administered during the observation period of this study due to allergies or intolerances and restriction of non-steroidal anti-inflammatory drugs (NSAID) in older patients and in patients with reduced renal function.
Results
There were 39 TKA and one unilateral knee arthroplasty (UKA). The UKA was included since it was scheduled and set up for TKA, but the decision for UKA was made intraoperatively. All interventions were done at the Department for Orthopedic Surgery, University Hospital/Inselspital Bern, Switzerland, by four different surgeons. All 40 patients were included in the analyses.
The tourniquet time differed significantly between group A (23 patients), the short tourniquet group, and group B (17 patients), the long tourniquet group. There were no differences between the groups regarding age, sex, baseline health status, duration of surgery, type of anesthesia, tourniquet pressure, and the application of tranexamic acid as shown in tables 1 and 2. No harms were identified.

Table 1.
Statistical parameters of groups A and B and their p-values.
| Parameter | Group | Mean value | SDa | Range | p |
| Tourniquet time | A | 30.1 min | 5.67 | 16 – 44 min | <0.0001 |
| B | 113.2 min | 11.23 | 90 – 127 min | ||
| Age | A | 67.7 y | 11.02 | 47 – 86 y | 0.74 |
| B | 66.5y | 11.18 | 44 – 79 y | ||
| BMI | A | 29.45 kg/m² | 5.86 | 20.1 – 42.70 kg/m² | 0.29 |
| B | 31.51 kg/m² | 6.26 | 23.5 – 40.06 kg/m² | ||
| ASA | A | 2.70 | 0.56 | 2 – 4 | 0.96 |
| B | 2.71 | 0.59 | 2 – 4 | ||
| Tourniquet pressure | A | 302.6 mmHg | 30.48 | 270 – 350 mmHg | 0.08 |
| B | 318.8 mmHg | 25.22 | 250 – 350 mmHg | ||
| Systolic BP before tourniquet | A | 114.8 mmHg | 17.42 | 90 – 145 mmHg | 0.09 |
| B | 125.9 mmHg | 22.86 | 90 – 165 mmHg | ||
| Duration of surgery | A | 146.9 min | 33.34 | 90 – 232 min | 0.94 |
| B | 147.8 min | 40.33 | 100 – 258 min |
a Standard deviation (SD), range and p-values calculated by unpaired t-test.
Table 2.
Statistical parameters of groups A and B, non-continuous variables.
| Parameter | Group | Variable a | Variable b | pb |
| Sex | A | 10 female | 13 male | 0.99 |
| B | 8 female | 9 male | ||
| Tranexamic Acid | A | 10 yes | 13 no | 0.32 |
| B | 4 yes | 13 no | ||
| Type of anesthesia | A | 6 Spinal | 17 General | 0.71 |
| B | 3 Spinal | 14 General |
b p-values calculated by Fisher’s exact test.
Primary outcome parameters: Pain was evaluated as the first primary outcome parameter. Patients in the long-tourniquet group (Group B) needed patient-controlled intravenous analgesia (PCIA) more often than patients from group A (group A: 5%, group B: 47%, p<0.001, Figure 1a). However, there were no significant differences between NRS pain scores for group A and group B. Pain scores increased until 24 hours after surgery with a mean NRS of 4 in both groups, and started to decrease afterwards for to NRS 2 in group A and NRS 3 in group B (Figure 1b).
For swelling, a non-significant tendency (p=0.07) was found for a higher increase of the calf circumference from 24 h to 48 h in group B compared to group A when the values were normalized to 4 h (Figure 2a). We could not show this tendency over the whole period of 4-48 h with the values normalized to the BL (Figure 2b).
Blood loss was lower in group B with the long tourniquet than in group A with a p-value of 0.046. (Figure 3).
Secondary outcomes: A significantly higher mean increase of C3a levels between 4 h and 48 h was found in group B when values were normalized to BL (Figure 4). In Group A, C3a levels decreased with a mean slope of -0.003 whereas in Group B they were still increasing postoperatively with a mean slope of 0.011. There were no significant changes between 24 h and 48 h when values were normalized to 4h (additional file 1).
In contrast, for C5a, a postoperative increase of the plasma levels between 4 h and 48 h, normalized to BL, was observed in both groups but no significant inter-group differences were found (Figure 5). This increase was less pronounced between 24 h and 48 h when normalized to 4h, with no significant inter-group differences (additional file 2).
PAI-1/tPA complexes were measured to assess endothelial cell activation due to IRI. As shown in Figure 6, the changes in PAI-1/tPA complex levels from 4 h to 48 h post-surgery were not significantly different between groups, but a tendency for a higher increase of PAI-1/tPA complexes, suggesting an increased procoagulant state of the endothelium, was found in group B compared to group A (Figure 6). This tendency was not shown between 24 h and 48 h when normalized to 4h (additional file 3).
There were no differences in the levels of Fetuin A, TAT, CK-MM and D-Dimers between groups A and B from 4 h to 48 h post-surgery and from 24 h to 48 h post-surgery. Graphs are available in the additional files no. 4 - 7.
In the Bio-Plex assay for pro- and anti-inflammatory markers, a significantly higher increase for MIG was shown in group B, both between 4 h and 48 h (normalized to BL) and between 24 h and 48 h (normalized to 4 h, Figure 7). The values slightly decreased between 24 h and 48 h in group A, whereas an increase of the values was seen for group B. The difference of the average calculated slopes was significant with p=0.036 (Figure 7a). There was also a significant inter-group difference for MIG in the time frame 24 h to 48 h, normalized to 4 h, with p=0.02 (Figure 7b).
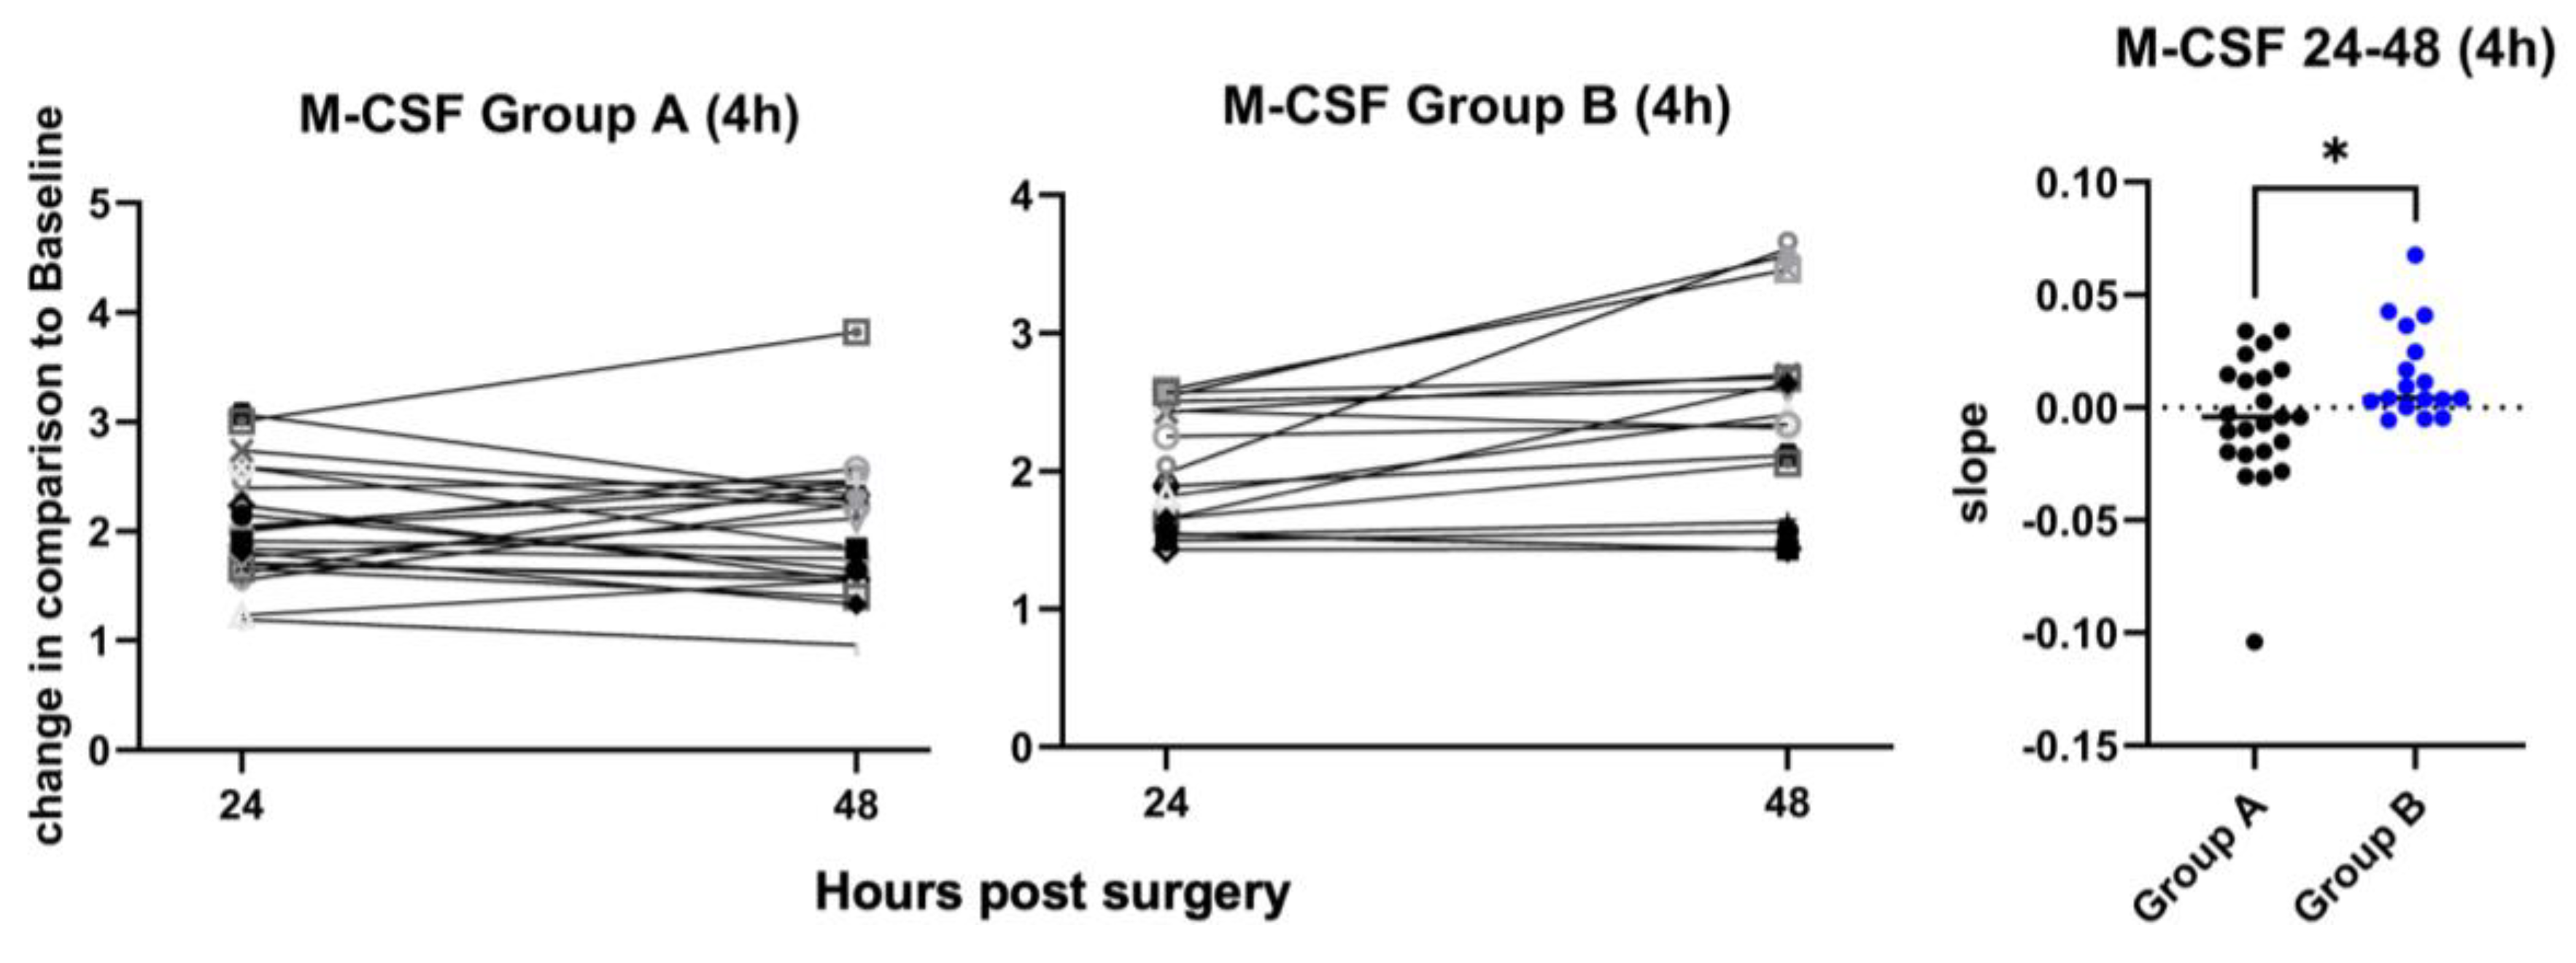
M-CSF levels, normalized to 4 h, increased significantly more between 24 h and 48 h in group B than in group A, p=0.019 (Figure 8). Not shown in the graph for group A in Figure 8, but included in the calculations, is one patient with a very high increase of the M-CSF levels (24 h: 19.77-fold increase, 48 h: 17.28-fold increase). There was no reason to exclude this patient from the M-CSF analysis. M-CSF levels when normalized to BL showed no significant in- or decrease (additional file 8).
There were no significant differences between groups in the changes over time for IP-10, MIP-1α and sC5b-9. Calculations and graphs are available in the additional files 9 - 11. Additionally, CTACK, eotaxin, bFGF, G-CSF, GM-CSF, GRO-alpha, HGF, IFN-alpha2, IFN-gamma, IL-1beta, IL-1ra, IL-2Ralpha, IL-6, IL-7, IL-8, IL-9, IL-13, IL-16, IL-18, LIF, MIF, MIP-1beta, RANTES, SCF, SCGF-beta, SDF-1alpha, TNF-beta, TRAIL, MCP-1, PDGFbb, and VEGF did not show any significant differences for patients 1-20 between group A and group B in the one way ANOVA when normalized to BL, so that we did not investigate those for patients 21-40. Graphs are available in additional file12.
Discussion
The aim of this study was to assess the effect of a short (30-60 min) vs. long (90-120 min) tourniquet duration on clinical features and on plasma markers of IRI in total knee arthroplasty surgery. Our hypothesis was, that a long tourniquet duration, even when staying within the clinically accepted time window of 120 min of limb ischemia, would lead to a more pronounced IRI. Clinically, this would potentially lead to more pain and swelling, and pro-inflammatory markers in plasma would be elevated.
In line with our hypothesis, patients in the long tourniquet group (Group B) more frequently used patient-controlled intravenous analgesia (PCIA) (Figure 1a). However, pain levels reported by the patients themselves on an analog pain scale (NRS), were not significantly different between the two groups (Figure 1b). This indicates that pain levels were actually higher in patients of group B, with long tourniquet times, but were successfully lowered by PCIA.
For swelling, measured as the increase of the calf circumference, the differences between short- and long tourniquet duration were not statistically significant, but showed a tendency for an increased swelling with long tourniquet application 24 h to 48 h post operation. Our interpretation of this finding is that from day 1 to day 2 there seems to be a higher progress in the swelling after use of a long tourniquet time compared to use of a short tourniquet time. These results are in line with a meta-analysis by Han et al. and two randomized control trials, which found higher pain scores, bigger swelling and also worse functional scores with longer tourniquet application [3,4,5]. However, a big meta-analysis by Xu et al. could not find any significant differences in pain, swelling and range of motion [6], so that the influence of the tourniquet on those outcomes is not entirely clear.
Intraoperative blood loss was significantly lower in the long tourniquet group due to reduced bleeding by compression of blood vessels, which is one of the reasons to use a tourniquet. Several studies and Meta analyses also showed lower intraoperative blood loss with longer tourniquet application [3,4,5,6]. However, none of these studies could show an impact on the need of blood transfusions.
For the analyzed inflammation markers, there was a significantly higher expression of C3a in the long tourniquet group. C3a is a central marker for complement activation via any of the three initiation pathways. Complement activation is known to occur in the context of IRI and our data support the hypothesis that the longer tourniquet time leads to a more pronounced IRI [7]. When comparing the increase of the inflammation markers M-CSF and MIG between 24 h and 48 h, normalized to the values at 4 h, significantly higher values for both markers in the long tourniquet group were found. In addition, a (non-significant) tendency for a higher increase was shown for PAI-1/tPA complexes and a significant increase of MIG between 4 h and 48 h, normalized to the values at BL. Elevated levels of PAI-1/tPA complexes are indicative of a procoagulant state of the endothelium, which may lead to clinical problems due to hypercoagulation. The latter has already been described by Watanabe et al. [8]. This group also found significantly higher levels of D-dimers 30 – 90 seconds after surgery with long application of a tourniquet, and those levels decreased quickly. This might be the reason why our study showed no significant differences in D-dimer levels, since the earliest sample was taken 4 h after TKA. An increased pro-thrombotic state of the endothelium might also lead to a higher risk of deep vein thrombosis after TKA with a long tourniquet, as shown by Huang et al. [9].
There were also increased levels of M-CSF and MIG in the long tourniquet group, which are rather protective factors in IRI. M-CSF is increased during inflammation [10,11] and leads to an enhanced revascularization and, therefore, an equally enhanced regeneration of skeletal muscle after ischemia [12]. MIG binds competitively to certain glycosaminoglycan-receptors and hereby inhibits chemotaxis of several chemokines. This leads to a reduced tissue injury and inflammation in mouse models [13,14]. The results of our study therefore suggest that the increased IRI in the long-tourniquet group leads to an upregulation of the tissue-protective and regenerative factors M-CSF and MIG, particularly between 24 h and 48 h after surgery.
Limitations
This study has some limitations. All quantifications of proinflammatory markers, growth factors, cytokines and complement activation were done from blood serum of patients and not tissue of the affected limb. Furthermore, there was a relatively small number of patients in each group.
Conclusions
Our results show a higher need for PCIA and by tendency higher swelling in the long tourniquet group. Additionally, we found higher levels of pro-inflammatory markers. In our opinion this shows that the application of a long tourniquet leads to higher IRI. However, one advantage when using a tourniquet is a reduction of intraoperative blood loss.
Even though TKA is more and more done without the use of a tourniquet, the conclusions of our study also apply to surgeries that are still routinely done with a tourniquet, e.g. in foot and hand surgery. Therefore, the surgeon should always critically evaluate, if the advantage of a tourniquet application (lower intraoperative blood loss) outweigh its disadvantages (higher need for analgesics, more pronounced IRI).
Alternatively, and where a prolonged ischemia time of an extremity cannot be avoided, the use of drugs which were shown to prevent IRI like C1 esterase inhibitor [15], complement receptor type 1 [16], low molecular weight dextran sulfate [17], nano-antioxidants [18] or oral melatonin [19], could be envisaged in the future.
List of Abbreviations
| ANOVA | Analysis of variance |
| ASA-score | American Society of Anesthesiologists score |
| beta-NGF | beta-nerve growth factor |
| bFGF | basic fibroblast growth factor |
| BL | baseline |
| BMI | body mass index |
| BP | blood pressure |
| C3a | complement factor 3a |
| C5a | complement factor 5a |
| CK-MM | creatine kinase muscle type |
| CRP | C-reactive protein |
| CTAK | cutaneous T-cell attracting chemokine |
| DVT | deep vein thrombosis |
| ELISA | enzyme-linked immunosorbent assay |
| G-CSF | granulocyte-colony stimulating factor |
| GM-CSF | granulocyte-macrophage colony-stimulating factor |
| GRO-alpha | growth-regulated protein alpha |
| HGF | hepatocyte growth factor |
| IFN-alpha2 | interferon alpha 2 |
| IFN-gamma | interferon gamma |
| IL | interleukin |
| IP10 | interferon γ-induced protein |
| IRI | ischemia reperfusion injury |
| Lc | leukocyte |
| LIF | Leukemia inhibitory factor |
| MCP | monocyte-chemotactic protein |
| M-CSF | Macrophage colony-stimulating factor |
| MIF | Macrophage migration inhibitory factor |
| MIG | monokine induced by gamma interferon |
| MIP | Macrophage inflammatory protein |
| NRS | numeric rating scale |
| NSAID | non-steroidal anti-inflammatory drug |
| PAI-I/tPA complexes | complexes of plasminogen activator inhibitor 1 (PAI-I) with tissue-type plasminogen activator (tPA) |
| PCIA | patient controlled intravenous analgesia |
| PDGF-BB | Platelet-derived growth factor subtype BB |
| PKA | protein kinase A |
| RANTES | regulated on activation, normal T-cell expressed and secreted |
| RCT | randomized controlled trial |
| sC5b-9 | soluble terminal complement complex |
| SCF | stem cell factor |
| SCGF-beta | stem cell growth factor beta |
| SDF-1alpha | stromal cell-derived factor 1 alpha |
| TAT | thrombin-antithrombin complexes |
| TKA | total knee arthroplasty |
| TNF | tumor necrosis factor |
| TRAIL | Tumor necrosis factor-related apoptosis-inducing ligand |
| VEGF | vascular endothelial growth factor |
Funding
Partial financial support was received from CSL Behring AG, Bern, Switzerland.
Ethics Approval
All procedures performed in studies involving human participants were in accordance with the ethical standards of the institutional and/or national research committee and with the 1964 Helsinki Declaration and its later amendments or comparable ethical standards. The study was approved by the Bioethics Committee of the Canton of Bern, Switzerland (No. KEK-BE 2017-00217) July 27, 2017.
Conflicts of Interest
The authors have no relevant financial or non-financial interests to disclose.
Informed consent
Informed consent was obtained from all individual participants included in the study.
Data availability statement
The datasets generated and/or analysed during the current study are not publicly available due to sensitive patient information but are available from the corresponding author on reasonable request.
Preregistration
This study was preregistered on ISRCTN (ISRCTN87180032) on 04/11/2016: https://doi.org/10.1186/ISRCTN87180032.
Authors’ contributions
Nele Pfeiffer, together with Alain Despont, performed the analyses of patients 21-40 and wrote the manuscript. Jane Shaw was in charge with sample preparation and planning of analyses, methodology and revised the manuscript critically. Alain Despont was in charge with planning and performance of analyses of samples, methodology and critical revision of the manuscript. Jelena Kummer started with sample and data collection and, together with Alain Despont, performed the analysis of patients 1-20. She also revised the manuscript critically. Rolf Spirig was involved in planning the study and critical revision of the manuscript. Mai M. Abdelhafez helped with methodology, sample collection and laboratory analyses. She also revised the manuscript critically. Emanuel Liechti was involved in surgery, contributed to the interpretation of the results and helped revising critically the manuscript. Sandro Kohl was involved in planning of the study, surgery, and critical revision of the manuscript. Frank Klenke conceived the study with Robert Rieben, both were in charge of overall direction and planning. Robert Rieben planned and supervised the project and revised the manuscript. Nele Pfeiffer, Jelena Kummer, Emanuel Liechti and Frank Klenke had unrestricted access to all data. All authors agreed to submit the manuscript, read and approved the final draft and take full responsibility of its content.
Acknowledgments
This paper would not have been possible without the great help of the nurses and doctors at the Department of Orthopedic Surgery, the crew of the OR, and the team of the Anesthesia Recovery Room, Inselspital, University of Bern, who helped with surgery and data collection by taking blood sampled and taking measurements, contributed significantly to this study. Fetuin-A measurements were done by Dr. rer. nat. Stefan Rudloff, Inselspital, University of Bern. His help is highly appreciated. The help of Karen Sullam PhD, Agroscope, Switzerland, with biomedical questions during preparation of the manuscript is kindly acknowledged.
References
- Apichartpiyakul, P.; Shinlapawittayatorn, K.; Rerkasem, K.; Chattipakorn, S.C.; Chattipakorn, N. Mechanisms and Interventions on Acute Lower Limb Ischemia/Reperfusion Injury: A Review and Insights from Cell to Clinical Investigations. Ann Vasc Surg 2022, 86, 452–481. [Google Scholar] [CrossRef] [PubMed]
- Morphine equivalent dose (MED) - Opioid conversions. Available online: https://globalrph.com/medcalcs/morphine-equivalent-dose-med-opioid-conversions/ (accessed on 03-09 2023).
- Han, J.; Zhang, X.Y.; Mu, S.Y.; Liu, S.L.; Cui, Q.T.; Zhang, C.; Liu, A.F. Tourniquet application in primary total knee arthroplasty for osteoarthritis: A systematic review and meta-analysis of randomized controlled trials. Front Surg 2022, 9, 994795. [Google Scholar] [CrossRef] [PubMed]
- Lai, Y.H.; Xu, H.; Su, Q.; Wan, X.F.; Yuan, M.C.; Zhou, Z.K. Effect of tourniquet use on blood loss, pain, functional recovery, and complications in robot-assisted total knee arthroplasty: a prospective, double-blinded, randomized controlled trial. J Orthop Surg Res 2022, 17(1), 118. [Google Scholar] [CrossRef] [PubMed]
- Ajnin, S.; Fernandes, R. Reduced length of stay and faster recovery after total knee arthroplasty without the use of tourniquet. J Clin Orthop Trauma 2020, 11(1), 129–132. [Google Scholar] [CrossRef] [PubMed]
- Xu, X.; Wang, C.; Song, Q.; Mou, Z.; Dong, Y. Tourniquet use benefits to reduce intraoperative blood loss in patients receiving total knee arthroplasty for osteoarthritis: An updated meta-analysis with trial sequential analysis. J Orthop Surg (Hong Kong) 2023, 31(2), 10225536231191607. [Google Scholar] [CrossRef] [PubMed]
- Zhao, H.Y.; Yeersheng, R.; Kang, X.W.; Xia, Y.Y.; Kang, P.D.; Wang, W.J. The effect of tourniquet uses on total blood loss, early function, and pain after primary total knee arthroplasty: a prospective, randomized controlled trial. Bone Joint Res 2020, 9(6), 322–332. [Google Scholar] [CrossRef] [PubMed]
- Watanabe, H.; Kikkawa, I.; Madoiwa, S.; Sekiya, H.; Hayasaka, S.; Sakata, Y. Changes in blood coagulation-fibrinolysis markers by pneumatic tourniquet during total knee joint arthroplasty with venous thromboembolism. J Arthroplasty 2014, 29(3), 569–73. [Google Scholar] [CrossRef] [PubMed]
- Huang, C.R.; Pan, S.; Li, Z.; Ruan, R.X.; Jin, W.Y.; Zhang, X.C.; Pang, Y.; Guo, K.J.; Zheng, X. Tourniquet use in primary total knee arthroplasty is associated with a hypercoagulable status: a prospective thromboelastography trial. Int Orthop 2021, 45(12), 3091–3100. [Google Scholar] [CrossRef] [PubMed]
- Le Meur, Y.; Tesch, G.H.; Hill, P.A.; Mu, W.; Foti, R.; Nikolic-Paterson, D.J.; Atkins, R.C. Macrophage accumulation at a site of renal inflammation is dependent on the M-CSF/c-fms pathway. J Leukoc Biol 2002, 72(3), 530–7. [Google Scholar] [CrossRef] [PubMed]
- Wang, Y.; Chang, J.; Yao, B.; Niu, A.; Kelly, E.; Breeggemann, M.C.; Abboud Werner, S.L.; Harris, R.C.; Zhang, M.Z. Proximal tubule-derived colony stimulating factor-1 mediates polarization of renal macrophages and dendritic cells, and recovery in acute kidney injury. Kidney Int 2015, 88(6), 1274–1282. [Google Scholar] [CrossRef] [PubMed]
- Zhang, M.J.; Sansbury, B.E.; Hellmann, J.; Baker, J.F.; Guo, L.; Parmer, C.M.; Prenner, J.C.; Conklin, D.J.; Bhatnagar, A.; Creager, M.A.; Spite, M. Resolvin D2 Enhances Postischemic Revascularization While Resolving Inflammation. Circulation 2016, 134(9), 666–680. [Google Scholar] [CrossRef] [PubMed]
- Vanheule, V.; Boff, D.; Mortier, A.; Janssens, R.; Petri, B.; Kolaczkowska, E.; Kubes, P.; Berghmans, N.; Struyf, S.; Kungl, A.J.; Teixeira, M.M.; Amaral, F.A.; Proost, P. CXCL9-Derived Peptides Differentially Inhibit Neutrophil Migration In Vivo through Interference with Glycosaminoglycan Interactions. Front Immunol 2017, 8, 530. [Google Scholar] [CrossRef] [PubMed]
- Marques, P.E.; Vandendriessche, S.; de Oliveira, T.H.C.; Crijns, H.; Lopes, M.E.; Blanter, M.; Schuermans, S.; Yu, K.; Poosti, F.; Vanheule, V.; Janssens, R.; Boff, D.; Kungl, A.J.; Menezes, G.B.; Teixeira, M.M.; Proost, P. Inhibition of Drug-Induced Liver Injury in Mice Using a Positively Charged Peptide That Binds DNA. Hepatol Commun 2021, 5(10), 1737–1754. [Google Scholar] [CrossRef] [PubMed]
- Duehrkop, C.; Banz, Y.; Spirig, R.; Miescher, S.; Nolte, M.W.; Spycher, M.; Smith, R.A.; Sacks, S.H.; Rieben, R. C1 esterase inhibitor reduces lower extremity ischemia/reperfusion injury and associated lung damage. PLoS One 2013, 8(8), e72059. [Google Scholar] [CrossRef] [PubMed]
- Banz, Y.; Hess, O.M.; Robson, S.C.; Csizmadia, E.; Mettler, D.; Meier, P.; Haeberli, A.; Shaw, S.; Smith, R.A.; Rieben, R. Attenuation of myocardial reperfusion injury in pigs by Mirococept, a membrane-targeted complement inhibitor derived from human CR1. Cardiovasc Res 2007, 76(3), 482–93. [Google Scholar] [CrossRef] [PubMed]
- Banz, Y.; Hess, O.M.; Robson, S.C.; Mettler, D.; Meier, P.; Haeberli, A.; Csizmadia, E.; Korchagina, E.Y.; Bovin, N.V.; Rieben, R. Locally targeted cytoprotection with dextran sulfate attenuates experimental porcine myocardial ischaemia/reperfusion injury. Eur Heart J 2005, 26(21), 2334–43. [Google Scholar] [CrossRef] [PubMed]
- Ni, D.; Wei, H.; Chen, W.; Bao, Q.; Rosenkrans, Z.T.; Barnhart, T.E.; Ferreira, C.A.; Wang, Y.; Yao, H.; Sun, T.; Jiang, D.; Li, S.; Cao, T.; Liu, Z.; Engle, J.W.; Hu, P.; Lan, X.; Cai, W. Ceria Nanoparticles Meet Hepatic Ischemia-Reperfusion Injury: The Perfect Imperfection. Adv Mater 2019, 31(40), e1902956. [Google Scholar] [CrossRef] [PubMed]
- Jouybar, R.; Khademi, S.; Razmjooie, S.; Bagheri, N. Effect of Preoperative Administration of Oral Melatonin on Pneumatic Tourniquet-Induced Ischemia-Reperfusion Injury in Orthopedic Surgery of Lower Extremities: A Randomized Clinical Trial. Iran J Med Sci 2022, 47(2), 123–130. [Google Scholar] [CrossRef] [PubMed]
Figure 1.
Use of PCIA in % of patients and pain scores rated on the NRS. a) Use of PCIA in % of patients. The p-value was calculated by Fisher’s exact test. b) Pain rated on the NRS between 0 (no pain) and 10 (worst pain imaginable) with red lines showing median values. The p-values were calculated by one-way ANOVA.
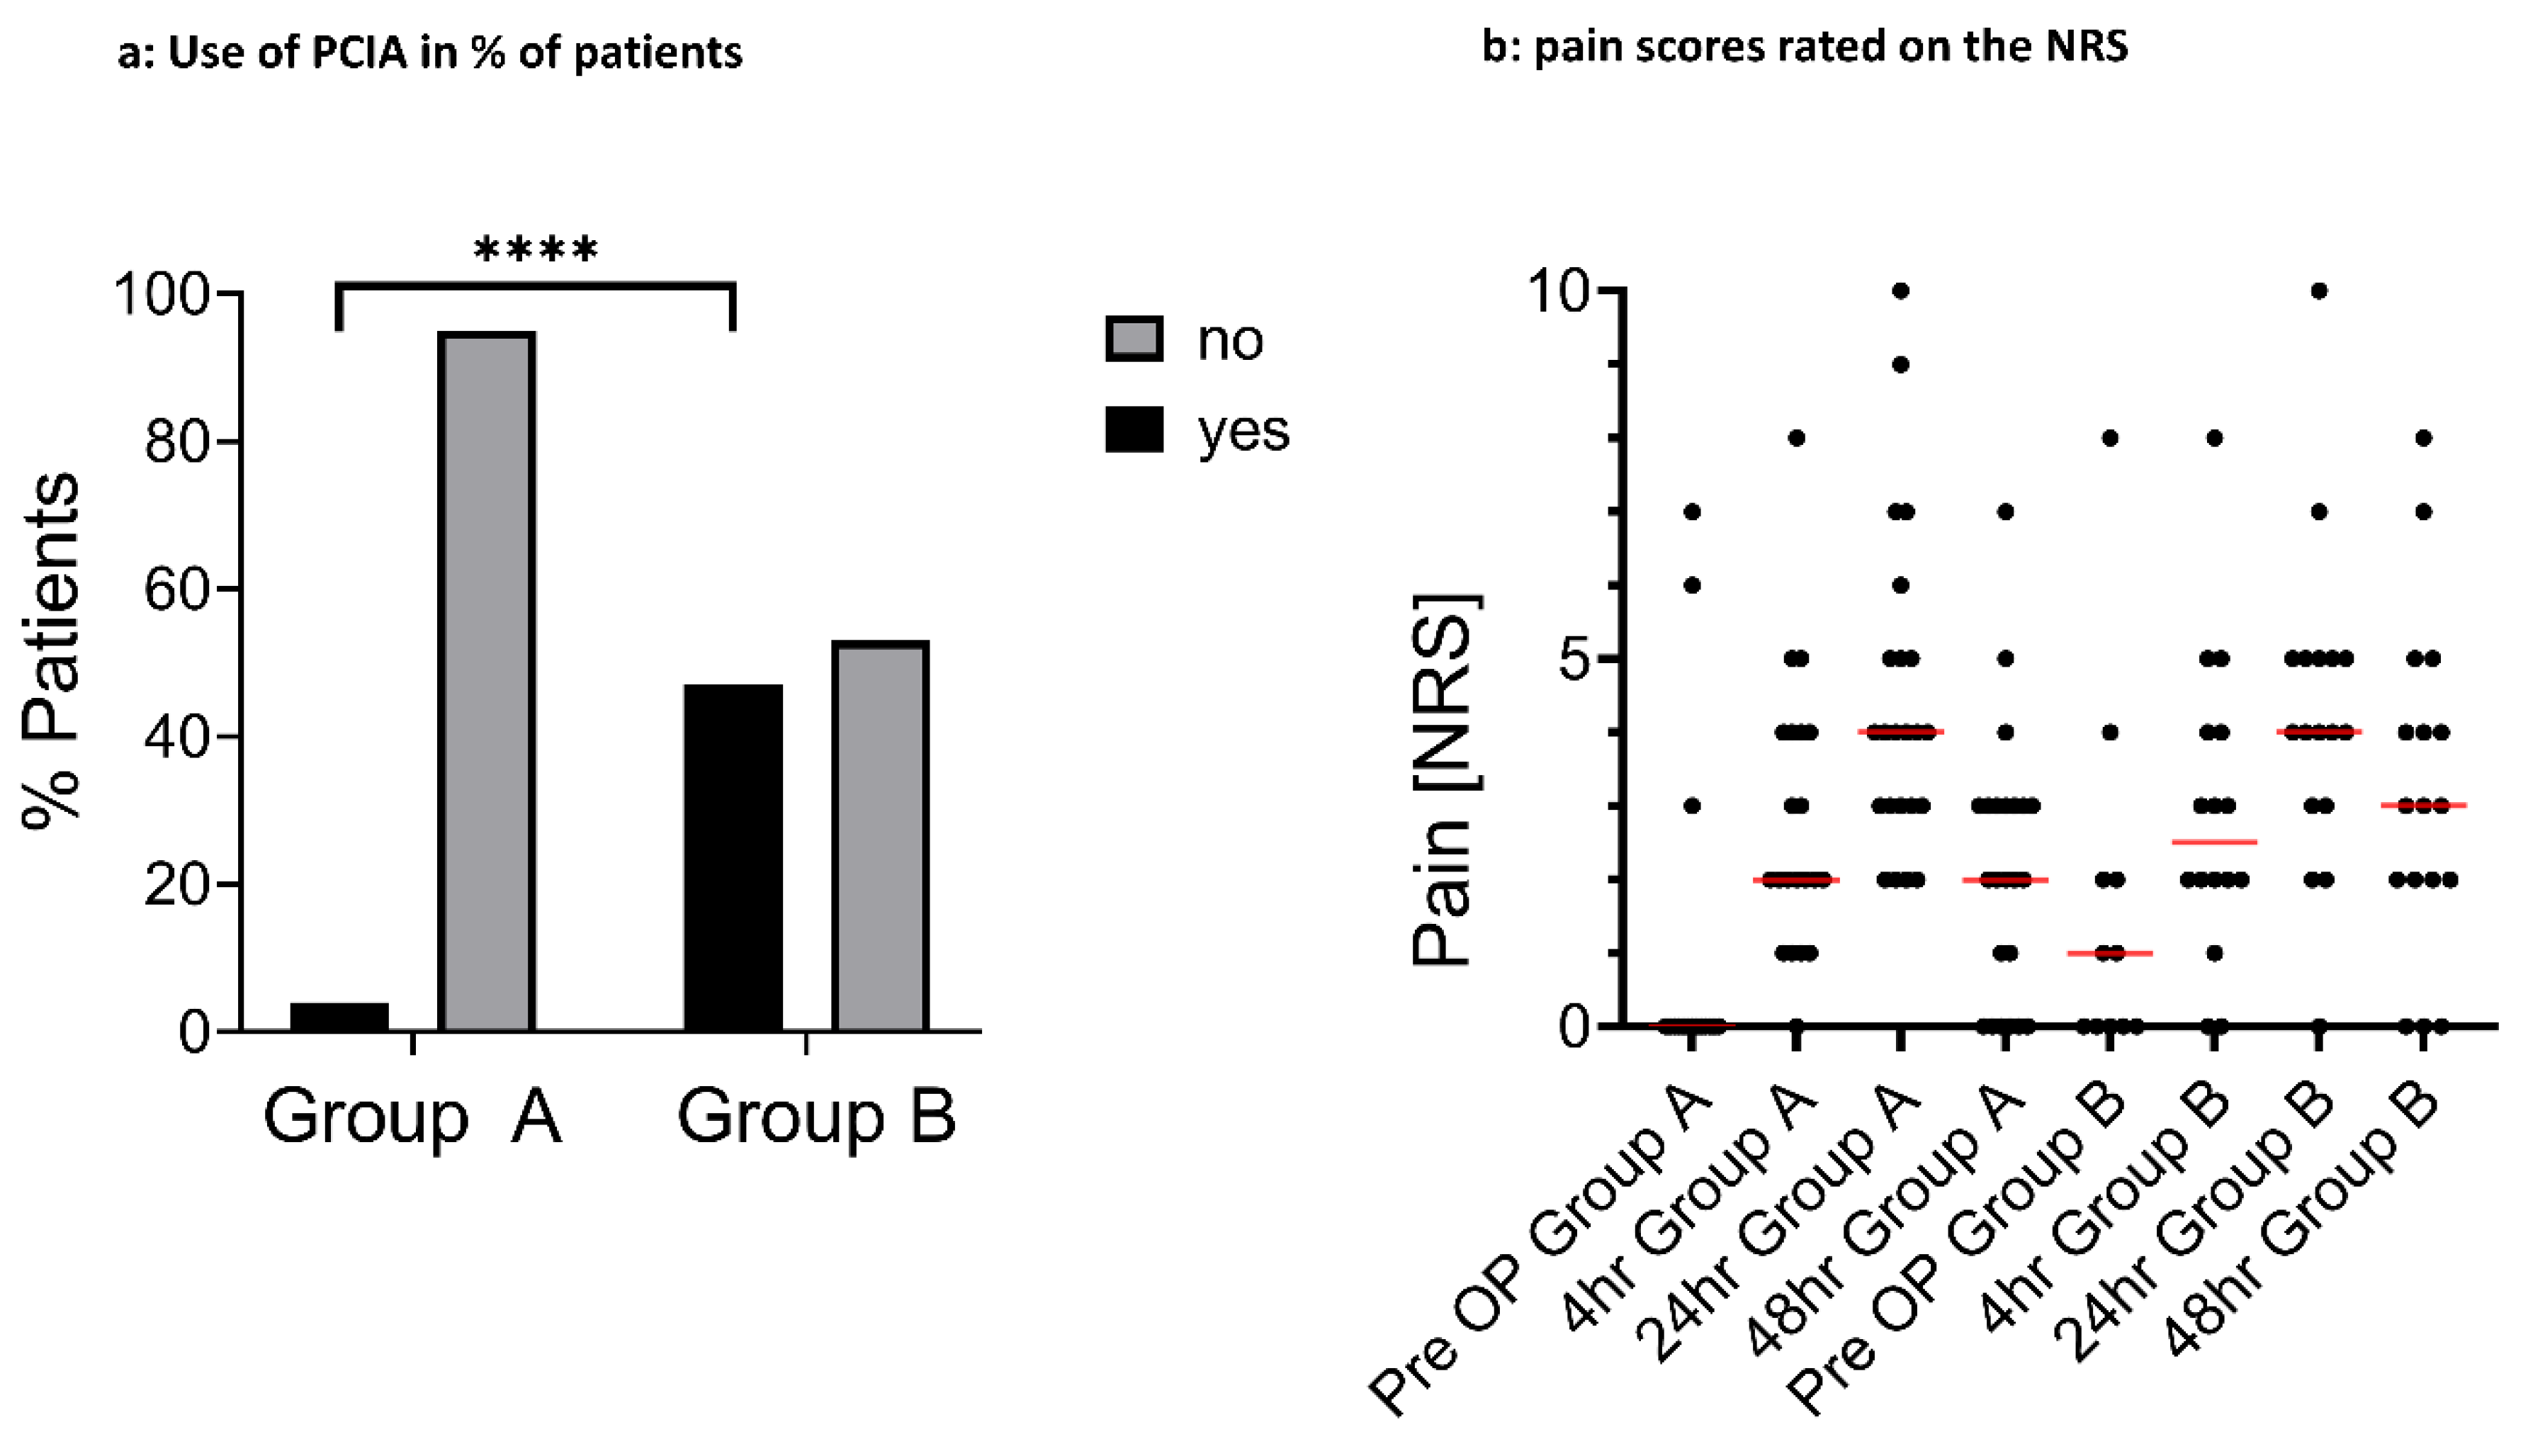
Figure 2.
Increase of the calf circumference at different time points. a) Increase of calf circumference between 24 and 48 h (normalized to 4 h), p=0.07. b) Increase of calf circumference between 4 h and 48 h normalized to BL, p=0.21; both calculated by unpaired t-test. Each dot represents an individual patient.
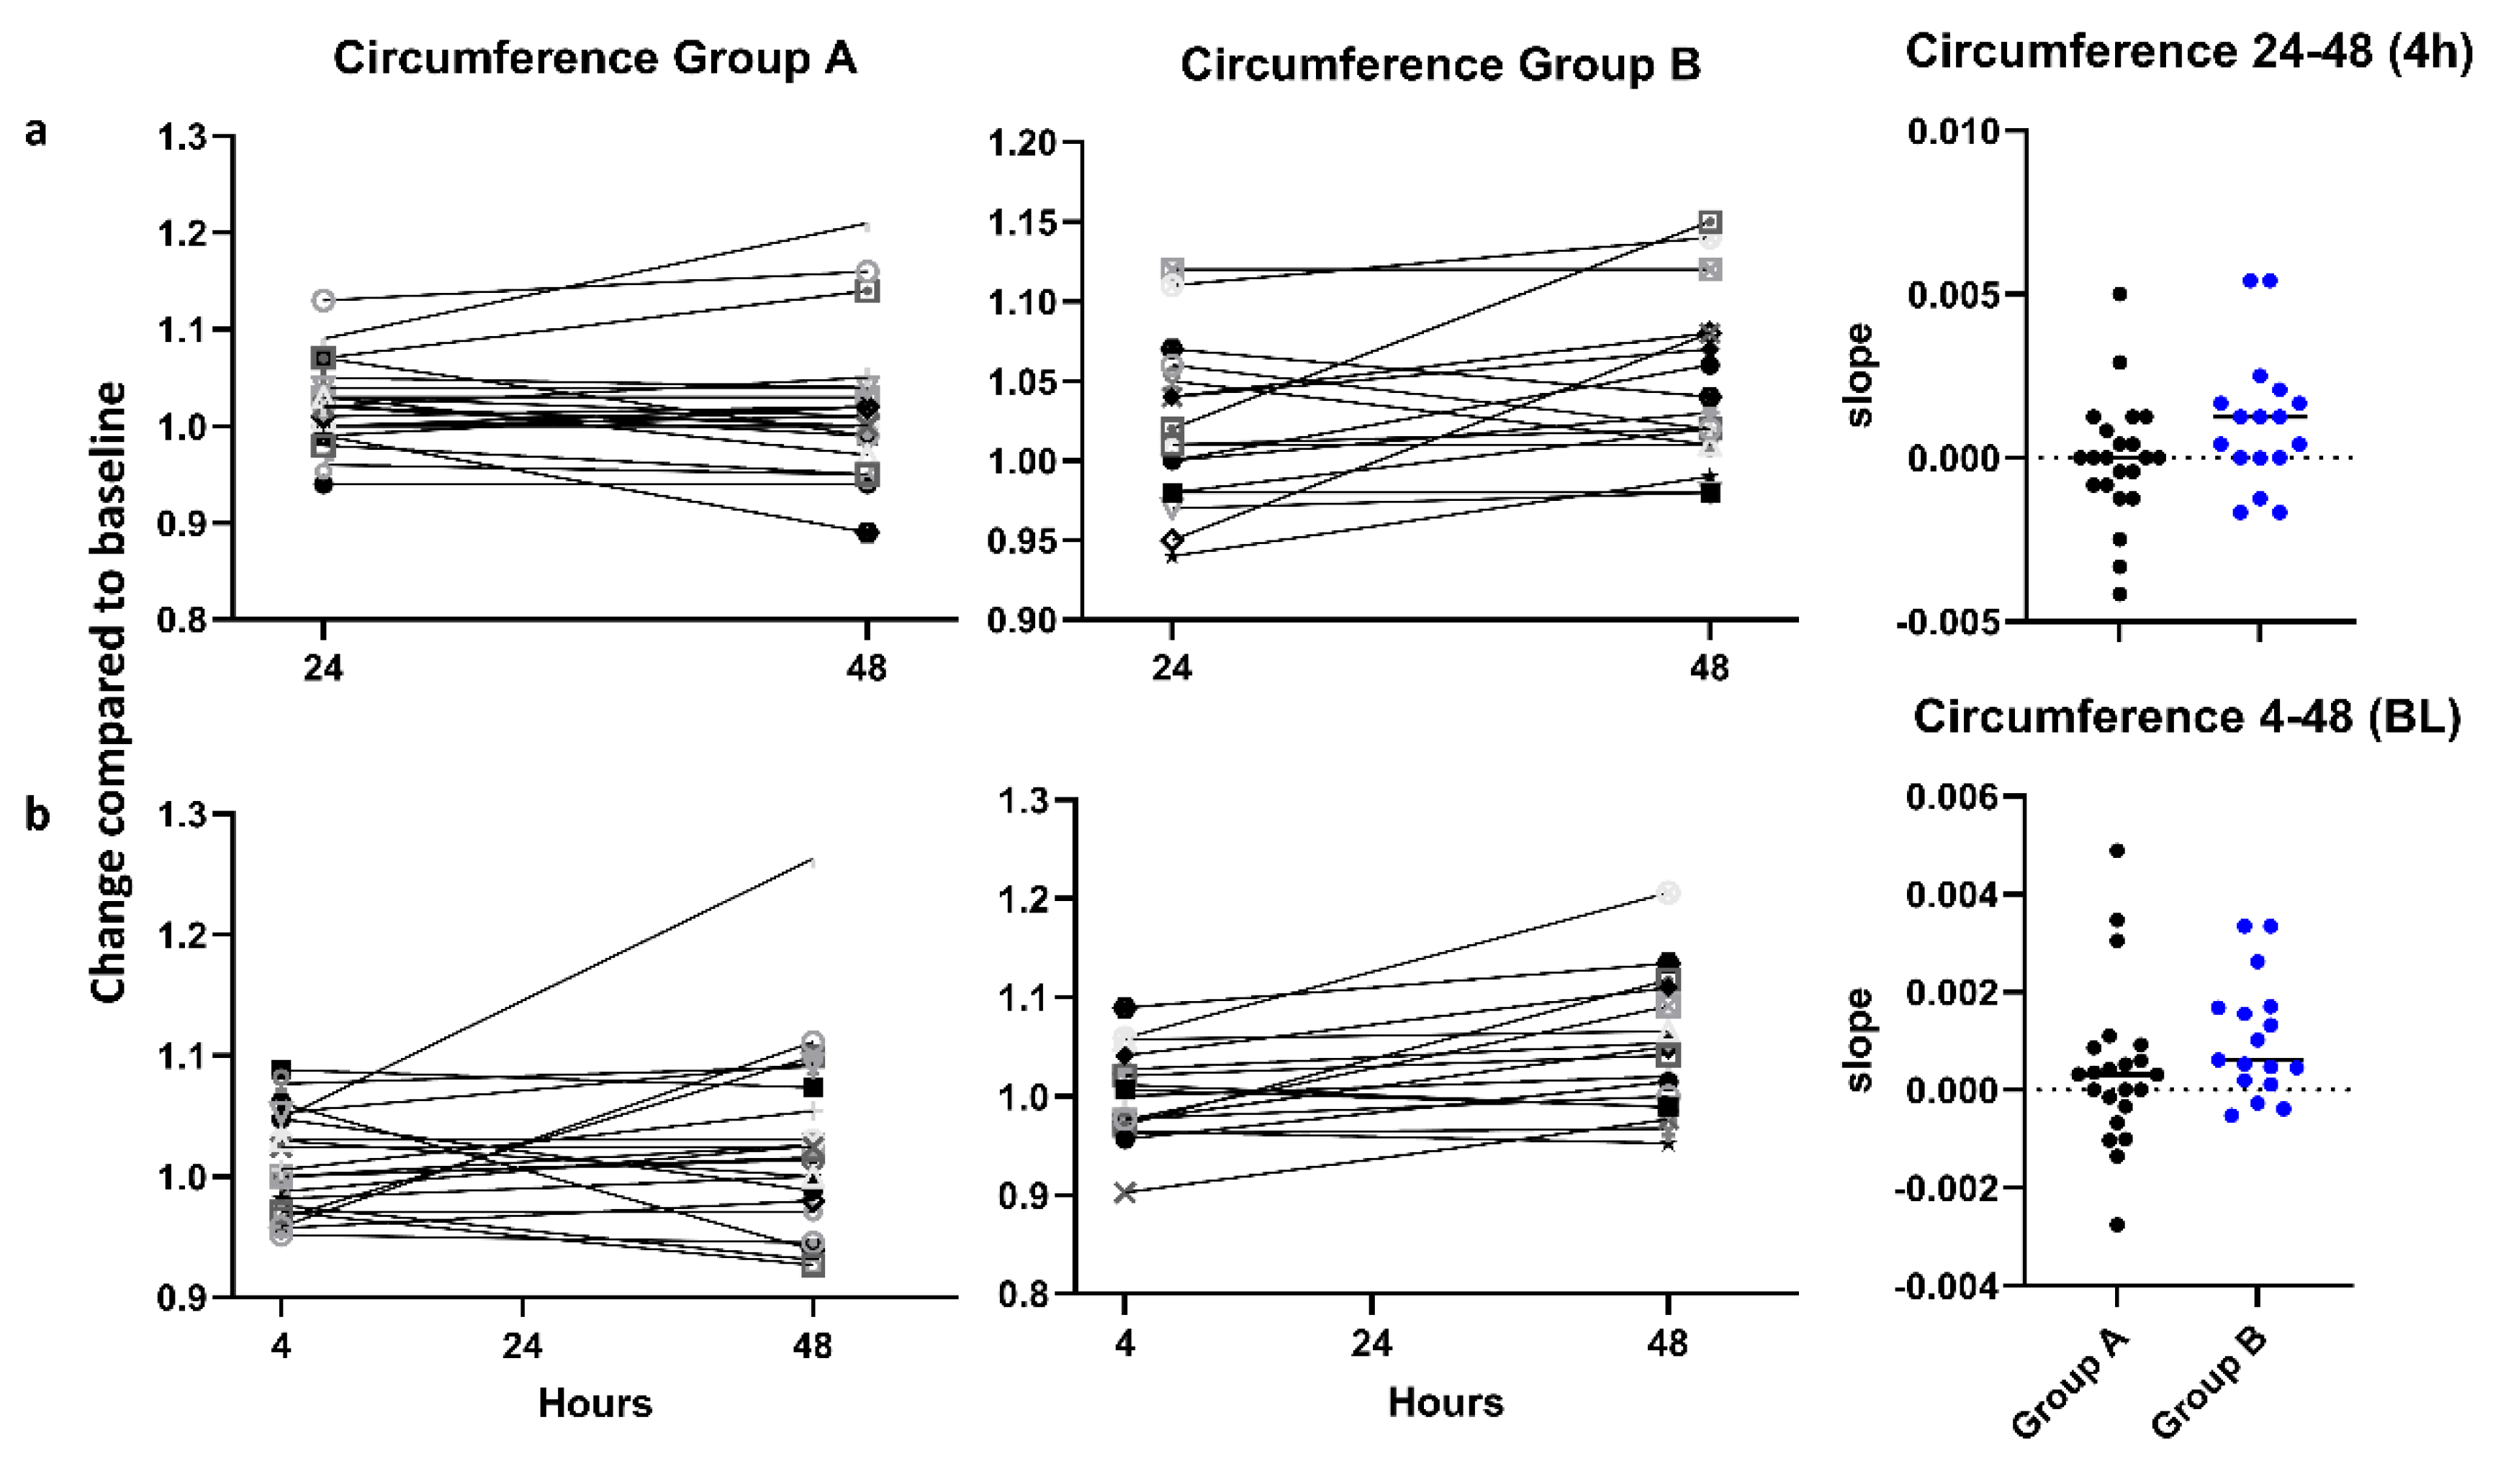
Figure 3.
Intraoperative blood loss. Blood loss Group A 540 ml, Group B 385 ml, each dot represents an individual patient, with lines showing the median values. p=0.046, calculated by the Mann-Whitney-U Test.
Figure 3.
Intraoperative blood loss. Blood loss Group A 540 ml, Group B 385 ml, each dot represents an individual patient, with lines showing the median values. p=0.046, calculated by the Mann-Whitney-U Test.
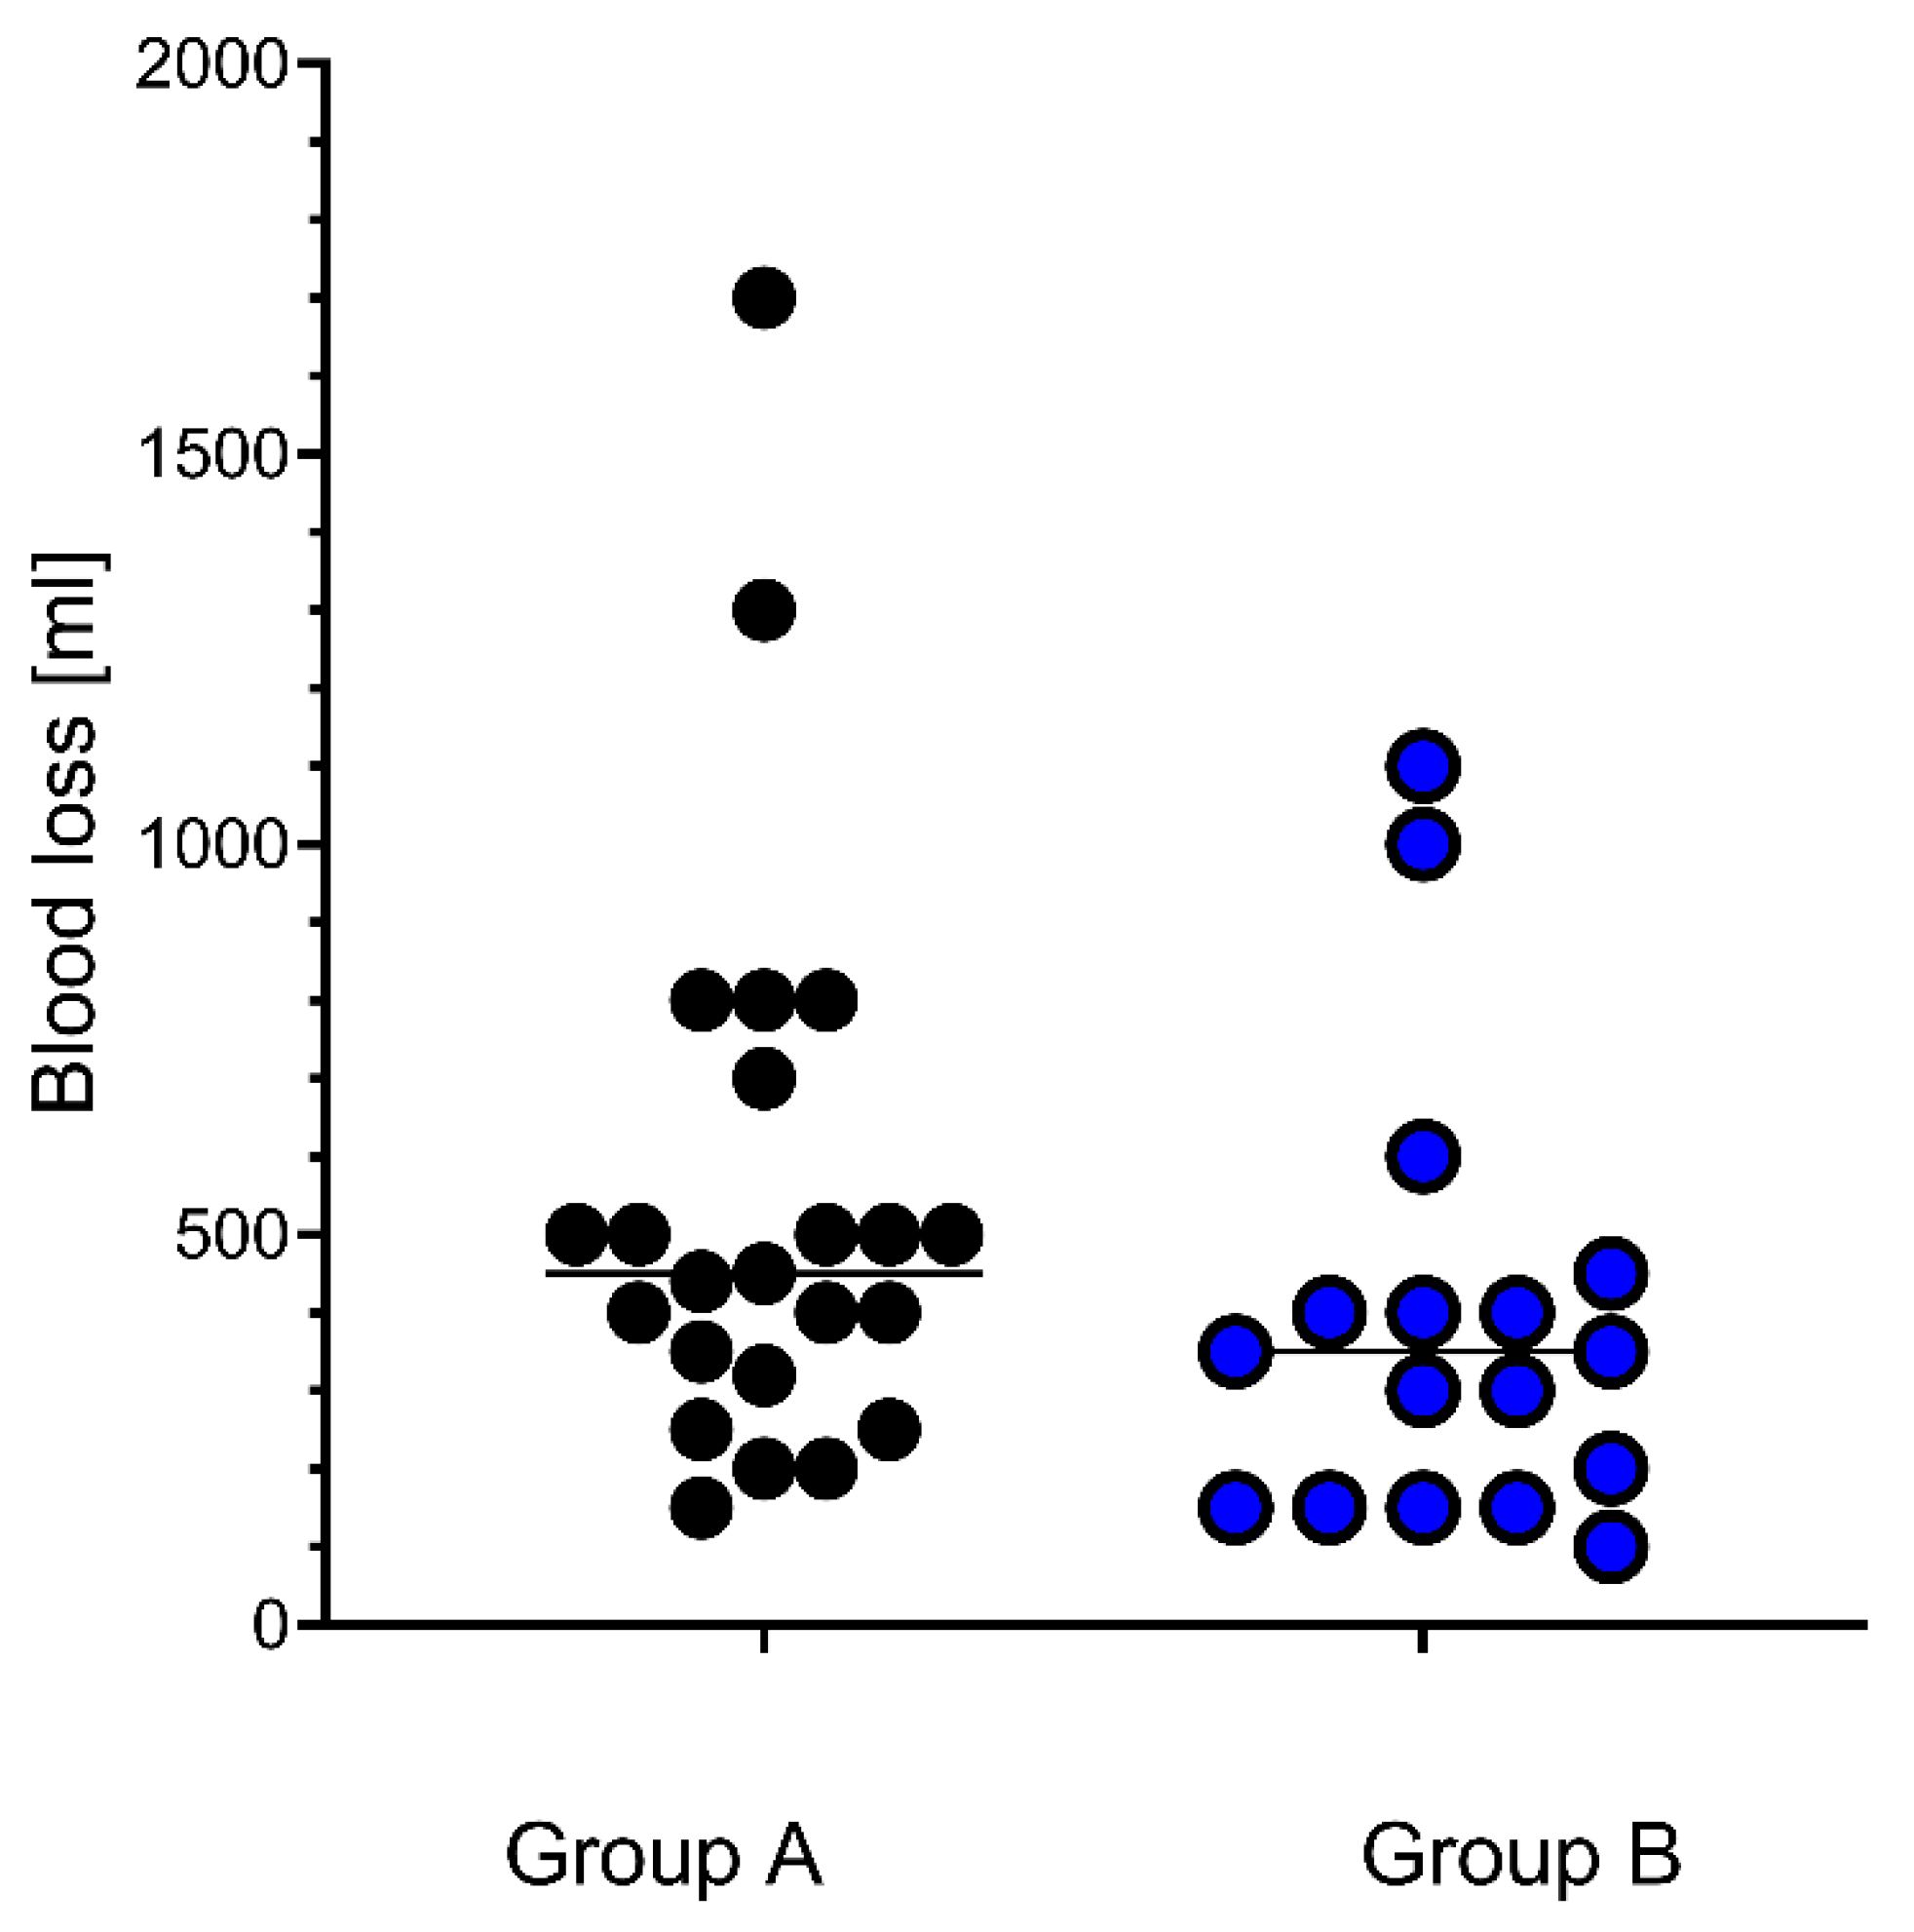
Figure 4.
Change of C3a plasma levels. Changes of C3a plasma levels between 4 h and 48 h after the operation are shown for Group A (left panel) and Group B (middle panel). Values are fold-changes normalized to baseline (BL). The slopes for the change between 4 h and 48 h are plotted on the right panel, with indication of the median values, showing a significantly higher increase of the C3a levels in Group B as compared to Group A, p=0.039, calculated by unpaired t-test. BL: Base Line.
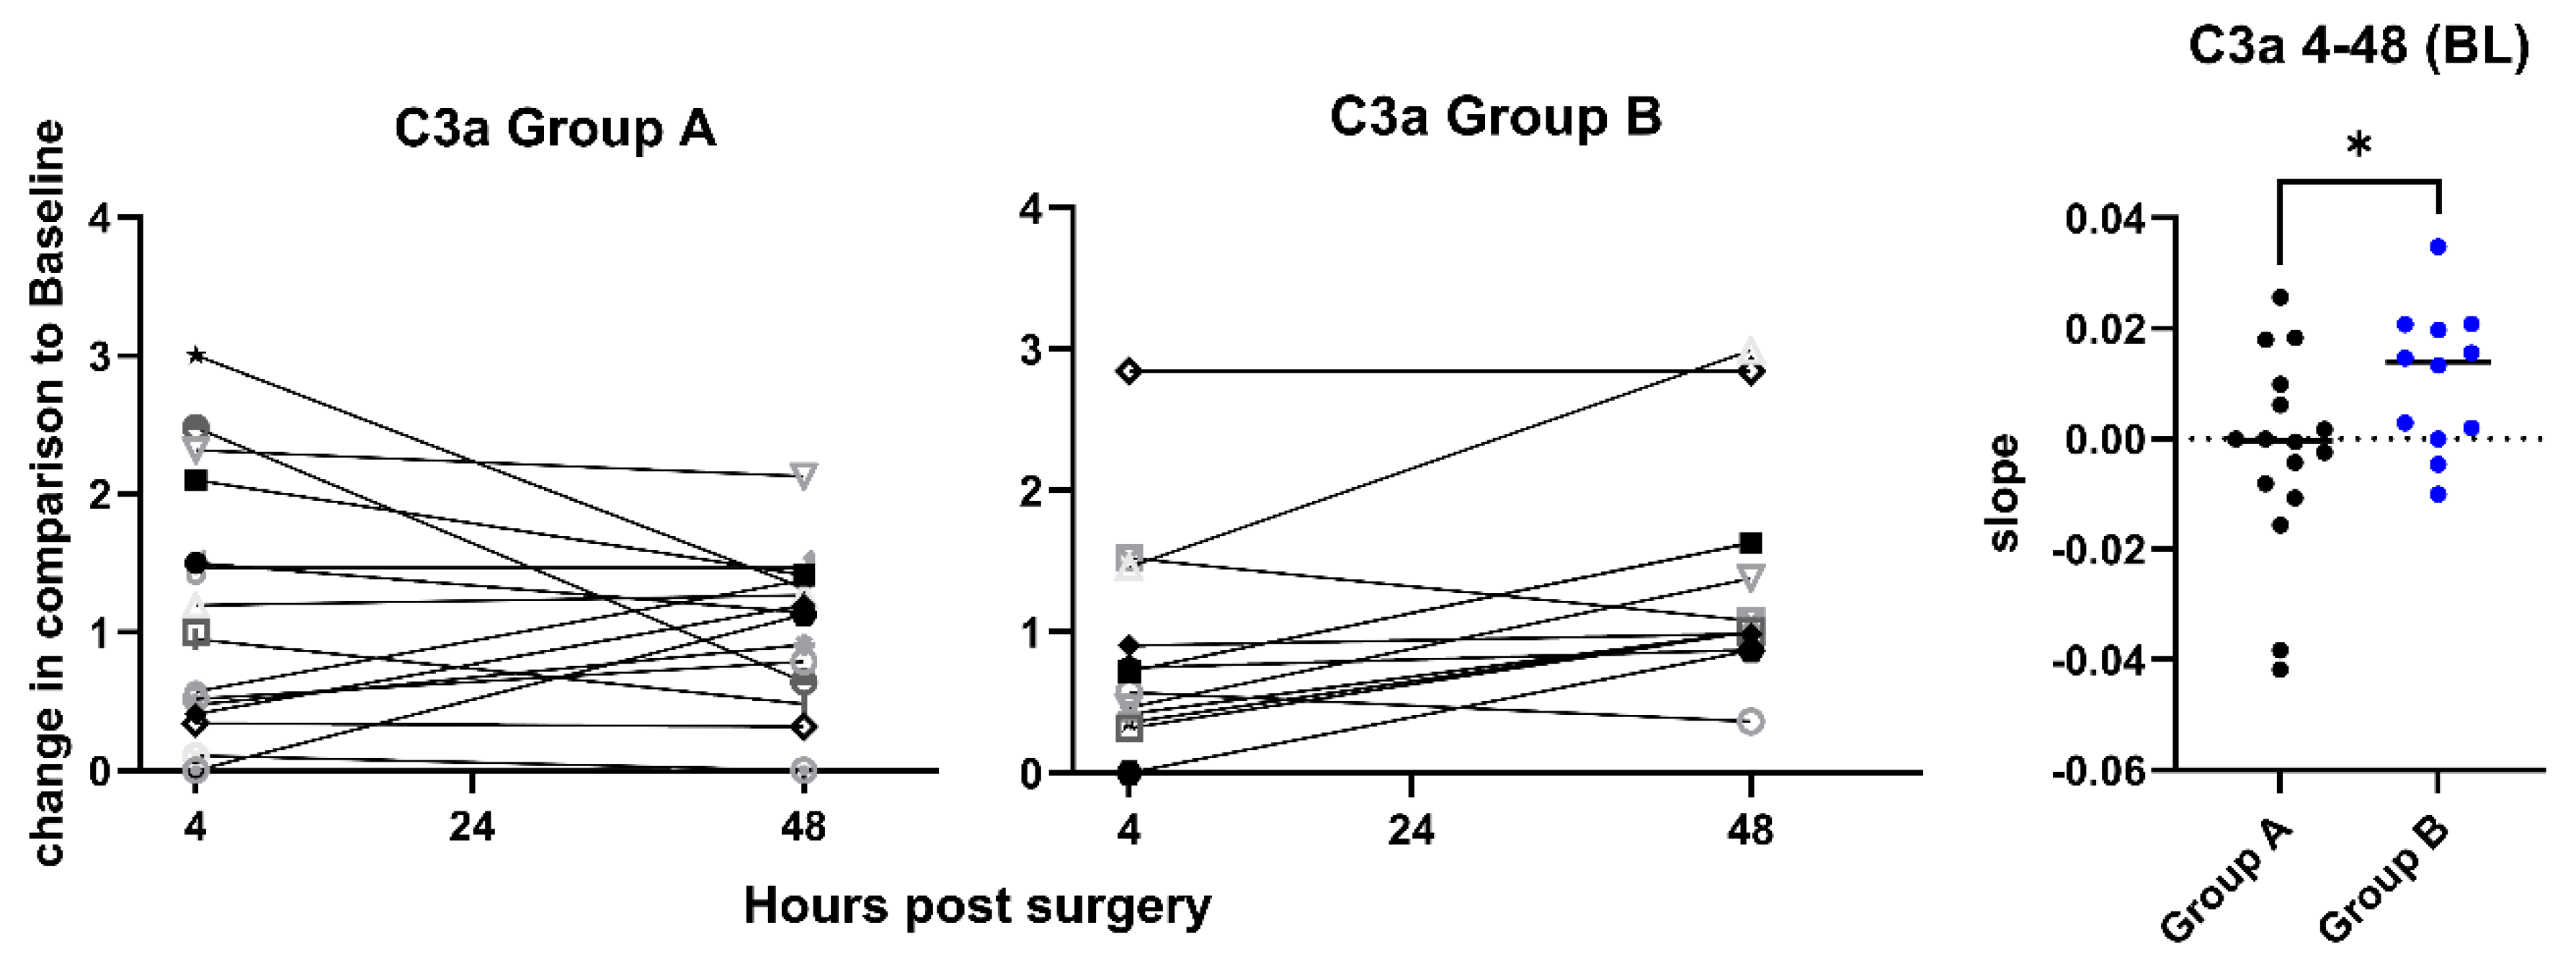
Figure 5.
Change of C5a plasma levels. Changes of C5a plasma levels between 4 h and 48 h after the operation are shown for Group A (left panel) and Group B (middle panel). Values are fold-changes normalized to baseline (BL). The slopes for the change between 4 h and 48 h are plotted on the right panel with indication of the median values. Plasma levels of C5a were consistently increased at 48, but the slopes were not significantly different between the groups, p=0.23, calculated by unpaired t-test. BL: Base Line.
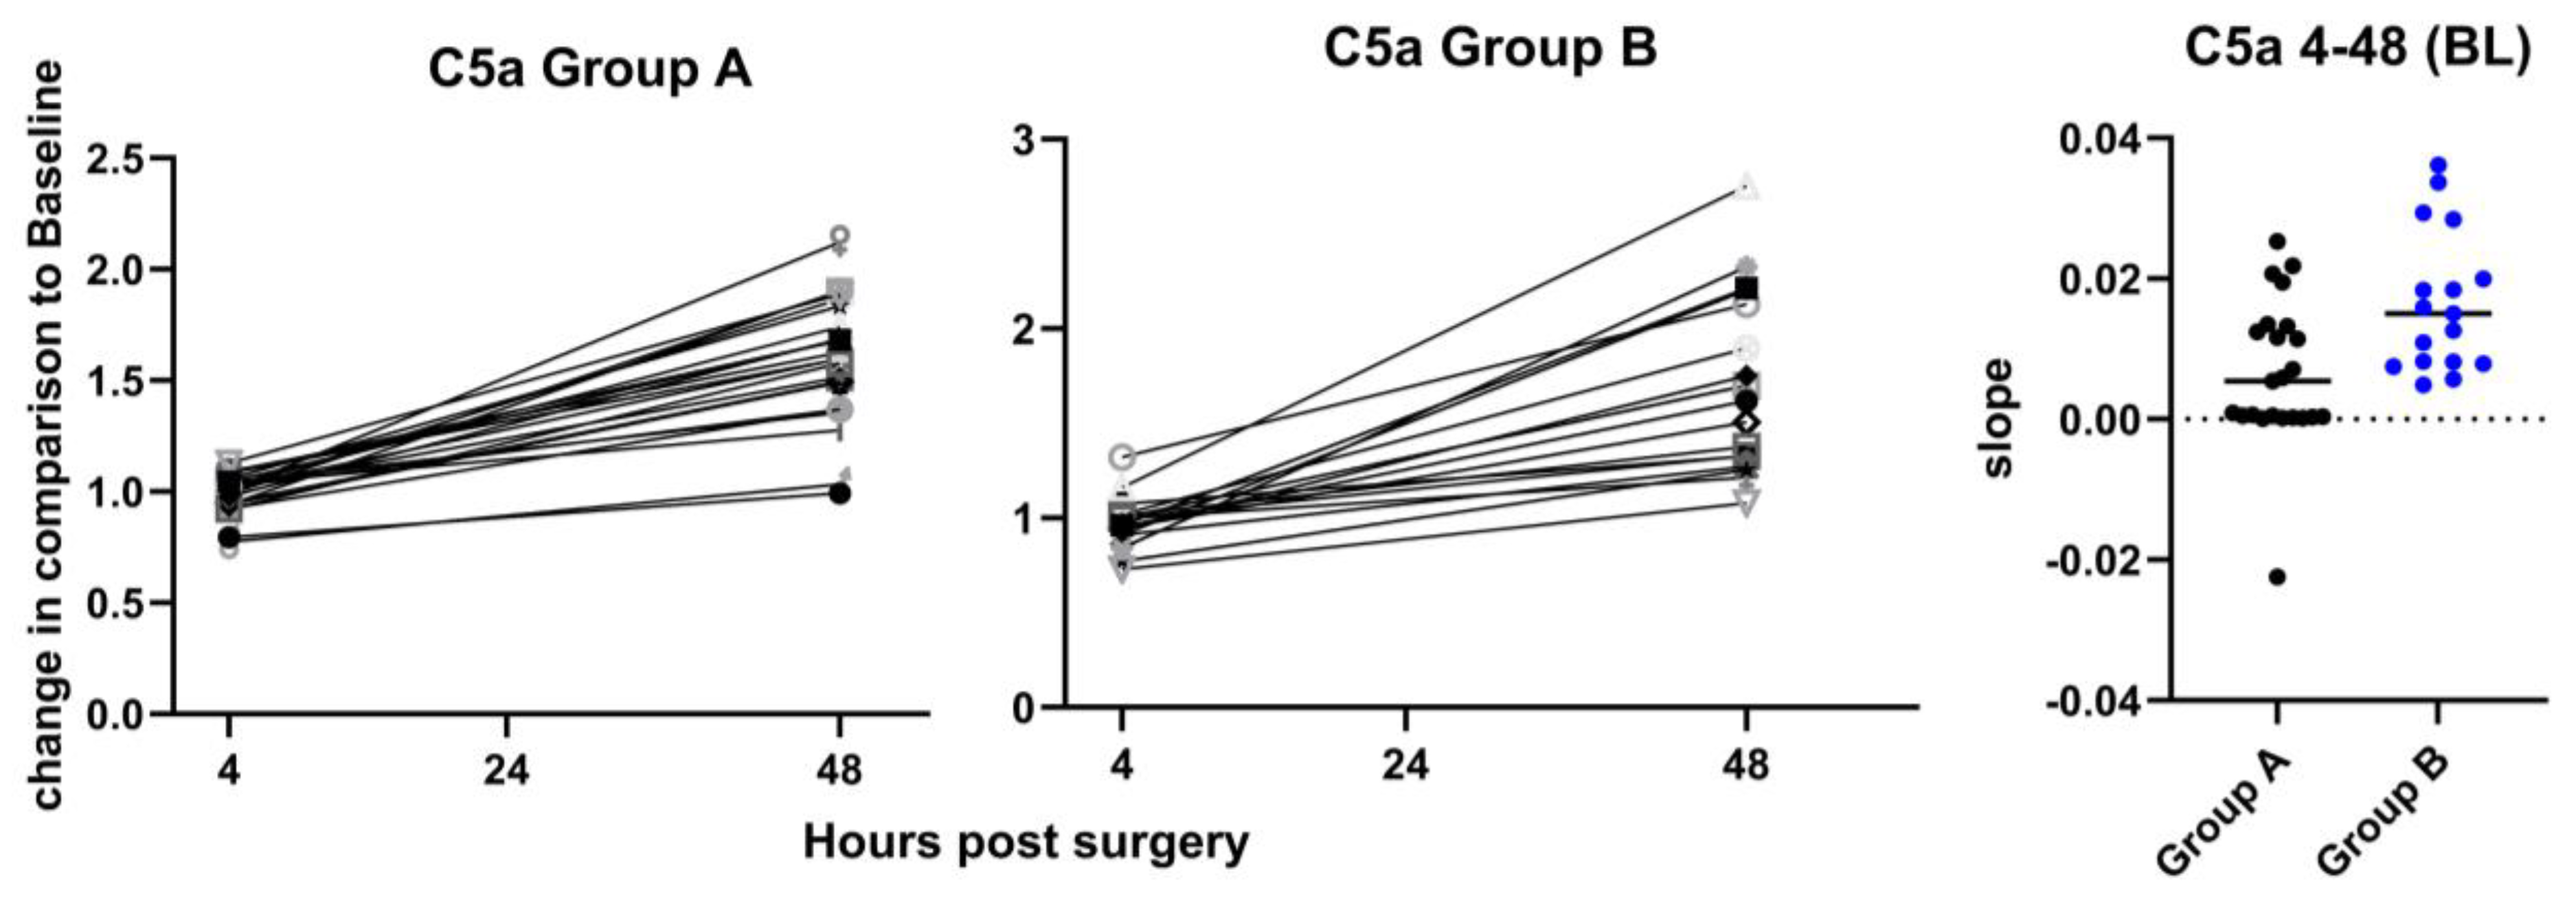
Figure 6.
Changes of PAI-1/tPA complex plasma levels. Changes of the plasma levels of PAI-1/tPA complexes between 4 h and 48 h after the operation are shown for Group A (left panel) and Group B (middle panel). Values are fold-changes normalized to baseline (BL). The slopes for the change between 4 h and 48 h are plotted on the right panel with indication of the media values, showing a non-significant tendency for a higher increase of the PAI-1/tPA levels in Group B as compared to Group A, p=0.09, calculated by unpaired t-test. BL: Base Line.
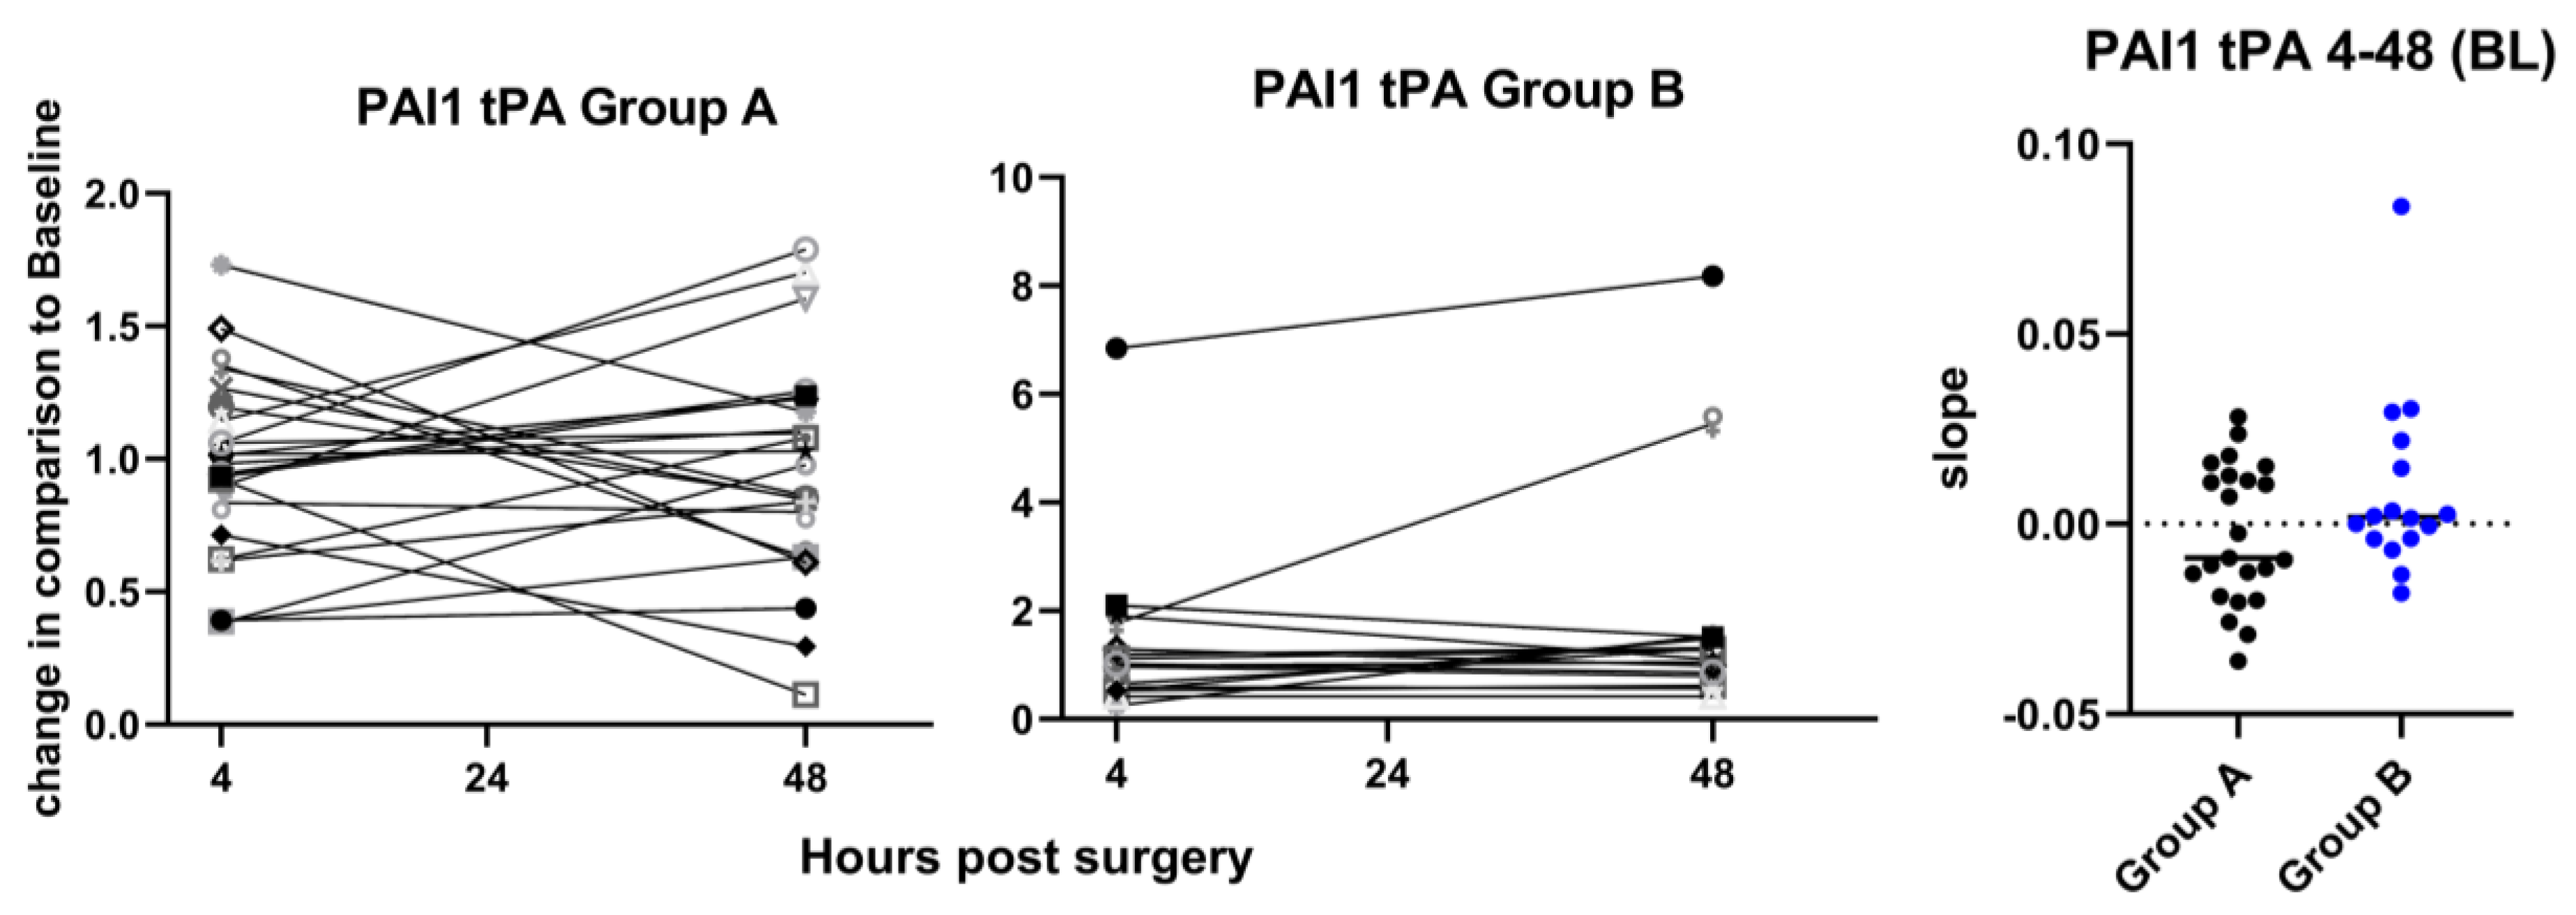
Figure 7.
Change of MIG plasma levels. a: Changes of the plasma levels of MIG between 4 h and 48 h after the operation are shown for Group A (left panel) and Group B (middle panel). Values are fold-changes normalized to BL. The slopes for the change between 4 h and 48 h are plotted on the right panel with indication of the median values, showing a significantly higher increase of the MIG levels in Group B as compared to Group A, p=0.036. b: Changes of the plasma levels of MIG between 24 h and 48 h after the operation, normalized to 4h, analogously to part a. p = 0.02, calculated by unpaired t-test. BL: Base Line.
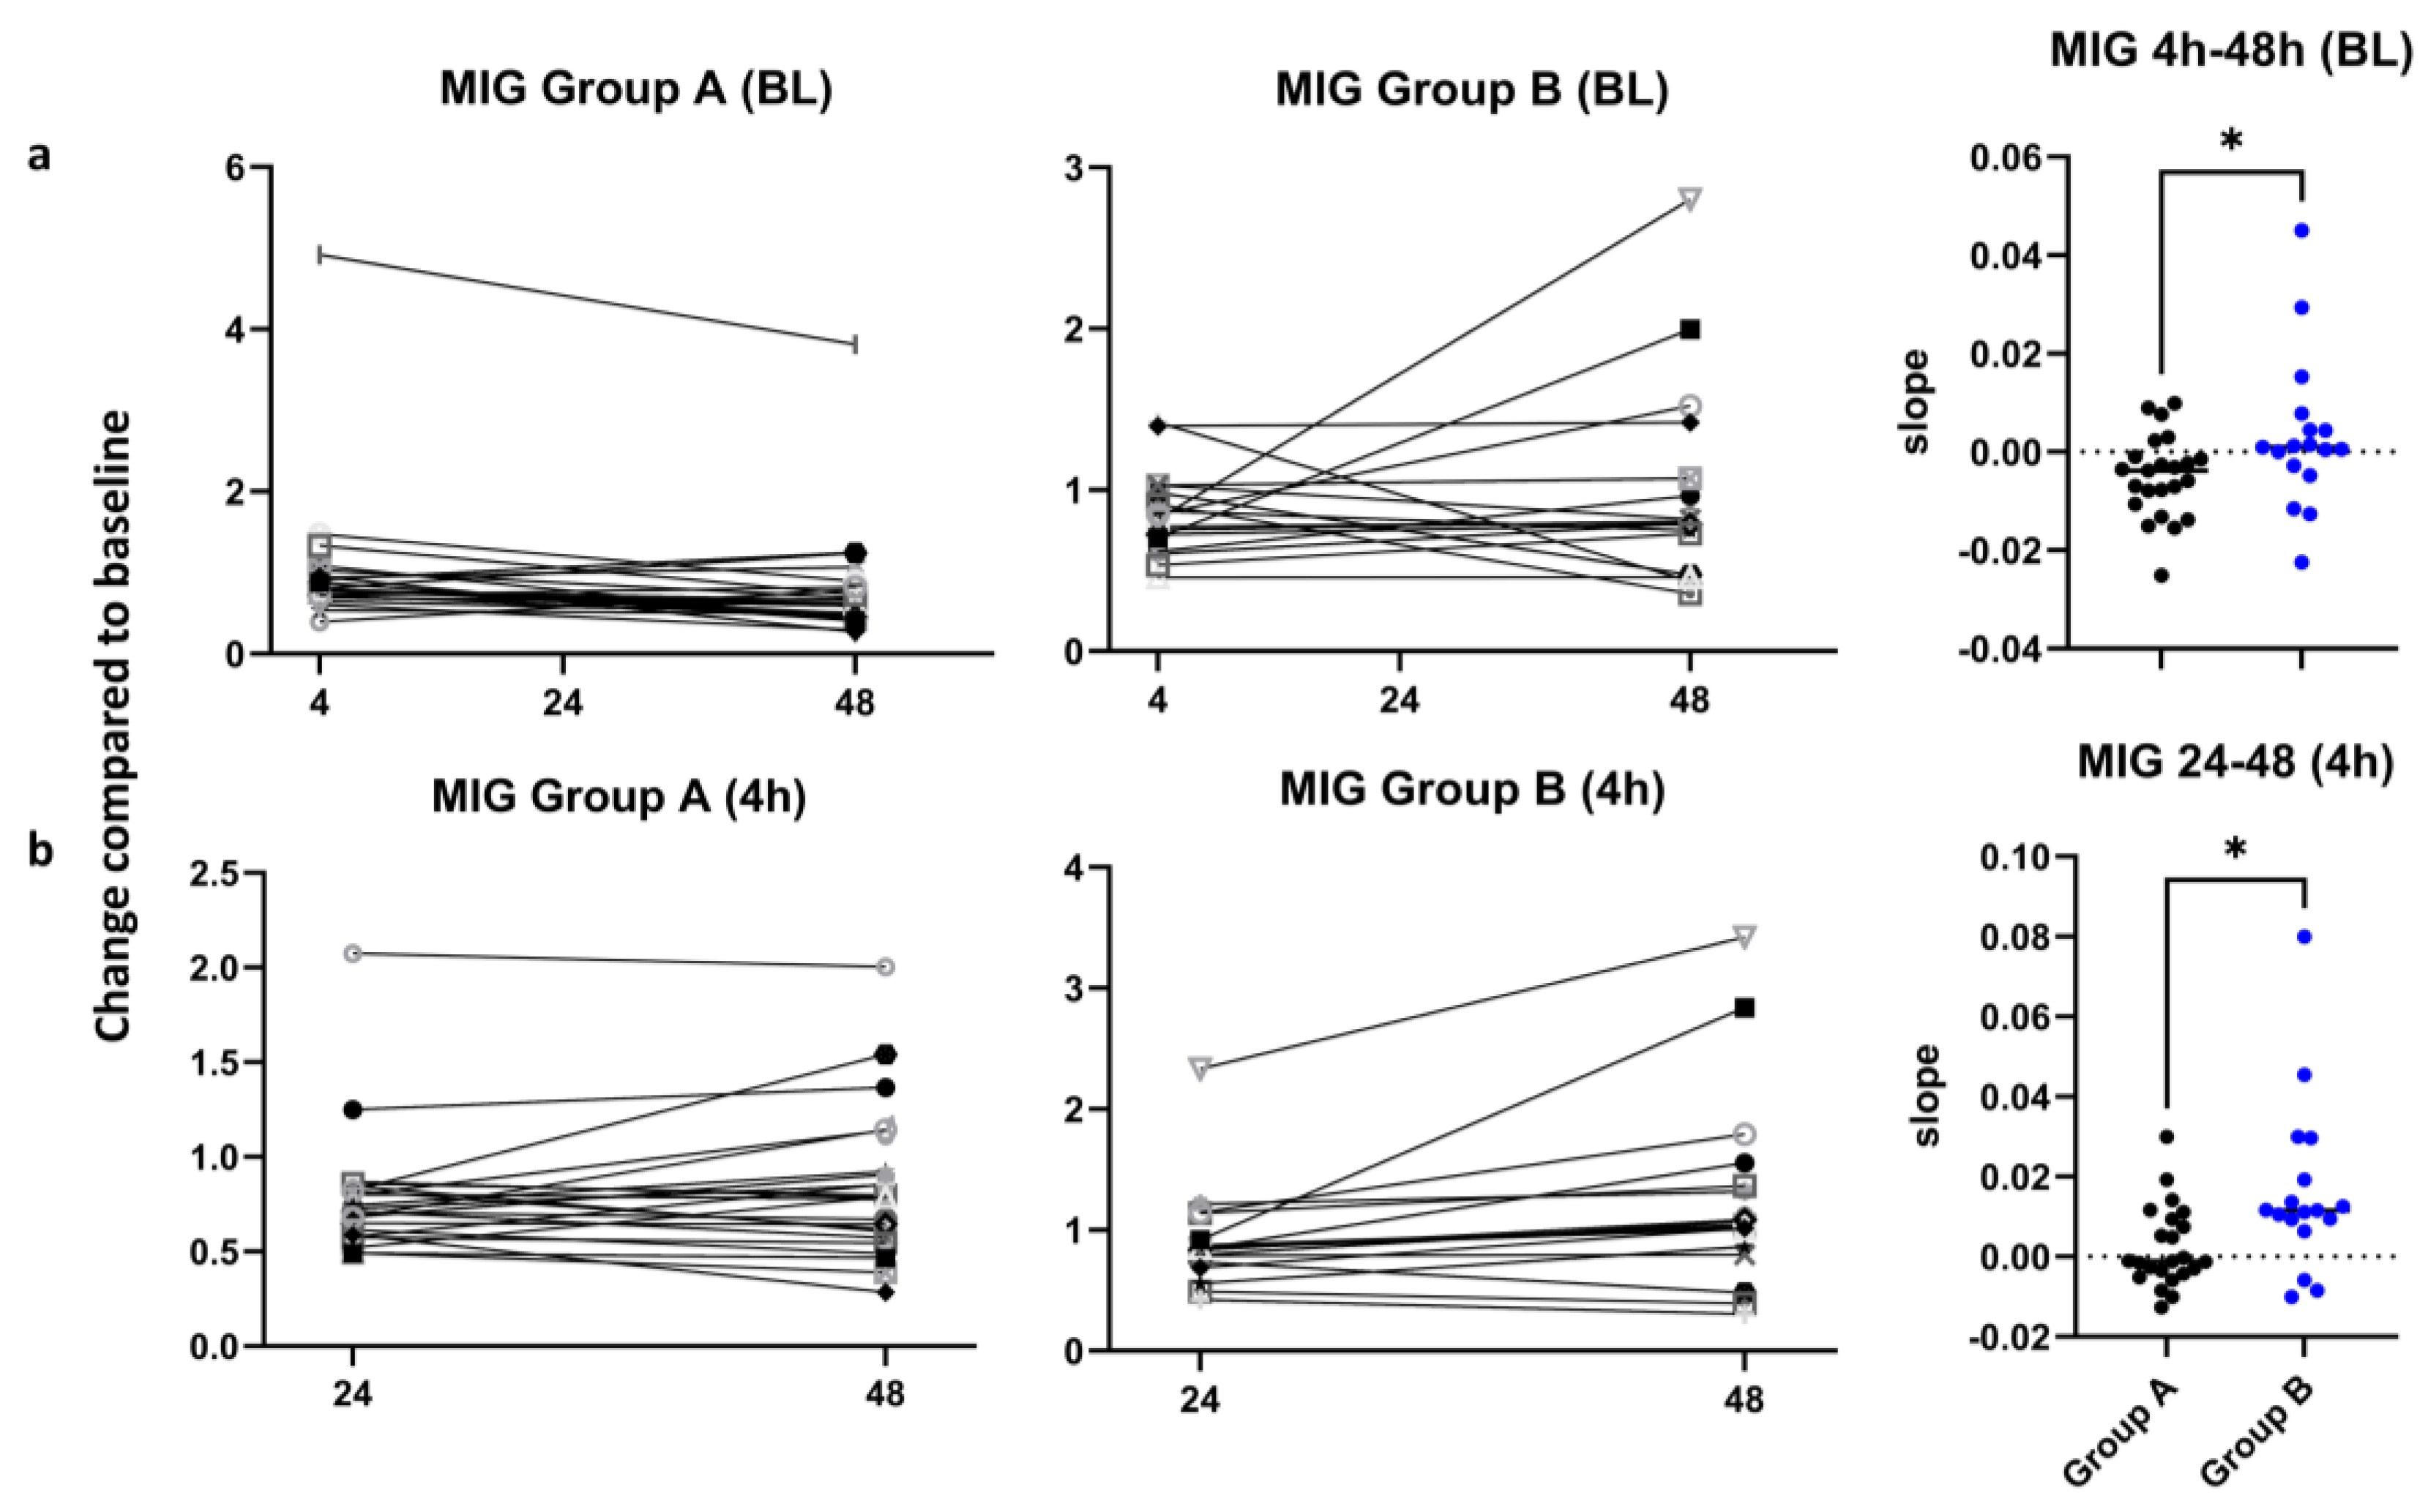
Figure 8.
Change of M-CSF plasma levels. Changes of the plasma levels of M-CSF between 24 h and 48 h after the operation are shown for Group A (left panel) and Group B (middle panel). Values are fold-changes normalized to 4 h. The slopes for the change between 24 h and 48 h are plotted on the right panel with indication of the mv, showing a significantly higher increase of the M-CSF levels in Group B as compared to Group A, p=0.019, calculated by unpaired t-test.
Disclaimer/Publisher’s Note: The statements, opinions and data contained in all publications are solely those of the individual author(s) and contributor(s) and not of MDPI and/or the editor(s). MDPI and/or the editor(s) disclaim responsibility for any injury to people or property resulting from any ideas, methods, instructions or products referred to in the content. |
© 2026 by the authors. Licensee MDPI, Basel, Switzerland. This article is an open access article distributed under the terms and conditions of the Creative Commons Attribution (CC BY) license (http://creativecommons.org/licenses/by/4.0/).
Copyright: This open access article is published under a Creative Commons CC BY 4.0 license, which permit the free download, distribution, and reuse, provided that the author and preprint are cited in any reuse.


