
Submitted:
20 January 2026
Posted:
21 January 2026
You are already at the latest version
Abstract
Global outdoor furniture consumes large amounts of virgin wood and polyolefins, while multilayer beverage cartons and rice husks are usually landfilled or burnt despite their polymer and lignocellulosic value. However, no study has yet provided experimentally validated formulations that convert both waste streams into extruded wood-like boards for low-load urban elements. This work therefore characterised hybrid composites containing 50–80 wt.% recycled Tetra Pak PolyAl and 20–50 wt.% ground rice husk, produced at pilot scale by single-screw extrusion plus compression moulding. Boards were tested for density, tensile and flexural properties, Shore D hardness, water absorption (ISO 62-inspired) and 254 nm UV ageing. Increasing rice-husk content from 20 to 50 wt.% raised Shore D hardness from 54 to 63 but almost doubled water uptake (≈45 vs 25 g m⁻² at 7 d), while UV exposure increased surface hardness by 3–5 points without visible cracking. The 70 Tetra Pak/30 rice-husk formulation gave the best balance, with a flexural modulus of 2.1 GPa and MOR of 18 MPa, exceeding the ASTM D7032 requirement for outdoor decking (MOR ≥ 11 MPa). By valorising two locally available wastes into a market-ready material, the proposed symbiosis supports circular-economy strategies for urban furniture.
Keywords:
recycled PolyAl
; rice husk
; composite boards
; wood–plastic composites
; outdoor durability
; water absorption
; UV ageing
; circular economy
; urban furniture
1. Introduction
Single-use packaging is one of the most critical sources of solid waste worldwide. Recent analyses estimate that around 40% of global plastic waste originates from packaging applications, with similar shares in regions that generate the largest amounts of plastic waste, such as Europe, the United States and China [1]. In the European Union (EU), packaging waste reached about 79.7 million tonnes in 2021, corresponding to roughly 178 kg per inhabitant [2,3]. Within this stream, plastic packaging alone accounts for more than 35 kg per person, of which only about 40–45% is effectively recycled [3]. These figures highlight the need for new solutions that simultaneously reduce the demand for virgin polymers and create higher-value outlets for post-consumer packaging fractions that are currently under-utilised [1,2,3].
Beverage cartons such as Tetra Pak® are a representative example of complex multilayer packaging. A typical used carton contains approximately 73–75 wt% cellulose fibres, 20–23 wt% polymers and 4–5 wt% aluminium [4,5]. After conventional hydropulping, high-quality fibres can be efficiently recovered, but the remaining polymer–aluminium fraction (commonly referred to as PolyAl) is more challenging to manage because the polyethylene layers and aluminium foil are strongly bonded [5]. In the last decade, carton manufacturers and recycling companies have invested in dedicated PolyAl recycling lines and in the development of new products such as pallets, crates and outdoor items [5,9,10,11,12]. However, existing capacities remain limited compared with the total volume of cartons placed on the market, and additional high-value applications for PolyAl-rich composites are still needed [5].
In parallel, agro-industrial residues are increasingly recognised as strategic resources within the transition to a circular bioeconomy. Rice husk is one of the most abundant agricultural by-products in rice-producing countries; it is generated in large volumes, is difficult to dispose of and is often under-utilised [6]. Recent reviews describe rice husk as a lignocellulosic material with relatively low density, significant silica content and a chemical composition that makes it attractive as a filler or reinforcement in polymer matrices [6]. Studies on rice-husk-reinforced polymer composites show that increasing husk content typically enhances stiffness and sometimes tensile strength, but at the expense of reduced impact resistance and increased water absorption, unless the fibre–matrix interface is carefully engineered with appropriate compatibilisers or surface treatments [6,7].
Natural-fibre-reinforced polymer composites and wood–plastic composites (WPCs) have evolved from early formulations based on virgin polymers and wood flour to more complex systems combining recycled polyolefins, diverse lignocellulosic fillers and tailored additives [6,7,8]. Gardner et al. [8], for example, show how WPCs are now widely used in decking, cladding and outdoor furniture, where moderate mechanical performance and adequate durability under outdoor exposure are required rather than high structural capacity. When these composites incorporate recycled polymers and waste lignocellulosic resources, they can substantially reduce the consumption of tropical hardwoods and virgin plastics in building and outdoor applications [8].
Alongside agricultural residues, post-consumer multilayer beverage cartons have emerged as a promising but technically demanding waste stream for composite production [5,9,10,11,12]. Several thermo-mechanical and mechanical recycling routes have been proposed to transform the polymer–aluminium fraction into cement-based materials, polymer concretes or polymer composites [5,9,10,11,12]. Martínez-López et al. [9] manufacture polymer concretes using recycled high-density polyethylene and PET from Tetra Pak® containers and report compressive and flexural strengths suitable for small structural elements. Macías-Gallego et al. [10] evaluate composite materials made from recycled Tetra Pak® containers, while Martínez-Barrera et al. [11,12] investigate the incorporation of Tetra Pak-derived components into concrete and other construction materials, demonstrating viable mechanical performance in non-structural applications. Overall, these studies focus on a single waste stream (either beverage-carton PolyAl or a lignocellulosic residue) and often on laboratory-scale specimens; only a limited number address board- or panel-like products manufactured by extrusion or compression moulding using industrially relevant equipment [5,6,7,9,10,11,12].
The concept of industrial symbiosis provides a useful framework to integrate these different waste streams into value-added products. Industrial symbiosis is commonly described as a specific application of industrial ecology in which traditionally separate industries collectively gain competitive advantage by exchanging materials, energy, water and by-products within local or regional networks [13]. Key features include collaboration among firms and the synergistic opportunities created by geographical proximity, which allow one company’s waste stream to become another company’s feedstock [13]. Recent reviews emphasise that well-designed industrial symbiosis initiatives can significantly reduce waste generation, decrease primary resource demand and improve the overall environmental performance of industrial clusters [14,15]. From a policy perspective, industrial symbiosis is increasingly recognised as a practical implementation tool for circular-economy strategies: the European Circular Economy Action Plan calls for high-value uses of secondary raw materials in resource-intensive sectors such as construction, plastics and packaging [16], while the United Nations 2030 Agenda stresses the need for resilient infrastructure (SDG 9), sustainable cities (SDG 11), responsible consumption and production (SDG 12) and climate action (SDG 13) [17]. Symbiotic schemes that valorise industrial and agro-food by-products into new materials and construction products directly contribute to these objectives by reducing landfilling, substituting virgin raw materials and enabling more sustainable infrastructure solutions [14,15,16,17].
Against this background, coupling recycled Tetra Pak® PolyAl with rice husk within a single composite material aligns with the core principles of industrial symbiosis and circular economy. The polymer–aluminium fraction of beverage cartons can act as a secondary polymeric matrix, while rice husk provides a lignocellulosic filler that partially replaces virgin wood flour or mineral fillers. If properly formulated and processed into wood-like boards, such composites could divert both packaging and agricultural residues from low-value uses or disposal, while supplying municipalities and other stakeholders with components suitable for low-load urban furniture applications.
Despite the substantial body of work on rice-husk composites, WPCs and recycled Tetra Pak® materials [5,6,7,8,9,10,11,12], there is, to the best of our knowledge, no systematic study of hybrid boards that combine recycled PolyAl and rice husk in different proportions and that are produced by extrusion plus compression moulding at board thicknesses representative of real products. Existing literature seldom reports a comprehensive mechanical and durability characterization—including tensile and flexural behaviour, surface hardness, water absorption and UV ageing—for such hybrid systems, nor does it explicitly link the measured properties to design windows for low-load structural elements such as park benches or beach walkways [6,7,8,9,10,11,12]. This work addresses these gaps by manufacturing wood-like boards from recycled Tetra Pak® PolyAl and ground rice husk through single-screw extrusion followed by compression moulding. Four formulations with different PolyAl/rice husk ratios are prepared and characterised in terms of density, tensile and flexural properties, surface hardness, water absorption and accelerated UV exposure. The experimental stress–strain curves are further analysed using the constitutive laws of Hollomon, Swift and Voce [18,19,20] too extract parameters relevant for mechanical design. By comparing the performance of the different formulations with data reported for rice-husk and Tetra Pak-based composites [6,7,8,9,10,11,12] and with typical property ranges for outdoor wood–plastic composites [8], the study aims to identify a composition that offers a suitable compromise between mechanical performance and durability for low-load urban furniture applications; as shown in the following sections, the intermediate PolyAl/rice husk ratio provides the most balanced solution within the tested range.
2. Materials and Methods
2.1. Raw Materials
The polymer matrix was an industrially pelletised PolyAl (PA) fraction obtained from post-consumer Tetra Pak® beverage cartons after fibre recovery by hydropulping. The PA consisted of polyethylene as the continuous phase, containing finely dispersed aluminium and residual cellulose fibres.
Rice husk (RH) was supplied by a local rice-processing company. The material was dried and mechanically ground to obtain a particulate lignocellulosic filler with a maximum particle size of approximately 1 mm. A maleic-anhydride-grafted polyethylene (MAPE) compatibilizer was used to improve interfacial adhesion between the hydrophobic PA and the hydrophilic RH. A brown colouring masterbatch was added to obtain a wood-like appearance suitable for outdoor applications.
Throughout the paper, PA and RH refer to the mass fractions (wt.%) of PolyAl and rice husk, respectively.
2.2. Composite Formulations
Four formulations were selected to cover a realistic range of RH contents while maintaining processability in extrusion and compression moulding. The compositions are summarised below:

Table 1.
Composite formulations (mass fractions in wt.%).
| Formulation 1 | PA (wt%) | RT (wt%) |
|---|---|---|
| F1 | 80 | 20 |
| F2 | 70 | 30 |
| F3 | 57 | 43 |
| F4 | 50 | 50 |
1All formulations contained the same proprietary amount of compatibilizer and colouring masterbatch provided by the industrial partner.
2.3. Processing of Wood-Like Boards
Composite boards were produced by an industrial partner using a single-screw extrusion followed by compression moulding. PA pellets, ground RH, compatibilizer and colourant were first homogenised in a gravimetric mixer and fed into a conventional single-screw extruder. Inside the barrel, PA melted and wet the RH particles, generating a viscous composite melt under standard processing conditions for PA-based materials as defined by the partner.
The molten strand leaving the die was deposited into a pre-heated steel mould with an internal cross-section of approximately 108 × 36 mm and a length of up to 3 m. Once the cavity was filled, the mould was closed and placed in a hydraulic press, where the material was consolidated under pressure and then cooled under controlled conditions. After demoulding, continuous solid boards with wood-like colour and surface finish were obtained.
2.4. Specimen Preparation
Specimens for mechanical and physical testing were machined from the boards using standard woodworking tools. Full-section beams were cut along the extrusion direction for three-point bending tests, with typical dimensions of about 440 × 108 × 35 mm (length × width × thickness), constrained by the board geometry.
Rectangular plates were extracted from the board faces and further machined into tensile specimens with a reduced central gauge, following the general philosophy of dog-bone specimens used for plastics. Smaller prismatic pieces were prepared for density measurements, and irregular fragments were reserved for hardness, water-absorption and UV-ageing tests.
All specimens were labelled with their formulation code (F1–F4) and conditioned at laboratory ambient temperature and humidity for at least 48 h prior to testing. For each formulation and test, several specimens were used and mean values and standard deviations were calculated.
2.5. Mechanical Testing
Tensile tests were carried out in a universal testing machine under displacement control. Plate-based specimens were clamped with mechanical wedge grips. The procedure followed the general recommendations of UNE-EN ISO 527 for plastics, with adaptations in specimen geometry and test speed imposed by the available board thickness and equipment. Force–displacement data were recorded continuously until failure and converted into engineering stress–strain curves using the initial cross-sectional area and gauge length. True stress–strain curves were then obtained assuming negligible volume change in the plastic regime.
Flexural behaviour was characterised by three-point bending tests on full-section beams in the same universal testing machine. A simply supported configuration with a span of 400 mm was used, resulting in a span-to-thickness ratio of approximately 11:1 for the nominal board thickness. The procedure was inspired by UNE-EN ISO 178 for plastics but adapted to the actual beam geometry. At least one quasi-static loading rate was employed; the applied force and mid-span deflection were recorded to determine the flexural modulus and strength from the standard beam-bending relationships.
2.6. Physical and Durability Testing
Surface hardness was measured on small specimens cut from the board surfaces using a Shore D durometer mounted on a stand. The methodology was based on UNE-EN ISO 868. For each specimen, several readings were taken at different locations and averaged to obtain a representative hardness value; at least three specimens per formulation were tested.
Apparent density was determined on prismatic specimens by dry measurements. Mass was recorded using an analytical balance and dimensions were measured with a calliper. The procedure was inspired by UNE-EN ISO 1183.
Water absorption was evaluated on fragments obtained from cutting operations. Specimens were dried to constant mass, weighed and then immersed in water at room temperature. At selected exposure times (from hours to several days), specimens were removed, wiped to remove surface water and re-weighed. Water uptake was expressed as mass gain per unit exposed surface area. The protocol followed the philosophy of UNE-EN ISO 62 but with non-standard specimen shapes and an adapted immersion schedule.
Short-term UV ageing was studied by exposing small specimens to a low-pressure mercury lamp with a dominant wavelength of 254 nm. Groups of specimens were subjected to increasing exposure times. After each interval, Shore D hardness was measured using the same procedure as for unexposed material. The method provided a qualitative assessment of the influence of UV radiation on surface properties, in analogy with the concept of accelerated weathering in UNE-EN ISO 4892.
2.7. Microstructural Analysis and Constitutive Modelling
Microstructural observations were performed on polished cross-sections of selected specimens by optical microscopy. The analysis focused on RH particle dispersion, the presence of voids or defects and the apparent quality of the PA–RH interface. Representative images were used to support the interpretation of the mechanical and physical results.
True stress–strain curves obtained from tensile tests were fitted to three classical work-hardening laws: Hollomon, Swift and Voce [18,19,20]. Nonlinear regression was applied to the plastic portion of the curves to identify the corresponding parameters for each formulation. These parameters were later used to compare the mechanical response of the PA–RH boards and to discuss the suitability of each constitutive law for design and numerical modelling of low-load structural elements made from the studied material.
3. Results
This section presents the experimental results obtained for the PA–RH boards, structured by type of test. First, the tensile and flexural responses are analysed together with the constitutive parameters identified from the true stress–strain curves. Then, the physical properties (hardness and apparent density) and water absorption behaviour are reported, followed by a brief assessment of short-term UV ageing and microstructural observations. Unless otherwise stated, reported values correspond to the mean of all tested specimens for each formulation, and the detailed numerical data are provided in the corresponding tables and figures.
3.1. Tensile Behaviour and Constitutive Parameters
The true stress–strain curves in tension for the four PA–RH boards are shown in the experimental and fitted plots, Hollomon and Voce. All compositions display a non-linear response from very low strain levels, with a short quasi-linear initial segment followed by a marked strain-hardening region up to fracture. Maximum true stresses are in the range of 8–10 MPa. Within this range, the 57PA–43RH board consistently reaches the highest stress levels over most of the strain interval, whereas 80PA–20RH shows the lowest tensile strength; 50PA–50RH and 70PA–30RH exhibit intermediate behaviour. The scatter between specimens of the same composition is moderate, indicating acceptable reproducibility of the manufacturing process.
The experimental curves were first fitted to the Hollomon law:
using true stress σ and true strain ε. The global parameters obtained for each formulation (refer to Table 2) show strength coefficients K between 29.29 and 76.85 MPa and strain-hardening exponents n between 0.43 and 0.60. The highest K and n values correspond to 50PA–50RH, followed by 57PA–43RH, while 70PA–30RH presents the lowest values; 80PA–20RH partially recovers both K and n. In all cases, the determination coefficients R2 lie between 0.94 and 0.97, confirming that this simple power law reproduces the overall curvature of the tensile response, although it cannot represent the gradual saturation observed at larger strains.
σ=K·εn,
After fitting the global Hollomon parameters, the experimental true stress–strain curves for all tensile specimens were compared with the corresponding model predictions. Figure 1 shows, for each PA–RH board, the individual tensile curves and the global Hollomon fit, illustrating both the scatter between specimens and the ability of the power law to reproduce the overall shape of the response.
To capture this saturation effect, the Voce law was also applied:
where σ0 is the initial flow stress, σs the saturation stress and c a material constant. The resulting global parameters for each composite are summarised in Table 3. Saturation stresses σs range from 7.76 MPa (80PA–20RH) to 10.36 MPa (57PA–43RH), in agreement with the ranking observed in the experimental curves. The parameter c takes values between 50.5 and 88.0, reflecting different rates of approach to saturation. The coefficients of determination R2 are between 0.94 and 0.99 and are systematically equal to or higher than those of the Hollomon fits, while the global Voce curves closely follow the envelopes of the experimental data for all formulations. On this basis, the Voce model is selected as the reference constitutive law for subsequent analysis of the tensile behaviour of the PA–RH boards.
After identifying the global Voce parameters, the experimental true stress–strain curves of all tensile specimens were compared with the corresponding model predictions. Figure 2 shows, for each PA–RH board, the individual tensile curves together with the global Voce fit, illustrating both the experimental scatter and the ability of the Voce law to reproduce the nonlinear hardening behaviour up to saturation.
To provide an overall comparison between formulations, the four global Voce curves were plotted together in a single graph. Figure 3 summarises the fitted tensile behaviour of the PA–RH boards, highlighting the differences in stress level and hardening rate associated with the PA/RH ratio.
3.2. Bending Behaviour and Constitutive Parameters
Three-point bending tests were carried out on full-section beams to characterise the flexural response of the PA–RH boards. True flexural stress–strain curves were derived from the force–deflection data and used to identify the parameters of the Hollomon and Voce work-hardening laws (Equations (1) and (2)), following the same procedure as in tension.
The flexural curves were first fitted using the Hollomon law (Equation (1)). The global parameters obtained for each formulation are summarised in Table 4. The strength coefficient K shows a clear decreasing trend from approximately 665 MPa for 50PA–50RH down to about 70 MPa for 80PA–20RH, while the strain-hardening exponent n decreases from around 0.90 to 0.51. The coefficients of determination R2 remain relatively high (between 0.86 and 0.98), indicating that the Hollomon law provides a reasonable description of the overall flexural hardening behaviour of the boards.
After fitting the global Hollomon parameters, the experimental true flexural stress–strain curves for all specimens were compared with the corresponding model predictions. Figure 4 shows, for each formulation, the individual flexural curves together with the global Hollomon fit, illustrating both the experimental scatter and the capability of the power law to reproduce the main features of the response.
To better capture the saturation tendency observed at higher flexural strains, the same curves were fitted using the Voce law (Equation (2)). The corresponding parameters are listed in Table 5. The saturation stress σs decreases from about 38 MPa for 50PA–50RH to roughly 16 MPa for 80PA–20RH, in line with the reduction of apparent flexural strength as the PA content increases. The initial stress σ0 is practically negligible in all cases, and the parameter c takes values between approximately 33 and 64, controlling how quickly the curves approach σs. The Voce fits yield R2 values between about 0.92 and 0.98, systematically higher than those obtained with the Hollomon model.
Figure 5 illustrates the agreement between the experimental flexural data and the Voce predictions for each formulation. The model closely follows the non-linear hardening over the whole strain range, particularly in the high-strain region. For design and comparative purposes, the four global Voce curves are finally plotted together in Figure 6, providing a compact summary of the flexural response of the PA–RH boards as a function of composition. In view of the higher average R2 and its ability to reproduce the saturation behaviour, the Voce law is selected as the preferred constitutive model in bending.
3.3. Surface Hardness
Shore D hardness in dry condition was measured on all PA–RH boards. The descriptive statistics for each formulation are summarised in Table 6, including number of specimens, mean value, standard deviation and minimum/maximum hardness. The highest average hardness was obtained for the 50PA–50RH board (≈61.67 Shore D), followed by 57PA–43RH (≈58.30). The 70PA–30RH and 80PA–20RH formulations showed lower mean values, around 52.36 and 50.36, respectively. Standard deviations remained modest in all cases, which indicates a good reproducibility of the hardness measurements.
The distribution of hardness values is illustrated in Figure 7 by means of box-and-whisker plots. For each composition, the median hardness is highlighted by a black line inside the box, and the numerical mean is plotted next to it. This representation makes it possible to visualise both intra-composition variability and the systematic decrease in hardness as the PA (Tetrabrik) content increases and the RH fraction is reduced.
The relationship between hardness and formulation was further quantified by a linear regression of the mean hardness against the PA content, expressed as Tetrabrik percentage in the mixture (Figure 8). The experimental data show a clear decreasing trend, which is well described by the regression line,
The equation representing this trend being:
this result indicates that each 1 wt.% increase in Tetrabrik content leads, on average, to a reduction of about 0.39 Shore D units in surface hardness within the studied composition range.
3.4. Apparent Density
Apparent density was determined for all PA–RH boards using prismatic specimens cut from the moulded panels. Figure 9 shows the evolution of density as a function of PA content. A clear increasing trend is observed, from approximately 1.12 g·cm−3 for the 50PA–50RH composite to about 1.20 g·cm−3 for 80PA–20RH, with intermediate values around 1.14 g·cm−3 and 1.18 g·cm−3 for the 57PA–43RH and 70PA–30RH formulations.
The linear regression of density versus PA percentage yields a high coefficient of determination (R2 = 0.993), confirming the strong correlation between both variables. The fitted relationship can be expressed as:
within the composition range considered in this study.
3.5. Water Absorption
Water absorption tests were performed on all PA–RH boards by monitoring the normalised mass gain per exposed surface area as a function of the square root of immersion time. The mean curves for each formulation are compared in Figure 10. All compositions exhibit an initial quasi-linear increase of absorbed water versus √t, consistent with a diffusion-controlled surface mechanism, followed by a gradual approach towards a quasi-steady state as immersion time increases.
A clear dependence on composition is observed. The 50PA–50RH and 57PA–43RH boards show the highest absorption rates and final uptake levels, whereas the 80PA–20RH composite exhibits the lowest values throughout the test, confirming the beneficial effect of a higher PA fraction on resistance to moisture ingress. The 70PA–30RH formulation displays intermediate behaviour, with noticeably lower water uptake than the more RH-rich boards while still retaining a significant bio-based content. Normalisation by exposed surface area removes geometric effects between specimens, enabling a consistent comparison among the four materials. Within the range studied, 70PA–30RH appears as a reasonable compromise between stiffness (Section 3.1 and Section 3.2) and water resistance.
3.6. Microstructural Observations
Representative optical micrographs of the PA–RH boards are shown in Figure 11, Figure 12, Figure 13 and Figure 14. The bright regions correspond to PolyAl-rich domains containing aluminium foil fragments, whereas the darker background is associated with the polymeric matrix and the lignocellulosic filler. In all formulations, PolyAl particles appear as irregular clusters with variable size, and their spatial distribution is clearly non-uniform, with zones of higher and lower particle density.
Within these qualitative pictures, the boards with higher PA content tend to exhibit larger PolyAl-rich agglomerates and more pronounced local heterogeneities, while the more RH-rich formulations show a slightly finer dispersion. Due to the absence of metallographic etching and the optical contrast limitations, individual rice husk particles cannot be clearly distinguished from the surrounding matrix, and a quantitative assessment of porosity or interfacial defects is not possible with the present images. Nevertheless, these observations support the interpretation that microstructural heterogeneity and the distribution of PolyAl-rich domains are likely to influence the tensile and flexural behaviour of the boards discussed in Section 3.1 and Section 3.2.
3.7. UV Ageing
The evolution of surface hardness under UV exposure was monitored for all PA–RH boards up to 100 h (test conditions described in Section 2). Figure 15 shows the mean Shore D hardness of each formulation as a function of exposure time. All composites exhibit a progressive increase in hardness with irradiation time, without abrupt changes or signs of surface degradation during the test window.
Formulations with higher RH content start from the highest initial hardness levels. The 50PA–50RH board increases from about 60.7 to 61.9 Shore D between 0 and 100 h, while 57PA–43RH evolves from roughly 59.3 to 61.1 Shore D with very small variations throughout the test. In contrast, the 70PA–30RH and 80PA–20RH boards begin from lower hardness values (≈50.5 and ≈49.5 Shore D, respectively) and show a more pronounced hardening, reaching about 61 and 56–57 Shore D after 100 h. Overall, all four formulations present a moderate increase in surface hardness under the applied UV conditions, with final values that tend to converge towards a relatively narrow range, which suggests that short-term UV exposure does not impair the mechanical performance of the boards.
4. Discussion
This section integrates the mechanical, physical and durability results obtained for the PA–RH composite boards and compares them with previous studies on rice-husk-reinforced polymers and Tetra Pak–based composites [5,6,7,8,9,10,11,12]. The aim is to clarify how the PolyAl/rice husk ratio controls stiffness, strength, hardness and water uptake, and to outline the implications for low-load structural applications in outdoor environments and for circular-economy strategies [13,14,15,16,17].
4.1. Mechanical and Physical Behaviour in the Context of Previous Composites
The boards manufactured from PA and RH exhibit densities between about 1.12 and 1.20 g/cm3, increasing almost linearly with the PA (Tetra Pak) fraction. This range is fully consistent with typical wood–plastic composites (WPCs) and with other materials derived from recycled Tetra Pak containers, such as polymer concretes, composite panels and concrete-like elements, which generally lie between 1.0 and 1.3 g/cm3 depending on matrix type and filler content [8,9,10,11,12].
Flexural strength values around 20 MPa and flexural moduli close to 3–4 GPa place the present boards in the lower–medium range of WPCs used for decking and cladding and in the same order of magnitude as Tetra Pak–based composites reported by Gallego et al., Martínez-López et al. and Martínez-Barrera et al. [9,10,11]. In those works, bending strengths between roughly 15 and 30 MPa and moduli above 3 GPa were obtained for boards and polymer concretes manufactured from recycled Tetra Pak fractions [9,10,11]. Compared with these references, the PA–RH boards achieve competitive stiffness and strength while simultaneously valorising two residue streams (PolyAl and rice husk), which imposes additional constraints on processing and dispersion.
The trend observed in this work—higher stiffness and hardness with increasing RH content, accompanied by reduced ductility—is in good agreement with reviews and parametric studies on polypropylene–rice husk composites [6,7]. These studies show that lignocellulosic fillers generally increase tensile and flexural modulus but can reduce tensile strength and elongation at break when the filler content becomes too high, due to stress concentrations and imperfect stress transfer at the matrix–fibre interface [6,7]. The behaviour of the present PA–RH boards therefore follows the same micromechanical tendencies, despite the more complex PolyAl matrix and the presence of aluminium layers.
From a constitutive viewpoint, the tensile and flexural curves of all formulations are strongly non-linear and can be described using classic work-hardening laws. Among the three models considered (Hollomon, Swift and Voce) [18,19,20], the Voce law gives the highest coefficients of determination and, importantly, captures the saturation of flow stress at large strains. This is relevant for design, because Hollomon-type power laws tend to overestimate stresses at high strain levels [18,19], whereas the Voce formulation was originally proposed to represent realistic saturation behaviour in metals [20] and can be directly implemented in numerical simulations of boards and structural details.
4.2. Effect of the PA/RH Ratio: Stiffness–Strength–Hardness Balance
Changing the PA/RH ratio proved to be an efficient way of tuning the mechanical response. Compositions with higher RH content showed higher Shore D hardness and increased flexural stiffness, as expected when a more rigid lignocellulosic phase is introduced into a polyolefin matrix [6,7,8]. At the same time, these RH-rich boards exhibited slightly lower flexural strength and reduced deformation capacity, which can be attributed to stress concentrations around rigid particles, local debonding at the PA/RH interface and a higher probability of micro-voids [6,7].
Conversely, PA-rich formulations (70PA–30RH and 80PA–20RH) benefited from a more continuous polymeric matrix and from the presence of aluminium flakes, which helped to maintain strength and improved moisture resistance, but they displayed lower modulus and hardness. Similar trade-offs between stiffness, strength and ductility have been reported in WPC technology, where the optimal natural-fibre content is often found in the range 30–40 wt.% [8].
Within the composition window studied here, the 70PA–30RH board stands out as the best compromise. It reaches the highest flexural stiffness while maintaining flexural strength values comparable to RH-richer boards and keeping water absorption at intermediate levels. Its hardness remains within the typical range reported for commercial WPC decking and cladding [8]. This balance between rigidity, strength, hardness and moisture sensitivity makes the 70PA–30RH formulation particularly suitable for low-load structural elements in urban furniture, where serviceability (deflection and surface wear) is as important as ultimate strength.
4.3. Water Absorption and UV Ageing in Relation to Durability Studies
Normalised water absorption curves revealed an initial regime approximately proportional to the square root of immersion time, followed by a gradual approach to saturation. This behaviour is typical of Fickian diffusion controlled by surface ingress and has been widely reported for PP–RH composites and other WPCs [6,7,8]. In the present boards, compositions with higher RH content showed higher slopes and higher saturation levels, whereas PA-rich formulations absorbed less water over the same exposure time. This is consistent with the hydrophilic nature of the lignocellulosic phase and the hydrophobic barrier effect of the PolyAl fraction [6,7,8].
In absolute terms, the maximum mass gains measured are comparable to, or lower than, those reported for other Tetra Pak–based composite panels and concrete-like materials [9,10,11,12]. For example, Bekhta et al. and Martínez-Barrera et al. observed water absorption levels of a few percent in Tetra Pak/polyethylene composites and Tetra Pak-reinforced concrete, respectively, with values strongly influenced by porosity and panel thickness [10,11,12]. The relatively moderate water uptake of the PA–RH boards confirms that a high PolyAl content provides an effective barrier against moisture ingress, improving performance with respect to PP–RH composites without metallic layers, which typically show higher absorption after prolonged immersion [6,7].
Regarding UV ageing, all formulations exhibited a progressive increase in surface hardness with exposure time. The effect was more pronounced for PA-rich compositions, suggesting that photo-oxidation and physical ageing of the polyolefin matrix lead to surface densification or partial cross-linking rather than to severe embrittlement during the 100 h exposure used here. Similar trends—moderate increases in stiffness and hardness with limited loss in flexural strength—have been described for WPCs and for composite boards produced from waste Tetra Pak under accelerated weathering [8,10]. However, the relatively short duration and simplified conditions of the present UV test call for extended ageing campaigns, including combined UV–moisture cycles and temperature variations, before definitive conclusions can be drawn about long-term durability in service.
4.4. Microstructure–Property Relationships
Optical microscopy qualitatively confirmed the heterogeneous microstructure that is typical of Tetra Pak–derived composites [9,10,11,12]. Bright PolyAl-rich domains containing aluminium foil fragments were observed within a darker polymer–filler matrix. These domains appeared as irregular clusters with a broad size distribution and a clearly non-uniform spatial arrangement, with regions of higher and lower particle density. Such heterogeneity has also been reported in polymer concretes and panels produced from ground Tetra Pak fractions, where the fragmentation process generates flakes that are difficult to disperse uniformly [9,10,11].
Although the absence of specific etching prevents a clear distinction of individual rice husk particles, the qualitative observations support the mechanical results. Local clustering of rigid PolyAl particles and associated voids can act as stress concentrators, promoting micro-crack initiation under tensile and flexural loading and partly explaining why the strength of the boards remains moderate despite their relatively high stiffness. On the other hand, the presence of rigid PolyAl domains near the surface likely contributes to the measured hardness and to the good abrasion resistance expected for these materials, which is advantageous in the context of pedestrian traffic and outdoor furniture.
These findings suggest that further optimisation of grinding, compounding and extrusion conditions, together with potential surface treatments or compatibiliser adjustments for rice husk, could reduce clustering, improve interfacial adhesion and enhance both strength and durability without compromising the high recycled content.
4.5. Implications for Circular Economy and Future Work
From a circular-economy perspective, the material system developed in this work simultaneously valorises two abundant residue streams: post-consumer beverage cartons and rice husk. This approach fits within the concepts of industrial symbiosis and resource efficiency described in the literature [13,14,15] and aligns with European policy frameworks on circular economy and sustainable production [16,17]. By transforming difficult-to-recycle PolyAl fractions and agricultural by-products into usable boards for benches, walkways and similar low-load components, the solution proposed here can help to reduce landfilling, substitute tropical timber and partially displace virgin fossil-based polymers [5,8].
The results obtained, especially for the 70PA–30RH formulation, indicate that PA–RH boards can realistically compete with conventional WPCs for certain outdoor applications, while offering a higher level of waste valorisation [8,9,10,11,12]. Nevertheless, several aspects require further research before large-scale deployment:
- optimisation of processing parameters to minimise microstructural heterogeneity and improve strength;
- long-term durability tests including cyclic wetting–drying, freeze–thaw cycles and combined UV–moisture weathering;
- assessment of creep, fatigue and impact behaviour under service-like conditions;
Overall, the present study shows that PA–RH composites are promising candidates for low-load structural elements in urban furniture and coastal infrastructure, providing a concrete example of how industrial symbiosis can support the transition towards more circular and climate-responsible materials systems [13,14,15,16,17].
5. Conclusions
This work characterised recycled PA–RH composite boards manufactured by extrusion and compression moulding for low-load structural applications. The main findings are:
1. All formulations show densities and flexural properties comparable to commercial wood–plastic composites and Tetra Pak–based boards, confirming their suitability for urban furniture and decking-type uses.
2. The Voce law provides the most accurate description of the tensile and flexural stress–strain curves, offering a compact constitutive model for design and numerical simulations.
3. Increasing the rice husk fraction enhances stiffness and surface hardness but increases water uptake, whereas PolyAl-rich boards show lower hardness but improved moisture resistance; the 70PA–30RH formulation offers the best overall compromise.
4. Water absorption remains within the range reported for other Tetra Pak composites, and short-term UV exposure leads to moderate surface hardening without visible degradation, indicating promising initial durability.
5. By jointly valorising beverage carton PolyAl and rice husk residues, these boards illustrate a viable industrial-symbiosis route that supports circular-economy and sustainability objectives, although long-term outdoor ageing and microstructural optimisation should be addressed in future work.
Author Contributions
Conceptualization, M.A. Perez Puig., Oscar Loriente.; methodology, Alba Loriente Lujan.; validation, M.A. Perez Puig., Fidel Salas., Oscar Loriente., Alba Loriente Lujan.; formal analysis, Alba Loriente Lujan.; investigation, Alba Loriente Lujan.; resources, data curation, Alba Loriente Lujan.; writing—original draft preparation, Alba Loriente Lujan.; writing—review and editing, Alba Loriente Lujan.; visualization, M.A. Perez Puig., Fidel Salas., Oscar Loriente.; supervision, M. A. Perez Puig., Fidel Salas., Oscar Loriente.; project administration, M. A. Perez Puig., Fidel Salas., Oscar Loriente.. All authors have read and agreed to the published version of the manuscript.
Funding
This research received no external funding. The APC was funded by the authors.
Data Availability Statement
The data supporting the findings of this study are contained within the article (tables and figures). Additional raw data are available from the corresponding author upon reasonable request. The data presented in this study are available on request from the corresponding author due to the collaborative agreement with the industrial partner that supplied the composite boards.
Acknowledgments
The authors would like to thank the laboratory technicians of the Materials and Mechanical Testing Laboratory at the Universitat Politècnica de València for their support. The authors also gratefully acknowledge the industrial partner that provided the PA–RH composite boards used in this study. During the preparation of this manuscript, the authors used ChatGPT (OpenAI, San Francisco, CA, USA) for assistance with language editing and refinement of the English style. The authors have reviewed and edited all AI-generated content and take full responsibility for the content of this publication.
Conflicts of Interest
The authors declare no conflicts of interest.
Abbreviations
The following abbreviations are used in this manuscript:
| EU | European Union |
| ISO | International Organization for Standardization |
| MAPE | Maleic-anhydride-grafted polyethylene |
| PA | PolyAl fraction from recycled Tetra Pak beverage cartons |
| PA-RH | PolyAl-rice husk composite boards |
| PP | Polypropylene |
| RH | Rice husk |
| SDG | Sustainable Development Goal |
| UV | Ultraviolet |
| WPC | Wood-plastic composite |
References
- Geyer, R.; Jambeck, J.R.; Law, K.L. Production, use, and fate of all plastics ever made. Science Advances 2017, 3, e1700782. [Google Scholar] [CrossRef] [PubMed]
- European Commission. Packaging waste. Environment. 2024. Available online: https://environment.ec.europa.eu/topics/waste-and-recycling/packaging-waste_en (accessed on 9 December 2025).
- Eurostat. Packaging Waste in the EU. News Release, 9 November 2023.
- Alliance for Beverage Cartons and the Environment (ACE). Beverage Cartons: Design for Recyclability Guidelines. 2022. Available online: https://www.beveragecarton.eu (accessed on 9 December 2025).
- Robertson, G.L. Recycling of aseptic beverage cartons: A review. Recycling 2021, 6, 20. [Google Scholar] [CrossRef]
- Suhot, M.A.; Hassan, M.Z.; Aziz, S.A.; Md Daud, M.Y. Recent progress of rice husk reinforced polymer composites: A review. Polymers 2021, 13, 2391. [Google Scholar] [CrossRef] [PubMed]
- Ghalme, S.G. Improving mechanical properties of rice husk and straw fiber reinforced polymer composite through reinforcement optimization. Jordan Journal of Mechanical and Industrial Engineering 2021, 15, 411–417. [Google Scholar]
- Gardner, D.J.; Han, Y.; Wang, L. Wood–plastic composite technology. Current Forestry Reports 2015, 1, 139–150. [Google Scholar] [CrossRef]
- Martínez-López, M.; Guerrero, A.; Peña-Rodríguez, G.; Martín-Martínez, J.M. Mechanical and thermal properties of polymer concrete made with recycled high-density polyethylene and poly(ethylene terephthalate) from Tetra Pak® containers. International Journal of Polymer Science 2015, 2015, 763917. [Google Scholar] [CrossRef]
- Gallego, S.M.; Aponte, A.G.; Sierra, R.B.; Marín, J.F. Evaluation of mechanical properties of composites manufactured from recycled Tetra Pak® containers. Tecnura 2020, 24, 36–46. [Google Scholar] [CrossRef]
- Martínez-Barrera, G.; Hernández-López, O.; Brostow, W.; López, K.H. Concrete reinforced with waste Tetra Pak material: Mechanical properties. Advances in Materials Science and Engineering 2015, 2015, 682926. [Google Scholar] [CrossRef]
- Martínez-Barrera, G.; Escobar-Campos, C.U. Waste Tetra Pak containers and its use in construction materials. Pädi Boletín Científico de Ciencias Básicas e Ingenierías del ICBI 2023, 11(Special 5), 1–6. [Google Scholar] [CrossRef]
- Taddeo, R.; Simboli, A.; Ioppolo, G.; Morgante, A. Industrial Symbiosis, Networking and Innovation: The Potential Role of Innovation Poles. Sustainability 2017, 9, 169. [Google Scholar] [CrossRef]
- Neves, A.C.; Godina, C.; Matias, J.C.; Sousa, J.P.A. Industrial symbiosis in the literature: A systematic review and research agenda. Journal of Cleaner Production 2020, 247, 119113. [Google Scholar] [CrossRef]
- Fraccascia, L.; Giannoccaro, I. What, where, and why: A taxonomy of industrial symbiosis. Journal of Cleaner Production 2016, 114, 62–75. [Google Scholar] [CrossRef]
- European Commission. A New Circular Economy Action Plan for a Cleaner and More Competitive Europe; COM(2020) 98 final; European Commission: Brussels, Belgium, 2020; Available online: https://eur-lex.europa.eu/legal-content/EN/TXT/?uri=CELEX:52020DC0098 (accessed on 9 December 2025).
- United Nations General Assembly. Transforming Our World: The 2030 Agenda for Sustainable Development; Resolution A/RES/70/1; United Nations: New York, NY, USA, 2015; Available online: https://undocs.org/A/RES/70/1 (accessed on 9 December 2025).
- Hollomon, J.H. Tensile deformation. Transactions of the American Institute of Mining and Metallurgical Engineers 1945, 162, 268–290. [Google Scholar]
- Swift, H.W. Plastic instability under plane stress. Journal of the Mechanics and Physics of Solids 1952, 1, 1–18. [Google Scholar] [CrossRef]
- Voce, E. A practical strain-hardening function. Metallurgia 1955, 51, 219–226. [Google Scholar]
Figure 1.
True tensile stress–strain Hollomon curves for the PA–RH boards.
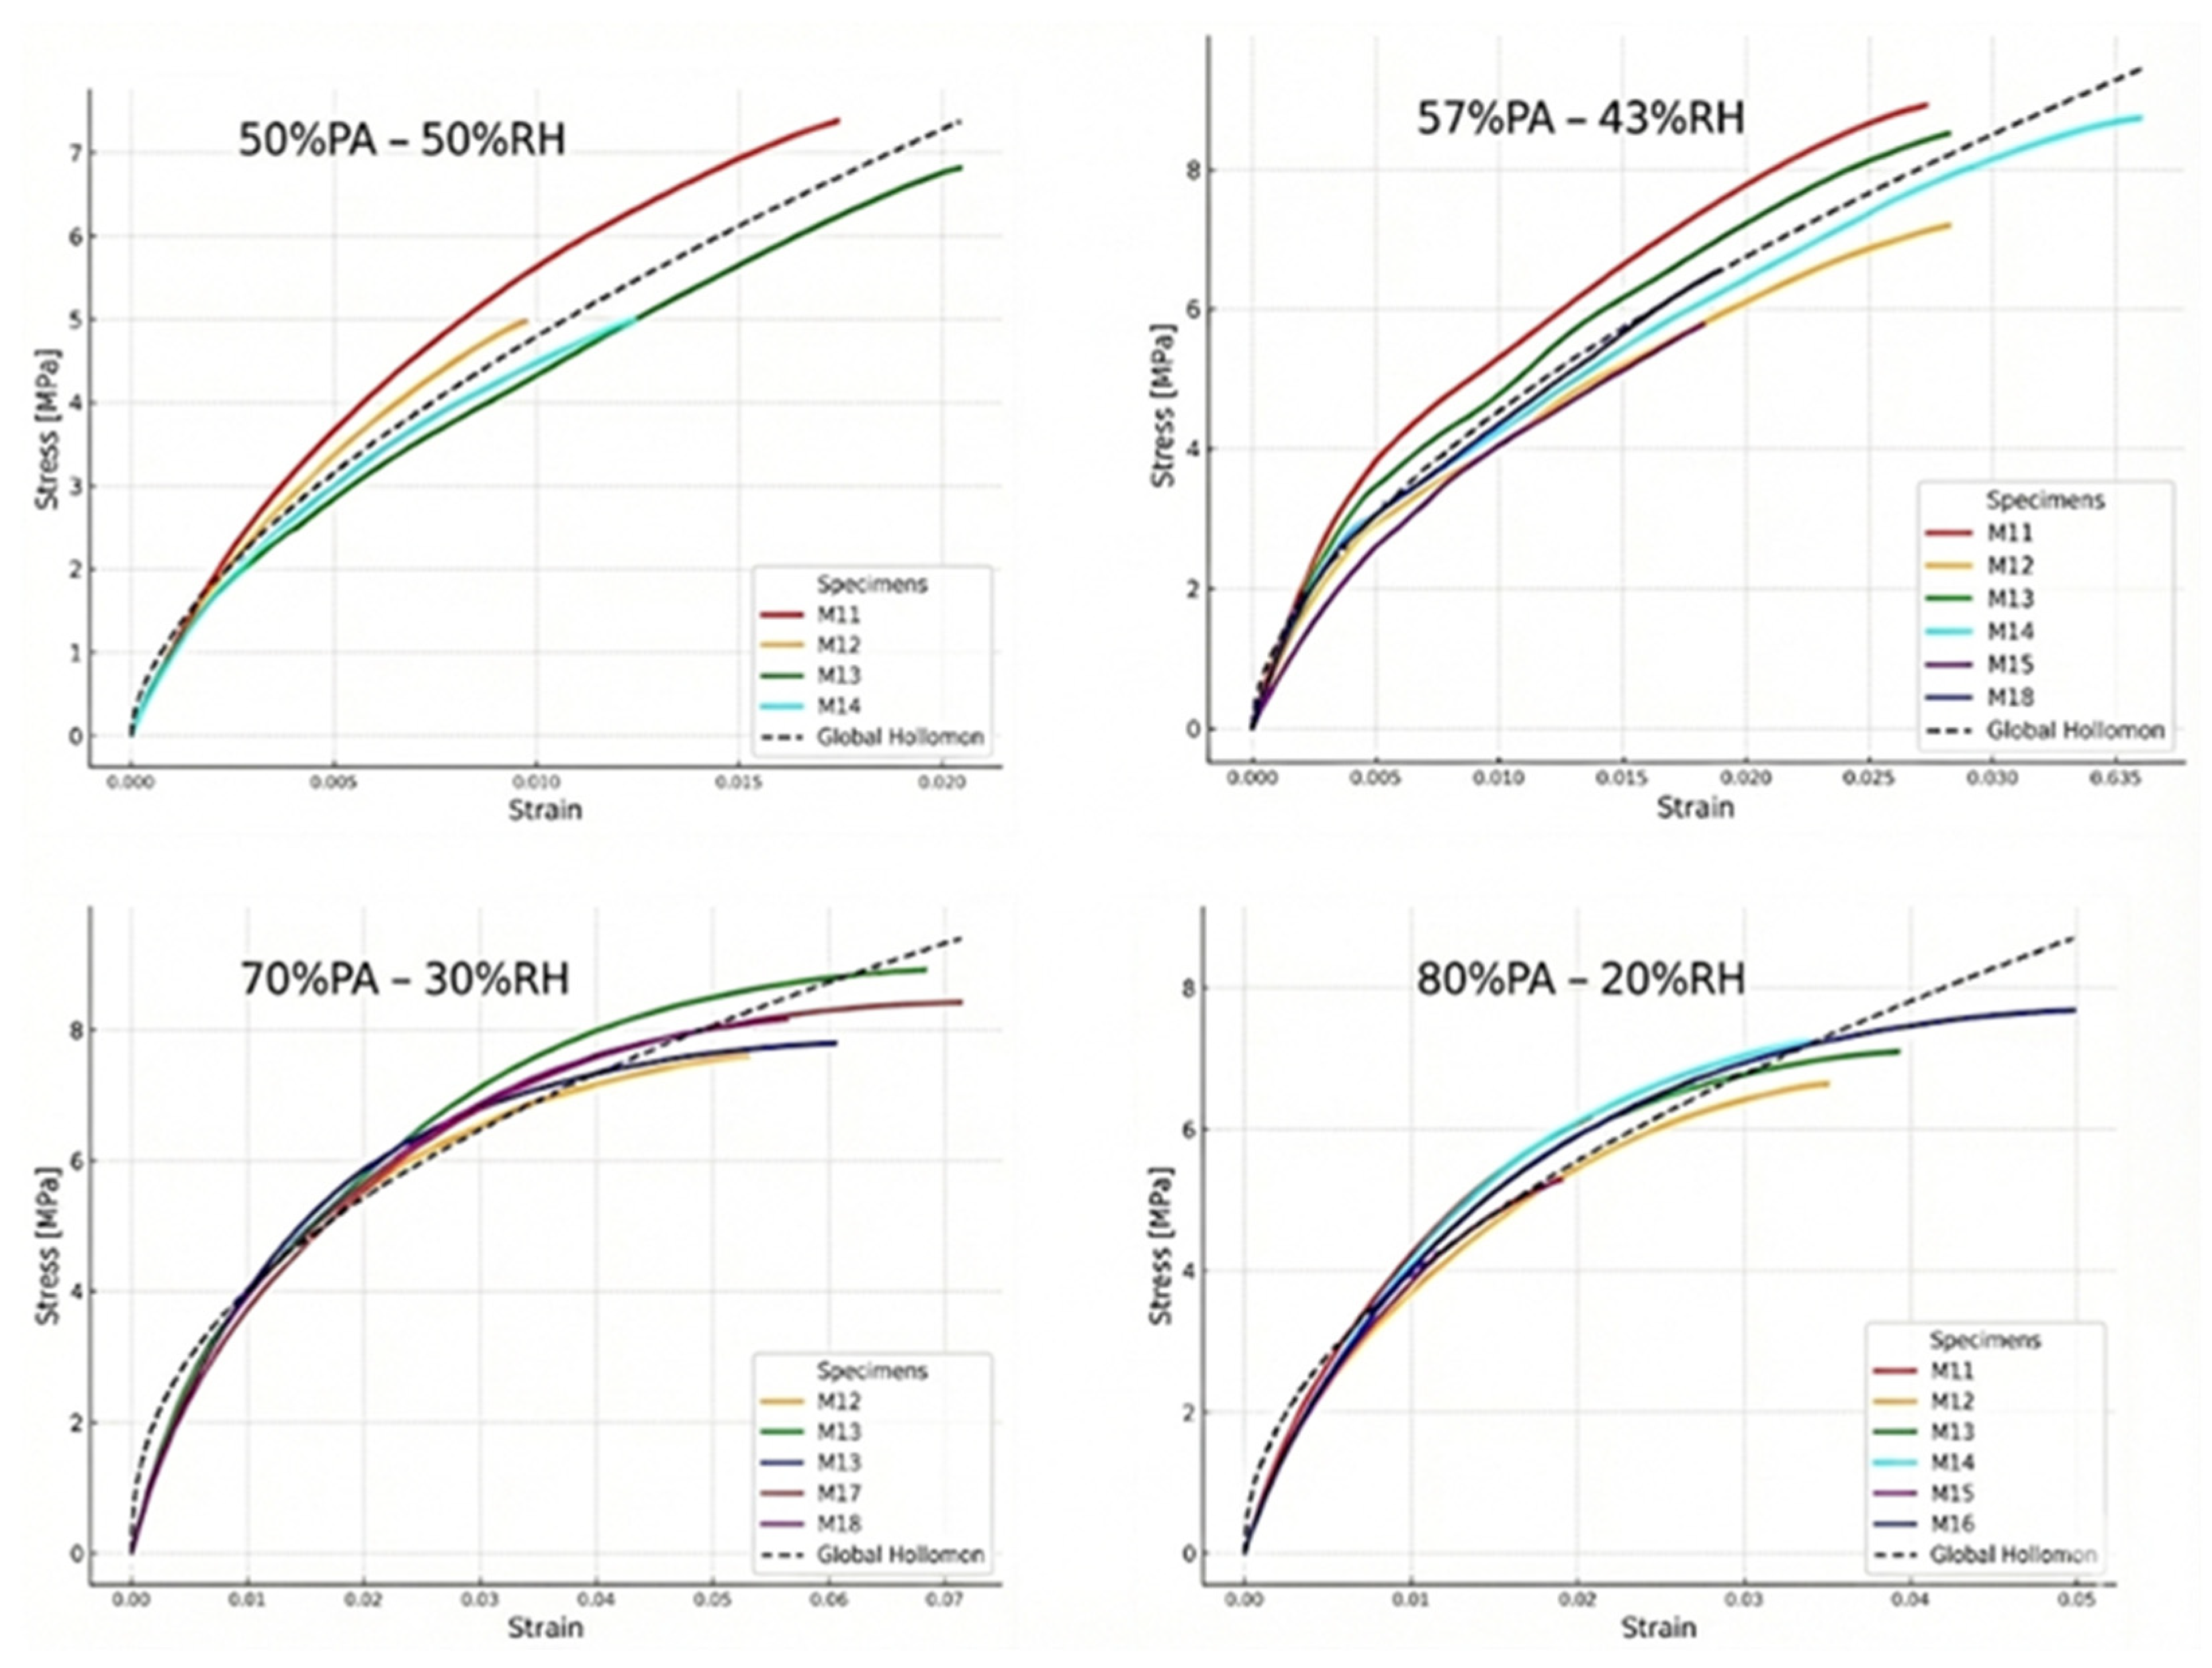
Figure 2.
True tensile stress–strain Voce curves for the PA–RH boards.
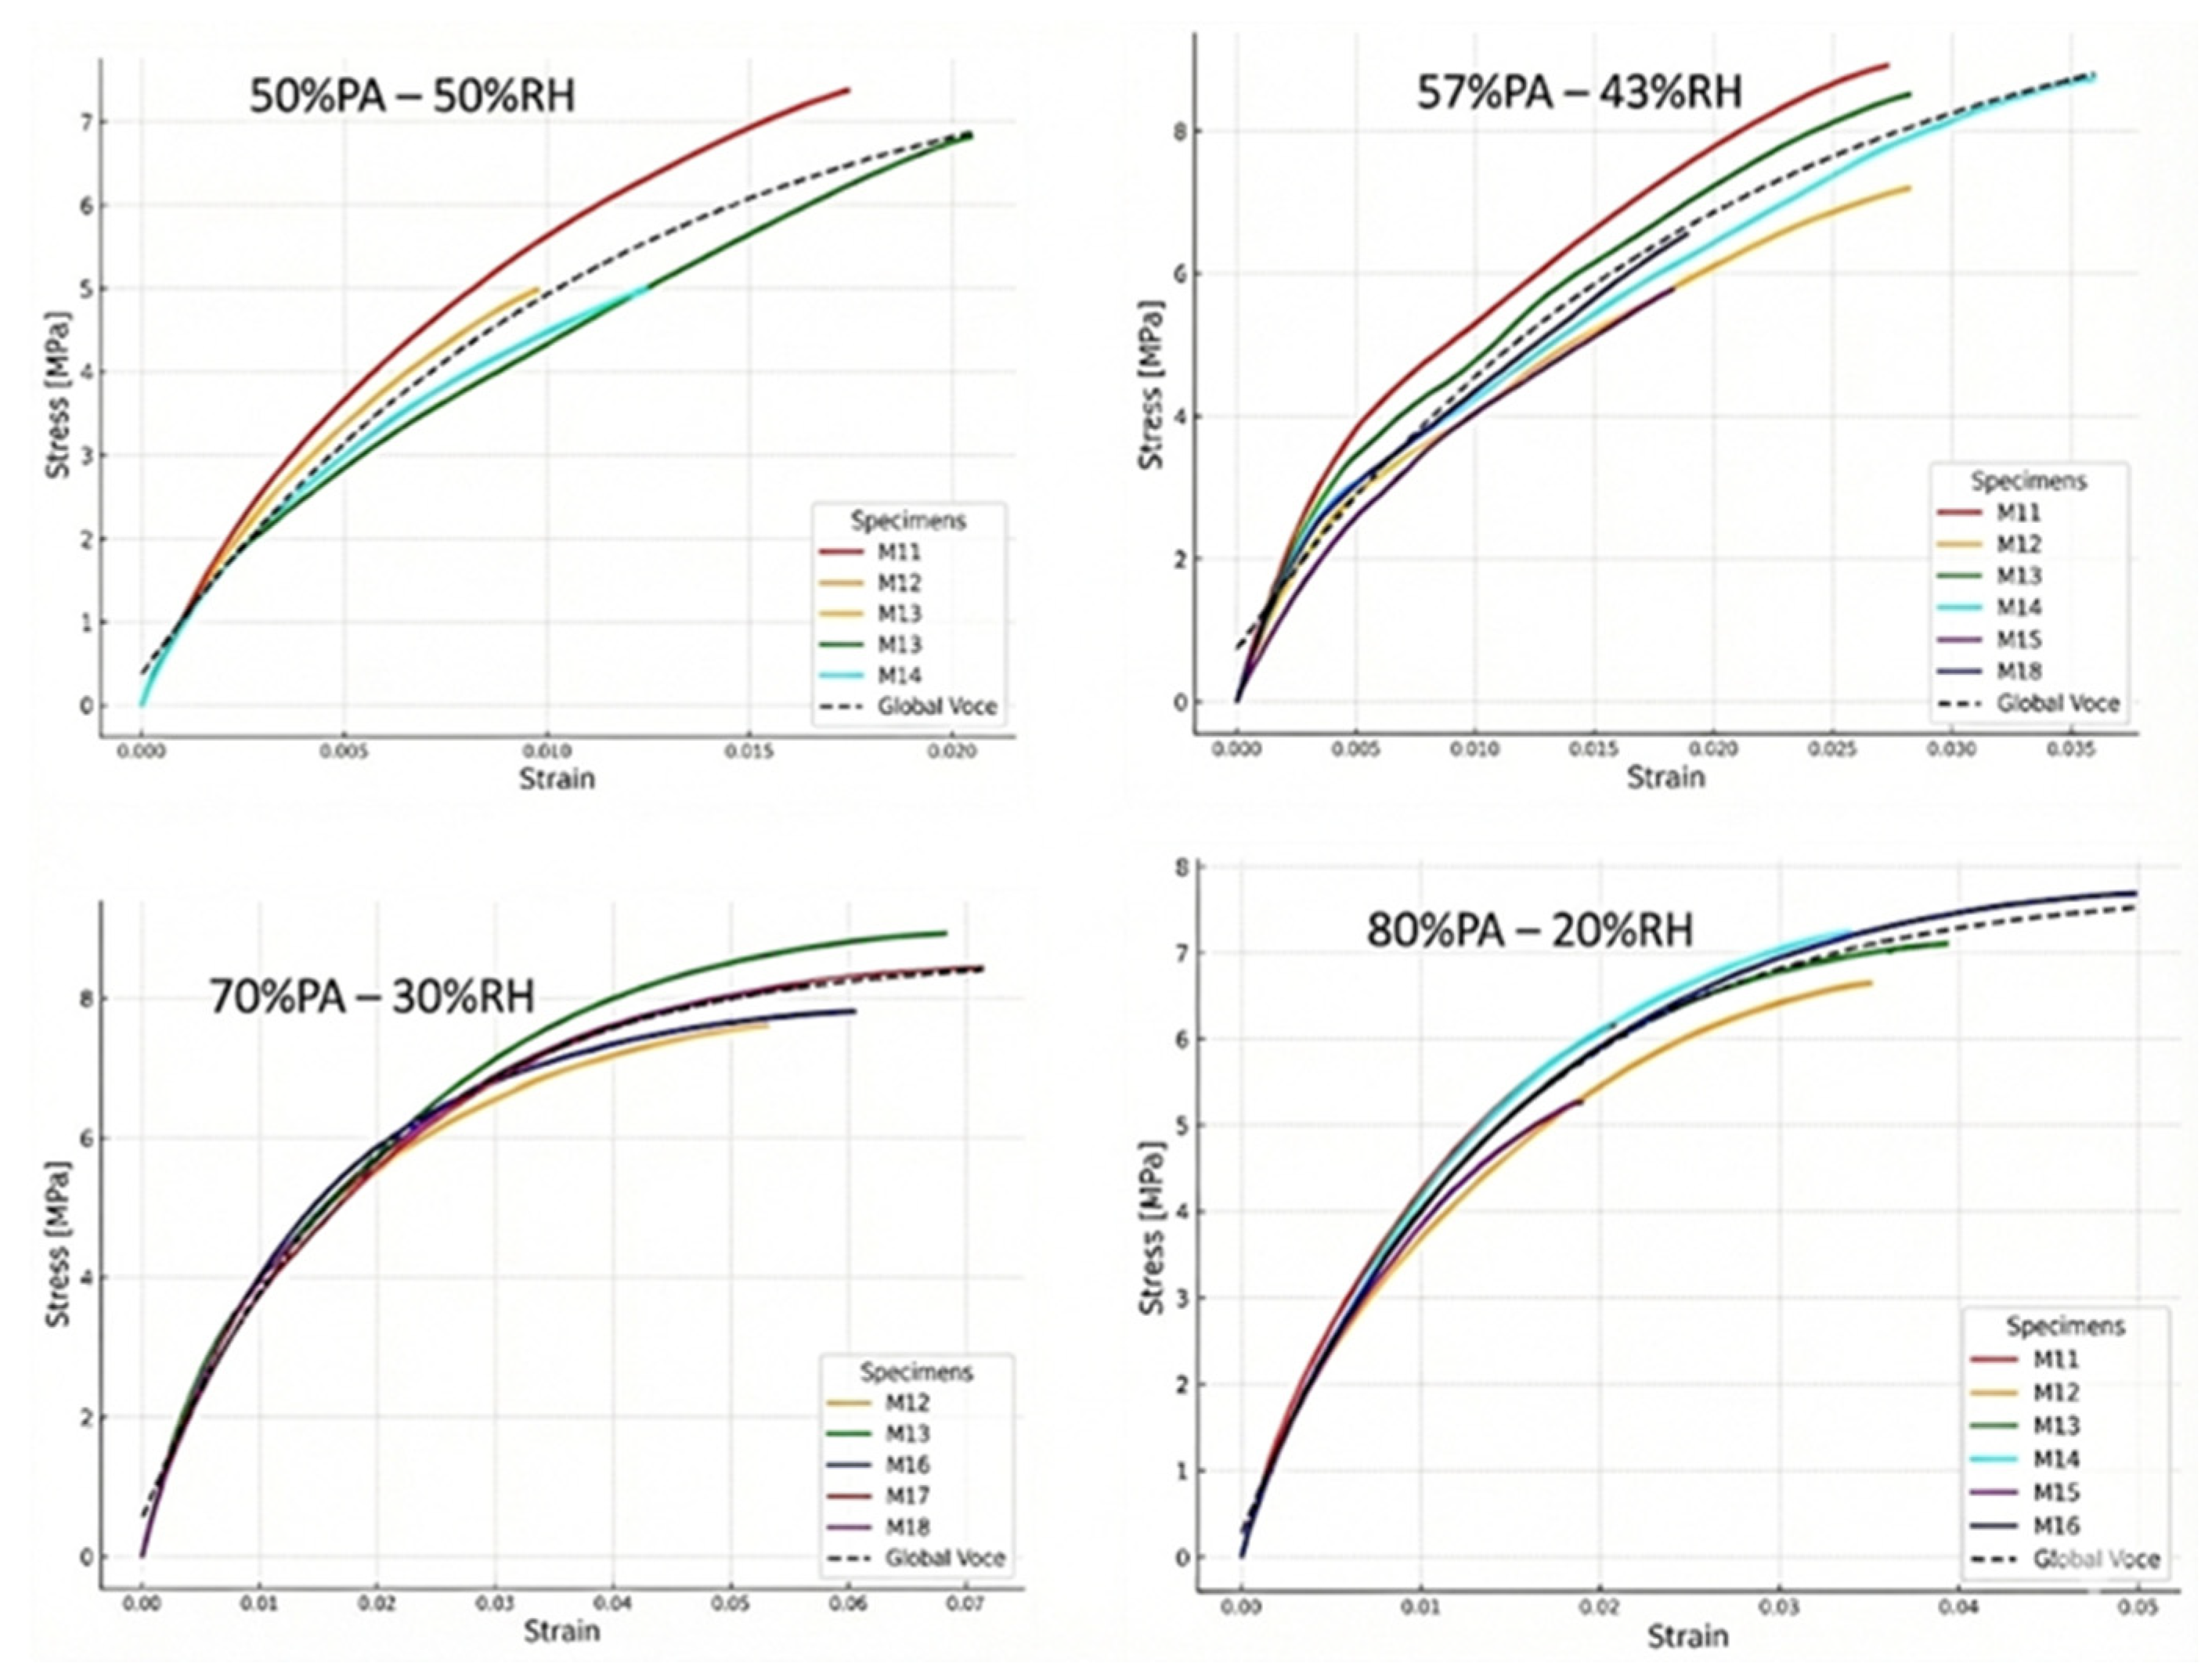
Figure 3.
Global Voce tensile stress-strain curves for the four PA-RH formulations.
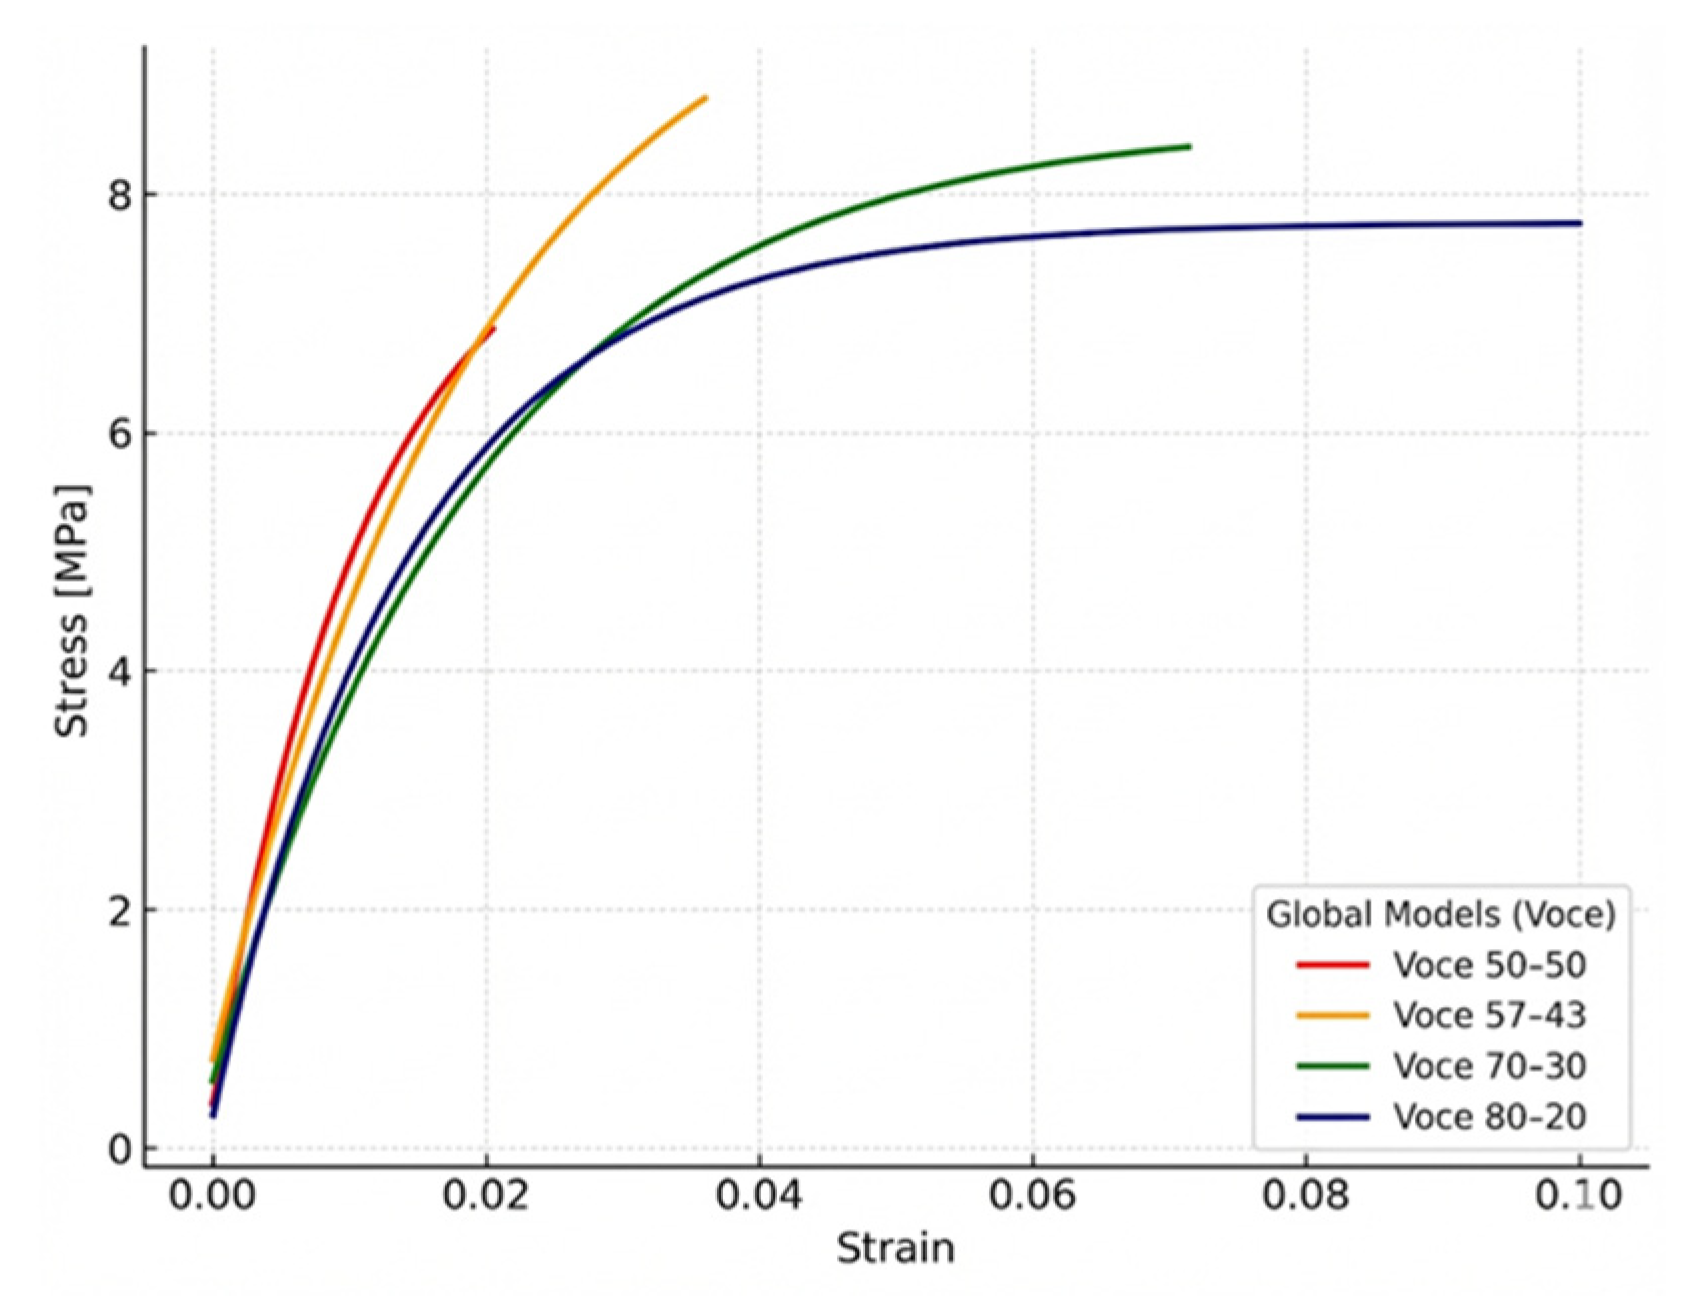
Figure 4.
Comparison between experimental flexural stress-strain curves and global Hollomon fits for the four PA-RH formulations.
Figure 4.
Comparison between experimental flexural stress-strain curves and global Hollomon fits for the four PA-RH formulations.
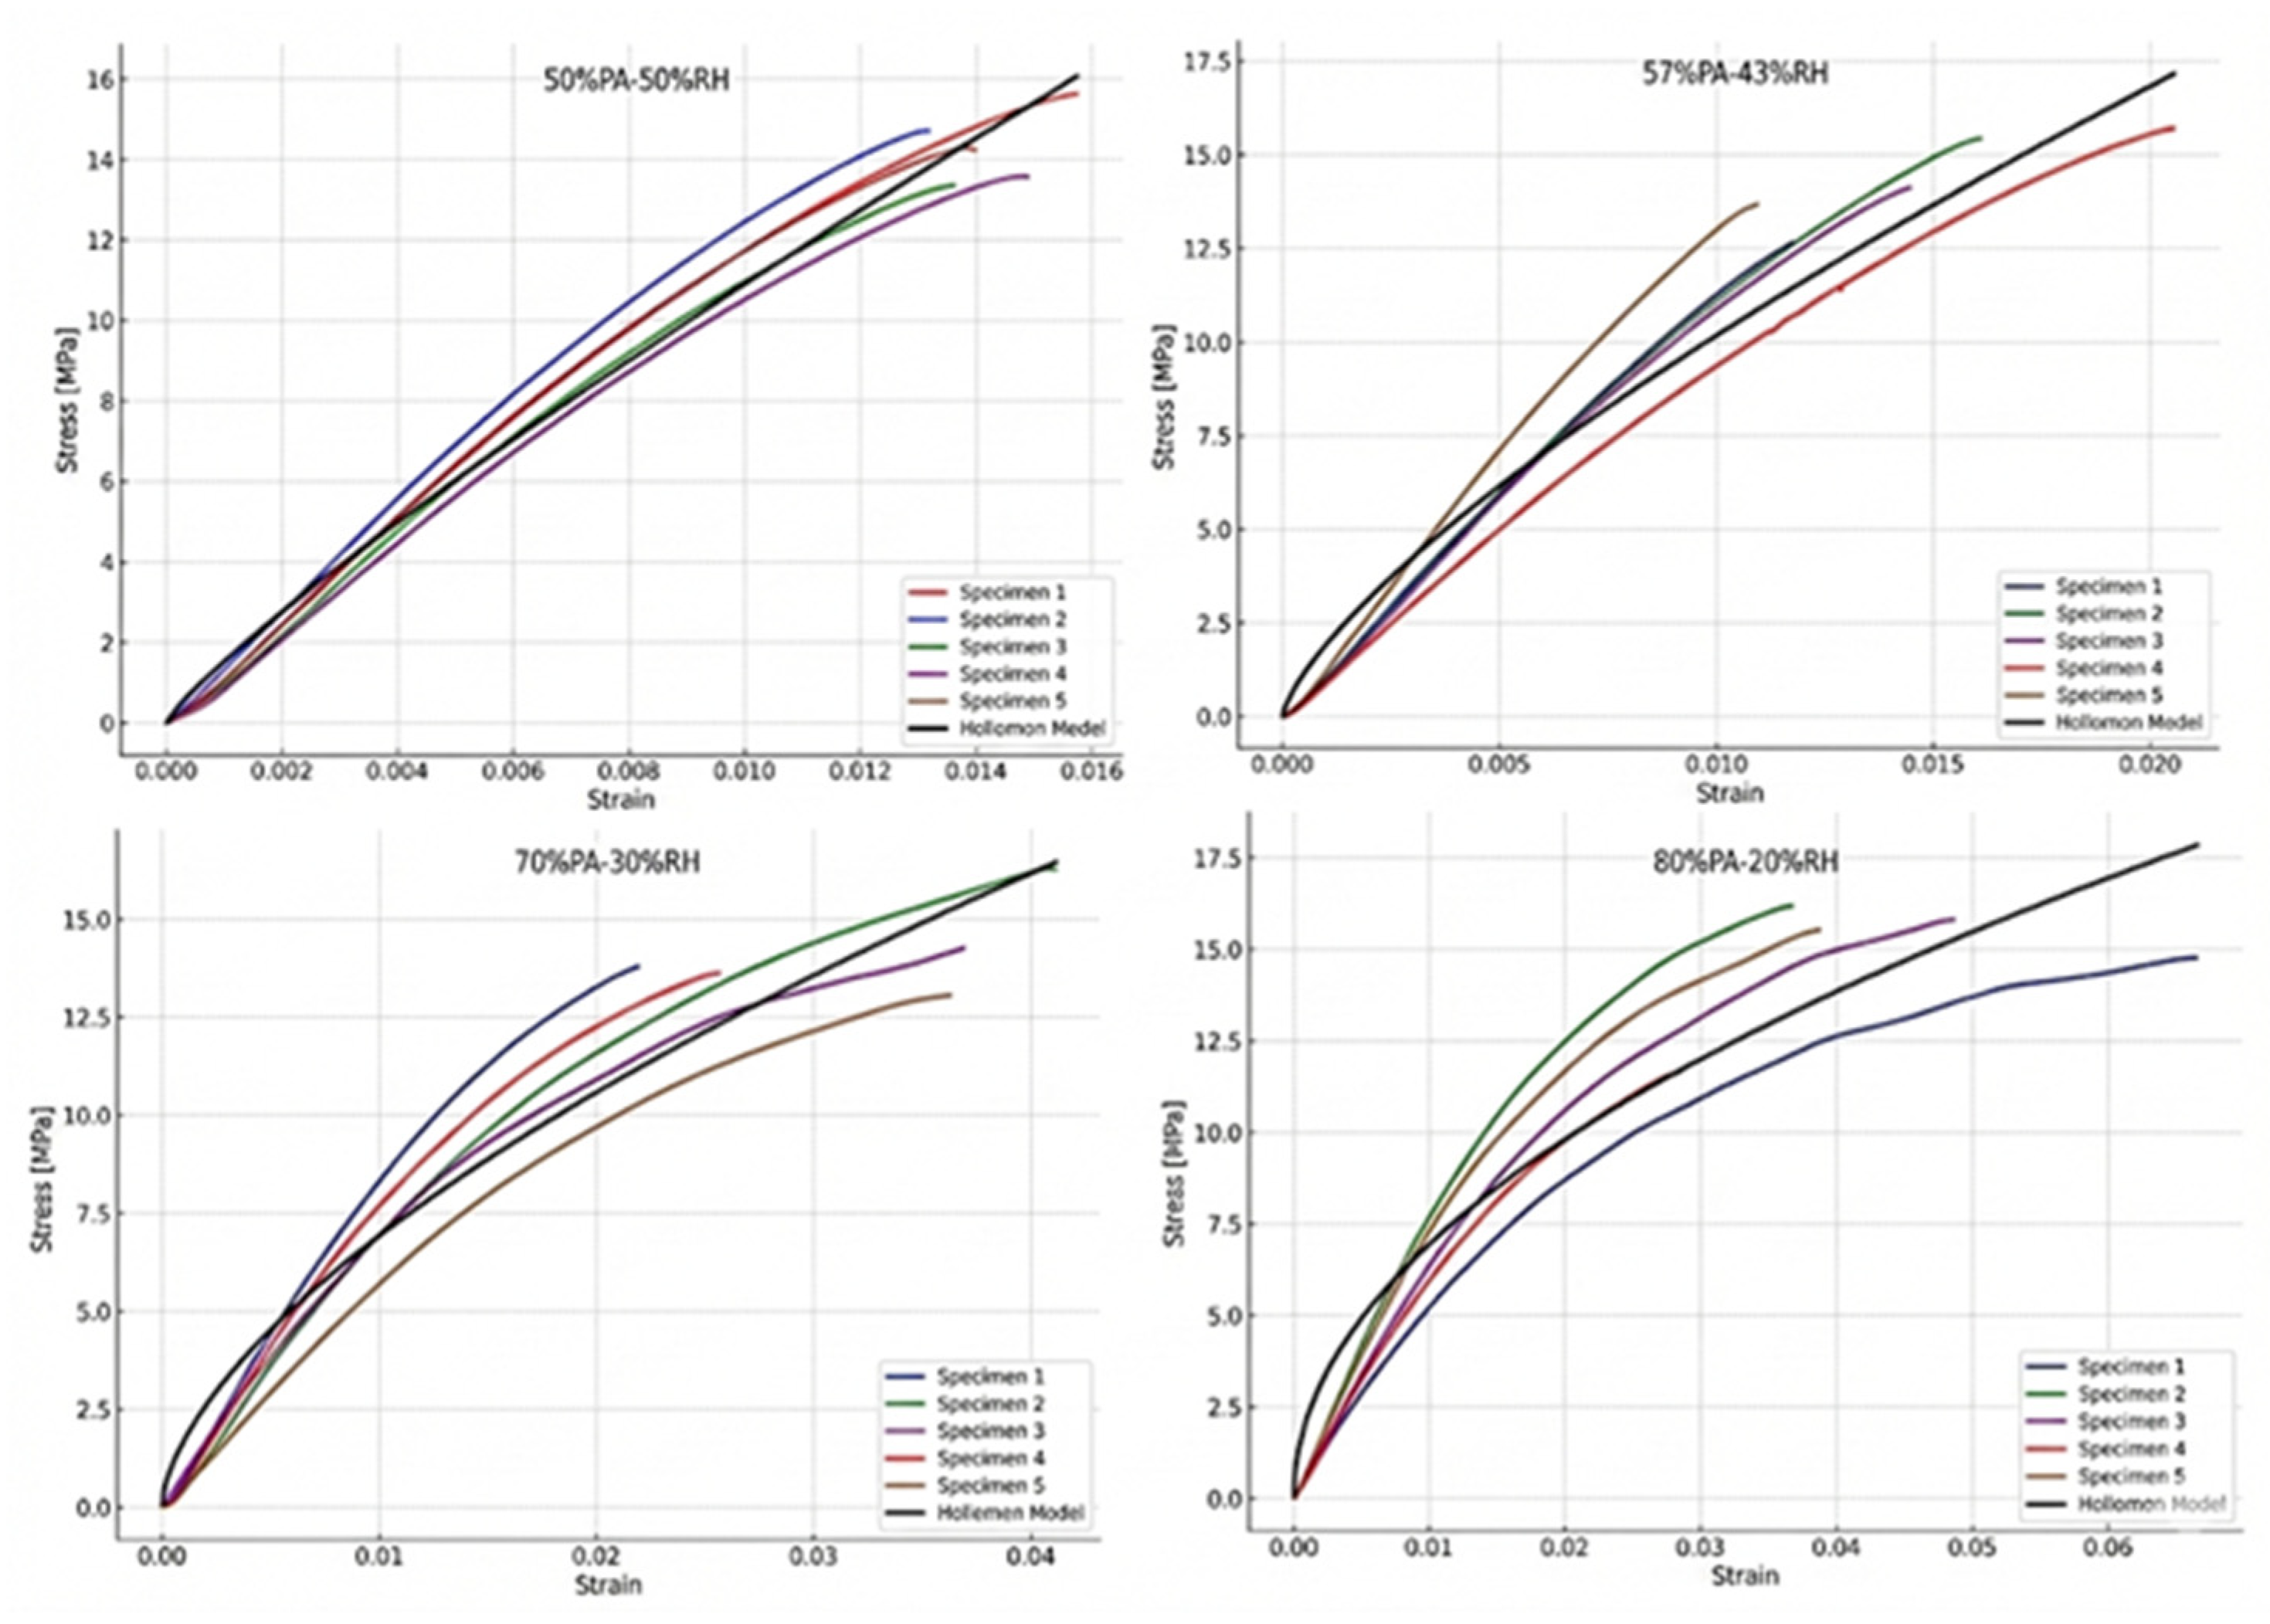
Figure 5.
Experimental flexural stress-strain curves and corresponding Voce fits for the four PA-RH formulations.
Figure 5.
Experimental flexural stress-strain curves and corresponding Voce fits for the four PA-RH formulations.
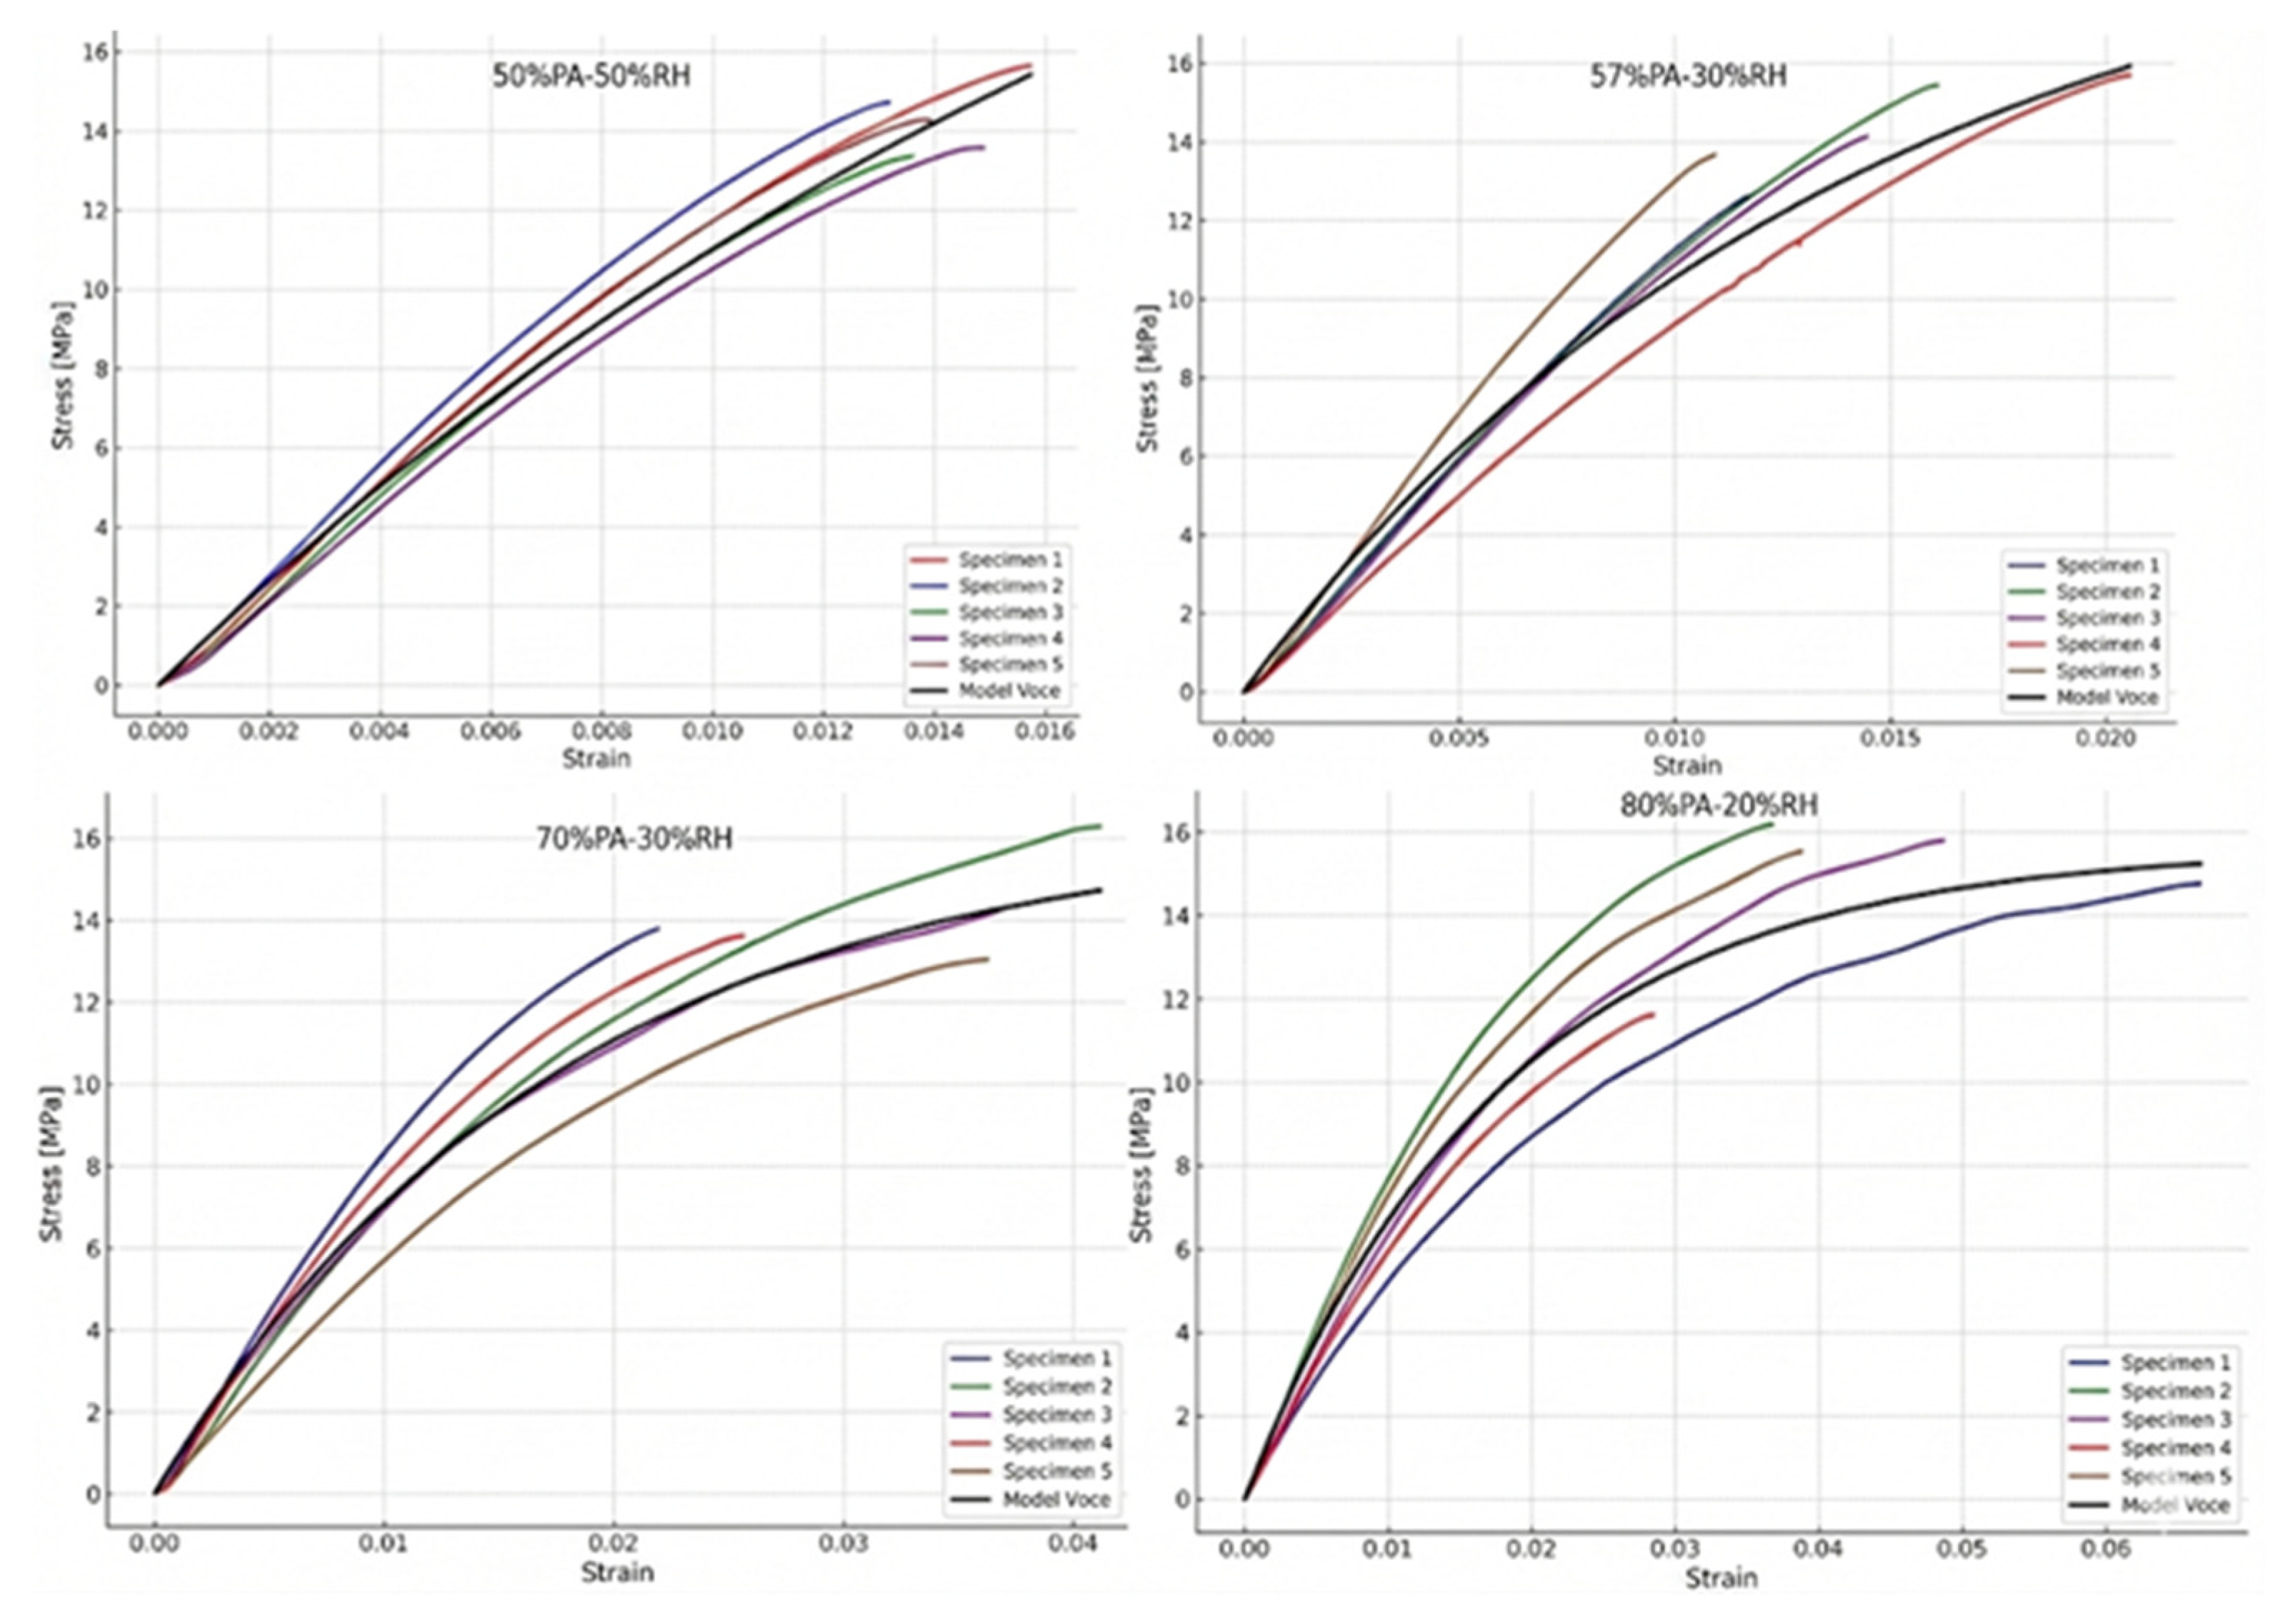
Figure 6.
Global Voce flexural stress-strain curves for the four formulations, obtained from the fitted parameters.
Figure 6.
Global Voce flexural stress-strain curves for the four formulations, obtained from the fitted parameters.
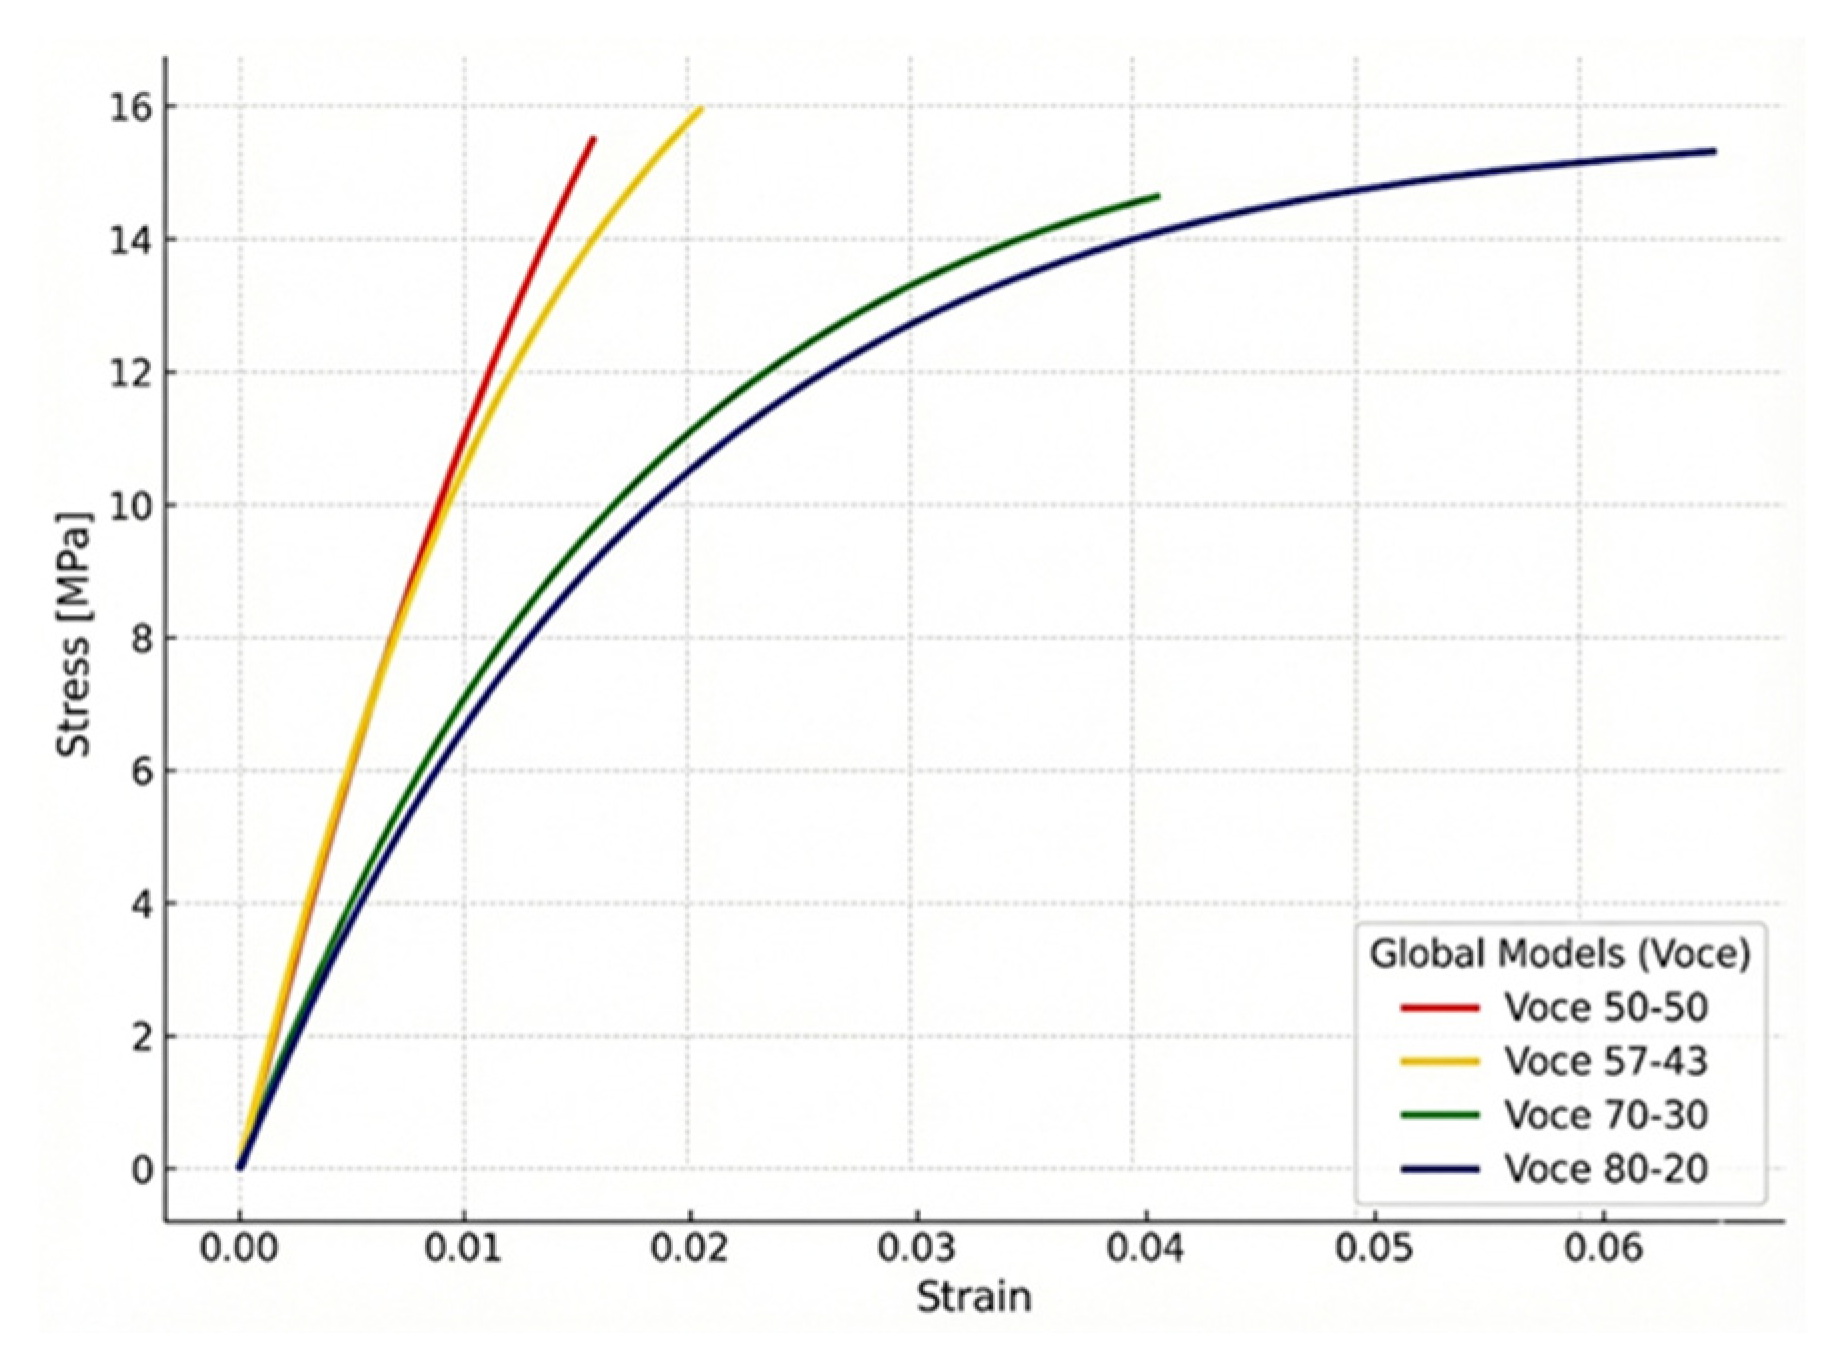
Figure 7.
Box-and-whisker representation of Shore D hardness by formulation.
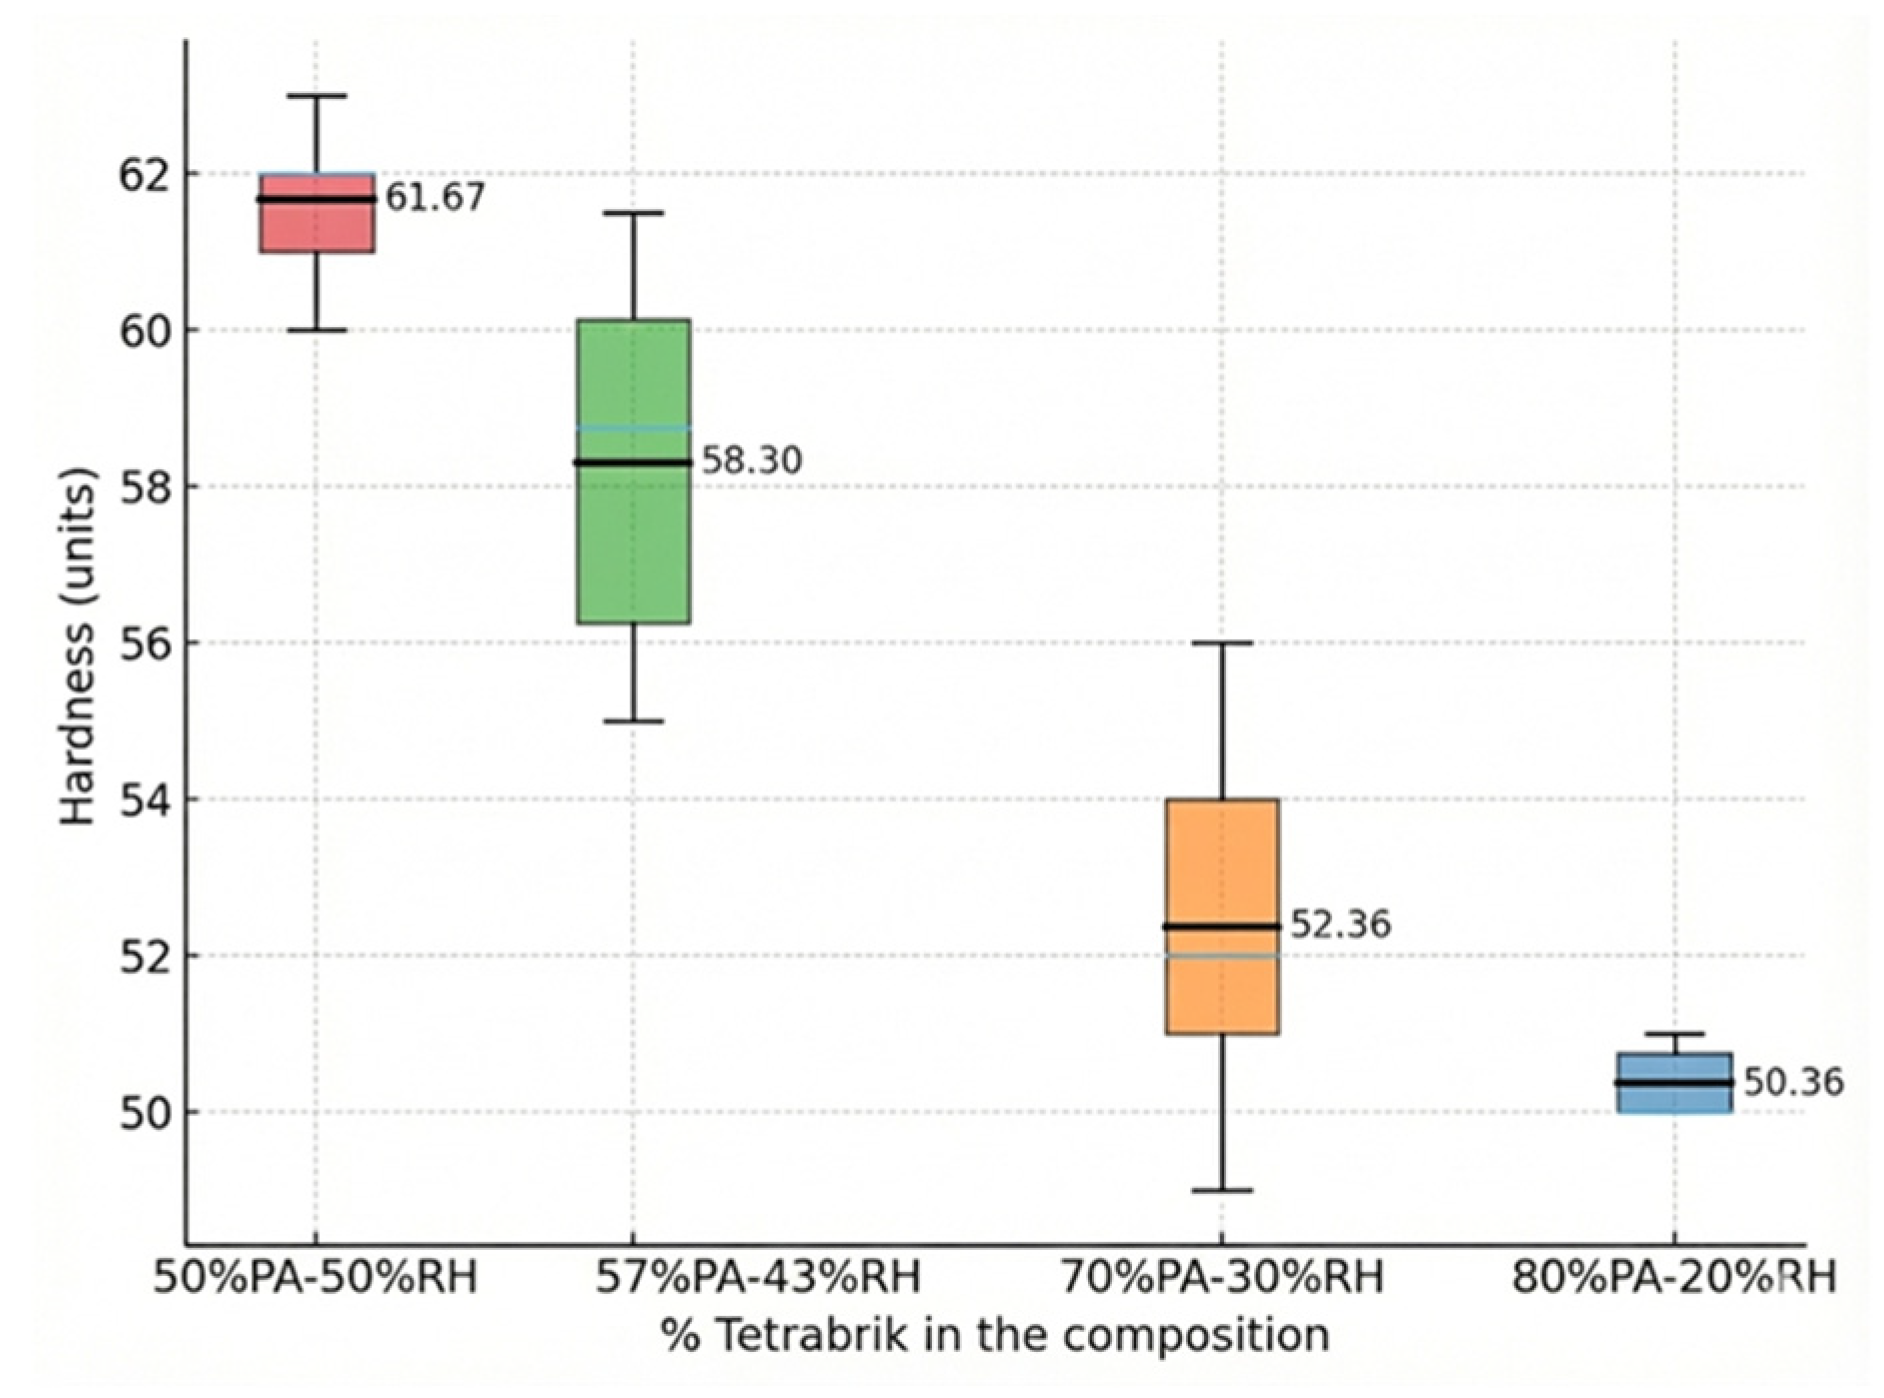
Figure 8.
Relationship between Shore D hardness and Tetrabrik (PA) content in the composites, with linear regression fit.
Figure 8.
Relationship between Shore D hardness and Tetrabrik (PA) content in the composites, with linear regression fit.
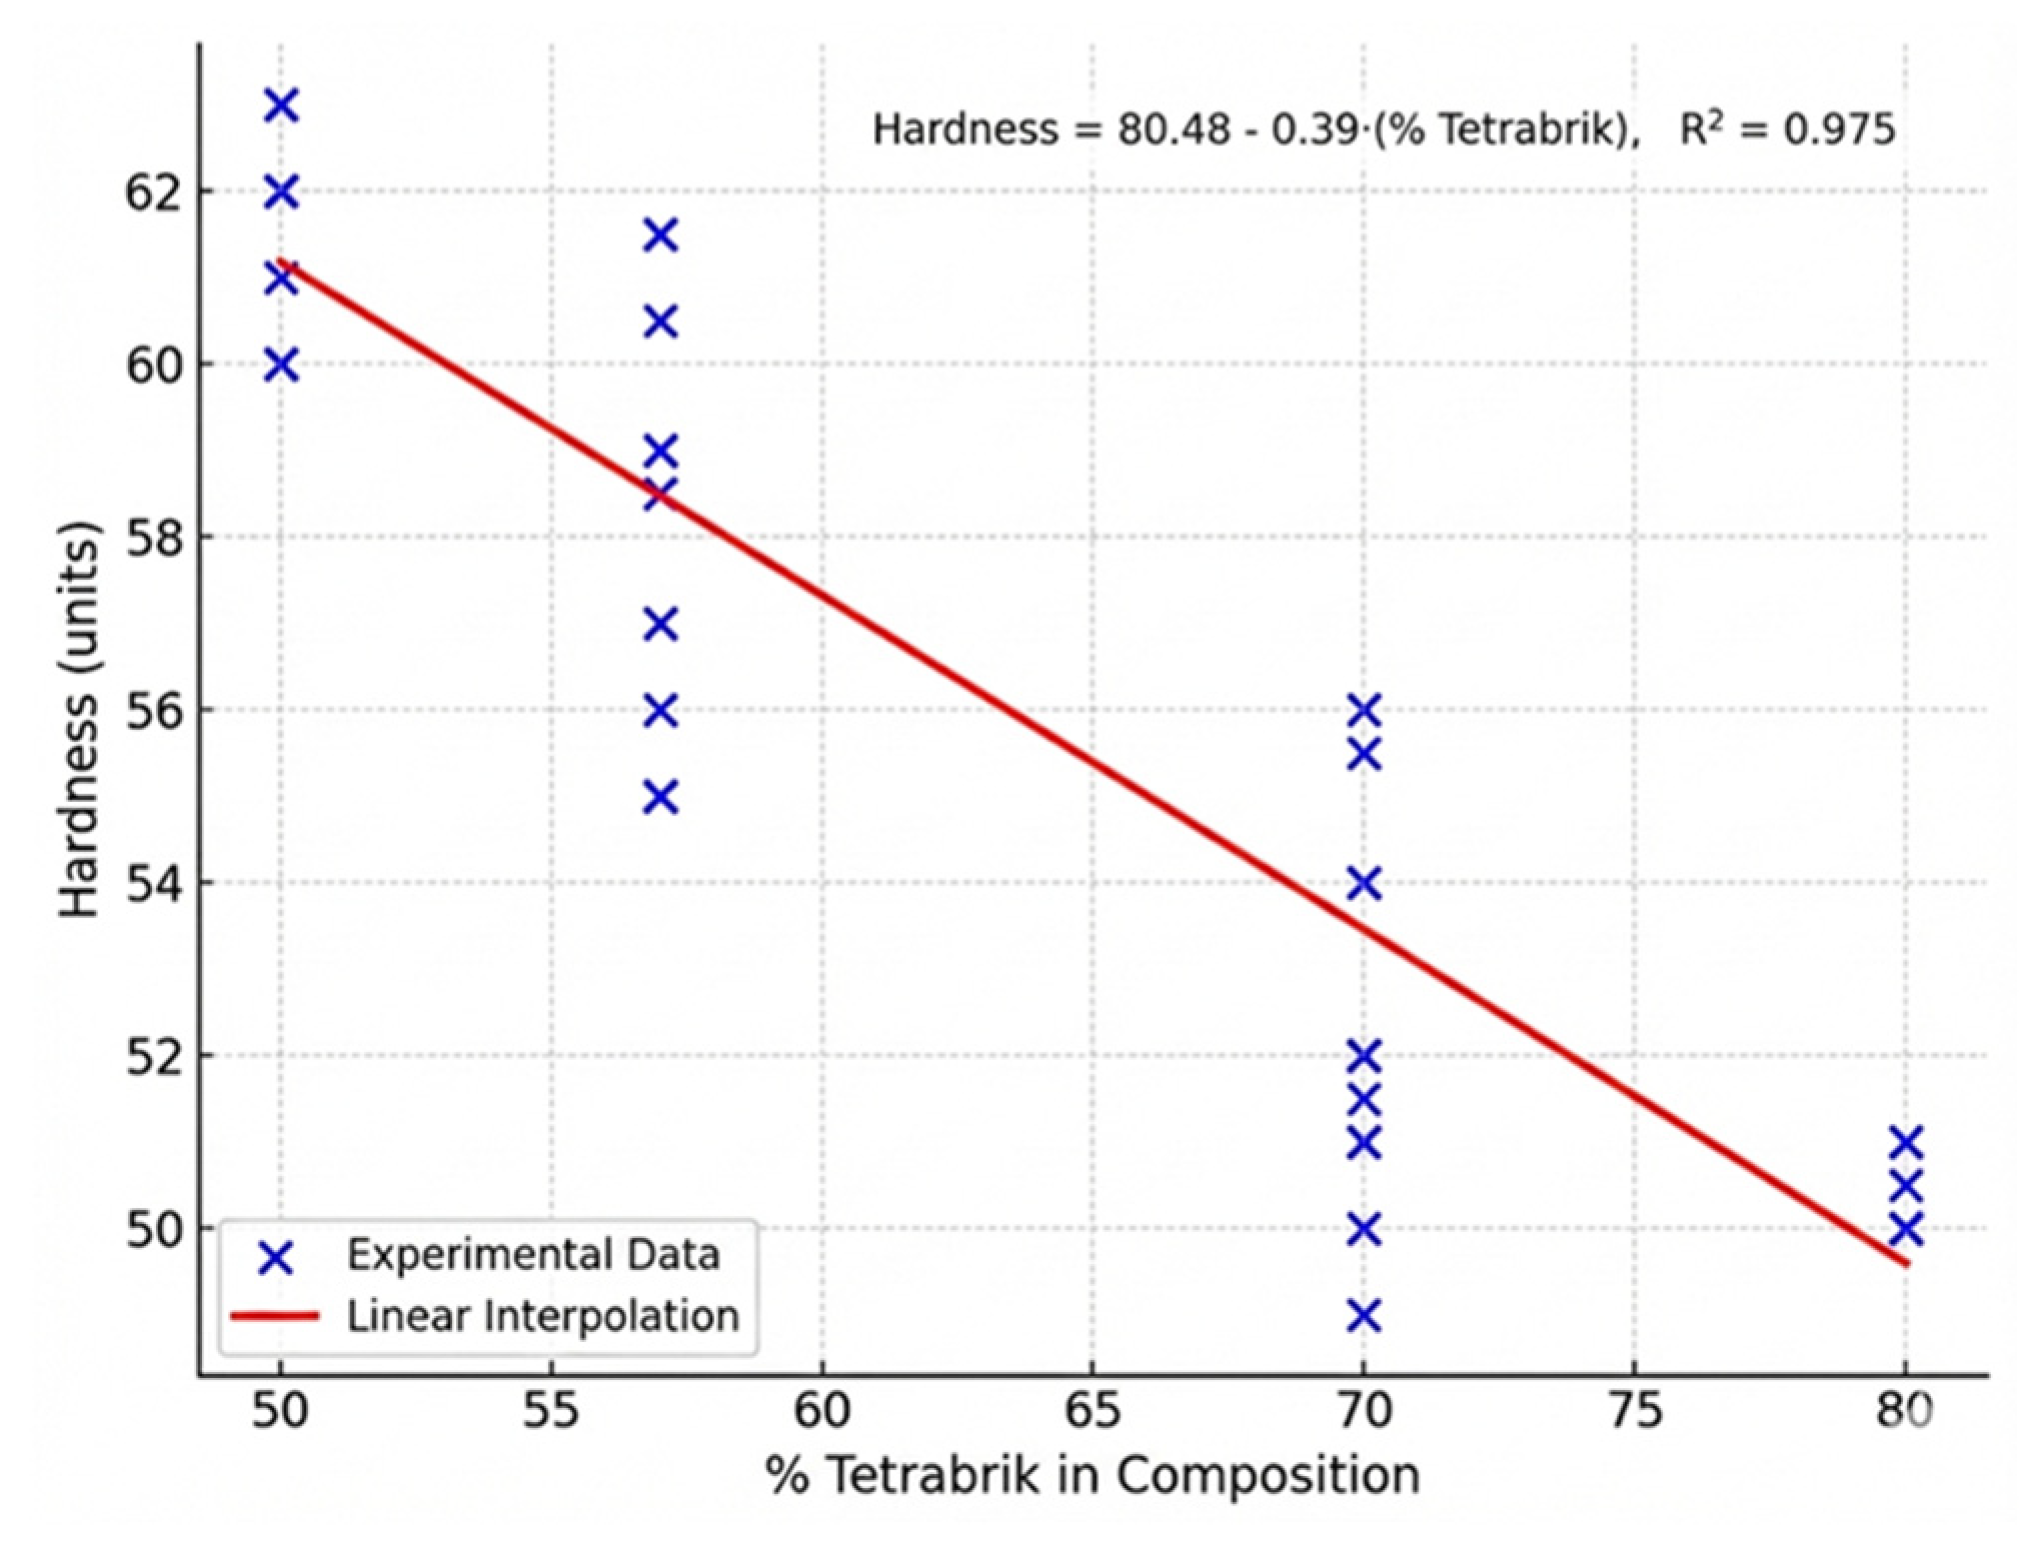
Figure 9.
Apparent density as function of PA content, with linear regression fit (R2 = 0.993).
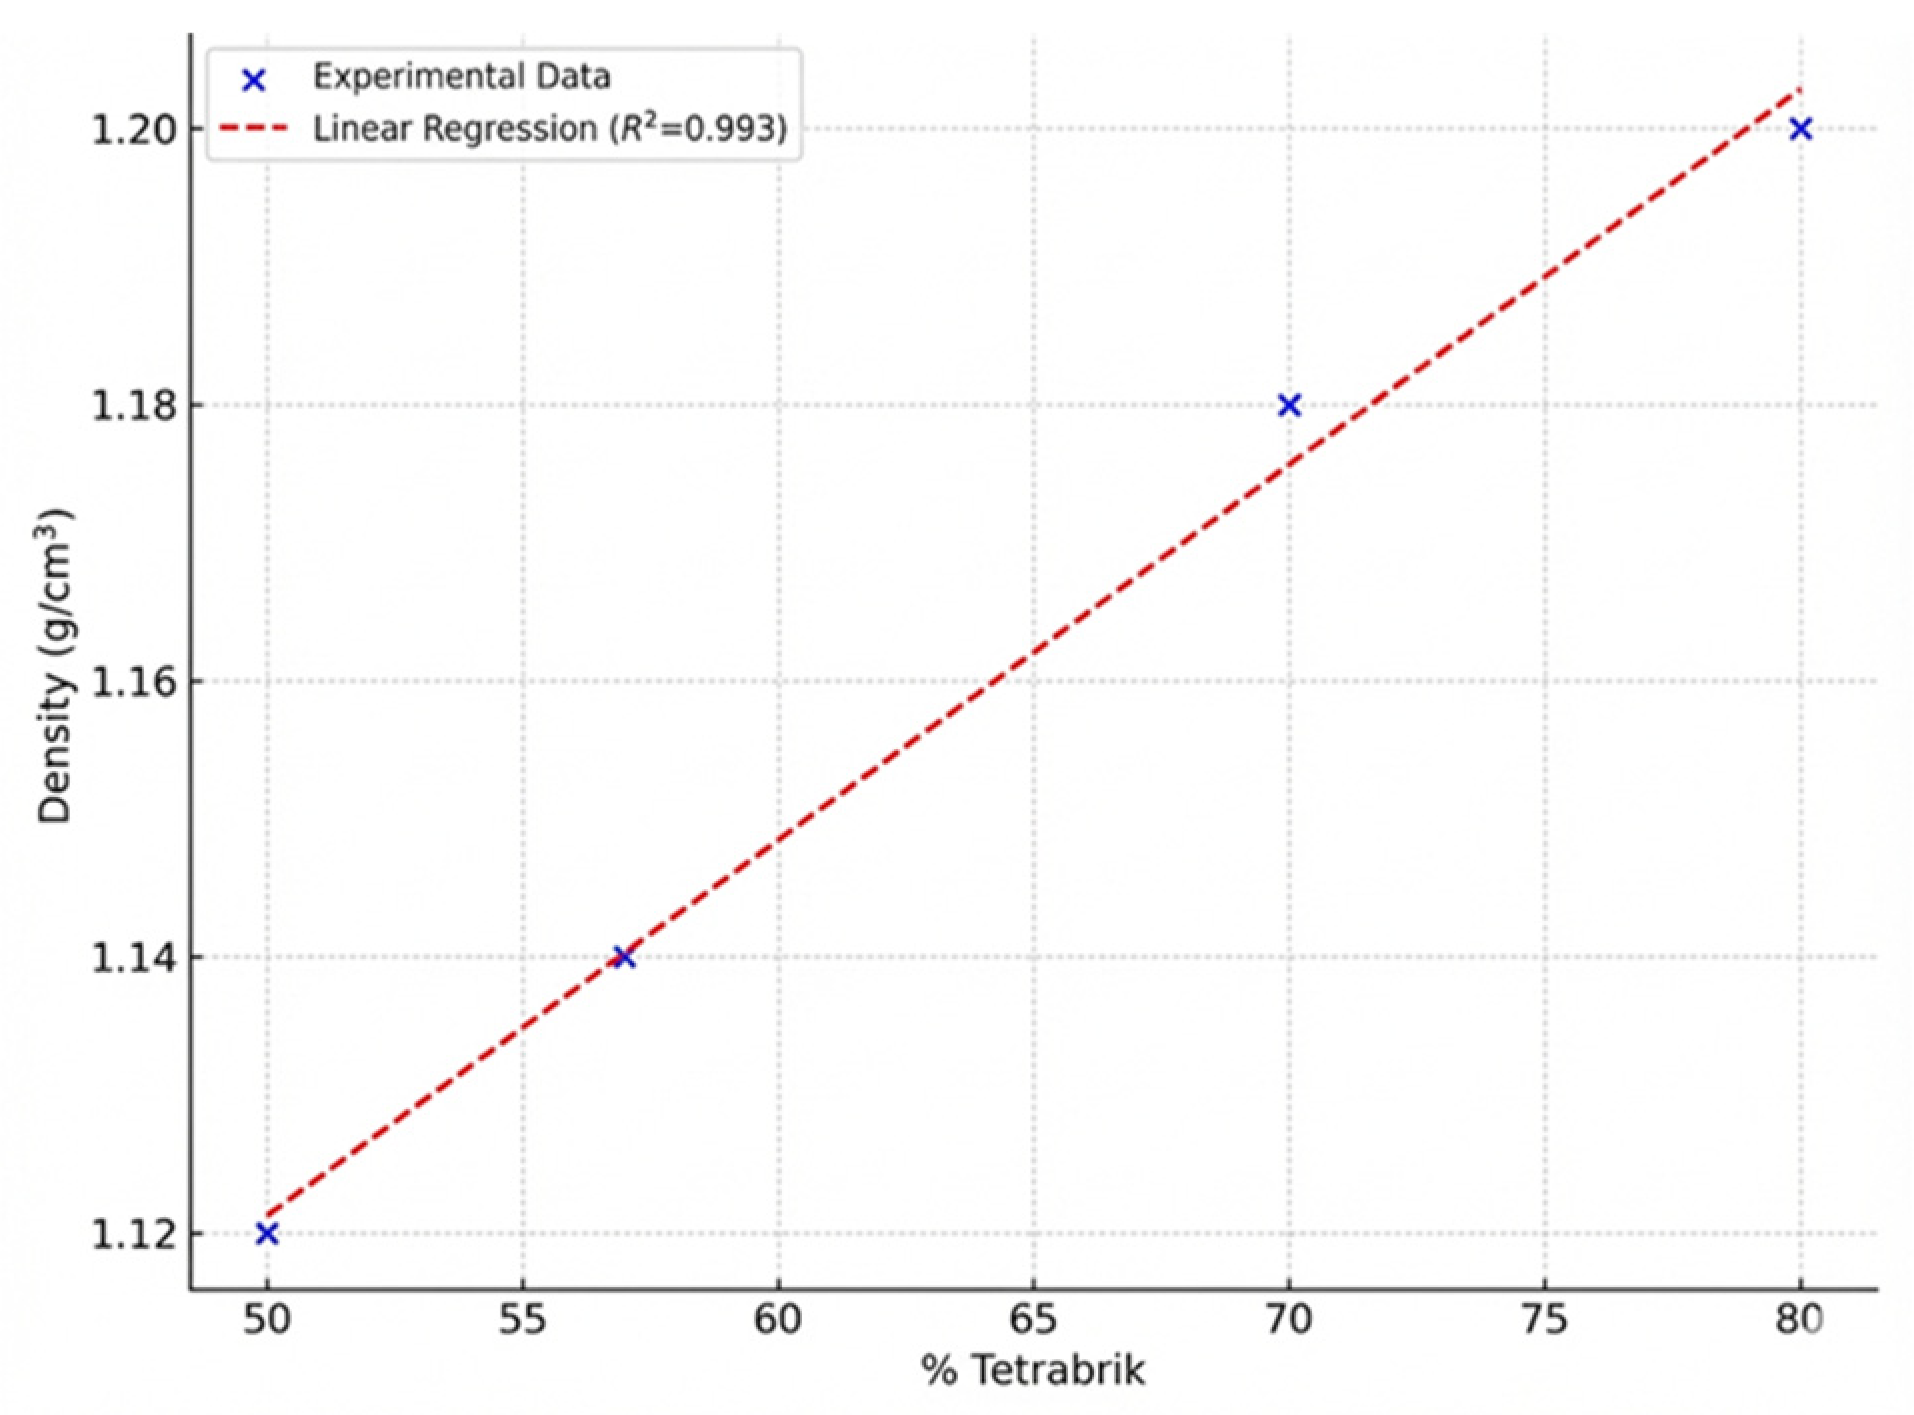
Figure 10.
Normalised surface water absorption as a function of the square root of immersion time.
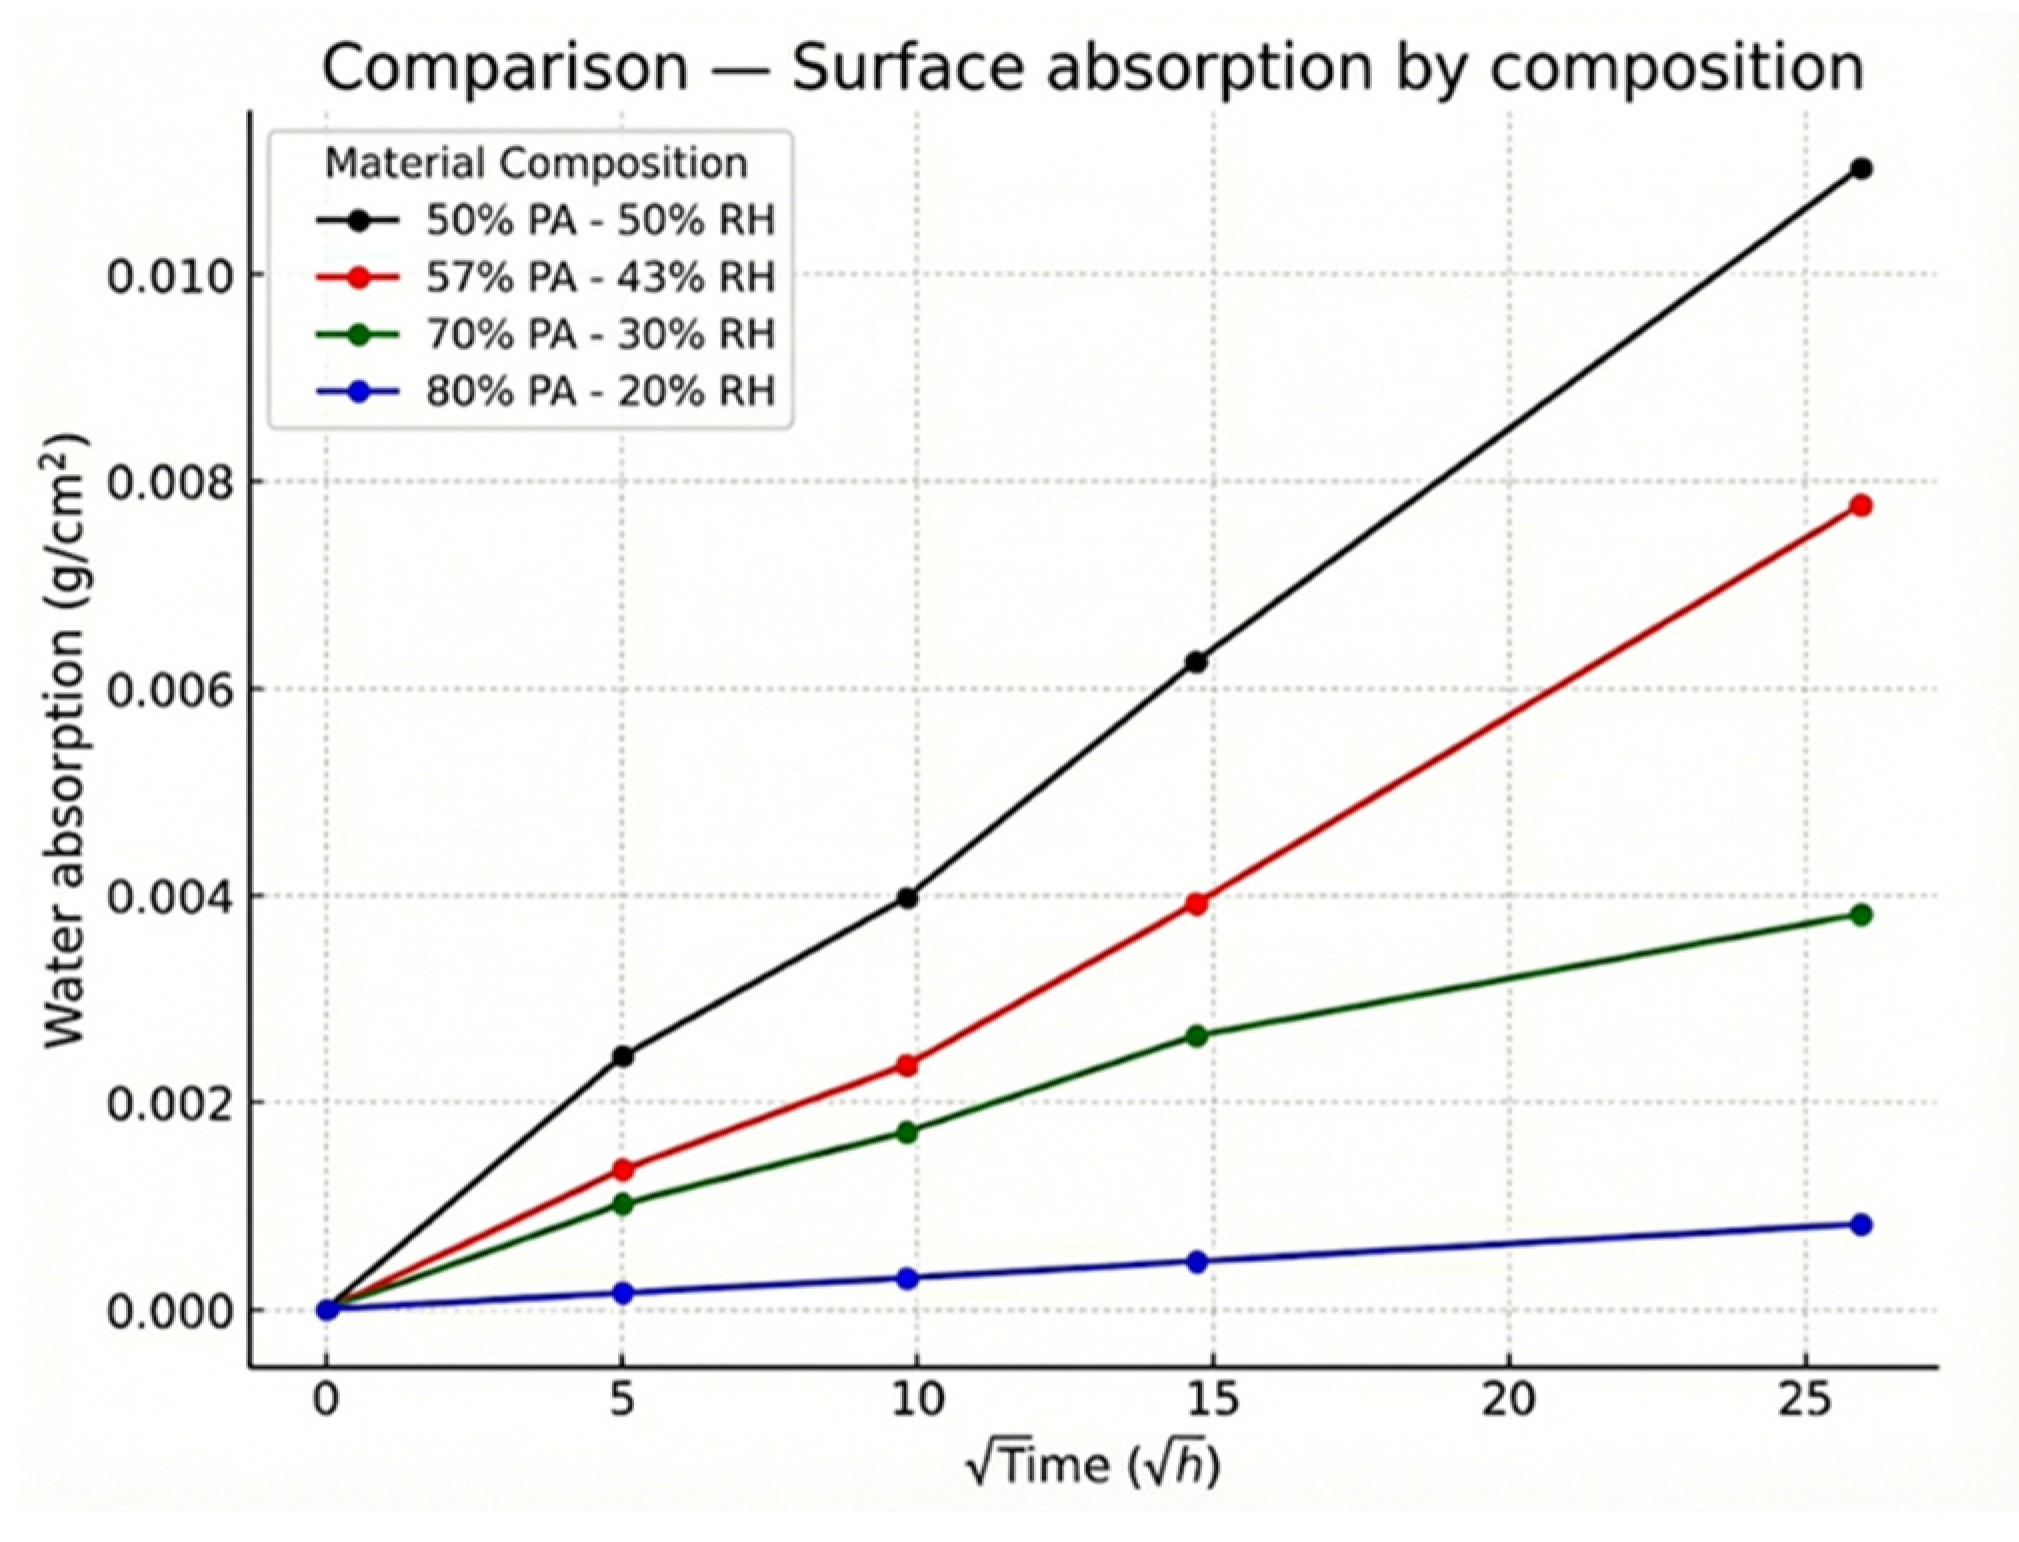
Figure 11.
Representative optical micrographs of the 80PA–20RH composite: (a) overview of the microstructure at 100×; (b) detail of PolyAl-rich domains and surrounding matrix at 200×; (c) close-up of PolyAl clusters and neighbouring regions at 400×.
Figure 11.
Representative optical micrographs of the 80PA–20RH composite: (a) overview of the microstructure at 100×; (b) detail of PolyAl-rich domains and surrounding matrix at 200×; (c) close-up of PolyAl clusters and neighbouring regions at 400×.
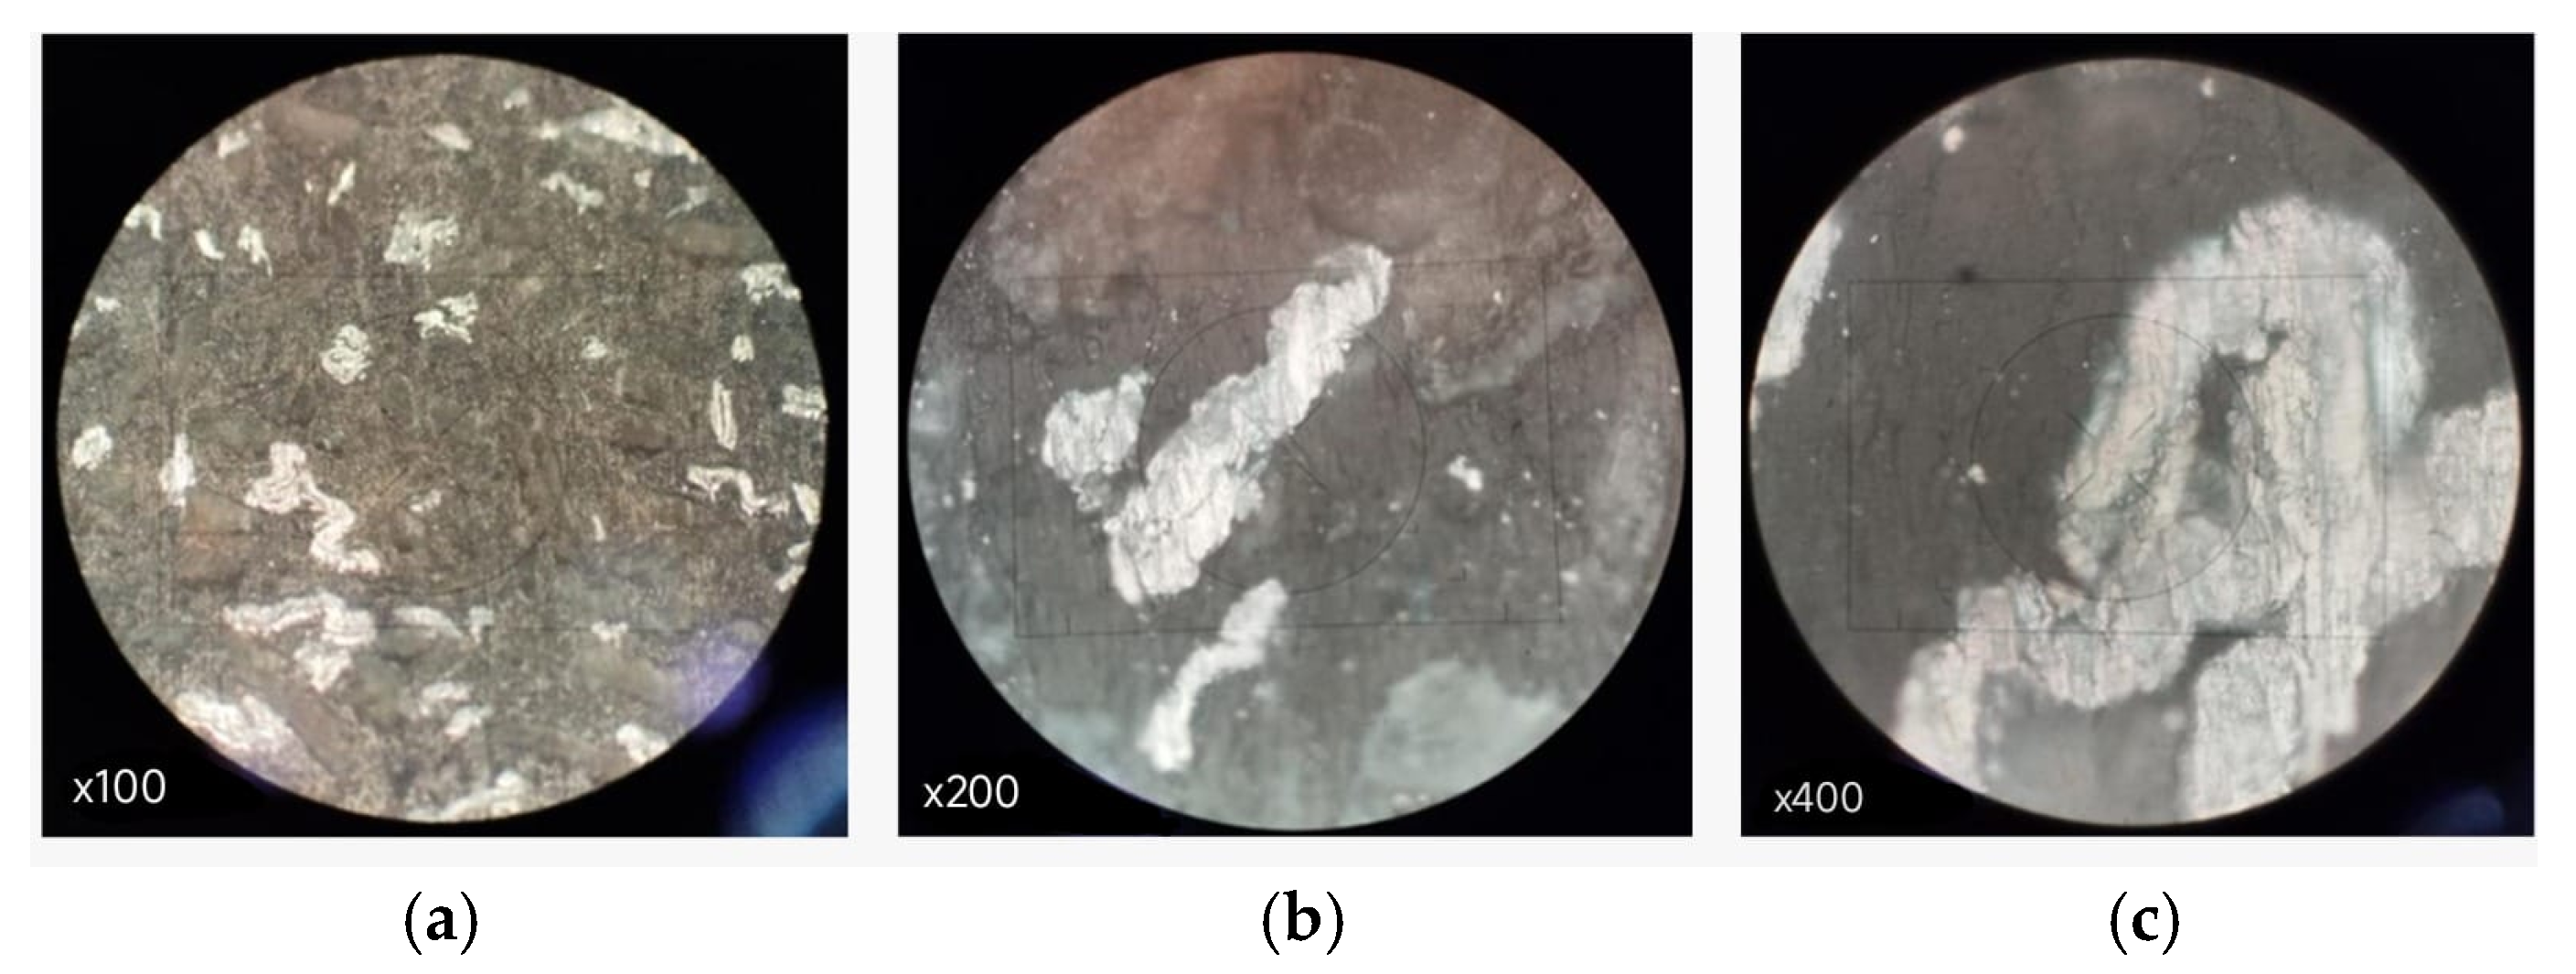
Figure 12.
Representative optical micrographs of the 70PA–30RH composite: (a) overview of the microstructure at 100×; (b) detail of PolyAl-rich domains and surrounding matrix at 200×; (c) close-up of PolyAl clusters and neighbouring regions at 400×.
Figure 12.
Representative optical micrographs of the 70PA–30RH composite: (a) overview of the microstructure at 100×; (b) detail of PolyAl-rich domains and surrounding matrix at 200×; (c) close-up of PolyAl clusters and neighbouring regions at 400×.
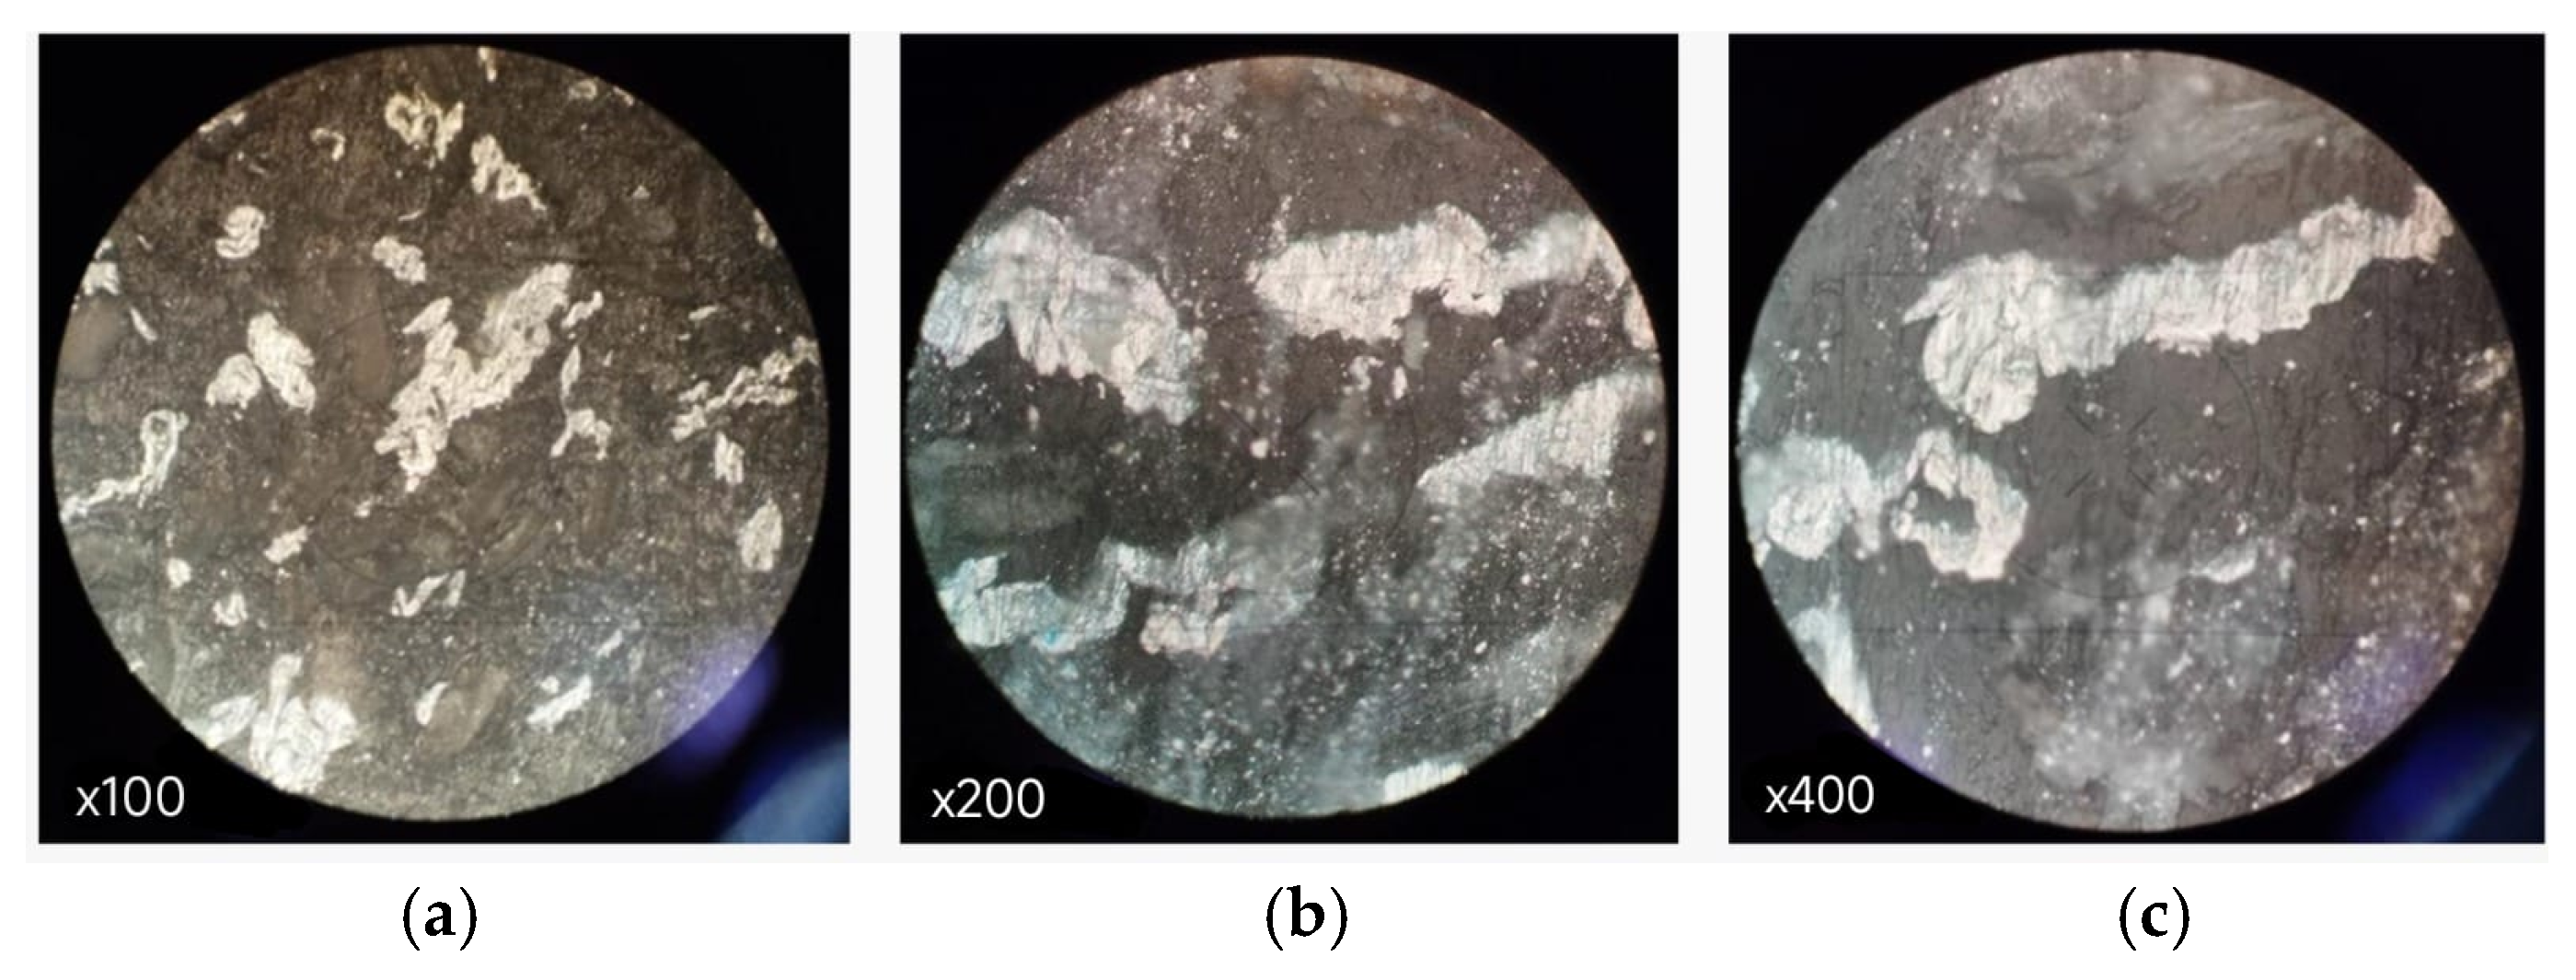
Figure 13.
Representative optical micrographs of the 57PA–43RH composite: (a) overview of the microstructure at 100×; (b) detail of PolyAl-rich domains and surrounding matrix at 200×; (c) close-up of PolyAl clusters and neighbouring regions at 400×.
Figure 13.
Representative optical micrographs of the 57PA–43RH composite: (a) overview of the microstructure at 100×; (b) detail of PolyAl-rich domains and surrounding matrix at 200×; (c) close-up of PolyAl clusters and neighbouring regions at 400×.
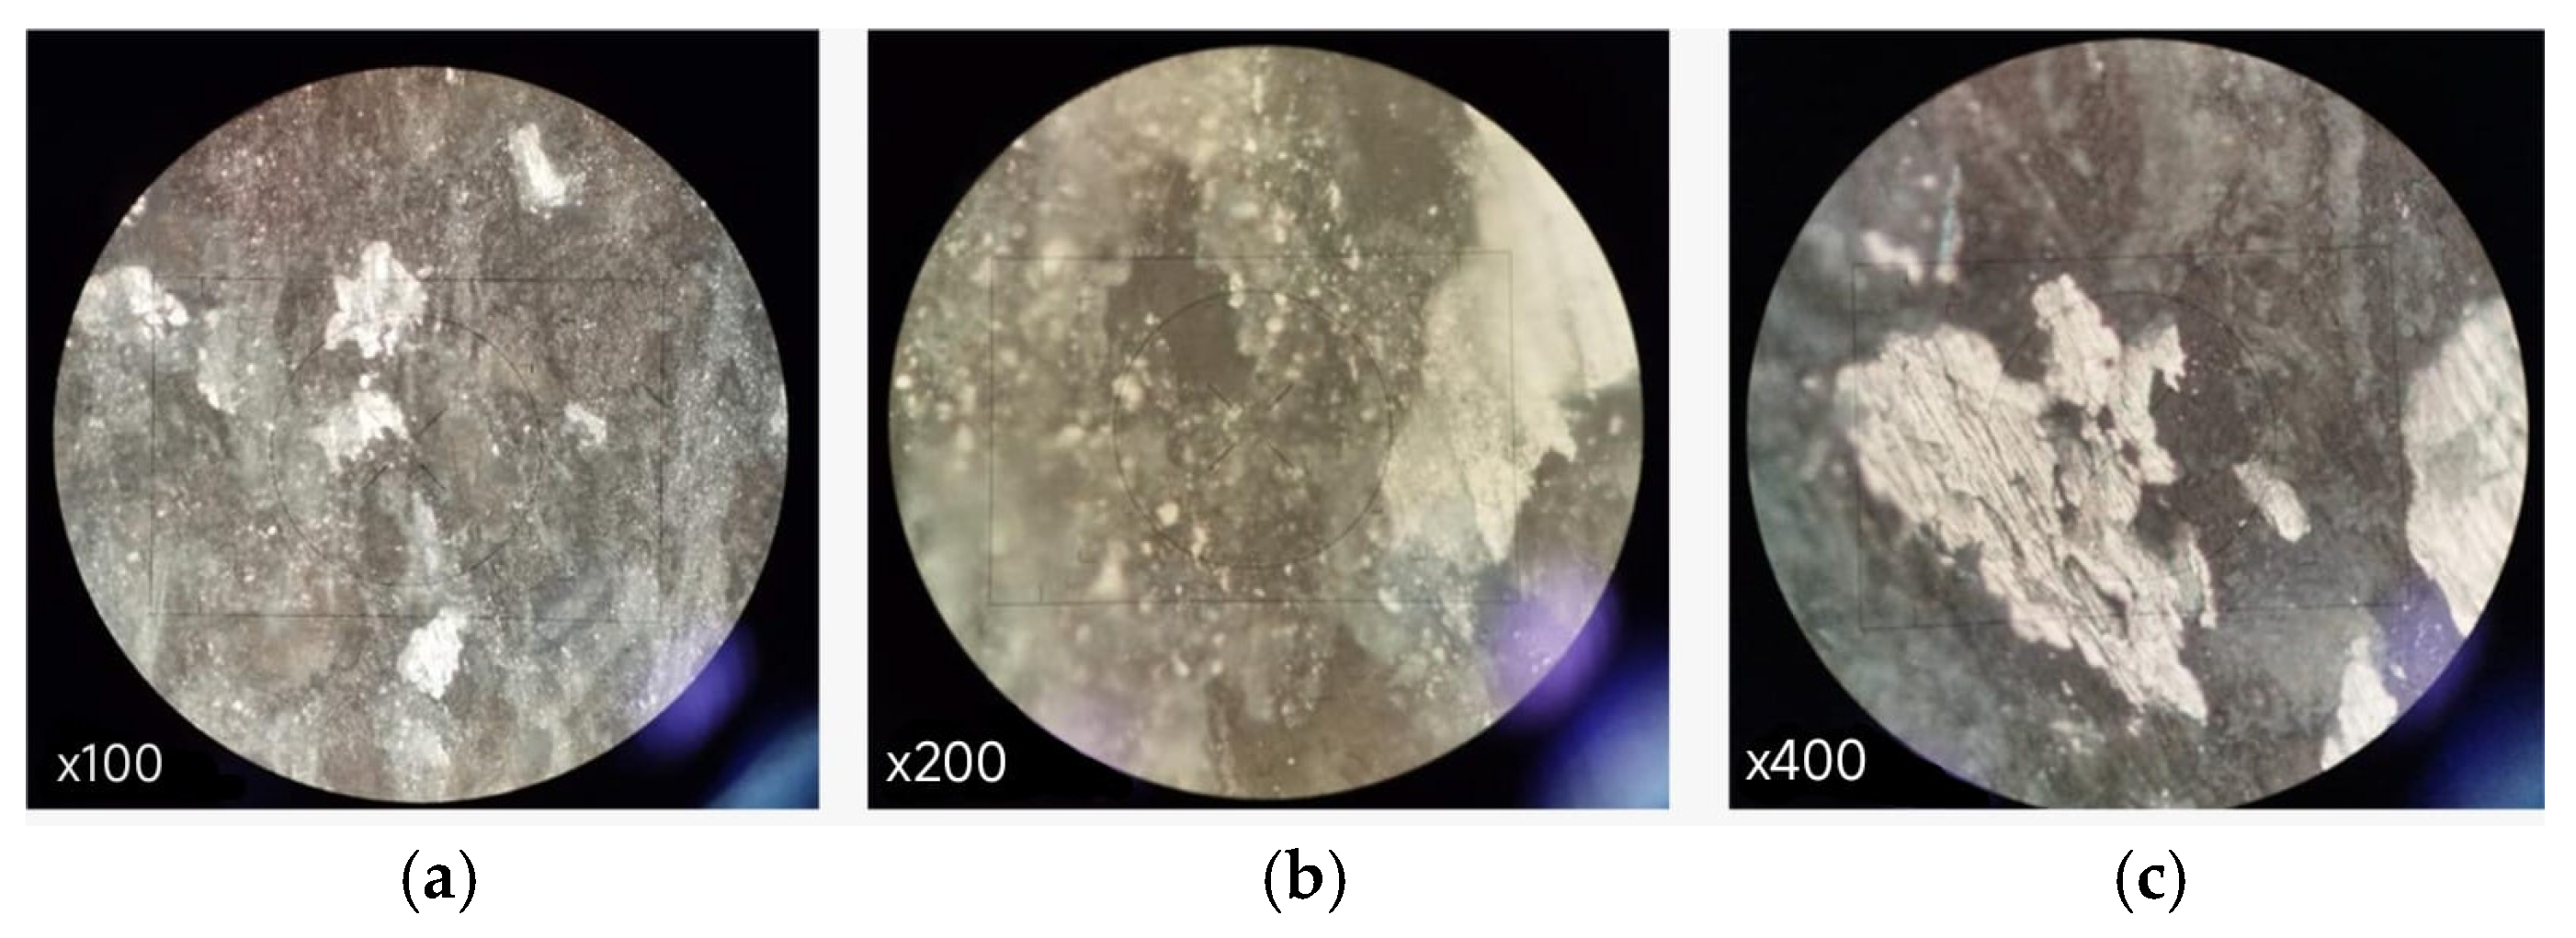
Figure 14.
Representative optical micrographs of the 50PA–50RH composite: (a) overview of the microstructure at 100×; (b) detail of PolyAl-rich domains and surrounding matrix at 200×; (c) close-up of PolyAl clusters and neighbouring regions at 400×.
Figure 14.
Representative optical micrographs of the 50PA–50RH composite: (a) overview of the microstructure at 100×; (b) detail of PolyAl-rich domains and surrounding matrix at 200×; (c) close-up of PolyAl clusters and neighbouring regions at 400×.
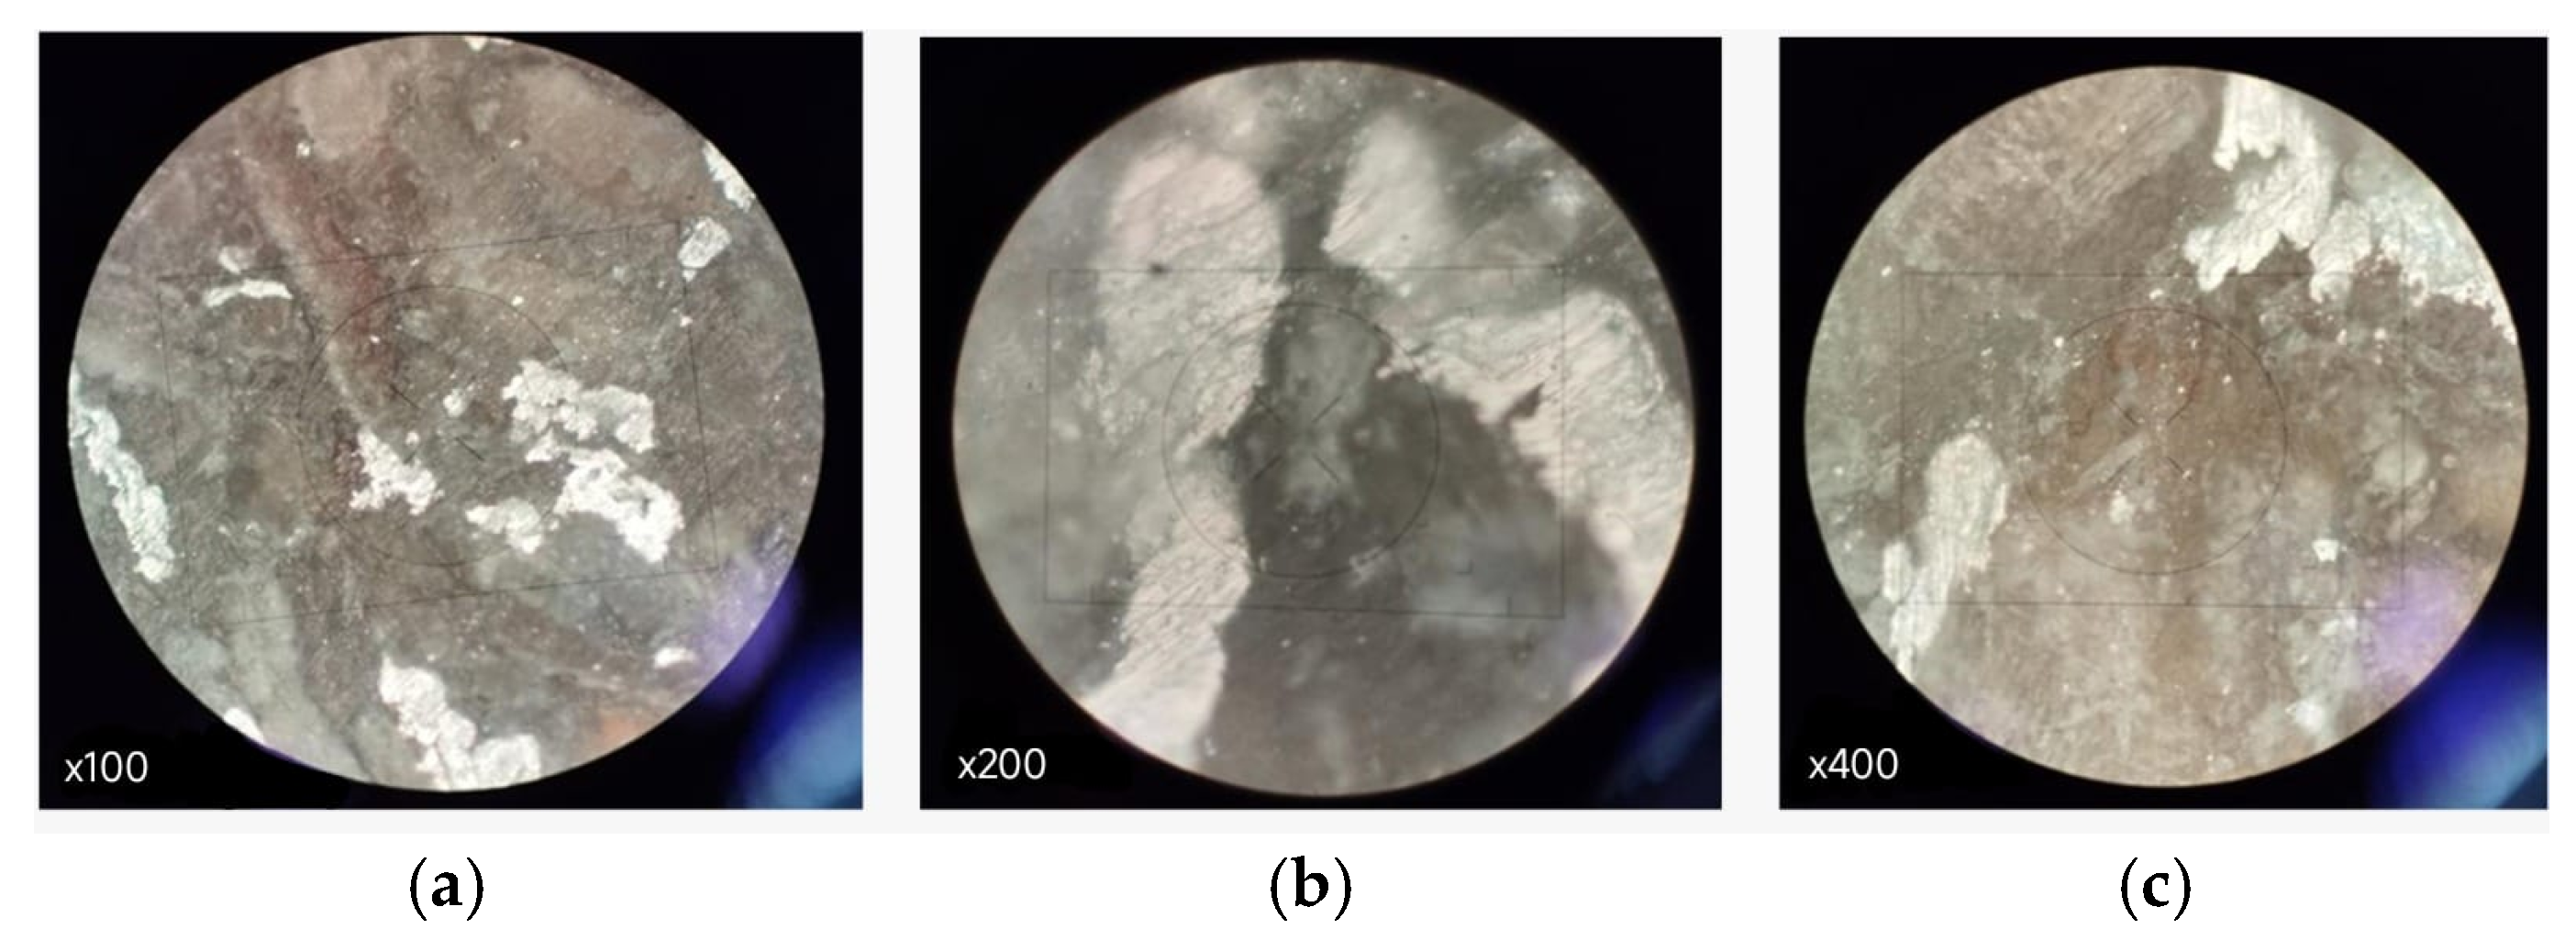
Figure 15.
Evolution of mean Shore D surface hardness as a function of UV exposure time.
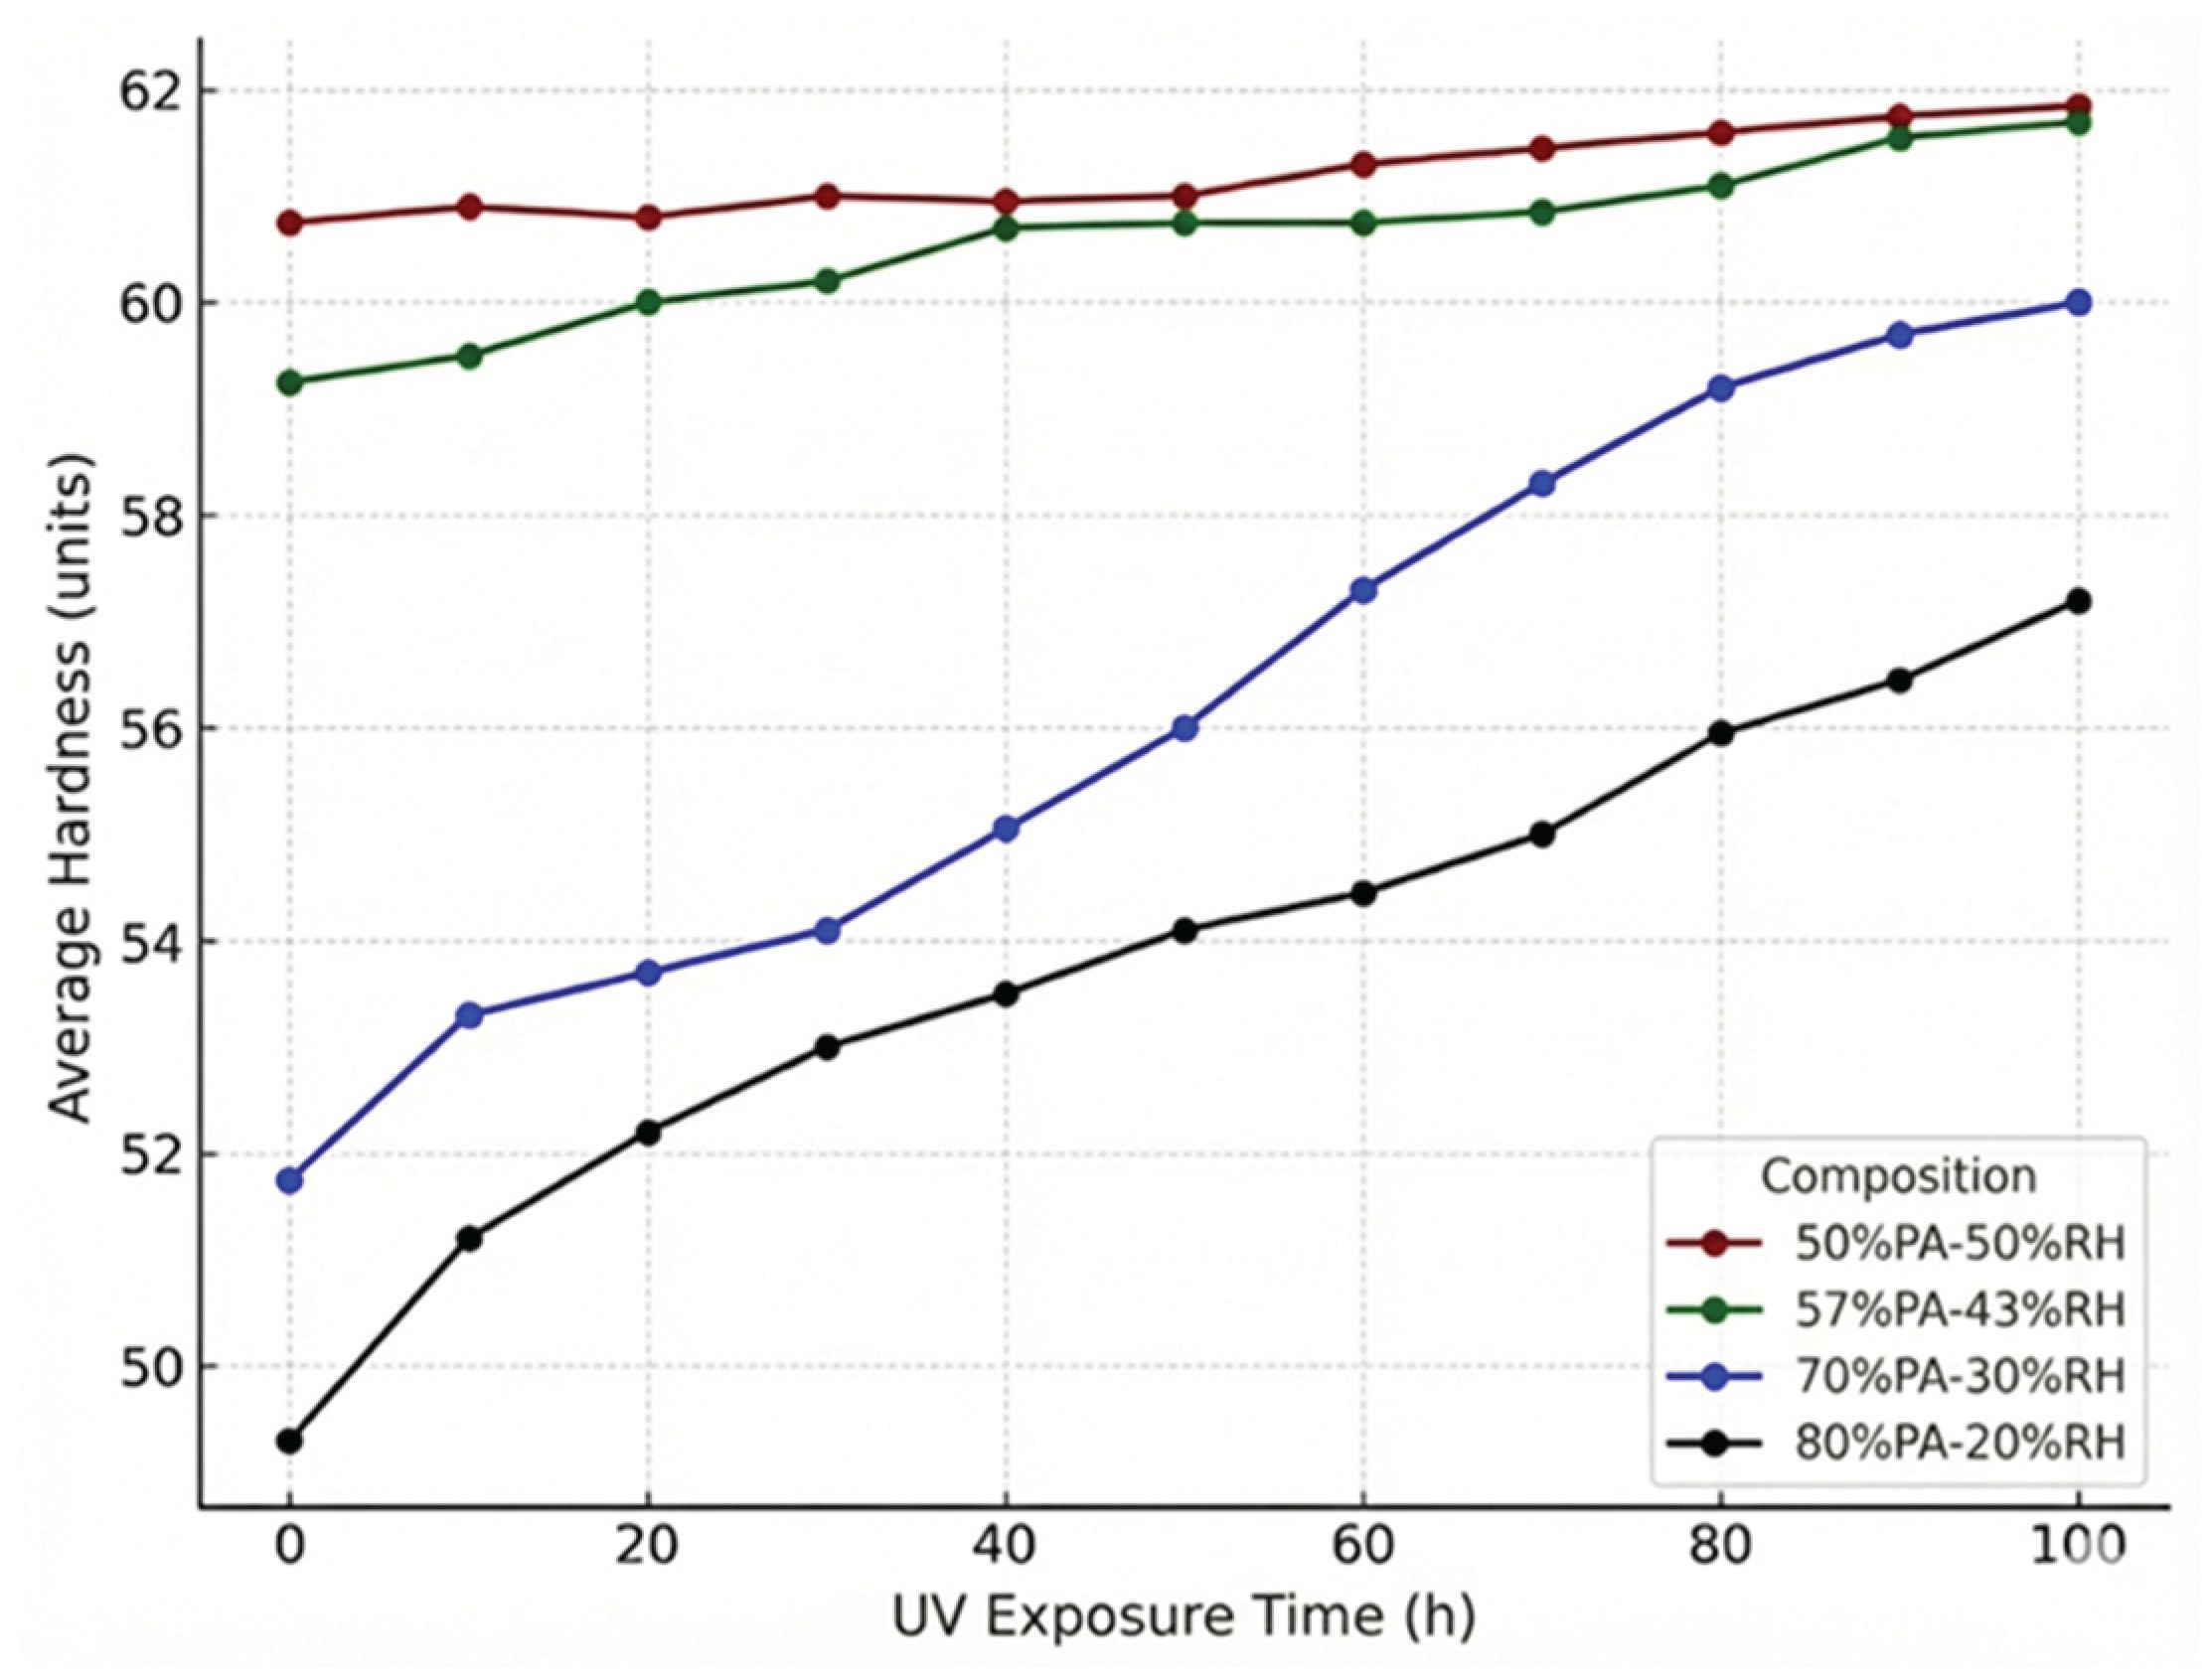
Table 2.
Hollomon parameters for the tensile true stress-strain curves of the PA-RH composites.
| Formulation | k (-) | n (-) | R2 |
|---|---|---|---|
| 50PA–50RH | 76.853 | 0.6027 | 0.9456 |
| 57PA–43RH | 62.409 | 0.5687 | 0.9404 |
| 70PA–30RH | 29.290 | 0.4303 | 0.9638 |
| 80PA–20RH | 38.159 | 0.4929 | 0.9655 |
Table 3.
Voce parameters for the tensile true stress-strain curves of the PA-RH composites.
| Formulation | σs (MPa) | σ0 (MPa) | c (-) | R2 |
|---|---|---|---|---|
| 50PA–50RH | 8.152 | 0.370 | 88.005 | 0.9466 |
| 57PA–43RH | 10.359 | 0.741 | 50.525 | 0.9386 |
| 70PA–30RH | 8.600 | 0.563 | 51.214 | 0.9857 |
| 80PA–20RH | 7.760 | 0.275 | 68.799 | 0.9888 |
Table 4.
Hollomon parameters for the three-point bending tests on PA–RH composites.
| Formulation | k (-) | n (-) | R2 |
|---|---|---|---|
| 50PA–50RH | 664.725 | 0.8988 | 0.9798 |
| 57PA–43RH | 310.686 | 0.7497 | 0.9242 |
| 70PA–30RH | 117.109 | 0.6153 | 0.9280 |
| 80PA–20RH | 70.262 | 0.5061 | 0.8590 |
Table 5.
Voce parameters identified from flexural tests on PA-RH composites.
| Formulation | σs (MPa) | σ0 (MPa) | c (-) | R2 |
|---|---|---|---|---|
| 50PA–50RH | 37.9098 | <0.1 | 33.1422 | 0.983658 |
| 57PA–43RH | 21.631 | <0.1 | 63.7753 | 0.941396 |
| 70PA–30RH | 16.3421 | <0.1 | 56.26 | 0.951323 |
| 80PA–20RH | 15.7087 | <0.1 | 54.2198 | 0.922698 |
Table 6.
Descriptive statistics of Shore D hardness for each formulation.
| Formulation | N | Mean hardness, μ |
Standard deviation, σ |
Minimum | Maximum |
|---|---|---|---|---|---|
| 50PA–50RH | 9 | 61.67 | 1.12 | 60.0 | 63.0 |
| 57PA–43RH | 10 | 58.30 | 3.39 | 55.0 | 61.5 |
| 70PA–30RH | 10 | 52.36 | 2.24 | 49.0 | 56.0 |
| 80PA–20RH | 7 | 50.36 | 0.74 | 51.0 | 51.0 |
Disclaimer/Publisher’s Note: The statements, opinions and data contained in all publications are solely those of the individual author(s) and contributor(s) and not of MDPI and/or the editor(s). MDPI and/or the editor(s) disclaim responsibility for any injury to people or property resulting from any ideas, methods, instructions or products referred to in the content. |
© 2026 by the authors. Licensee MDPI, Basel, Switzerland. This article is an open access article distributed under the terms and conditions of the Creative Commons Attribution (CC BY) license (http://creativecommons.org/licenses/by/4.0/).
Copyright: This open access article is published under a Creative Commons CC BY 4.0 license, which permit the free download, distribution, and reuse, provided that the author and preprint are cited in any reuse.


