
Submitted:
19 January 2026
Posted:
20 January 2026
You are already at the latest version
Abstract
Introduction: Engaging in physical activity is a cornerstone of healthy aging, yet physical inactivity remains prevalent among U.S. older adults. This study aimed to develop and validate measures of perceptions, attitudes, and practices to support personalized physical activity promotion among older adults. Method: For this online cross-sectional survey, we enrolled 310 community-dwelling older adults and 11 content experts. Using the Knowledge, Attitudes, and Practices framework, we developed 14 items for the Perceived Physical Activity Benefits Scale (PBAS), seven items for the Attitudes toward Physical Activity Scale (APAS), and nine items for the Physical Activity Practice Scale (PAPS). Using a 30:70 split, derivation and replication samples were generated via simple random sampling without replacement. Content validity and item analyses were performed on the full sample, followed by exploratory and confirmatory factor analyses in the derivation and replication samples, respectively. Results: Item-level content validity indices for the PBAS, APAS, and PAPS were 0.96, 0.94, and 0.95, respectively. Internal consistencies (Cronbach’s alpha) were 0.92 for the PBAS, 0.77 for the APAS, and 0.91 for the PAPS. Exploratory factor analyses identified two subscale constructs for each measure, all demonstrating good to excellent subscale reliability. Confirmatory factor analysis fit indices ranged from 0.89–0.91 for the PBAS, 0.84–0.92 for the APAS, and 0.95–0.97 for the PAPS. Conclusion: The PBAS, APAS, and PAPS are reliable and valid instruments for assessing perceptions, attitudes, and practices related to physical activity among older adults and can support interventions aimed at promoting personalized physical activity and healthy aging.
Keywords:
perception
; attitude
; practice
; physical activity
; older adults
; instrument validation
1. Introduction
Physical activity is a cornerstone of healthy aging, yet inactivity remains highly prevalent among U.S. older adults.[1,2,3]. Despite well-established evidence demonstrating that regular physical activity reduces the risk of cardiovascular disease, frailty, falls, cognitive decline, and all-cause mortality among older adults [4,5,6], engagement in physical activity remains low[7,8]. Physical inactivity contributes to loss of independence, diminished quality of life, and increased healthcare costs [9,10,11]. Conversely, consistent engagement in moderate-intensity activities, such as walking, cycling, or resistance training, has been shown to improve balance, strength, mood, and cognitive function [1,12,13].
Guidelines from the World Health Organization and the U.S. Department of Health and Human Services recommend that adults aged 65 years and older engage in at least 150 minutes of moderate-intensity or 75 minutes of vigorous-intensity aerobic activity weekly, along with muscle-strengthening and balance exercises [14,15]. As of 2022, 14 percent of older adults met the physical activity guideline, with the proportion decreasing from 16 percent among those aged 65 to 74 years to six percent among those aged 85 years and older [16]. This reduced engagement in physical activity may reflect both physical limitations and psychosocial barriers, such as fear of falling, lack of motivation, and limited social support [17,18,19]. Previous studies have shown that older adults often have general awareness of physical activity’s health benefits but may underestimate the amount or intensity required to achieve them [20,21]. Misconceptions about safety, particularly regarding exercise-related injury or fatigue, further discourage participation [22]. These findings underscore the need for approaches that account for individual differences in perceptions, attitudes, and behavioral readiness when promoting physical activity among older adults.
Although several validated instruments assess aspects of physical activity behavior among older adults [23,24,25,26,27], each addresses only specific domains and subdomains of knowledge of the role, benefits, and recommendations for physical activity in older adults, attitudes toward engaging in physical activity or exercise, or physical activity practices. The Exercise Benefits and Barriers Scale focuses on perceived advantages and constraints related to exercise but does not assess attitudes or practice behaviors [27]. The Behavioral Regulation in Exercise Questionnaire and its modifications emphasize motivational regulation and motivation but do not assess knowledge or patterns of practical engagement [23]. Also, the International Physical Activity Questionnaire provides reliable estimates of physical activity levels but offers no insight into the underlying beliefs, attitudes, or knowledge that drive behavior [24].
This study, therefore, aims to develop and validate measures of perceptions, attitudes, and practices to support personalized physical activity promotion among older adults. By assessing the reliability and validity of these measures, we seek to provide standardized instruments that capture individual-level variation in perceptions, attitudes, and practices related to physical activity among U.S. older adults.
2. Materials and Methods
2.1. Instrument Development
Guided by the Knowledge, Attitudes, and Practices (KAP) framework [30] and existing literature [13,20,21,31] and exercise guidelines [14,15], we formulated 30 items to assess knowledge of exercise and physical activity benefits, attitudes towards physical activity, and engagement in physical activity. Fourteen of these items that assessed knowledge were pooled into the Perceived Physical Activity Benefits Scale (PBAS), while the remaining seven and nine items were pooled into the Attitudes toward Physical Activity Scale (APAS) and the Physical Activity Practice Scale (PAPS), respectively. PBAS and APAS items were rated on a five-point Likert scale ranging from strongly disagree (1) to strongly agree (5). PAPS items were rated on a five-point frequency scale ranging from never (1) to very often (5). Hence, the PBAS, APAS, and PAPS are scored from 14 to 70, 7 to 35, and 9 to 45, respectively. Higher scores indicate higher knowledge of perceived benefits, a more positive attitude, and more engagement in physical activities.
2.2. Study Design and Participants
We conducted an online cross-sectional survey of community-dwelling older adults and content experts. Participants were recruited through ResearchMatch, a nationwide online research registry that connects investigators with individuals interested in participating in research [32]. ResearchMatch has over 120,000 volunteers, including over 13,000 older adults [32]. Recruitment invitations were disseminated through the platform’s email listserv, and individuals interested in participating provided their email address for screening, eligibility, and electronic consent before gaining access to the survey. Data collection was conducted using REDCap, a secure, web-based platform designed for research data capture and management [33,34].
Eligible participants were adults aged 65 years or older who resided in the community, were able to complete an online questionnaire in English, and provided informed consent. Older adults residing in long-term care facilities and with a history of dementia were excluded. Content experts were similarly recruited from ResearchMatch, and they must have advanced degrees (Master, PhD, MD) and at least three years of research experience in public health, health services, aging, physical activity, rehabilitation, or caregiving research.
2.3. Stratification
For psychometric validation, the full sample of older adults was randomly divided into derivation (30%) and replication (70%) samples using simple random sampling without replacement. The derivation sample was used for exploratory factor analysis, while the replication sample was reserved for confirmatory factor analysis.
2.4. Missing Data
We did not encounter any missing data from the survey among the instrument experts. However, 369 older adults initiated the survey, and 310 (84%) completed it. Those who did not complete the survey completed less than 50% of the items. We performed listwise deletion for these 59 respondents because missingness was not at random [35].
2.5. Analytical Plan
Sociodemographic Characteristics
We reported the sociodemographic characteristics of the study participants using frequency distributions and summary statistics.
Content Validity
Experts evaluated each item in the PABS, APAS, and PAPS for relevance using a four-point ordinal scale - not relevant (1), somewhat relevant but needs major revision (2), relevant with minor alteration (3), and extremely relevant (4). We recoded responses 3 and 4 as 1 (relevant) and responses 1 and 2 as 0 (not relevant). For each item, the Item Content Validity Index (I-CVI) was calculated as the proportion of experts endorsing the item as relevant (i.e., total relevant score divided by the total number of experts) [36]. Inter-rater agreement for each item was estimated using a Cohen’s kappa statistic (κ), calculated as κ = (po − 0.5)/(1 − 0.5), with po representing the proportion of relevant responses for each item [37]. We retained items with an inter-rater agreement of 0.2 or higher [37]. The scale content validity index (S-CVI) was computed in two steps. First, for each expert, we calculated the proportion of relevant items (relevance proportion) on the scale by summing their individual relevance scores and dividing by the total number of items. Next, the S-CVI was computed by averaging the relevance proportions across all experts [36].
2.6. Item Analysis and Reliability
We computed the floor and ceiling effects, item difficulty, variability, discrimination, and internal consistency. Floor and ceiling effects were computed as the proportion of respondents who selected the lowest and highest response category for each item. Proportions below 20% are considered ideal [38]. Item difficulty and variability were assessed using the mean and standard deviation. Mid-range values are considered ideal [39]. Item discrimination was computed using the inter-item correlation, and values of 0.2 or higher are considered adequate [40]. We computed the internal consistency (a measure of reliability) by calculating Cronbach’s alpha of the scale after ensuring that deleting any item would not meaningfully improve the scale’s reliability. Cronbach’s alpha value of 0.70 to 0.79 is considered adequate, 0.80 to 0.89 as good, and 0.90 and higher as excellent [41,42,43,44].
2.7. Exploratory Factor Analysis
Using the derivation sample, we assessed the latent factors in the PBAS, APAS, and PAPS. Factors were extracted using maximum likelihood estimation. We determined the number of possible latent factors using eigenvalues greater than 1, visual inspection of scree plots, and the cumulative proportion of variance explained (exceeding 50%) [45]. We examined the factor solutions iteratively, starting from no rotation, and progressing to orthogonal and oblique rotations. The final factor solution represents the model with minimal cross-loading and the most interpretable structure. For ease of interpretation, we suppressed factor loading coefficients with values 0.3 or lower, consistent with prior studies [45,46,47].
2.8. Confirmatory Factor Analysis
Using the replication sample, we examined the reliability of the factor structures identified in the exploratory factor analysis. We assessed the model fit using multiple indices, including the Comparative Fit Index (CFI), Tucker–Lewis Index (TLI), Normed Fit Index (NFI), and Root Mean Square Error of Approximation (RMSEA). NFI, CFI, and TLI values of 0.90 – 0.94 are deemed adequate fit, while values of 0.95 or higher are deemed good fit [48,49]. RMSEA values of 0.05 or less are considered a good fit, 0.05 to 0.08 an adequate fit, and 0.08 to 0.10 a marginal fit [48,49]. We limited model modifications to the errors of the items, guided by the standardized expected parameter change (SEPC), modification index (MI), and the presence of a conceptual explanation for the items whose errors we allowed to covary. Specifically, we limited the SEPC to values greater than 0.2 and MI to 10, which is above the critical value of 3.84 [50]. We compared the original and modified models using the Akaike and Bayesian information criteria, with lower values indicating a better model.
2.9. Statistical Analysis
2.10. Ethical Considerations
We received approval from the NYU Langone Health Institutional Review Board (IRB #i25-00450; August 21, 2025). All study participants signed electronic informed consent before accessing the survey. All study activities were conducted in accordance with ethical standards for research involving human participants and complied with applicable institutional and federal regulations
3. Results
3.1. Sociodemographic Characteristics
A total of 310 older adults completed the survey, with a mean (SD) age of 70.1 (4.3) years (Table 2). Participants were predominantly female (57.1%), non-Hispanic White (50.7%), married (69.0%), and had a bachelor’s degree or higher (48.4%). Most participants lived with others (80.0%). Demographic characteristics were well balanced between the derivation and replication samples. Additionally, a total of eleven instrument experts, with a mean (SD) age of 31.1 (5.6) years, conducted content validity assessment of the items in the survey instruments (Table 3). The experts were predominantly male (63.6%), non-Hispanic Black (72.7%), physicians (63.6%), with a mean research experience of 7.2 (2.8) years.
3.2. Content Validity
The PABS is a 14-item scale. None of the items required reverse scoring. The mean item and scale content validity indices were both 0.96 (Table 4). The proportion agreement and Kappa values for all 14 items ranged from 0.6 to 1.0 and 0.8 to 1.0, respectively. All 14 items were retained. The APAS is a 7-item scale. None of the items required reverse scoring. The mean item and scale content validity indices were both 0.94. The proportion agreement and Kappa values for all seven items ranged from 0.4 to 1.0 and 0.6 to 1.0, respectively. All seven items were retained. The APAS is a 9-item scale. None of the items required reverse scoring. The mean item and scale content validity indices were both 0.95. The proportion agreement and Kappa values for all nine items ranged from 0.6 to 1.0 and 0.8 to 1.0, respectively. All nine items were retained.
3.3. Item Analysis
All 14 items on the PABS had floor effects below 20% but exhibited ceiling effects above 20%, ranging from 57% to 75% (Table 5). The mean score of the items ranged from 4.4 to 4.7, while the item variability ranged from 0.6 to 0.8. All 14 items correlated moderately to strongly with correlation coefficients ranging from 0.5 to 0.7. The Cronbach alpha of the scale was 0.92, and deleting any item would not improve the scale’s reliability.
Similarly, all seven items on the APAS had floor effects below 20% but exhibited ceiling effects above 20%, ranging from 47% to 72%. The mean score of the items ranged from 3.9 to 4.6, while the item variability ranged from 0.6 to 1.3. All seven items correlated moderately with correlation coefficients ranging from 0.3 to 0.6. The Cronbach alpha of the scale was 0.77, and deleting any item would not improve the scale’s reliability.
Additionally, all nine items on the PAPS had floor effects below 20% but exhibited ceiling effects above 20%, ranging from 38% to 60%. The mean score of the items ranged from 3.6 to 4.3, while the item variability ranged from 0.9 to 1.5. All nine items correlated moderately to strongly with correlation coefficients ranging from 0.4 to 0.8. The Cronbach alpha of the scale was 0.91, and deleting any item would not improve the scale’s reliability.
3.4. Exploratory Factor Analysis
Using the derivative data, we identified two subconstructs in the PABS, generated via oblique rotation, that yielded the most parsimonious structure: the General Health Benefit subscale and the Specific Health Benefit subscale (Table 6). Eight items loaded on the General Health Benefit subscale with factor loadings ranging from 0.49 to 1.05, while six items loaded on the Specific Health Benefit subscale with factor loadings ranging from 0.46 to 0.83. The internal consistencies (Cronbach’s alpha) of the General and Specific Health Benefit subscales were 0.89 and 0.84, respectively.
Also, we identified two subconstructs in the APAS, generated via orthogonal rotation, that yielded the most parsimonious structure: the Intrinsic Motivational Factor subscale and the Extrinsic Motivational Factor subscale. Four items loaded on the Intrinsic Motivational Factor subscale with factor loadings ranging from 0.54 to 0.90, while three items loaded on the Extrinsic Motivational Factor subscale with factor loadings ranging from 0.61 to 0.89. The internal consistencies of the Intrinsic and Extrinsic Motivational Factor subscales were 0.77 and 0.80, respectively.
Additionally, we identified two subconstructs in the PAPS, generated using orthogonal rotation, that yielded the most parsimonious structure: the General Physical Activity Behavior subscale and the General Physical Activity Behavior subscale. Five items loaded on the General Physical Activity Behavior subscale with factor loadings ranging from 0.58 to 1.01, while four items loaded on the Specific Physical Activity Behavior subscale with factor loadings ranging from 0.56 to 0.74. The internal consistencies of the General and Specific Physical Activity Behavior subscales were 0.90 and 0.80, respectively.
3.5. Confirmatory Factor Analysis
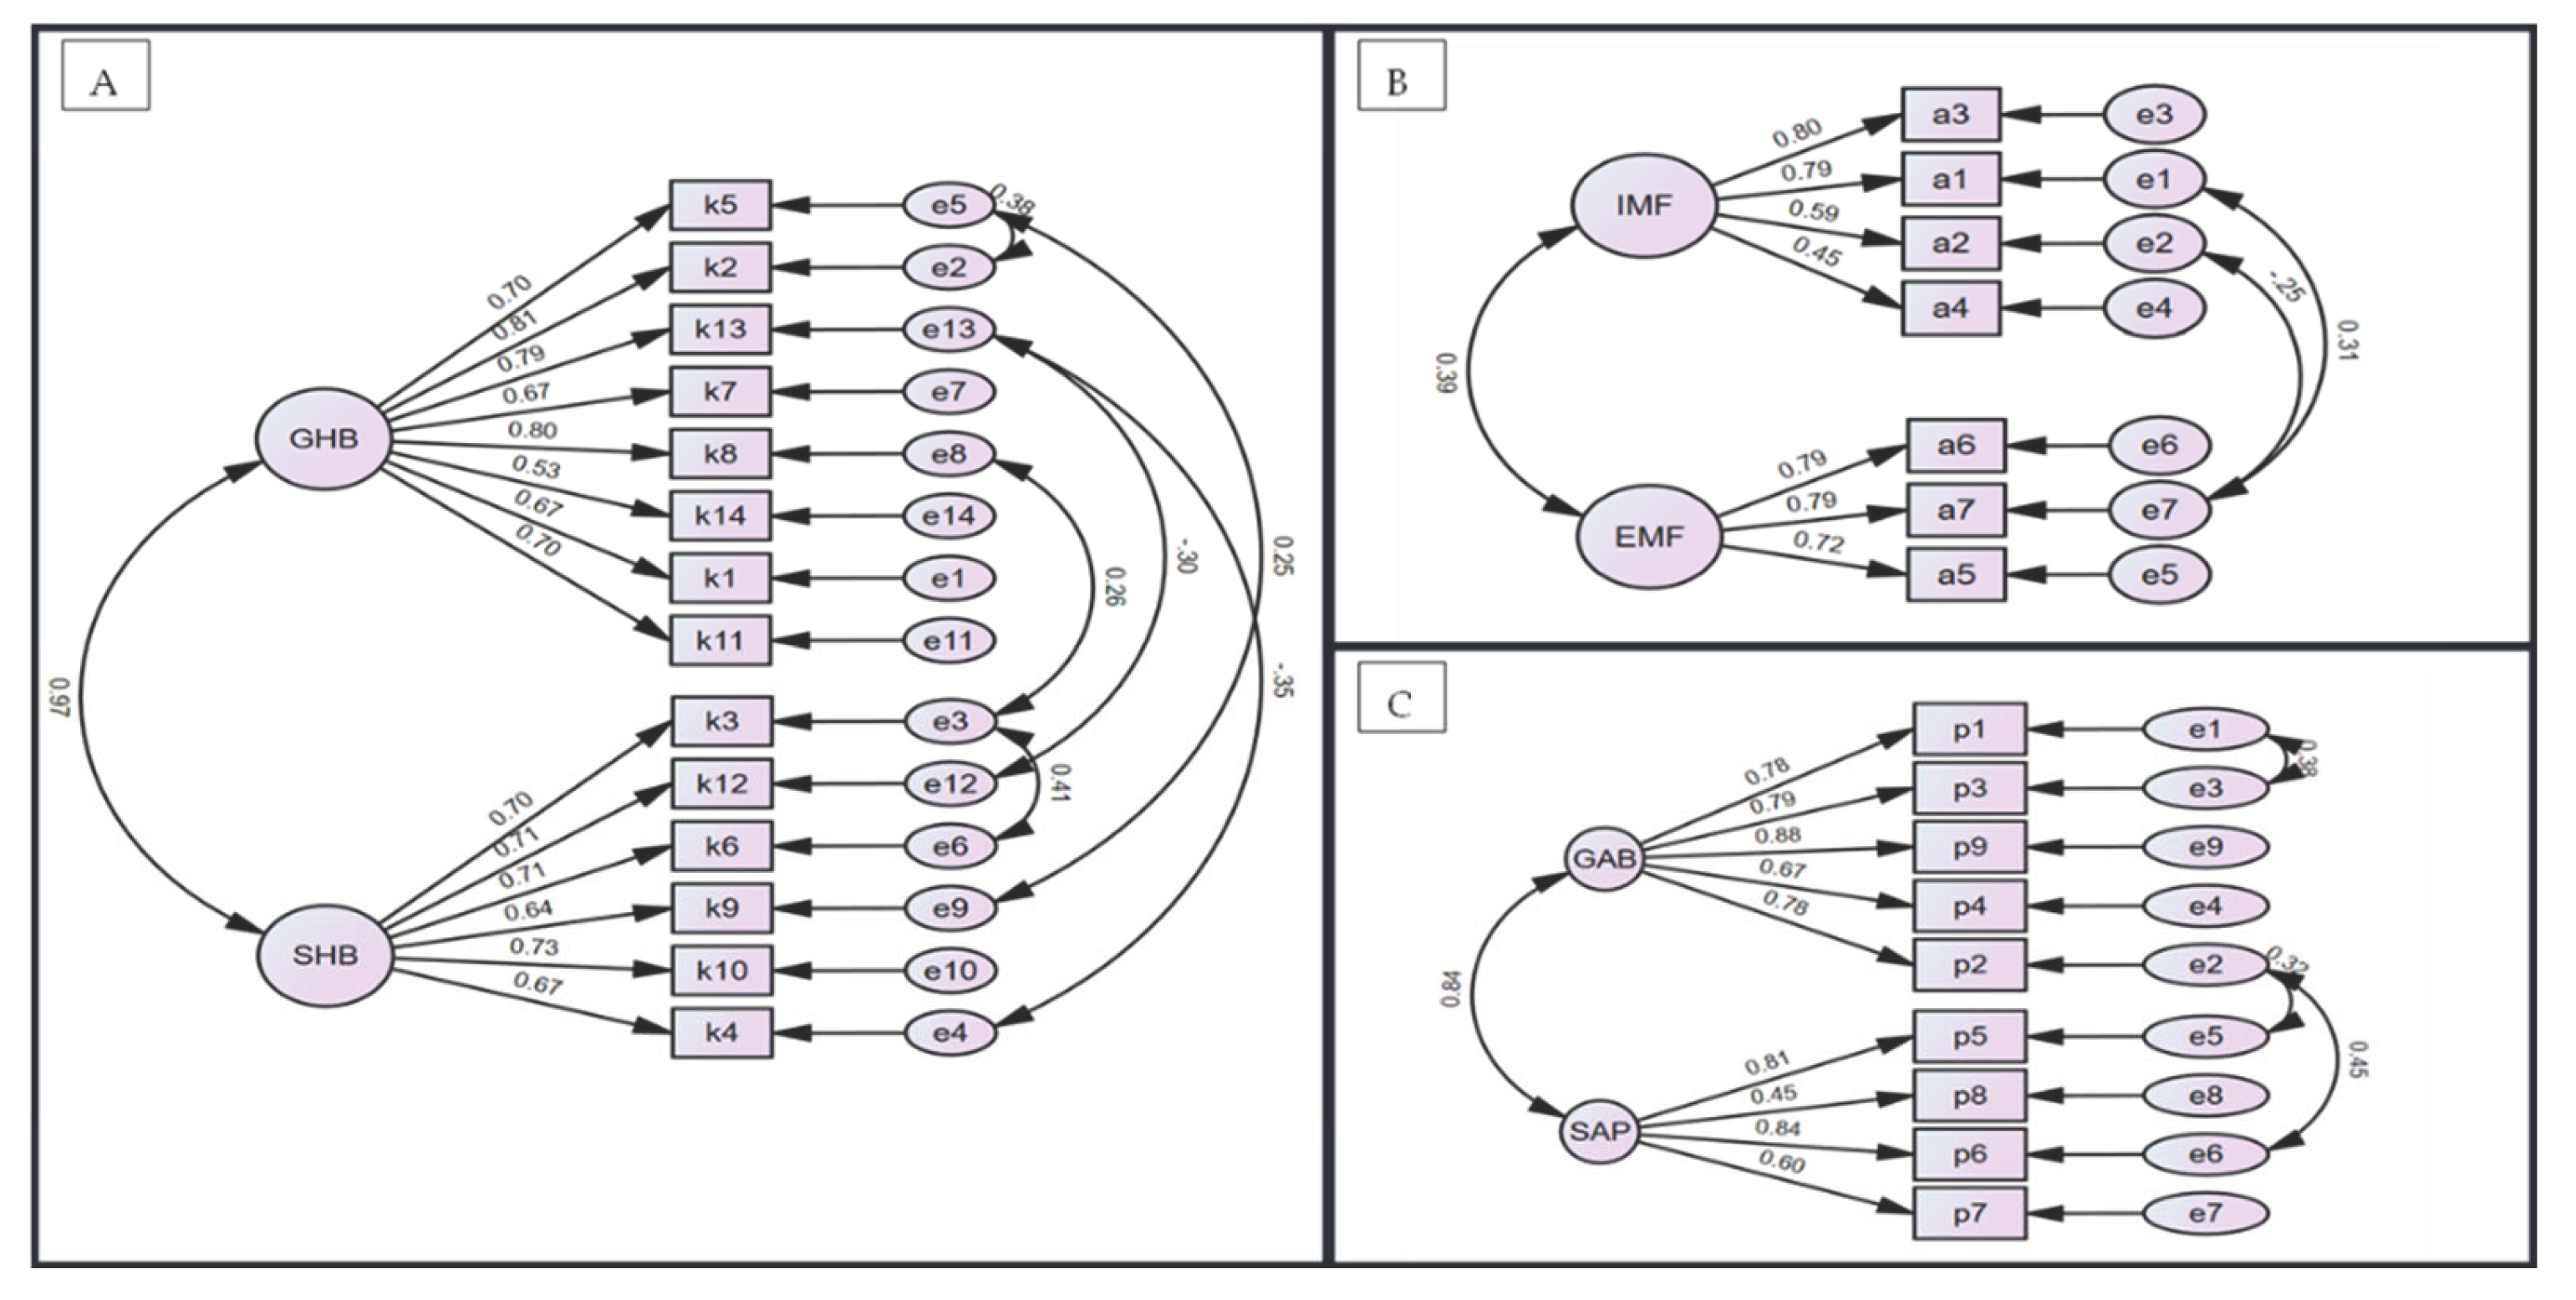
Confirmatory factor analysis of the PABS confirmed the two-subscale structure, with standardized coefficients ranging from 0.53 to 0.81 and from 0.64 to 0.73 for the General and Specific Health Benefit subscales, respectively (Figure 1A). The correlation between the two factors was 0.97, and six constraints were imposed on item errors, guided by our predefined handling of modification indices. The modified model had better fit indices compared to the baseline exploratory factor model (Table 7). The final NFI, CFI, and TLI values were borderline to good, at 0.89, 0.92, and 0.90, respectively. The RMSEA was suboptimal, with a value of 0.09 (90% CI: 0.08 – 0.11).
Also, confirmatory factor analysis of the APAS confirmed the two-subscale structure, with standardized coefficients ranging from 0.45 to 0.80 and from 0.72 to 0.79 for the Intrinsic and Extrinsic Motivational Factors subscales, respectively (Figure 1B). The correlation between the two factors was 0.39, and two constraints were imposed on item errors, guided by our predefined handling of modification indices. The modified APAS model had better fit indices compared to the baseline APAS exploratory factor model. The final NFI, CFI, and TLI values were borderline to good, at 0.90, 0.92, and 0.84, respectively. The RMSEA was suboptimal, with a value of 0.13 (90% CI: 0.10 – 0.17).
Additionally, confirmatory factor analysis of the PAPS confirmed the two-subscale structure, with standardized coefficients ranging from 0.67 to 0.88 and from 0.45 to 0.81 for the General and Specific Physical Activity Practice subscales, respectively (Figure 1C). The correlation between the two factors was 0.84, and three constraints were imposed on item errors, guided by our predefined handling of modification indices. The modified PAPS model had better fit indices compared to the baseline APAS exploratory factor model. The final NFI, CFI, and TLI values were excellent at 0.95, 0.97, and 0.95, respectively. The RMSEA was adequate, with a value of 0.08 (90% CI: 0.05 – 0.11).

Table 1.
Items in the Perceived Physical Activity Benefits for Older Adults Scale, Attitude Towards Physical Activities Scale, and Physical Activity Practice Scale.
Table 1.
Items in the Perceived Physical Activity Benefits for Older Adults Scale, Attitude Towards Physical Activities Scale, and Physical Activity Practice Scale.
| ID | Perceived Physical Activity Benefits for Older Adults Scale (PABS) |
| K1 | Regular physical activity is essential for maintaining good health in older adults. |
| K2 | Older adults who engage in physical activity experience improved quality of life. |
| K3 | Exercise helps older adults maintain independence in daily activities. |
| K4 | Engaging in regular exercise reduces the risk of premature death in older adults. |
| K5 | The benefits of exercise outweigh the risks for most older adults. |
| K6 | Regular physical activity improves heart health and reduces the risk of cardiovascular disease. |
| K7 | Strength training exercises help prevent osteoporosis and maintain bone health. |
| K8 | Exercise can reduce the risk of falls by improving strength and balance. |
| K9 | Regular exercise enhances cognitive function and reduces the risk of dementia. |
| K10 | Physical activity can help manage chronic conditions such as diabetes and arthritis. |
| K11 | Older adults should engage in at least 150 minutes of moderate-intensity physical activity per week. |
| K12 | Strength training exercises should be performed at least twice a week for older adults. |
| K13 | Even light-intensity activities, such as walking, provide significant health benefits for older adults. |
| K14 | It is never too late for older adults to start exercising and gain health benefits. |
| ID | Attitude Towards Physical Activities Scale (APAS) |
| A1 | I enjoy engaging in physical activity. |
| A2 | Exercise is an important part of a healthy lifestyle. |
| A3 | I feel motivated to exercise regularly. |
| A4 | I believe I can still benefit from exercise regardless of my age. |
| A5 | Exercising with others makes it more enjoyable for me. |
| A6 | I would be more likely to exercise if I had proper guidance. |
| A7 | Encouragement from family or friends increases my likelihood of exercising. |
| ID | Physical Activity Practice Scale (PAPS) |
| P1 | I engage in physical activity at least 3 times a week. |
| P2 | I perform strength-training exercises at least twice a week. |
| P3 | I engage in moderate-to-vigorous physical activity for at least 150 minutes per week. |
| P4 | I incorporate light physical activities (e.g., walking, stretching) into my daily routine. |
| P5 | I participate in group-based or social exercise programs. |
| P6 | I do balance or flexibility exercises to prevent falls. |
| P7 | I track my physical activity levels using a device or app. |
| P8 | I exercise regularly based on my healthcare provider’s advice. |
| P9 | I follow an exercise plan or routine. |
Table 2.
Sociodemographic characteristics of older adults (N = 310) stratified into derivation (n=101, 33%) and replication samples (n=209, 67%).
Table 2.
Sociodemographic characteristics of older adults (N = 310) stratified into derivation (n=101, 33%) and replication samples (n=209, 67%).
| Variables | Total Population | Derivation Sample | Replication Sample | p-value |
|---|---|---|---|---|
| Mean (SD) Age | 70.07 (4.29) | 70.05 (4.24) | 70.09 (4.44) | 0.929 |
| Sex | ||||
| Male | 133 (42.90) | 90 (43.06) | 43 (42.57) | 0.935 |
| Female | 177 (57.10) | 119 (56.94) | 58 (57.43) | |
| Race/Ethnicity | ||||
| Non-Hispanic White | 157 (50.65) | 106 (50.72) | 51 (50.50) | 0.541 |
| Non-Hispanic Black | 98 (31.61) | 66 (31.58) | 32 (31.68) | |
| Hispanic | 35 (11.29) | 26 (12.44) | 9 (8.91) | |
| Other Races | 20 (6.45) | 11 (5.26) | 9 (8.91) | |
| Educational Attainment | ||||
| High School or less | 53 (17.10) | 34 (16.27) | 19 (18.81) | 0.724 |
| Some College | 107 (34.52) | 75 (35.89) | 32 (31.68) | |
| Bachelor’s or higher | 150 (48.39) | 100 (47.85) | 50 (49.50) | |
| Marital Status | ||||
| Married | 214 (69.03) | 143 (68.42) | 71 (70.30) | 0.255 |
| WDS | 14 (4.52) | 7 (3.35) | 7 (6.93) | |
| Never Married | 82 (26.45) | 59 (28.23) | 23 (22.77) | |
| Living Situation | ||||
| Living alone | 62 (20.00) | 39 (18.66) | 23 (22.77) | 0.396 |
| Living with others | 248 (80.00) | 170 (81.34) | 78 (77.23) |
WDS: Widowed/Divorced/Separated.
Table 3.
Sociodemographic characteristics of instrument experts (N=11).
| Variables | Experts (N = 11, %) |
| Mean (SD) Age | 31.1 (5.6) |
| Sex | |
| Male | 7 (63.6) |
| Female | 4 (36.4) |
| Race/Ethnicity | |
| Non-Hispanic White | 2 (18.2) |
| Non-Hispanic Black | 8 (72.7) |
| Hispanic | 1 (9.1) |
| Education | |
| Masters | 2 (18.2) |
| PhD | 2 (18.2) |
| MD | 7 (63.6) |
| Research Experience | |
| Mean (SD) years | 7.2 (2.8) |
| Profession | |
| Physicians | 7 (63.6) |
| Nurses | 1 (9.1) |
| Health Service Researchers | 3 (27.3) |
SD: Standard Deviation.
Table 4.
Content validation of the items in the Perceived Physical Activity Benefits for Older Adults Scale, Attitude Towards Physical Activities Scale, and Physical Activity Practice Scale.
Table 4.
Content validation of the items in the Perceived Physical Activity Benefits for Older Adults Scale, Attitude Towards Physical Activities Scale, and Physical Activity Practice Scale.
| Items | E1 | E2 | E3 | E4 | E5 | E6 | E7 | E8 | E9 | E10 | E11 | No in Agreement | I-CVI | Kappa | Decision |
| Perceived Physical Activity Benefits for Older Adults Scale | |||||||||||||||
| K1 | 1 | 1 | 1 | 1 | 1 | 1 | 1 | 1 | 1 | 1 | 1 | 11 | 1.00 | 1.00 | Retain |
| K2 | 1 | 1 | 0 | 1 | 1 | 1 | 1 | 1 | 1 | 1 | 1 | 10 | 0.91 | 0.82 | Retain |
| K3 | 1 | 1 | 1 | 1 | 1 | 1 | 1 | 1 | 1 | 1 | 1 | 11 | 1.00 | 1.00 | Retain |
| K4 | 1 | 1 | 0 | 1 | 1 | 1 | 1 | 1 | 1 | 1 | 1 | 10 | 0.91 | 0.82 | Retain |
| K5 | 1 | 1 | 1 | 1 | 1 | 1 | 1 | 1 | 1 | 1 | 1 | 11 | 1.00 | 1.00 | Retain |
| K6 | 1 | 1 | 1 | 1 | 1 | 1 | 1 | 1 | 1 | 1 | 1 | 11 | 1.00 | 1.00 | Retain |
| K7 | 1 | 1 | 0 | 1 | 1 | 1 | 1 | 1 | 1 | 1 | 1 | 10 | 0.91 | 0.82 | Retain |
| K8 | 1 | 1 | 1 | 1 | 1 | 1 | 1 | 1 | 1 | 1 | 1 | 11 | 1.00 | 1.00 | Retain |
| K9 | 1 | 1 | 0 | 1 | 1 | 1 | 1 | 1 | 1 | 1 | 1 | 10 | 0.91 | 0.82 | Retain |
| K10 | 1 | 1 | 1 | 1 | 1 | 1 | 1 | 1 | 1 | 1 | 1 | 11 | 1.00 | 1.00 | Retain |
| K11 | 1 | 1 | 0 | 1 | 1 | 1 | 1 | 1 | 1 | 1 | 1 | 10 | 0.91 | 0.82 | Retain |
| K12 | 1 | 1 | 1 | 1 | 1 | 1 | 1 | 1 | 1 | 1 | 1 | 11 | 1.00 | 1.00 | Retain |
| K13 | 1 | 1 | 0 | 1 | 1 | 1 | 1 | 1 | 1 | 1 | 1 | 10 | 0.91 | 0.82 | Retain |
| K14 | 1 | 1 | 1 | 1 | 1 | 1 | 1 | 1 | 1 | 1 | 1 | 11 | 1.00 | 1.00 | Retain |
| Proportion Relevant | 1 | 1 | 0.57 | 1 | 1 | 1 | 1 | 1 | 1 | 1 | 1 | Scale CVI: 0.96, Mean I-CVI: 0.96 | |||
| Attitude Towards Physical Activities Scale | |||||||||||||||
| A1 | 1 | 1 | 1 | 1 | 1 | 1 | 1 | 1 | 1 | 1 | 1 | 11 | 1.00 | 1.00 | Retain |
| A2 | 1 | 1 | 1 | 1 | 1 | 1 | 1 | 1 | 1 | 1 | 1 | 11 | 1.00 | 1.00 | Retain |
| A3 | 1 | 1 | 0 | 1 | 1 | 1 | 1 | 1 | 1 | 1 | 1 | 10 | 0.91 | 0.82 | Retain |
| A4 | 1 | 1 | 0 | 1 | 1 | 1 | 1 | 1 | 1 | 1 | 1 | 10 | 0.91 | 0.82 | Retain |
| A5 | 1 | 1 | 0 | 1 | 1 | 1 | 1 | 1 | 1 | 1 | 1 | 10 | 0.91 | 0.82 | Retain |
| A6 | 1 | 1 | 0 | 1 | 0 | 1 | 1 | 1 | 1 | 1 | 1 | 9 | 0.82 | 0.64 | Retain |
| A7 | 1 | 1 | 1 | 1 | 1 | 1 | 1 | 1 | 1 | 1 | 1 | 11 | 1.00 | 1.00 | Retain |
| Proportion Relevant | 1 | 1 | 0.43 | 1 | 0.86 | 1 | 1 | 1 | 1 | 1 | 1 | Scale CVI: 0.94, Mean I-CVI: 0.94 | |||
| Physical Activity Practice Scale | |||||||||||||||
| P1 | 1 | 1 | 1 | 1 | 1 | 1 | 1 | 1 | 1 | 1 | 1 | 11 | 1.00 | 1.00 | Retain |
| P2 | 1 | 1 | 0 | 1 | 1 | 1 | 1 | 1 | 1 | 1 | 1 | 10 | 0.91 | 0.82 | Retain |
| P3 | 1 | 1 | 1 | 1 | 1 | 1 | 1 | 1 | 1 | 1 | 1 | 11 | 1.00 | 1.00 | Retain |
| P4 | 1 | 1 | 0 | 1 | 1 | 1 | 1 | 1 | 1 | 1 | 1 | 10 | 0.91 | 0.82 | Retain |
| P5 | 1 | 1 | 1 | 1 | 1 | 1 | 1 | 1 | 1 | 1 | 1 | 11 | 1.00 | 1.00 | Retain |
| P6 | 1 | 1 | 1 | 1 | 1 | 1 | 1 | 1 | 1 | 1 | 10 | 0.91 | 0.82 | Retain | |
| P7 | 1 | 1 | 0 | 1 | 1 | 1 | 1 | 1 | 1 | 1 | 1 | 10 | 0.91 | 0.82 | Retain |
| P8 | 1 | 1 | 0 | 1 | 1 | 1 | 1 | 1 | 1 | 1 | 1 | 10 | 0.91 | 0.82 | Retain |
| P9 | 1 | 1 | 1 | 1 | 1 | 1 | 1 | 1 | 1 | 1 | 1 | 14 | 1.00 | 1.00 | Retain |
| Proportion Relevant | 1 | 1 | 0.56 | 1 | 1 | 0.89 | 1 | 1 | 1 | 1 | 1 | Scale CVI: 0.95, Mean I-CVI: 0.95 | |||
Table 5.
Item analysis of the Perceived Physical Activity Benefits for Older Adults Scale, Attitude Towards Physical Activities Scale, and Physical Activity Practice Scale (n=310).
Table 5.
Item analysis of the Perceived Physical Activity Benefits for Older Adults Scale, Attitude Towards Physical Activities Scale, and Physical Activity Practice Scale (n=310).
| Items | Floor (n, %) |
Ceiling (n, %) |
Item Difficulty (Mean) |
Item Variability (Std Dev) |
Item Discrimination (Correlation) | Alpha If item deleted | Decision |
|---|---|---|---|---|---|---|---|
| Perceived Physical Activity Benefits for Older Adults Scale | |||||||
| K1 | 3 (1.0) | 235 (75.8) | 4.70 | 0.637 | 0.652 | 0.917 | Retain |
| K2 | 3 (1.0) | 225 (72.6) | 4.65 | 0.684 | 0.735 | 0.914 | Retain |
| K3 | 4 (1.3) | 220 (71.0) | 4.64 | 0.672 | 0.639 | 0.917 | Retain |
| K4 | 6 (1.9) | 206 (66.5) | 4.53 | 0.811 | 0.585 | 0.920 | Retain |
| K5 | 4 (1.3) | 206 (66.5) | 4.54 | 0.786 | 0.716 | 0.915 | Retain |
| K6 | 1 (0.3) | 223 (71.9) | 4.66 | 0.605 | 0.672 | 0.917 | Retain |
| K7 | 2 (0.6) | 222 (71.6) | 4.62 | 0.690 | 0.626 | 0.918 | Retain |
| K8 | 4 (1.3) | 219 (70.6) | 4.64 | 0.666 | 0.729 | 0.915 | Retain |
| K9 | 4 (1.3) | 185 (59.7) | 4.42 | 0.843 | 0.625 | 0.918 | Retain |
| K10 | 2 (0.6) | 187 (60.3) | 4.50 | 0.718 | 0.642 | 0.917 | Retain |
| K11 | 4 (1.3) | 181 (58.4) | 4.40 | 0.849 | 0.642 | 0.918 | Retain |
| K12 | 3 (1.0) | 177 (57.1) | 4.45 | 0.744 | 0.670 | 0.916 | Retain |
| K13 | 2 (0.6) | 221 (71.3) | 4.65 | 0.646 | 0.698 | 0.916 | Retain |
| K14 | 6 (1.9) | 205 (66.1) | 4.56 | 0.768 | 0.544 | 0.921 | Retain |
| Score Range: 14 – 70; Scale Mean: 63.96; Scale SD: 7.18; Cronbach Alpha: 0.92 | |||||||
| Attitude Towards Physical Activities Scale | |||||||
| A1 | 3 (1.0) | 183 (59.0) | 4.35 | 0.946 | 0.588 | 0.727 | Retain |
| A2 | 1 (0.3) | 220 (71.0) | 4.61 | 0.719 | 0.420 | 0.760 | Retain |
| A3 | 12 (3.9) | 171 (55.2) | 4.15 | 1.178 | 0.552 | 0.732 | Retain |
| A4 | 2 (0.6) | 223 (71.9) | 4.65 | 0.645 | 0.346 | 0.771 | Retain |
| A5 | 10 (3.2) | 148 (47.7) | 4.02 | 1.157 | 0.638 | 0.712 | Retain |
| A6 | 14 (4.5) | 144 (46.5) | 3.92 | 1.252 | 0.406 | 0.770 | Retain |
| A7 | 10 (3.2) | 155 (50.0) | 4.12 | 1.103 | 0.564 | 0.730 | Retain |
| Score Range: 7 – 35; Scale Mean: 29.81; Scale SD: 4.66; Cronbach Alpha: 0.77 | |||||||
| Physical Activity Practice Scale | |||||||
| P1 | 3 (1.0) | 186 (60.0) | 4.26 | 1.057 | 0.714 | 0.688 | Retain |
| P2 | 33 (10.6) | 138 (44.5) | 3.74 | 1.405 | 0.778 | 0.681 | Retain |
| P3 | 18 (5.8) | 158 (51.0) | 3.95 | 1.290 | 0.764 | 0.712 | Retain |
| P4 | 1 (0.3) | 173 (55.8) | 4.32 | 0.888 | 0.622 | 0.471 | Retain |
| P5 | 56 (18.1) | 119 (38.4) | 3.42 | 1.549 | 0.727 | 0.619 | Retain |
| P6 | 23 (7.4) | 136 (43.9) | 3.81 | 1.299 | 0.765 | 0.675 | Retain |
| P7 | 55 (17.7) | 142 (45.8) | 3.64 | 1.547 | 0.625 | 0.434 | Retain |
| P8 | 23 (7.4) | 153 (49.4) | 3.96 | 1.270 | 0.453 | 0.258 | Retain |
| P9 | 23 (7.4) | 159 (51.3) | 3.95 | 1.317 | 0.810 | 0.694 | Retain |
| Score Range: 9 – 45; Scale Mean: 35.05; Scale SD: 8.93; Cronbach Alpha: 0.91 | |||||||
Table 6.
Exploratory factor analysis, subscale constructs, and subscale reliability of the items in the Perceived Physical Activity Benefits for Older Adults Scale, Attitude Towards Physical Activities Scale, and Physical Activity Practice Scale (Derivation Sample: n=101).
Table 6.
Exploratory factor analysis, subscale constructs, and subscale reliability of the items in the Perceived Physical Activity Benefits for Older Adults Scale, Attitude Towards Physical Activities Scale, and Physical Activity Practice Scale (Derivation Sample: n=101).
| Perceived Physical Activity Benefits Scale | Attitude Towards Physical Activities Scale | Physical Activity Practice Scale | ||||||
|---|---|---|---|---|---|---|---|---|
| Item ID | GHB | SHB | Item ID | IMF | EMF | Item ID | GAB | SAP |
| K5 | 1.046 | A3 | 0.897 | P1 | 1.011 | |||
| K2 | 0.851 | A1 | 0.809 | P3 | 0.871 | |||
| K13 | 0.642 | A2 | 0.697 | P10 | 0.711 | |||
| K7 | 0.582 | A4 | 0.542 | P4 | 0.627 | |||
| K8 | 0.578 | A9 | 0.894 | P2 | 0.580 | |||
| K15 | 0.562 | A10 | 0.704 | P5 | 0.742 | |||
| K1 | 0.547 | A6 | 0.606 | P9 | 0.703 | |||
| K11 | 0.485 | P6 | 0.685 | |||||
| K3 | 0.831 | P7 | 0.560 | |||||
| K12 | 0.749 | |||||||
| K6 | 0.587 | |||||||
| K9 | 0.580 | |||||||
| K10 | 0.506 | |||||||
| K4 | 0.457 | |||||||
| Subscale Metrics* | ||||||||
| Measure | GHB | SHB | Measure | IMF | EMF | Measure | GAB | SAP |
| Mean | 36.75 | 27.21 | Mean | 17.75 | 12.06 | Mean | 20.22 | 14.83 |
| SD | 4.30 | 3.30 | SD | 2.76 | 2.97 | SD | 5.10 | 4.51 |
| Range | 8 – 40 | 6 – 30 | Range | 4 – 20 | 3 – 15 | Range | 5 – 25 | 4 - 20 |
| A | 0.89 | 0.84 | α | 0.77 | 0.80 | α | 0.90 | 0.80 |
GHB: General Health Benefit; SHB: Specific Health Benefit; IMF: Intrinsic Motivational Factor; EMF: Extrinsic Motivational Factor; GAB: General Physical Activity Behavior; SAP: Structured Physical Activity Participation. α: Cronbach’s alpha.*Subscale metrics computed on the full sample size (n=305).
Table 7.
Summary of the confirmatory factor analysis of the Perceived Physical Activity Benefits for Older Adults Scale, Attitude Towards Physical Activities Scale, and Physical Activity Practice Scale (Replication Sample: n=209).
Table 7.
Summary of the confirmatory factor analysis of the Perceived Physical Activity Benefits for Older Adults Scale, Attitude Towards Physical Activities Scale, and Physical Activity Practice Scale (Replication Sample: n=209).
| Fit Indices | Baseline Exploratory Factor Analysis Model | Modified Confirmatory Factor Analysis Model | |
| Perceived Physical Activity Benefits Scale | |||
| Normed Fit Index | 0.83 | 0.89 | |
| Comparative Fit Index | 0.86 | 0.92 | |
| Tucker-Lewis Fit Index | 0.83 | 0.90 | |
| RMSEA (90% CI) | 0.112 (0.108 – 0.136) | 0.094 (0.078 – 0.109) | |
| AIC | 395.49 | 295.65 | |
| BIC | 402.18 | 303.26 | |
| χ2(df) | 309.49 (76) | 197.65 (70) | |
| PCMIN/df | 4.07 | 2.82 | |
| Attitude Towards Physical Activities Scale | |||
| Normed Fit Index | 0.85 | 0.90 | |
| Comparative Fit Index | 0.87 | 0.92 | |
| Tucker-Lewis Fit Index | 0.79 | 0.84 | |
| RMSEA (90% CI) | 0.153 (0.121 – 0.187) | 0.133 (0.098 – 0.171) | |
| AIC | 120.42 | 99.71 | |
| BIC | 122.18 | 101.63 | |
| χ2(df) | 76.42 (13) | 51.71 (11) | |
| PCMIN/df | 5.88 | 4.70 | |
| Physical Activity Practice Scale | |||
| Normed Fit Index | 0.90 | 0.95 | |
| Comparative Fit Index | 0.92 | 0.97 | |
| Tucker-Lewis Fit Index | 0.89 | 0.95 | |
| RMSEA (90% CI) | 0.125 (0.101 – 0.149) | 0.081 (0.053 – 0.109) | |
| AIC | 165.95 | 116.39 | |
| BIC | 168.78 | 119.52 | |
| χ2(df) | 109.95 (26) | 54.39 (23) | |
| PCMIN/df | 4.23 | 2.37 | |
* RMSEA: Root Mean Square Error of Approximation; AIC: Akaike Information Criteria; BIC: Bayesian Information Criteria; χ2(df): Chi-square (degree of freedom); PCMIN/df: Ratio of chi-square to its degrees of freedom.
Figures and Tables
Figure 1.
Structural equation model showing the result of the confirmatory factor analysis of the factors in the (A) Perceived Physical Activity Benefits for Older Adults Scale, (B) Attitude Towards Physical Activities Scale, and (C) Physical Activity Practice Scale. GHB: General Health Benefit; SHB: Specific Health Benefit; IMF: Intrinsic Motivational Factors; EMF: Extrinsic Motivational Factors; GAB: General Activity Behavior; SAP: Structured Activity Participation.4. Discussion.
Promoting sustained physical activity among older adults is a critical public health priority to support healthy aging and reduce preventable morbidity and mortality. In this study, we developed and validated three complementary instruments, the PBAS, APAS, and PAPS, using a rigorous, multi-step psychometric approach grounded in the Knowledge, Attitudes, and Practices framework [30]. The three scales demonstrated excellent content validity, acceptable to excellent internal consistency, and stable factor structures, which were replicated in an independent sample. Together, these findings indicate that the PBAS, APAS, and PAPS are reliable and valid tools for comprehensive assessment of perceptions, attitudes, and behaviors related to physical activity among community-dwelling older adults.
The internal consistency estimates ranged from acceptable to excellent, indicating that items within each scale and subscale coherently measured their intended constructs. Although mid-range mean score distributions are often desirable for population discrimination [39], we observed substantial ceiling effects for the PBAS, APAS, and PAPS. These high mean scores likely reflect widespread awareness of the benefits of physical activity and generally favorable attitudes toward exercise and physical activity among community-dwelling older adults, rather than poor scale performance, a pattern reported in prior studies of physical activity perception and attitudes [53,54]. Additionally, our greater score variability observed for the PAPS is consistent with extant literature demonstrating that, despite high knowledge and positive attitudes, actual engagement in physical activity remains suboptimal among older adults [7,55,56]. Given the substantial ceiling effects observed in the PABS, APAS, and PAPS, these survey instruments are particularly useful for identifying older adults with lower perceived benefits of physical activity, poor attitudes, and reduced engagement in physical activity, who may benefit most from targeted or tailored intervention approaches.
Exploratory factor analysis identified two interpretable and theoretically meaningful subscales within each measure, underscoring the multidimensional nature of physical activity perceptions, attitudes, and practices among older adults. Within the PBAS, factors differentiated between General Health Benefits and Specific Health Benefits, suggesting that older adults distinguish broad, socially reinforced beliefs about exercise from more actionable, guideline- and condition-specific knowledge. This distinction may help explain the persistent discordance between high perceived benefit and low physical activity engagement reported in earlier studies [7,53,54,55,56] by identifying which subscale predicts low physical activity engagement. Similarly, the APAS separated Intrinsic Motivational Factors from Extrinsic Motivational Factors, highlighting distinct internal and external pathways that influence attitudes toward physical activity. While external motivating factors predict initiation, intrinsic motivation sustains the maintenance of such activity, consistent with the self-determination theory[57]. Additionally, the PAPS distinguished between General Activity Behavior and Structured Activity Participation, capturing differences between routine, unstructured physical activity and intentional, planned, or monitored physical activity. This differentiation identifies domains of activity that may be more amenable to targeted intervention and system-level support.
Confirmatory factor analysis supported the two-factor structure identified through exploratory analyses for all three instruments, with model fit improving following theoretically justified modifications. The near-perfect correlation between the General Health Benefit and Specific Health Benefit factors indicates that these dimensions are highly related, reflecting that older adults who recognize general benefits of physical activity are also likely to identify the specific benefits with respect to health outcomes and guidelines. Despite this high correlation, we retained the two-factor model because each factor captures conceptually distinct domains relevant for identifying perception profiles that may inform tailored messaging or intervention focus. Consistent with principles of model modification [50], we correlated error items sparingly and only between items with clear conceptual or contextual overlap. Specifically, correlations in the PBAS reflected relationships between physical activity and exercise benefit (K2–K5), general and specific health outcomes (K4–K13; K12–K13), perceived benefit and specific cognitive or functional outcomes (K5–K9; K3–K6; K3–K8). For the APAS, correlated errors captured overlap between intrinsic enjoyment and social encouragement (A1–A7) and between perceived importance of exercise and social facilitation (A2–A7). For the Physical Activity Practice Scale, correlations reflected overlap between general activity frequency and duration (P1–P3) and between strength training and participation in structured or guided activity (P2–P5; P2–P6). These correlations are consistent with expected method variance arising from conceptual and contextual item similarity [58,59], rather than from model misspecification.
These validated instruments have several practical applications. The PBAS, APAS, and PAPS provide standardized measures to examine determinants of physical activity and assess intervention mechanisms. The subscales allow researchers to identify specific areas—such as gaps in exercise knowledge, differences in intrinsic versus extrinsic motivation, or variations in general versus structured activity engagement—enabling more targeted strategies to support behavior change. Clinically, these surveys can help identify older adults with low engagement in physical activity, including those who understand its benefits but struggle to maintain consistent or structured participation. The observed ceiling effects further highlight the instruments’ utility for targeting individuals with lower perception, less favorable attitudes, or reduced activity levels, who may benefit most from intervention efforts.
Our study has its limitations. Selection bias is possible given our online recruitment strategy, which likely captured a relatively healthy, tech-savvy population with higher baseline physical activity levels and health awareness[60,61]. Consequently, the external validity of these instruments should be further examined in functionally and clinically diverse older adult populations, including those with chronic conditions or functional limitations. Responses to the survey items are self-reported, and the possibility of social desirability bias and recall bias cannot be eliminated[62,63]. The cross-sectional design precludes assessment of test–retest reliability. Despite these limitations, the study has notable strengths. The instruments are grounded in a theory-informed framework, ensuring conceptual rigor. Also, the instruments address an important gap in measuring older adults’ physical activity by capturing perceptions, attitudes, and practices. Additionally, the identification of interpretable subscales allows for nuanced assessment of specific knowledge domains, motivational factors, and types of activity engagement, making the scales particularly useful for informing tailored interventions and evaluating behavior change efforts.
5. Conclusions
The PBAS, APAS, and PAPS are reliable and valid instruments for assessing perceptions, attitudes, and physical activity practices among community-dwelling U.S. older adults. Their multidimensional structure captures both general and specific health benefits, intrinsic and extrinsic attitudes, and general and structured activity behaviors, providing a comprehensive framework for understanding determinants of physical activity among older adults. By filling a critical gap in measurement, these tools can inform research, screening, and the development of more personalized and targeted strategies to promote healthy aging through sustained physical activity.
Author Contributions
Conceptualization, O.A; Methodology, O.A.; Software, O.A., Formal Analysis, O.A.; Data Curation, O.A.; Writing – Original Draft Preparation, O.A.; Writing – Review & Editing, O.A., D.B, J.C.; Visualization, O.A.; Supervision, J.C., D.B.
Funding
This research received no external funding.
Institutional Review Board Statement
This study was reviewed and approved by the NYU Langone Health Institutional Review Board (IRB#: i25-00450, 08/21/2025).
Informed Consent Statement
Informed consent was obtained from all subjects involved in the study.
Data Availability Statement
The original data presented in the study are openly available in FigShare at 10.6084/m9.figshare.30953792.
Conflicts of Interest
The authors declare no conflicts of interest.
Abbreviations
The following abbreviations are used in this manuscript:
| PBAS | Physical Activity Benefits Scale |
| APAS | Attitudes toward Physical Activity Scale |
| PAPS | Physical Activity Practice Scale |
| KAP | Knowledge, Attitudes, and Practices |
| U.S. | United States |
| I-CVI | Item Content Validity Index |
| S-CVI | Scale Content Validity Index |
| CFI | Comparative Fit Index |
| TLI | Tucker–Lewis Index |
| NFI | Normed Fit Index |
| RMSEA | Root Mean Square Error of Approximation |
| GHB | General Health Benefit |
| SHB | Specific Health Benefit |
| IMF | Intrinsic Motivational Factor |
| EMF | Extrinsic Motivational Factor |
| GAB | General Physical Activity Behavior |
| SAP | Structured Physical Activity Participation |
| α | Cronbach’s alpha |
| κ | Cohen’s kappa statistic |
References
- McPhee, J.S.; French, D.P.; Jackson, D.; Nazroo, J.; Pendleton, N.; Degens, H. Physical activity in older age: perspectives for healthy ageing and frailty. Biogerontology 2016, 17, 567-580. [CrossRef]
- Centers for Disease Control and Prevention. MMWR Data Highlight: Physical Inactivity Among Adults 50 Years and Older. Available online: https://archive.cdc.gov/www_cdc_gov/physicalactivity/inactivity-among-adults-50plus/mmwr-data-highlights.pdf (accessed on.
- Strain, T.; Flaxman, S.; Guthold, R.; Semenova, E.; Cowan, M.; Riley, L.M.; Bull, F.C.; Stevens, G.A. National, regional, and global trends in insufficient physical activity among adults from 2000 to 2022: a pooled analysis of 507 population-based surveys with 5·7 million participants. Lancet Glob Health 2024, 12, e1232-e1243. [CrossRef]
- Nocon, M.; Hiemann, T.; Müller-Riemenschneider, F.; Thalau, F.; Roll, S.; Willich, S.N. Association of physical activity with all-cause and cardiovascular mortality: a systematic review and meta-analysis. Eur J Cardiovasc Prev Rehabil 2008, 15, 239-246. [CrossRef]
- Thibaud, M.; Bloch, F.; Tournoux-Facon, C.; Brèque, C.; Rigaud, A.S.; Dugué, B.; Kemoun, G. Impact of physical activity and sedentary behaviour on fall risks in older people: a systematic review and meta-analysis of observational studies. European Review of Aging and Physical Activity 2012, 9, 5-15. [CrossRef]
- Lin, Y.H.; Chen, Y.C.; Tseng, Y.C.; Tsai, S.T.; Tseng, Y.H. Physical activity and successful aging among middle-aged and older adults: a systematic review and meta-analysis of cohort studies. Aging (Albany NY) 2020, 12, 7704-7716. [CrossRef]
- Adeyemi, O.; Chippendale, T.; Ogedegbe, O.; Boatright, D.; Chodosh, J. Activity Intensity and All-Cause Mortality Following Fall Injury Among Older Adults: Results from a 12-Year National Survey. Healthcare 2025, 13. [CrossRef]
- Bhattacharyya, M.; Miller, L.E.; Miller, A.L.; Bhattacharyya, R.; Herbert, W.G. Disparities in adherence to physical activity guidelines among US adults: A population-based study. Medicine 2024, 103, e39539. [CrossRef]
- Taylor, A.H.; Cable, N.T.; Faulkner, G.; Hillsdon, M.; Narici, M.; Van Der Bij, A.K. Physical activity and older adults: a review of health benefits and the effectiveness of interventions. J Sports Sci 2004, 22, 703-725. [CrossRef]
- Agbangla, N.F.; Séba, M.-P.; Bunlon, F.; Toulotte, C.; Fraser, S.A. Effects of Physical Activity on Physical and Mental Health of Older Adults Living in Care Settings: A Systematic Review of Meta-Analyses. International Journal of Environmental Research and Public Health 2023, 20, 6226. [CrossRef]
- Duijvestijn, M.; de Wit, G.A.; van Gils, P.F.; Wendel-Vos, G.C.W. Impact of physical activity on healthcare costs: a systematic review. BMC Health Serv Res 2023, 23, 572. [CrossRef]
- Brown, W.J.; McLaughlin, D.; Leung, J.; McCaul, K.A.; Flicker, L.; Almeida, O.P.; Hankey, G.J.; Lopez, D.; Dobson, A.J. Physical activity and all-cause mortality in older women and men. Br J Sports Med 2012, 46, 664-668. [CrossRef]
- Moshkovits, Y.; Chetrit, A.; Dankner, R. Self-reported physical activity properties and 20-year all-cause and cardiovascular mortality among community-dwelling older adults. Postgraduate medical journal 2025, 101, 108-115. [CrossRef]
- World Health Organization. WHO guidelines on physical activity and sedentary behaviour: at a glance. Available online: https://www.who.int/europe/publications/i/item/9789240014886 (accessed on.
- U.S. Department of Health and Human Services. Physical Activity Guidelines for Americans. 2018.
- National Center for Health Statistics. Characteristics of Older Adults Who Met Federal Physical Activity Guidelines for Americans: United States, 2022. National Health Statistics Reports 2024.
- Rivera-Torres, S.; Fahey, T.D.; Rivera, M.A. Adherence to Exercise Programs in Older Adults: Informative Report. Gerontol Geriatr Med 2019, 5, 2333721418823604. [CrossRef]
- Dijkstra, F.; van der Sluis, G.; Jager-Wittenaar, H.; Hempenius, L.; Hobbelen, J.S.M.; Finnema, E. Facilitators and barriers to enhancing physical activity in older patients during acute hospital stay: a systematic review. International Journal of Behavioral Nutrition and Physical Activity 2022, 19, 99. [CrossRef]
- Meredith, S.J.; Cox, N.J.; Ibrahim, K.; Higson, J.; McNiff, J.; Mitchell, S.; Rutherford, M.; Wijayendran, A.; Shenkin, S.D.; Kilgour, A.H.M.; et al. Factors that influence older adults’ participation in physical activity: a systematic review of qualitative studies. Age and Ageing 2023, 52, afad145. [CrossRef]
- Buttery, A.K.; Martin, F.C. Knowledge, attitudes and intentions about participation in physical activity of older post-acute hospital inpatients. Physiotherapy 2009, 95, 192-198. [CrossRef]
- Pienaar, P.E.; De Swardt, M.; De Vries, M.; Roos, H.; Joubert, G. Physical activity knowledge, attitudes and practices of the elderly in Bloemfontein old age homes. South African Family Practice 2004, 46, 17-19. [CrossRef]
- Cavill, N.A.; Foster, C.E.M. Enablers and barriers to older people’s participation in strength and balance activities: A review of reviews. J Frailty Sarcopenia Falls 2018, 3, 105-113. [CrossRef]
- Markland, D.; Tobin, V. A Modification to the Behavioural Regulation in Exercise Questionnaire to Include an Assessment of Amotivation. Journal of Sport and Exercise Psychology 2004, 26, 191-196. [CrossRef]
- Craig, C.L.; Marshall, A.L.; SjÖStrÖM, M.; Bauman, A.E.; Booth, M.L.; Ainsworth, B.E.; Pratt, M.; Ekelund, U.L.F.; Yngve, A.; Sallis, J.F.; et al. International Physical Activity Questionnaire: 12-Country Reliability and Validity. Medicine & Science in Sports & Exercise 2003, 35.
- Fuchs, R., & Schwarzer, R. . Selbstwirksamkeit zur sportlichen Aktivität: Reliabilität und Validität eines neuen Me[sinstruments [Self-efficacy toward physical exercise: Reliability and validity of a new instrument]. Zeitschrift für Differentielle und Diagnostische Psychologi 1994, 15, 141–154.
- Liu, S.-H.; Morais, S.A.; Lapane, K.L.; Kay, J. Physical activity and attitudes and perceptions towards physical activity in patients with spondyloarthritis: A systematic review. Seminars in Arthritis and Rheumatism 2020, 50, 289-302. [CrossRef]
- Sechrist, K.R.; Walker, S.N.; Pender, N.J. Development and psychometric evaluation of the exercise benefits/barriers scale. Research in Nursing & Health 1987, 10, 357-365.
- Akdeniz, K.A.; Ayar, D.; Bektas, İ.; Bektas, M. Predicting the effect of healthy lifestyle belief on attitude toward nutrition, exercise, physical activity, and weight-related self-efficacy in Turkish adolescents. Arch Pediatr 2022, 29, 44-50. [CrossRef]
- Avraham, R.; Simon-Tuval, T.; Van Dijk, D. Determinants of physical activity habit formation: a theory-based qualitative study among young adults. Int J Qual Stud Health Well-being 2024, 19, 2341984. [CrossRef]
- Gumicio, S.; Merica, M.; Luhman, N.; Fauvel, G.; Zompi, S.; Ronsse, A. The KAP Survey Model (Knowledge, Attitudes & Practices). Available online: https://issuu.com/medecinsdumonde/docs/47-the-kap-survey-model-knowledge-a (accessed on.
- Maduakolam, I.O.; Osude, C.P.; Ede, S.S.; Onyekachi-Chigbu, A.C.; Osuorah, C.S.; Okoh, C.F. Knowledge, Attitude and Practice of Physical Exercise Among Elderly People in Enugu Metropolis, Nigerian. Physical Activity and Health 2023. [CrossRef]
- ResearchMatch. What is ResearchMatch? Available online: https://www.researchmatch.org/ (accessed on 11/22/2025).
- Harris, P. Research Electronic Data Capture (REDCap). Journal of the Medical Library Association 2018. [CrossRef]
- Harris, P.A.; Taylor, R.; Thielke, R.; Payne, J.; Gonzalez, N.; Conde, J.G. Research electronic data capture (REDCap)--a metadata-driven methodology and workflow process for providing translational research informatics support. J Biomed Inform 2009, 42, 377-381. [CrossRef]
- Fox-Wasylyshyn, S.M.; El-Masri, M.M. Handling missing data in self-report measures. Res Nurs Health 2005, 28, 488-495. [CrossRef]
- Polit, D.F.; Beck, C.T. The content validity index: are you sure you know what’s being reported? Critique and recommendations. Research in nursing & health 2006, 29, 489-497. [CrossRef]
- McHugh, M.L. Interrater reliability: the kappa statistic. Biochem Med (Zagreb) 2012, 22, 276-282. [CrossRef]
- Terwee, C.B.; Bot, S.D.; de Boer, M.R.; van der Windt, D.A.; Knol, D.L.; Dekker, J.; Bouter, L.M.; de Vet, H.C. Quality criteria were proposed for measurement properties of health status questionnaires. J Clin Epidemiol 2007, 60, 34-42. [CrossRef]
- McGahee, T.W.; Ball, J. How to read and really use an item analysis. Nurse educator 2009, 34, 166-171, doi:doi: 10.1097/NNE.0b013e3181aaba94.
- Metsämuuronen, J. Underestimation of the item discrimination power and Somers’ D as an alternative for the item-total-and item-rest correlations. Preprint 2019, 2, doi:doi. org/10.13140/RG.
- Nunnally, J.C.; Bernstein, I. Psychometric theory, 2nd ed.; MacGraw-Hill: New York, 1978.
- Knapp, T.R. Coefficient alpha: conceptualizations and anomalies. Res Nurs Health 1991, 14, 457-460. [CrossRef]
- Tavakol, M.; Dennick, R. Making sense of Cronbach’s alpha. International journal of medical education 2011, 2, 53.
- Taber, K.S. The Use of Cronbach’s Alpha When Developing and Reporting Research Instruments in Science Education. Research in Science Education 2018, 48, 1273-1296. [CrossRef]
- Adeyemi, O.J. Mobile phone use while driving: Development and validation of knowledge, attitude, and practice survey instruments. Journal of Safety Research 2021. [CrossRef]
- Adeyemi, O.; Bouillon Minois, J.-B.; Siman, N.; Cuthel, A.; Goldfeld, K.; Grudzen, C. Knowledge and Attitudes toward Hospice and Palliative Care: Instrument Validation among Emergency Providers. American Journal of Hospice and Palliative Medicine 2022. [CrossRef]
- Yusufov, M.; Adeyemi, O.; Flannery, M.; Bouillon-Minois, J.B.; Van Allen, K.; Cuthel, A.M.; Goldfeld, K.S.; Ouchi, K.; Grudzen, C.R. Psychometric Properties of the Functional Assessment of Cancer Therapy-General for Evaluating Quality of Life in Patients With Life-Limiting Illness in the Emergency Department. J Palliat Med 2024, 27, 63-74. [CrossRef]
- Hu, L.t.; Bentler, P.M. Cutoff criteria for fit indexes in covariance structure analysis: Conventional criteria versus new alternatives. Structural equation modeling: a multidisciplinary journal 1999, 6, 1-55. [CrossRef]
- Byrne, B. Structural Equation Modeling with AMOS: Basic Concepts, Applications, and Programming.; Taylor & Francis Group: New York, USA:, 2010; Volume Second edition.
- Whittaker, T.A. Using the Modification Index and Standardized Expected Parameter Change for Model Modification. The Journal of Experimental Education 2012, 80, 26-44.
- IBM Corp. IBM SPSS Statistics for Windows. Available online: https://www-01.ibm.com/support/docview.wss?uid=swg21476197 (accessed on 07/03/2022).
- Arbuckle, J.L. IBM SPSS Amos, 27; IBM SPSS: Chicago, 2016.
- Rovzar, C.M.; Tee, S.; Calvachi, P.; Ganapathy, A.; Knauer, A.; Brezoczky, K.; Phelan, E.A.; Kado, D.M. Knowledge, attitudes, and beliefs about balance among adults in the United States. SAGE Open Med 2025, 13, 20503121251374966. [CrossRef]
- Jancey, J.M.; Clarke, A.; Howat, P.; Maycock, B.; Lee, A.H. Perceptions of physical activity by older adults: A qualitative study. Health Education Journal 2009, 68, 196-206. [CrossRef]
- Troutman-Jordan, M.; O’Brien, T.; Keaton, M. Older Adults’ Views and Attitudes on Physical Activity; Reasons to Participate and Abstain. J Community Health Nurs 2021, 38, 232-243. [CrossRef]
- Keadle, S.K.; McKinnon, R.; Graubard, B.I.; Troiano, R.P. Prevalence and trends in physical activity among older adults in the United States: A comparison across three national surveys. Prev Med 2016, 89, 37-43. [CrossRef]
- Bandhu, D.; Mohan, M.M.; Nittala, N.A.P.; Jadhav, P.; Bhadauria, A.; Saxena, K.K. Theories of motivation: A comprehensive analysis of human behavior drivers. Acta Psychologica 2024, 244, 104177. [CrossRef]
- Pace, V.L. Method Variance From the Perspectives of Reviewers: Poorly Understood Problem or Overemphasized Complaint? Organizational Research Methods 2009, 13, 421-434. [CrossRef]
- Podsakoff, P.M.; MacKenzie, S.B.; Lee, J.Y.; Podsakoff, N.P. Common method biases in behavioral research: a critical review of the literature and recommended remedies. J Appl Psychol 2003, 88, 879-903. [CrossRef]
- Whiteley, S. Total Survey Error & Institutional Research: A Case Study of the University Experience Survey. Australasian Association for Institutional Research 2014.
- Rojas-Saunero, L.P.; Glymour, M.M.; Mayeda, E.R. Selection Bias in Health Research: Quantifying, Eliminating, or Exacerbating Health Disparities? Curr Epidemiol Rep 2024, 11, 63-72. [CrossRef]
- Althubaiti, A. Information bias in health research: definition, pitfalls, and adjustment methods. J Multidiscip Healthc 2016, 9, 211-217. [CrossRef]
- Van de Mortel, T.F. Faking it: social desirability response bias in self-report research. Australian Journal of Advanced Nursing, The 2008, 25, 40.
Disclaimer/Publisher’s Note: The statements, opinions and data contained in all publications are solely those of the individual author(s) and contributor(s) and not of MDPI and/or the editor(s). MDPI and/or the editor(s) disclaim responsibility for any injury to people or property resulting from any ideas, methods, instructions or products referred to in the content. |
© 2026 by the authors. Licensee MDPI, Basel, Switzerland. This article is an open access article distributed under the terms and conditions of the Creative Commons Attribution (CC BY) license (http://creativecommons.org/licenses/by/4.0/).
Copyright: This open access article is published under a Creative Commons CC BY 4.0 license, which permit the free download, distribution, and reuse, provided that the author and preprint are cited in any reuse.


