
Submitted:
19 January 2026
Posted:
21 January 2026
You are already at the latest version
Abstract
Background/Objectives: Macrophages polarized into M1 and M2 phenotypes differentially regulate immune and drug responses. Despite their distinct functional roles, differences in UDP-glucuronosyltransferase (UGT) expression and activity between M1 and M2 macrophages remain poorly understood. This study aimed to characterize differential UGT expression in M1 and M2 macrophages and to elucidate how UGT-mediated prostaglandin E2 (PGE2) glucuronidation modulates macrophage inflammatory responses. Methods: THP-1 cells were chemically differentiated into macrophages (M0) and subsequently polarized into M1 and M2 phenotypes. UGT expression profiles were assessed using RT-PCR, quantitative RT-PCR, and Western blotting. UGT enzymatic activity was compared by quantifying glucuronide metabolites derived from UGT-specific substrates using LC-MS/MS, along with measurement of free PGE2 and PGE2-glucuronide by ELISA. Pro-inflammatory cytokine expression and secretion in M1 macrophages were quantified using quantitative RT-PCR and ELISA. Results: UGT1A1, UGT1A4, UGT1A5, UGT1A9, and UGT2B7 were markedly upregulated in M1 compared with M2 macrophages at both the mRNA and protein levels. UGT enzymatic activity was significantly higher in M1 macrophages (p < 0.01) and was attenuated in a concentration-dependent manner by the UGT inhibitor diclofenac. Enhanced UGT activity in M1 macrophages was reflected by increased formation of estradiol-3-glucuronide and naloxone-3-glucuronide (both p < 0.01). Furthermore, PGE2 glucuronidation was more pronounced in M1 macrophages, and inhibition of UGTs with atazanavir reduced PGE2-glucuronide formation and pro-inflammatory cytokine production, including IL-1β, IL-6, and TNF-α. Conclusion: UGT-mediated PGE2 glucuronidation in M1 macrophages plays a critical role in sustaining pro-inflammatory cytokine responses. These findings identify UGTs as important regulators of macrophage phenotype and inflammatory signaling.
Keywords:
macrophages
; UGTs
; glucuronidation
; PGE2
; inflammation
1. Introduction
Macrophages are fundamental components of the innate immune system and play critical roles in host defense and immune regulation [1]. Among their heterogeneous populations, M1 and M2 macrophages are recognized as the two predominant phenotypes, each exhibiting distinct functional characteristics [2]. M1 macrophages are classically activated cells characterized by strong pro-inflammatory activity and potent anti-microbial functions, contributing to the initiation and amplification of immune responses during infection and tissue injury [3]. In contrast, M2 macrophages are alternatively activated and primarily exert anti-inflammatory effects, facilitating tissue repair, wound healing, and resolution of inflammation [4]. The dynamic balance between M1 and M2 macrophages is crucial for maintaining immune homeostasis, and its dysregulation is implicated in various pathological conditions, including chronic inflammatory diseases and tumor progression [5].
Despite extensive research on macrophage polarization, the role of UDP-glucuronosyltransferases (UGTs) in macrophage biology remains largely unexplored. UGTs are phase II metabolic enzymes predominantly expressed in the liver and are responsible for the detoxification and elimination of a broad spectrum of xenobiotics through glucuronidation [6]. In addition to drug metabolism, UGTs also regulate endogenous substrates, including fatty acids, lipids, and steroid hormones, thereby influencing cellular signaling pathways and physiological functions [7]. Although UGT expression and activity have been well characterized in hepatic tissues, their expression profiles and functional relevance in M1 and M2 macrophages are not well defined [8,9].
Prostaglandin E2 (PGE2) is a key lipid mediator that modulates immune and inflammatory responses in macrophages [10]. PGE2 promotes vasodilation during the early phase of inflammation and regulates the activity of various immune cells, including neutrophils, macrophages, dendritic cells, and mast cells [11]. It enhances the production of the anti-inflammatory cytokine interleukin-10 (IL-10) while suppressing pro-inflammatory cytokines such as IL-1β, IL-6, and tumor necrosis factor alpha (TNF-α) [12]. Although pharmacological strategies targeting PGE2 synthesis, such as corticosteroids and nonsteroidal anti-inflammatory drugs (NSAIDs), are widely used, their adverse effects and limited efficacy in chronic inflammation underscore the need for alternative regulatory mechanisms [13]. Notably, UGTs can inactivate PGE2 through glucuronidation, thereby reducing its bioavailability [14]. Given that UGT-mediated metabolism modulates intracellular levels of bioactive lipids and hormones [7], glucuronidation of PGE2 may represent an important mechanism controlling macrophage inflammatory function.
Therefore, this study aimed to investigate UGT expression patterns in M1 and M2 macrophages and to elucidate the role of UGT-mediated PGE2 glucuronidation in regulating inflammatory cytokine responses. Our findings suggest that macrophage UGTs may serve as novel modulators of inflammation and potential therapeutic targets in inflammatory diseases.
2. Materials and Methods
2.1. Chemicals and Reagent
All chemicals and reagents were procured from Sigma-Aldrich (St. Louis, MO, USA) unless otherwise stated. Phorbol 12-myristate 13-acetate (PMA) was used to differentiate THP-1 cells into M0 macrophages. Lipopolysaccharide (LPS) and human interferon gamma (IFN-γ) were utilized to polarize M0 into M1 macrophages. Recombinant human interleukin-4 (IL-4) and IL-13 were employed for M2 macrophage polarization. Diclofenac and atazanavir (ATZ) served as the UGT inhibitor in our experiments.
2.2. Macrophage Culture, Differentiation and Polarization
The culture of macrophages and their polarization into M1 and M2 cells were performed using methods previously established in our laboratory [15]. Briefly, THP-1 cells were maintained in RPMI 1640 medium supplemented with 10% fetal bovine serum (FBS), 2-mercaptoethanol (0.05 mM) and 1% penicillin-streptomycin. For differentiation into M0 macrophages, THP-1 cells were treated with PMA (200 ng/mL) for 24 hours. To further polarize into M1, M0 macrophages were exposed to LPS (100 ng/mL) and human IFN-γ (20 ng/mL) for 24 hours. For M2 polarization, M0 macrophages were treated with recombinant human IL-4 and IL-13 (both at 20 ng/mL) for 24 hours.
2.3. Reverse Transcription Polymerase Chain Reaction (RT-PCR) and Quantitative Real-Time PCR (qRT-PCR)
Total RNA was isolated from the cells using TRIzol reagent (Invitrogen, Carlsbad, CA, USA). Approximately 1 μg of RNA was reverse transcribed using the iScript cDNA Synthesis Kit (Bio-Rad Laboratories, Hercules, CA, USA). RT-PCR was first performed to determine which UGT genes were expressed among all UGTs. Synthesized cDNA was subjected to PCR amplification in a 50 μL reaction volume containing 10 mM dNTPs, 25 mM MgCl2, and 10 pmol of both the forward and reverse primers (Supplementary Table S1). qRT-PCR was then performed with CFX96 Touch Real-Time PCR Detection System (Bio-Rad Laboratories) using TaqMan probe sets for GAPDH (catalogue number Hs02786624_m1), UGT1A1 (catalogue number Hs00426380_m1), UGT 1A4 (catalogue number Hs01655285_s1), UGT1A5 (catalogue number Hs01374521_s1), UGT1A9 (catalogue number Hs02516855_s1), UGT2B7 (catalogue number Hs00426592_m1), IL-1β (catalogue number Hs01555410_m1), IL-6 (catalogue number Hs00174131_m1), and TNF-α (catalogue number Hs00174128_m1) acquired from Thermo Fisher Scientific (Waltham, MA, USA). The relative expression of genes was normalized to GAPDH using the 2^-ΔΔCt method [16].
2.4. Western Blotting
Cells were lysed using RIPA buffer supplemented with protease and phosphatase inhibitors. Protein concentrations were measured using the BCA Protein Assay Kit (Pierce Biotechnology, Rockford, IL, USA). Samples were then resolved on SDS-PAGE and transferred to nitrocellulose membranes. Membranes were blocked with 5% BSA and incubated overnight at 4℃. Primary antibodies against UGT1A1, UGT1A4, UGT1A9, and UGT2B7 were used at a dilution of 1:1000 (Abcam, Cambridge, UK). After washing, membranes were incubated with HRP-conjugated secondary antibodies. Bands were visualized using ECL detection system and images were captured using a ChemiDoc Imaging System (Bio-Rad Laboratories).
2.5. UGT Activity Assay Using Fluorescence-Based Detection System
After harvesting M1 and M2 macrophages, membrane fractions were extracted according to previously described methods [15]. UGT activity was measured using a fluorescence-based UGT activity assay according to the manufacturer’s instructions (Abcam). Briefly, membrane protein (500 μg) was added to the appropriate wells of a black 96-well plate, followed by the addition of reaction mixes including UGT substrates and assay buffer. The reaction was initiated by the addition of UDP-glucuronic acid (UDPGA). Fluorescence was immediately measured in kinetic mode for 40 min at 37℃ with excitation and emission wavelengths set at 415 and 502 nm, respectively (Molecular Devices, San Jose, CA, USA).
2.6. UGT Activity Assay Using LC/MS-MS
Selective enzymatic activities of UGT1A1 and UGT2B7 were measured independently using β-estradiol [17] and naloxone [18], respectively, as isoform-specific substrates in microsomes prepared from harvested cells. Reactions were initiated by the addition of NADPH and UDPGA and reaction mixture were analyzed by LC-MS/MS after 1 h of incubation using an API 5500 system (Applied Biosystems, Foster City, CA, USA) coupled to an Agilent 1290 high-performance liquid chromatography system. Estradiol-3-glucuronide was detected in negative ion mode using the transition m/z 447.0→271.0, with estrone glucuronide (m/z 445.0→269.0) used as the internal standard. Naloxone-3-glucuronide was detected in positive ion mode by monitoring the transition m/z 504.0→310.0 as previously described [19]. Peak areas were automatically integrated using Analyst software (version 1.4).
2.7. ELISA Assay
Cells were treated with arachidonic acid (ARA) in the presence or absence of ATZ, and culture media were collected at 3, 6, and 24 h after treatment for subsequent analyses. Concentration of PGE2 in culture media were quantified using a Prostaglandin E2 Parameter Assay Kit (R&D Systems, Minneapolis, MN, USA) according to the manufacturer’s instructions [20]. For the quantification of PGE2-glucuronide, samples were enzymatically digested with β-glucuronidase. Levels of IL-1β, IL-6, and TNF-α were quantified using Human Quantikine ELISA Kit (R&D Systems) in accordance with the manufacturer’s instructions [21].
2.8. Statistical Analysis
All experiments were performed in triplicate, and data are presented as mean ± standard deviation. Comparison between two groups were made using Student’s t-test, while comparisons among multiple groups utilized one-way ANOVA followed by post-hoc Tukey test. A p value of less than 0.05 was considered statistically significant. All statistical analyses were carried out using GraphPad Prism software (Version 8.0).
3. Results
3.1. UGT Expression Profiles
THP-1 cells were cultured under optimized conditions and subsequently differentiated into diverse macrophage phenotypes upon appropriate stimulation (Figure 1A). Specifically, THP-1 cells were differentiated into a macrophage phenotype (M0) through PMA treatment as previously described [22]. The M0 macrophages were then polarized into M1 macrophages upon exposure to LPS and human IFN-γ [23], evident from the sharpened cell morphology. On the other hand, treatment with recombinant human IL-4 and IL-13 transformed M0 into M2 macrophages [24], characterized by their flattened shape (Figure 1B). To determine whether macrophage differentiation and polarization alter UGT expression, RT-PCR was performed in M0, M1, and M2 macrophages. Higher UGT mRNA expressions were observed in M1 compared with other cell types examined in this analysis, particularly for UGT1A1, UGT1A4, UGT1A5, UGT1A9, UGT2B4, UGT2B10, and UGT2B15 (Figure 1C), indicating distinct UGT mRNA expression patterns across macrophage types.
Based on these results, UGT isoforms showing the greatest differences between M1 and M2 macrophages were selected for further validation. qRT-PCR analysis confirmed that mRNA expression levels of UGT1A1, UGT1A4, UGT1A5, UGT1A9, and UGT2B7 were significantly higher in M1 compared with M2 macrophages (Figure 2A-E). Consistent with these results, Western blot analysis showed increased protein expression of UGT1A1, UGT1A4, UGT1A9, and UGT2B7 in M1 macrophages, indicating that macrophage polarization is associated with differential regulation of UGT expressions.
3.2. UGT Enzymatic Activity in M1 and M2 Macrophages
Beyond expression levels, differences in UGT activity between M1 and M2 macrophages were analyzed. In the assay using a fluorescent substrate for UGT, it was observed that M1 macrophages had significantly higher UGT activity compared with M2 counterparts (p < 0.01) (Figure 3A). To ensure the specificity of UGT activity, a known UGT inhibitor, diclofenac was treated in the catalytic reaction [25]. As anticipated, the UGT activity reduced in a concentration-dependent manner in the presence of diclofenac (p < 0.001) (Figure 3B). To further probe the functional implications of UGT expression differences in these macrophages, the formation of glucuronidated metabolites produced by specific UGT isoforms were analyzed using LC-MS/MS as described previously [19]. Estradiol-3-glucuronide, a metabolite specifically produced by UGT1A1 [17] (Figure 3C) were examined in M1 and M2 macrophages. Comparison of estradiol-3-glucuronide production showed a 4-fold difference in metabolic capacity in M1 compared with M2 macrophages (p < 0.01) (Figure 3D). The formation of the UGT2B7-selective metabolite naloxone-3-glucuronide (Figure 3E) [18] was also significantly higher in M1 compared with M2 macrophages (p < 0.05) (Figure 3F). However, the difference in activity of UGT2B7 between M1 and M2 macrophages was not markedly greater than that of UGT1A1. Overall, higher UGT activity was consistently observed in M1 macrophages, accompanied by predominant UGT expression patterns.
3.3. Impact of UGT-Mediated PGE2 Glucuronidation in M1 Macrophages
The difference in UGT activity between M1 and M2 macrophages was further evident from the extent of glucuronidation of PGE2, an immunoregulatory lipid mediator [10]. Upon treatment with ARA, the precursor of PGE2 [26], comparable levels of free PGE2 were detected in both macrophage phenotypes (Figure 4A), while PGE2-glucuronide levels were higher in M1 compared with M2 macrophages (Figure 4B). Using ATZ as a UGT inhibitor [27], PGE2-glucuronide levels were decreased (Figure 4B), while free PGE2 levels were increased (Figure 4A) in both M1 and M2 macrophages, indicating the role of UGTs in the regulation of PGE2 levels in these macrophages. To further elucidate the role of UGTs in PGE2 metabolism in M1 macrophages, a time-course quantitation was performed. Following ATZ treatment, free PGE2 concentrations were higher at each time point than under ARA-only conditions (Figure 4C), whereas PGE2-glucuronide concentrations were lower (Figure 4D), indicating that UGTs contribute to the regulation of PGE2 metabolism.
3.4. Effect of UGT Inhibition on Pro-Inflammatory Markers in M1 Macrophages
Finally, considering the association between PGE2 and pro-inflammatory responses, it was investigated whether UGT activity inhibition affects pro-inflammatory markers within M1 macrophages. Upon ATZ treatment, mRNA levels of pro-inflammatory cytokines, including IL-1β, IL-6, and TNF-α, were significantly reduced in M1 macrophages (Figure 5A-C). Consistent with these transcriptional changes, protein levels of IL-1β, IL-6, and TNF-α were also decreased following ATZ treatment (Figure 5D-F).
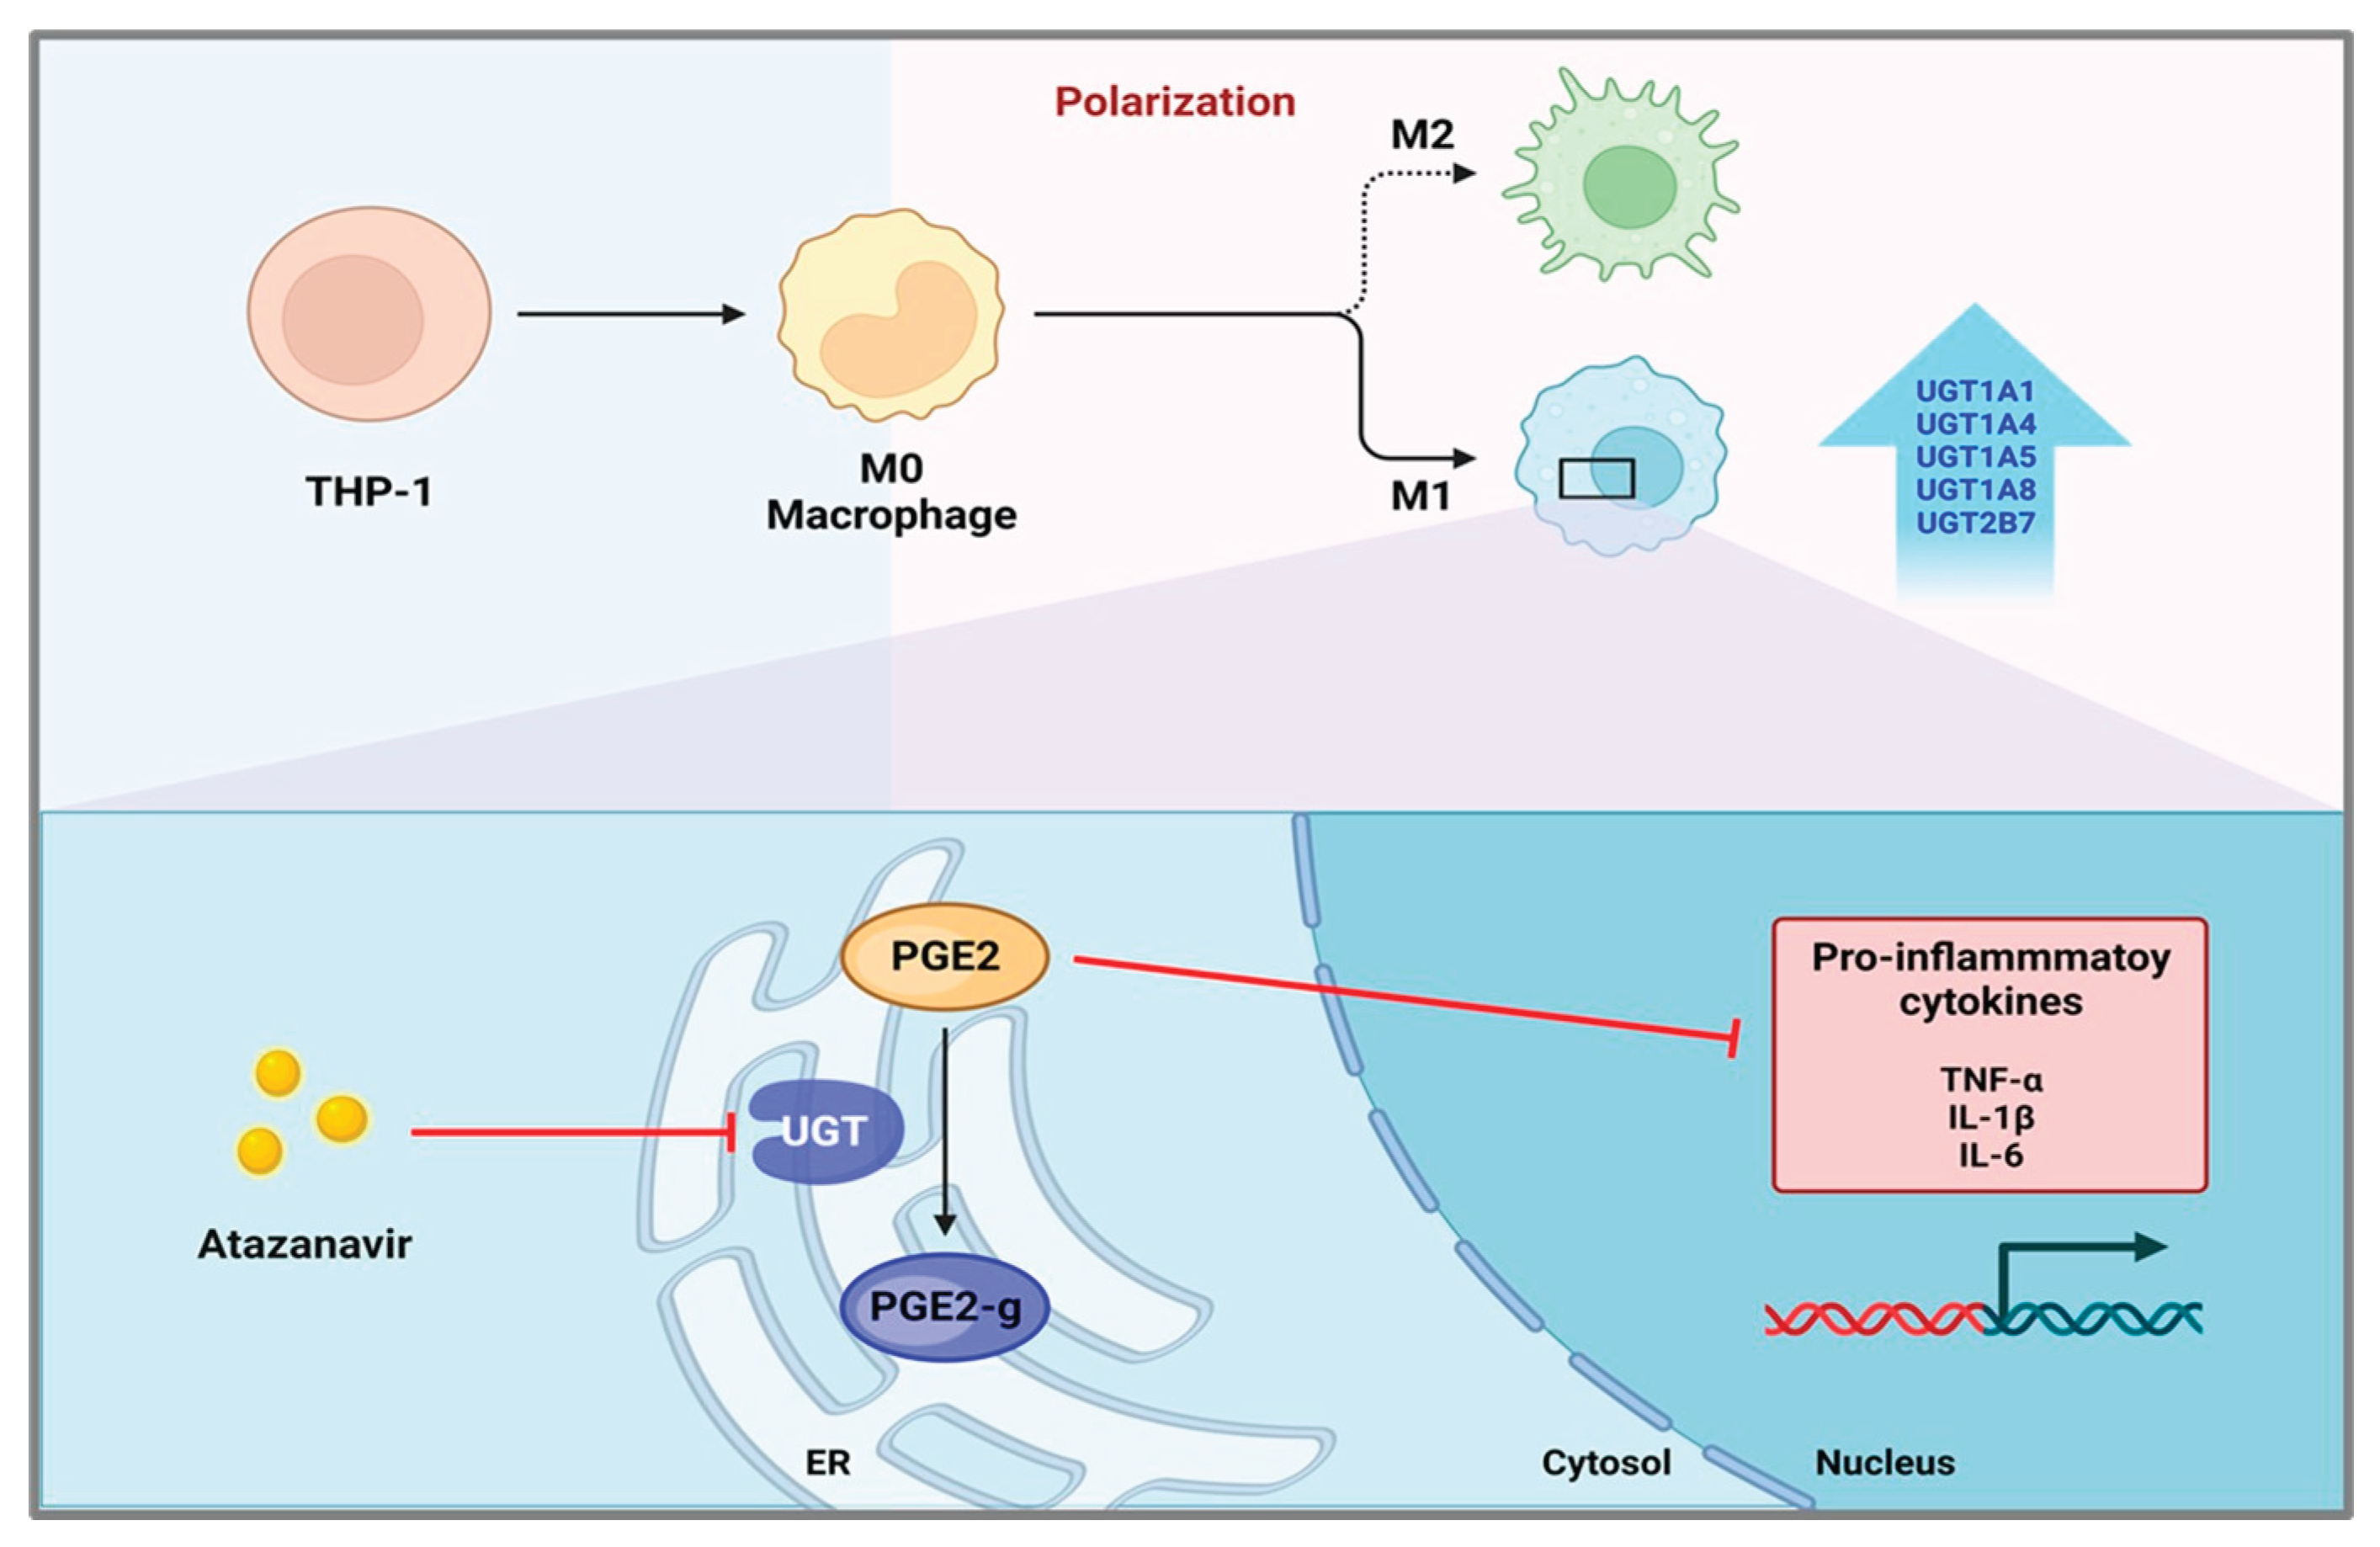
Taken together, these findings demonstrate that UGT inhibition attenuates the pro-inflammatory phenotype of M1 macrophages, in association with altered PGE2 metabolism and downstream inflammatory signaling, as illustrated in Figure 6.
4. Discussion
The present study provides novel evidence that M1 and M2 macrophages differ substantially in UGT expression, enzymatic activity, and the regulation of downstream inflammatory signaling. Notably, M1 macrophages markedly upregulated expression of UGT1A1, UGT1A4, UGT1A5, UGT1A9, and UGT2B7, accompanied by heightened glucuronidation activity toward prototype substrates, compared with M2 macrophages. Given that PGE2 is known as a representative signaling molecule that regulates cell differentiation and inflammatory responses in macrophages [28,29], the present study investigated the effects of differences in UGT-mediated PGE2 glucuronidation between M1 and M2 macrophages on inflammatory responses. Enhanced UGT-mediated metabolism of PGE2 in M1 macrophages resulted in reduced levels of free PGE2, thereby enabling sustained high production of pro-inflammatory cytokines such as IL-1β, IL-6, and TNF-α, which amplify inflammatory signaling, promote immune cell recruitment, and stabilize the M1 pro-inflammatory phenotype [30]. These findings significantly advance understanding of UGTs in macrophages beyond their role in traditional xenobiotic metabolism, unveiling a previously unrecognized function in the metabolic control of inflammatory mediators such as PGE2.
The substantially higher mRNA and protein expressions of the UGT1A and UGT2B enzymes in M1 compared with M2 macrophages provide insights into the functional characteristics of these two activated macrophage phenotypes. This observation is consistent with previous findings, which demonstrated the induction of UGT1A1 and UGT1A7 in rat macrophages following LPS stimulation [23]. The differential expression of UGTs appears to reflect the distinct phenotypes and functional specialization between M1 and M2 macrophages, with UGT induction in M1 macrophages being functionally aligned with their classical role in enhancing the clearance of toxins and xenobiotics during infection [31]. In contrast, alternatively activated M2 macrophages, which are specialized for tissue repair and regeneration, exhibit comparatively lower UGT expression, consistent with a functional state oriented toward wound healing rather than xenobiotic metabolism. Comprehensive profiling of UGT isoforms during dynamic macrophage polarization could elucidate new subtype-specific roles.
The heightened UGT expression in M1 macrophages was accompanied by increased catalytic activity, evidenced by greater formation of the prototype glucuronide metabolites estradiol-3-glucuronide and naloxone-3-glucuronide compared with M2 macrophages. This elevated catalytic activity confers enhanced conjugation potential to deactivate endogenous substrates or xenobiotics, thereby facilitating their elimination. Notably, this aligns with previous observations in LPS/IFNγ-polarized M1 macrophages showing induction of genes involved in glutathione biosynthesis and xenobiotic metabolism, reflecting enhanced antioxidant and metabolic-detoxification responses [32,33]. Correspondingly, M2 macrophages have been reported to exhibit attenuated xenobiotic metabolism and antioxidant defenses [34], consistent with their reduced UGT expression and glucuronidation capacity. These differences collectively suggest that UGT could be an important component of the network regulating macrophage polarization.
An important consequence of heightened UGT expression in M1 macrophages appears to be increased glucuronidation of PGE2, an endogenous lipid mediator pivotal for immune regulation [10,11,12]. Pharmacological inhibition of UGTs resulted in marked reduction in PGE2-glucuronide accompanied by a concomitant increase in free PGE2 levels, which was associated with decreased pro-inflammatory cytokines IL-1β, IL-6, and TNF-α (Figure 6). These findings suggest that UGT-mediated PGE2 glucuronidation enables M1 macrophages to sustain robust pro-inflammatory signaling. Given that free PGE2 is well recognized for its immunosuppressive effects [10,11,12], its inactivation through glucuronidation may represent a mechanism by which M1 macrophages maintain their pro-inflammatory phenotype. Taken together with previous reports demonstrating a role for PGE2 in regulating M1 and M2 polarization [29], our results indicate that UGTs contribute to macrophage polarization and inflammatory responses by fine-tuning PGE2 availability and downstream signaling pathways.
The current data strongly support a regulatory role for UGTs in shaping inflammatory responses through modulation of PGE2, while potential regulation through other bioactive lipid mediators, including lipoxins, resolvins, and protectins, remains plausible [35,36]. Comprehensive profiling of UGT activity toward additional lipid mediators and associated downstream signaling pathways may further delineate the mechanisms and breadth of UGT involvement during M1 macrophage activation. Modulation of UGT activity, for example through pharmacological induction, could influence macrophage polarization toward a more inflammatory phenotype by altering PGE2 availability. Collectively, these findings demonstrate both the feasibility and therapeutic potential of targeting UGTs to modulate macrophage inflammatory profiles. Previous UGT-focused research has primarily aimed to identify UGT-inducing compounds to enhance the metabolism and elimination of endogenous and exogenous substrates [37]. In the context of inflammation, such inducers may contribute to immune regulation by promoting the clearance of immunosuppressive or pro-resolving mediators, depending on the inflammatory milieu. Although further investigation is required, these advances highlight promising avenues for the development of UGT-targeted immunomodulatory therapies.
Identifying a previously unrecognized role of UGTs in macrophages beyond their canonical function in xenobiotic metabolism would advance current understanding of the multifaceted UGT enzyme system. Our findings demonstrate that UGT expression is closely aligned with macrophage polarization states and that UGT activity actively reinforces pro-inflammatory phenotypes, thereby expanding the biological scope of these enzymes. Although in vitro models may not fully recapitulate the complexity of macrophage phenotypes observed in vivo, the present study provides a conceptual framework for addressing unresolved questions at the intersection of UGT function and macrophage biology. Comprehensive in vivo profiling of UGT expression and activity during macrophage polarization and inflammatory responses will be essential to establish the clinical relevance of UGTs as potential therapeutic targets in inflammatory diseases. While inflammation is a necessary host defense mechanism against infection and external insults, timely resolution requires the effective clearance of pro-inflammatory signaling mediators. Dysregulation of UGT activity, which governs the metabolic inactivation of mediators such as PGE2, may therefore contribute to pathological conditions, including chronic inflammation. Accordingly, our findings underscore the need for careful consideration of pharmacological agents that modulate UGT activity, as such interventions may have unintended effects on the inflammatory microenvironment of macrophages.
In summary, this study provides novel evidence that elevated UGT expression and activity regulate PGE2 glucuronidation and downstream cytokine responses in M1 macrophages. Our findings reveal an unrecognized role for UGTs in modulating the balance between pro- and anti-inflammatory signaling in macrophages through the regulation of PGE2, thereby offering important insight into the functional distinctions between M1 and M2 phenotypes. Further investigation of UGT expression and activity during immune activation in vivo will be critical for defining the physiological relevance of UGT-mediated metabolism. Collectively, this study substantially advances the understanding of UGT biology, an area that has remained largely underappreciated in the context of macrophage function and inflammatory regulation.
Supplementary Materials
The following supporting information can be downloaded at: Preprints.org, Table S1: Primers for RT-PCR.
Author Contributions
Conceptualization, H.Y.C. and S.-J.L.; Methodology, H.Y.C., D.H.K. and S.-J.L; Software, H.Y.C., D.L. and D.H.K.; Validation, H.Y.C., D.H.K. and S.-J.L.; Formal analysis, H.Y.C., D.L. and D.H.K.; Investigation; H.Y.C. and D.H.K.; Resources; S.-J.L. and J.-G.S; Data curation, S.A., Y.-S.C. and D.H.K.; Writing – Original Draft Preparation, H.Y.C. and S.A.; Writing – Review & Editing, D.L. and S.-J.L; Visualization, D.L.; Supervision, S.-J.L.; Project Administration, S.-J.L.; Funding Acquisition; S.-J.L. and J.-G.S. All authors have read and agreed to the published version of the manuscript.
Funding
This work supported by the National Research Foundation of Korea (NRF) grant funded by the Korea government (MSIT) (No. 2018R1A5A2021242 and 2020R1I1A3073778).
Institutional Review Board Statement
Not applicable.
Informed Consent Statement
Not applicable.
Data Availability Statement
The datasets presented in this study are available from the corresponding author on reasonable request.
Conflicts of Interest
The authors declare no conflicts of interest.
Abbreviations
The following abbreviations are used in this manuscript:
| ARA | Arachidonic acid |
| ATZ | Atazanavir |
| IFN-γ | Interferon gamma |
| IL | Interleukin |
| LPS | Lipopolysaccharide |
| NSAID | Non-steroidal anti-inflammatory drug |
| PGE2 | Prostaglandin E2 |
| PMA | Phorbol 12-myristate 13-acetate |
| TNF-α | Tumor necrosis factor alpha |
| UDPGA | UDP-glucuronic acid |
| UGT | UDP-glucuronosyltransferase |
References
- Wynn, T.A.; Chawla, A.; Pollard, J.W. Macrophage Biology in Development, Homeostasis and Disease. Nature 2013, 496, 445–455. [Google Scholar] [CrossRef]
- Murray, P.J.; Wynn, T.A. Protective and Pathogenic Functions of Macrophage Subsets. Nat Rev Immunol 2011, 11, 723–737. [Google Scholar] [CrossRef] [PubMed]
- Italiani, P.; Boraschi, D. From Monocytes to M1/M2 Macrophages: Phenotypical vs. Functional Differentiation. Front. Immunol. 2014, 5. [Google Scholar] [CrossRef] [PubMed]
- Mantovani, A.; Biswas, S.K.; Galdiero, M.R.; Sica, A.; Locati, M. Macrophage Plasticity and Polarization in Tissue Repair and Remodelling. The Journal of Pathology 2013, 229, 176–185. [Google Scholar] [CrossRef]
- Mantovani, A.; Marchesi, F.; Malesci, A.; Laghi, L.; Allavena, P. Tumour-Associated Macrophages as Treatment Targets in Oncology. Nat Rev Clin Oncol 2017, 14, 399–416. [Google Scholar] [CrossRef] [PubMed]
- Tukey, R.H.; Strassburg, C.P. Human UDP-Glucuronosyltransferases: Metabolism, Expression, and Disease. Annu. Rev. Pharmacol. Toxicol. 2000, 40, 581–616. [Google Scholar] [CrossRef]
- Yang, N.; Sun, R.; Liao, X.; Aa, J.; Wang, G. UDP-Glucuronosyltransferases (UGTs) and Their Related Metabolic Cross-Talk with Internal Homeostasis: A Systematic Review of UGT Isoforms for Precision Medicine. Pharmacological Research 2017, 121, 169–183. [Google Scholar] [CrossRef]
- Meech, R.; Hu, D.G.; McKinnon, R.A.; Mubarokah, S.N.; Haines, A.Z.; Nair, P.C.; Rowland, A.; Mackenzie, P.I. The UDP-Glycosyltransferase (UGT) Superfamily: New Members, New Functions, and Novel Paradigms. Physiological Reviews 2019, 99, 1153–1222. [Google Scholar] [CrossRef]
- Tochigi, Y.; Yamashiki, N.; Ohgiya, S.; Ganaha, S.; Yokota, H. ISOFORM-SPECIFIC EXPRESSION AND INDUCTION OF UDP-GLUCURONOSYLTRANSFERASE IN IMMUNOACTIVATED PERITONEAL MACROPHAGES OF THE RAT. Drug Metabolism and Disposition 2005, 33, 1391–1398. [Google Scholar] [CrossRef]
- Ricciotti, E.; FitzGerald, G.A. Prostaglandins and Inflammation. ATVB 2011, 31, 986–1000. [Google Scholar] [CrossRef]
- Kalinski, P. Regulation of Immune Responses by Prostaglandin E2. The Journal of Immunology 2012, 188, 21–28. [Google Scholar] [CrossRef]
- Hedi, H.; Norbert, G. Inhibition of IL-6, TNF-α, and Cyclooxygenase-2 Protein Expression by Prostaglandin E2-Induced IL-10 in Bone Marrow-Derived Dendritic Cells. Cellular Immunology 2004, 228, 99–109. [Google Scholar] [CrossRef] [PubMed]
- Gunaydin, C.; Bilge, S.S. Effects of Nonsteroidal Anti-Inflammatory Drugs at the Molecular Level. EAJM 2019, 50, 116–121. [Google Scholar] [CrossRef]
- Allain, E.P.; Rouleau, M.; Le, T.; Vanura, K.; Villeneuve, L.; Caron, P.; Turcotte, V.; Lévesque, E.; Guillemette, C. Inactivation of Prostaglandin E2 as a Mechanism for UGT2B17-Mediated Adverse Effects in Chronic Lymphocytic Leukemia. Front. Oncol. 2019, 9, 606. [Google Scholar] [CrossRef]
- Cho, H.Y.; Ahn, S.; Cho, Y.-S.; Seo, S.-K.; Kim, D.H.; Shin, J.-G.; Lee, S.-J. CYP2C19 Contributes to THP-1-Cell-Derived M2 Macrophage Polarization by Producing 11,12- and 14,15-Epoxyeicosatrienoic Acid, Agonists of the PPARγ Receptor. Pharmaceuticals 2023, 16, 593. [Google Scholar] [CrossRef]
- Livak, K.J.; Schmittgen, T.D. Analysis of Relative Gene Expression Data Using Real-Time Quantitative PCR and the 2−ΔΔCT Method. Methods 2001, 25, 402–408. [Google Scholar] [CrossRef] [PubMed]
- Williams, J.A.; Ring, B.J.; Cantrell, V.E.; Campanale, K.; Jones, D.R.; Hall, S.D.; Wrighton, S.A. Differential Modulation of UDP-Glucuronosyltransferase 1A1 (UGT1A1)-Catalyzed Estradiol-3-Glucuronidation by the Addition of UGT1A1 Substrates and Other Compounds to Human Liver Microsomes. Drug Metabolism and Disposition 2002, 30, 1266–1273. [Google Scholar] [CrossRef] [PubMed]
- Di Marco, A.; D’Antoni, M.; Attaccalite, S.; Carotenuto, P.; Laufer, R. DETERMINATION OF DRUG GLUCURONIDATION AND UDP-GLUCURONOSYLTRANSFERASE SELECTIVITY USING A 96-WELL RADIOMETRIC ASSAY. Drug Metabolism and Disposition 2005, 33, 812–819. [Google Scholar] [CrossRef]
- Seo, K.-A.; Kim, H.-J.; Jeong, E.S.; Abdalla, N.; Choi, C.-S.; Kim, D.-H.; Shin, J.-G. In Vitro Assay of Six UDP-Glucuronosyltransferase Isoforms in Human Liver Microsomes, Using Cocktails of Probe Substrates and Liquid Chromatography–Tandem Mass Spectrometry. Drug Metabolism and Disposition 2014, 42, 1803–1810. [Google Scholar] [CrossRef]
- Elkhenany, H.A.; Linardi, R.L.; Ortved, K.F. Differential Modulation of Inflammatory Cytokines by Recombinant IL-10 in IL-1β and TNF-α ̶ Stimulated Equine Chondrocytes and Synoviocytes: Impact of Washing and Timing on Cytokine Responses. BMC Vet Res 2024, 20, 546. [Google Scholar] [CrossRef]
- Xu, Y.; Li, W.; Shi, J.; Guo, Y. Midkine Promotes PDGF - BB -induced Proliferation, Migration, and Glycolysis of Airway Smooth Muscle Cells via the PI3K Akt Pathway. Physiological Reports 2025, 13, e70553. [Google Scholar] [CrossRef] [PubMed]
- Liu, T.; Huang, T.; Li, J.; Li, A.; Li, C.; Huang, X.; Li, D.; Wang, S.; Liang, M. Optimization of Differentiation and Transcriptomic Profile of THP-1 Cells into Macrophage by PMA. PLoS ONE 2023, 18, e0286056. [Google Scholar] [CrossRef]
- Orecchioni, M.; Ghosheh, Y.; Pramod, A.B.; Ley, K. Macrophage Polarization: Different Gene Signatures in M1(LPS+) vs. Classically and M2(LPS–) vs. Alternatively Activated Macrophages. Front. Immunol. 2019, 10, 1084. [Google Scholar] [CrossRef] [PubMed]
- Scott, T.E.; Lewis, C.V.; Zhu, M.; Wang, C.; Samuel, C.S.; Drummond, G.R.; Kemp-Harper, B.K. IL-4 and IL-13 Induce Equivalent Expression of Traditional M2 Markers and Modulation of Reactive Oxygen Species in Human Macrophages. Sci Rep 2023, 13, 19589. [Google Scholar] [CrossRef]
- Jarrar, Y.B.; Kim, D.H.; Lee, S.-J.; Shin, J.-G. Inhibition of 20-Hydroxyeicosatetraenoic Acid (20-HETE) Glucuronidation by Non-Steroidal Anti-Inflammatory Drugs in Human Liver Microsomes and Recombinant UDP-Glucuronosyltransferase Enzymes. Prostaglandins, Leukotrienes and Essential Fatty Acids 2020, 153, 102055. [Google Scholar] [CrossRef]
- Wang, B.; Wu, L.; Chen, J.; Dong, L.; Chen, C.; Wen, Z.; Hu, J.; Fleming, I.; Wang, D.W. Metabolism Pathways of Arachidonic Acids: Mechanisms and Potential Therapeutic Targets. Sig Transduct Target Ther 2021, 6, 94. [Google Scholar] [CrossRef]
- Van Der Mey, D.; Gerisch, M.; Jungmann, N.A.; Kaiser, A.; Yoshikawa, K.; Schulz, S.; Radtke, M.; Lentini, S. Drug-drug Interaction of Atazanavir on UGT1A1-mediated Glucuronidation of Molidustat in Human. Basic Clin Pharma Tox 2021, 128, 511–524. [Google Scholar] [CrossRef]
- Takayama, K.; Garcı́a-Cardeña, G.; Sukhova, G.K.; Comander, J.; Gimbrone, M.A.; Libby, P. Prostaglandin E2 Suppresses Chemokine Production in Human Macrophages through the EP4 Receptor. Journal of Biological Chemistry 2002, 277, 44147–44154. [Google Scholar] [CrossRef] [PubMed]
- Wang, W.; Liang, M.; Wang, L.; Bei, W.; Rong, X.; Xu, J.; Guo, J. Role of Prostaglandin E2 in Macrophage Polarization: Insights into Atherosclerosis. Biochemical Pharmacology 2023, 207, 115357. [Google Scholar] [CrossRef]
- Chen, S.; Saeed, A.F.U.H.; Liu, Q.; Jiang, Q.; Xu, H.; Xiao, G.G.; Rao, L.; Duo, Y. Macrophages in Immunoregulation and Therapeutics. Sig Transduct Target Ther 2023, 8, 207. [Google Scholar] [CrossRef]
- Richardson, T.A.; Sherman, M.; Kalman, D.; Morgan, E.T. EXPRESSION OF UDP-GLUCURONOSYLTRANSFERASE ISOFORM mRNAS DURING INFLAMMATION AND INFECTION IN MOUSE LIVER AND KIDNEY. Drug Metabolism and Disposition 2006, 34, 351–353. [Google Scholar] [CrossRef]
- Zhang, H.; Liu, H.; Zhou, L.; Yuen, J.; Forman, H.J. Temporal Changes in Glutathione Biosynthesis during the Lipopolysaccharide-Induced Inflammatory Response of THP-1 Macrophages. Free Radical Biology and Medicine 2017, 113, 304–310. [Google Scholar] [CrossRef]
- Diotallevi, M.; Checconi, P.; Palamara, A.T.; Celestino, I.; Coppo, L.; Holmgren, A.; Abbas, K.; Peyrot, F.; Mengozzi, M.; Ghezzi, P. Glutathione Fine-Tunes the Innate Immune Response toward Antiviral Pathways in a Macrophage Cell Line Independently of Its Antioxidant Properties. Front. Immunol. 2017, 8, 1239. [Google Scholar] [CrossRef]
- Pérez, S.; Rius-Pérez, S. Macrophage Polarization and Reprogramming in Acute Inflammation: A Redox Perspective. Antioxidants 2022, 11, 1394. [Google Scholar] [CrossRef]
- Chan, M.M.-Y.; Moore, A.R. Resolution of Inflammation in Murine Autoimmune Arthritis Is Disrupted by Cyclooxygenase-2 Inhibition and Restored by Prostaglandin E2-Mediated Lipoxin A4 Production. The Journal of Immunology 2010, 184, 6418–6426. [Google Scholar] [CrossRef] [PubMed]
- Basil, M.C.; Levy, B.D. Specialized Pro-Resolving Mediators: Endogenous Regulators of Infection and Inflammation. Nat Rev Immunol 2016, 16, 51–67. [Google Scholar] [CrossRef] [PubMed]
- Soars, M.G.; Petullo, D.M.; Eckstein, J.A.; Kasper, S.C.; Wrighton, S.A. AN ASSESSMENT OF UDP-GLUCURONOSYLTRANSFERASE INDUCTION USING PRIMARY HUMAN HEPATOCYTES. Drug Metabolism and Disposition 2004, 32, 140–148. [Google Scholar] [CrossRef] [PubMed]
Figure 1.
UGT expression profiling across THP-1-derived macrophages. (A) Experimental workflow for differentiation and polarization of THP-1 cells into M0, M1, and M2 macrophages. THP-1 cells were differentiated into M0 macrophages by PMA treatment and subsequently polarized into M1 using LPS and IFN-γ or into M2 macrophages using IL-4 and IL-13. (B) Representative phase-contrast images showing morphological changes during differentiation and polarization of THP-cells. M1 macrophages exhibit an elongated, sharpened morphology (arrows), whereas M2 macrophages display a flattened morphology (arrowheads). (C) Gene expression profiles of UGT isoforms in liver tissue, THP-1 cells, M0, M1, and M2 macrophages. The results presented are representative of one out of the three independent experiments. ACTB used as a loading control. Liver tissue cDNA was used as a positive control for the detection of UGTs in the expected size of amplification. No bands were detected in negative control samples in which PCR was performed without reverse transcriptase.
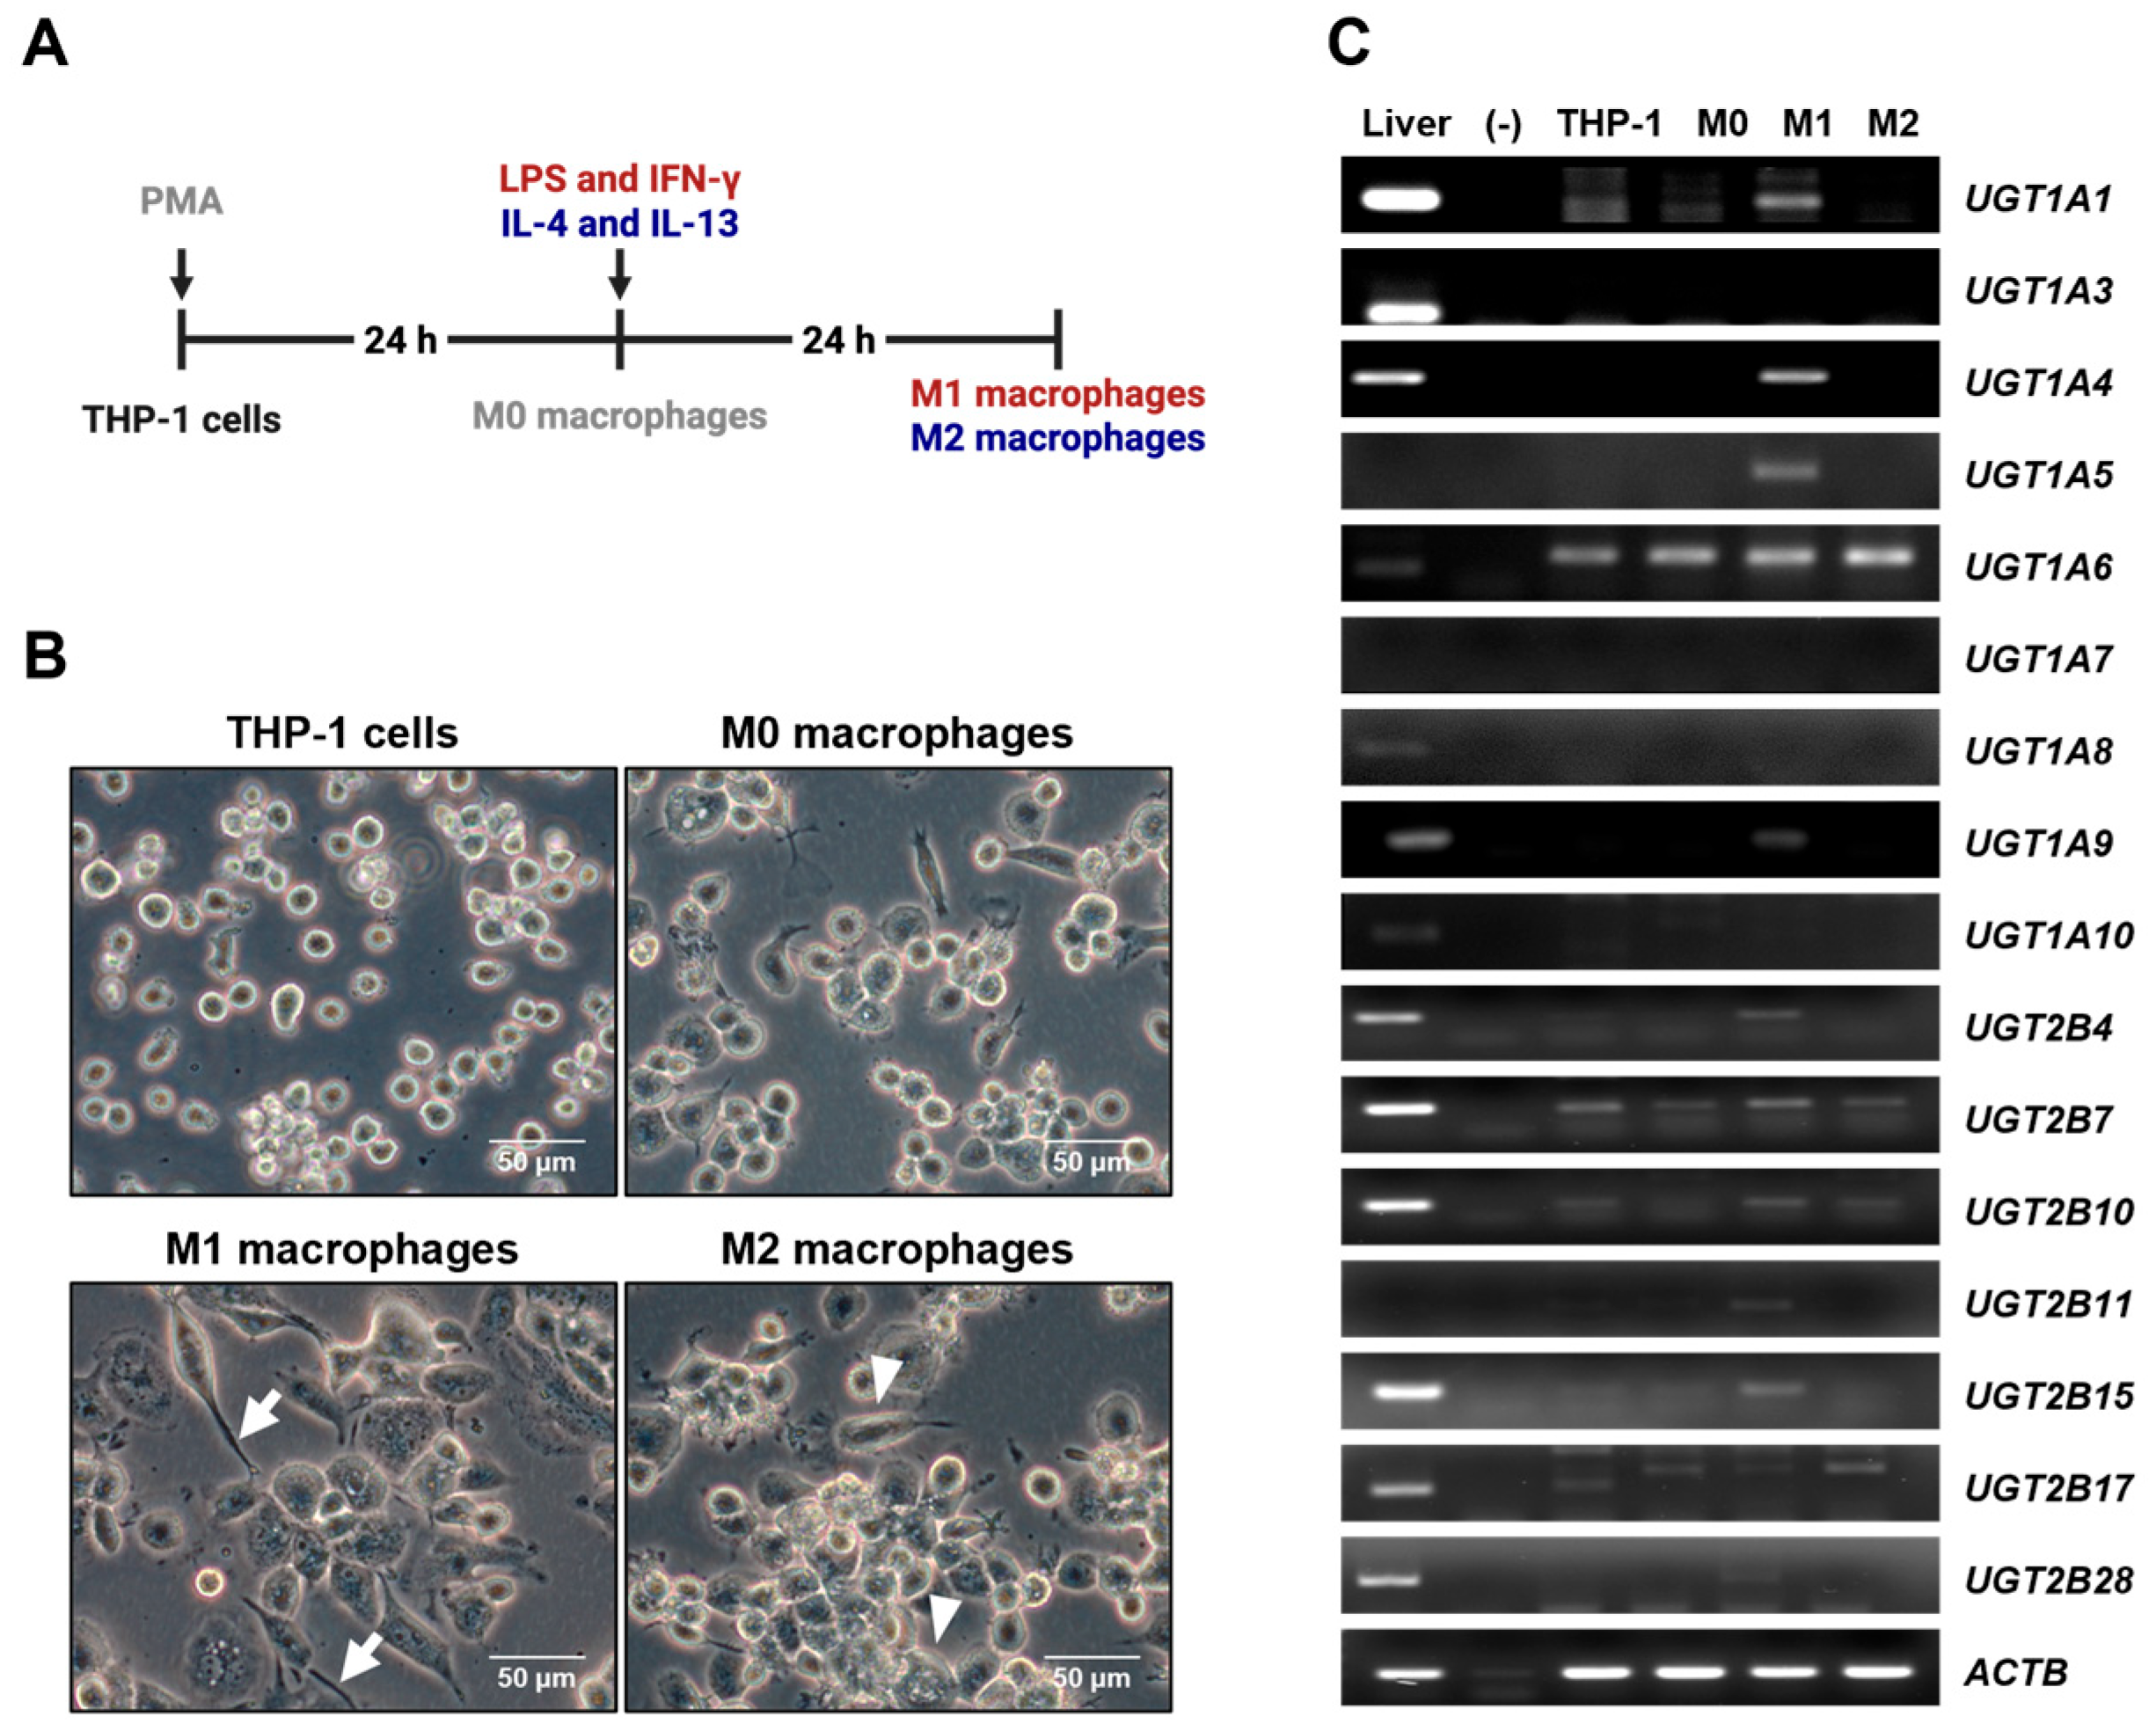
Figure 2.
Predominant expression of UGT mRNAs and proteins in M1 macrophages. (A-E) Relative UGT mRNA expression in THP-1 cells, M0, M1, and M2 macrophages. Data are presented as fold changes in mRNA expression normalized to GAPDH. Values represent the mean ± SD of three independent experiments. *p < 0.05, **p < 0.01, and ***p < 0.001 compared with THP-1. (F) Relative protein expression in THP-1 cells, M0, M1, and M2 macrophages, with β-actin used as loading control. The results presented are representative of one out of the three independent experiments.
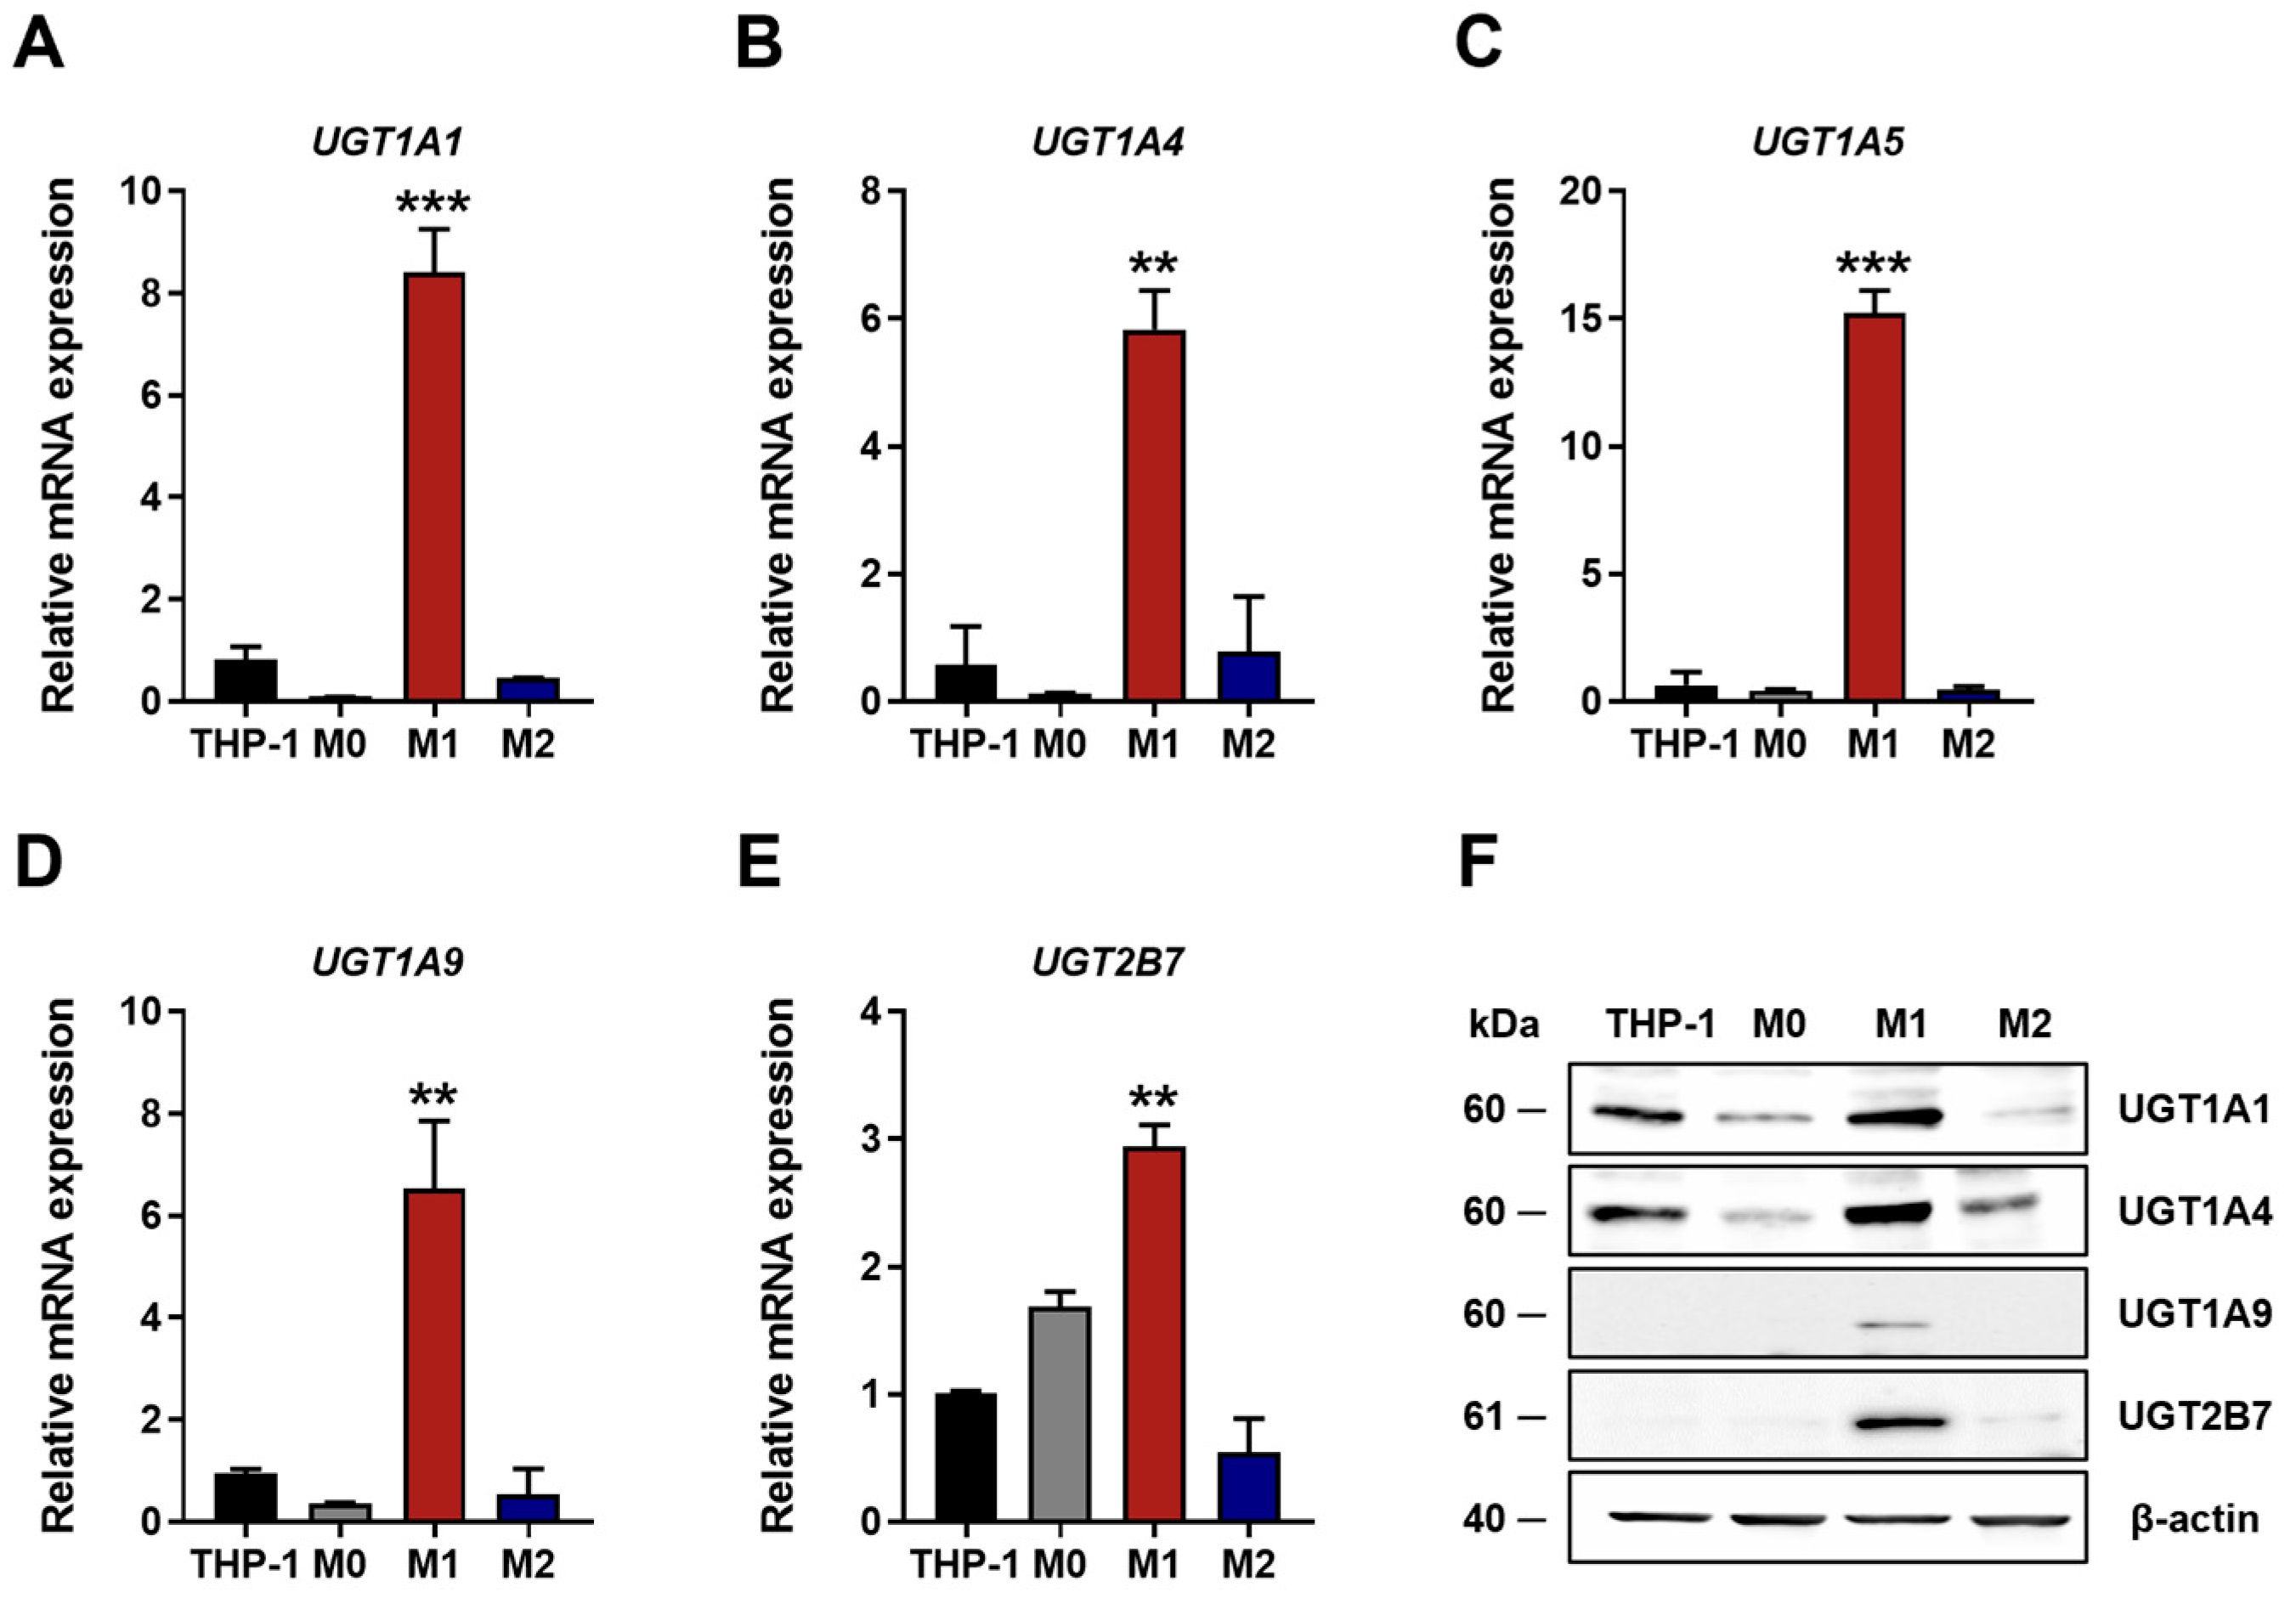
Figure 3.
Strong UGT enzymatic activity in M1 compared with M2 macrophages. (A) Total UGT enzymatic activity measured in M1 and M2 macrophages. (B) Concentration-dependent inhibition of UGT activity in M1 and M2 macrophages following treatment with diclofenac. (C) Representative LC-MS/MS chromatogram showing the detection of estradiol-3-glucuronide as a UGT1A1-mediated metabolite. (D) UGT1A1-specific enzymatic activity in M1 and M2 macrophages. (E) Representative LC-MS/MS chromatogram showing the detection of naloxone-3-glucuronide as a UGT2B7-mediated metabolite. (F) UGT2B7-specific enzymatic activity in M1 and M2 macrophages. UGT activity was determined using total cellular protein extracts. Data are presented as the mean ± SD of three independent experiments. *p < 0.05, **p < 0.01, and ***p < 0.001 compared with no treatment or M1.
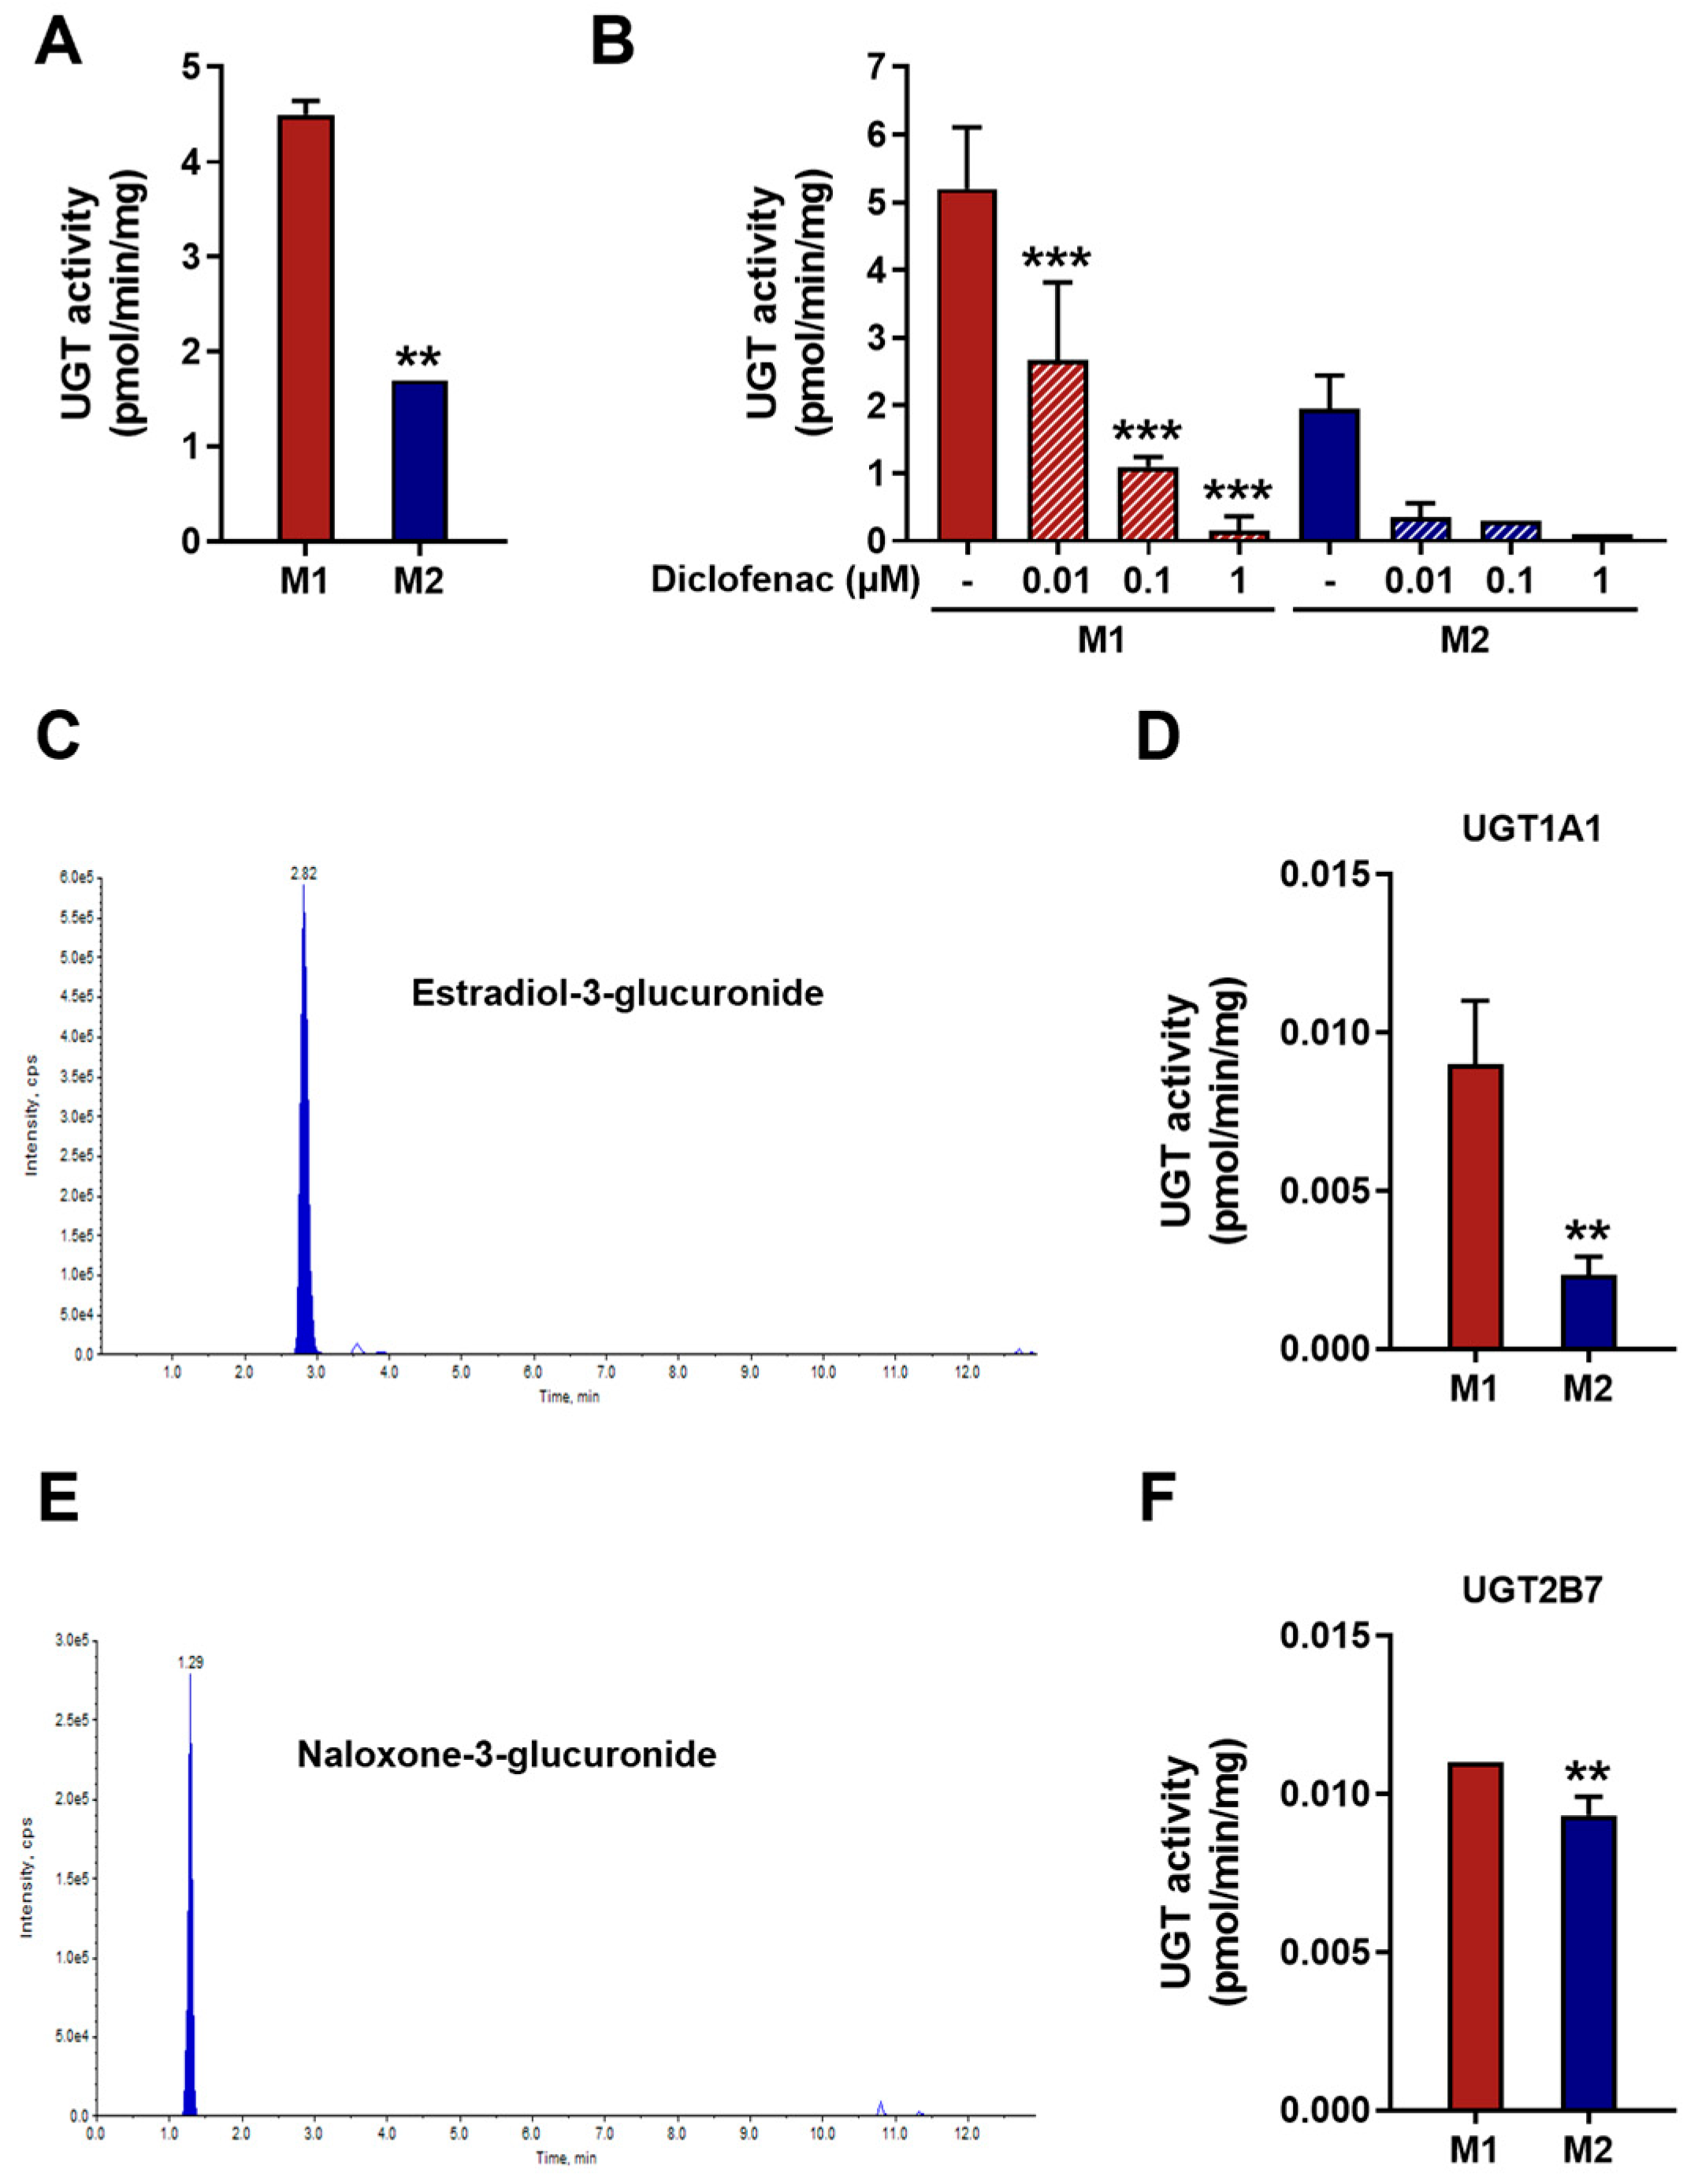
Figure 4.
Influence of the ATZ as UGT inhibitor on production of PGE2-glucuronide in M1 and M2 macrophages. Levels of (A) free PGE2 and (B) PGE2-glucuronide in M1 and M2 macrophages treated with 100 μM ARA in the presence or absence of the UGT inhibitor ATZ. Time-dependent changes in (C) free PGE2 and (D) PGE2-glucuronidelevels in M1 macrophages treated with ARA alone or in combination with ATZ for the indicated times. Data are presented as the mean ± SD of three independent experiments. *p < 0.05, **p < 0.01, and ***p < 0.001 compared to no treatment or M1+ARA.
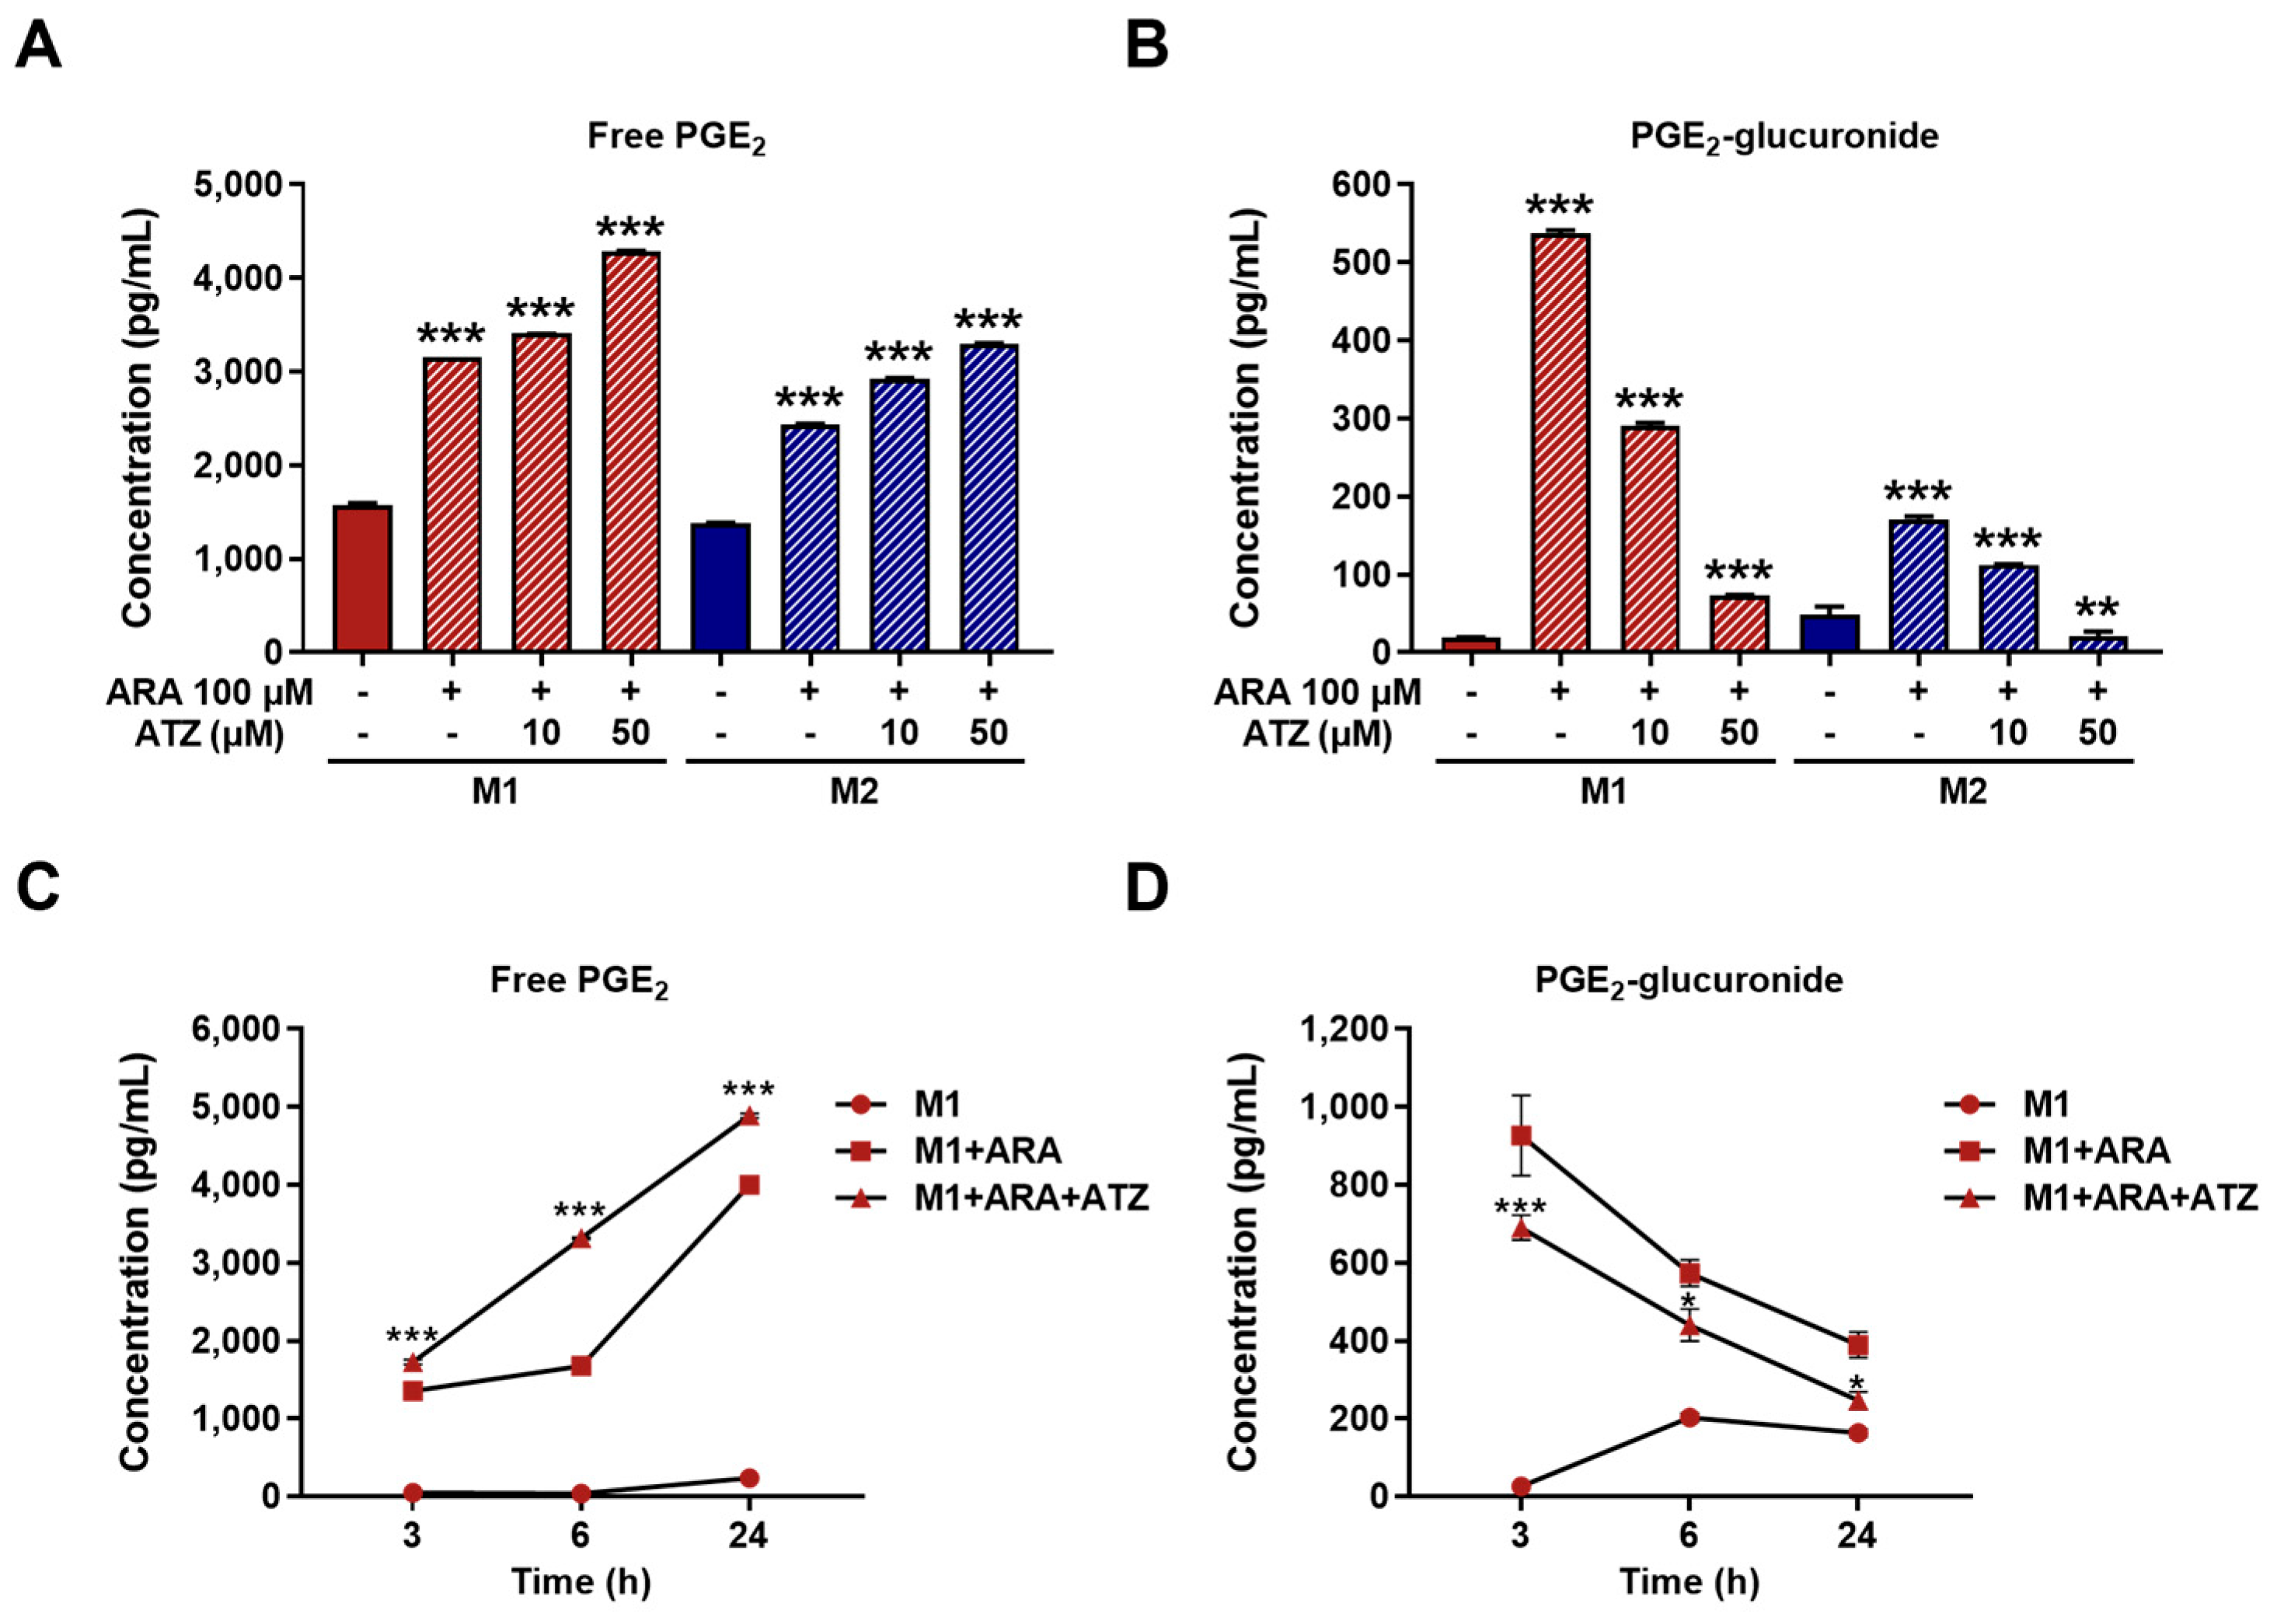
Figure 5.
Impact of ATZ on production of pro-inflammatory cytokines in M1 macrophages. Relative mRNA expression levels of (A) IL1B, (B) IL6, and (C) TNF in M1 macrophages treated with the UGT inhibitor ATZ. Protein levels of (D) IL-1β, (E) IL-6, and (F) TNF-α in the culture supernatants of M1 macrophages following ATZ treatment. Data are presented as the mean ± SD of three independent experiments. *p < 0.05, **p < 0.01, and ***p < 0.001 compared to no treatment.
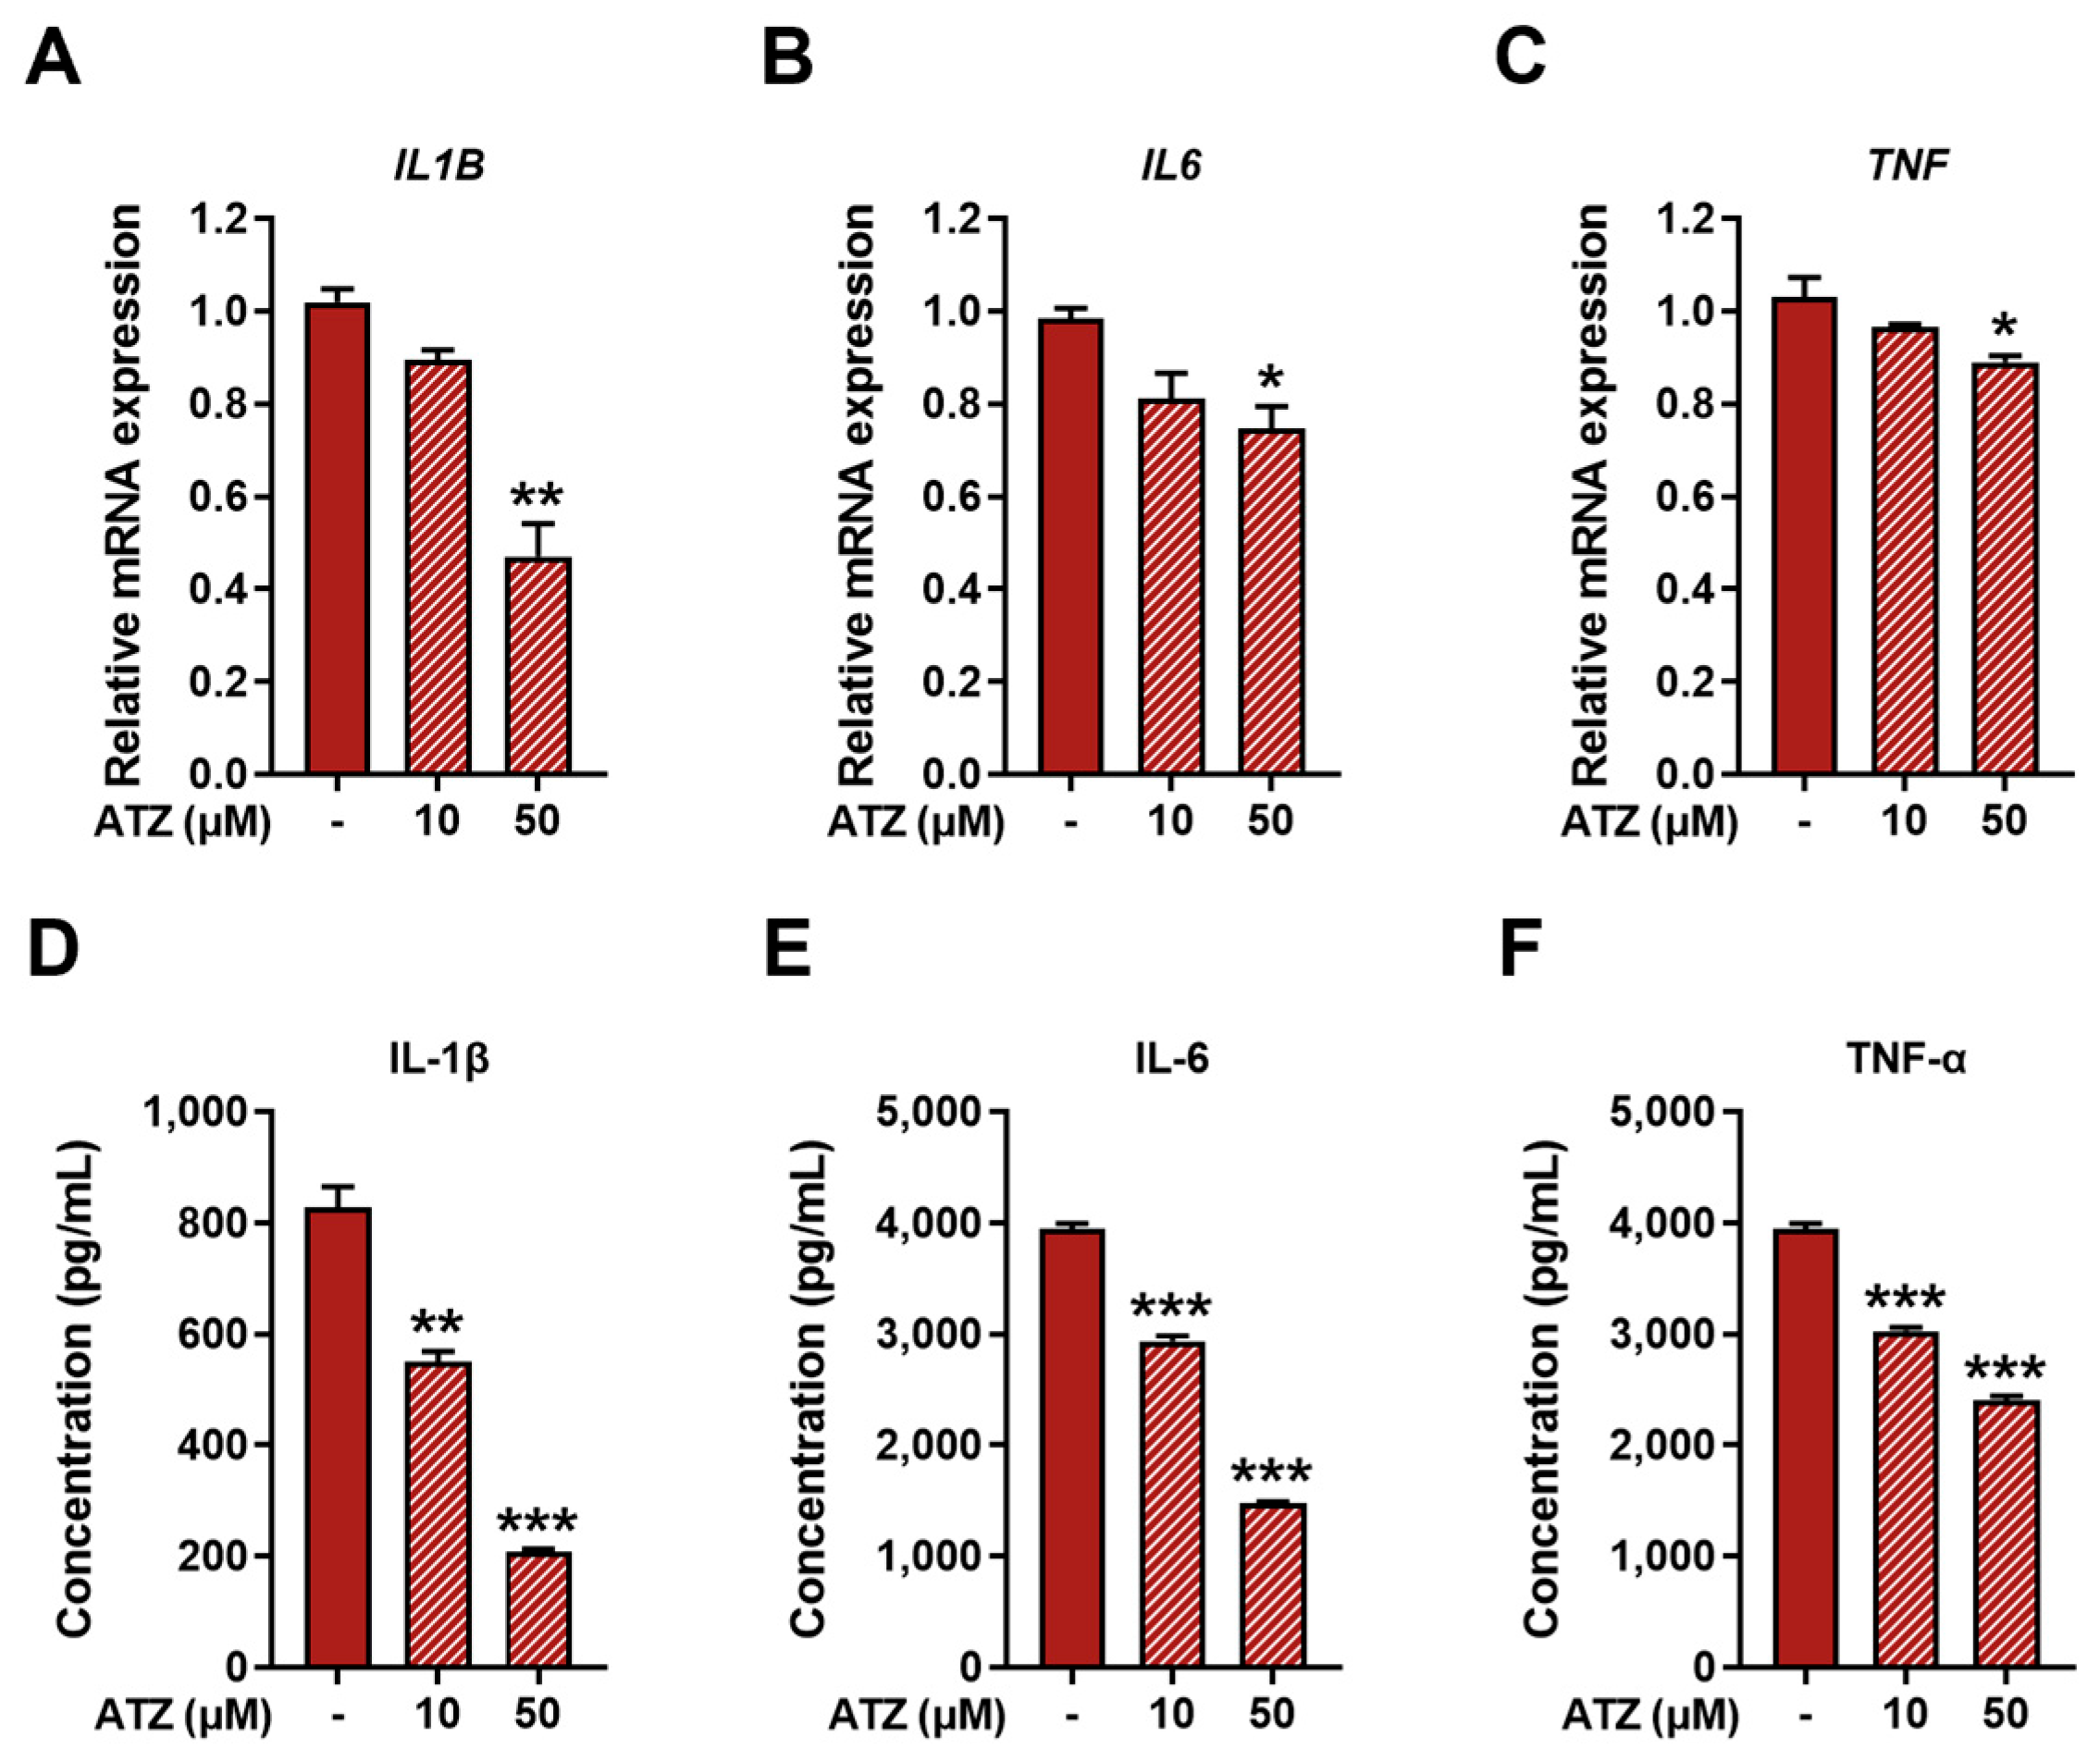
Figure 6.
Schematic illustration of the proposed role of UGTs in regulating macrophage inflammatory responses. M1 macrophages exhibit increased expression of multiple UGT enzymes, which promotes the glucuronidation of PGE2 to PGE2-glucuronide and is associated with enhanced production of pro-inflammatory cytokines. In contrast, inhibition of UGT activity by atazanavir suppresses PGE2 glucuronidation, resulting in increased levels of free PGE2 and reduced production of pro-inflammatory cytokines in M1 macrophages. ER, endoplasmic reticulum; PGE2, prostaglandin E2; PGE2-g, PGE2-glucuronide; UGT, UDP-glucuronosyltransferase.
Disclaimer/Publisher’s Note: The statements, opinions and data contained in all publications are solely those of the individual author(s) and contributor(s) and not of MDPI and/or the editor(s). MDPI and/or the editor(s) disclaim responsibility for any injury to people or property resulting from any ideas, methods, instructions or products referred to in the content. |
© 2026 by the authors. Licensee MDPI, Basel, Switzerland. This article is an open access article distributed under the terms and conditions of the Creative Commons Attribution (CC BY) license (http://creativecommons.org/licenses/by/4.0/).
Copyright: This open access article is published under a Creative Commons CC BY 4.0 license, which permit the free download, distribution, and reuse, provided that the author and preprint are cited in any reuse.


