Submitted:
19 January 2026
Posted:
22 January 2026
You are already at the latest version
Abstract
Opportunities to improve the effectiveness of associative protection in scene analysis can be found in changing the configurations of digital etalons (reference patterns) and in transition from a decimal to a hexadecimal system when encoding object names and their coordinates. The relevance of the research undertaken is determined by the need for a significant increase in the number of keys used and the advisability of further improvement of the security strength. Based on a preliminary analysis, a rule for selecting digital reference configurations has been formulated from the condition of uniform distribution of bit inclusions in the pseudorandom sequence (GAMMA) container when using the decimal and hexadecimal systems for encoding purposes. Algorithms for forming a complete and limited test list of permutations for experimental research purposes have been developed. Results of the computational experiment confirmed validity of the formulated rule. For the accepted configurations, estimates of the expected number of preserved bits of the etalon were obtained.
Keywords:
associative data protection
; digital etalon configurations
; transition to a 16-bit system
; bit distribution function
; mathematical expectation of the number of stored etalon bits
1. Introduction
Review [1] examined the state of research in the field of associative data protection in scene analysis [2]. Associativity is defined by the use of a masking mechanism for binary matrix etalons of decimal digits of code representations of object names and their coordinates. Both are encoded by k-bit numbers. Each number digit is entered into a binary matrix of size , . The masking algorithm performs a division of the etalons of the set , where Q is the base of the number system (in this case, ), and sequentially formed subsets into dichotomic pairs according to the value of one bit. The positions of this bit correspond to the unit in the inverse (assuming bit-wise inversion, i.e. complement) matrices of the masks of both subsets of the pair.
We used decimal coding with postal (ZIP code-style) symbols (Figure 1). Individual bits of the etalon set were placed along the outer contour and inner "zigzag" of the binary matrices (Figure 2).
The mask generation process is random. For each matrix, a separate mask matrix of the same size is created, which stores the bits essential for its identification in the etalon. The set of masks is the key to recognition. The masked bits are subject to randomization. As a result, each numerical code is converted into a k-section steganographic container, initially filled with a segment of a pseudo-random sequence of length , into which randomly stored code bits are interspersed at the positions of the units of the inverse matrix masks. Regardless of n, the average number of such bits remains constant. Here M is the mathematical expectation for a single reference. At the same time, as n increases, the steganographic security of the method also increases due to the increase in [3].
The integration of cryptography and steganography is a characteristic feature of associative security.
2. Research Objectives
The perspective for the development of research on associative security outlined in [1] is linked to the reconfiguration of digital etalons and the transition from a decimal to a hexadecimal system. This transition increases the maximum number of object names and coordinate values from (decimal) to (hexadecimal) for . This should significantly increase cryptographic strength, provided that complete coverage is achieved — meaning that GAMMA sequence is generated once using the cryptographic version of the Mersenne Twister pseudorandom number generator [4]. Given an acceptable key search, decryption of the container contents will then yield the complete set of names. The key space also expands significantly due to a much larger number of permutations available with hexadecimal symbols. The use of such permutations is characteristic of the developed masking algorithm [1].
The criterion for selecting etalon configurations is not trivial. The emphasis of reconfiguration in [1] was made on minimising the average number of bit inclusions in the information-carrying GAMMA container. Our findings give for "postal coding," rather than as in [1]. This is already quite close to the minimum possible value for decimal encoding. For the set , this number is reduced to by sequentially dividing the entire set and the resulting subsets in half [1].
In this article, the focus has changed while keeping an interest in the obtained M values. We suppose that the main issue is the need to eliminate spikes in the distribution function of unmasked bits along the container length. Such spikes make it easier for an adversary to distort the transmitted message using intentional network noise. To obtain a uniform distribution function of inclusions along the length of the container in [1], it was necessary to prohibit the appearance of units at the nodal points highlighted in Figure 2 when forming key sets of inverse mask matrices. This led to a significant reduction in the number of keys used ("correct" keys) and, consequently, to a decrease in cryptographic strength.
To ensure programming convenience we abandon the reverse diagonal approach introduced in [1] and return to the contour shown in Figure 2. This choice facilitates the transition from matrix to linear representation, which leads to a significant reduction in the amount of data transferred. Moreover, as the research has shown, this makes it possible to better meet the reconfiguration criterion adopted in [1].
The randomness of key (i.e. mask set) generation is largely determined by the random selection of the initial permutation of characters in the set . The number of permutations of r elements is . Figure 3 shows the distribution of inverse mask units along the etalon outlines (Figure 2) for postal symbols (Figure 1), obtained using the Fisher–Yates shuffling algorithm [5,6].
The majority of the individual bits of all keys involved are distributed among the nodes shown in Figure 2. In Figure 3, the zero position corresponds to the lower left point in Figure 2, the outer contour is traversed clockwise, then continuously in a zigzag pattern (linearisation of the matrix representation of the binary etalon).
It was useful to check whether the spikes in the distribution function were the result of an unsuccessful set of statistics. The most reliable check would be to go through all possible permutations. For , the number of possible permutations is . The current state of computer technology allows us to generate this list in a fraction of a second. Complete iteration over the list during mask generation took 30 minutes and confirmed the validity of the previously obtained result (see Figure 4; in this case).
Let us refer to Figure 3. Each key has an average of 8 occurrences of stored bits at selected points. This casts doubt on the existence of "correct" keys with zeros at all node points. Nevertheless, such keys do exist [1]. We analysed all obtained keys. It was found that 73% of them contain at least one "critical" mask (on average, 8 such masks for each non-working key). In other words, only 27% of the keys can be used in practice. This could lead to a reduction in the cryptographic security strength.
This defines our primary research objective: finding such a rule for selection of digital etalon shapes that will eliminate spikes in the inclusion distribution function.
Spikes occur as a result of combining multiple keys. Figuring out an appropriate etalon selection rule, we should bear in mind that the key generation system [7] is subject to external influences, specifically changes in etalon shapes. Therefore, we can only observe the effects of this influence without explaining the underlying mechanisms. Explanation is, of course, a key function of science [8], but a full explanation here proves difficult.
Studying Figure 4 can provide us with valuable information regarding the heuristic rule that we seek to develop. According to the condition, the outline of the etalon points between the nodal points is composed of line segments consisting only of ones or only of zeros. The results of the first dichotomous partitions for all points of each segment, except for the nodal points, are identical. Examination of Figure 4 reveals that the distribution for each segment is also identical. Therefore, it is logical to assume that:
- 1.
- The behaviour of the system at each point of the outline is determined by the result of the first dichotomous division at that point.
- 2.
- To determine the cause of the spikes, it is enough to consider the case .
3. The Etalon Configurations Selection Rule and the Prerequisites for Its Verification
Our algorithm for generating the complete set of permutations of r elements is based on the expression: .
Algorithm 1.
First, cyclic left shifts are performed for elements of a certain initial permutation. Then, the result of each such shift, except for the leftmost element, undergoes the same operation. And so on. The algorithm terminates by shifting a two-element set.
A complete permutation list is characterized by the equal presence of each element in any position of the sequence times. This fact is illustrated by Table 1 using the example of , where .
Let us consider the case . It is characteristic that the spikes in Figure 4 appear only at the nodal points of the outer contour of Figure 2(a). There is no spike at the upper right point, because there is no dichotomous pair for it. Among the dichotomous pairs at the nodal points, two pairs include singleton subsets, two include subsets of two elements, and one includes a subset of three elements. At other points where no spikes are observed, five pairs include subsets of cardinality 4, three pairs include subsets of cardinality 5, and one pair includes a subset of cardinality 3. However, the node with the subset of cardinality 3 produces a spike. Therefore, configurations exhibiting this property should be excluded.
According to the assumption given in Section 2, we come to the following conclusion. A necessary condition for the absence of spikes in the distribution function is the absence of dichotomy at certain points or (what is still hypothetical) that during the first division in the masking process, dichotomous selections occur at the points of the outline in Figure 2(a), and subsets of cardinality (4–5) – for and, by analogy, (7–8) – for , close in cardinality to the subsets selected in [1] to minimise the number of inclusions.
Based on this analysis, we propose the following heuristic rule:
Rule.
The configurations of digital etalons should be chosen in such a way that the previously specified conditions are fulfilled in order to obtain a uniform distribution function.
This hypothesis requires experimental verification. For the case , testing can be performed on the entire set of permutations. However, when , the total number of permutations becomes as much as . Exhaustively enumerating all permutations is computationally infeasible. It is therefore practical to construct a suitable limited test list for the purposes of research.
We now clarify what "suitable" means as applied to a limited test list. To ensure suitability, we must select a subset of permutations in such a way that will allow to reproduce the same distribution function as could be obtained by the usage of complete permutation set. For this purpose we should strive to maintain the property which is naturally inherent to a complete permutation set: that each element is equally contained in any position of the r-sequence.
To form such a list for even values of r, the following algorithm is proposed:
Algorithm 2
[H].
- Step 1. Perform left cyclic shifts for elements of a certain initial permutation of r-element sequence.
- Step 2. Split each resulting permutation, including the initial one, in half.
- Step 3. Finding the complete list of permutations with cardinality for each resulting subset of elements.
For this algorithm, the cardinality of the resulting set of permutations is equal to . Each element is present in any position of the r-sequence times. These positions are illustrated in Table 2 () and Table 3 (). When , we obtain 12 test permutations, while . All permutations are different. Each element appears three times in any position. When , we obtain 66 different test permutations, while . Each element appears 11 times in any position.
For (), we obtain different test permutations, i.e. approximately of the total set. Each decimal digit appears 239 times in any position of the r-sequence. The validity of using the test list to estimate the distribution of inclusions along the length of the container is illustrated in Figure 5 using the example of (compare with Figure 4).
The requirements of the formulated rule were fulfilled in the configurations of digital etalons shown in Figure 6. Of the 15 points in Figure 2(a), at (Figure 6(a)) we have: 4 points with no dichotomous partitions; and among the rest (with existing partitions): 7 points with subsets of cardinality 4 and 4 points with subsets of cardinality 5. At (Figure 6(b)) – the previous 4 points of absence, 8 points with subsets of cardinality 8, 3 points – subsets of cardinality 7.
The proposed rule formulates necessary but not sufficient conditions. Repeated adjustments are possible in some etalons. In the course of further planned research, an increase in the duration of the computational experiment cannot be ruled out. This led to a revision of the software implementation of the masking algorithm presented in [1].
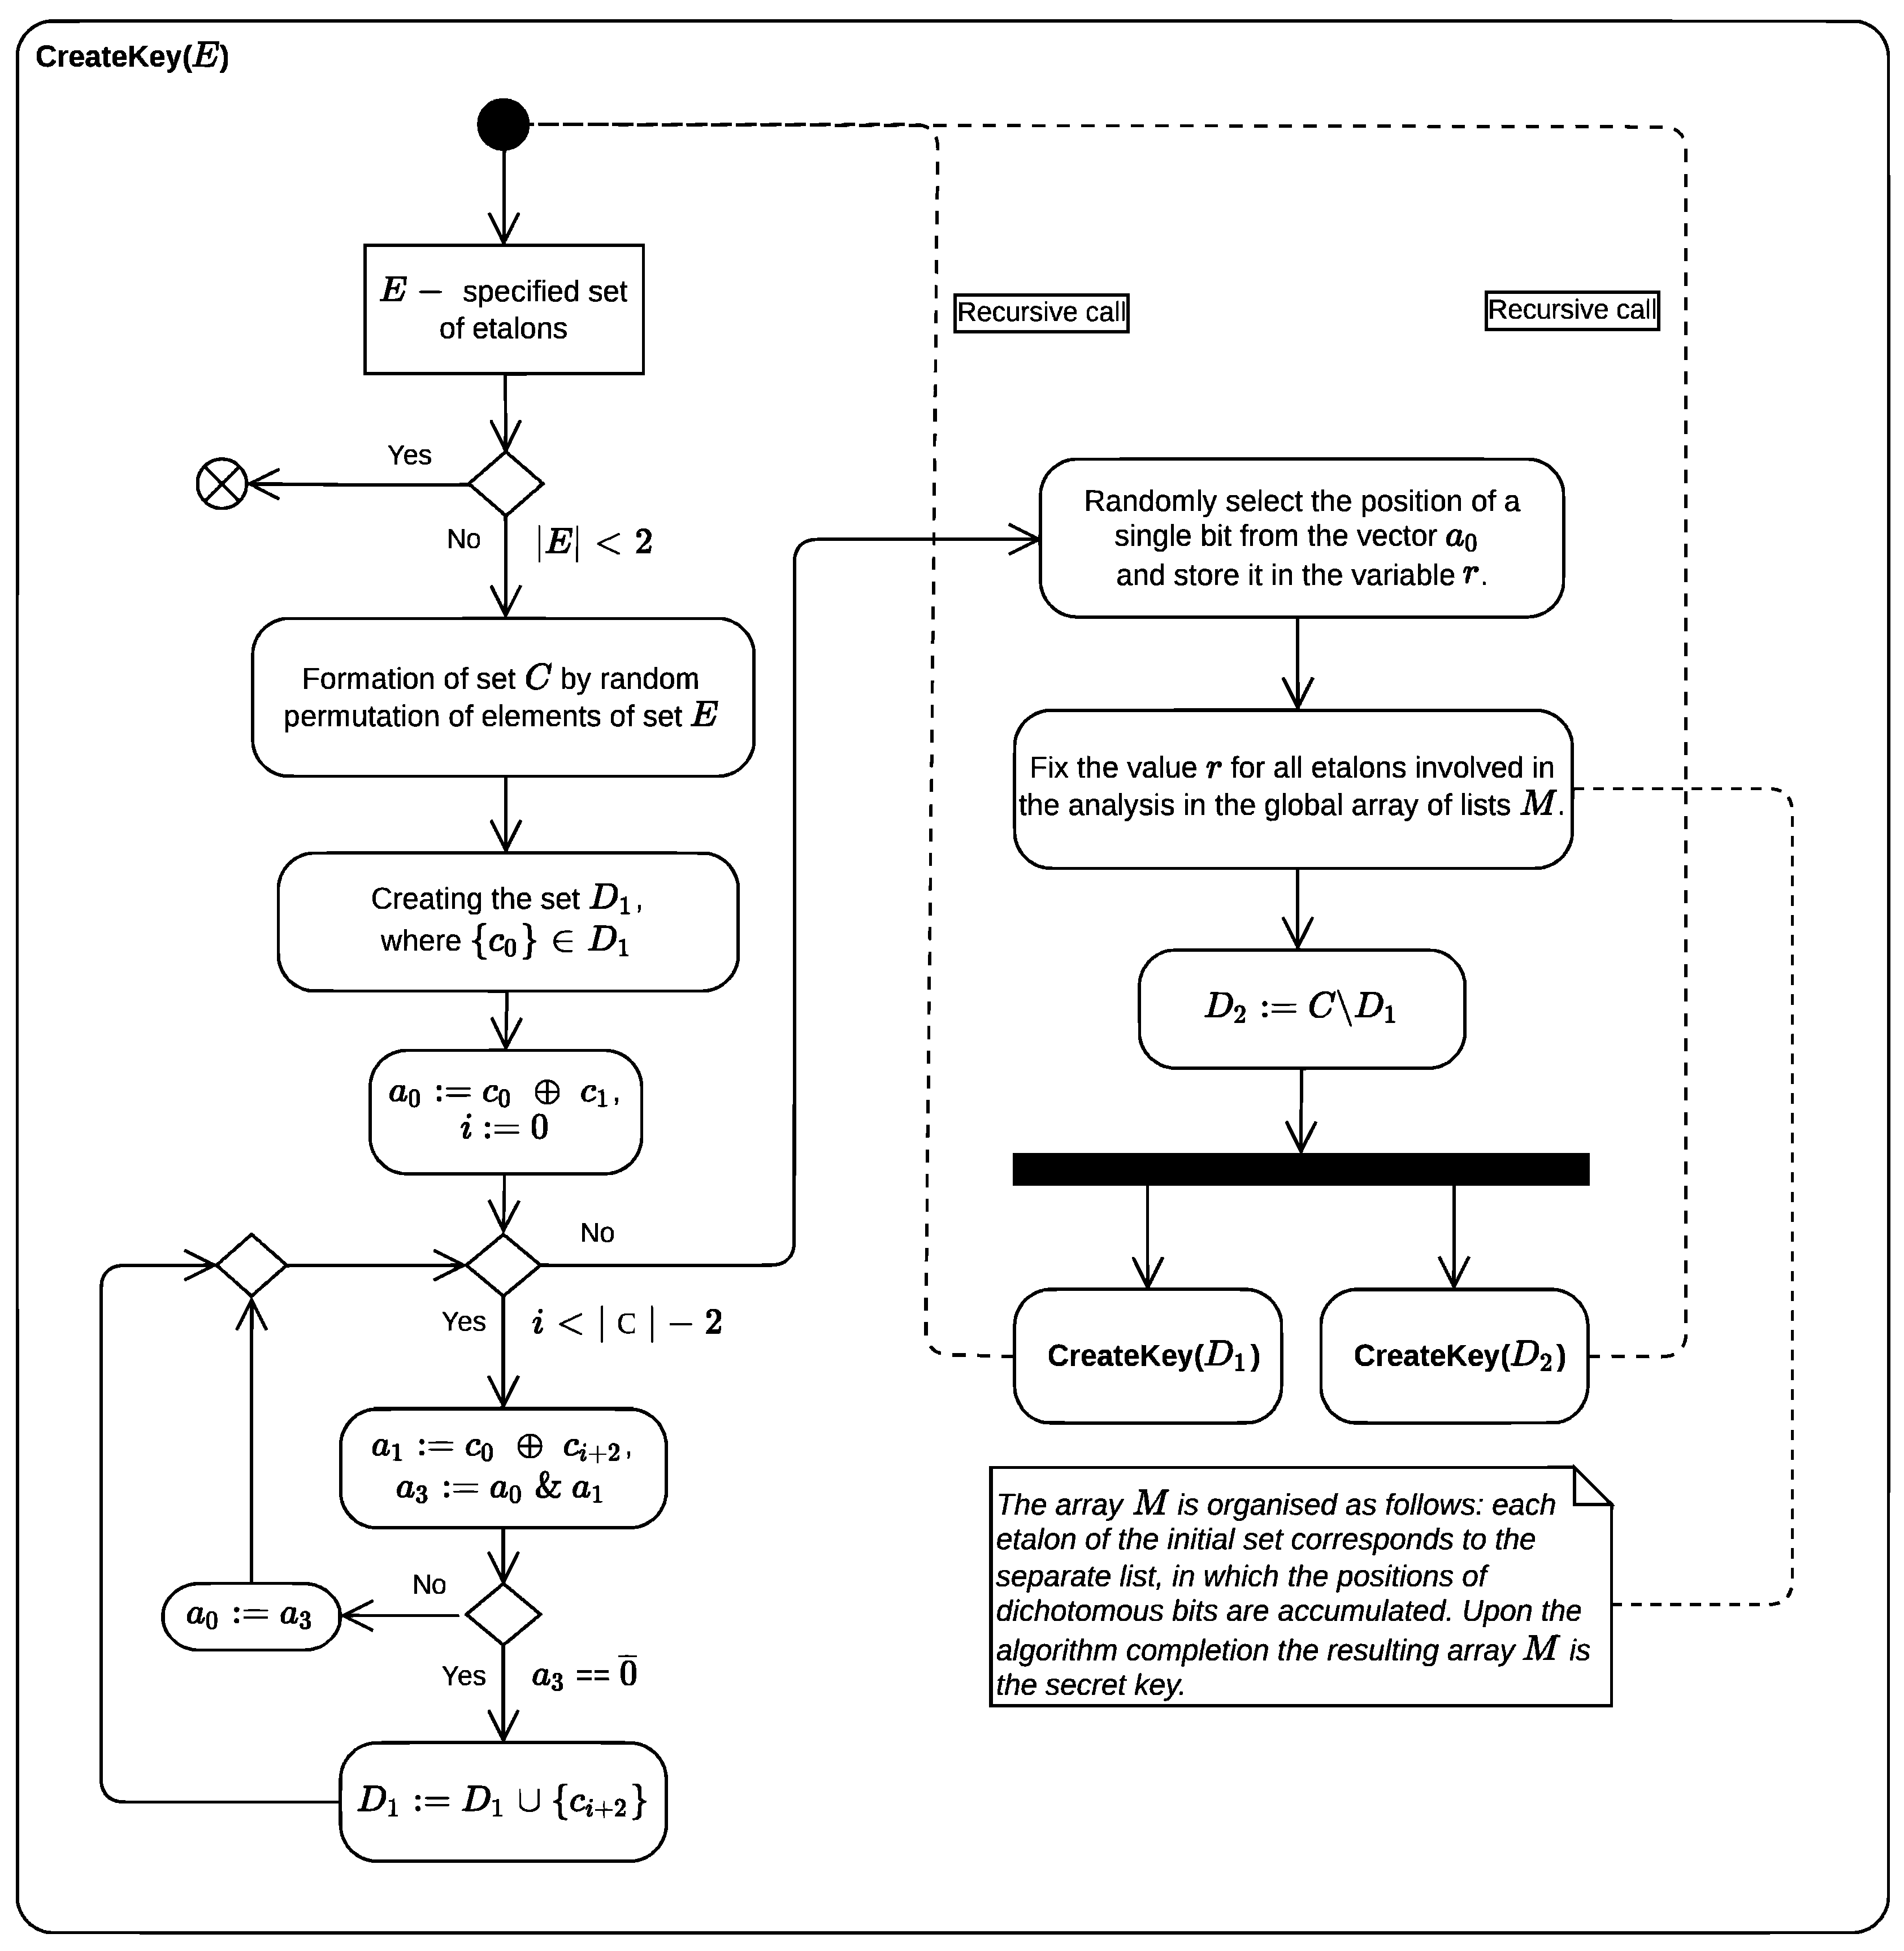
The new software implementation of the masking algorithm (see Figure A1 in Appendix) employing its recursiveness and utilizing the Parallel class of the .NET [9] and the BitVectorLib library [10], showed a 20-fold acceleration compared to the sequential implementation of the basic algorithm on the full set of permutations in the case of . The testing was carried out on a hardware platform with the following characteristics: Intel Core i5-9300H processor (8 logical, 4 physical cores), 16 GB DDR4 RAM, Windows 11 operating system (10.0.22631.4460).
4. Results of the Computational Experiment
This section presents the results of experimental verification of the formulated rule for the proposed etalon configurations on the sets and with evaluation of the values of M and enumeration of the complete and limited test lists of permutations, respectively. The value of n seriously affects the volume of the transmitted message. Thus, the research is limited to the case , which retains the advantages of associative protection [11].
Case . The experiment with shapes in Figure 6(a) led to the appearance of a spike in the upper left node of Figure 2(a). It can be seen that there is no spike in the lower right node. We consider the reason for this lies in the fact that the first position gives a subset with the cardinality of 4 in the first division, while the second position divides the complete set exactly in half. To align the situations, we had to change the representation of the digit 3 (Figure 7).
As a result, the desired uniform distribution was obtained (Figure 8) with the value .
Case . The figure is similar to that observed in the case of . Figure 6(b) still maintains the spike in the upper left node of Figure 2(a). Note that during the first division, subsets with a cardinality of , are selected for this and the lower-right nodes in this case. The applied correction principle is the same as before: we adjust the cardinality of the selected subsets in the upper-left node to the level assumed for the case , correcting the representation of the number 3 (Figure 9).
This ensured the required uniform distribution (Figure 10) with a value of .
5. Conclusions
The methodology employed in this article consists of establishing facts through computational experiments, hypothesizing possible causes of failures and ways to overcome them, as well as verifying them as needed. It is not strictly inductive. Nevertheless, it was possible to extrapolate the results of the analysis of the simplest case to arbitrary values of n.
The rule formulated in the article and its robust verification allow us to properly approach the choice of digital etalon representations when encoding scene data in the case of their associative protection. Some readers may find the configurations in Figure 7 and Figure 9 aesthetically less appealing. In this case, they can try to find their own forms that satisfy this rule.
Author Contributions
Conceptualization, V.R.; methodology, V.R.; software, R.G. and A.B.; validation, V.R., R.G. and A.B.; formal analysis, V.R. and R.G.; investigation, V.R. and R.G.; resources, R.G. and A.B.; data curation, V.R.; writing—original draft preparation, V.R.; writing—review and editing, V.R. and R.G.; visualization, V.R., R.G. and A.B.; supervision, V.R.; project administration, V.R. and R.G. All authors have read and agreed to the published version of the manuscript.
Funding
The work was carried out with the support of the grant provided by the Academy of Sciences of the Republic of Tatarstan to higher education institutions, scientific and other organizations to support plans for developing human resources by encouraging their scientific and scientific-pedagogical staff to defend doctoral dissertations and carry out scientific research work.
Acknowledgments
The authors express their sincere gratitude to Academician V.K. Levin for his support of the research on associative data protection.
Conflicts of Interest
The authors declare no conflicts of interest.
Appendix A
Figure A1.
Presentation of the new software implementation of the masking algorithm in the form of an activity diagram in UML.
Figure A1.
Presentation of the new software implementation of the masking algorithm in the form of an activity diagram in UML.
References
- Vershinin, I.S.; Gibadullin, R.F.; Raikhlin, V.A. State of research in the field of associative data protection. Uchenye Zapiski Kazanskogo Universiteta. Seriya Fiziko-Matematicheskie Nauki 2025, 167, 413–436. (In Russian).
- Duda, R.O.; Hart, P.E. Pattern Classification and Scene Analysis; Wiley-Interscience: New York, NY, USA, 1973.
- Ker, A.D. A capacity result for batch steganography. IEEE Signal Processing Letters 2007, 14(8), 525–528.
- Matsumoto, M.; Saito, M.; Nishimura, T.; Hagita, M. CryptMT stream cipher version 3. eSTREAM, ECRYPT Stream Cipher Project, Report 2007, 28.
- Fisher, R.A.; Yates, F. Statistical Tables for Biological, Agricultural and Medical Research, 3rd ed.; Oliver & Boyd: London, UK, 1948.
- Febriani, I.; Ekawati, R.; Supriadi, U.; Abdullah, M.I. Fisher-Yates shuffle algorithm for randomization math exam on computer based-test. In Proceedings of the AIP Conference Proceedings, April 2021; AIP Publishing LLC: 2021; Volume 2331, p. 060015.
- Nicolis, G.; Prigogine, I. Exploring Complexity: An Introduction; W.H. Freeman: New York, NY, USA, 1989.
- Nikitin, E.P. Ob"yasnenie — Funktsiya Nauki (Explanation as a Function of Science); Nauka: Moscow, Russia, 1970. (In Russian).
- Vasilchikov, V.V. On the recursive-parallel programming for the .NET framework. Automatic Control and Computer Sciences 2014, 48(7), 575–580.
- Sabouri, A. BitVector: A Memory-Efficient and High-Performance Struct for Working with Individual Bits in .NET Applications. Available online: https://github.com/alirezanet/BitVector (accessed on 19 December 2025).
- Raikhlin, V.A.; Gibadullin, R.F.; Vershinin, I.S. Is It Possible to Reduce the Sizes of Stegomessages in Associative Steganography? Lobachevskii Journal of Mathematics 2022, 43(2), 455–462.
Figure 1.
The set of postal symbols
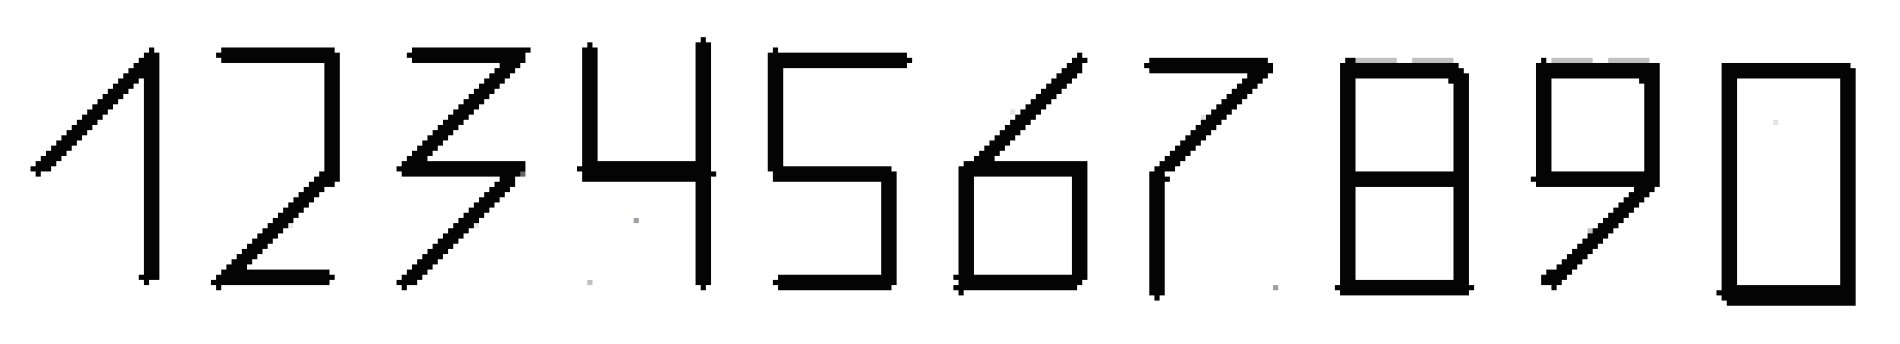
Figure 2.
Positions of binary units in matrix-etalons for (a) and (b)
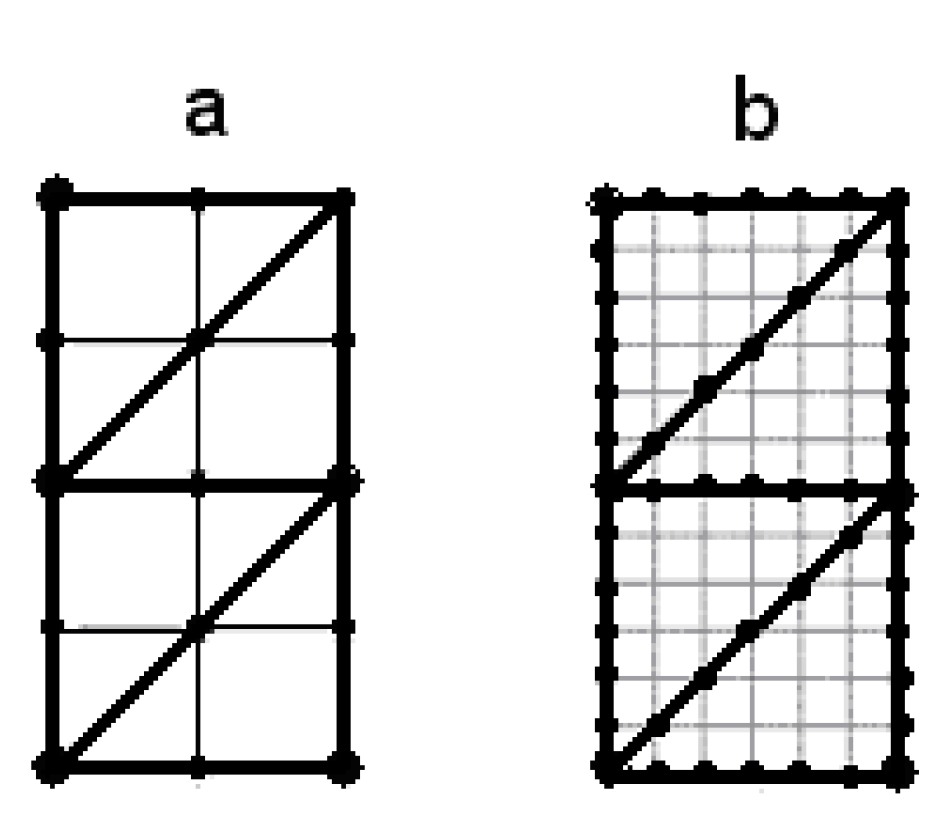
Figure 3.
Total distribution of significant bits for keys according to the outline of the etalon at ,
Figure 3.
Total distribution of significant bits for keys according to the outline of the etalon at ,
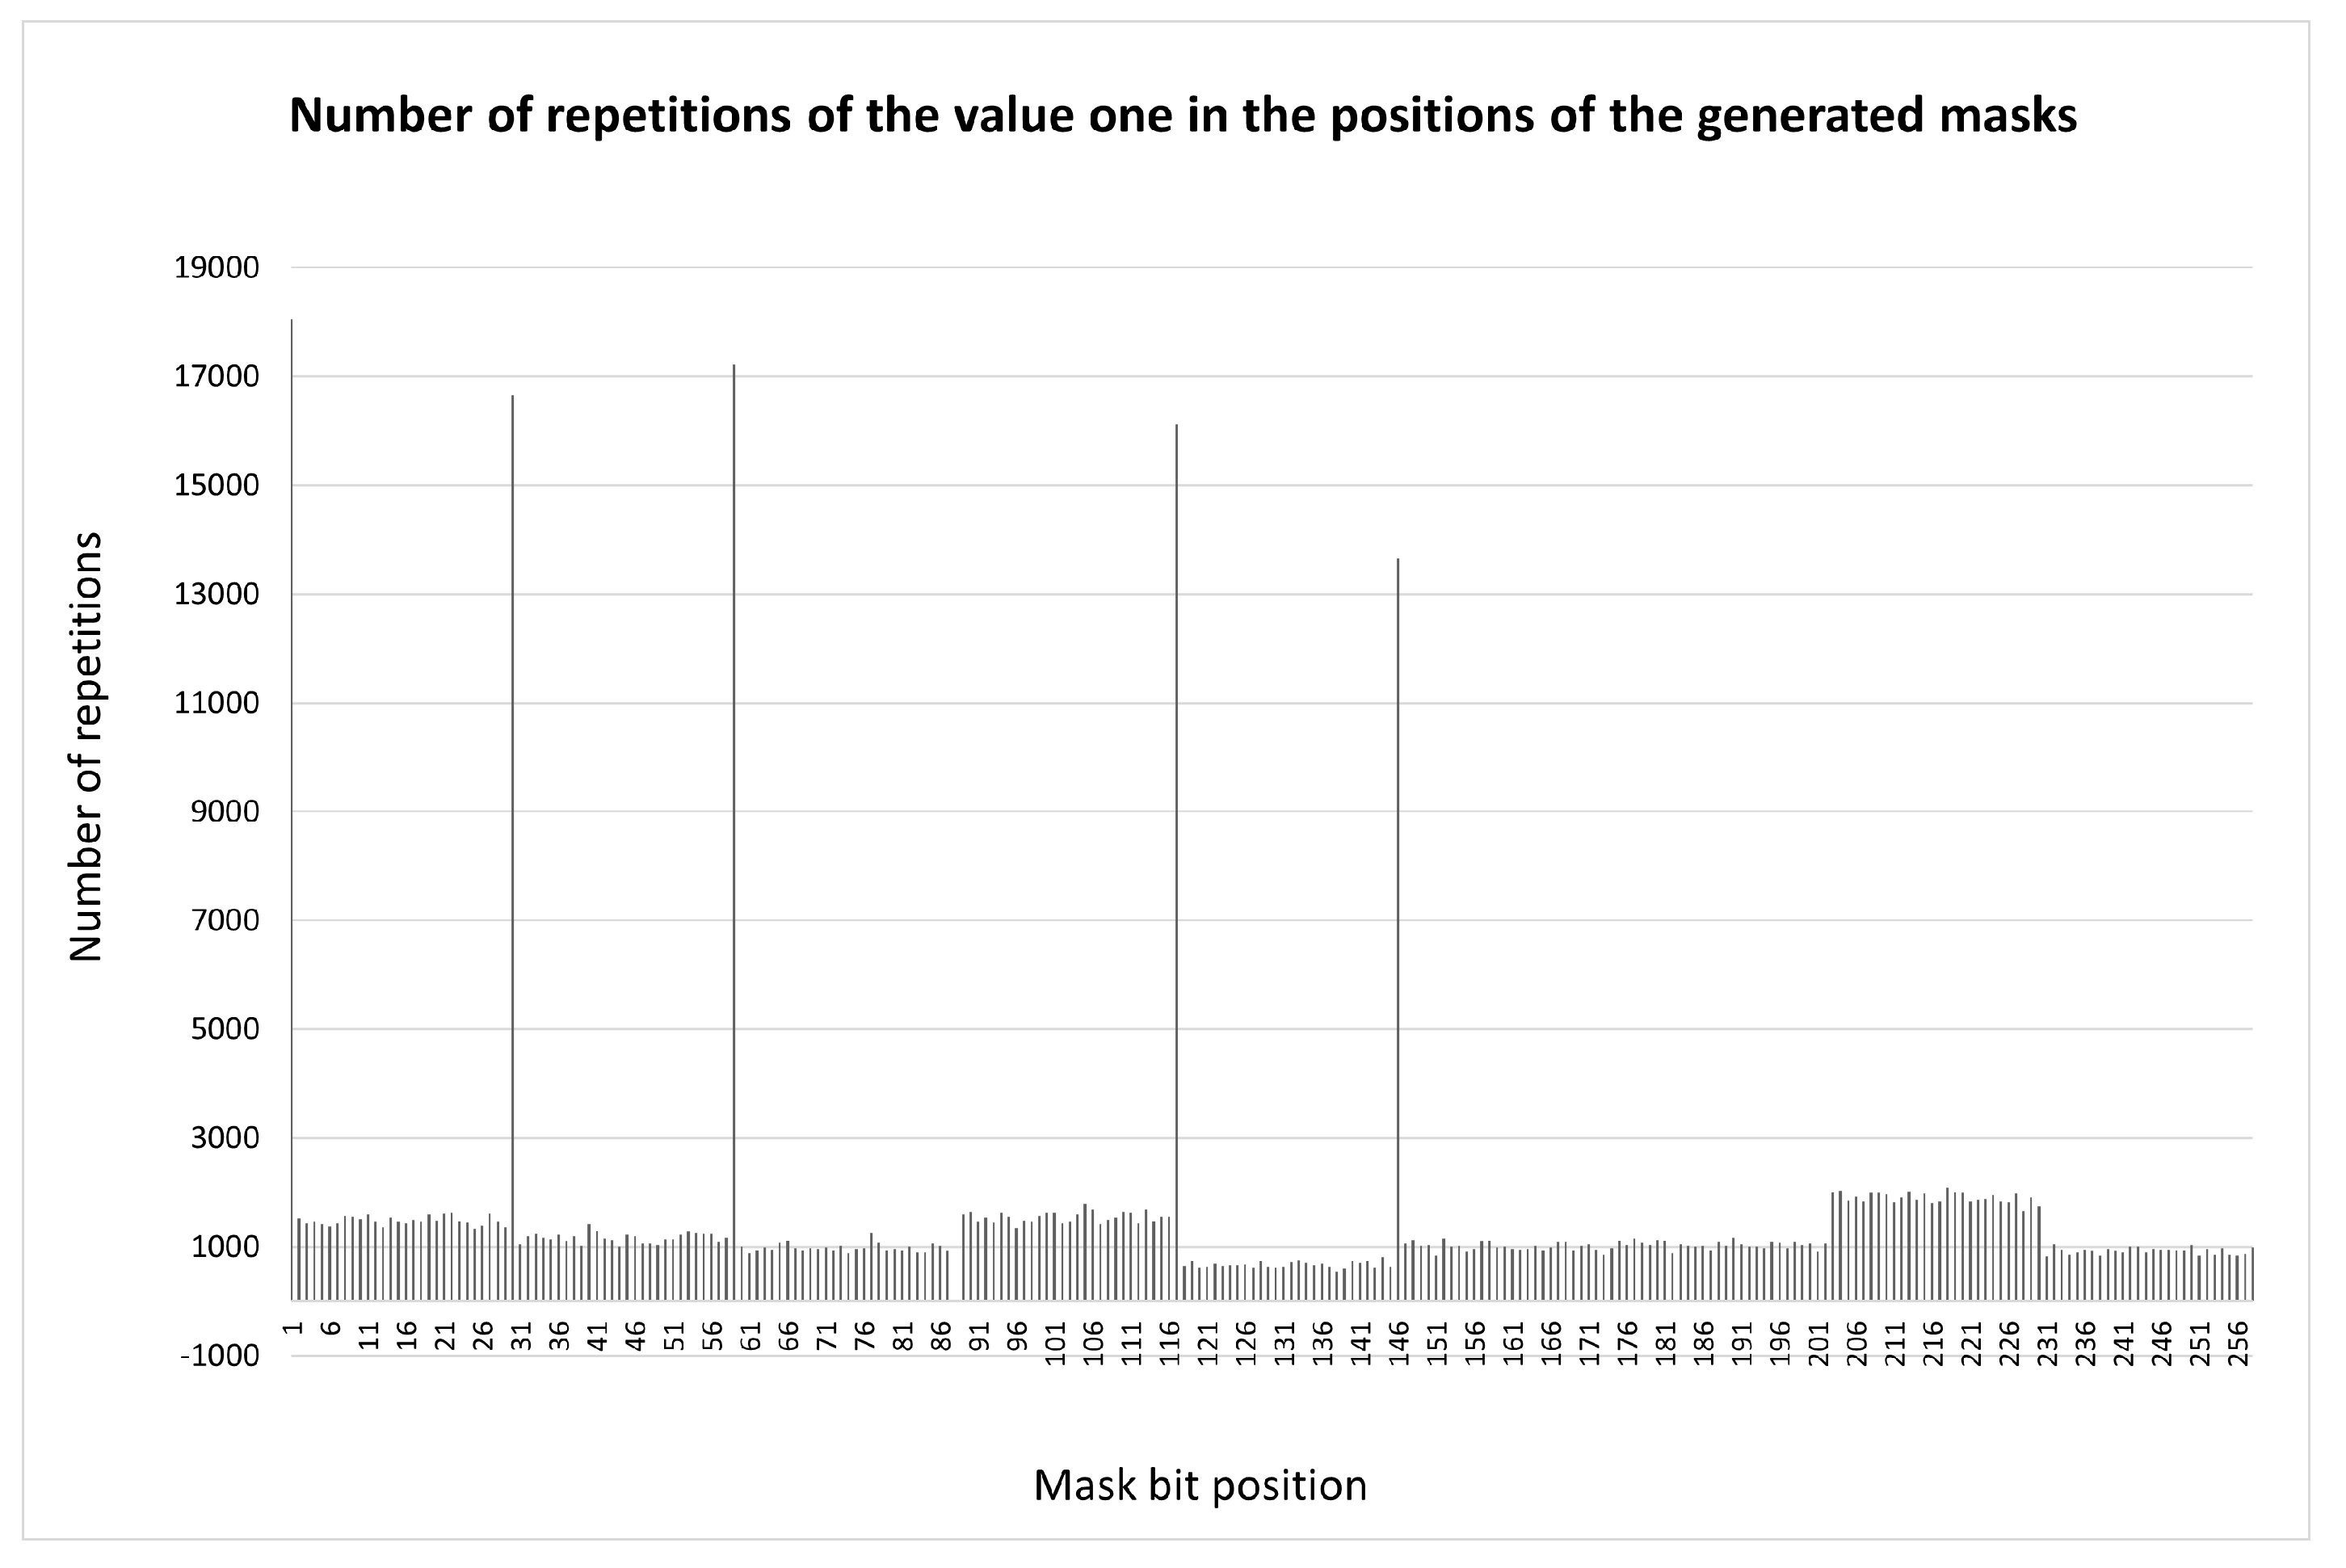
Figure 4.
Total distribution of significant bits for keys according to the etalon outline at ,
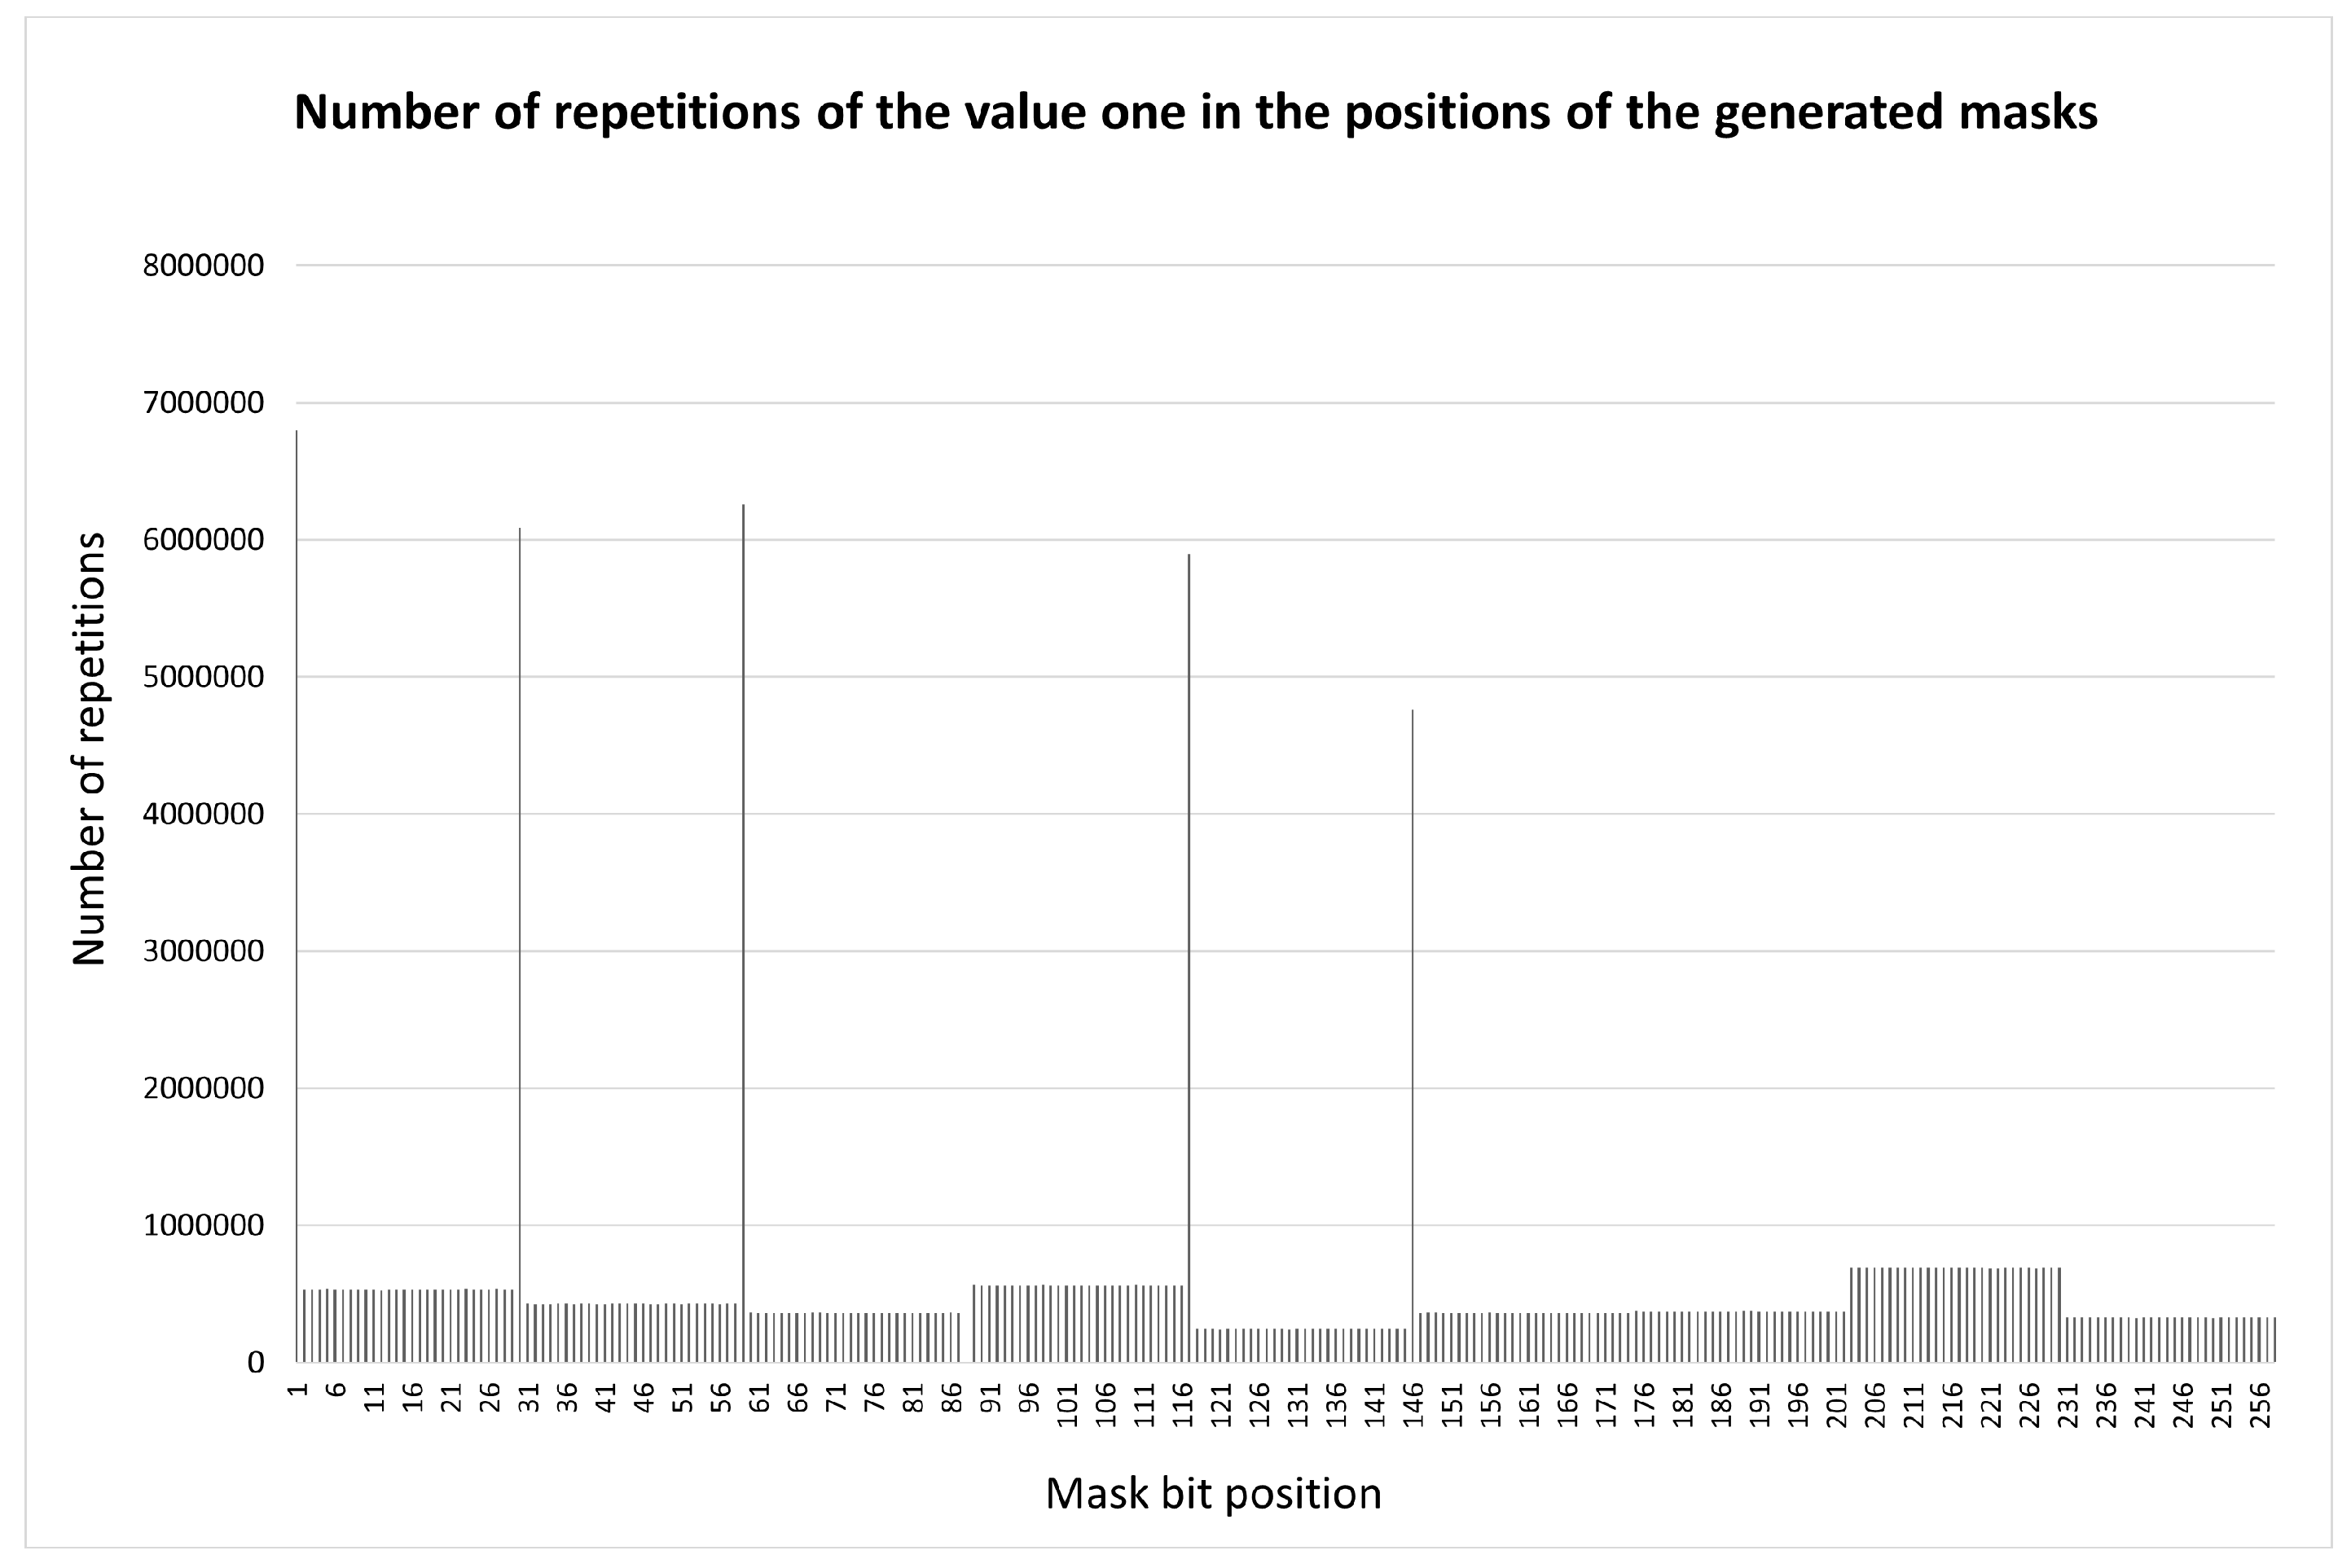
Figure 5.
Total distribution of significant bits for a set of keys according to the etalon outline at , obtained by enumerating the test list of permutations
Figure 5.
Total distribution of significant bits for a set of keys according to the etalon outline at , obtained by enumerating the test list of permutations
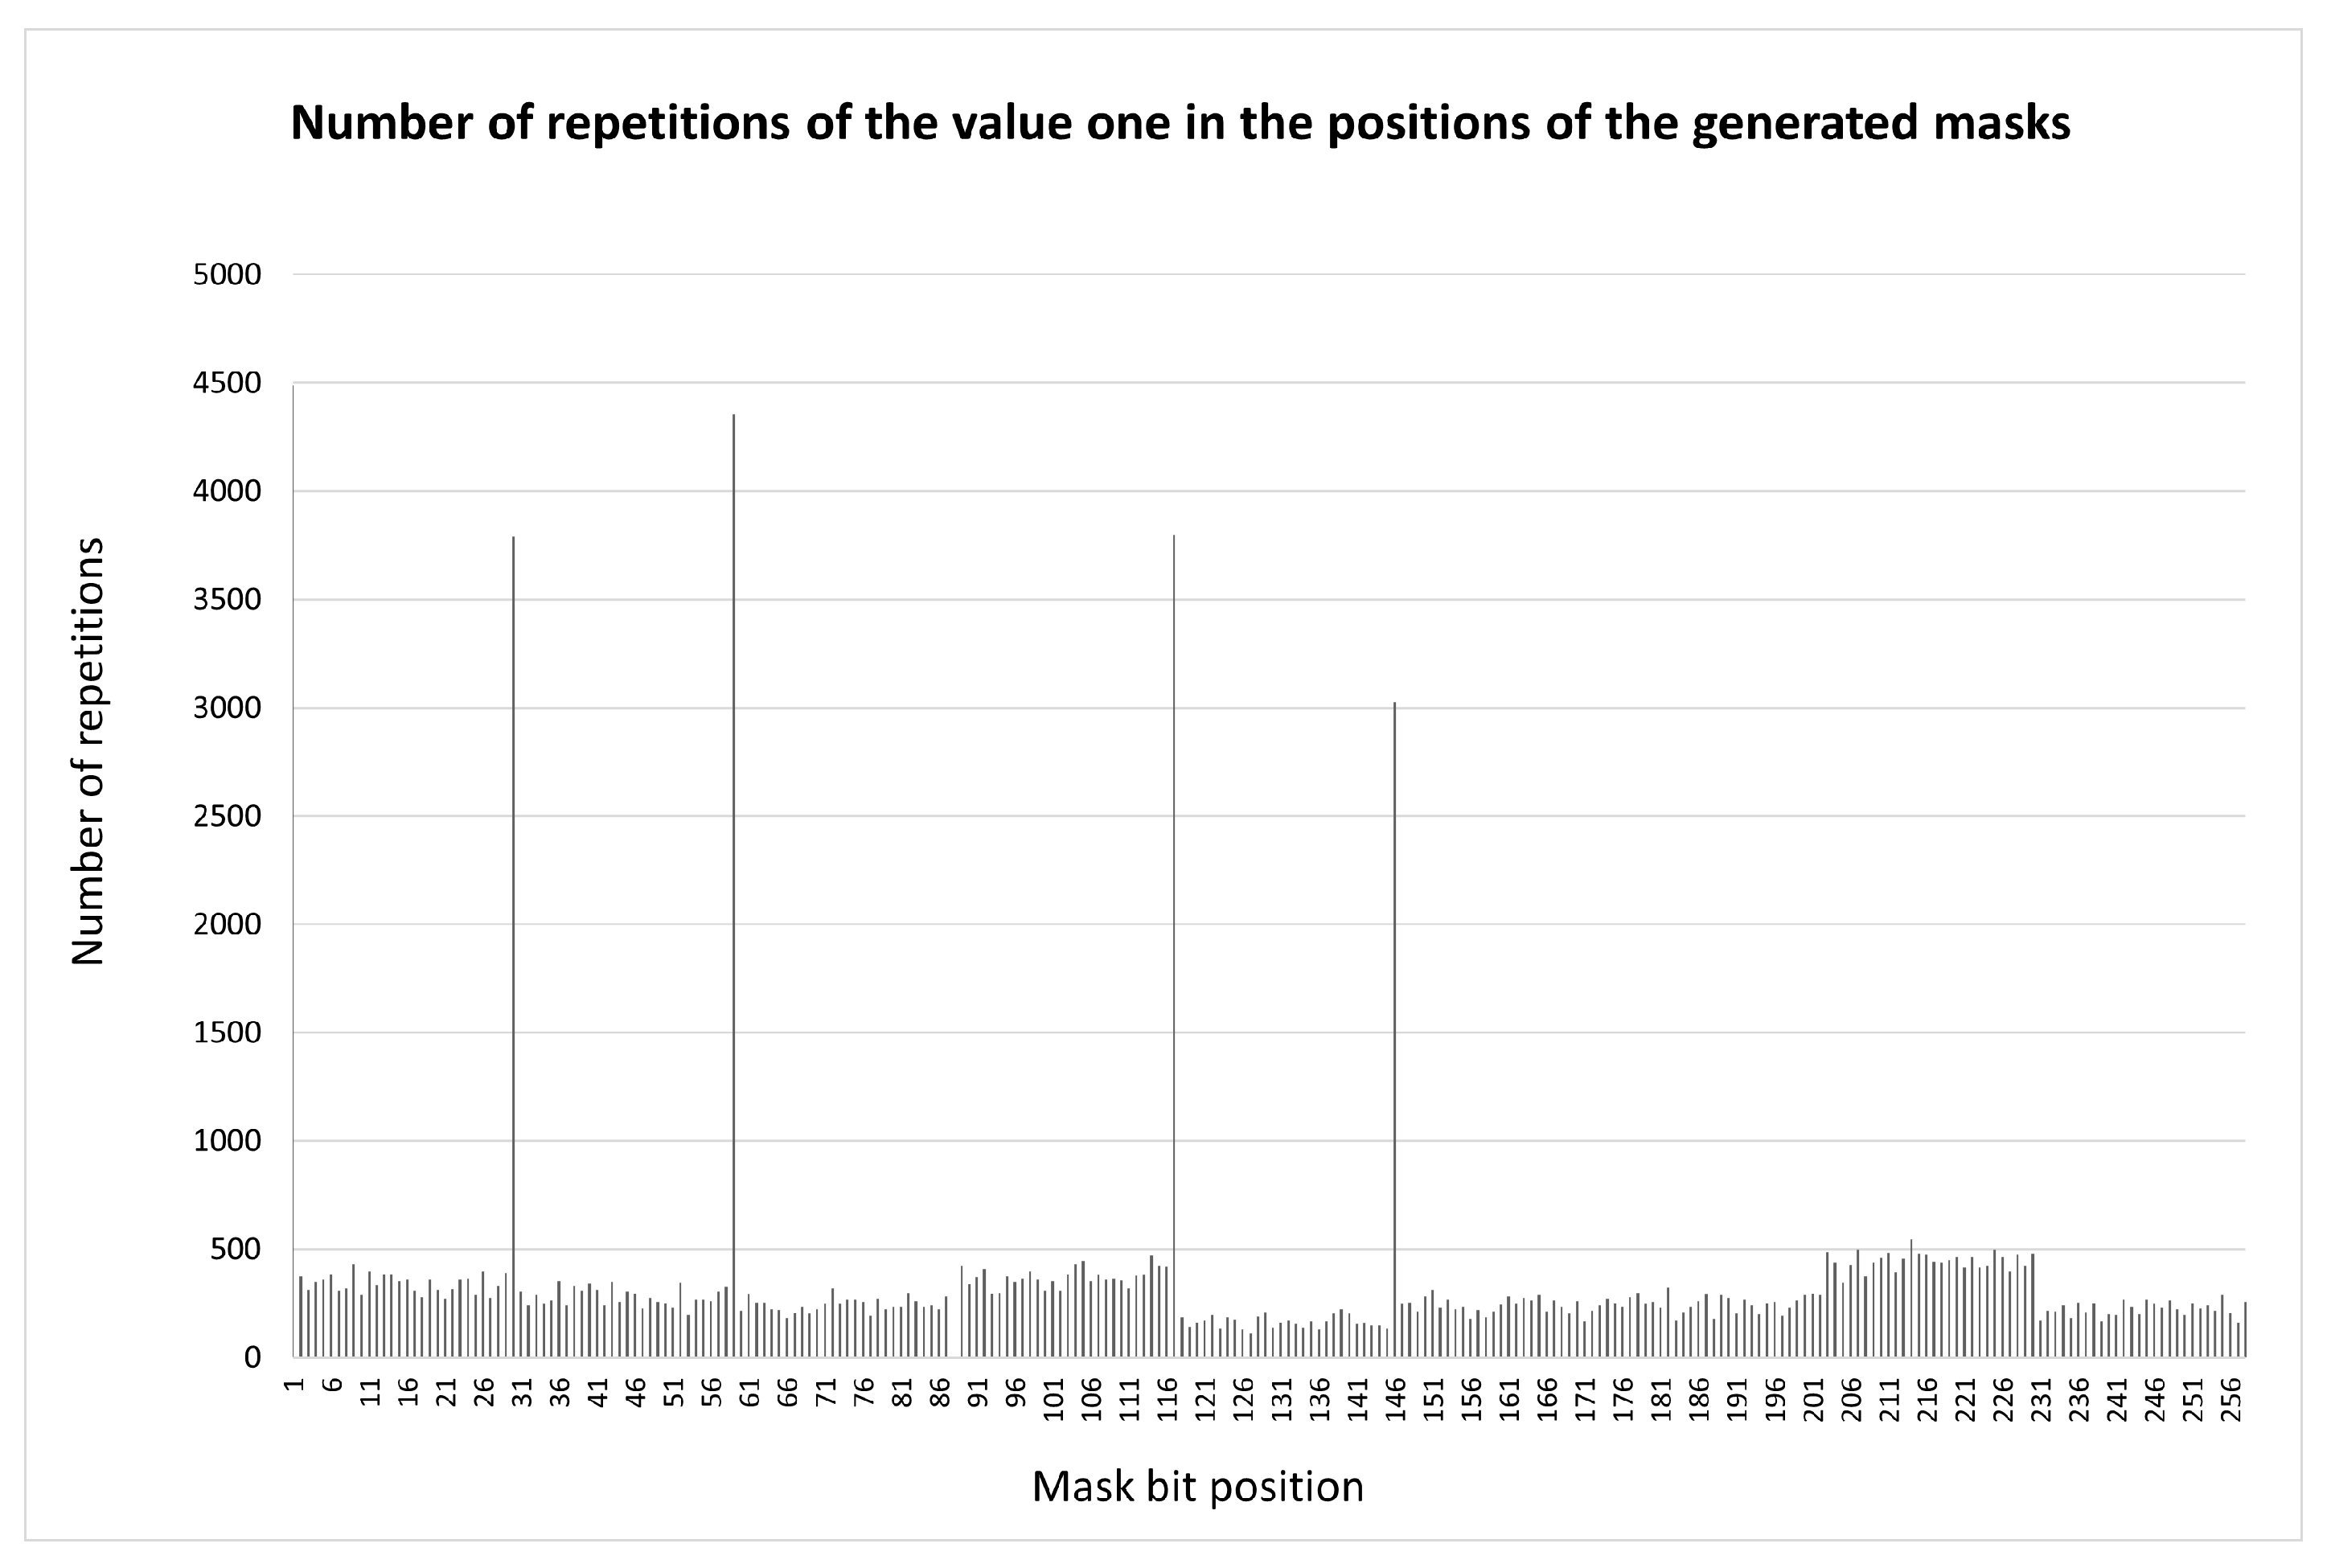
Figure 6.
The proposed etalon configurations of sets (a) and (b)
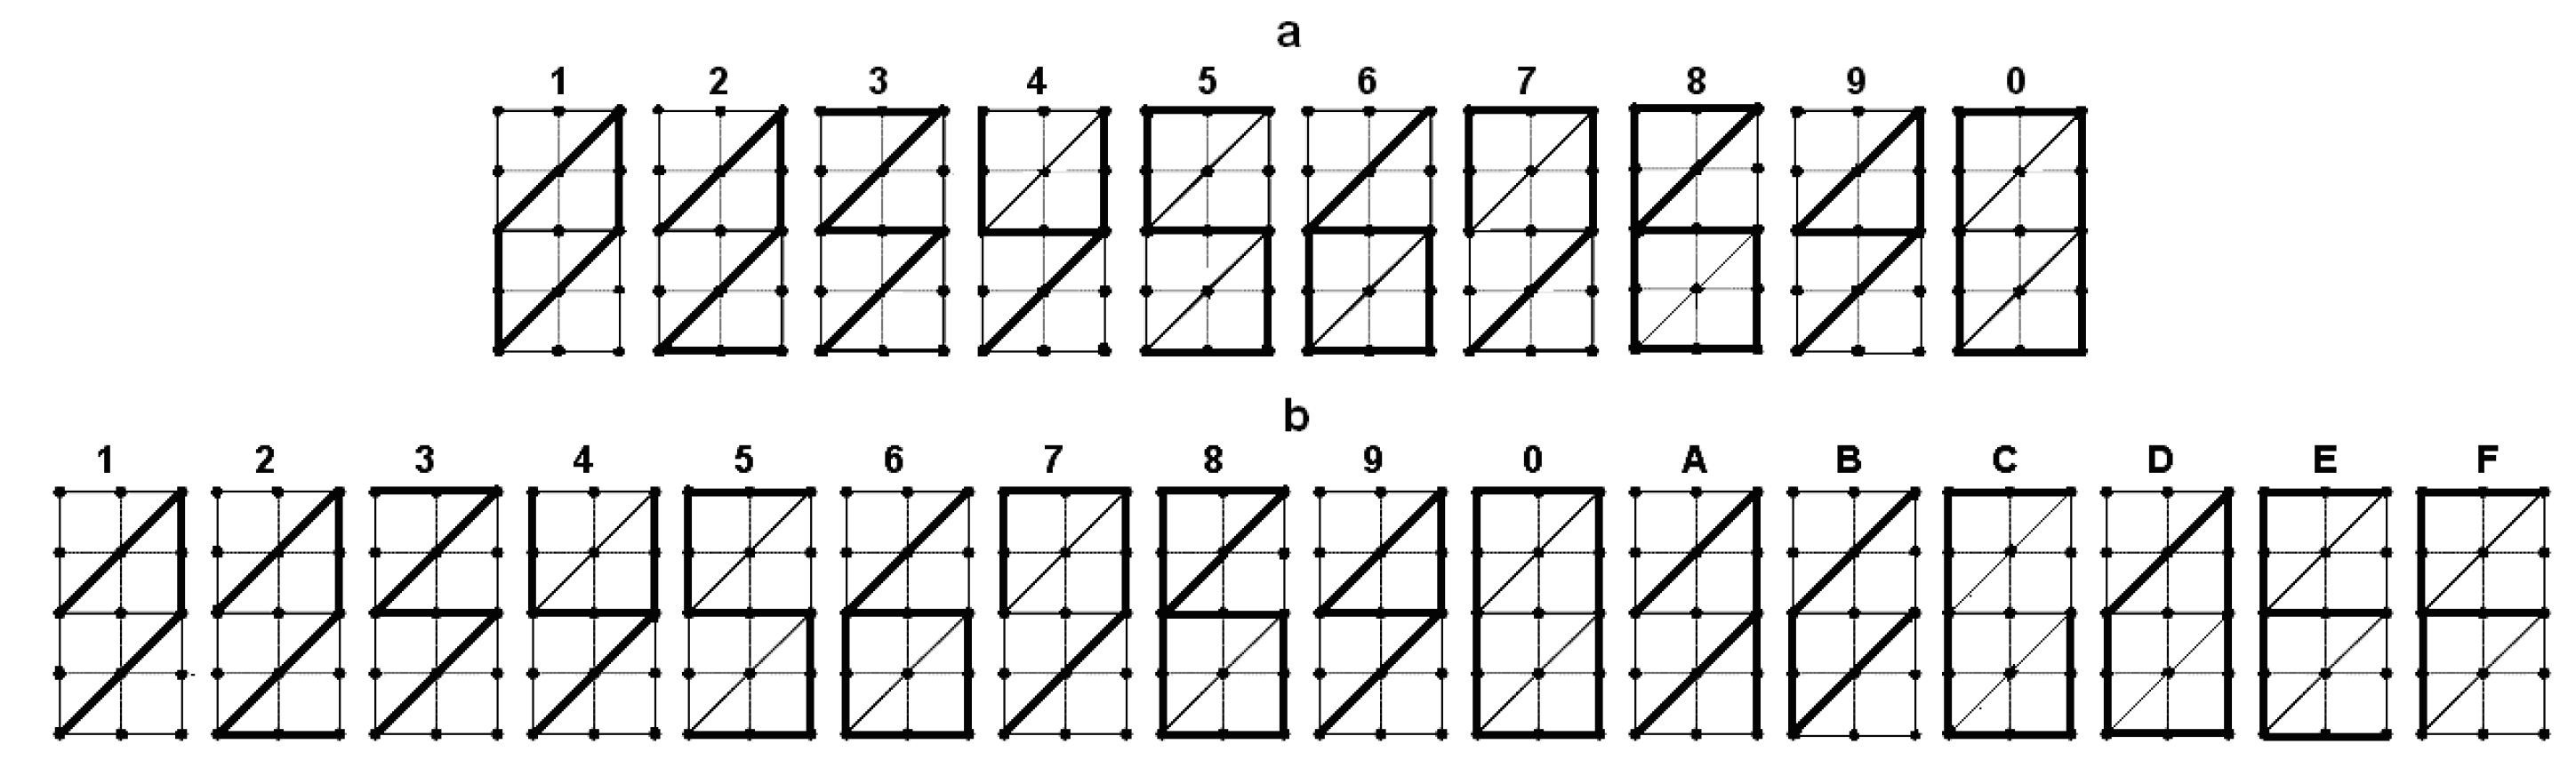
Figure 7.
Found labels of the set
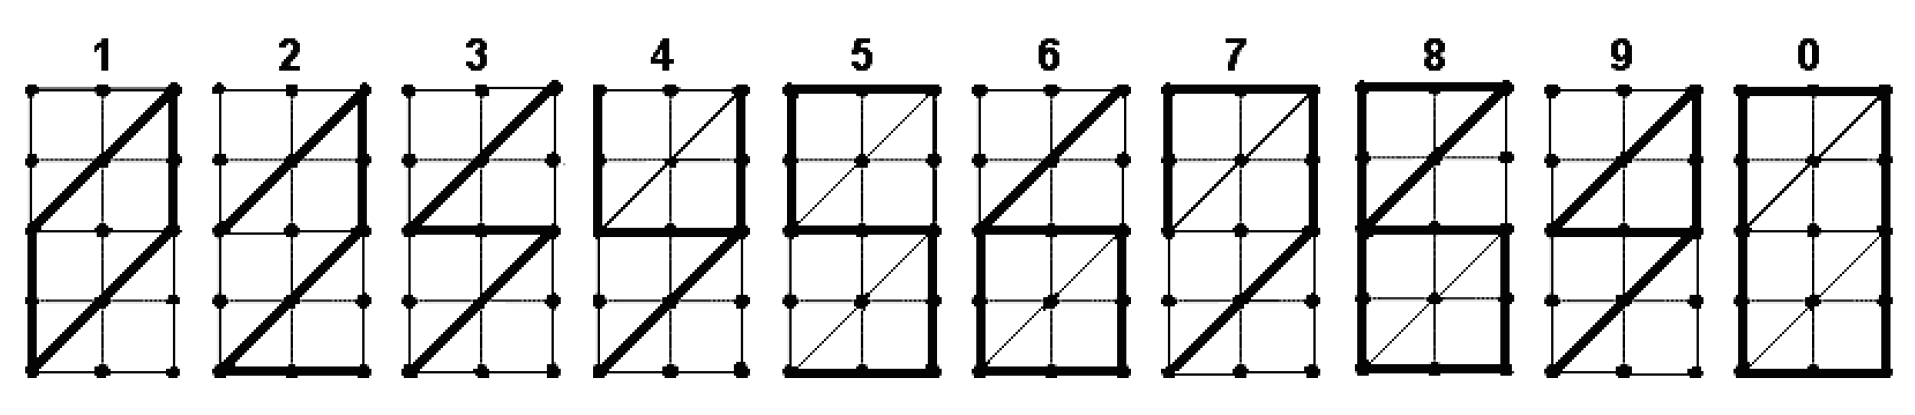
Figure 8.
Distribution of significant bits for the found etalon labels at , and permutations
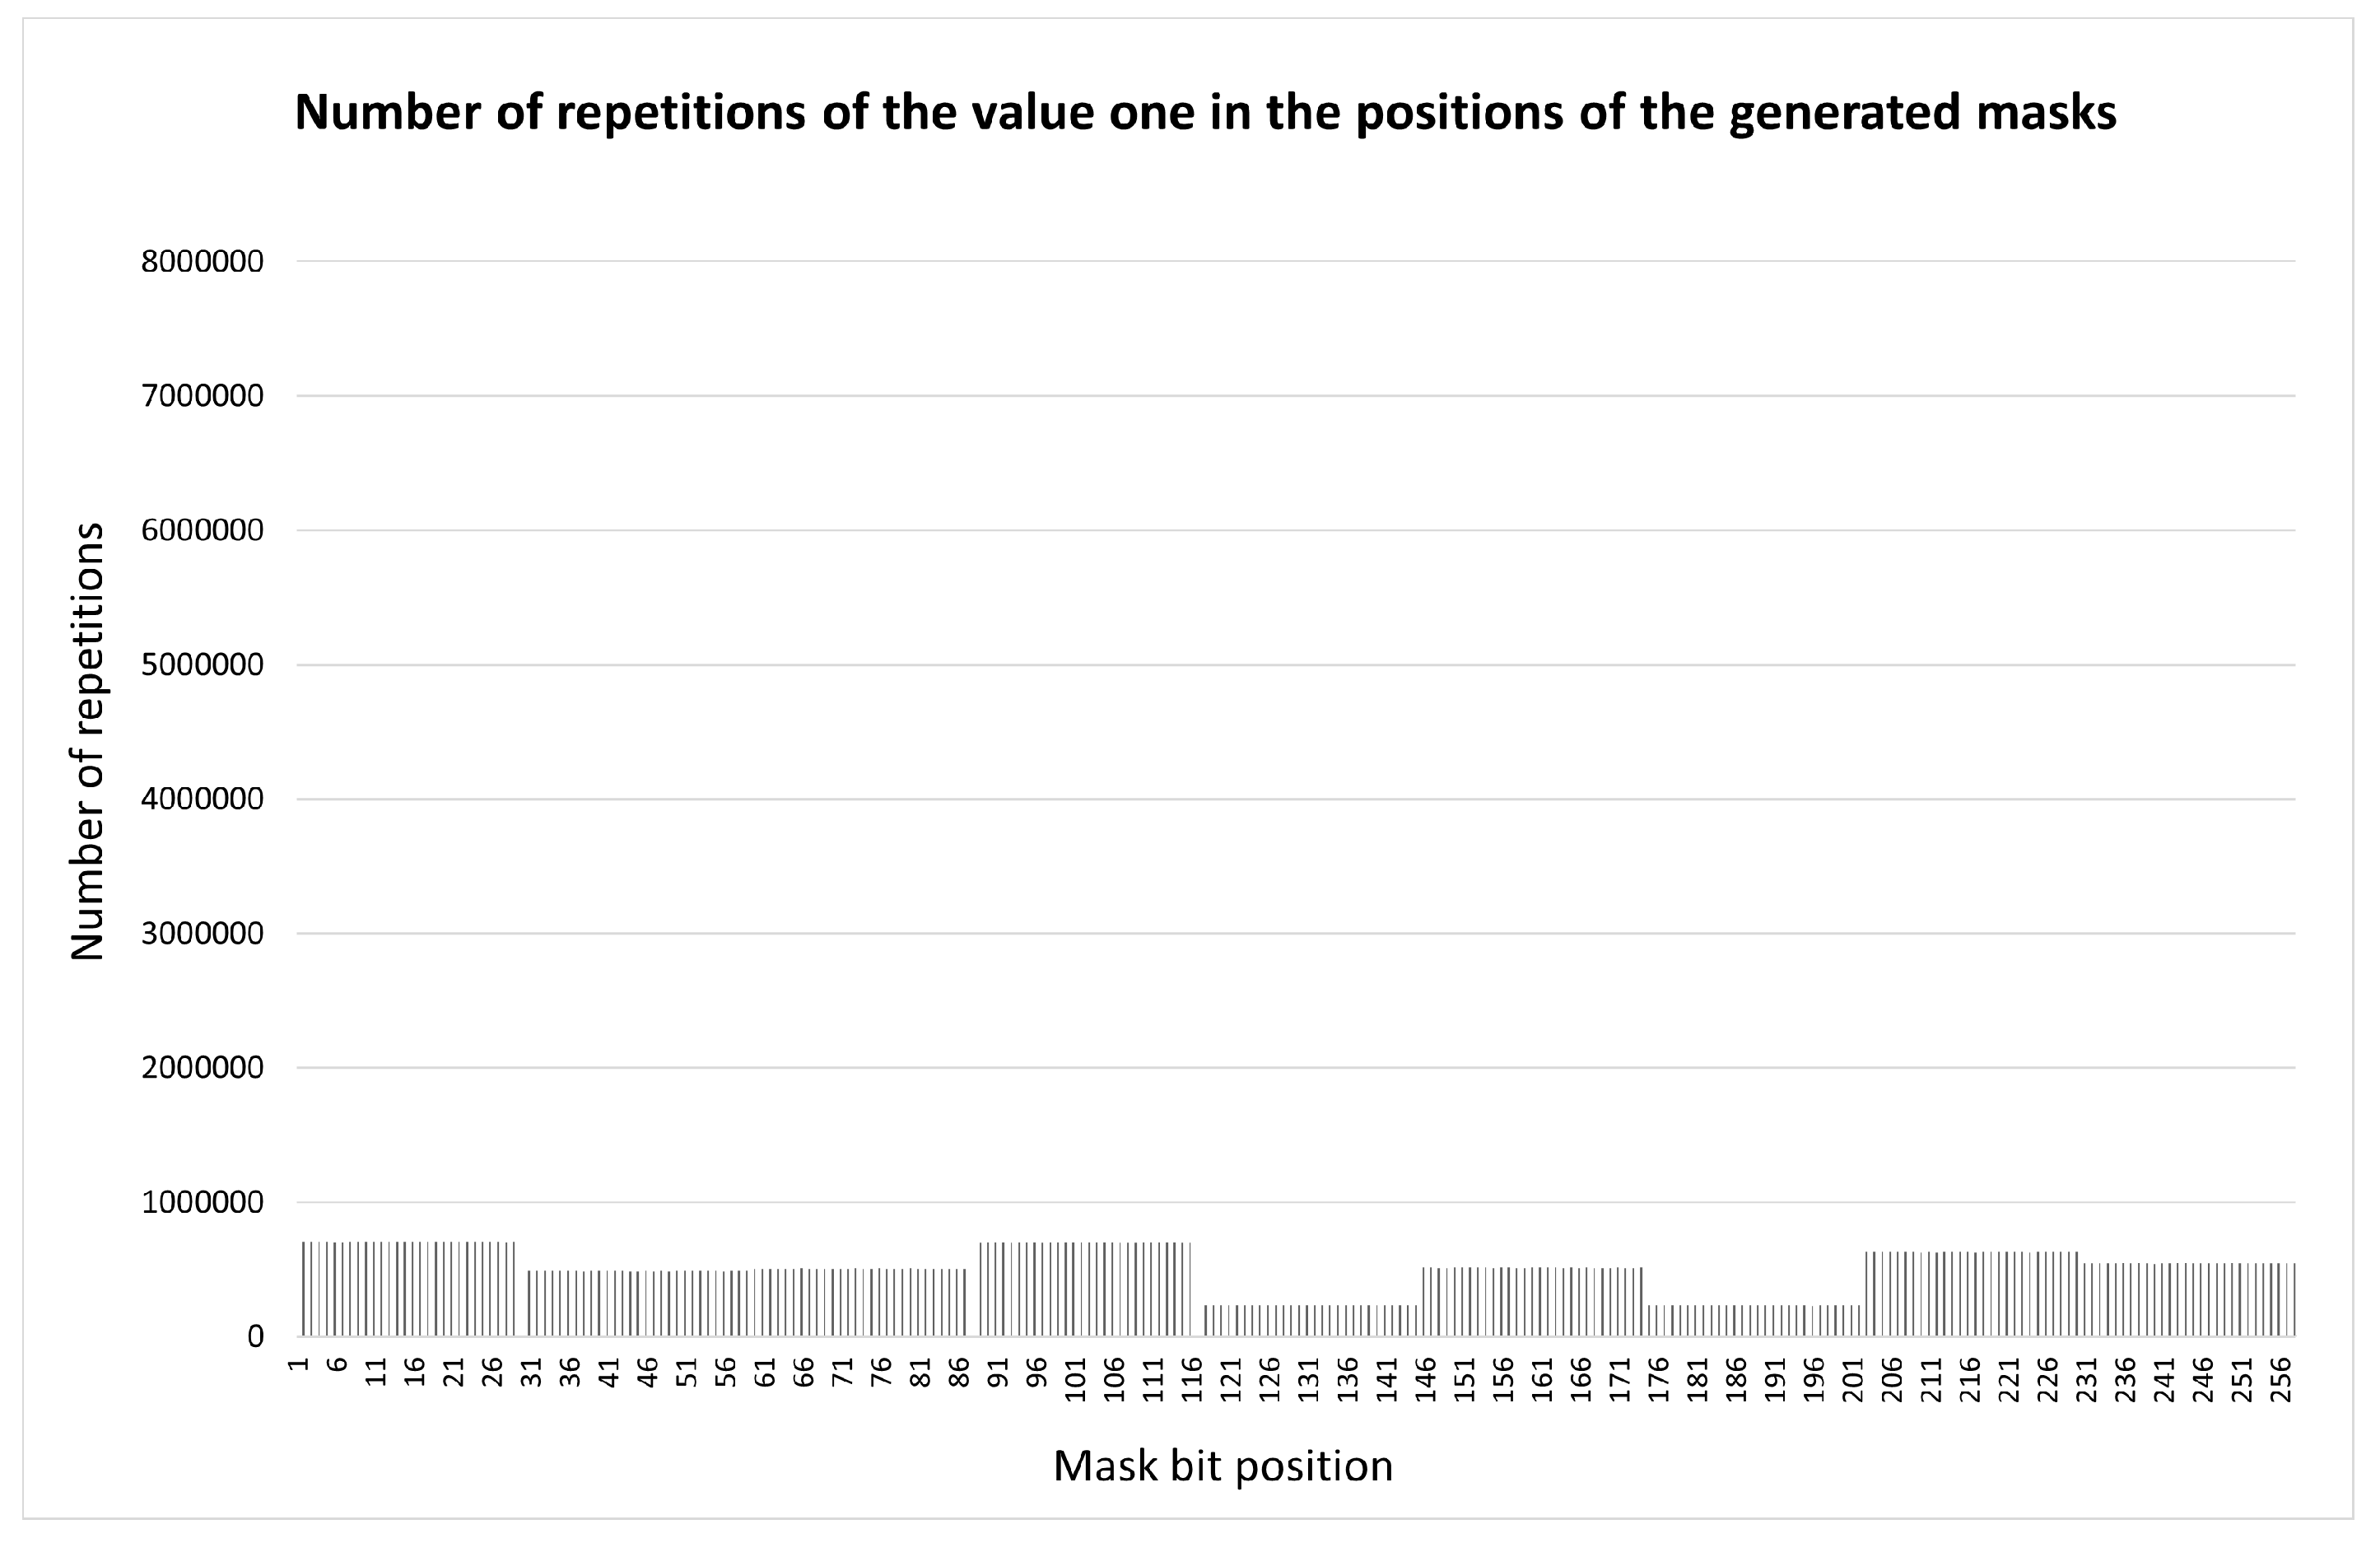
Figure 9.
Refined etalon labels of the set
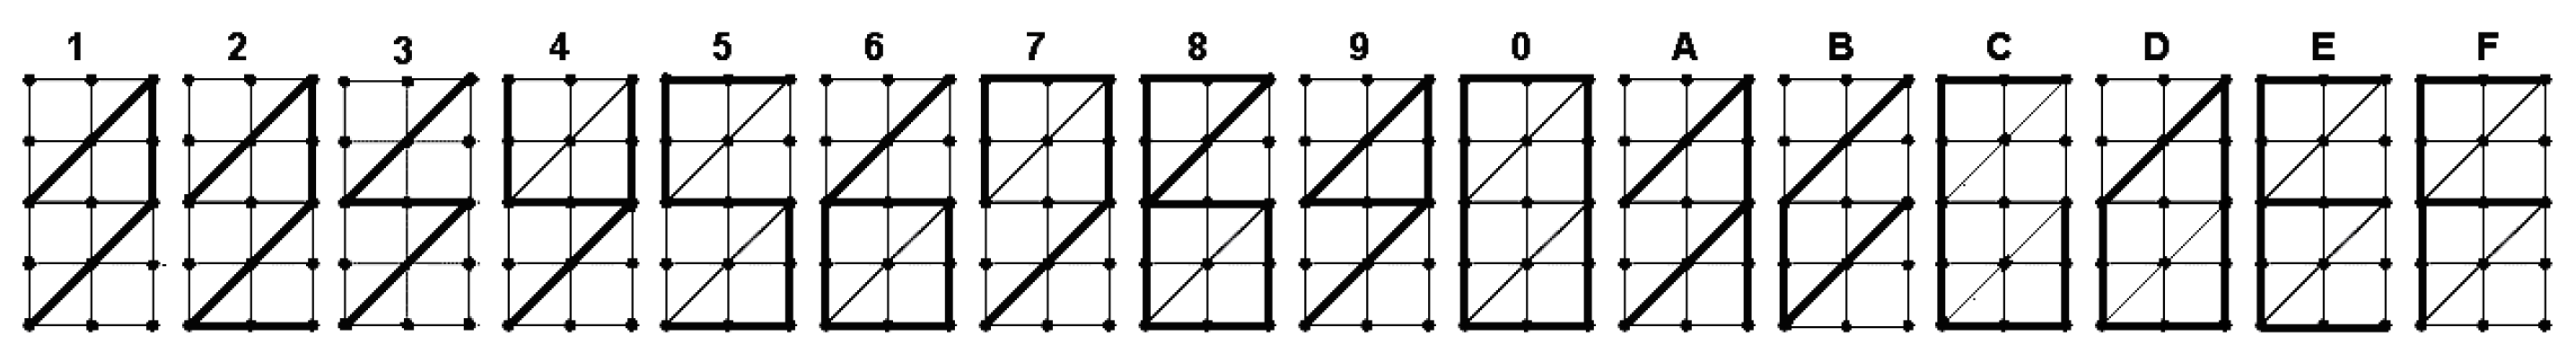
Figure 10.
Distribution of significant bits for refined etalon configurations at , obtained through enumeration of the test list of permutations
Figure 10.
Distribution of significant bits for refined etalon configurations at , obtained through enumeration of the test list of permutations
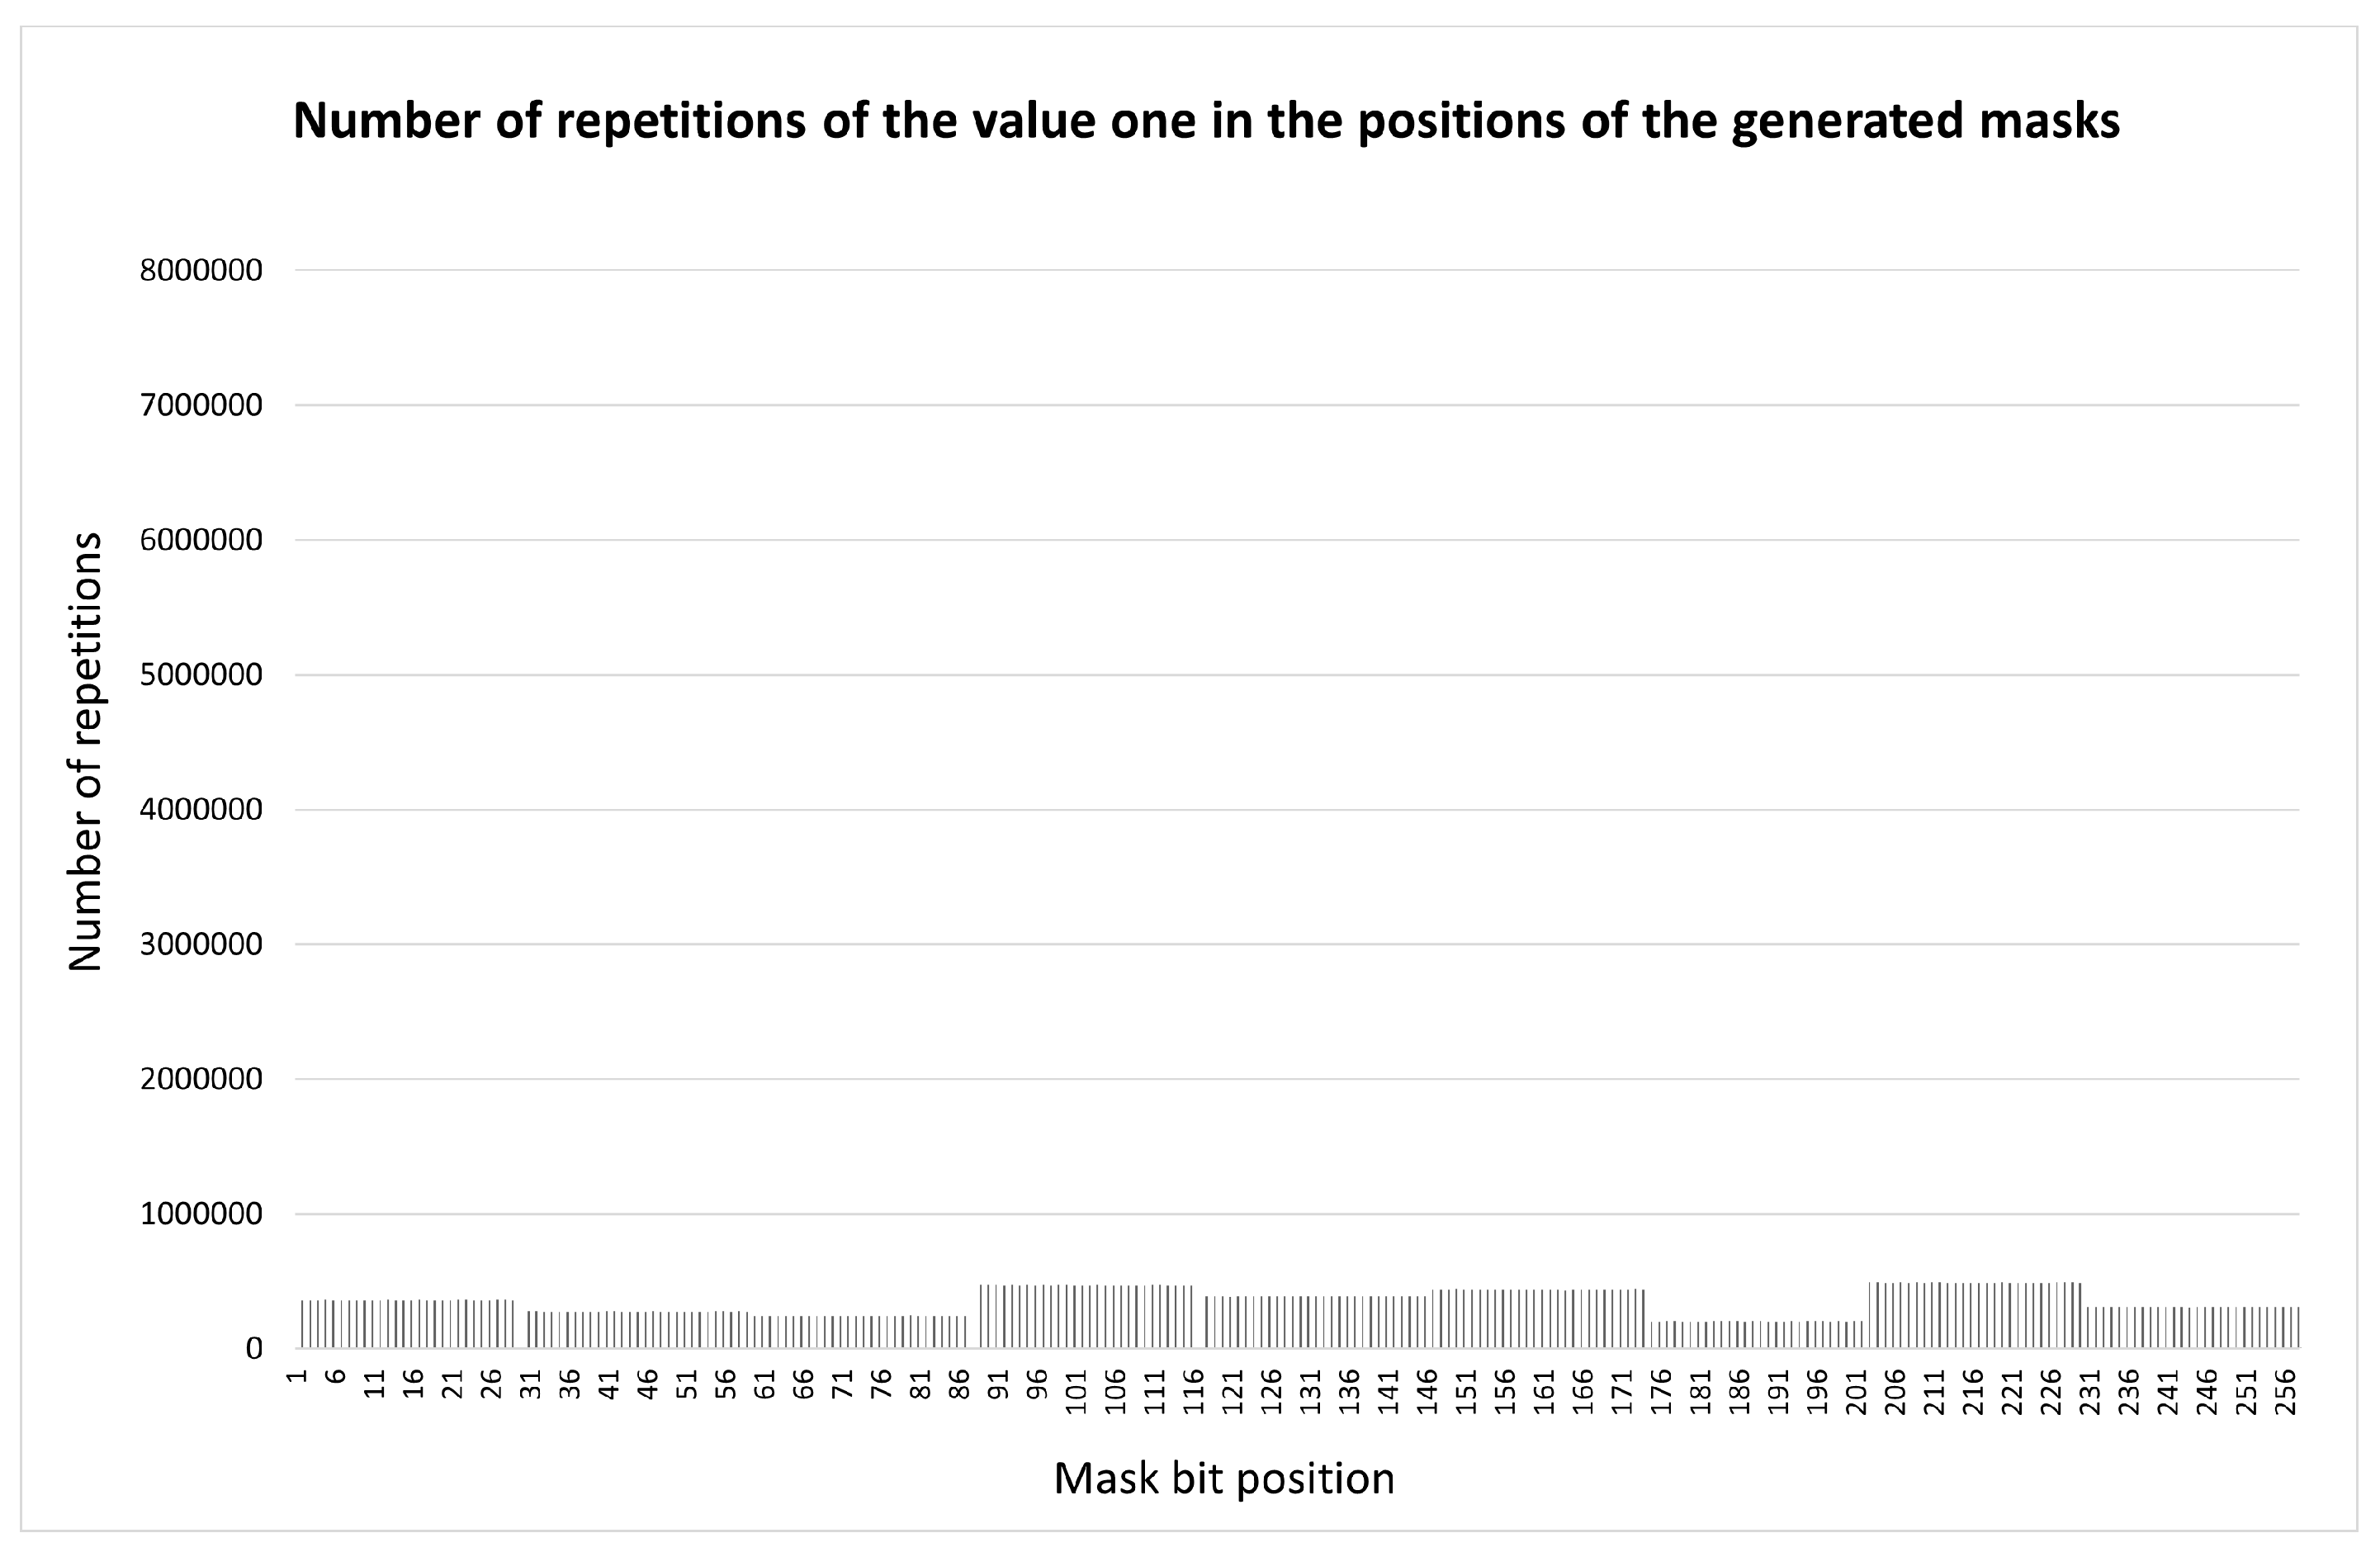

Table 1.
The complete set of permutations in a sequence of 5 elements.
| (E D) C B A | (D C) B A E | (C B) A E D | (B A) E D C | (A E) D C B |
|---|---|---|---|---|
| (E D) C A B | (D C) B E A | (C B) A D E | (B A) E C D | (A E) D B C |
| (E D) B A C | (D C) A E B | (C B) E D A | (B A) D C E | (A E) C B D |
| (E D) B C A | (D C) A B E | (C B) E A D | (B A) D E C | (A E) C D B |
| (E D) A C B | (D C) E B A | (C B) D A E | (B A) C E D | (A E) B D C |
| (E D) A B C | (D C) E A B | (C B) D E A | (B A) C D E | (A E) B C D |
| (E C) B A D | (D B) A E C | (C A) E D B | (B E) D C A | (A D) C B E |
| (E C) B D A | (D B) A C E | (C A) E B D | (B E) D A C | (A D) C E B |
| (E C) A D B | (D B) E C A | (C A) D B E | (B E) C A D | (A D) B E C |
| (E C) A B D | (D B) E A C | (C A) D E B | (B E) C D A | (A D) B C E |
| (E C) D B A | (D B) C A E | (C A) B E D | (B E) A D C | (A D) E C B |
| (E C) D A B | (D B) C E A | (C A) B D E | (B E) A C D | (A D) E B C |
| (E B) A D C | (D A) E C B | (C E) D B A | (B D) C A E | (A C) B E D |
| (E B) A C D | (D A) E B C | (C E) D A B | (B D) C E A | (A C) B D E |
| (E B) D C A | (D A) C B E | (C E) B A D | (B D) A E C | (A C) E D B |
| (E B) D A C | (D A) C E B | (C E) B D A | (B D) A C E | (A C) E B D |
| (E B) C A D | (D A) B E C | (C E) A D B | (B D) E C A | (A C) D B E |
| (E B) C D A | (D A) B C E | (C E) A B D | (B D) E A C | (A C) D E B |
| (E A) D C B | (D E) C B A | (C D) B A E | (B C) A E D | (A B) E D C |
| (E A) D B C | (D E) C A B | (C D) B E A | (B C) A D E | (A B) E C D |
| (E A) C B D | (D E) B A C | (C D) A E B | (B C) E D A | (A B) D C E |
| (E A) C D B | (D E) B C A | (C D) A B E | (B C) E A D | (A B) D E C |
| (E A) B D C | (D E) A C B | (C D) E B A | (B C) D A E | (A B) C E D |
| (E A) B C D | (D E) A B C | (C D) E A B | (B C) D E A | (A B) C D E |
Table 2.
Formation of the test list of permutations for .
| (D C) (B A) | (C B) (A D) | (B A) (D C) | (A D) (C B) |
|---|---|---|---|
| C D B A | B C A D | A B D C | D A C B |
| D C A B | C B D A | B A C D | A D B C |
Table 3.
Formation of the test list of permutations for .
| (F E D) (C B A) | (E D C) (B A F) | (D C B) (A F E) | (C B A) (F E D) | (B A F) (E D C) | (A F E) (D C B) |
|---|---|---|---|---|---|
| E D F C B A | D C E B A F | C B D A F E | B A C F E D | A F B E D C | F E A D C B |
| D F E C B A | C E D B A F | B D C A F E | A C B F E D | F B A E D C | E A F D C B |
| F D E C B A | E C D B A F | D B C A F E | C A B F E D | B F A E D C | A E F D C B |
| E F D C B A | D E C B A F | C D B A F E | B C A F E D | A B F E D C | F A E D C B |
| D E F C B A | C D E B A F | B C D A F E | A B C F E D | F A B E D C | E F A D C B |
| F E D B A C | E D C A F B | D C B F E A | C B A E D F | B A F D C E | A F E C B D |
| F E D A C B | E D C F B A | D C B E A F | C B A D F E | B A F C E D | A F E B D C |
| F E D C A B | E D C B F A | D C B A E F | C B A F D E | B A F E C D | A F E D B C |
| F E D B C A | E D C A B F | D C B F A E | C B A E F D | B A F D E C | A F E C D B |
| F E D A B C | E D C F A B | D C B E F A | C B A D E F | B A F C D E | A F E B C D |
Disclaimer/Publisher’s Note: The statements, opinions and data contained in all publications are solely those of the individual author(s) and contributor(s) and not of MDPI and/or the editor(s). MDPI and/or the editor(s) disclaim responsibility for any injury to people or property resulting from any ideas, methods, instructions or products referred to in the content. |
© 2026 by the authors. Licensee MDPI, Basel, Switzerland. This article is an open access article distributed under the terms and conditions of the Creative Commons Attribution (CC BY) license (http://creativecommons.org/licenses/by/4.0/).
Copyright: This open access article is published under a Creative Commons CC BY 4.0 license, which permit the free download, distribution, and reuse, provided that the author and preprint are cited in any reuse.


