
Submitted:
18 December 2024
Posted:
18 December 2024
You are already at the latest version
Abstract
Digital data protection is important to prevent changes and manipulation of digital data by unauthorized parties. Reliable, secure and fast digital data security techniques are needed. One such technique is the use of cryptography. This paper discusses the implementation of MS Circle Map in cryptography for data security. The object used in this study is a digital image. Encryption algorithms that use chaos functions to secure digital data must have a high key space and fast processing time. This research was conducted by designing an algorithm for encryption and decryption and then implementing it with Python programming. The MS Circle function has six parameters (x0,r, λ, K, Ω, t) to obtain a sufficiently high key space 1.889×101,267 1.889×101,267combination and has a key sensitivity level of 10-16. The MS Circle Map function has high resistance to various attacks. This is evidenced by the results from the key space, initial value sensitivity test, goodness of fit test, entropy, correlation coefficient, NPCR test, UACI test and image quality test. Based on the tests carried out, it was found that the MS Circle Map algorithm successfully resisted brute force, statistical, and differential attacks. The results of image quality tests using MSE and PSNR showed that the digital image decryption stage was successful and the original image could be restored.
Keywords:
chaos function
; circle map
; decryption algorithm
; encryption algorithm
; MS map
; MS Circle map
1. Introduction
Currently, communication and information technology is developing very rapidly. This development can be seen by the ease of obtaining information with the internet. The internet is a medium that can facilitate its users in obtaining various information and communication processes from any part of the world and at any time. Someone can easily send personal data to others so that the data can be widely distributed on the internet.
Highly confidential personal data needs to be secured from the threat of manipulation or data theft. This is done so that the data is not known by unauthorized parties. Digital images are one form of digital data or information that is often targeted by crime. Cryptography is a reliable, safe, and fast security technique that can be implemented on digital images. The cryptography process is basically very simple. The original data or information is called plaintext while the data or information that has been encoded is called ciphertext. In this case, the original image acts as plaintext. Encryption is the process of changing the original image into an encrypted image. While the reverse process, namely decryption, is the process of changing the encrypted image back into the original image. The algorithm for transforming plaintext into ciphertext is called a cipher.
The performance of an algorithm can be seen from the security resistance of the algorithm to attacks and its computation time. Although image encryption algorithms require a small key space and long computation time, they produce well-encrypted data. However, digital image encryption is preferred which has a faster time and maintains security [1]. The use of chaos-based image encryption is one solution to the problem of image security.
Researchers [2] developed the Logistic-Gauss Map Algorithm. The Logistic-Gauss Map Algorithm by composing the Logistic map and Gauss map functions to produce a key space of and a key sensitivity value of . This algorithm is difficult to attack with brute force attacks. In addition, testing attacks on encrypted image data using statistical attacks and differential attacks shows that this algorithm has high durability.
The algorithm is sequentially arranged between Logistic Map and Chebyshev Map [3]. This method is used to ensure the transmission of medical images. First, the image is encrypted with Logistic Map, then the encrypted image is generated, and then the encrypted image is encrypted again with Chebyshev Map. In other words, the medical image is encrypted in two steps using two functions. The same method is used in the decryption process. This algorithm has four parameters, when the parameter value for the logistic map is set to an impossible value, the image is no longer secure. In addition, it also takes longer to perform the encryption technique twice.
Other researchers have proposed encryption algorithms using chaos logistic map and DNA encoding functions to improve the security level of image encryption algorithms. DNA encoding is used to scramble pixel values into DNA bases and scramble them in DNA addition, DNA complement and XOR operations. Meanwhile, the logistic function is used as a keystream generator required in DNA complement and XOR operations [4]. There have been some research on chaos function-based encryption algorithms, such as those using chaos functions Logistic map [5] which produces a key space of , and those using MS map [6,7] which produces a keyspace of , those using Gauss Iterated map [8] which has a Number of Changing pixel Rate (NPCR) value of 93. 6% and Unified Averaged Intensity (UACI) of 27.9%, those using Gauss & Circle [9] which produces a key space of 2.6244 x 10 1269, [10] and those which develops an image encryption algorithm using logistic map and Piecewise Linear Chaotic map which has a key sensitivity value of 10-10 resistance to brute force attack.
In this study, digital image encryption and decryption were carried out through the composition of MS Map and Circle Map functions. The developed algorithm aims to improve security resilience against various attacks and speed up the process time in digital image encryption. The performance of the proposed algorithm was tested using initial value sensitivity level analysis, key space analysis, histogram, correlation, entropy, NPCR, UACI, MSE and PSNR.
2. Materials and Methods
2.1. Criptography
According to Schneier [11], Cryptography is the science and art of learning how to maintain the security of a message. Meanwhile, Menezes, et. al. [12] define cryptography as a field that studies mathematical techniques related to aspects of data security, such as confidentiality, validity, integrity, and authentication.
Apart from aiming to provide security and confidentiality of information, another goal of cryptography is to provide data integrity services, namely to ensure that the message remains original or the message has not been manipulated. Authentication is used to ensure that both the communicating party and the source of the information are correct. Non- repudiation is intended to prevent communicating entities from making communication errors, namely the sender of the message denying sending the message or the receiver of the message denying receiving the message [13].
The original data or information is called plaintext while the data or information that has been encoded is called ciphertext. The process of converting plaintext into ciphertext is called encryption. However, the reverse process of converting ciphertext into plaintext is called decryption. The encryption and decryption process requires a key that is only known by the sender or receiver [14].
2.2. MS Map
MS Map is one of the new chaotic maps modified from logistic map. The modification is done by changing the general form of the logistic map [6,7]. MS Map can be seen in Equation (1) below:
with the definition of x mod 1 is as shown in Equation (2) [15]:
mod 1 is imposed on the modified form so that its domain and codomain lie in the interval (0, 1) or in other words, the generated keystream taken is only its decimal value. For any x number, x mod 1 is all positive real numbers smaller than 1.
The MS Map function consists of three parameters: x0, r, λ. The domains of the three keys are x0 ∈ (0, 1), r, λ ∈ R parameters. x0 Parameter serves as initial value parameter, while r and λ parameters are as control parameters. With the condition that the value of r > λ, the randomness of the keystream value generated by the MS Map function is influenced by the selection of the values of r and λ.
2.3. Circle Map
Circle map is a one-dimensional function that maps a circle to itself. The Circle Map Equation with Equation (3) is as follows [16]:
mod 1 is the decimal part of a number, so the value of the map is always lower than 1 but not less than 0, and the K ∈ R parameter. Meanwhile, Ω is in the interval 0 ≤ Ω ≤ 1, and since this is the single sum term in modulo 1, then all other values of Ω are already represented by this interval.
A very interesting characteristic of the Circle Map is that it has infinite chaos possibilities. If a person wants to get a high enough Lyapunov exponent, she/ he can choose high or low (negative), because the value of K moves away from 0 and the exponent keeps increasing. The Ω value of the Circle Map also decreases as K moves away from 0 [17].
2.4. MS Circle Map
The new chaos function in this research is formulated through the composition process of two chaos functions: MS Map and Circle Map chaos functions. The composition process of MS Map and Circle Map chaos functions can be done because both have the same degree and dimension. If the Circle Map function is expressed as f(x) and the MS Map function as g(x), then the composition function of Circle Map and MS Map is expressed as MS Circle map function.
The MS Circle map function is a recursive function which can be seen in the equation below (4) [18]:
with for and ], , in real numbers and as the initial value.
The MS Circle Map function and its test results have proven that the function is chaotic [18], so the function can be further used as a keystream generator for encryption and decryption processes. The encryption process is performed on the original (confidential) image data using the keystream generated by the MS Circle Map chaos function. The encryption process can be seen in Figure 1 and the decryption process in Figure 2 below:
The encryption methods of digital images are as shown in Figure 1. The steps to generate a keystream are started by entering all the function parameter values as input and generating a keystream output. Because the MS Circle Map function uses the mod 1 operation, the result area of the MS Circle Map function is a real number that lies between the values 0 and 1. To get an integer, the result is then multiplied by 106. After that, the result is floored to get a row of integers and discard the fractions. The next step is to operate the resulting integer with mod 256 so that the resulting keystream can be substituted with each image pixel with a size of 8 bits.
The encryption process begins by transforming the original digital image (plain image) into a matrix form, with the entries being the values of the corresponding pixels. Then, with the MS Circle Map function, a keystream is generated as many as pixels from the plain image, namely keystream. Furthermore, the substitution encryption process is carried out using the XOR operation between the pixels at the coordinate position (i, j) of the plain image () with the key value in pairs. The XOR substitution operation is carried out pixel by pixel starting from the first pixel to the last pixel until the encrypted image is obtained. The XOR operation can be stated in the form of Equation (5) below:
in which K i+1 is the i+1 -th key in the keystream, and Ci is the i -th pixel cipher.
In order for the original image information can be accessed again, a decryption process is carried out using the same key as it is during the encryption process, as shown in Figure 2. The decryption process chart is the reverse process of the encryption process. The cipher image becomes input data along with all parameters used during the encryption process. Given that the key used during encryption is not sent or stored, the keystream must be regenerated during the decryption process. Keystream generation is the same as the generation process in the encryption algorithm. After the keystream is generated, the decryption process is carried out.
2.5. Encryption and Decryption Algorithms
The algorithm for the digital image encryption and decryption process uses MS Circle Map which was previously described in Figure 1 for the encryption process and in Figure 2 for the decryption process. The encryption and decryption algorithms use the XOR substitution operation. The encryption algorithm can be seen in Algorithm 1.
| Algorithm-1: Image Encryption Process |
| Input: parameters and plain image Output: Encrypted Image
|
Algorithm 1 is an encryption process that is performed on all pixels of the original image until they are all encrypted. Algorithm 1 shows the sequence of steps in the image encryption process. The input of this algorithm is the initial value (x0) with the five key parameters namely r,K,Ω,λ, iteration (k), and the original image pixel data (Pk); whereas the output is the encrypted image. The encryption process is shown in the fourth step to the twelfth step. The k-th key is calculated in the fifth and sixth steps using Equation (3). Meanwhile, the seventh step is the encryption process with XOR substitution between pixel (Pk) and key Kk. This continues to iterate until all pixels are encrypted.
The decryption algorithm is performed by returning each pixel of the encrypted image so that it returns to the original image. The key and keystream parameters in the decryption process are the same as the encryption process. The decryption algorithm is as follows:
| Algorithm-2. Image Decryption Process |
| Input: parameters and encrypted image Output: Decrypted Image
|
Algorithm 2 shows the sequence of steps in the image decryption process. The input of this algorithm is the initial value x0 with the five parameters namely r, K, Ω, λ, k, and Ci (in vector form); while the output is the decrypted image. The decryption process is shown in the fourth step to the twelfth step. The k -th key is calculated in the fifth and sixth steps using equation (3). The seventh step is the XOR substitution decryption process between pixel Ci and key Ki+1. This continues to iterate until all pixels are decrypted.
2.6. Encryption and Decryption Software Development Prototype
The developed algorithm is implemented into a prototype of encryption and decryption software based on the proposed MS Circle Map function. The implementation of this prototype was carried out using the Python programming language version 3.7 and a Graphical User Interface (GUI) or program display was created to help facilitate this research.
The main page of the program can be seen in Figure 3 which has five main menus, namely the image encryption menu, image decryption, quality test (histogram, correlation coefficient, MSE, and PSNR), randomness test (correlation distribution), and statistical test (Uniform, Entropy, UACI, and NPCR).
The “Enkripsi Citra” (Image Encryption) menu is a digital image encryption process by inputting the original image and all parameters and the output is the encrypted image. When the “Enkripsi Citra” menu is selected, a new window will appear as in Figure 4. Menu. The new window for this encryption process consists of five parts, namely filling in the initial value, parameters, and i iteration. “Buka File” (Open File) button is to read the image to be encrypted, while ‘Jalankan’ (Execute) button is to run the encryption process, ‘Simpan File’ (Save File) button is to save the encrypted image in the computer, and ‘Keluar’ (Exit) button is to close the window of the encryption process.
Selecting the image decryption menu button in the main window as shown in Figure 2 will display the image decryption window in Figure 5. This window has the same menu display as the window for the image encryption process. The decryption process through the selection of the “Jalankan” button can be done after filling in all the initial values and key parameters as in the encryption process and reading the encrypted image. The result of the decryption process is shown on the right side of the encrypted image as shown in Figure 5. The length of time of the decryption process is shown above the “Keluar” button which is 3.907 seconds.
For testing the quality of the decrypted image against the original image, it can be done by selecting the “Uji Kualitas” (Quality Test) button in the main window of Figure 3. The selection of the button displays a new window in Figure 6. This window has a menu several buttons: “Buka File Citra Asli” (Open Original Image File) button to read the original image used in the encryption process, “Buka File Citra Terenkripsi/Terdekripsi” (Open Encrypted/ Decrypted Image File) button to read the encrypted image or decrypted image, “Uji Kualitas” button to run the test algorithms according to the input image, and “Keluar” button to exit this window.
Next, for testing the randomness of the pixel colour intensity of the encrypted image, it can be done by selecting the “Uji Keacakan” (Randomness Test) button on the main window of Figure 3. The selection of the button displays a new window in Figure 7. This window has several buttons: “Buka File Citra”, “Uji Distribusi Korelasi” (Correlation Distribution Test), and “Keluar”.
For statistical testing of the encrypted image, it can be done by pressing the “Uji Statistik” (Statistical Test) button on the main window of Figure 3. The selection of the button displays a new window shown in Figure 8. This window has several buttons: “Buka Citra Uji 1” (Open Tested Image 1), Buka Citra Uji 2” (Open Tested Image 2), “Uji Statistik”, and “Keluar”.
2.7. Test Data
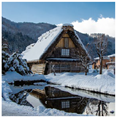
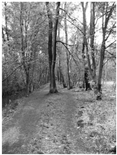
The test data used were 30 digital images which include coloured and grayscale images. The test data are tropical beach.png, jungle.bmp, Bird.png, Village.bmp, and City.png. with each type of image having three different sizes. The five types of images were chosen because they have a wide variety of shape, color, and texture features and information. The coloured image test data can be seen in Table 1 and the grayscale image test data can be seen in Table 2 below:
3. Results and Discussion
The trial was carried out by implementing algorithms 1 and 2, namely the encryption and decryption processes, as well as performing the algorithm in the Python programming language running on a computer with the following specifications: i5- 7200U Intel(R) Core (TM), @ 2.50GHz 2.70 GHz CPU, 8.00GB Memory (RAM), Windows 10 Home Operating System, and 64 bit Single Language. The key used during the encryption process is the same as the decryption process, namely with the initial value. , and ,,, . The results of the image encryption and decryption were then tested for their resilience with several analyses, namely initial value sensitivity analysis, uniformity, image quality, image quality, correlation, key space, differential analysis, and encryption-decryption process time.
3.1. Initial Value Sensitivity Analysis
The sensitivity testing of the key to the MS Circle Map function can be done by performing the encryption process on five colour images and five grayscale images of various sizes. Sensitivity testing is done through the decryption process using different initial values for the key used in the encryption process.
Table 3 shows the results of the initial value sensitivity test. The test was done by looking at the results of the decrypted image using the difference in initial values as shown in the second column. However, the other key parameters use the same keys of λ = 2.1, Ω = 0.5 and K = 1000, and r = 3.8. The third column shows the results of the decrypted image using the parameter values in the second columns. The last column shows the histogram pattern of the decrypted image.
The initial value has a sensitivity of because with a difference in the being , the encrypted image still cannot be opened to the original image and the histogram has a uniform distribution that looks flat. Even with a difference in the value of , the encrypted image in each test data cannot be successfully opened. The decrypted image using the value encrypted image is still not successfully unlocked. However, for the image with a value difference of , the new encrypted image can be successfully opened.
After conducting the initial value sensitivity test, it can be concluded that the initial value of the MS Circle Map function is very sensitive (ill condition). This shows that a small change in the key value results in a very different change in the function value, and minimizes the chance of a brute force attack on the encryption algorithm. A brute force attack is defined as trying all possible key pair values on the encrypted image to get the original image.
3.1. Key Space Analysis
A brute force attack is done by trying all possible keys to perform decryption to obtain the original image. To reduce the chances of a successful brute force attack, the algorithm must also have a large key space. The key space states the total number of different keys that can be used to perform encryption/decryption [19]. The MS Circle Map function-based encryption algorithm uses six key parameters, namely , , and iteration. With its domain , and iteration. In Python, the maximum value of a float type number is . Meanwhile, the real numbers in the interval (0,1) have the precision level up to of and integer data has possible value of
Overall, the key space size of the MS Circle map function encryption and decryption algorithm reaches the following value:
The size of this key space is so large that the algorithm can withstand brute force attacks.
Based on Table 4, it shows that the MS Circle Map function-based encryption algorithm has a larger key space compared to other encryption algorithms. The MS Circle Map encryption algorithm has a key space of , the MS Map key space is while the Circle Map key space is In the fourth row, the key space for the Circle Map and MS Map undergoes double encryption sequentially, measuring . This shows that the MS Circle Map algorithm is more secure against brute force attacks.
3.2. Goodness of Fit Test
Statistical analysis of the algorithm was carried out to see the algorithm’s resilience to statistical attacks. The test analysis was carried out quantitatively, namely by testing the goodness of fit. The more uniform the distribution of the encrypted image, the more difficult it is to perform a statistical attack. Therefore, a uniformity test was performed on all pixel values of the encrypted image using the goodness of fit test.
The gray level of the pixel is located at a value of 0-255 which is used as the number of classes, so in this case there are 256 classes. The frequency of pixel values from the encrypted image will be grouped according to their class which is called the observed frequency for each class. The expected frequency for each class is the same, namely (column × row) / 256.
The statistical values of the coloured image test data can be seen in Table 5 while the statistical values for the grayscale image is shown in Table 6.
The number of classes is 256 classes, with the degrees of freedom of 256 - 1 = 255 and a significance level of 1%, the critical value obtained is 310.457388. the decision making is done by comparing the test statistic value to its critical value. The comparison results that can be seen in Table 5 and Table 6 show that each test statistic value is less than the critical value. This proves that the pixel intensity of the encrypted image is uniformly distributed so that this encryption algorithm is resistant to statistical attacks.
3.3. Correlation Analysis
Correlation analysis is a method used to determine the direction and strength of the relationship between two variables [20]. The correlation coefficient is a number used to see how strong the relationship between variables is. In the plain image, neighbouring pixels have a strong linear relationship, indicated by a high correlation coefficient value, which is close to +1 or -1. In the encrypted image, neighbouring pixels have no relationship or the correlation coefficient value is close to zero.
Table 7 shows the correlation coefficient of the plain image to the encrypted image. The correlation coefficient of the plain image is 0.941184 horizontally, 0.923354 vertically, and 0.893363 diagonally. The correlation coefficient of the plain image is close to 1, indicating that the pixels of the plain image have a very high correlation.
The correlation coefficient of the encrypted image has a value of -0.00102 horizontally, 0.00012 vertically, and 0.00048 diagonally. In other words, the correlation coefficient of the encrypted image has a value close to 0. This indicates that the pixels of the encrypted image have a weak correlation so that the information in the encrypted image cannot be read.
The correlation coefficient of the original image against the encrypted grayscale image is shown in Table 9 and Table 10. In Table 9, it can be seen that the correlation coefficient value of the original image is 0.93834 horizontally, 0.9156 vertically, and 0.883123 diagonally. The correlation coefficient of the original image is close to 1 which indicates that the pixels of the original image have a very high correlation. Whereas in Table 10, it can be seen that the correlation coefficient of the encrypted image has a value of 0.06114 horizontally, 0.00093 vertically, and 0.00021 diagonally. The correlation coefficient of the encrypted image has a value close to 0, indicating that the pixels of the encrypted image have a weak correlation so that the information in the encrypted image cannot be read.
3.4. Differential Analysis
Differential analysis is tested using The Number of Changing pixel Rate (NPCR) and The Unified Averaged Intensity (UACI). The NPCR test calculates the percentage of different pixels from two encrypted images to the plain image. The UACI test is a test of the average intensity of two encrypted images.
If two encrypted images are represented as C1 and C2, then the pixel values of coordinates (i, j) are C1(i, j) and C2(i, j). with D(i, j)=1 if C1(i, j)=C2(i, j), and D(i, j)=0 if , W and H are the width and length of the encrypted image in pixels.
The NPCR is thus calculated using the following Equation (6) [21].
The UACI test is the percentage of the average intensity of two encrypted images. UACI can be calculated by the following Equation (7) [21].
The Table 11 shows the results of the NPCR and UACI calculations. All test data have good NPCR, which is close to 99.6%, as well as the UACI value of all test data approaching 33.4% [22]. This shows that there is a change in each pixel as a whole in the original image to the encrypted image so that the data changes produce different information. It means that this algorithm has good resistance to differential attacks.
3.5. Entropy Analysis
Entropy analysis was carried out to determine the level of randomness in encrypted images [23]. Encrypted images should have an ideal entropy value equal to 8 [24]. Testing was carried out for all encrypted image test data. The entropy value can be calculated using the following equation (8):
If Pi is the probability of the occurrence of pixels with value of i, then there are 256 possible pixel values in a grayscale image.
The test results on encrypted colored and grayscale images are shown in Table 12. The entropy values obtained are all close to 8, which indicates that the encryption algorithm is safe from statistical attacks and is able to randomize pixels to predict information in the image.
3.6. Image Quality Analysis
Digital image quality analysis was performed using the Peak Signal to Noise Ratio (PSNR) test to determine the quality of decrypted and encrypted images. The PSNR testing refers to the Mean Square Error (MSE) value.
The calculation of MSE and PSNR can be seen in equations (9) and (10) below [25]
The algorithm in the decryption technique should be able to restore the encrypted image to the original image without any errors. The MSE and PSNR values between the original image and the decrypted image are shown in Table 13.
The MSE value on all test data is 0 which proves that there is no error in the decrypted image or it can be said that the decrypted image is the same as the original image. The PSNR value on all test data has a value of ∞ which proves that the decrypted image is the same as the original or in other words, no information is lost.
Table 14 shows the results of the encrypted image quality test and the original image, it can be concluded that for each test data, the MSE value is not equal to zero and the PSNR value is less than 40 decibels. The MSE value of the encrypted image is greater than the MSE value of the decrypted image. This shows that the encrypted image successfully maintains information from the original image. This means that the encrypted image is very different from the original image and the information from the encrypted image cannot be read.
4. Conclusions
The MS Circle Map function can be used as a random number generator or keystream in the process of digital image encryption and decryption. This can be proven from the resilience of the encryption algorithm, namely: the size of the key space obtained which reaches and the sensitivity level of the initial value which reaches . This means that the encryption algorithm developed has high resistance to brute force attacks. The histogram of the resulting encrypted image has a uniform distribution, the entropy value is close to 8, and the correlation coefficient value of the encrypted image is close to zero (0). This shows that the encryption algorithm developed has high resistance to statistical attacks.
The obtained NPCR value is 99.6% and the UACI value is close to 33.4%. This shows that the developed encryption algorithm has high resistance to differential attacks. The results of quantitative tests of digital image quality using MSE and PSNR measurements are 0 and ∞, respectively. This shows that the decrypted image is exactly the same as the original (plain) image.
5. Patents
This encryption program prototype has been registered with the copyright certificate at the Directorate General of Intellectual Property Rights, Ministry of Law and Human Rights of the Republic of Indonesia with the number EC00202310294.
Author Contributions
Conceptualization, MT.S., and M.S; methodology, MT.S., and M.I.; software, M.I.; validation, MT.S., M.S. and M.I.; formal analysis, M.S. and MT.S.; investigation, M.I.; resources, M.I.; data curation, M.I.; writing—original draft preparation, M.I.; writing—review and editing, M.I., M.S., MT.S.; visualization, M.I.; supervision, M.S., MT.S. and H.S.; project administration, M.I.; funding acquisition, M.S. and H.S. All authors have read and agreed to the published version of the manuscript.
Funding
This research was funded by the Ministry of Education, Culture, Research, Technology and Higher Education with contract No. 155/e5/PG.02.00.PT/2022.
Institutional Review Board Statement
Not applicable.
Informed Consent Statement
Not applicable.
Data Availability Statement
Data sharing not applicable.
Acknowledgments
Many thanks for the opportunity and support to the Ministry of Education, Culture, Research, Technology and Higher Education (DRTPM) TA 2022.
Conflicts of Interest
The authors declare no conflicts of interest.
References
- Pareek, N.K.; Patidar, V.; Sud, K.K. Image encryption using chaotic logistic map. Image and vision computing 2006, 24, 926–934. [Google Scholar] [CrossRef]
- Kembaren, S.B.; Suryadi, S.; Triswanto, T. Implementasi algoritma enkripsi citra digital berbasis chaos menggunakan fungsi komposisi logistic dan gauss iterated map. Prosiding Seminar Nasional & Internasional 2018, 1, 263–272. [Google Scholar]
- Dai, Y.; Wang, X. Medical image encryption based on a composition of logistic maps and chebyshev maps. In Proceedings of the 2012 IEEE International Conference on Information and Automation, Shenyang, China, 6–8 June 2012. [Google Scholar]
- Suryadi, M.Y.; Satria, Y.; Fauzi, M. Implementation of digital image encryption algorithm using logistic function and DNA encoding. Journal of Physics: Conference Series 2018, 974, 012028. [Google Scholar] [CrossRef]
- Suryadi, M.T.; Nurpeti, E.; Widya, D. Performance of Chaos-Based Encryption Algorithm for Digital Image. Journal Telecommunication, Computing, Electronics and Control 2014, 12, 675–682. [Google Scholar]
- Suryadi, M.; Irsan MY, T.; Satria, Y. New modified map for digital image encryption and its performance. Journal of Physics: Conference Series 2017, 893, 012050. [Google Scholar] [CrossRef]
- Suryadi, M.T.; Maria, Y.T.I.; Yudi, S. Encryption Algorithm using New Modified map for digital image. In Proceedings of the IndoMS International Conference of Mathematics and Application (IICMA), Depok, West Java, Indonesia, 3–4 November 2015; pp. 71–78. [Google Scholar]
- Sahay, A.; Pradhan, C. Multidimensional comparative analysis of image encryption using gauss iterated and logistic maps. In Proceedings of the 2017 International Conference on Communication and Signal Processing (ICCSP), Chennai, India, 6–8 April 2017; pp. 1347–1351. [Google Scholar] [CrossRef]
- Suryadi, M.T.; Satria, Y.; Hadidulqawi, A. Implementation of the Gauss-Circle Map for encrypting and embedding simultaneously on digital image and digital text. Journal of Physics: Conference Series 2021, 1821, 012037. [Google Scholar] [CrossRef]
- Andrew, A.; Andrian, A.; Kuantan, S.; Setia, R.; Christnatalis, C. Pengacakan citra digital dengan menggunakan logistic map dan piecewise linear chaotic map. Jurnal Teknologi Kesehatan dan ilmu Sosial 2019, 1, 96–102. [Google Scholar]
- Schneier, B. Applied Cryptography: Protocols, Algorithms, and Source Code in C; 2007. [Google Scholar]
- Menezes, A.J.; Van Oorschot, P.C.; Vanstone, S.A. Handbook of Applied Cryptography; CRC press, 2018. [Google Scholar]
- Kocarev, L.; Lian, S. Chaos-Based Cyrptography; Springer: Berlin/Heidelberg, Germany, 2011. [Google Scholar]
- Stallings, W. Cryptography and Network Security 4/E; Pearson Education India, 2014. [Google Scholar]
- Satria, Y.; Suryadi, M.; Solihat, I.M.; Prawadika, L.N.; Melvina, V. The composition of the improved logistic map and the ms map in generating a new chaotic function. Journal of Physics: Conference Series 2020, 1490, 012046. [Google Scholar] [CrossRef]
- Boyland, P.L. Bifurcations of circle maps: Arnol’d tongues, bistability and rotation interval. Communications in Mathematical Physics 1986, 106, 353–381. [Google Scholar] [CrossRef]
- Suryadi, M.; Satria, Y.; Prawadika, L.N. An improvement on the chaotic behavior of the gauss map for cryptography purposes using the circle map combination. Journal of Physics: Conference Series 2020, 1490, 012045. [Google Scholar] [CrossRef]
- Mursidah, I.; Suryadi, S.; Madenda, S.; Harmanto, S. A New Chaos Function Developed through the Composition of the MS Map and the Circle Map. In Proceedings of the 3rdInternational Conference on Mathematics and Learning Research (ICOMER), Surakarta, Indonesia, 30 September 2023; p. 32. [Google Scholar]
- Fu, C.; Chen, J.; Zou, H.; Meng, W.; Zhan, Y.; Yu, Y. A chaos-based digital image encryption scheme with an improved diffusion strategy. Optics express 2012, 20, 2363–2378. [Google Scholar] [CrossRef] [PubMed]
- Walpole, R.E.; Ergle, W.D. Elementary Statistical Concepts; Macmillan Basingstoke, 1983. [Google Scholar]
- Benlashram, A.; Al-Ghamdi, M.; AlTalhi, R.; Laabidi, P.K. A novel approach of image encryption using pixel shuffling and 3d chaotic map. Journal of Physics: Conference Series 2020, 1447, 012009. [Google Scholar] [CrossRef]
- Wu, Y.; Noonan, J.P.; Agaian, S.; et al. Npcr and uaci randomness tests for image encryption, Cyber journals: multidisciplinary journals in science and technology. Journal of Selected Areas in Telecommunications (JSAT) 2011, 1, 31–38. [Google Scholar]
- Lone, P.N.; Singh, D.; Mir, U.H. A novel image encryption using random matrix affine cipher and the chaotic maps. Journal of Modern Optics 2021, 68, 507–521. [Google Scholar] [CrossRef]
- Zhang, L.; Zhang, L.; Zhang, L. Application research of digital media image processing technology based on wavelet transform. EURASIP Journal on Image and Video Processing 2018, 1–10. [Google Scholar] [CrossRef]
- Wang, Z.; Bovik, A.C. Mean squared error: Love it or leave it? a new look at signal fidelity measures. IEEE signal processing magazine 2009, 26, 98–117. [Google Scholar] [CrossRef]
Figure 1.
Digital Image Encryption Process Based on MS Circle Map.
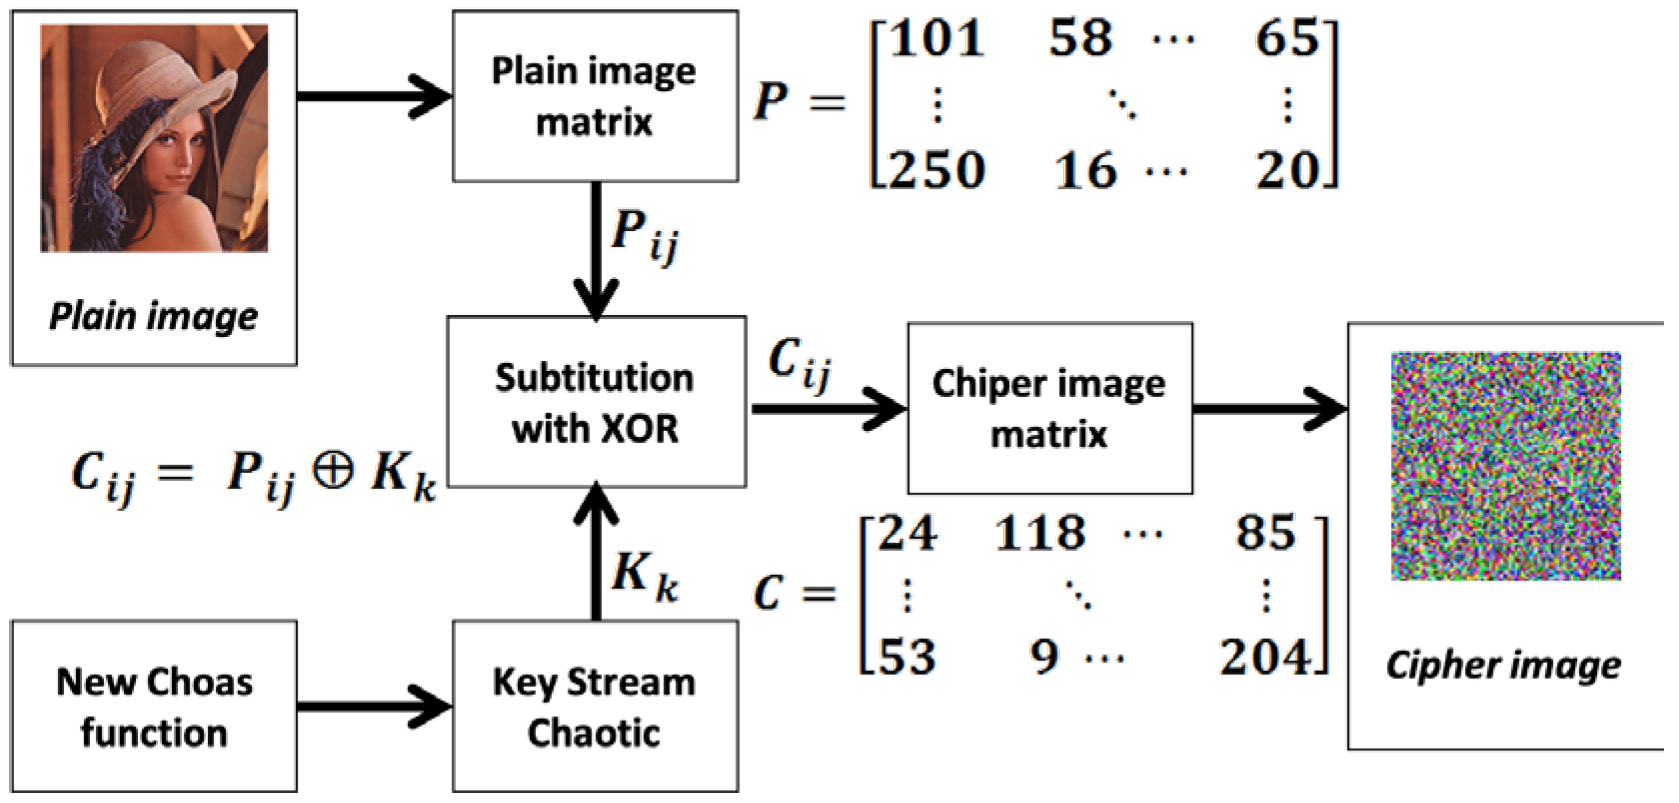
Figure 2.
Digital Image Decryption Process Based on MS Circle Map.
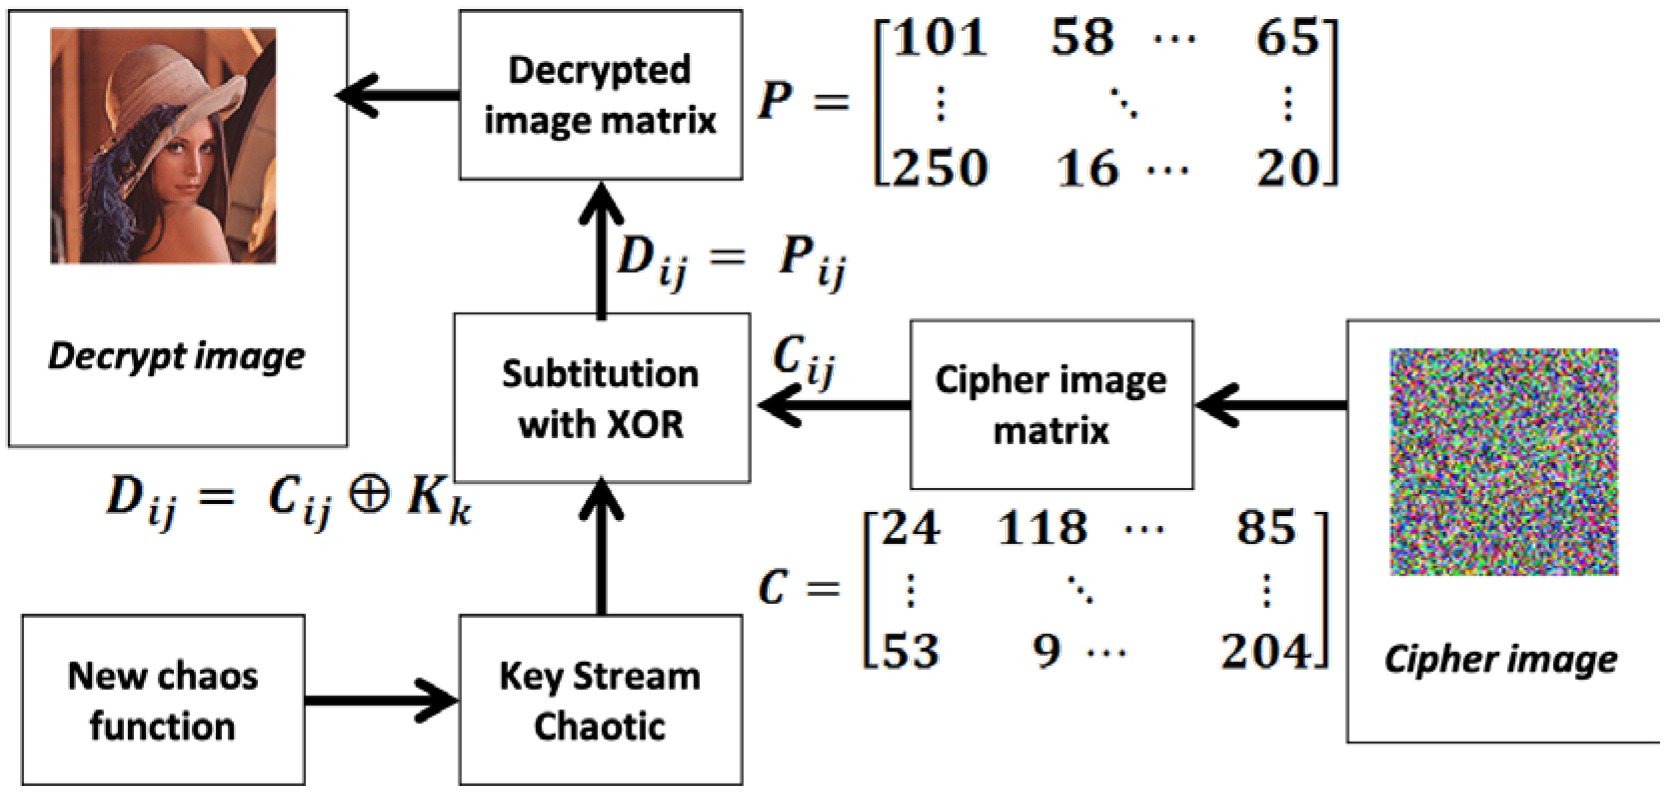
Figure 3.
MS Circle Map Based Cryptography Main Menu.
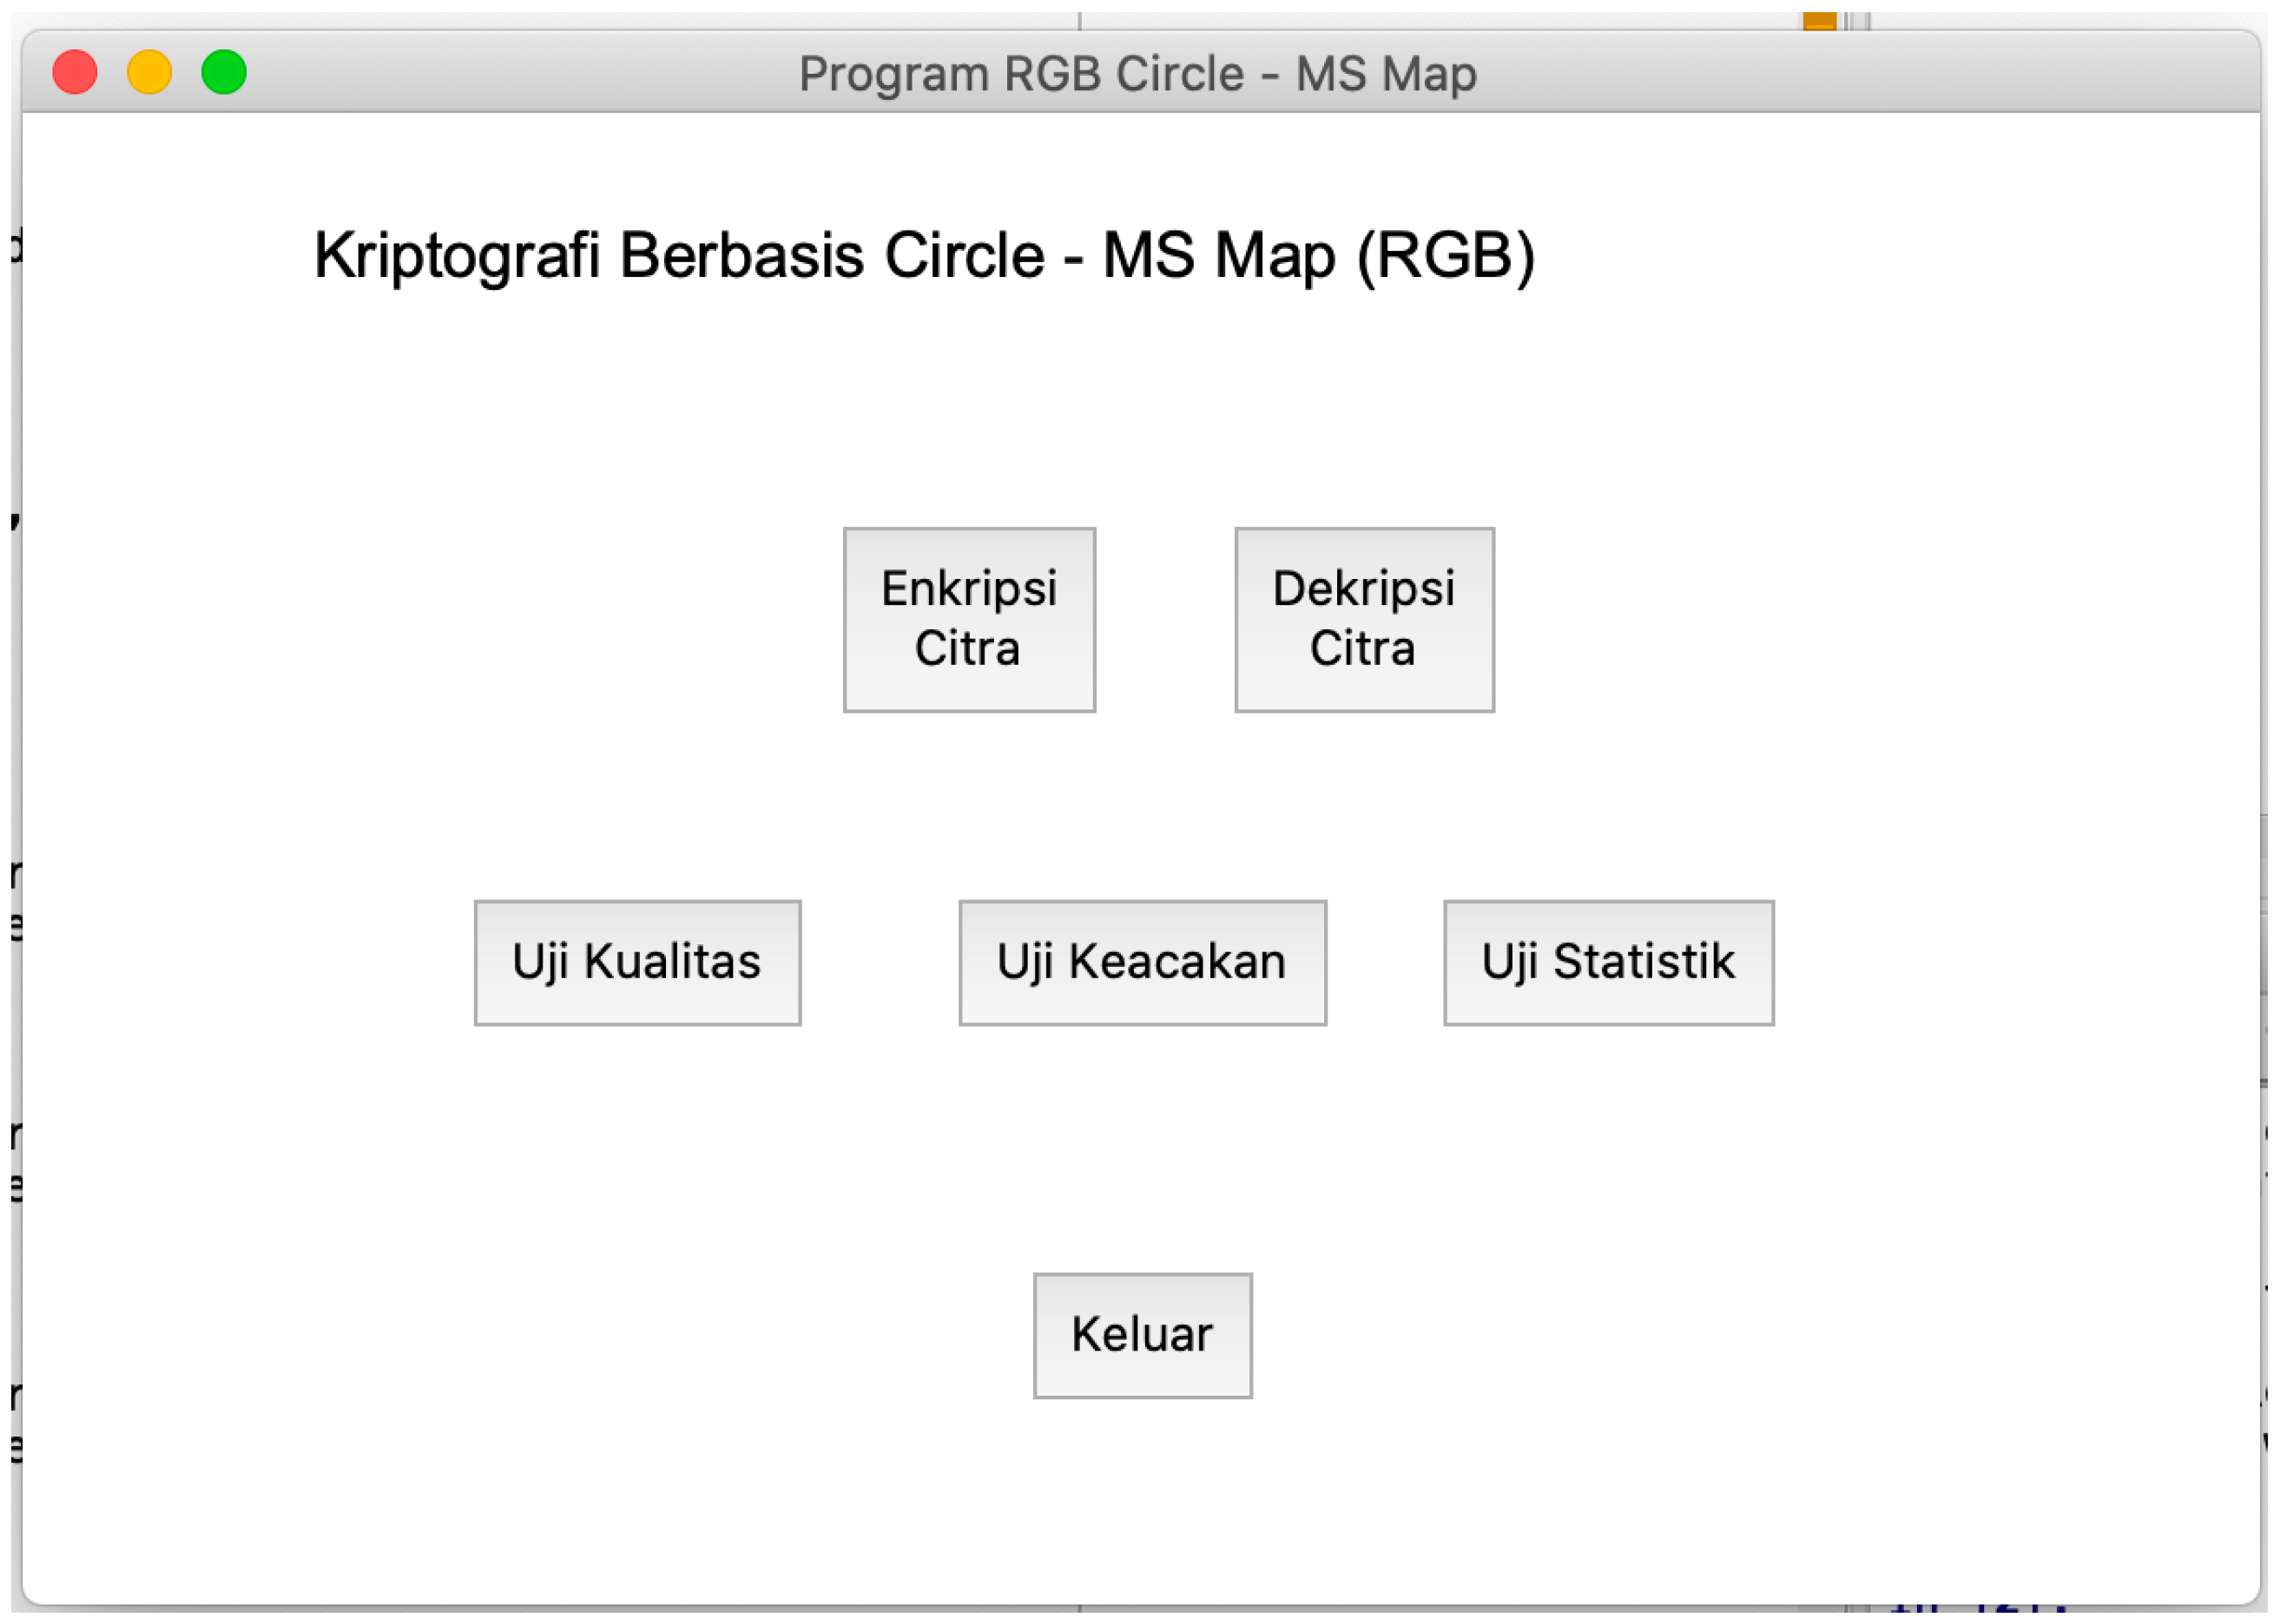
Figure 4.
Encryption Program Display.
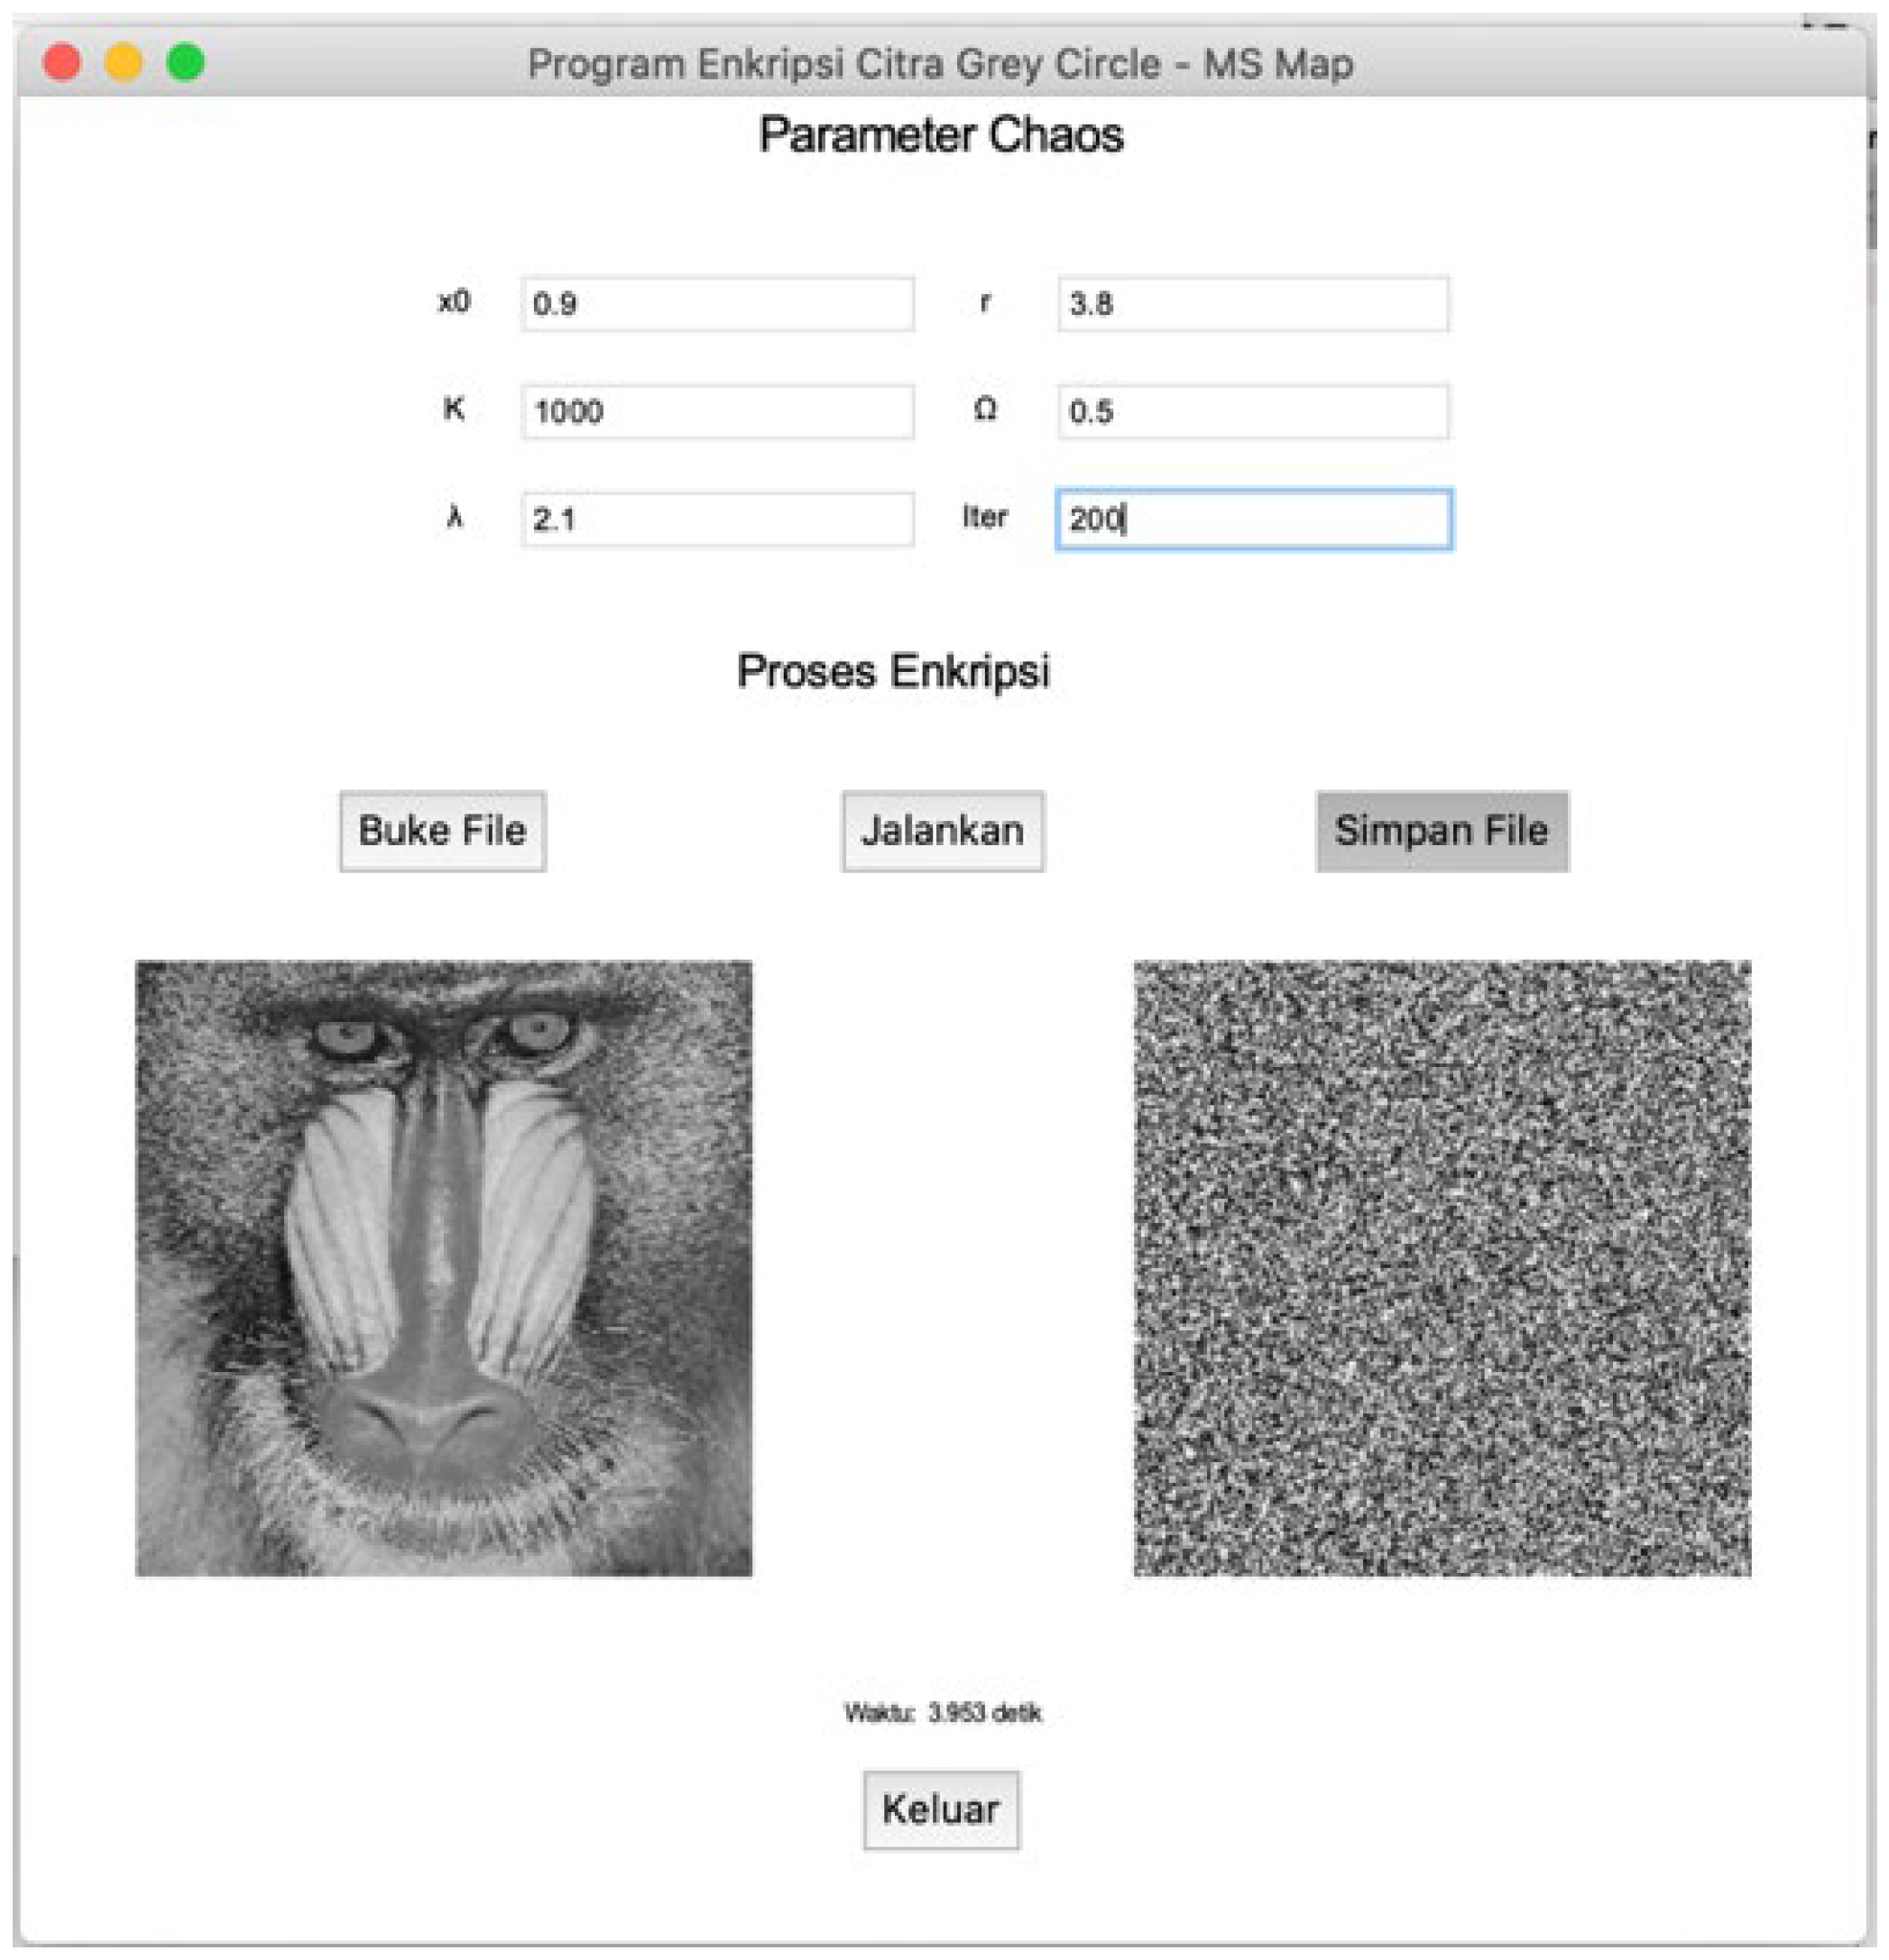
Figure 5.
Decryption Program Display.
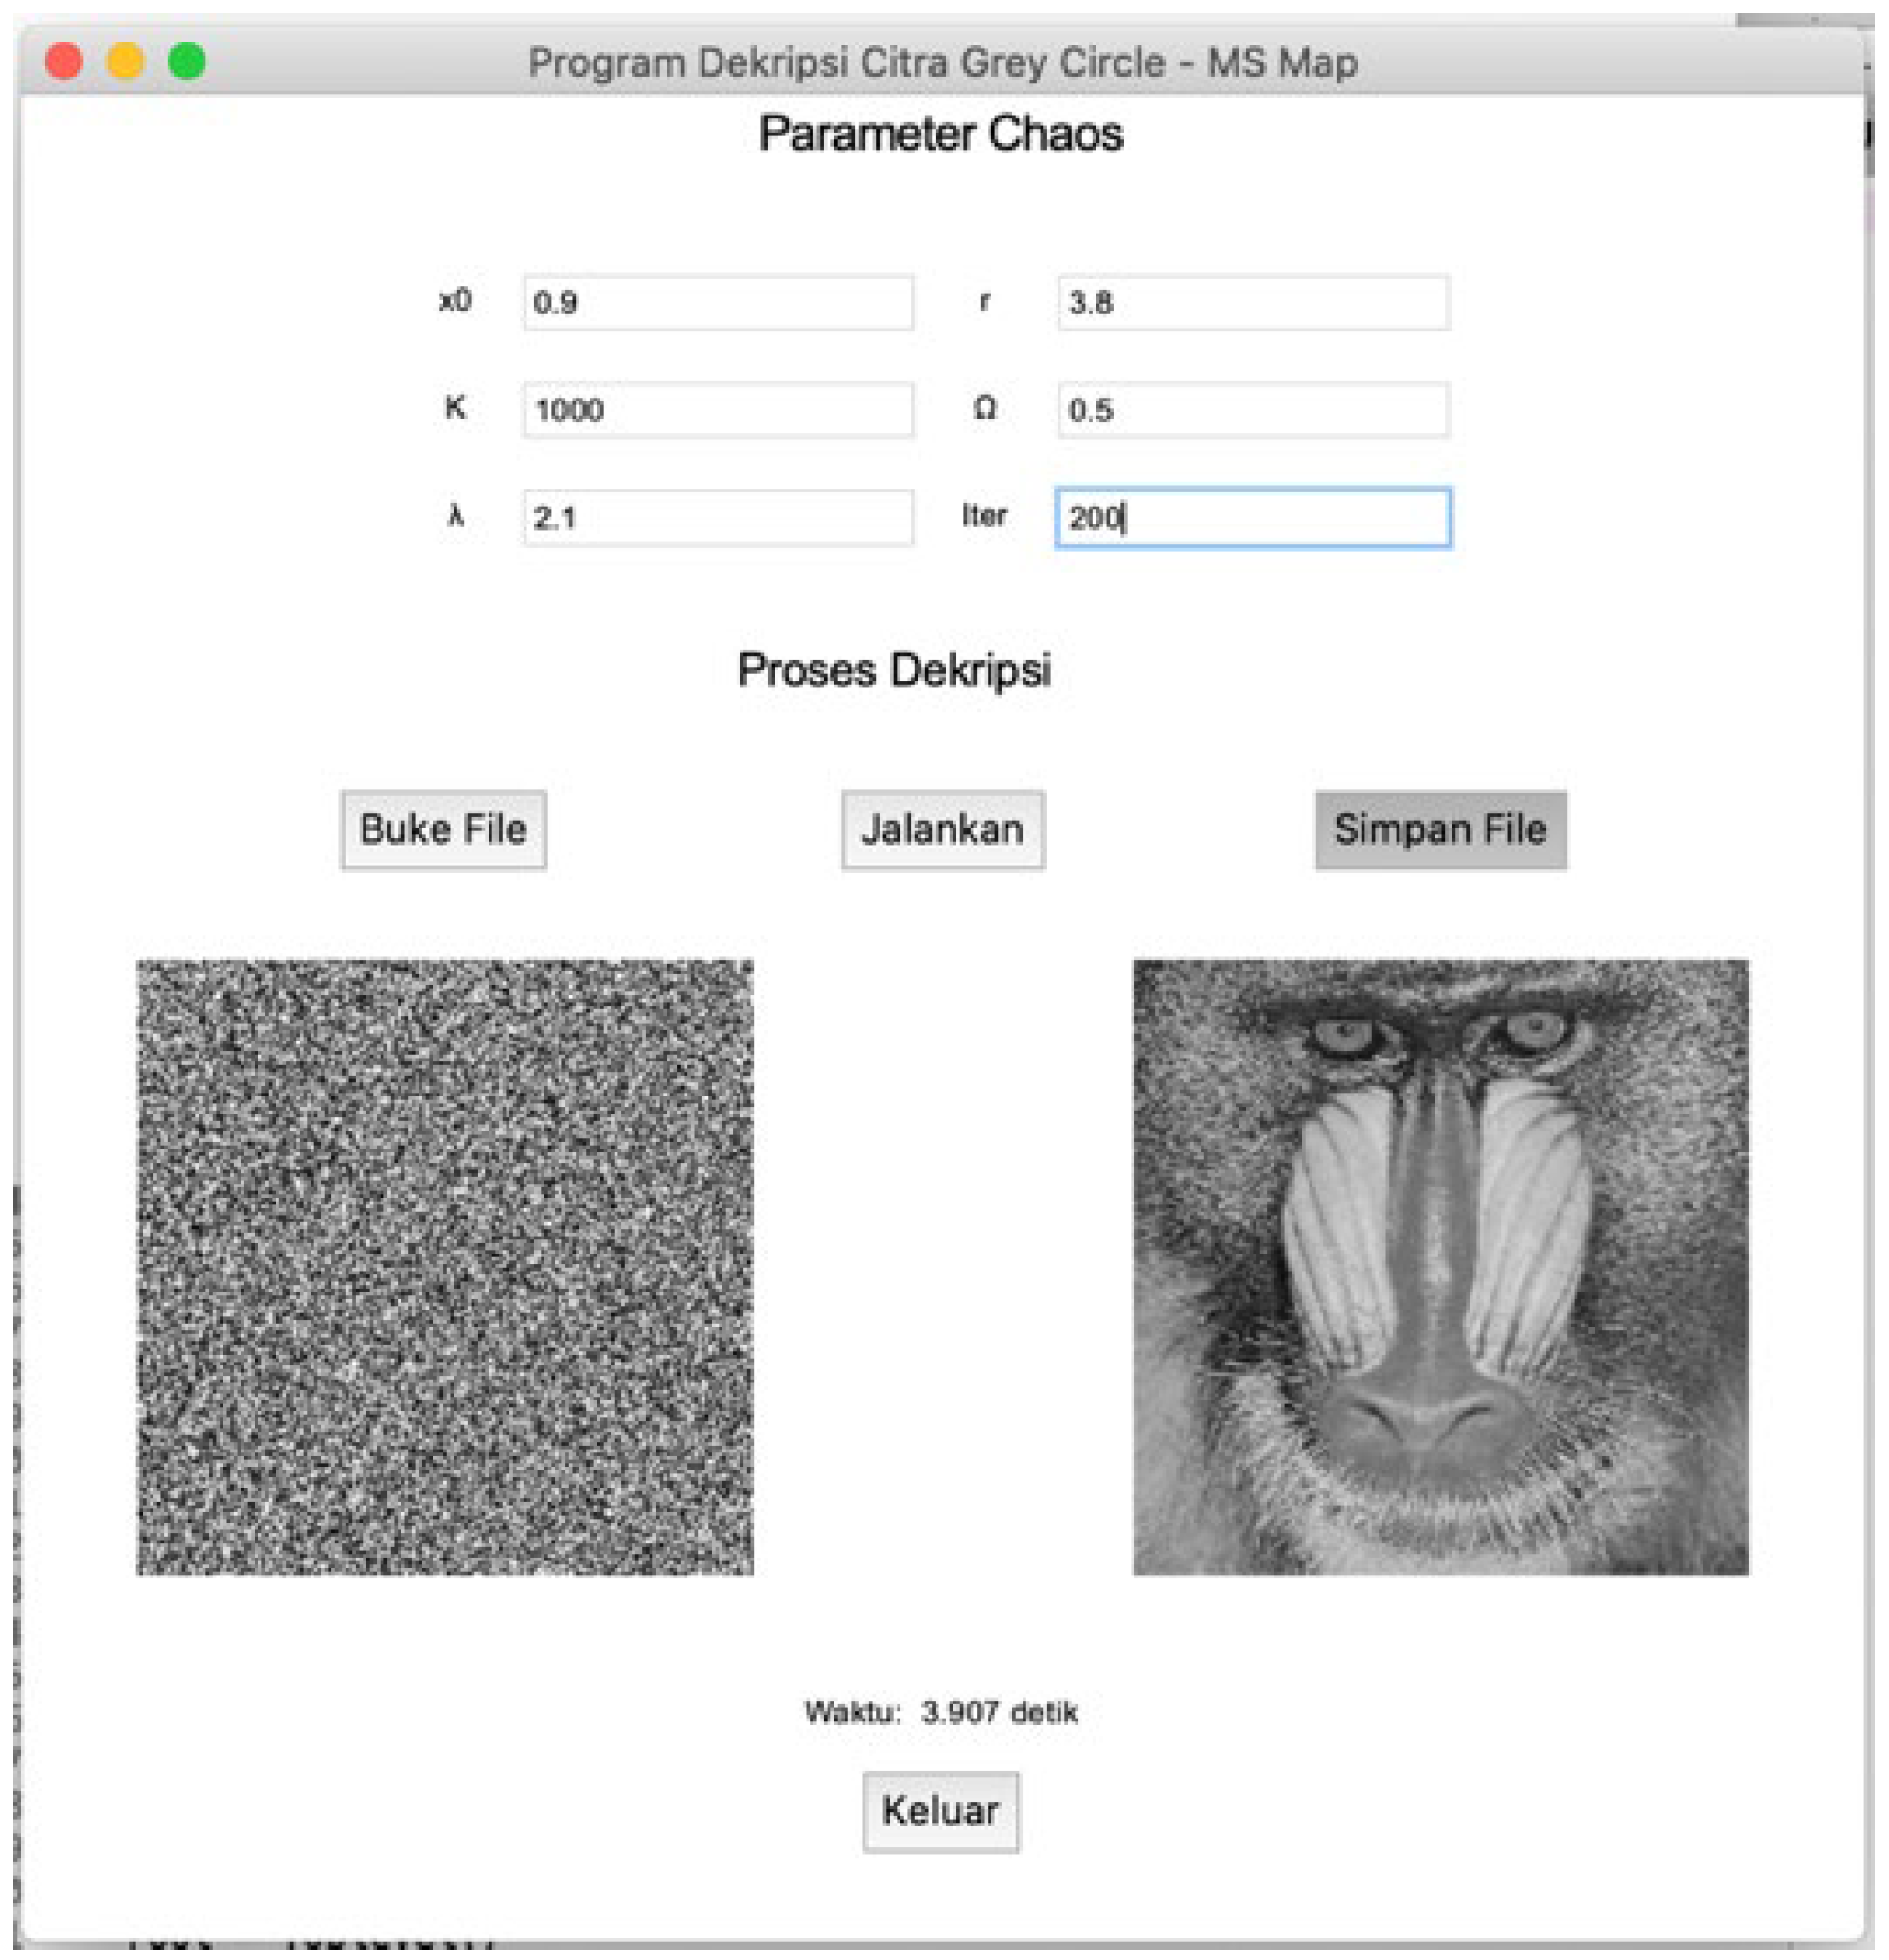
Figure 6.
Quality Test Menu Display.
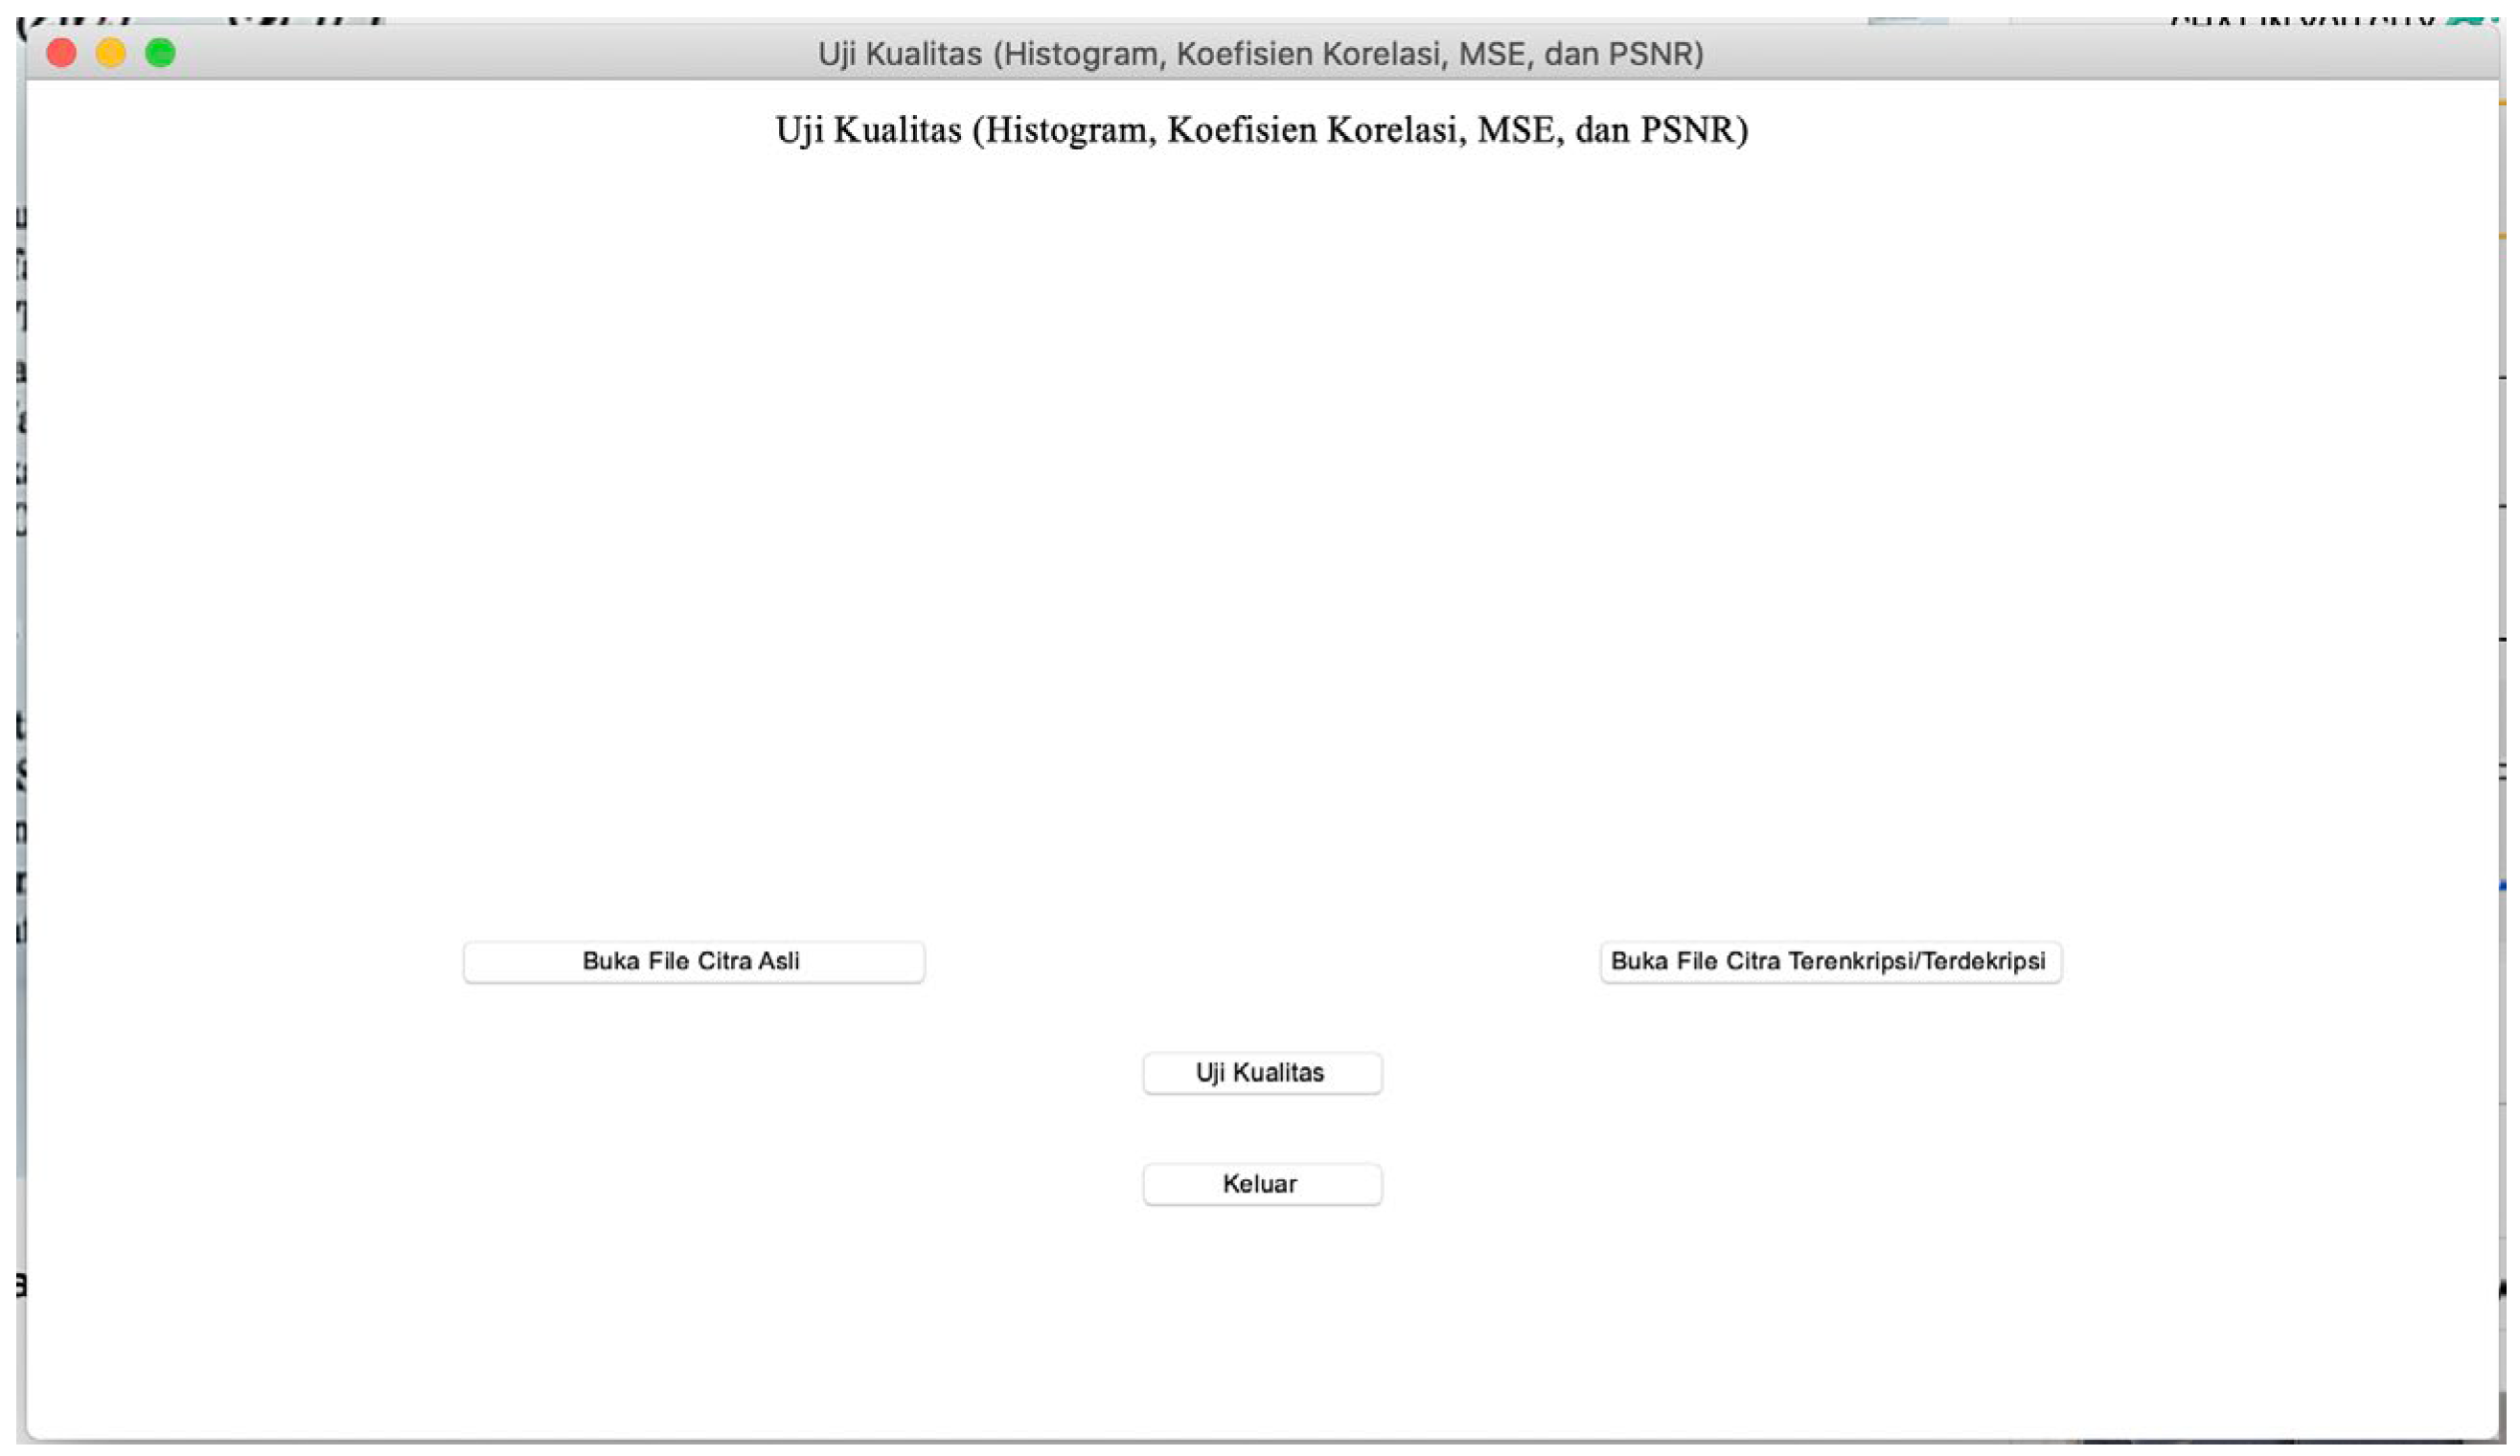
Figure 7.
Randomness Test Display.
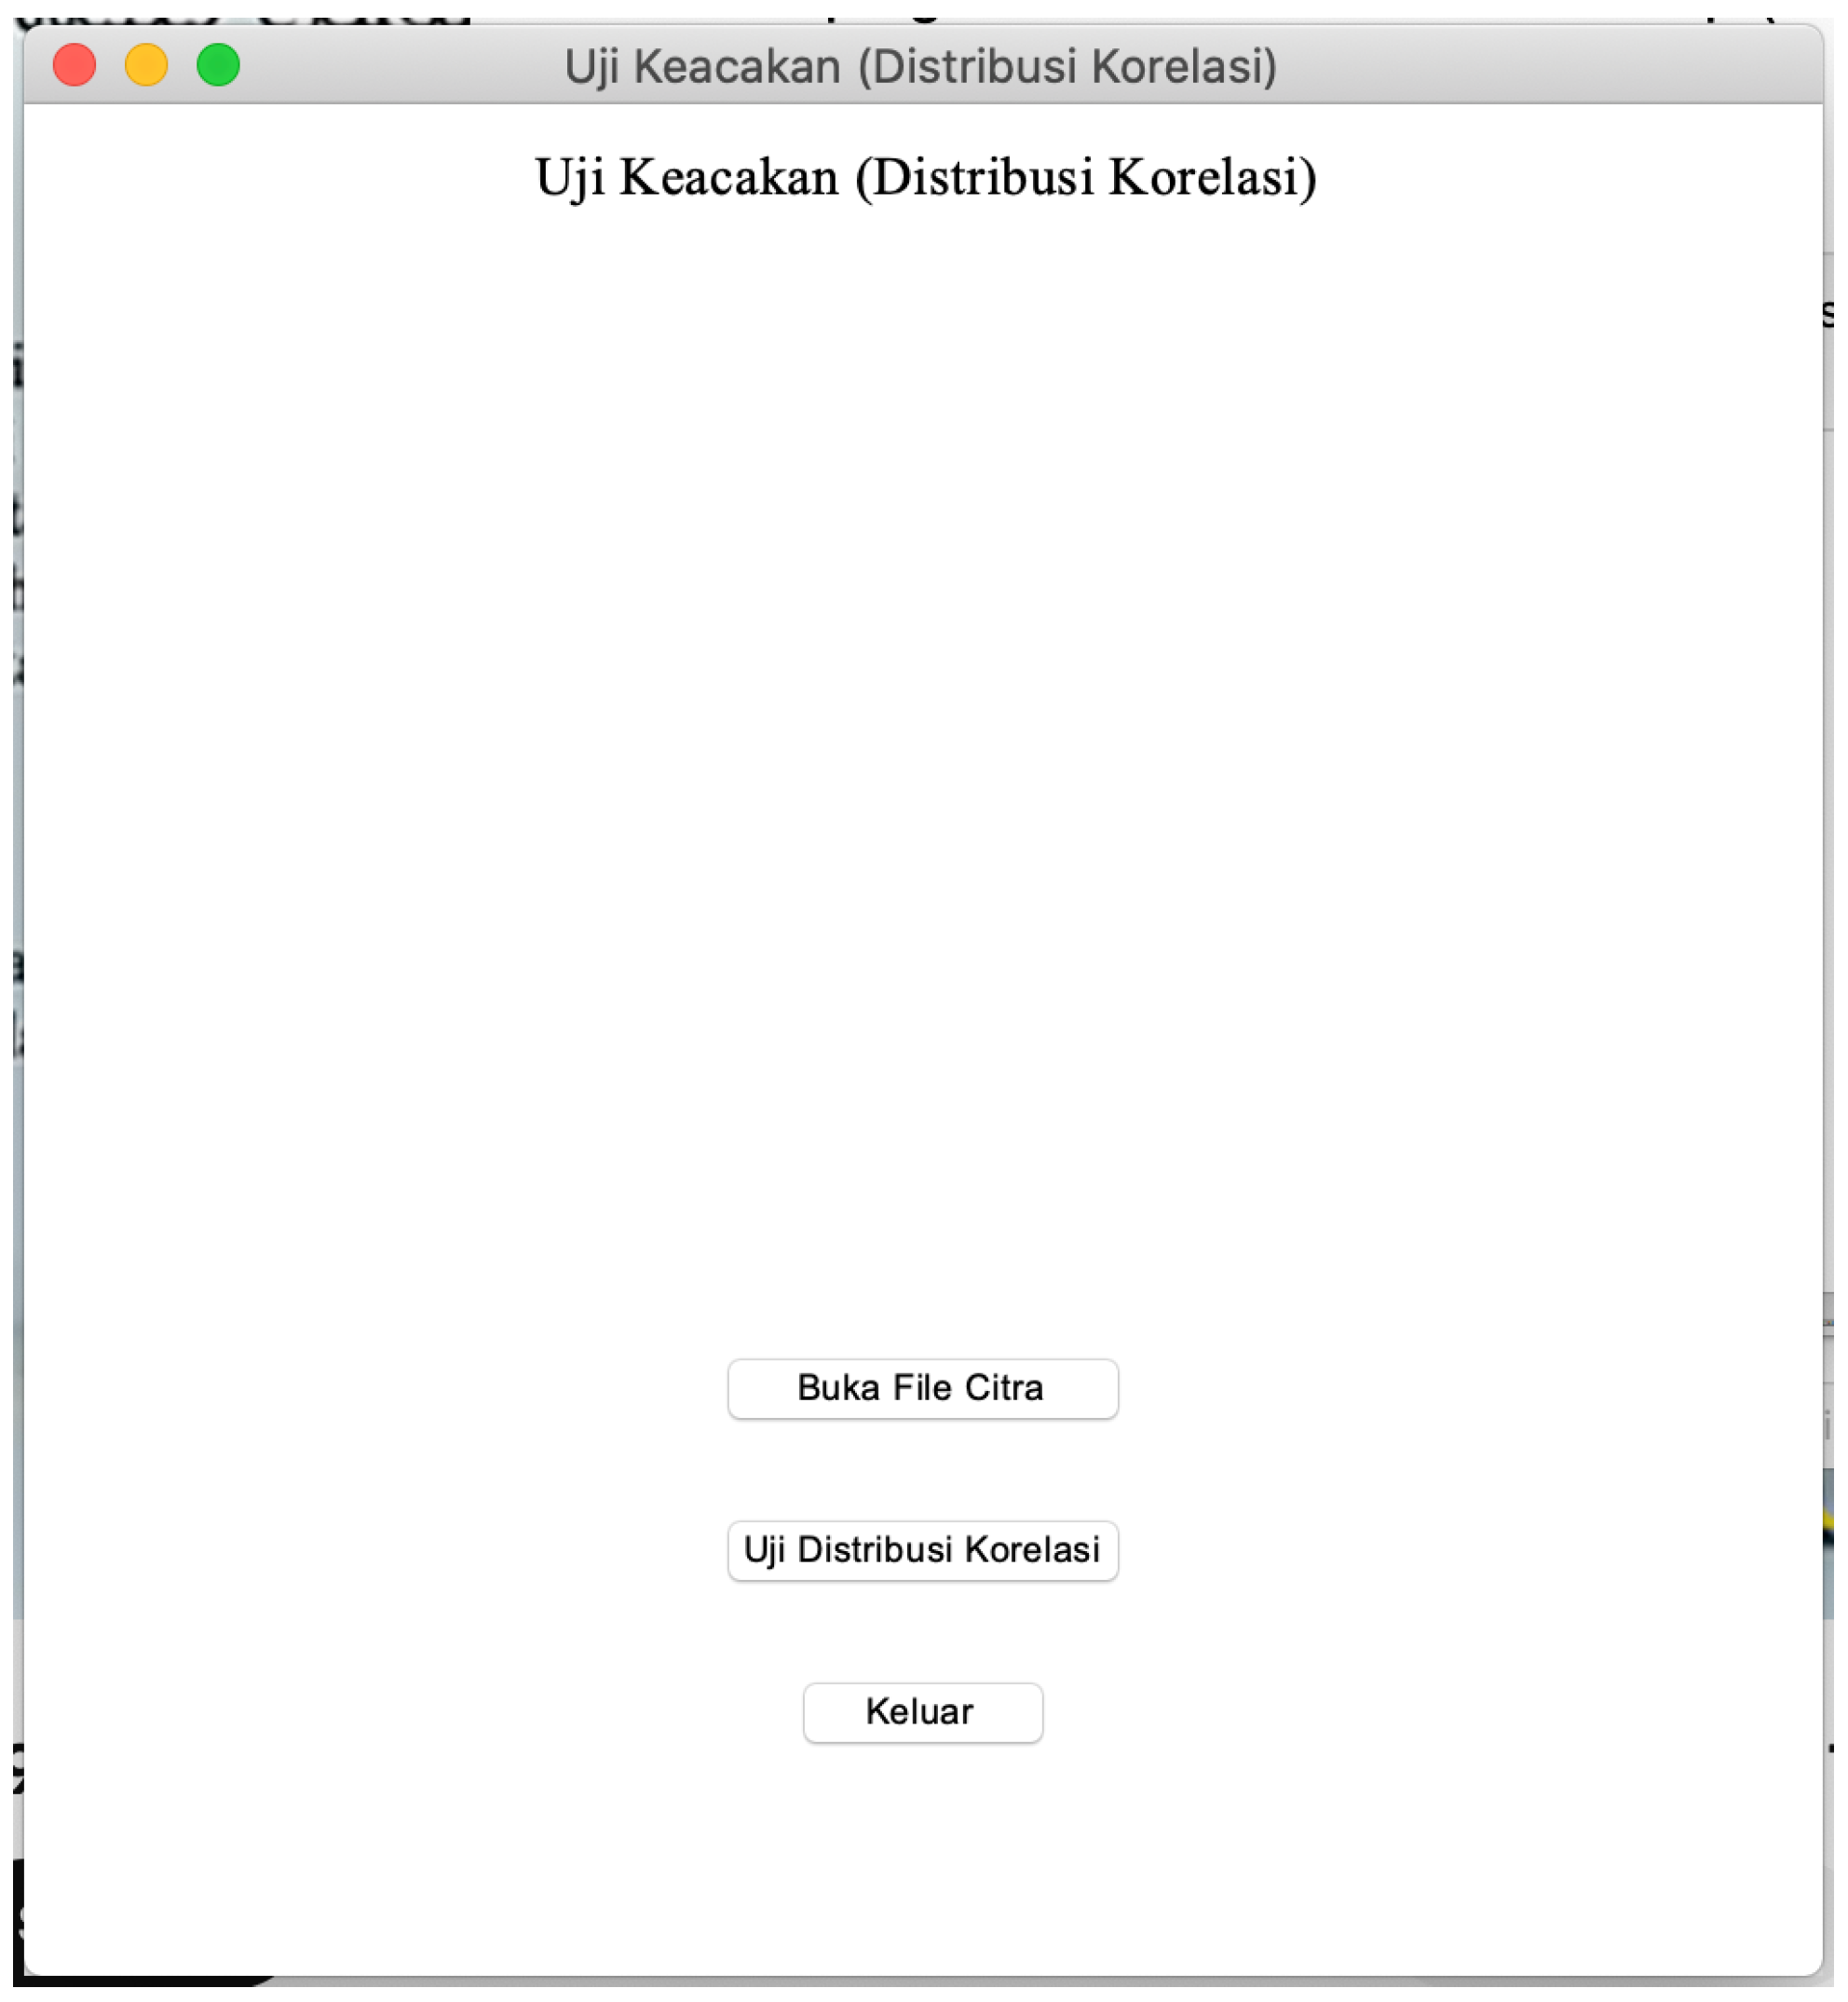
Figure 8.
Statistical Test Display.
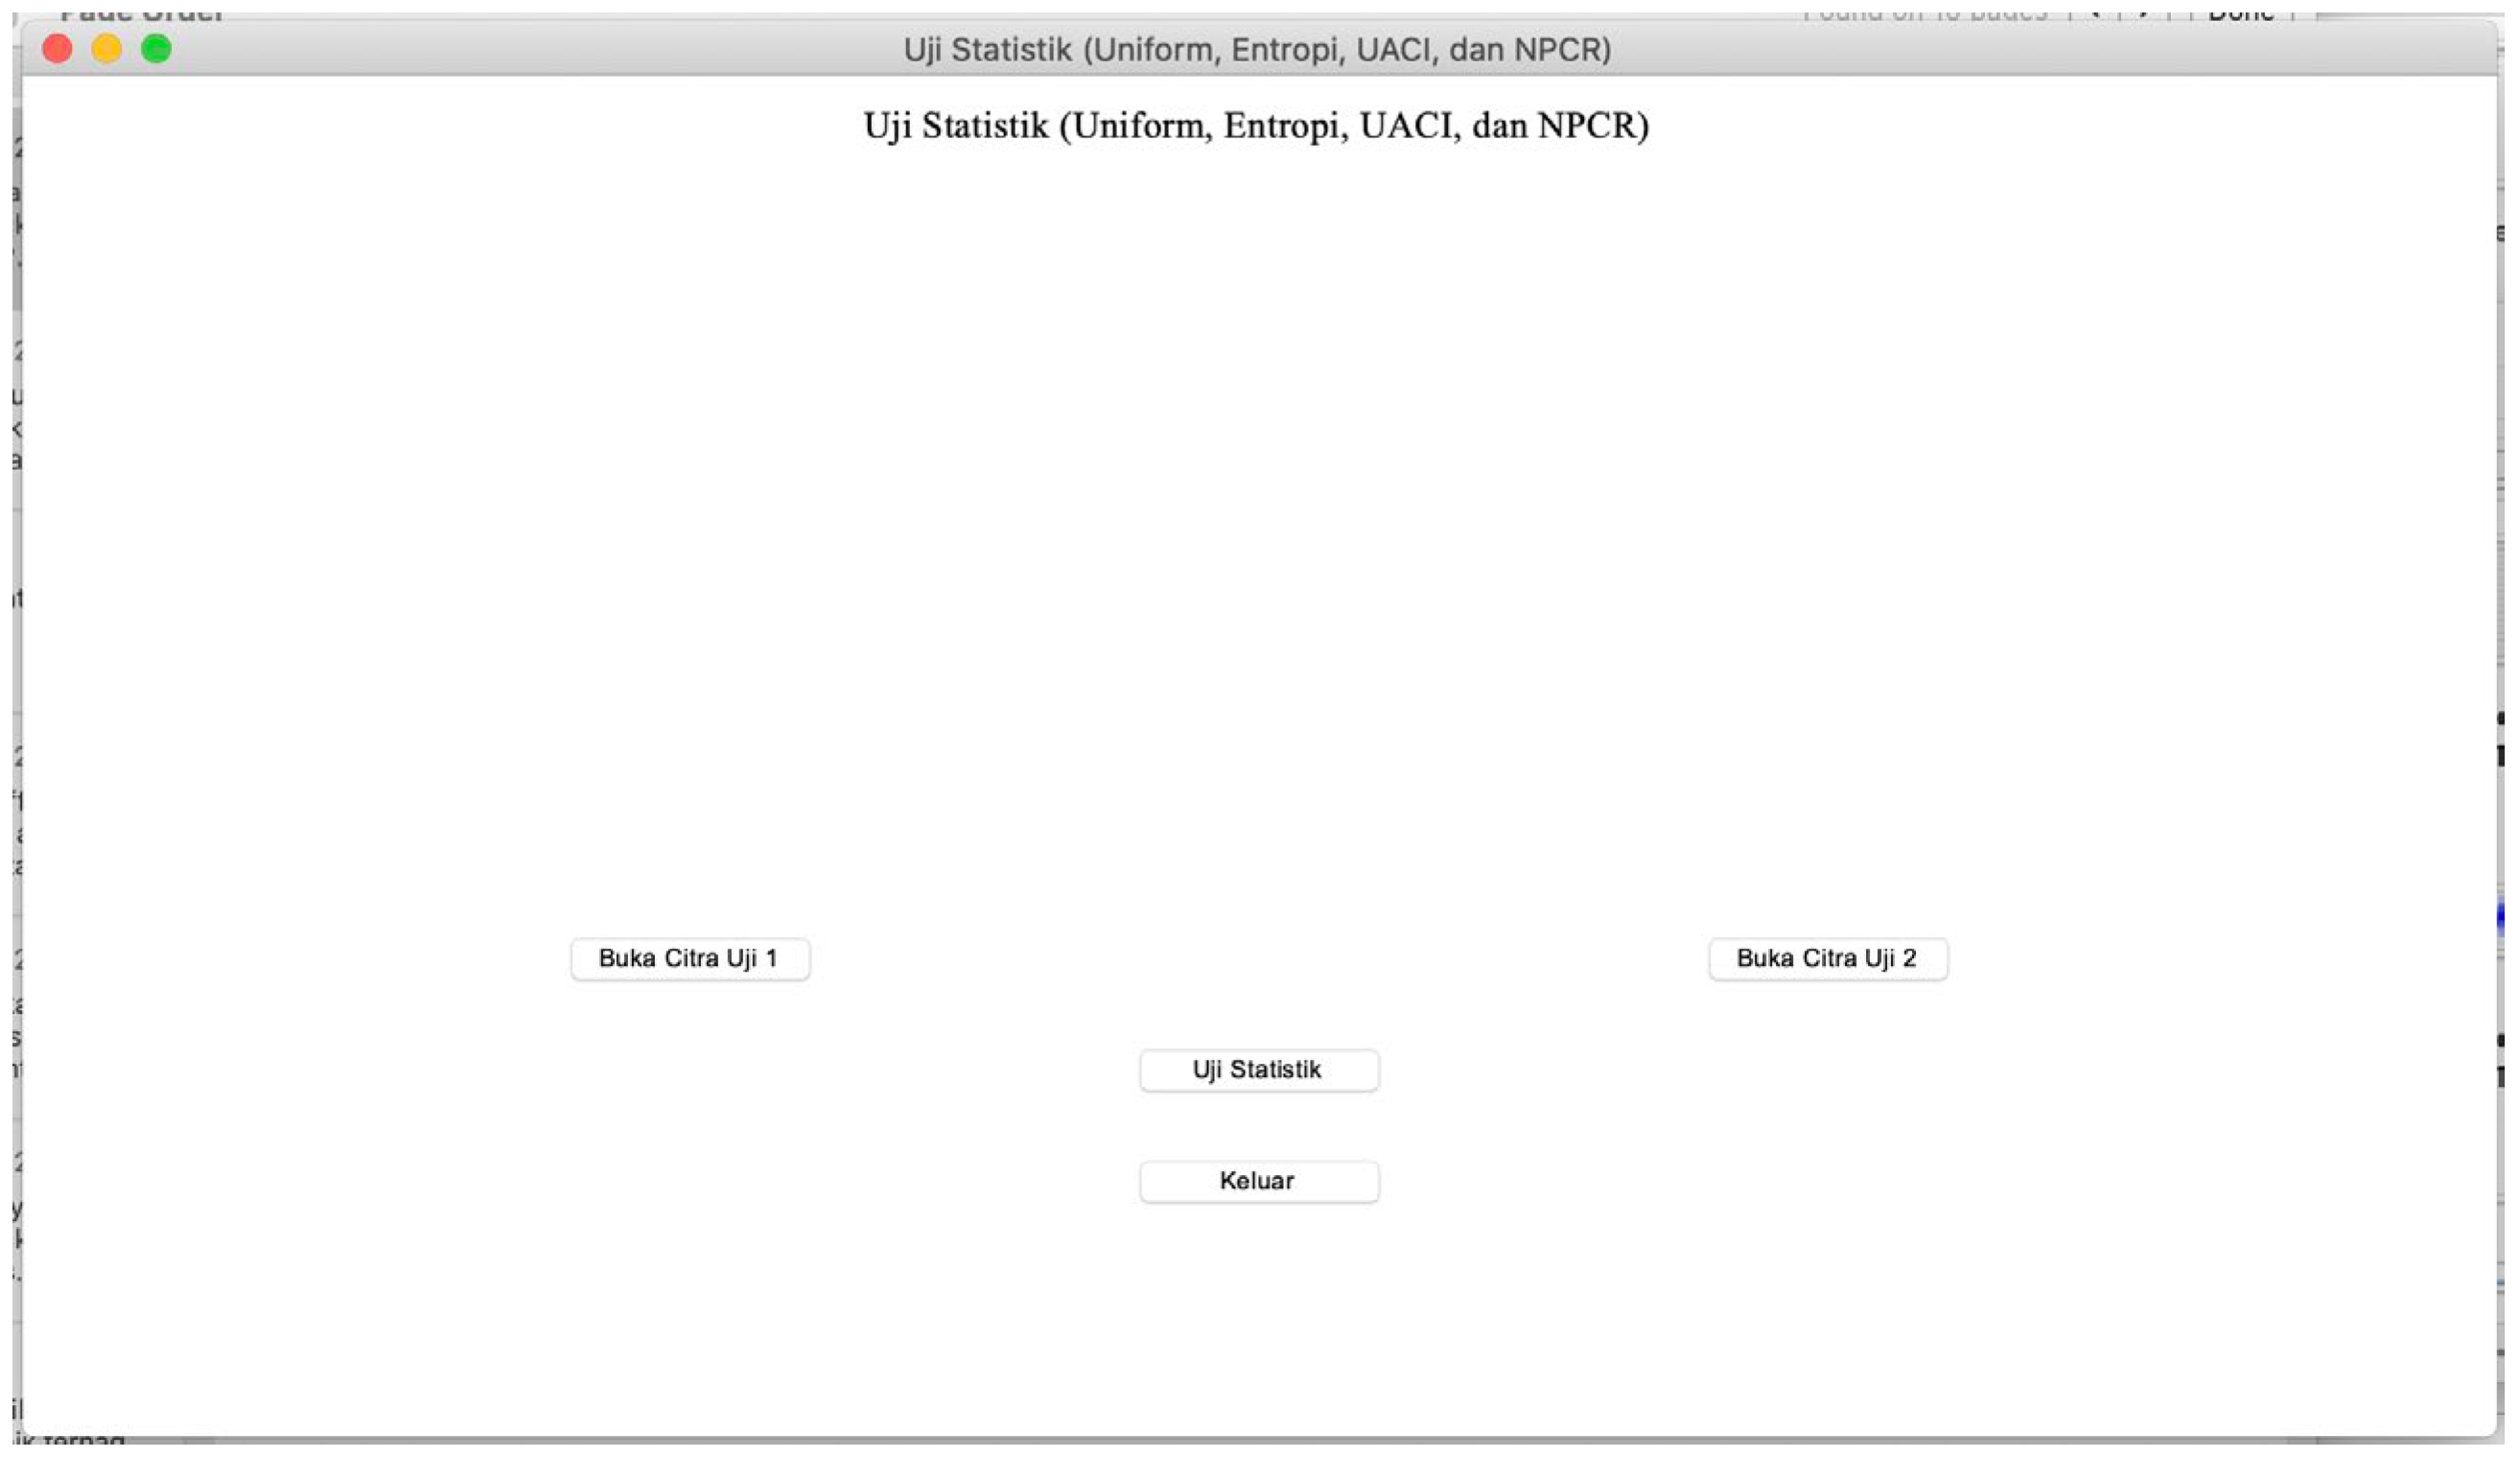

Table 1.
Coloured Image Test Data.
| Test Data | Image Name | Image Display | Size (pixels) |
|---|---|---|---|
| 1 | Tropical Beach.png |  |
256256 |
| 2 | 512512 | ||
| 3 | 10241024 | ||
| 4 | Jungle.bmp |  |
7681024 |
| 5 | 15362048 | ||
| 6 | 30724096 | ||
| 7 | Bird.png |  |
23041536 |
| 8 | 34562304 | ||
| 9 | 46083072 | ||
| 10 | Village.bmp |  |
512512 |
| 11 | 10241024 | ||
| 12 | 20482048 | ||
| 13 | City.png |  |
512288 |
| 14 | 1024576 | ||
| 15 | 20481152 |
Table 2.
Grayscale Image Test Data.
| Test Data | Image Name | Display Image | Size (pixels) |
|---|---|---|---|
| 16 | Tropical Beach.png |  |
256256 |
| 17 | 512512 | ||
| 18 | 10241024 | ||
| 19 | Jungle.bmp |  |
7681024 |
| 20 | 15362048 | ||
| 21 | 30724096 | ||
| 22 | Bird.png |  |
23041536 |
| 23 | 34562304 | ||
| 24 | 46083072 | ||
| 25 | Village.bmp |  |
512512 |
| 26 | 10241024 | ||
| 27 | 20482048 | ||
| 28 | City.png | 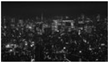 |
51288 |
| 29 | 1024576 | ||
| 30 | 20481152 |
Table 3.
Initial Value Sensitivity.
| Test Data | Decrypted image | |
|---|---|---|
| Tropical Beach.png (512 |  |
|
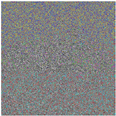 |
||
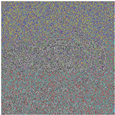 |
||
 |
||
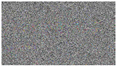
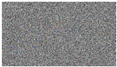
| Jungle.bmp (7681024) | 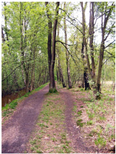 |
|
 |
||
 |
||
 |
||
| Bird.png (23041536) |  |
|
 |
||
 |
||
 |
||
| Village.bmp (512512) | 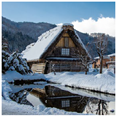 |
|
 |
||
 |
||
 |
||
| City.png (512288) |  |
|
 |
||
 |
||
 |
||
| Tropical Beach.png (512512) | 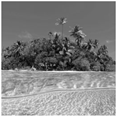 |
|
 |
||
 |
||
 |
||
| Jungle.bmp (7681024) |  |
|
 |
||
 |
||
 |
||
| Bird.png (23041536) |  |
|
 |
||
 |
||
 |
||
| Village.bmp (512512) |  |
|
 |
||
 |
||
 |
||
| City.png (512288) |  |
|
 |
||
 |
||
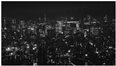 |
Table 4.
Comparison of Chaotic Function Key Spaces.
| Function | Parameter | Key Space |
|---|---|---|
| MS Circle Map (proposed) | ||
| Circle Map | ||
| MS Map | ||
| Circle + MS Map |
Table 5.
Statistical Test Results of Coloured Image Data.
| Test Data | Test Statistic Value | ||
|---|---|---|---|
| Red | Green | Blue | |
| 1 | 268.164062 | 258.437500 | 253.164063 |
| 2 | 250.863281 | 277.939453 | 275.384765 |
| 3 | 235.232421 | 270.956542 | 233.668940 |
| 4 | 243.031901 | 251.895833 | 271.606770 |
| 5 | 238.991699 | 244.717773 | 310.002929 |
| 6 | 288.055501 | 288.981445 | 254.281127 |
| 7 | 275.367187 | 248.243923 | 267.787905 |
| 8 | 235.268904 | 227.270254 | 272.959297 |
| 9 | 260.675238 | 209.334056 | 264.488281 |
| 10 | 250.142578 | 205.775390 | 270.474609 |
| 11 | 275.858398 | 263.105468 | 242.437988 |
| 12 | 245.902588 | 223.680786 | 226.968017 |
| 13 | 229.420138 | 230.788194 | 260.524305 |
| 14 | 259.599826 | 206.467013 | 222.075520 |
| 15 | 240.970703 | 235.670138 | 267.295355 |
Table 6.
Statistical Test Results of Grayscale Image Data.
| Test Data | Test Statistic Value |
|---|---|
| 16 | 247.1875 |
| 17 | 246.248046 |
| 18 | 246.130859 |
| 19 | 219.767578 |
| 20 | 288.8857429 |
| 21 | 251.916582 |
| 22 | 274.582754 |
| 23 | 274.217978 |
| 24 | 223.690285 |
| 25 | 253.832031 |
| 26 | 272.104980 |
| 27 | 267.083251 |
| 28 | 286.586805 |
| 29 | 266.861979 |
| 30 | 270.957248 |
Table 7.
Correlation Coefficient of the Plain Coloured Images.
| Test Data | Correlation Coefficient Values of Plain Images | ||
|---|---|---|---|
| Horizontal | Vertical | Diagonal | |
| 1 | 0.96568 | 0.94434 | 0.92287 |
| 2 | 0.96617 | 0.94438 | 0.92639 |
| 3 | 0.97512 | 0.97521 | 0.96592 |
| 4 | 0.86378 | 0.85873 | 0.79948 |
| 5 | 0.90500 | 0.89435 | 0.84902 |
| 6 | 0.96200 | 0.95648 | 0.93273 |
| 7 | 0.98914 | 0.98481 | 0.98135 |
| 8 | 0.99281 | 0.98962 | 0.987836 |
| 9 | 0.99415 | 0.99176 | 0.9895 |
| 10 | 0.96107 | 0.95283 | 0.9337 |
| 11 | 0.96845 | 0.96614 | 0.95483 |
| 12 | 0.98193 | 0.98199 | 0.969853 |
| 13 | 0.81418 | 0.74386 | 0.65015 |
| 14 | 0.86347 | 0.78645 | 0.71327 |
| 15 | 0.91477 | 0.87933 | 0.82351 |
Table 8.
Correlation Coefficient of Encrypted Coloured Images.
| Test Data | Encryption Image Correlation Coefficient | ||
|---|---|---|---|
| Horizontal | Vertical | Diagonal | |
| 1 | -0.0029 | 0.00052 | 0.0038 |
| 2 | -0.00256 | 0.00015 | 0.00338 |
| 3 | -0.0011 | -0.0004 | -0.00047 |
| 4 | -0.00104 | -0.00091 | -0.00116 |
| 5 | -0.00001 | 0.00023 | -0.00015 |
| 6 | 0.00066 | 0.00012 | -0.00033 |
| 7 | 0.00022 | -0.00013 | -0.00002 |
| 8 | 0.00023 | 0.0001 | -0.00053 |
| 9 | 0.00041 | 0.00055 | -0.00063 |
| 10 | -0.00256 | 0.0008 | 0.00321 |
| 11 | -0.00436 | -0.00166 | -0.0015 |
| 12 | 0.00053 | 0.00013 | -0.00006 |
| 13 | -0.0016 | 0.00252 | 0.00222 |
| 14 | -0.00126 | -0.00027 | 0.00058 |
| 15 | 0.000013 | 0.000016 | -0.00026 |
Table 9.
Correlation Coefficient of Original Grayscale Images.
| Test Data | Correlation Coefficient Values of Plain Images | ||
|---|---|---|---|
| Horizontal | Vertical | Diagonal | |
| 1 | 0.96063 | 0.93627 | 0.91181 |
| 2 | 0.95844 | 0.93544 | 0.91289 |
| 3 | 0.98365 | 0.97155 | 0.95976 |
| 4 | 0.85548 | 0.84890 | 0.78851 |
| 5 | 0.89866 | 0.88655 | 0.83881 |
| 6 | 0.95941 | 0.95327 | 0.92803 |
| 7 | 0.98501 | 0.97712 | 0.97292 |
| 8 | 0.98710 | 0.98418 | 0.98073 |
| 9 | 0.99159 | 0.98743 | 0.98439 |
| 10 | 0.96044 | 0.95203 | 0.93269 |
| 11 | 0.96776 | 0.96539 | 0.94798 |
| 12 | 0.98155 | 0.98160 | 0.96920 |
| 13 | 0.80676 | 0.73035 | 0.63572 |
| 14 | 0.84834 | 0.76068 | 0.68246 |
| 15 | 0.93034 | 0.86319 | 0.80094 |
Table 10.
Correlation Coefficient of Grayscale Encrypted Images.
| Test Data | Encryption Image Correlation Coefficient | ||
|---|---|---|---|
| Horizontal | Vertical | Diagonal | |
| 1 | -0.001 | 0.00352 | 0.0041 |
| 2 | -0.0016 | 0.00377 | -0.0033 |
| 3 | -0.0011 | -0.0018 | -0.0013 |
| 4 | -0.0015 | -0.0005 | -0.0014 |
| 5 | 0 | 0.00101 | -0.0006 |
| 6 | 0.00056 | 0.0057 | 0.0024 |
| 7 | 0 | 0.0013 | 0.0006 |
| 8 | 0.00029 | 0 | -0.0006 |
| 9 | 0.00017 | 0.00035 | -0.0004 |
| 10 | -0.0025 | -0.0001 | 0.00328 |
| 11 | -0.0015 | -0.002 | -0.0013 |
| 12 | 0.00038 | 0 | -0.0013 |
| 13 | -0.0009 | 0.00256 | 0.00232 |
| 14 | -0.0009 | 0 | 0.00074 |
| 15 | -0.0001 | -0.0001 | -0.0003 |
Table 11.
NPCR and UACI values of color images and grayscale images.
| Test Data | NCPR (%) | UACI (%) | Test Data | NCPR (%) | UACI (%) |
|---|---|---|---|---|---|
| 1 | 99.62 | 35.42 | 16 | 99.62 | 28.67 |
| 2 | 99.62 | 35.85 | 17 | 99.62 | 28.83 |
| 3 | 99.60 | 35.85 | 18 | 99.60 | 28.88 |
| 4 | 99.60 | 30.16 | 19 | 99.60 | 29.41 |
| 5 | 99.61 | 30.52 | 20 | 99.61 | 29.77 |
| 6 | 99.61 | 30.61 | 21 | 99.60 | 29.85 |
| 7 | 99.61 | 32.61 | 22 | 99.60 | 28.80 |
| 8 | 99.61 | 32.62 | 23 | 99.60 | 28.81 |
| 9 | 99.61 | 32.63 | 24 | 99.60 | 28.83 |
| 10 | 99.62 | 32.79 | 25 | 99.60 | 32.19 |
| 11 | 99.60 | 32.96 | 26 | 99.59 | 32.39 |
| 12 | 99.61 | 33.05 | 27 | 99.61 | 32.49 |
| 13 | 99.60 | 39.97 | 28 | 99.59 | 39.56 |
| 14 | 99.60 | 40.30 | 29 | 99.59 | 39.87 |
| 15 | 99.60 | 40.40 | 30 | 99.60 | 40.01 |
Table 12.
Entropy Encryption of color image sand grayscale images.
| Test Data | Entropy Value | Test Data | Entropy Value |
|---|---|---|---|
| 1 | 7.9992 | 16 | 7.9972 |
| 2 | 7.9993 | 17 | 7.9993 |
| 3 | 7.9999 | 18 | 7.9998 |
| 4 | 7.9997 | 19 | 7.9998 |
| 5 | 7.9999 | 20 | 7.9999 |
| 6 | 7.9999 | 21 | 7.9999 |
| 7 | 7.9999 | 22 | 7.9999 |
| 8 | 7.9999 | 23 | 7.9999 |
| 9 | 7.9999 | 24 | 7.9999 |
| 10 | 7.9993 | 25 | 7.9993 |
| 11 | 7.9998 | 26 | 7.9998 |
| 12 | 7.9999 | 27 | 7.9999 |
| 13 | 7.9988 | 28 | 7.9986 |
| 14 | 7.9997 | 29 | 7.9997 |
| 15 | 7.9999 | 30 | 7.9999 |
Table 13.
MSE and PSNR decrypted image vs. plain image.
| Test Data | MSE | PSNR | Test Data | MSE | PSNR |
|---|---|---|---|---|---|
| 1 | 0 | 16 | 0 | ||
| 2 | 0 | 17 | 0 | ||
| 3 | 0 | 18 | 0 | ||
| 4 | 0 | 19 | 0 | ||
| 5 | 0 | 20 | 0 | ||
| 6 | 0 | 21 | 0 | ||
| 7 | 0 | 22 | 0 | ||
| 8 | 0 | 23 | 0 | ||
| 9 | 0 | 24 | 0 | ||
| 10 | 0 | 25 | 0 | ||
| 11 | 0 | 26 | 0 | ||
| 12 | 0 | 27 | 0 | ||
| 13 | 0 | 28 | 0 | ||
| 14 | 0 | 29 | 0 | ||
| 15 | 0 | 30 | 0 |
Table 14.
MSE and PSNR encrypted image vs. plain image.
| Test Data | MSE | PSNR | Test Data | MSE | PSNR |
|---|---|---|---|---|---|
| 1 | 12197.9 | 7.26794 | 16 | 7792.84 | 9.21384 |
| 2 | 12476.2 | 7.16997 | 17 | 7897.38 | 9.15596 |
| 3 | 12473.6 | 7.17087 | 18 | 7930.13 | 9.13799 |
| 4 | 8774.36 | 8.71352 | 19 | 8285.94 | 8.96471 |
| 5 | 9003.19 | 8.58683 | 20 | 8508.42 | 8.83231 |
| 6 | 9059.46 | 8.55977 | 21 | 8562.34 | 8.80487 |
| 7 | 10369.4 | 7.97323 | 22 | 7886.87 | 9.16175 |
| 8 | 10376.2 | 7.96532 | 23 | 7888.86 | 9.16076 |
| 9 | 10388.3 | 7.96532 | 24 | 7898.16 | 9.15553 |
| 10 | 10484.5 | 7.92531 | 25 | 10079.1 | 8.09654 |
| 11 | 10601.3 | 7.85564 | 26 | 10221.8 | 8.03552 |
| 12 | 10654.0 | 7.85564 | 27 | 10287.3 | 8.00775 |
| 13 | 15174.4 | 6.31968 | 28 | 14951.4 | 6.38396 |
| 14 | 15381.1 | 6.26092 | 29 | 15136.3 | 6.33058 |
| 15 | 15456.8 | 6.23959 | 30 | 15197.0 | 6.31319 |
Disclaimer/Publisher’s Note: The statements, opinions and data contained in all publications are solely those of the individual author(s) and contributor(s) and not of MDPI and/or the editor(s). MDPI and/or the editor(s) disclaim responsibility for any injury to people or property resulting from any ideas, methods, instructions or products referred to in the content. |
© 2024 by the authors. Licensee MDPI, Basel, Switzerland. This article is an open access article distributed under the terms and conditions of the Creative Commons Attribution (CC BY) license (http://creativecommons.org/licenses/by/4.0/).
Copyright: This open access article is published under a Creative Commons CC BY 4.0 license, which permit the free download, distribution, and reuse, provided that the author and preprint are cited in any reuse.


