
Submitted:
17 January 2026
Posted:
20 January 2026
You are already at the latest version
Abstract
A hybridization assay based on the microfluidic biochip was developed to identify the origin of the Atlantic salmon species. Among the 215 single nucleotide polymorphic (SNP) sites found in the mtDNA of Salmo salar, we located five sites in devising our assay method. We found two sites that worked, while the others generated either insufficient signals or specificity. We have successfully identified the North American origin of the three samples, as confirmed by Sanger sequencing.
Keywords:
microfluidic biochip
; Atlantic salmon
; mitochondrial DNA
; hybridization assay
; single nucleotide polymorphism
1. Introduction
Atlantic salmon (Salmo salar) has routinely been identified for its continental origin, viz., North American or European [1]. Commercially, the salmon stocks are harvested together at sea when they are mixed on feeding grounds or migration routes [2,3]. The proportions of continent of origin vary annually or even seasonally [1,4]. For example, the proportion of caught salmon of North American origin is more than doubled since 1970’s [1]. Mixed-stock fishery has raised a lot of concerns because it can cause the less productive stocks to be seriously depleted and the more productive ones under-harvested [5]. This situation implied a genetic risk to salmon stocks. Therefore, information on the composition and origin of the catch should be provided to the management for setting up the yearly quota of the fishery as well as the evaluation of the impact [6]. Therefore, powerful methods for the identification of the stock components and quantification of their relative proportions have to be constructed for assessing the effects of mixed-stock sea fisheries on home water stocks.
A variety of techniques has been developed for the discrimination between Atlantic salmon of North American and European origins. Early efforts include morphometric and meristic analysis [7,8,9], elemental analysis [10], protein electrophoresis methods [11], as well as nucleic acid analysis [6,12,14]. Techniques based on DNA analysis present advantages over protein-based techniques, as the former is not dependent on tissue source, age of the individual, or sample damage. Recently, mitochondrial DNA (mtDNA) has been sequenced [15], and it has provided potentially useful markers for discriminating between Atlantic salmons. Restriction analysis of mtDNA has been reported to differentiate between closely related species. [6,13]. However, its routine and widespread application in fishstock management is still constrained by the cost, speed, and technical complexity of existing methods.
Here, we develop a low-cost, fast and simple method that is based on the microfluidic microarray (MMA) assay [19,20]. The MMA assay consists of the hybridization of the mtDNA of Atlantic salmon with specific oligonucleotide probes. There are hundreds of copies mtDNA, which is a small circular genome located in the mitochondria, as opposed to only two copies of genomic DNA in the cell nucleus. The specific probes used in the hybridization assay are designed based on the single nucleotide polymorphic (SNP) sites found in the non-coding genome, as described previously [21,22,23]. To develop our microfluidic microarray assay, we have examined the D-loop, which is a non-coding control region, in the salmon mtDNA and identified several SNP sites, see Table 1.
2. Materials and Methods
2.1. Materials
3-Aminopropyltriethoxyl silane (APTES), 50% glutaraldehyde, sodium dodecyl sulphate (SDS) and Triton X-100 were obtained from Sigma-Aldrich. Ultra-pure water (18 MΩ·cm) was obtained from an Easypure RF purification system (Dubuque, IA). Negative photoresist (SU-8 50) and its developer were purchased from MicroChem Corporation (Newton, MA). An elastomer base, Sylgard® 184 silicone and its curing agent used to make polydimethylsiloxane (PDMS) were obtained from Dow Corning Corporation (Midland, MI). The plain 3"×2" glass microscope slides were purchased from Fisher Scientific Company (Ottawa, ON, Canada). All other chemicals and solvents were purchased from BDH Tech Inc (Toronto, ON, Canada) and used without further purification.
All oligonucleotides were synthesized and modified by IDT. The sequences of oligonucleotides used and their acronyms were listed in Table 2 for primers and Table 3 for probes.
Sequence of J-PCR-Eu (213 bp), shown in bold blue is complementary to the J-Eu probe, in which the SNP site J (3444) is underlined:
5'ACAAAGCCCCCATGTGGACTGGGGGCACTGCCCCCACAACCAAGAGTCACAACTCTAAGTACCAGAATTTCTGACCAAAAATGATCCGGCATCACGCCGATCAACGGACCGAGTTACCCTAGGGATAACAGCGCAATCCTCTCCCAGAGTCCCTATCGACGAGGGGGTTTACGACCTCGATGTTGGATCAGGACATCCTAATGGTGCAGCCGC-3'
2.2. Extraction of DNA
Sample of fin tissue from Atlantic salmon specimens were used to isolate total DNA. The extractions were performed using the Puregene DNA Isolation Kit by Genetra System. DNA was isolated from 300 μg of fin tissue, according to the “mouse tail tissue protocol”.
2.3. PCR Amplification
PCR amplifications were performed with 50 ng of total DNA in a 25 μL reaction tube including 0.05 U Taq DNA polymerase. 12.5 pmol of each primer (forward and reverse), 2.5 μL of 10X PCR buffer, 12.5 μmol of dNTPs and autoclaved water to bring the total reaction volume to 25 μL. The PCR cycle began with an initial denaturation step of 4 min at 95 °C, followed by 35 cycles consisting of a denaturation step at 95 °C for 45 s, annealing at the optimal annealing temperature specific to each pair of primers for 45 s, extension at 72 °C for 1 min, and ending with a final extension step at 72 °C for 10 min. Following mtDNA amplification, 5 μL of PCR products were electrophoresed on a 1% agarose gel made with 1X TBE. The size of each product was verified using 1 kb DNA ladder. The remaining 20 μL of PCR products were purified using the QIAGEN QIAquick PCR product purification kit and quantified with a UV spectrometer (Nanodrop 2000).
2.4. Surface Modification of Glass Chips
The glass substrates were chemically modified to produce aldehyde-functionalized surfaces using an established procedure (See Scheme 1) (21). Briefly, plain glass slides were cleaned with 10% NaOH solution for 10 minutes at ~100°C. After being rinsed with distilled water, the slides were treated with a piranha solution (70:30 v/v, sulfuric acid to 30% hydrogen peroxide) for 1h at ~80°C. The slides were then rinsed with water and dried under a stream of nitrogen.
The cleaned slides were treated with a mixture of ethanol: H2O: APTES (95:3:2 by volume) for 2h under stirring; rinsed with 95% ethanol and deionized H2O; dried under nitrogen and baked at ~120°C for 1h. The aminated glass slides were then immersed in 5% glutaraldehyde in a 10X PBS (Phosphate Buffered Saline) solution overnight and washed with acetone and deionized H2O. After being dried in a nitrogen gas stream, the aldehyde-modified glass slides were stored in a dark place at 4°C before probe printing.
2.5. Fabrication of PDMS Channel Plates
A 2"×2" PDMS channel plate was fabricated using an established photolithographic method [18,21]. The channel pattern was designed using Visual Basic (Microsoft) and was printed on a transparency to create the photomask at a resolution of 3368 dpi. Molding masters were fabricated in a modular clean room (577 series, Clean Air Products, Minneapolis, MN). First, a 4" silicon wafer was spin-coated with a layer of SU-8 photoresist by a spin coater (WS-400, Laurell Technologies Corporation, North Wales, PA). Then the channel patterns were created on the SU-8 coated wafer with the photomask using a UV exposure system (Model LS-150-3, Bachur & Associates, San Jose, CA). The SU-8-coated wafer was developed to produce the molding master. PDMS prepolymer was cast against the molding master and cured at 50ºC for 12 h to yield an elastomeric channel plate. The width of the straight channels was 300 µm and the channel height was 20 μm. The length of the straight section of each channel was 30 mm. Solution reservoirs (1 mm in diameter) at both ends of channels were punched on the PDMS channel plate using a flat-end syringe needle.
2.6. Probe Line Creation
As shown in Figure 1 (Step 1), the PDMS channel plate was sealed against the aldehyde glass slide to form the microfluidic biochip. Then, 0.8 µL of probe DNA prepared in the spotting solution (1.0 M NaCl + 0.15 M NaHCO3) was added into the inlet reservoirs using a micropipette. The probe solution was filled through the channels by applying vacuum pumping at the outlets. With incubation at room temperature for 30 min, covalent Schiff linkage was formed between the amine ends of the probe oligonucleotides and the aldehyde groups on the glass surface [21]. After washing the microchannels with 1 µL of washing solution (0.15% Triton-X 100, 1.0M NaCl and 0.15M NaHCO3), the PDMS channel plate was then peeled off and the glass slide was chemically reduced with a NaBH4 solution (100 mg of NaBH4 was dissolved in 30 mL 1x PBS and 10 mL 95% EtOH) for 15 min to reduce the Schiff linkage to the more stable C-N single bond. The glass chip was then rinsed with deionized water for 2 min and dried by nitrogen gas and was ready for hybridization. All procedures were conducted at room temperature.
2.7. Sample Hybridization and Biochip Scanning
The glass chip immobilized with the probe line arrays was covered with a PDMS channel plate to form the microfluidic biochip. The straight channels were orthogonal to the printed probe lines on the slide (as shown in Figure 1 Step 2). The DNA samples (oligonucleotides or PCR products) were prepared in the hybridization buffer (4X SSC + 0.2% SDS, unless stated otherwise). The PCR products were denatured at 95ºC for 4 min and then quickly cooled in an ice-water bath just before hybridization. 1.0-µL DNA targets were added to the inlet reservoirs using an automatic pipettor. Sample solutions in different reservoirs were then pumped into channels by vacuum suction simultaneously applying at the 16 outlets. The flow of DNA targets and their binding on the immobilized probes in a microchannel was shown in Figure 1 Step 3. Two methods were used to control the hybridization temperature inside the microchannels. In the continuous-flow mode, a Peltier device (CP1-12715, Thermal Enterprises, NJ) was placed under the glass slide assembly, and the hybridization temperature was adjusted by tuning the voltage applied to the Peltier device. In the stop-flow incubation mode, the assembly was incubated in a humidity box placed in an oven at a specified temperature. Hybridization was achieved between complementary DNA targets in solution and probe lines at the intersections, showing the hybridization patches of 300 µm × 300 µm. The microchannels were rinsed immediately with 2 µL hybridization buffer following hybridization.
Following the hybridization and washing procedures, the glass slide was scanned on a confocal laser fluorescent scanner (Typhoon 9410, Molecular Dynamics, Amersham Biosystems). The resolution is 25 µm. The excitation wavelength was 488 nm or 633 nm for fluorescent-labeled or Cy5-labeled samples, respectively. The photomultiplier tube (PMT) voltage was set to 600V. The scanned image was analyzed by ImageQuant 5.2 software. In the data quantification procedure, square frames (13 pixels × 13 pixels) were overlaid on the square hybridization patches in the image. The average fluorescent signals of the 169 pixels were measured in relative fluorescent unit (RFU).
3. Results and Discussion
3.1. Identification of SNP to Discriminate Between Atlantic Salmon of Different Continental Origins
In genetic studies, it is very popular to investigate the mitochondrial genome because of its ease of isolation (i.e. more easily than from the nuclear genome), its small size, and its rapid accumulation of mutations.
The salmon mitochondrial genome has been identified to have 215 SNP sites. From the DNA sequences among various salmon samples, we have selected five SNP sites (J, K, L, M, N) at nucleotide positions 3444, 8642, 10000, 10126, 13514, respectively, due to complete consensus, as shown in Table 1. Those positions 2850 and 3711 with only partial consensus are also shown to illustrate the selection process. The European salmon DNA sequence at these five SNP sites is also shown below Table 1, in which the sites are depicted in red color.
From the sequence and SNP site information, primers and probes are designed to give similar, if not identical, melting temperature (Tm), based on the interrelated governing factors such as GC content, nucleotide length, primer concentration, concentrations of Na+ and Mg2+ ions. The forward (For) primers and reverse (Rev) primers are designed so that the Tm values of each primer pair are matched. Each forward primer is fluorescently labelled by Cy5, so that the forward strand of the PCR product formed is complementary to its specific probe, as shown in Table 3.
The forward strand of the European salmon PCR product around SNP site J (position 3444) is depicted below Table 2, in which the site is underlined, and the J probe is bolded in blue color.
3.2. Hybridization of PCR Products of Sample 1
Four PCR products (J1, K1, M1, N1) and their mixture (MX1) were prepared from salmon sample 1, and the hybridization of their forward strands with the probes are conducted on a MMA chip. The fluorescence image of the hybridization results is shown in Figure 2. It is observed that the hybridization signals of K1, M1 and N1 with KA, MA and NA, respectively, are strong. Since the signals are weaker in KE and NE but not ME, the discriminations were good in K1 and N1, but bad in M1. The quantified fluorescent intensities are shown in Figure 3, indicating strong and discriminative binding of K1 to KAm and N1 to NAm. The signal of M1 to MAm is strong but not much stronger than that to MEu. The signals of hybridizations between J probes and J1 were weak (note the scale on Figure 3d). The weak J signal is due to weak binding because of the secondary structures in J1 as well as hairpins in the J probes (JAm and JEu), see Figure 4a.
Even worse, J1 is found to cross-hybridize to M probes as well, as depicted in Figure 3d that probes MAm and MEu bind to M1. The cross-hybridization was in the reverse order, i.e. J1 binds to MEu more strongly, as shown in the alignment between MEu and the reverse complement of J1 (Figure 4b). This cross-hybridization reduced the discrimination by the M probes in the PCR product mixture MX1, as shown in Figure 3e.
We found that the signal intensity and specificity are good only for PCR products K1 and N1. With this information, sample 1 was identified to be of North American origin, and its DNA sequence was confirmed by Sanger sequencing.
3.2. Hybridization of Multiplex PCR Products of Three Salmon Samples
The signal intensity and specificity of hybridization between the probes and PCR products worked well with probes K and N. Since probes J produced weak signals and probes M were non-discriminating, we decided to select a fifth SNP site which is L at position 10000, see the SNP nucleotides, primers and probes in Table 1, Table 2 and Table 3, respectively.
In addition, we performed multiplex PCR for J, K, L and N using the four sets of forward and reverse primers. We also conducted an analysis to ensure there was no competitive binding between the primers which were mixed in the multiplex PCR procedure. We performed multiplex PCR on three Atlantic salmon samples (1, 2, 3).
The hybridization signals of multiplex PCR products of the 3 samples (MP1, MP2 and MP3a) are shown in Figure 5. MX2 was the mixture of individual PCR products of sample 2. We found that probes K and N were good in achieving discrimination, though not probes L, see Figure 5b. This concludes that the 3 samples were of North American origin. These findings were confirmed with Sanger sequencing. Although probe L did not work well in terms of specificity, we still have probes K and N at our disposal.
3.3. Thermodynamic Calculations of Hybridizations for Specific Probes
Finally, we calculated the thermodynamic parameters for the five probes and attempted to predict why M and L are non-discriminating. Table 4 depicts the nucleotides involved in the mismatch duplex formation, with the discrimination ratios calculated. The free energies of perfect-matched (PM) and mismatched (MM) duplexes of the five probes, and the differences in the two free energies are calculated, see Table 5.
Figure 6 shows the simulated hybridization intensity of the 5 sets of probes for J, K, L, M, N, normalized to the intensity of a high-binding sequence B, which was previously studied in the fungal DNA detection [19,21]. The high hybridization intensities and good discrimination are apparent in the cases of K and N, see Figure 6a. In the case of L, the discrimination is undesirable due to thermodynamic reasons. However, the discrimination was predicted to be good in the case of M due to thermodynamics, but the reality is not like this because kinetics and secondary structures have not been accounted for.
Figure 6b illustrates the situation when the bases (purine or pyrimidine) of the nucleotides adjacent to the SNP sites are considered.
4. Conclusion
In summary, we have developed a hybridization-based method to allow the identification of the origin of the Atlantic salmon based on two SNP sites. Such a method is cost-effective, rapid, relatively simple, and so it can potentially be applied to investigate all types of Atlantic salmon products. In addressing the issue of cost-effectiveness, the cost of the hybridization assay is lower than previous methods as no restriction enzymes are required.
Acknowledgement
We thank the funding from Natural Sciences and Engineering Research Council of Canada.
Abbreviations
| MMA | Microfluidic microarray |
| PDMS | Polydimethylsiloxane |
| APTES | 3-Aminopropyltriethoxysilane |
| SDS | Sodium dodecyl sulphate |
| SSC | Sodium chloride-sodium citrate buffer |
| PBS | Phosphate Buffered Saline |
References
- Reddin, D. G.; Friedland, K. D. A history of identification to continent of origin of Atlantic salmon (Salmo salar L.) at west Greenland, 1969-1997. Fish Res 1999, 43((1-3)), 221–235. [Google Scholar] [CrossRef]
- Saunders, R. L. Atlantic Salmon (Salmo-Salar) Stocks and Management Implications in the Canadian Atlantic Provinces and New England, USA. Can J Fish Aquat Sci 1981, 38((12)), 1612–1625. [Google Scholar] [CrossRef]
- Reddin, D. G.; Stansbury, D. E.; Short, P. B. Continent of Origin of Atlantic Salmon (Salmo-Salar L) at West Greenland. J Conseil 1988, 44((2)), 180–188. [Google Scholar] [CrossRef]
- Jacobsen, J. A.; Lund, R. A.; Hansen, L. P.; O'Maoileidigh, N. Seasonal differences in the origin of Atlantic salmon (Salmo salar L.) in the Norwegian Sea based on estimates from age structures and tag recaptures. Fish Res 2001, 52((3)), 169–177. [Google Scholar] [CrossRef]
- Pella, J. J.; Robertson, T. L. Assessment of Composition of Stock Mixtures. Fish B-Noaa 1979, 77((2)), 387–398. [Google Scholar]
- Bermingham, E.; Forbes, S. H.; Friedland, K.; Pla, C. Discrimination between Atlantic Salmon (Salmo-Salar) of North-American and European Origin Using Restriction Analyses of Mitochondrial-DNA. Can J Fish Aquat Sci 1991, 48((5)), 884–893. [Google Scholar] [CrossRef]
- Reddin, D. G.; Misra, R. K. Hotellings -T(2) to Identify the Origin of Atlantic Salmon (Salmo-Saalar) in a Mixed-Stock Fishery. Can J Fish Aquat Sci 1985, 42((2)), 250–255. [Google Scholar] [CrossRef]
- Claytor, R. R.; Maccrimmon, H. R.; Gots, B. L. Continental and Ecological Variance-Components of European and North-American Atlantic Salmon (Salmo-Salar) Phenotypes. Biol J Linn Soc 1991, 44((3)), 203–229. [Google Scholar] [CrossRef]
- Friedland, K. D.; Reddin, D. G. Use of Otolith Morphology in Stock Discriminations of Atlantic Salmon (Salmo-Salar). Can J Fish Aquat Sci 1994, 51((1)), 91–98. [Google Scholar] [CrossRef]
- Kelly, S.; Heaton, K.; Hoogewerff, J. Tracing the geographical origin of food: The application of multi-element and multi-isotope analysis. Trends Food Sci Tech 2005, 16((12)), 555–567. [Google Scholar] [CrossRef]
- Verspoor, E.; Beardmore, J. A.; Consuegra, S.; De Leaniz, C. G.; Hindar, K.; Jordan, W. C.; Koljonen, M. L.; Mahkrov, A. A.; Paaver, T.; Sanchez, J. A.; Skaala, O.; Titov, S.; Cross, T. F. Population structure in the Atlantic salmon: insights from 40 years of research into genetic protein variation. J Fish Biol 2005, 67, 3–54. [Google Scholar] [CrossRef]
- Davidson, W. S.; Birt, T. P.; Green, J. M. A Review of Genetic-Variation in Atlantic Salmon, Salmo-Salar L, and Its Importance for Stock Identification, Enhancement Programs and Aquaculture. J Fish Biol 1989, 34((4)), 547–560. [Google Scholar] [CrossRef]
- King, T. L.; Spidle, A. P.; Eackles, M. S.; Lubinski, B. A.; Schill, W. B. Mitochondrial DNA diversity in North American and European Atlantic salmon with emphasis on the Downeast rivers of Maine. J Fish Biol 2000, 57((3)), 614–630. [Google Scholar] [CrossRef]
- Gilbey, J; Knox, D; O'Sullivan, M; et al. Novel DNA markers for rapid, accurate, and cost-effective discrimination of the continental origin of Atlantic salmon (Salmo salar L.). ICES Journal of Marine Science 2005, 62, 1609–1616. [Google Scholar] [CrossRef]
- Hurst, 15. Carolyn D.; Bartlett, Sylvia E.; Davidson, William S.; Bruce, Ian J. The complete mitochondrial DNA sequence of the Atlantic salmon, Salmo salar. Gene 239 1999, 237–242. [Google Scholar] [CrossRef]
- Markham, N. R.; Zuker, M. DINAMelt web server for nucleic acid melting prediction. Nucleic Acids Research 2005, 33, W577–W581. [Google Scholar] [CrossRef]
- SantaLucia, J.; Hicks, D. The thermodynamics of DNA structural motifs. Ann. Rev. Biophys. Biomol. Structure 2004, 33, 415–440. [Google Scholar] [CrossRef]
- Wang, Lin; Li, Paul C.H.; Yu, Hua-Zhong; Parameswaran, Ash M. Fungal Pathogenic Nucleic Acid Detection Achieved with a Microfluidic Microarray Device. Anal. Chim. Acta 2008, 610, 97–104. [Google Scholar] [CrossRef]
- Wang, Lin; Li, Paul C.H. “Optimization of a microfluidic microarray device for the fast discrimination of fungal pathogenic DNA”. Anal. Biochem. 2010, 400, 282–288. [Google Scholar] [CrossRef]
- Wang, Lin; Li, Paul C.H. “Gold nanoparticle-assisted single base-pair mismatch discrimination on a microfluidic microarray device”. Biomicrofluidics 2010, 4, 032209. [Google Scholar] [CrossRef]
- Wang, L.; Li, P.C.H. Flexible Microarray Construction and Fast DNA Hybridization Conducted on a Microfluidic Chip for Greenhouse Plant Fungal Pathogen Detection. J. Agri. Food Chem. 2007, 55, 10509–10516. [Google Scholar] [CrossRef]
- Sedighi, Abootaleb; Li, Paul C.H. Kras Gene codon 12 mutation detection enabled by Gold Nanoparticles conducted in a NanoBioArray chip. Anal. Biochem. 2014, 448, 58–64. [Google Scholar] [CrossRef]
- Oberc, Christopher; Sedighi, Abootaleb; Li, Paul C.H. Genetic authentication of Panax ginseng and Panax quinquefolius Based on using Single Nucleotide Polymorphism (SNP) Conducted in a Nucleic Acid Test Chip. Anal. Bioanal. Chem. 414(2022), 3987–3998. [CrossRef]
Figure 1.
The hybridization-based assay using a microfluidic microarray (MMA) biochip with straight microchannels. (Step 1) The creation of a DNA probe line array on an aldehyde-modified glass slide via horizontally-oriented microchannels. After removal of the PDMS slab, green probe lines, which were fluorescein-labeled ADF, were depicted on the glass slide, as reported previously [21]. (Step 2) After the straight PDMS channels were placed orthogonal to the probe lines, the MMA biochip was ready for introduction of DNA samples labelled by Cy5 (red fluorescence). (Step 3) Hybridization reactions between the DNA samples and the immobilized probes occurred inside the microchannels, leading to the reactions revealed at the intersections between the channels and horizontal probe lines as red patches.
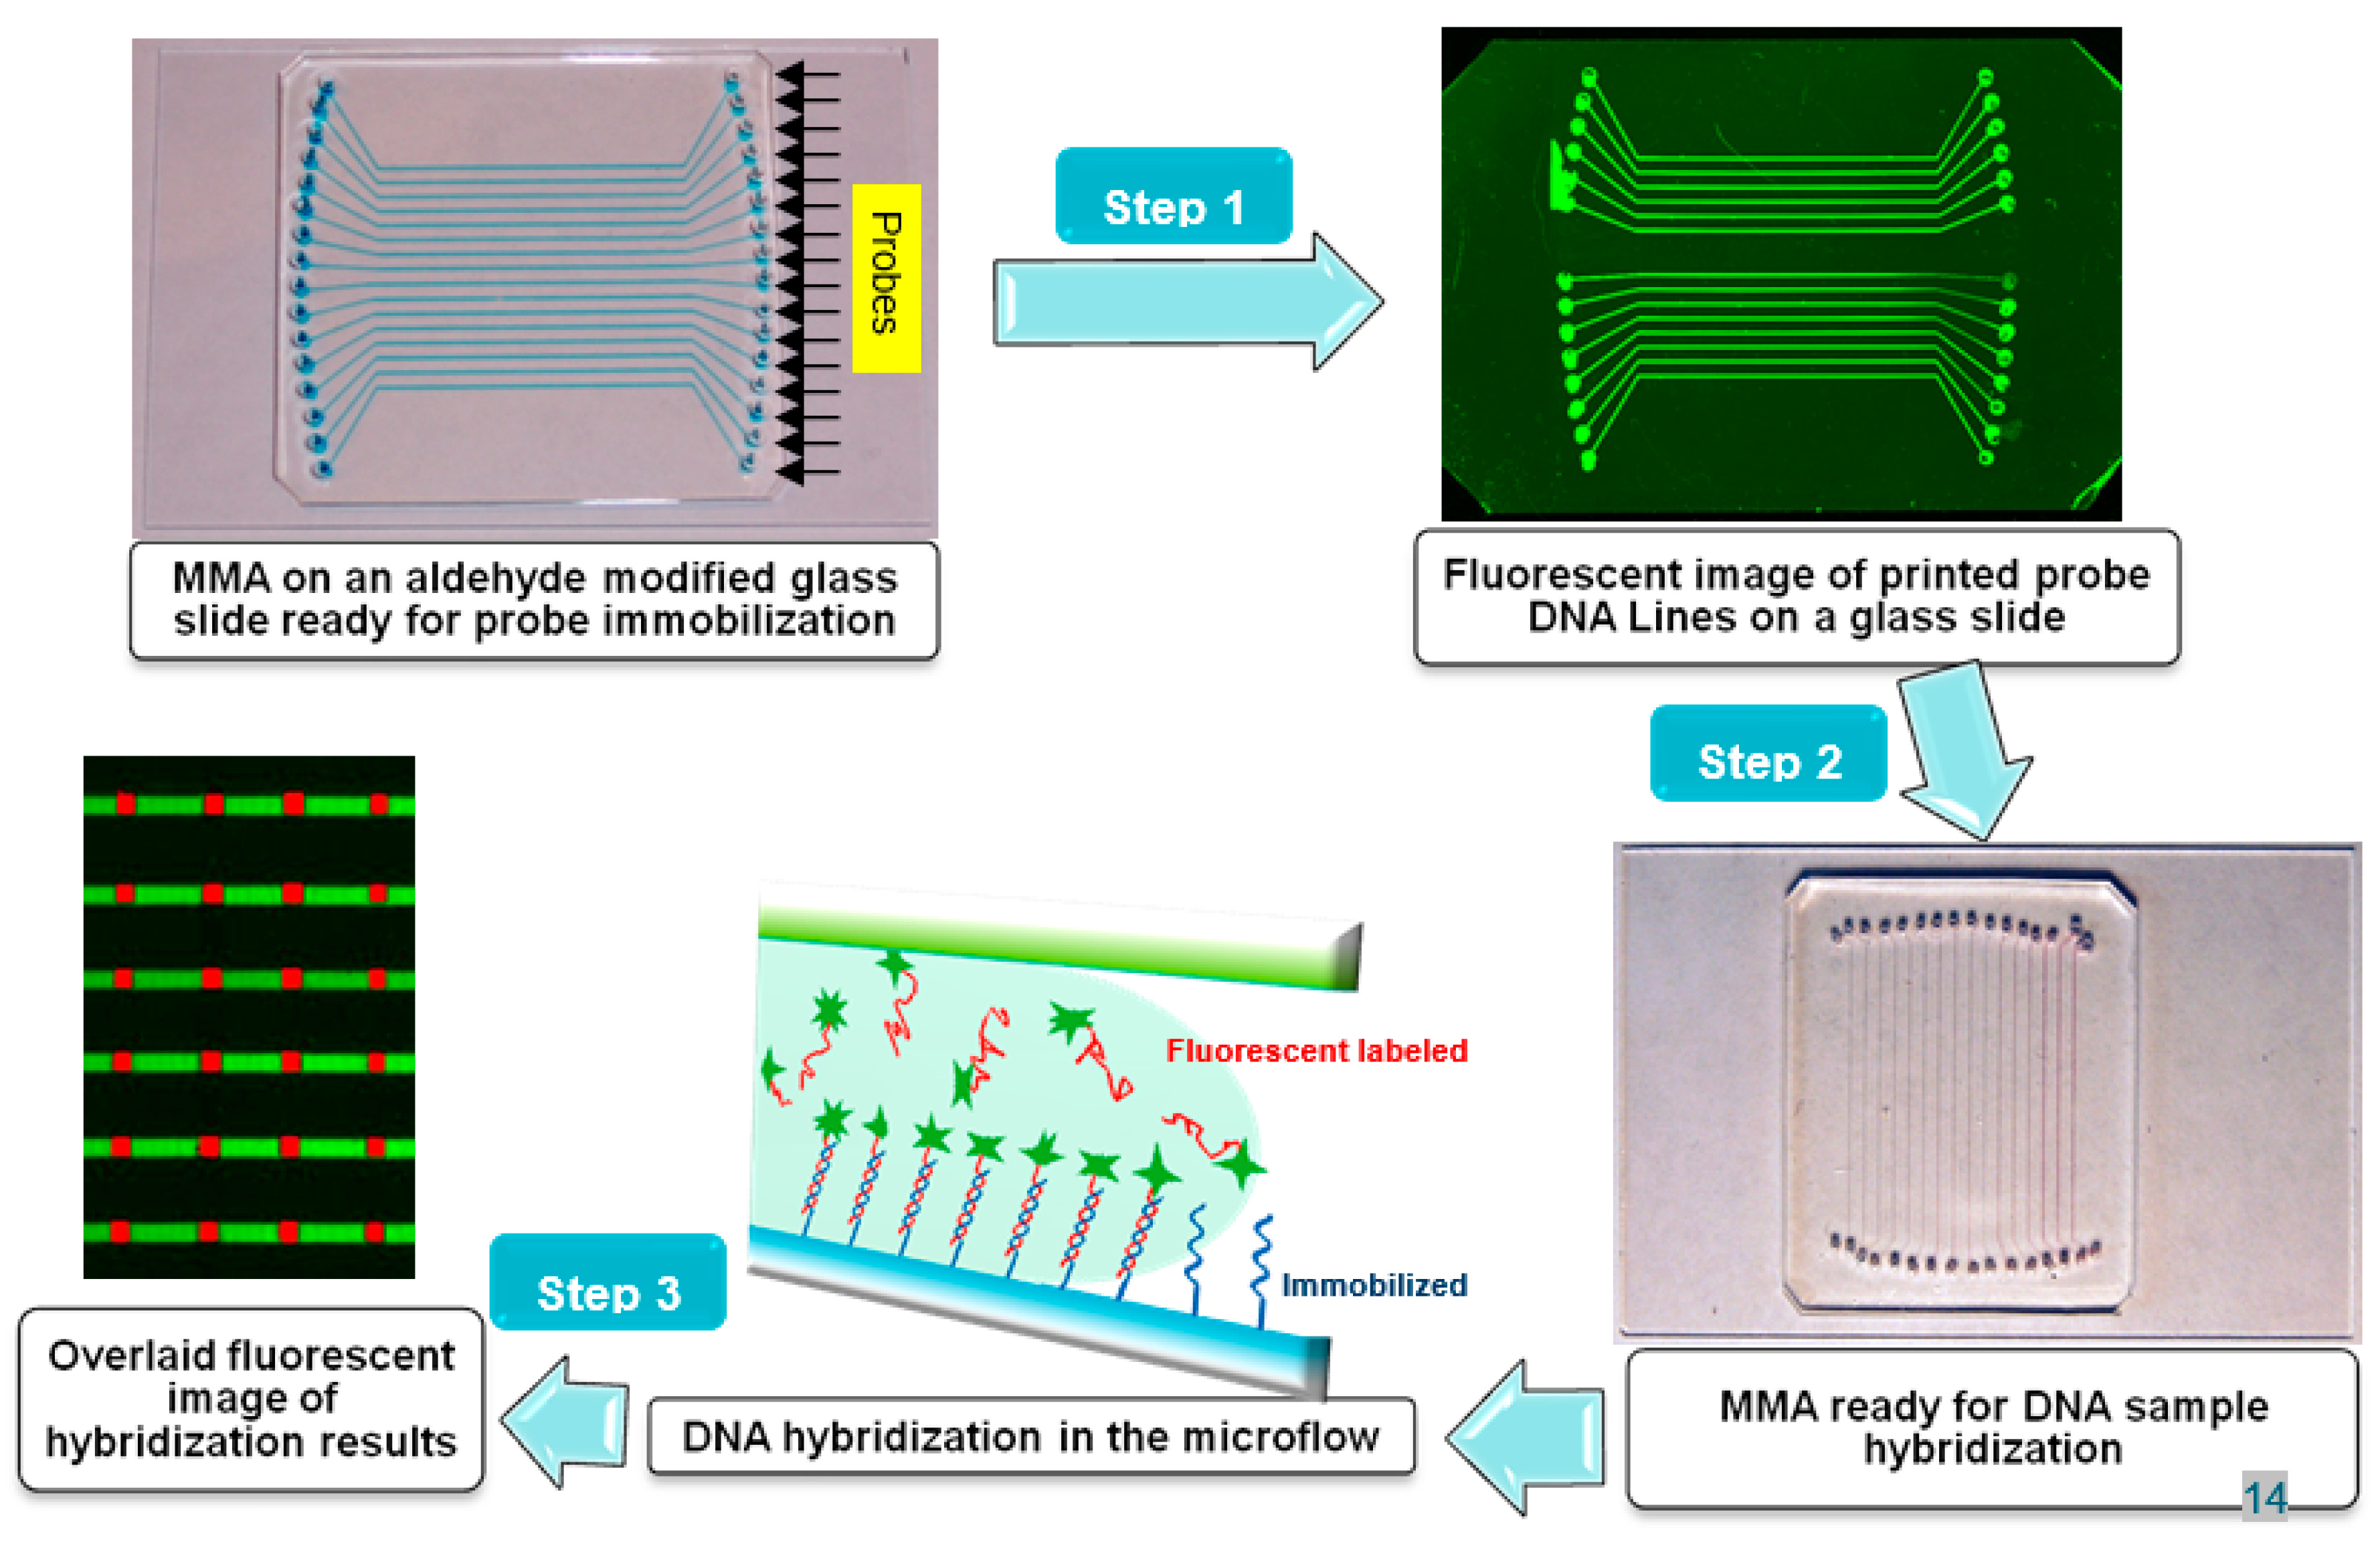
Figure 2.
The images of the hybridizations of PCR products (introduced in horizontal directions) with immobilized probes (immobilized vertical lines). Probes (1 μL) specific to four SNP sites (J, K, M, N, see Table 3) were immobilized for 20 min. PCR of salmon sample 1 using four primer sets (see Table 2) were prepared. J1, K1, M1 and N1 are denatured PCR products (20 nM) and MX1 is their mixture (each 5 nM). Hybridization was achieved at 50 °C in 10 min. All four PCR products prepared from sample 1 were verified by Sanger sequencing (ABI Prism 3100 genetic analyzer) to be of North American origin.
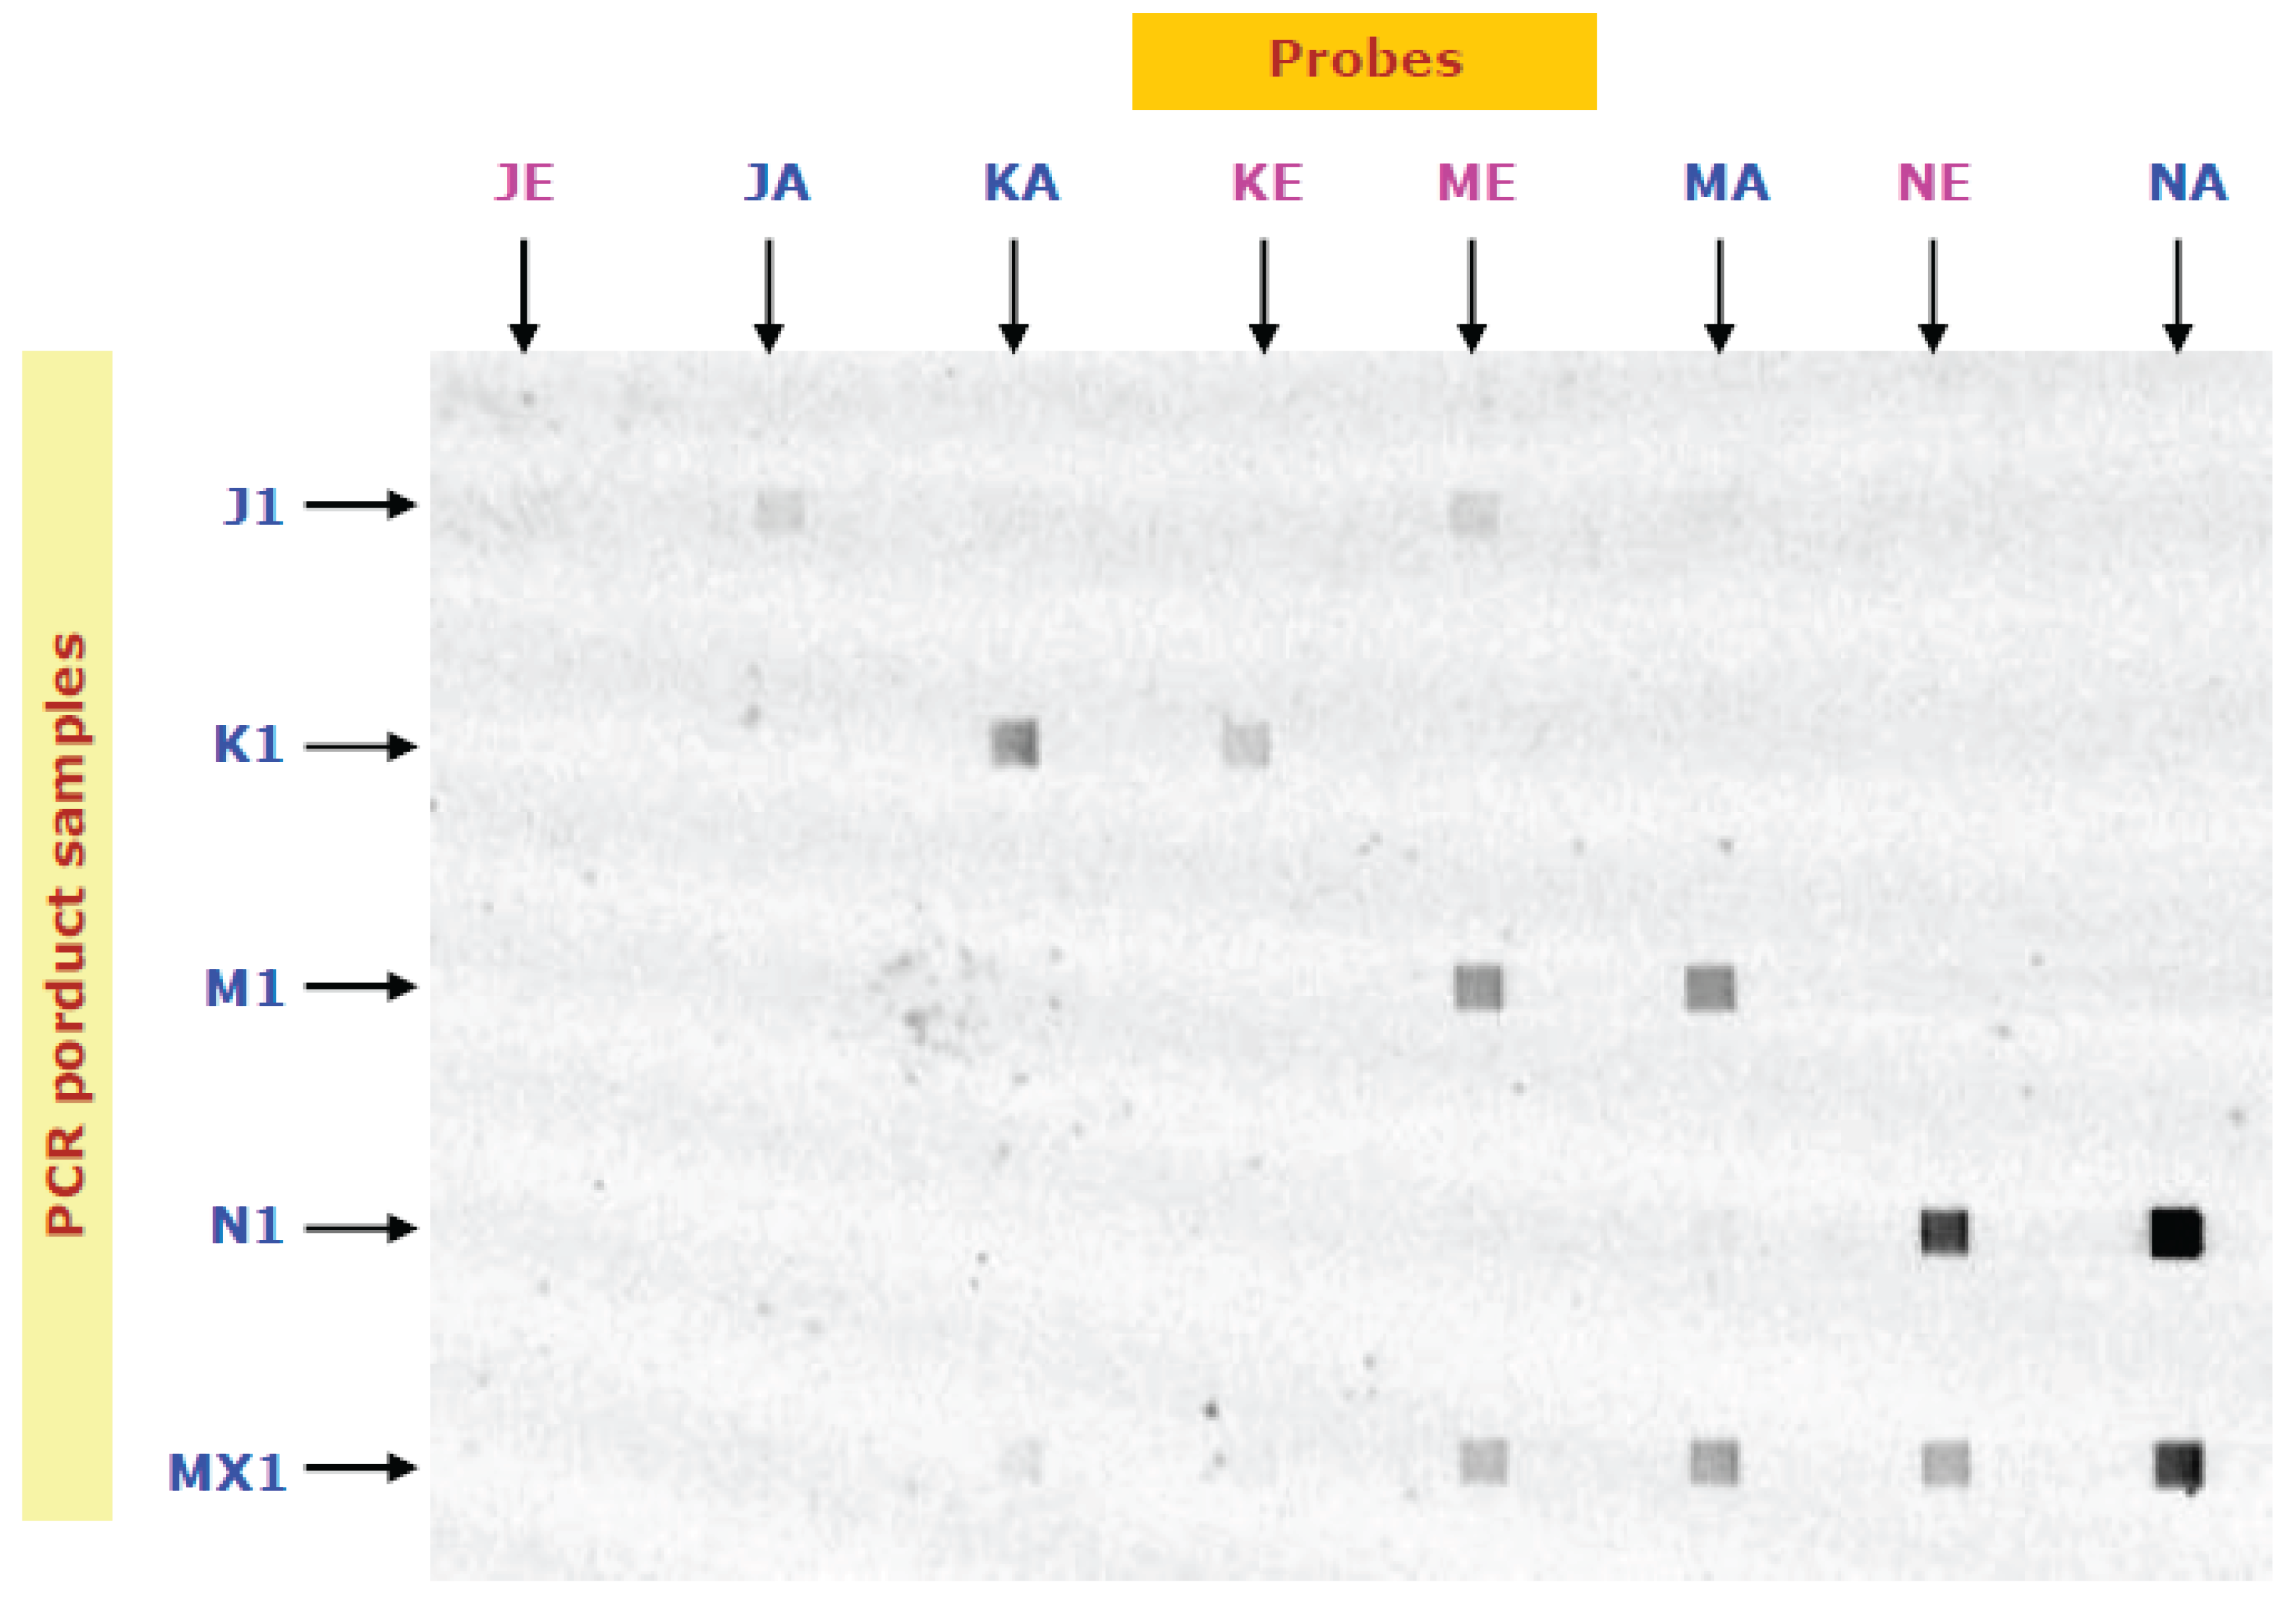
Figure 3.
Hybridization signals between four PCR products: J1, K1, M1, N1 of salmon sample 1 and their respective eight probes. The signals of the binding of K1, M1 and N1 with their specific probes (KAm, MAm, NAm) are stronger than that of J1 (with probe JAm). The discriminations of sample 1 by probes KAm and NAm are greater than that by probe MAm. Undesirably, J1 cross-hybridized with M probes in the reverse order, i.e. higher signal with MEu than with MAm. This cross-hybridization had further reduced the discrimination of the M probes in the PCR product mixture (MX1).
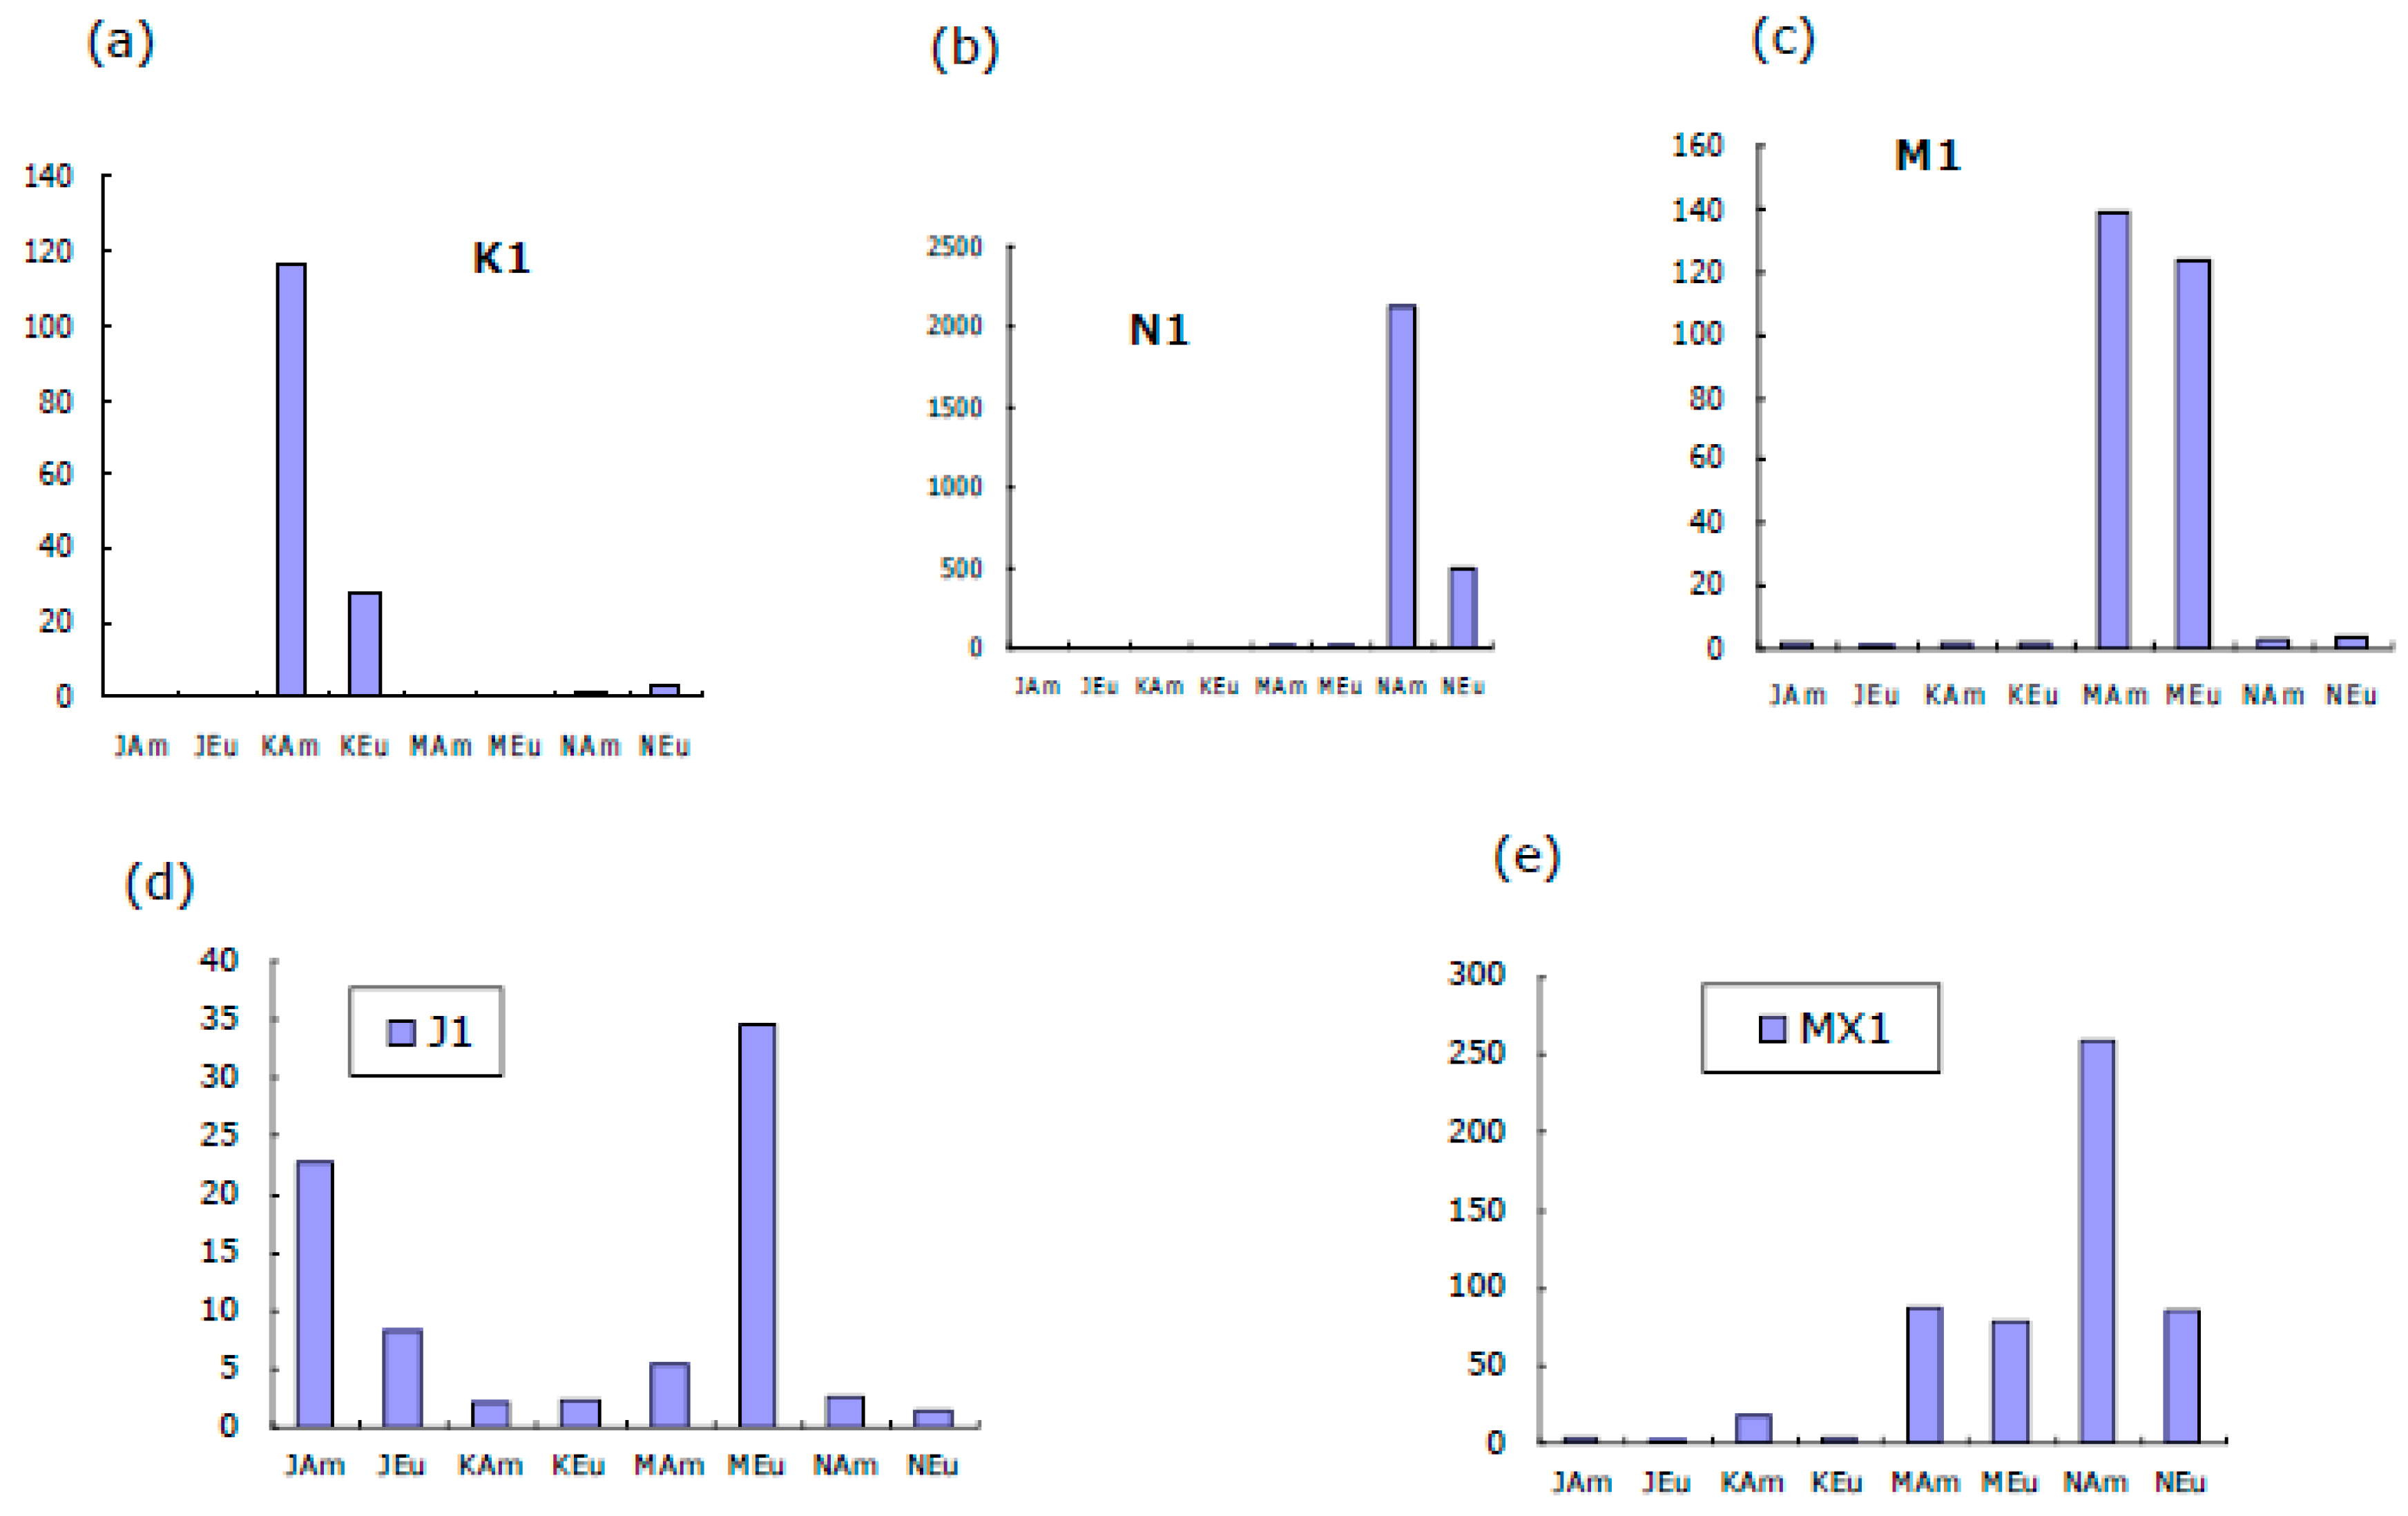
Figure 4.
Hybridization between probes J (JAm and JEu) and J-PCR product (J1) of salmon sample 1. (a) Secondary structures in J1 product as well as in JAm and JEu probes. (b) nucleic acid sequences of J1 around M site and of probes MAm and MEu. The 9 nucleotides (nt) of cross-hybridization between J1 and MEu probes (21-nt) are shown in blue.
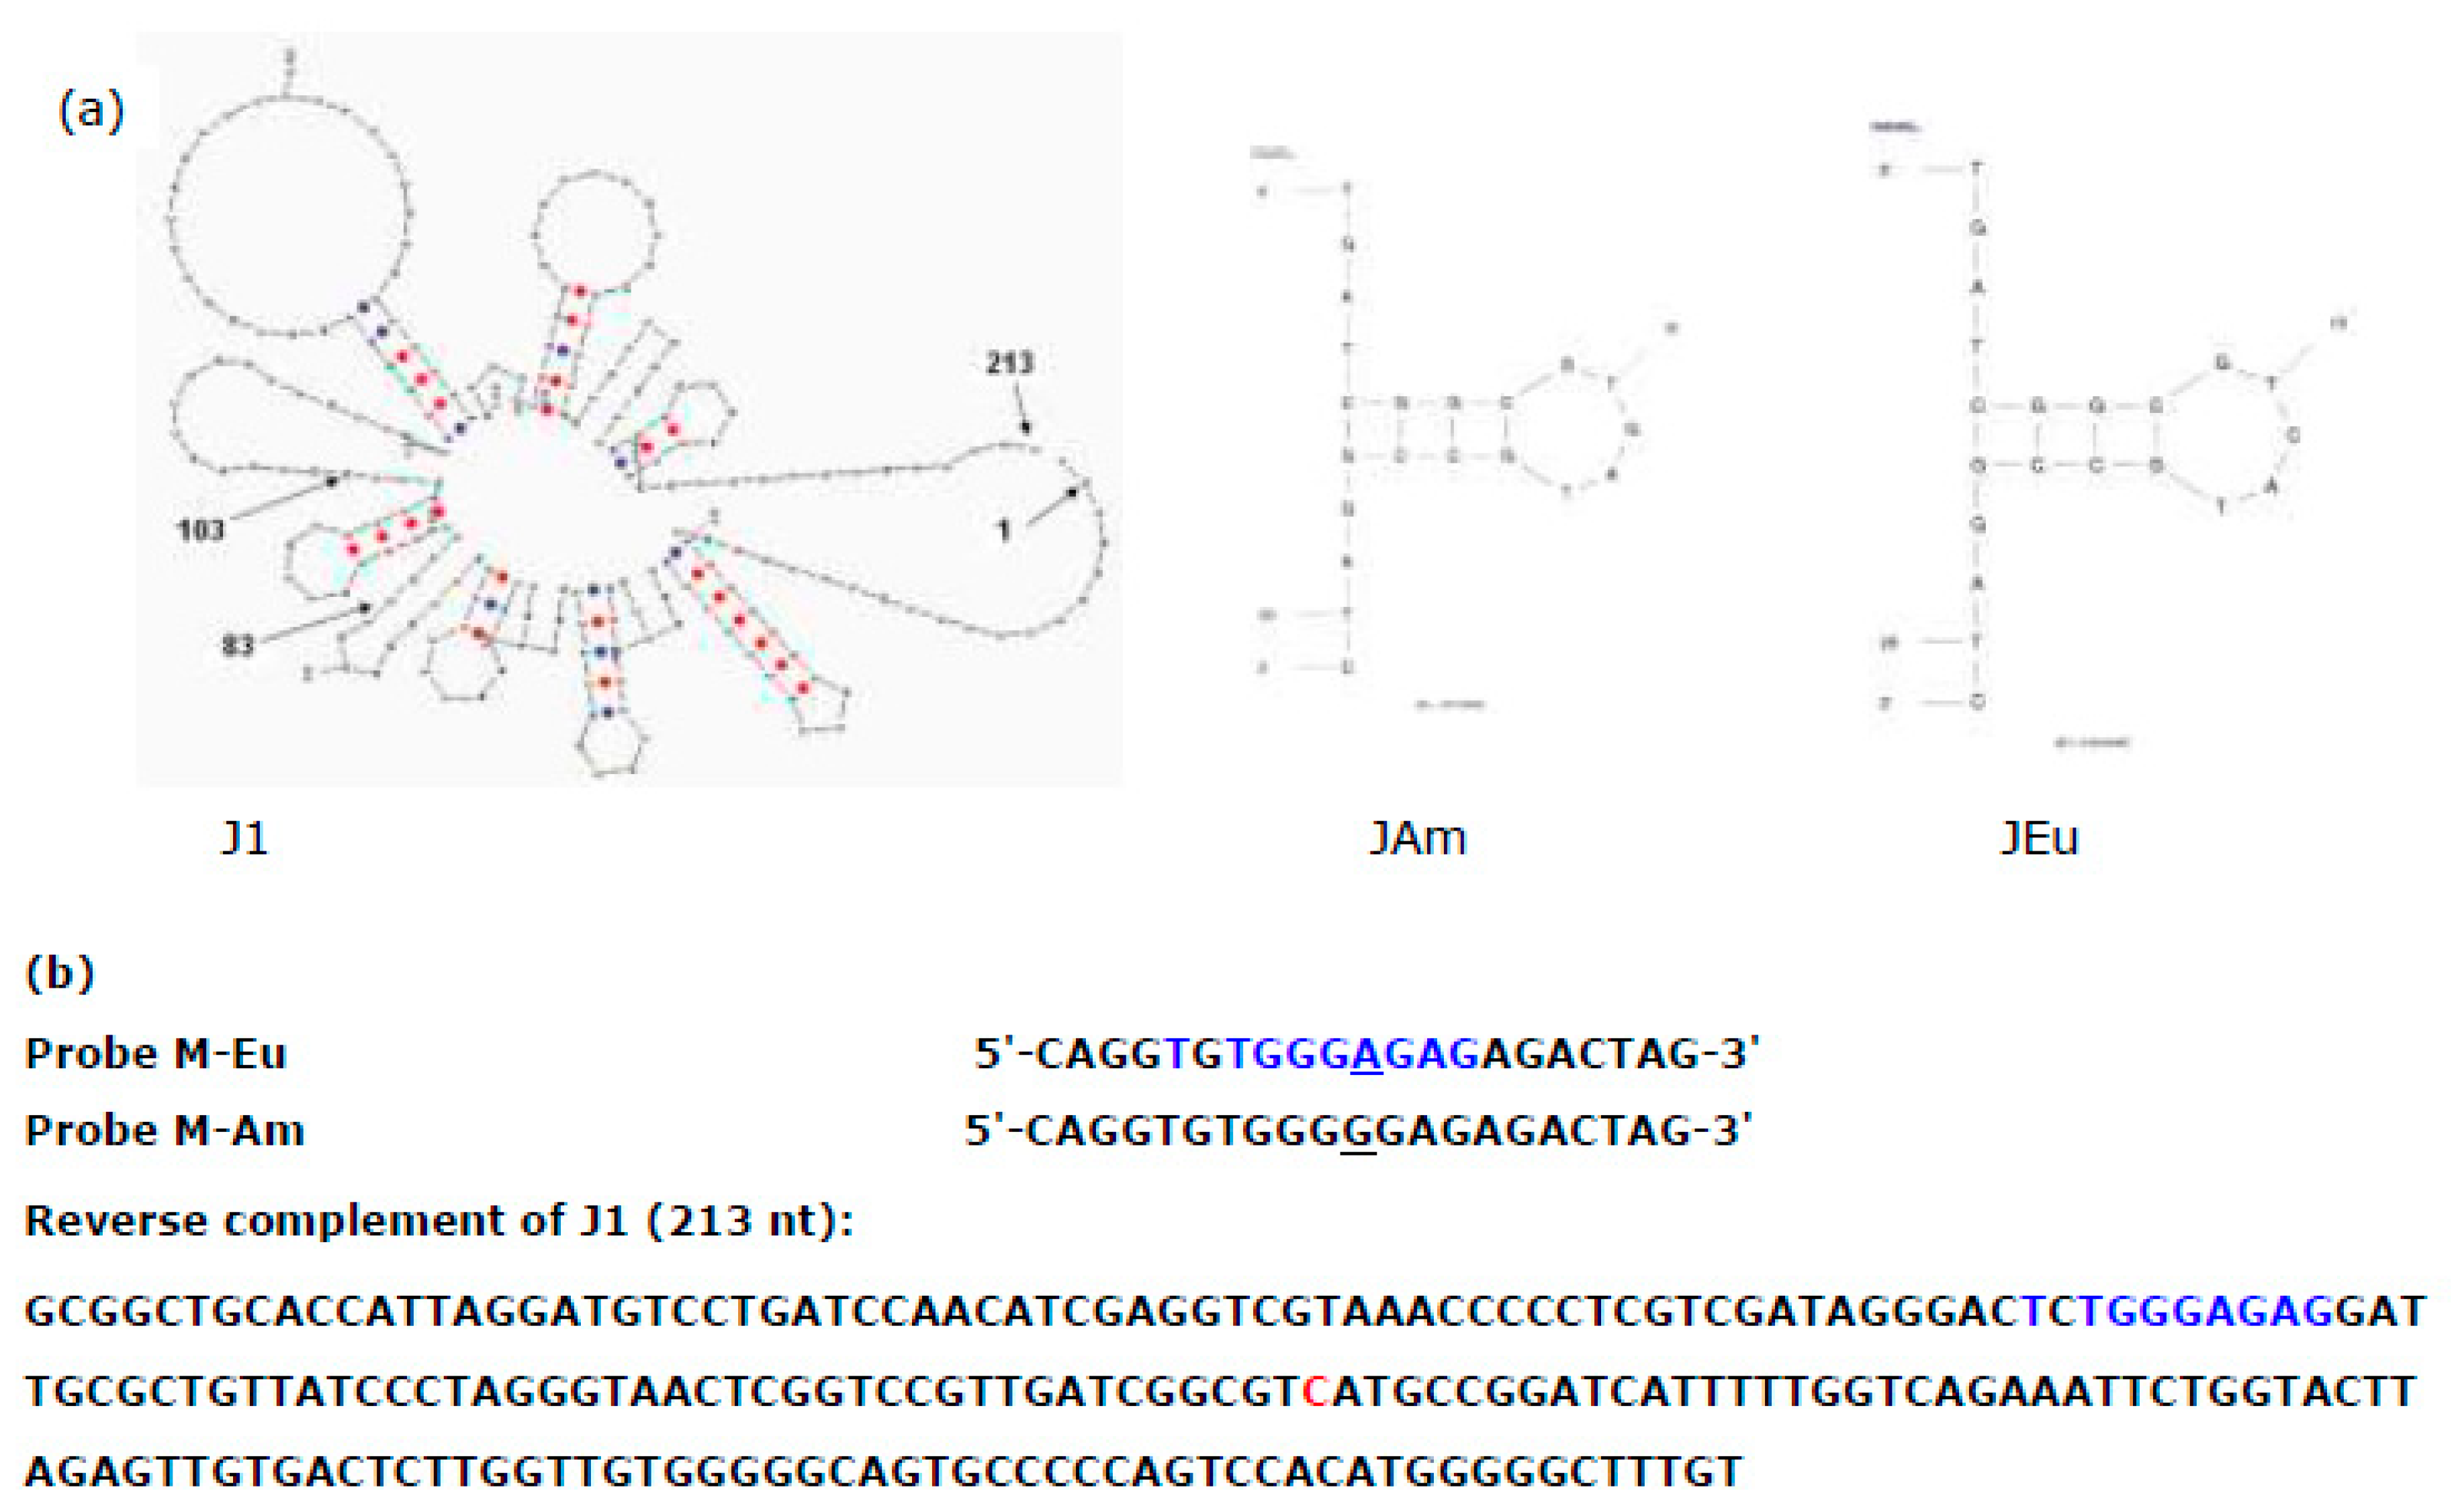
Figure 5.
Hybridization signals of multiplex PCR products of the 3 samples (1, 2 and 3) to specific probes: J, K, L, N. (a) fluorescence image of the hybridization assay conducted on the MMA biochip. The PCR products: MP1, MP2, MP3a (multiplex) and MX2 (mixture of K2, N2, L2 and J2) were introduced via the horizontally-oriented microchannels. And the probes lines were immobilized in the vertical orientation; the probes specific to the North American salmon are KA, NA, LA, JA; while the unlabelled probes on the right are the corresponding European probes: KE, NE, LE, JE. Duplications of PCR products are boxed, and duplications of probes lines are duly labeled. (b) Fluorescence intensity of binding of MP1 with 3 probes (K, L, N). intensity with probe J was too weak to show in the same scale. (c) Fluorescence intensity of binding of MP2 with probes K, L, N. (d) Fluorescence intensity of binding of MP3a with probes K, L, N. (e) Fluorescence intensity of binding of MX2 with probes K, L, N.
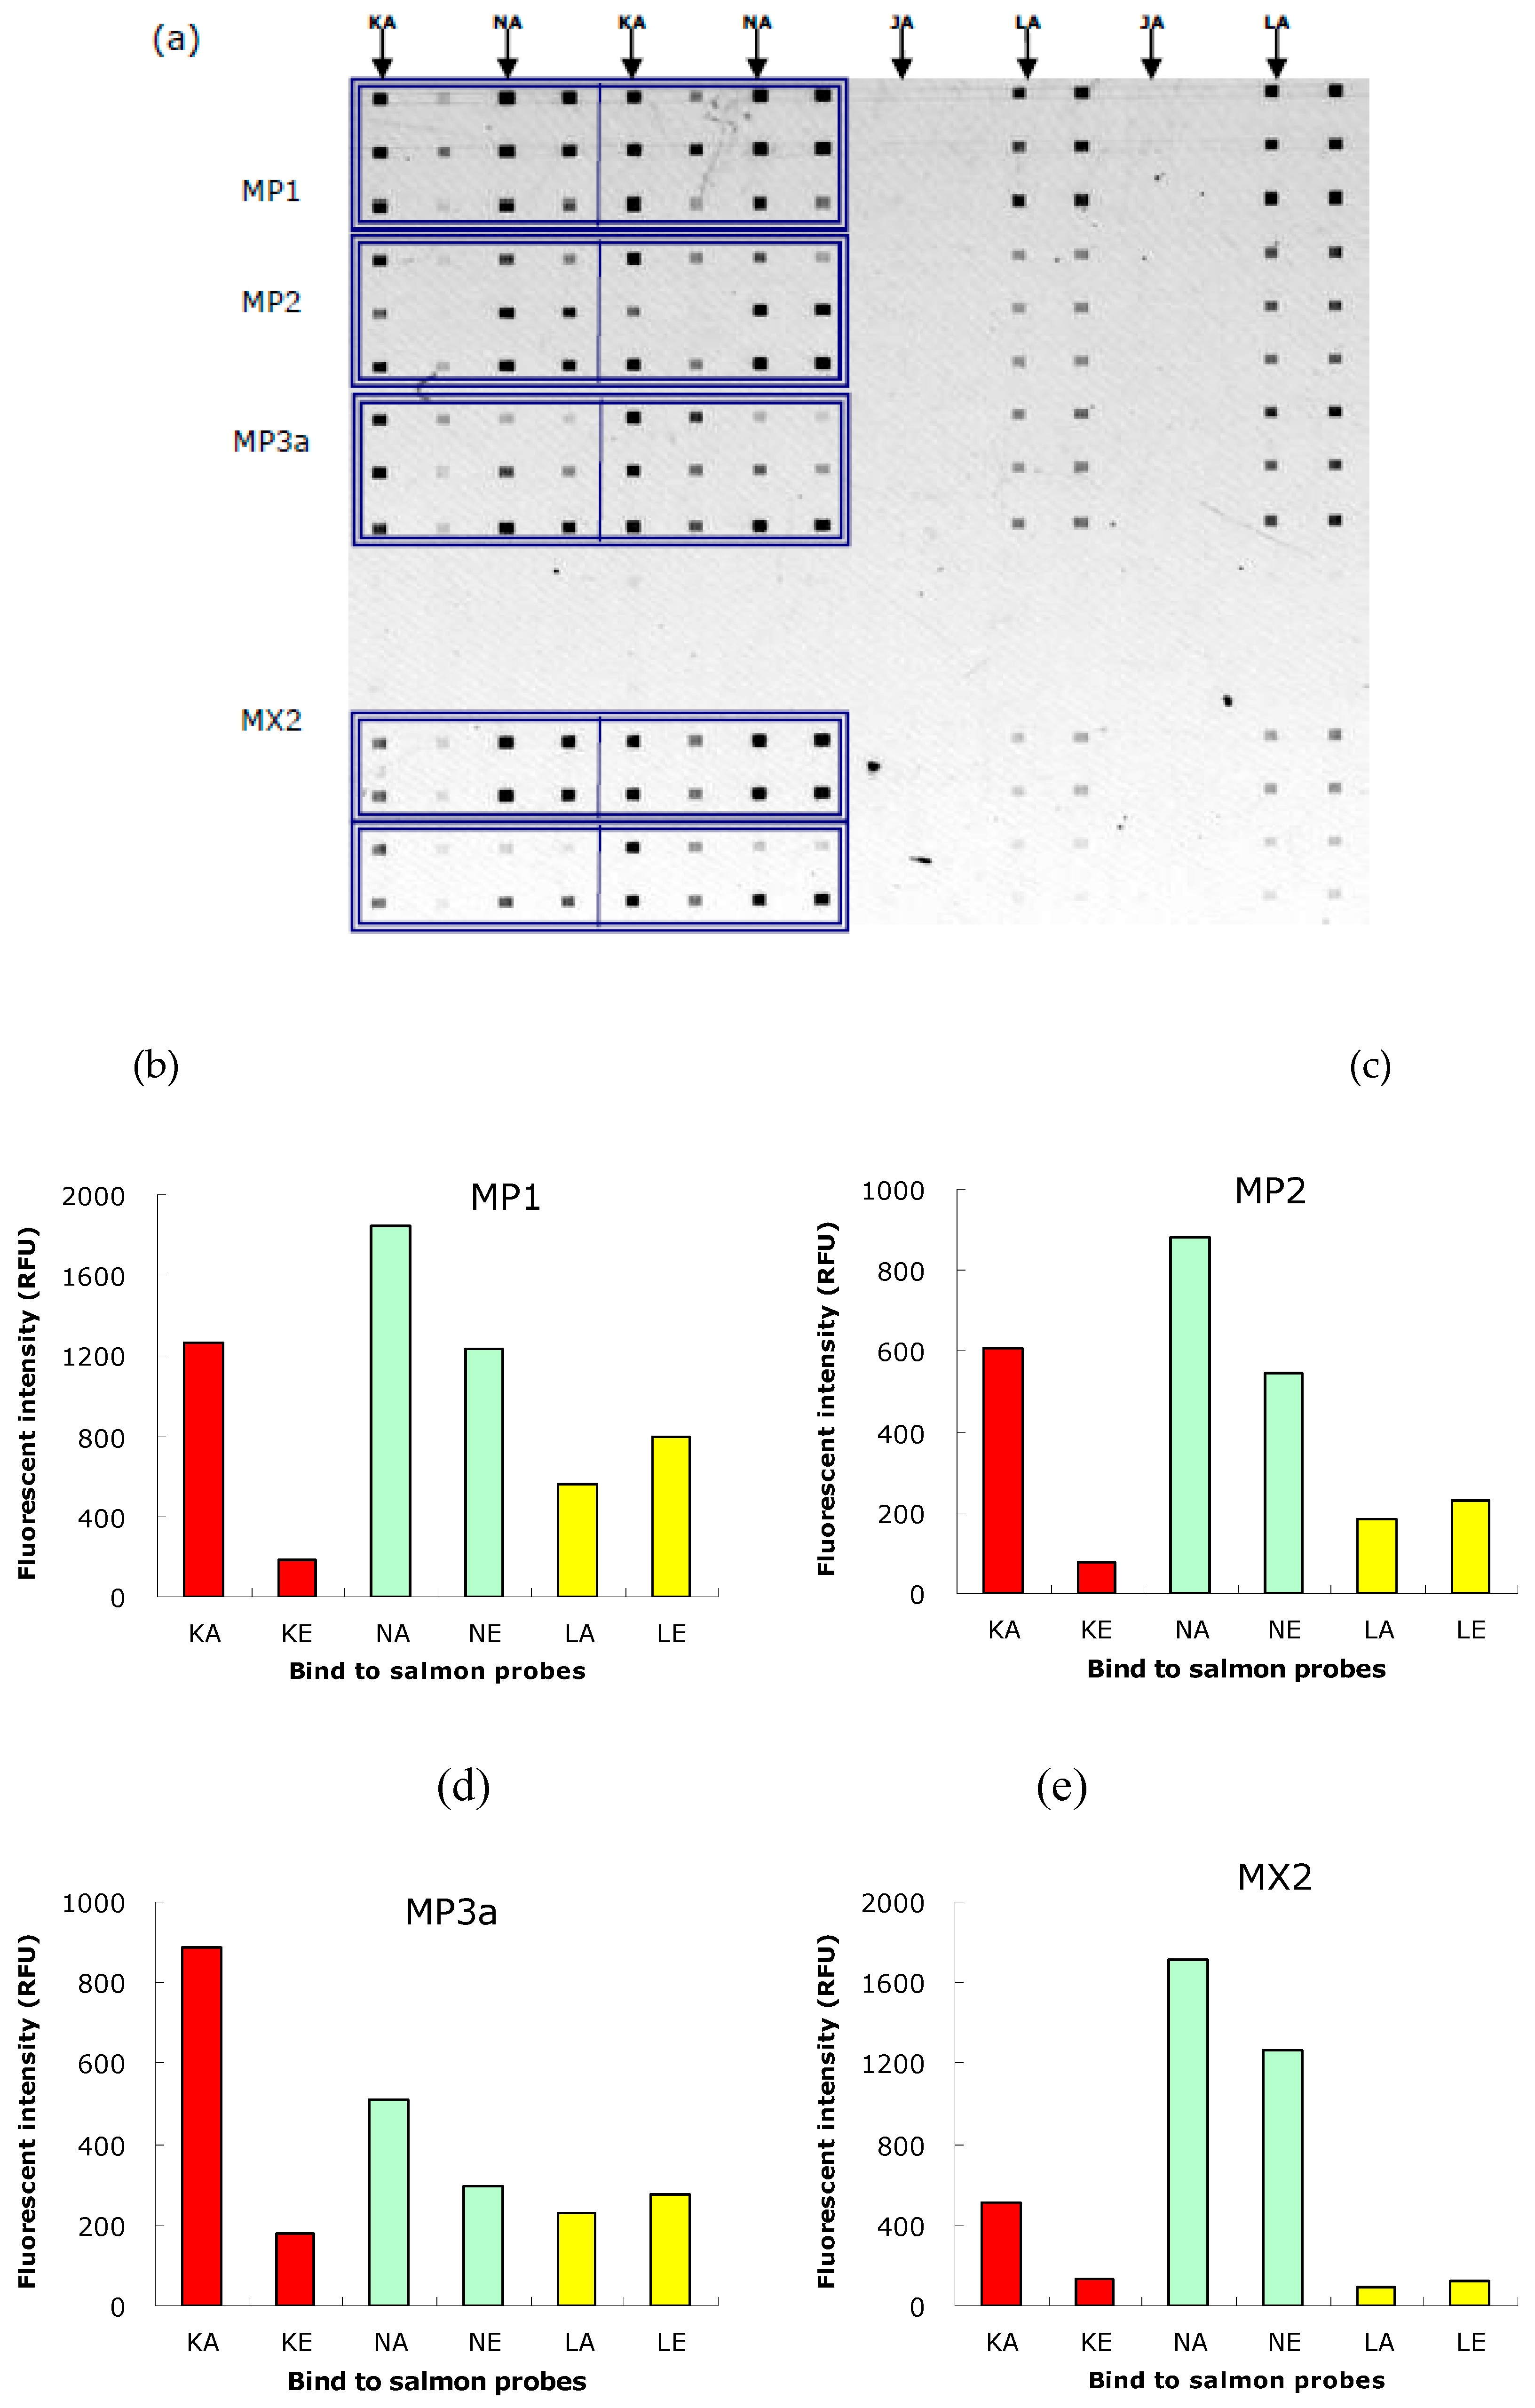
Figure 6.
Predicted hybridization signals of perfect-matched (PM) and mismatched (MM) DNA duplexes. (a) PM vs. MM signals for five salmon probes, and for a previously reported fungal probe [18,21]. (b) MM signals for the five probes with the consideration of the two adjacent nucleotides; T and C are pyrimidines (pyr) and A and G are purines (pur).
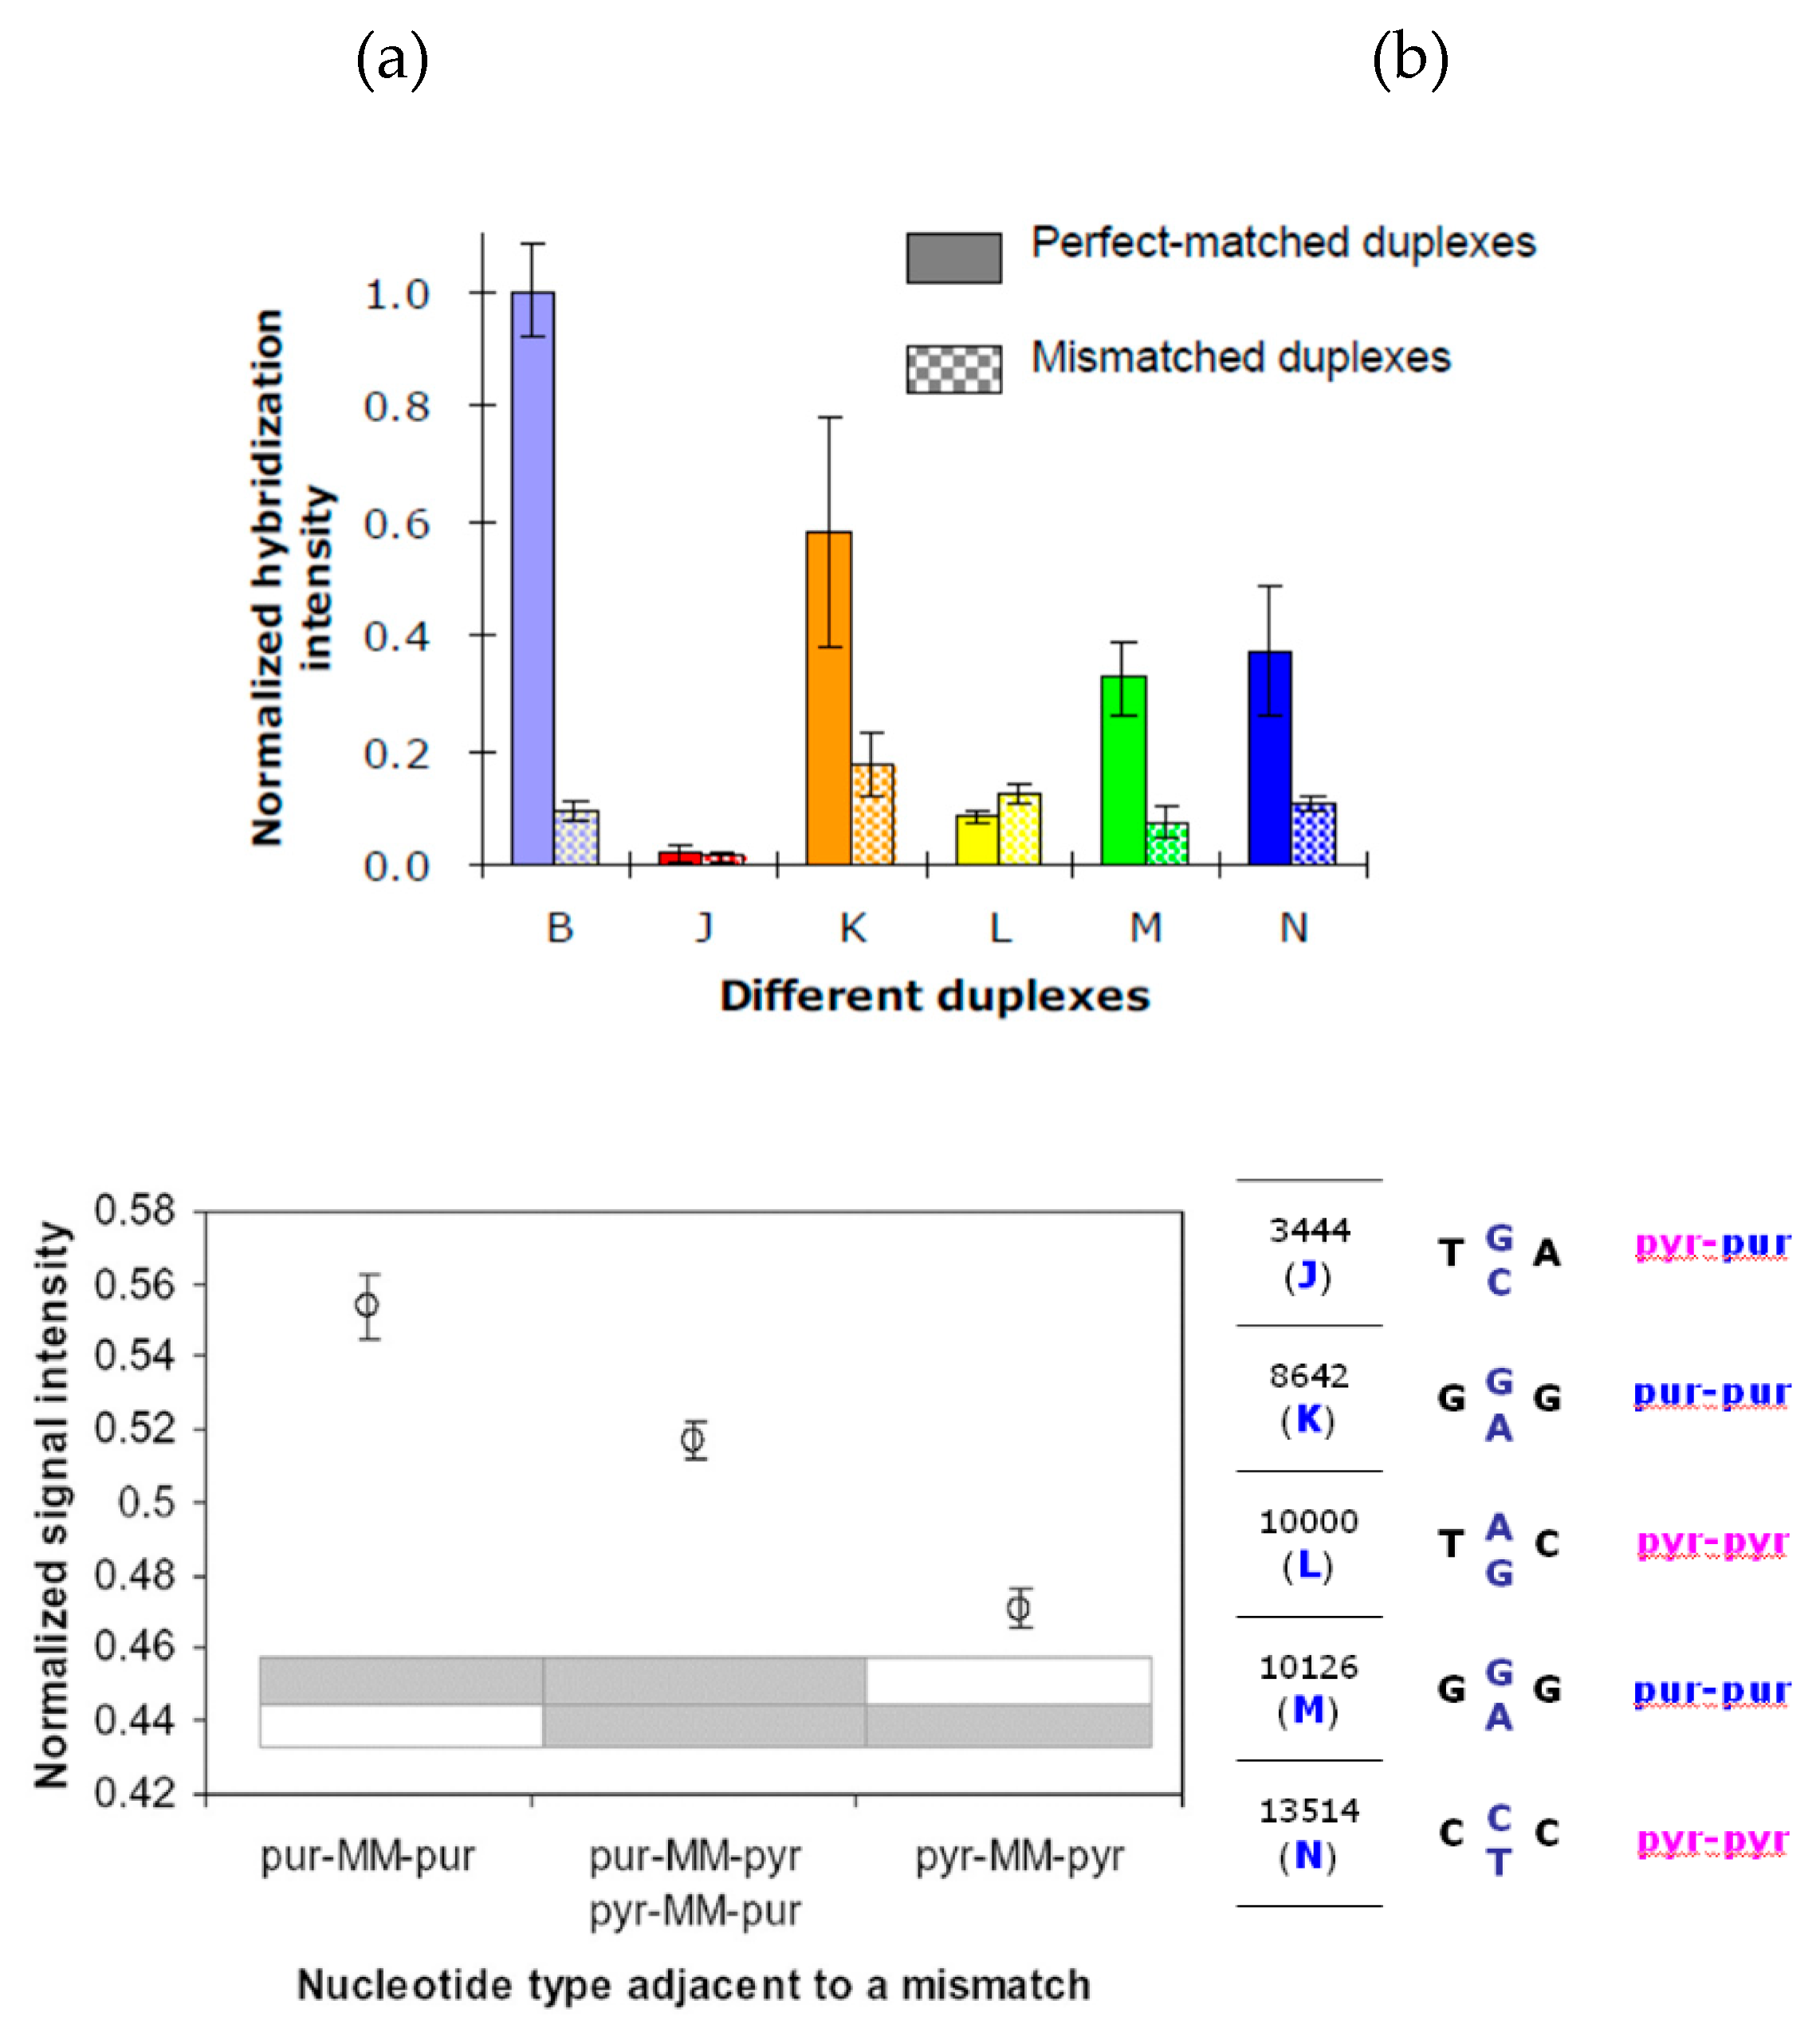

Table 1.
Selected SNP sites (J, K, L, M, N) in mtDNA of Atlantic salmon are shown with the nucleotide positions. Partial sequences of the European salmon genome is shown below.
Table 1.
Selected SNP sites (J, K, L, M, N) in mtDNA of Atlantic salmon are shown with the nucleotide positions. Partial sequences of the European salmon genome is shown below.
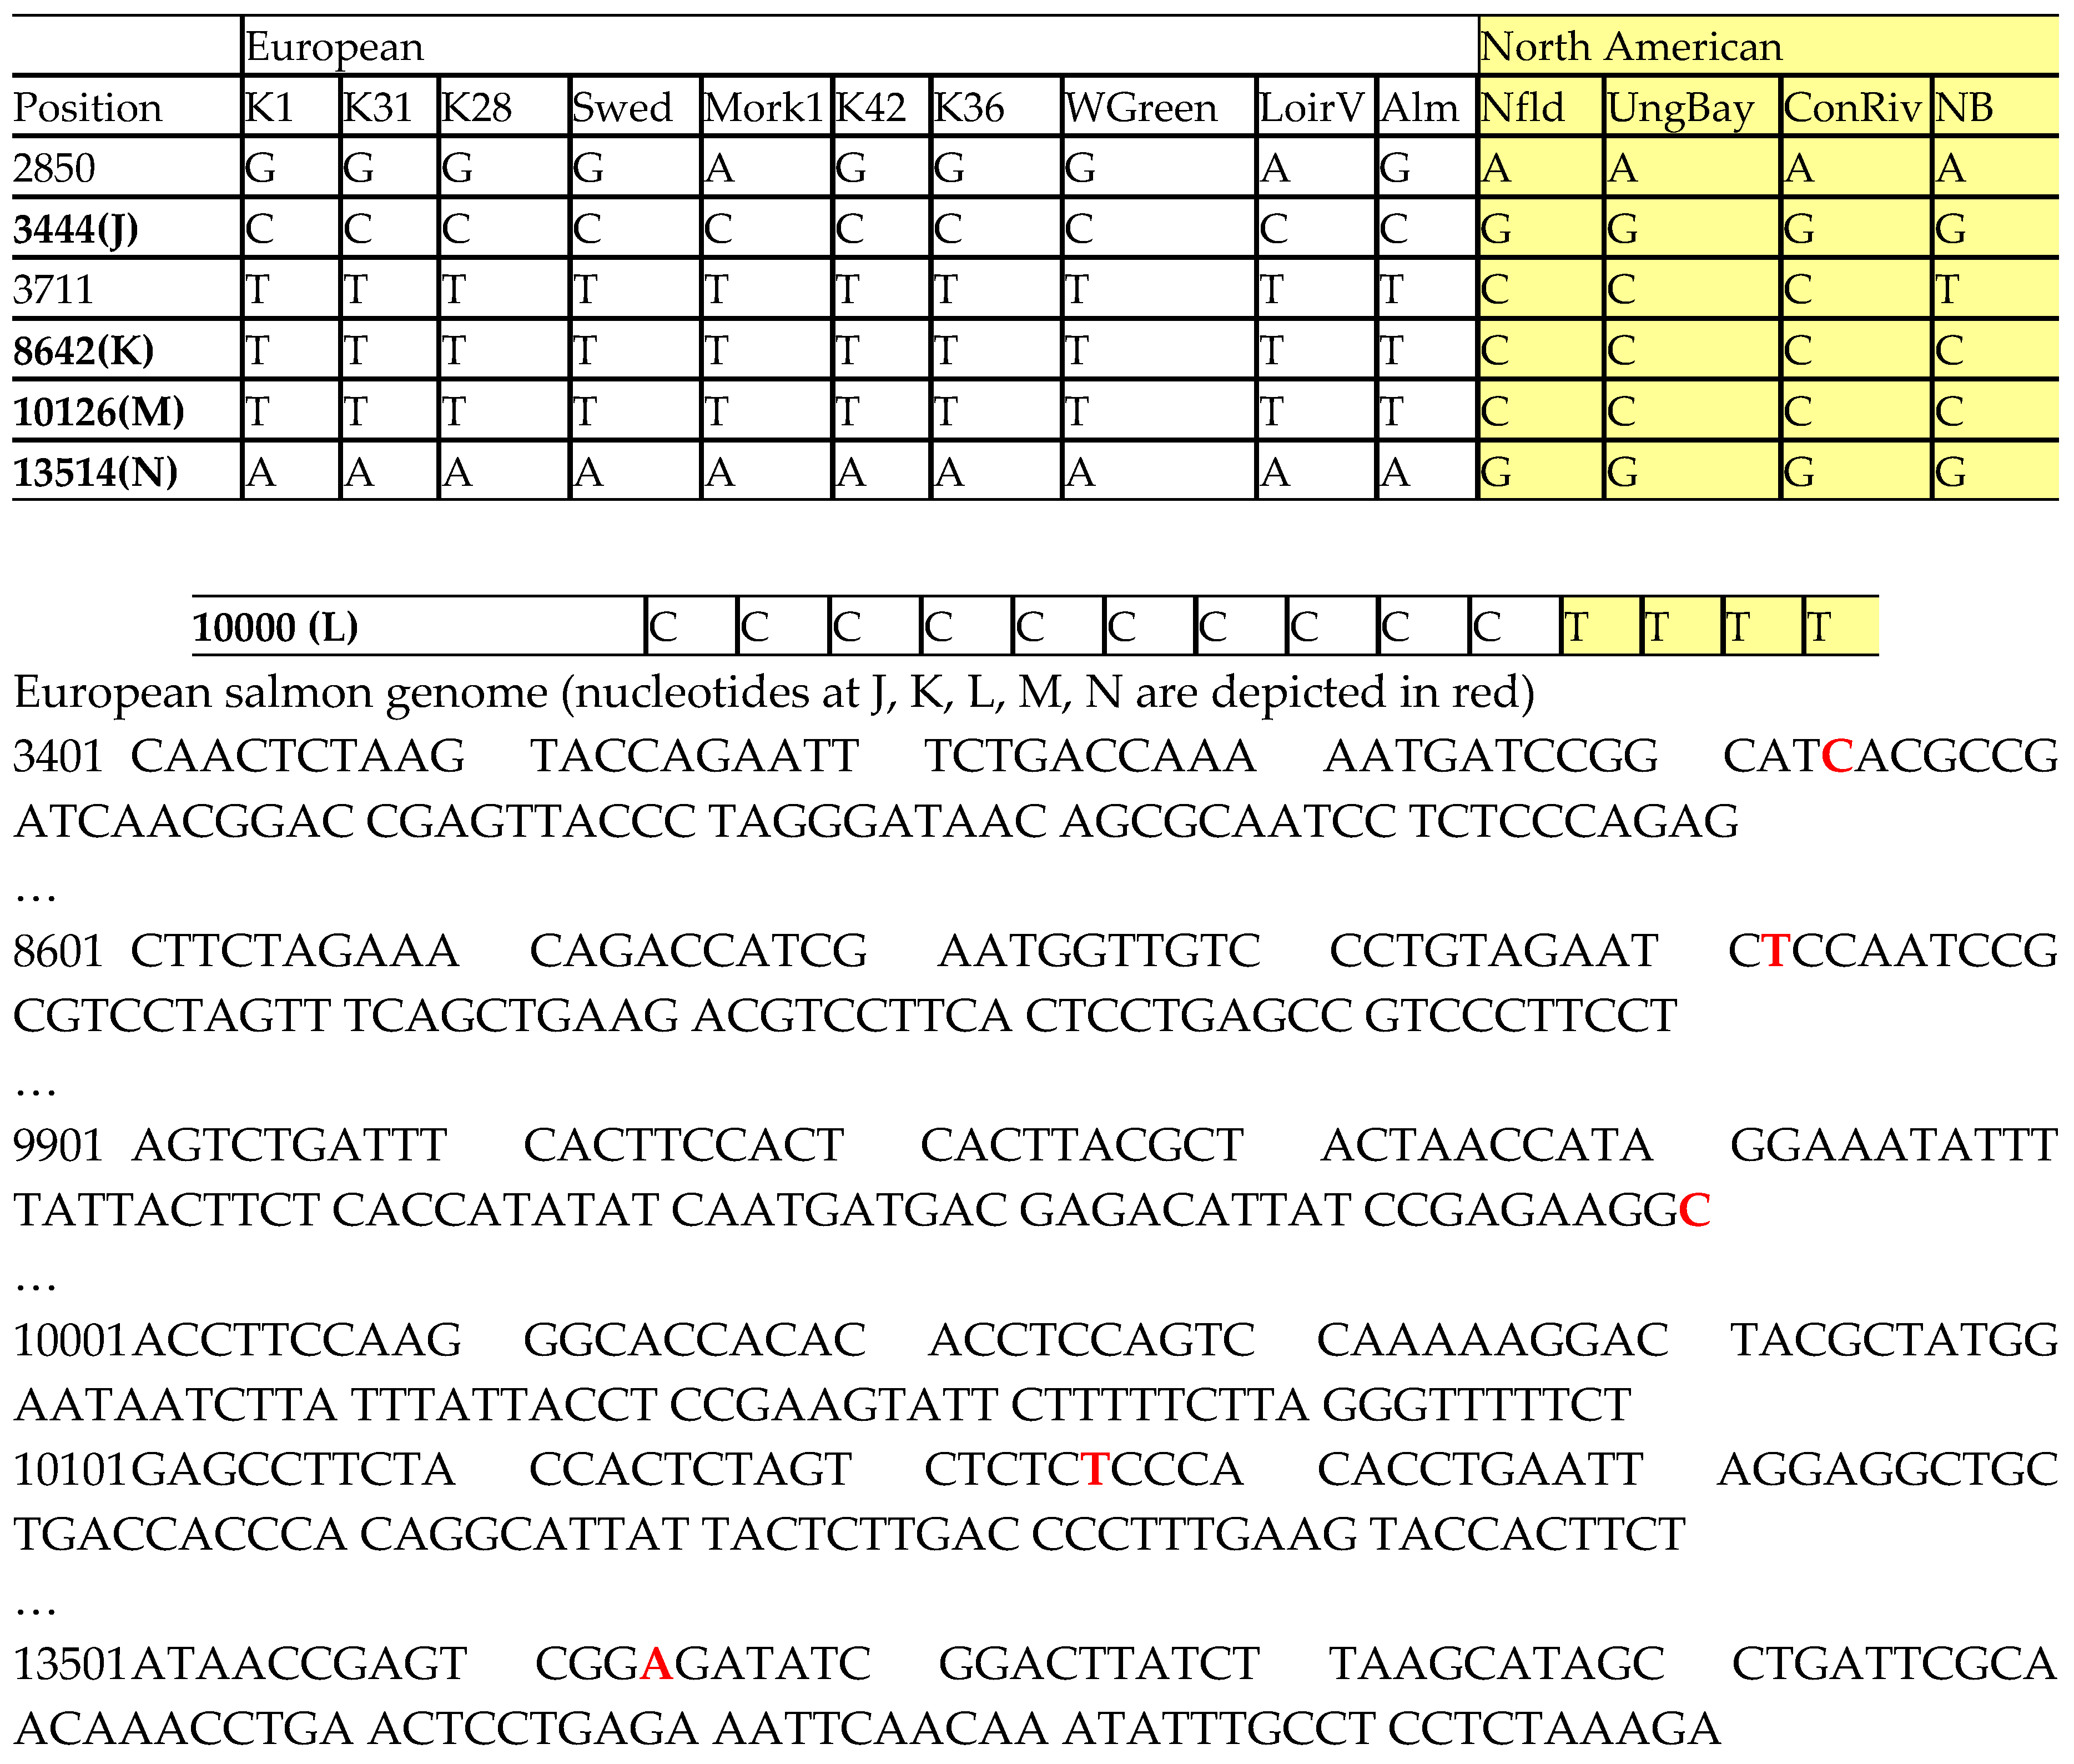 |
Table 2.
Oligonucleotide primer sets for preparation of PCR products. The melting temperature Tm are determined by us as well as by the IDT website (200 nM primer concentration, 50 mM monocation, 0.7 mM Mg2+) http://arep.med.harvard.edu/cgi-bin/adnan/tm.pl.
Table 2.
Oligonucleotide primer sets for preparation of PCR products. The melting temperature Tm are determined by us as well as by the IDT website (200 nM primer concentration, 50 mM monocation, 0.7 mM Mg2+) http://arep.med.harvard.edu/cgi-bin/adnan/tm.pl.
| Acronym | Length | Sequence (5'-3') | Tm by Lin |
Tm IDT |
|---|---|---|---|---|
| J | 21 21 |
For: Cy5 – ACAAA GCCCC CATGT GGACT G Rev: GCGGC TGCAC CATTA GGATG T |
75 75 |
60.2 60.3 |
| K | 21 19 |
For: Cy5 – TATGA ATACA CCGAC TACGA A Rev: CTGTT TGGTT TAATC GTCC |
61.9 61.6 |
50.5 48.8 |
| L | 19 21 |
For: Cy5 – TGCCC TTCTA CTTAC ATCA Rev: AAAGA ATACT TCGGA GGTAA T |
60.1 60.0 |
50.2 48.7 |
| M | 21 18 |
For: Cy5 – CAAAA AGGAC TACGC TATGG A Rev: TGTGG TGGGC TCATG TAA |
65.5 65.4 |
52.4 53.7 |
| N | 21 18 |
For: Cy5 – TGAGA AGGTG TTGGC ATTAT A Rev: GGGAG TGTGA GGTCG AGT |
64.3 64.4 |
51.4 56.3 |
| J-PCR | 213 bp | Sequence shown below | ||
| K-PCR | 226 bp | |||
| L-PCR | 215-bp | |||
| M-PCR | 223-bp | |||
| N-PCR | 209-bp | |||
Tm values determined from IDT were based on 50 mM NaCl.
Table 3.
Oligonucleotide probes used in this study (50 mM monocation, 0.7 mM Mg2+) http://arep.med.harvard.edu/cgi-bin/adnan/tm.pl.
Table 3.
Oligonucleotide probes used in this study (50 mM monocation, 0.7 mM Mg2+) http://arep.med.harvard.edu/cgi-bin/adnan/tm.pl.
| Acronym | Length | Sequence (5'-3') | Tm Lin | Tm IDT |
|---|---|---|---|---|
| J | 21 | Am: NH2-(CH2)6 –TGATCGGCGTCATGCCGGATC Eu: NH2-(CH2)6 –TGATCGGCGTGATGCCGGATC |
58.4 58.4 |
62.1 62.1 |
| K | 21 | Am: NH2-(CH2)6 – CGCGGATTGGGGATTCTACAG Eu: NH2-(CH2)6 – CGCGGATTGGAGATTCTACAG |
54.0 51.8 |
57.8 55.3 |
| L | 21 | Am: NH2-(CH2)6 – CTTGGAAGGTACCTTCTCGGA Eu: NH2-(CH2)6 – CTTGGAAGGTGCCTTCTCGGA |
52.1 55.3 |
56.0 59.2 |
| M | 21 | Am: NH2-(CH2)6 – CAGGTGTGGGGGAGAGACTAG Eu: NH2-(CH2)6 – CAGGTGTGGGAGAGAGACTAG |
54.6 52.1 |
58.6 56.0 |
| N | 21 | Am: NH2-(CH2)6 – GTCCGATATCCCCGACTCGGT Eu: NH2-(CH2)6 – GTCCGATATCTCCCGACTCGGT |
56.5 54.1 |
60.5 57.9 |
Tm from IDT were provided based on 50 mM NaCl. Complementary sequences for probes J-Am and J-Eu (biotin- and Cy5-labelled), and for probes K-Am and K-Eu (Cy5) were also ordered.
Table 4.
Mismatch types of European (left, white) and North American (right, yellow) salmon.
| 3444 (J) | 8642 (K) | 10000 (L) | 10126 (M) | 13514 (N) | ||||||
| Mismatch | C/C | G/G | G/T | A/C | A/C | G/T | G/T | A/C | C/A | T/G |
| Discrimination ratio | 0.5 | 0.4 | 0.7 | 0.4 | 0.4 | 0.7 | 0.7 | 0.4 | 0.4 | 0.7 |
Table 5.
The calculated free energies of DNA duplexes for North American salmon PCR product: mismatched (MM) is with European probes and perfect-matched (PM) with North American probes.*.
Table 5.
The calculated free energies of DNA duplexes for North American salmon PCR product: mismatched (MM) is with European probes and perfect-matched (PM) with North American probes.*.
| Duplex name | Mismatched part for MM duplexes |
ΔG of PM duplex (kJ/mol) |
ΔΔG of PM and MM duplexes (kJ/mol)# |
|---|---|---|---|
| B @ | ATA:TTT | -71.5 | 10.04 |
| J | TCA:ACT | -91.2 | 15.89 |
| K | GGG:CTC | -76.9 | 7.11 |
| L | TAC:ACG | -84.1 | 18.4 |
| M | GGG:CTC | -79.5 | 7.11 |
| N | CCC:GAG | -82.8 | 14.22 |
Disclaimer/Publisher’s Note: The statements, opinions and data contained in all publications are solely those of the individual author(s) and contributor(s) and not of MDPI and/or the editor(s). MDPI and/or the editor(s) disclaim responsibility for any injury to people or property resulting from any ideas, methods, instructions or products referred to in the content. |
© 2026 by the authors. Licensee MDPI, Basel, Switzerland. This article is an open access article distributed under the terms and conditions of the Creative Commons Attribution (CC BY) license (http://creativecommons.org/licenses/by/4.0/).
Copyright: This open access article is published under a Creative Commons CC BY 4.0 license, which permit the free download, distribution, and reuse, provided that the author and preprint are cited in any reuse.


