Submitted:
18 January 2026
Posted:
20 January 2026
You are already at the latest version
Abstract
Existing coal spontaneous combustion liability assessments suffer from incomplete temperature range coverage, poor cross-rank comparability, and weak correlations between microscopic essence and macroscopic criteria—issues that undermine reliability and risk coal mine safety. This study aims to establish a structure-driven intrinsic identification system to address these gaps.
Using 10 cross-rank coal samples (lignite, bituminous coal, anthracite), we conducted systematic research via experiments, model building, and theoretical verification. We integrated three stage-specific parameters (each matching a combustion phase): saturated oxygen uptake (VO2, 30℃ chromatographic adsorption), average heating rate R70 (40−70℃ adiabatic oxidation), and Fuel Combustion Characteristic index (FCC, 110−230℃ crossing point method). With Information Entropy weighting (VO2:0.296; R70: 0.292; FCC: 0.412), we constructed the Multi-Factor Comprehensive Spontaneous Combustion Index (MF-CSCI). We also screened functional groups via FTIR, built a microstructure-driven model (MD-CSEI, linking groups to MF-CSCI), and verified mechanisms via DFT. Results show MF-CSCI covers the full “adsorption-heat accumulation-self-heating” process: HG lignite (MF-CSCI=1.0) had high liability, YCW anthracite (MF-CSCI=7.98) low liability, solving cross-rank issues. Pearson analysis found −OH positively correlated with MF-CSCI (r≈0.997), C=C negatively (r≈−0.951); MD-CSEI achieved R2=0.863 (P=0.042).This study improves cross-rank assessment accuracy, enables rapid micro-to-macro risk prediction, and provides a theoretical basis for on-site coal safety management.
Keywords:
coal spontaneous combustion liability
; density functional theory
; multi-factor comprehensive spontaneous combustion index
; spontaneous combustion essential identification model
; key regulatory functional groups for spontaneous combustion
1. Introduction
Spontaneous combustion of coal seams is a core hidden danger restricting the safe production of coal mines. Its high incidence and strong destructiveness have become a major challenge to be addressed urgently in China’s coal industry.Statistical data show that over 90% of coal seams in China are spontaneous or easy-to-spontaneously combust coal seams. Endogenous fires caused by spontaneous combustion account for 85%−90% of the total number of coal mine fires.Every year, hundreds of millions of tons of coal resources are lost due to coal fire disasters, with direct economic losses exceeding 20 billion yuan (RMB). Meanwhile, it is accompanied by derivative environmental problems such as massive greenhouse gas emissions and surface subsidence, posing multiple threats to the “safety-resource-environment” system [1,2,3]. Coal spontaneous combustion liability, as a core indicator reflecting the intrinsic attribute of coal spontaneous combustion, requires objective and accurate assessment. This assessment serves as the premise and foundation for early warning of goaf fires and accurate application of inhibitors. Especially in cross-rank mining scenarios (from lignite to anthracite), how to break the bottleneck of consistent assessment results under different working conditions has become the key to improving the effectiveness of engineering intervention [4].
However, existing assessment methods for spontaneous combustion liability still have significant shortcomings: most rely on single macroscopic indicators such as normal-temperature oxygen adsorption capacity and crossing point temperature (CPT). They not only suffer from issues including incomplete temperature range coverage, poor cross-rank comparability, and inconsistent thresholds and classification standards, but also directly lead to chain problems such as delayed early warning, limited effectiveness of engineering intervention, and slow updates of standards [5].
To address the defects of single indicators, the academic community has explored from different dimensions, but a systematic solution has not yet been formed. In the low-temperature stage, the chromatographic oxygen adsorption method has become the mainstream technology to characterize the early oxygen adsorption and activation capacity. Tan et al. compared coal samples of different ranks and found that the physical adsorption capacity generally decreases with increasing coal rank. However, the occurrence of adsorption “recovery” and amplified differences between samples in high-rank coal indicates that a single low-temperature indicator is difficult to achieve stable cross-rank extrapolation [6]. Zhou et al. focused on low-rank bituminous coal and used a combined experimental system involving atmospheric pressure gas adsorption, temperature-programmed heating, and in-situ ESR (Electron Spin Resonance) to compare coal samples with different particle sizes. They found that reduced particle size significantly enhances the oxidation and self-heating capacity of the same coal type, thereby amplifying the differences in spontaneous combustion liability under different particle size conditions [7].
In the temperature-rise and heat-release stage, crossing point temperature (CPT) is widely used to define the transition node from adsorption to self-heating. Chen et al. emphasized the influence of the coupling between heat conduction and heat release processes on CPT [8]. Starting from the energy conservation equation, Wang et al. pointed out that at CPT, the heat conduction term changes from “inputting heat into the sample center” to “exporting heat outward”. At this point, the local enthalpy change term and heat release term reach equilibrium. Thus, CPT can be regarded as a “transition temperature” from external heating control to internal self-heating control.
However, it has insufficient response to differences in low-temperature physical adsorption, posing the risk of “the reaction having started but the indicator lagging behind” [9]. To reduce the deviation of single indicators, scholars have attempted to construct comprehensive assessment systems. Gbadamosi et al. systematically compared multiple indicators, including XPT (CPT), Stage II slope, FCC, and Wits-Ehac, to quantify the spontaneous combustion liability of different coal samples [10]. Gao et al. and Said et al. took the crossing point temperature index (CJI) as the “comprehensive criterion”. They then combined grey relational analysis and multiple regression to establish models between pore structure, functional group information and CJI, so as to make up for the blind spots of a single temperature range [11]. Slopiecka et al. proposed an analysis paradigm based on thermogravimetric data, which can evaluate physical consistency by comparing with macroscopic criteria. However, this framework mainly stays at the kinetic level. It has not yet provided a systematic description of how microstructural characteristics quantitatively constrain the mapping relationship between engineering macroscopic indicators [12].
In summary, although existing studies have approached from dimensions such as low-temperature adsorption, temperature-rise heat release, and microscopic characterization, three core bottlenecks remain. First, temperature range fragmentation makes it difficult to connect the full-process information of “adsorption-self-heating”. Second, insufficient comparability across coal ranks and working conditions limits the stability of assessment results. Third, loose mapping between microscopic essence and macroscopic criteria leads to weak interpretability and transferability. To address these issues, this study proposes a complete identification system of “macroscopic index-microstructure-kinetic verification”. It takes the chromatographic oxygen adsorption method (30 °C low-temperature oxygen adsorption capacity), the adiabatic oxidation method (40–70 °C medium-temperature heat accumulation), and the crossing point temperature method (110–230 °C rapid reaction thermal behavior) as the basis for multi-factor construction, and combines Information Entropy weighting to form a Multi-Factor Coupling Index (MF-CSCI)—solving the problems of single-indicator temperature range coverage and cross-rank comparability. A consistency analysis involving 20 cross-rank coal samples and the national standard evaluation system is conducted to verify the reliability and universality of the MF-CSCI. Through FTIR spectroscopy and Pearson correlation coefficient analysis, two types of key functional groups (–OH as active driver and C=C as structural inhibitor) are extracted; a microstructure-driven multi-factor prediction model is then established to achieve rapid prediction of MF-CSCI and spontaneous combustion grades. Finally, DFT theory is integrated to clarify the functional group regulation mechanism, providing an accurate and stable new method for the assessment of coal seam spontaneous combustion liability.
2. Construction of the Multi-Factor Comprehensive Coal Spontaneous Combustion Tendency Index (MF-CSCI)
In this section, through crossing point temperature (CPT) experiments, adiabatic oxidation experiments, and chromatographic oxygen adsorption experiments, key parameters of the low-temperature adsorption stage, medium-temperature heat accumulation stage, and rapid self-heating stage are obtained respectively. Combined with Information Entropy weighting, the Multi-Factor Comprehensive Index (MF-CSCI) is constructed, ultimately forming a macroscopic assessment indicator that covers all complete key temperature ranges. This lays a foundation for the subsequent correlation of microscopic mechanisms and the construction of an intrinsic assessment system.All experimental tests in this study were conducted in triplicate to ensure data repeatability. The results showed good consistency, and the average values were used for further analysis.
2.1. Source and Pretreatment of Test Samples
The experimental coal samples were collected from Hegang Coal Mine (HG) in Heilongjiang, Fengshuigou Coal Mine (FSG) in Inner Mongolia, Yima Coal Mine (YM) in Henan, Zhaoshipan Coal Mine (ZSP) in Shaanxi, Meiyukou Coal Mine (MYK) in Datong, Shanxi, Selian Coal Mine (SL) in Inner Mongolia, Honghui Coal Mine (HH) in Gansu, Chaijiagou Coal Mine (CJG) in Shaanxi, Fenghuangshan Coal Mine (FHS) in Shanxi, and Yangchangwan Coal Mine (YCW) in Ningxia, respectively. These samples cover a cross-rank range from lignite and bituminous coal (including long-flame coal, gas coal, etc.) to anthracite.
The pretreatment of coal samples was carried out with reference to GB/T 474-2008: the 2mm-thick oxidized layer on the surface was peeled off, the unoxidized part in the center was taken, crushed and sieved to 200 mesh (0.074 mm), then dried at a constant temperature of 30°C for 12 hours under the protection of 99.99% nitrogen, and finally sealed and stored away from light.
2.2. Acquisition of Key Parameters and Characteristic Analysis in the Low-Temperature Adsorption Stage
The chromatographic oxygen adsorption experiment is a core method to characterize the oxygen adsorption and activation capacity of coal in the low-temperature stage. This experiment aims to obtain the saturated oxygen adsorption capacity (VO2) of 10 coal samples at 30°C (a key temperature range for low-temperature adsorption) — this parameter will serve as one of the core indicators for the “low-temperature adsorption end” of the Multi-Factor Comprehensive Index (MF-CSCI) [15,16,17].
2.2.1. Instruments and Parameters
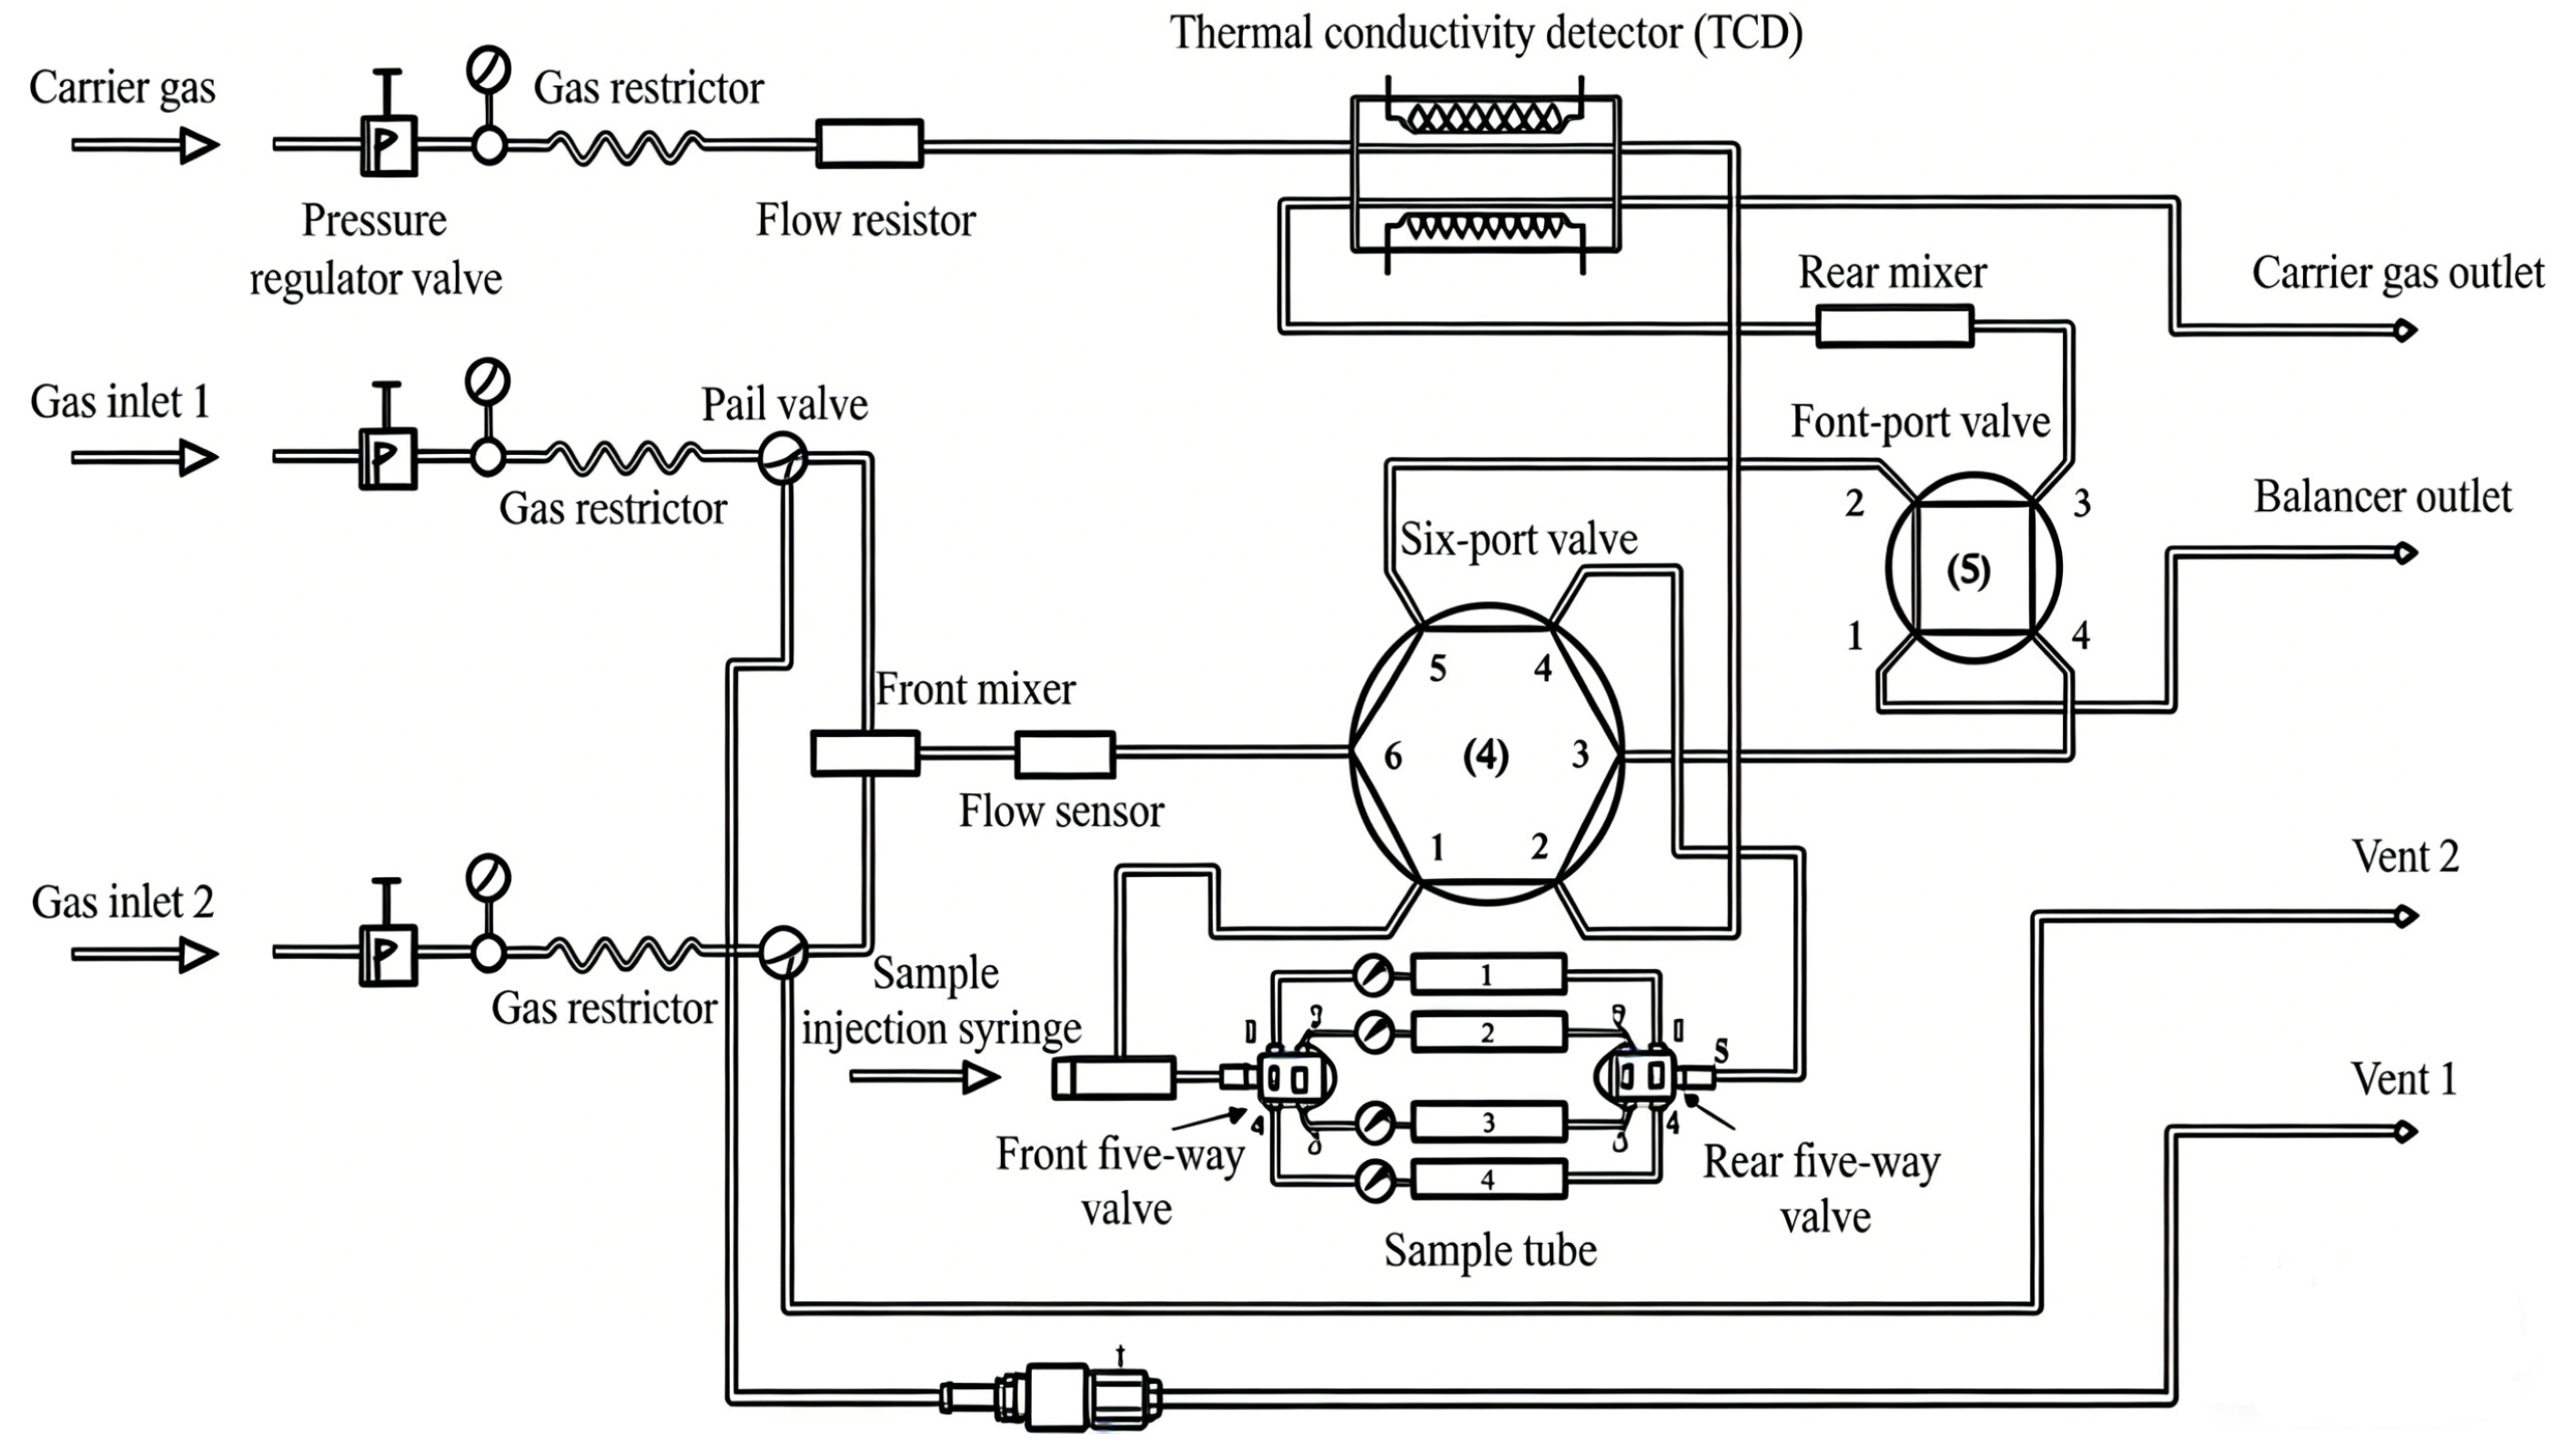
The ZRJ-1 Coal Spontaneous Combustion Tester was used in the experiment. Under the conditions of 30°C and 1.0133×10⁵Pa, the oxygen adsorption capacity was measured to determine the spontaneous combustion tendency of coal.
The coal samples were crushed to 80–100 mesh, with the column oven temperature set at 30°C and the oxygen flow rate at 20±0.5 cm3/min. After the coal samples were adsorbed for 20 minutes, the desorption peak area (S1) was measured; under the same conditions, the empty tube was adsorbed for 5 minutes, and the desorption peak area (S2) was measured.
Figure 2.
Schematic Diagram of the ZRJ-1 Coal Spontaneous Combustion Propensity Tester.
2.2.2. Results and Analysis
The calculation formula for the oxygen adsorption capacity of coal measured by the chromatographic oxygen adsorption method is shown in Formula (1), and the experimentally measured S1 and S2 are substituted into this formula.
In the formula:
Vd: Denotes the oxygen adsorption capacity of coal, with the unit of /(cm3/g);
K: Denotes the instrument constant, with the unit of min/(mV·s);
K1: Denotes the instrument calibration factor, which is unitless;
Rc1:Denotes the carrier gas flow rate of the actual tube, with the unit of cm3/min;
Rc2: Denotes the carrier gas flow rate of the empty tube, with the unit of cm3/min;
α1: Denotes the ratio of the oxygen partial pressure in the actual tube to the atmospheric pressure, which is unitless;
α2: Denotes the ratio of the oxygen partial pressure in the empty tube to the atmospheric pressure, which is unitless;
S1: Denotes the desorption peak area of the actual tube, with the unit of mV·s;
S2: Denotes the desorption peak area of the empty tube, with the unit of mV·s;
G: Denotes the mass of the coal sample, with the unit of g;
dTRD: Denotes the relative density of coal, which is unitless;
Vs: Denotes the volume of the sample tube (standard state), with the unit of cm3;
Wd: Denotes the moisture content of the coal sample, with the unit of %.
After calculation, the saturated oxygen adsorption capacities of the ten kinds of experimental coal samples under the conditions of normal temperature (30°C) and atmospheric pressure (1.0133×10⁵ Pa) are shown in Figure 3.
Figure 3.
Saturated Oxygen Adsorption Capacity of Each Coal Sample.
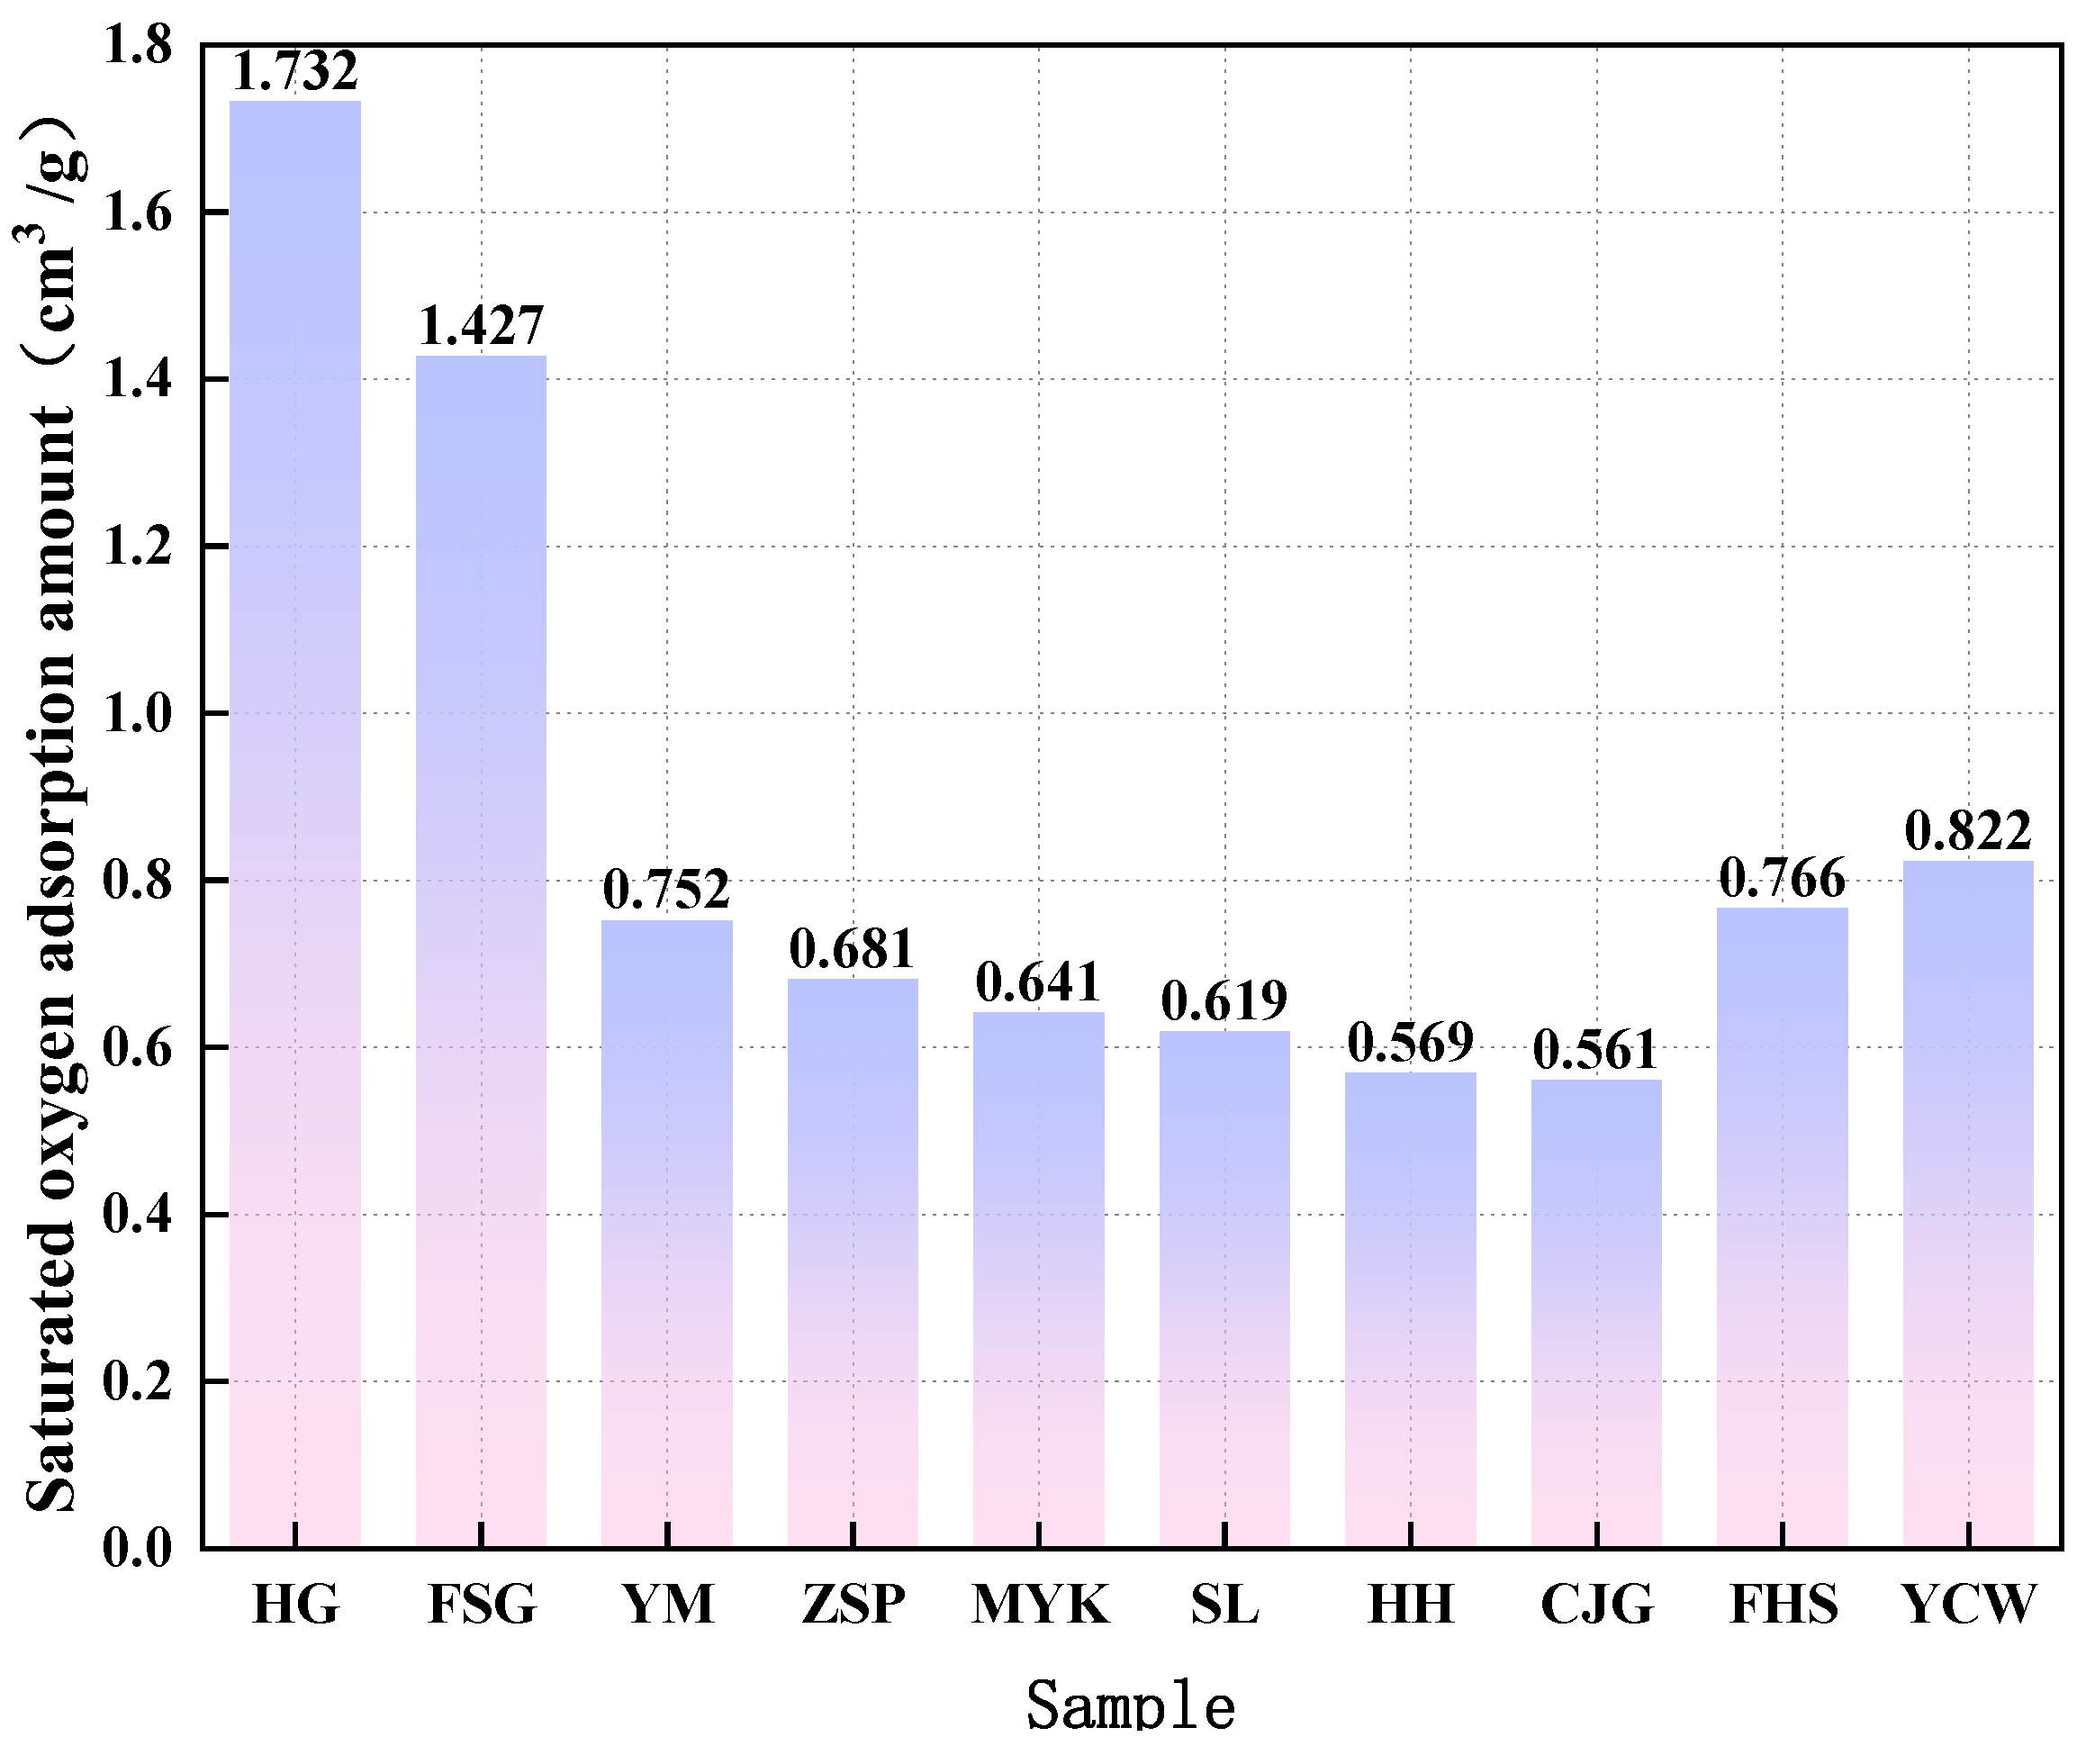
According to the principle of the chromatographic oxygen adsorption method, the oxygen adsorption capacity of coal samples traditionally exhibits a positive correlation with their spontaneous combustion tendency. However, this single-indicator approach has inherent limitations in cross-rank assessments. High-rank coal samples, despite having lower chemical activity, possess highly developed micropore structures that significantly increase physical adsorption sites, leading to a non-monotonic recovery in VO2. This discrepancy highlights the defect of relying solely on physical adsorption to define liability, which is one of the key issues solved by the multi-factor identification system (MF-CSCI) proposed in this study.
Analysis of the saturated oxygen adsorption capacity (VO2) of the 10 coal samples shows that it exhibits a non-monotonic variation of “first decreasing and then increasing” with coal rank (from lignite to bituminous coal to anthracite): the VO2 values of lignite samples (HG, FSG) are significantly higher; those of bituminous coal samples (ZSP, HH) are the lowest; while the VO2 values of anthracite samples (YCW, FHS) surpass those of bituminous coal in turn.
This trend is directly related to the structural characteristics of different coal ranks: Low-rank coals (HG, FSG) contain a large number of highly active groups (such as hydroxyl groups and oxygen-containing functional groups), which easily undergo chemical adsorption with oxygen at low temperatures. As a result, their VO2 values are high and they exhibit a strong spontaneous combustion tendency. Medium-rank bituminous coals are dominated by mesopores, with a specific surface area lower than that of lignite. Moreover, during the metamorphism process, oxygen-containing groups are partially decomposed, leading to a decrease in both physical and chemical adsorption capacities, hence their VO2 values are the lowest. High-rank anthracites (FHS, YCW) have highly condensed carbon skeletons that form well-developed micropores, significantly increasing the number of physical adsorption sites. With physical adsorption as the dominant mechanism, their VO2 values rise accordingly. To summarize, the differences in the VO2 values of coal samples essentially reflect the differences in the spontaneous combustion tendency of coals with different metamorphic degrees, providing core data support for the “low-temperature adsorption end” parameter of the subsequent MF-CSCI index
2.3. Acquisition of Key Parameters and Characteristic Analysis in the Medium-Temperature Heat Accumulation Stage
The low-temperature adsorption stage clarifies the initial oxidation activity of coal. However, it only analyzes the characteristics of the low-temperature stage in the coal spontaneous combustion process from the perspective of physical adsorption.
The heat accumulation imbalance occurring in the medium-temperature heat accumulation stage (40−70°C) is also crucial. This section focuses on the medium-temperature heat accumulation process and fills the intermediate gap in the research on the evolution law of coal spontaneous combustion by acquiring its key parameters [18].
2.3.1. Instruments and Parameters
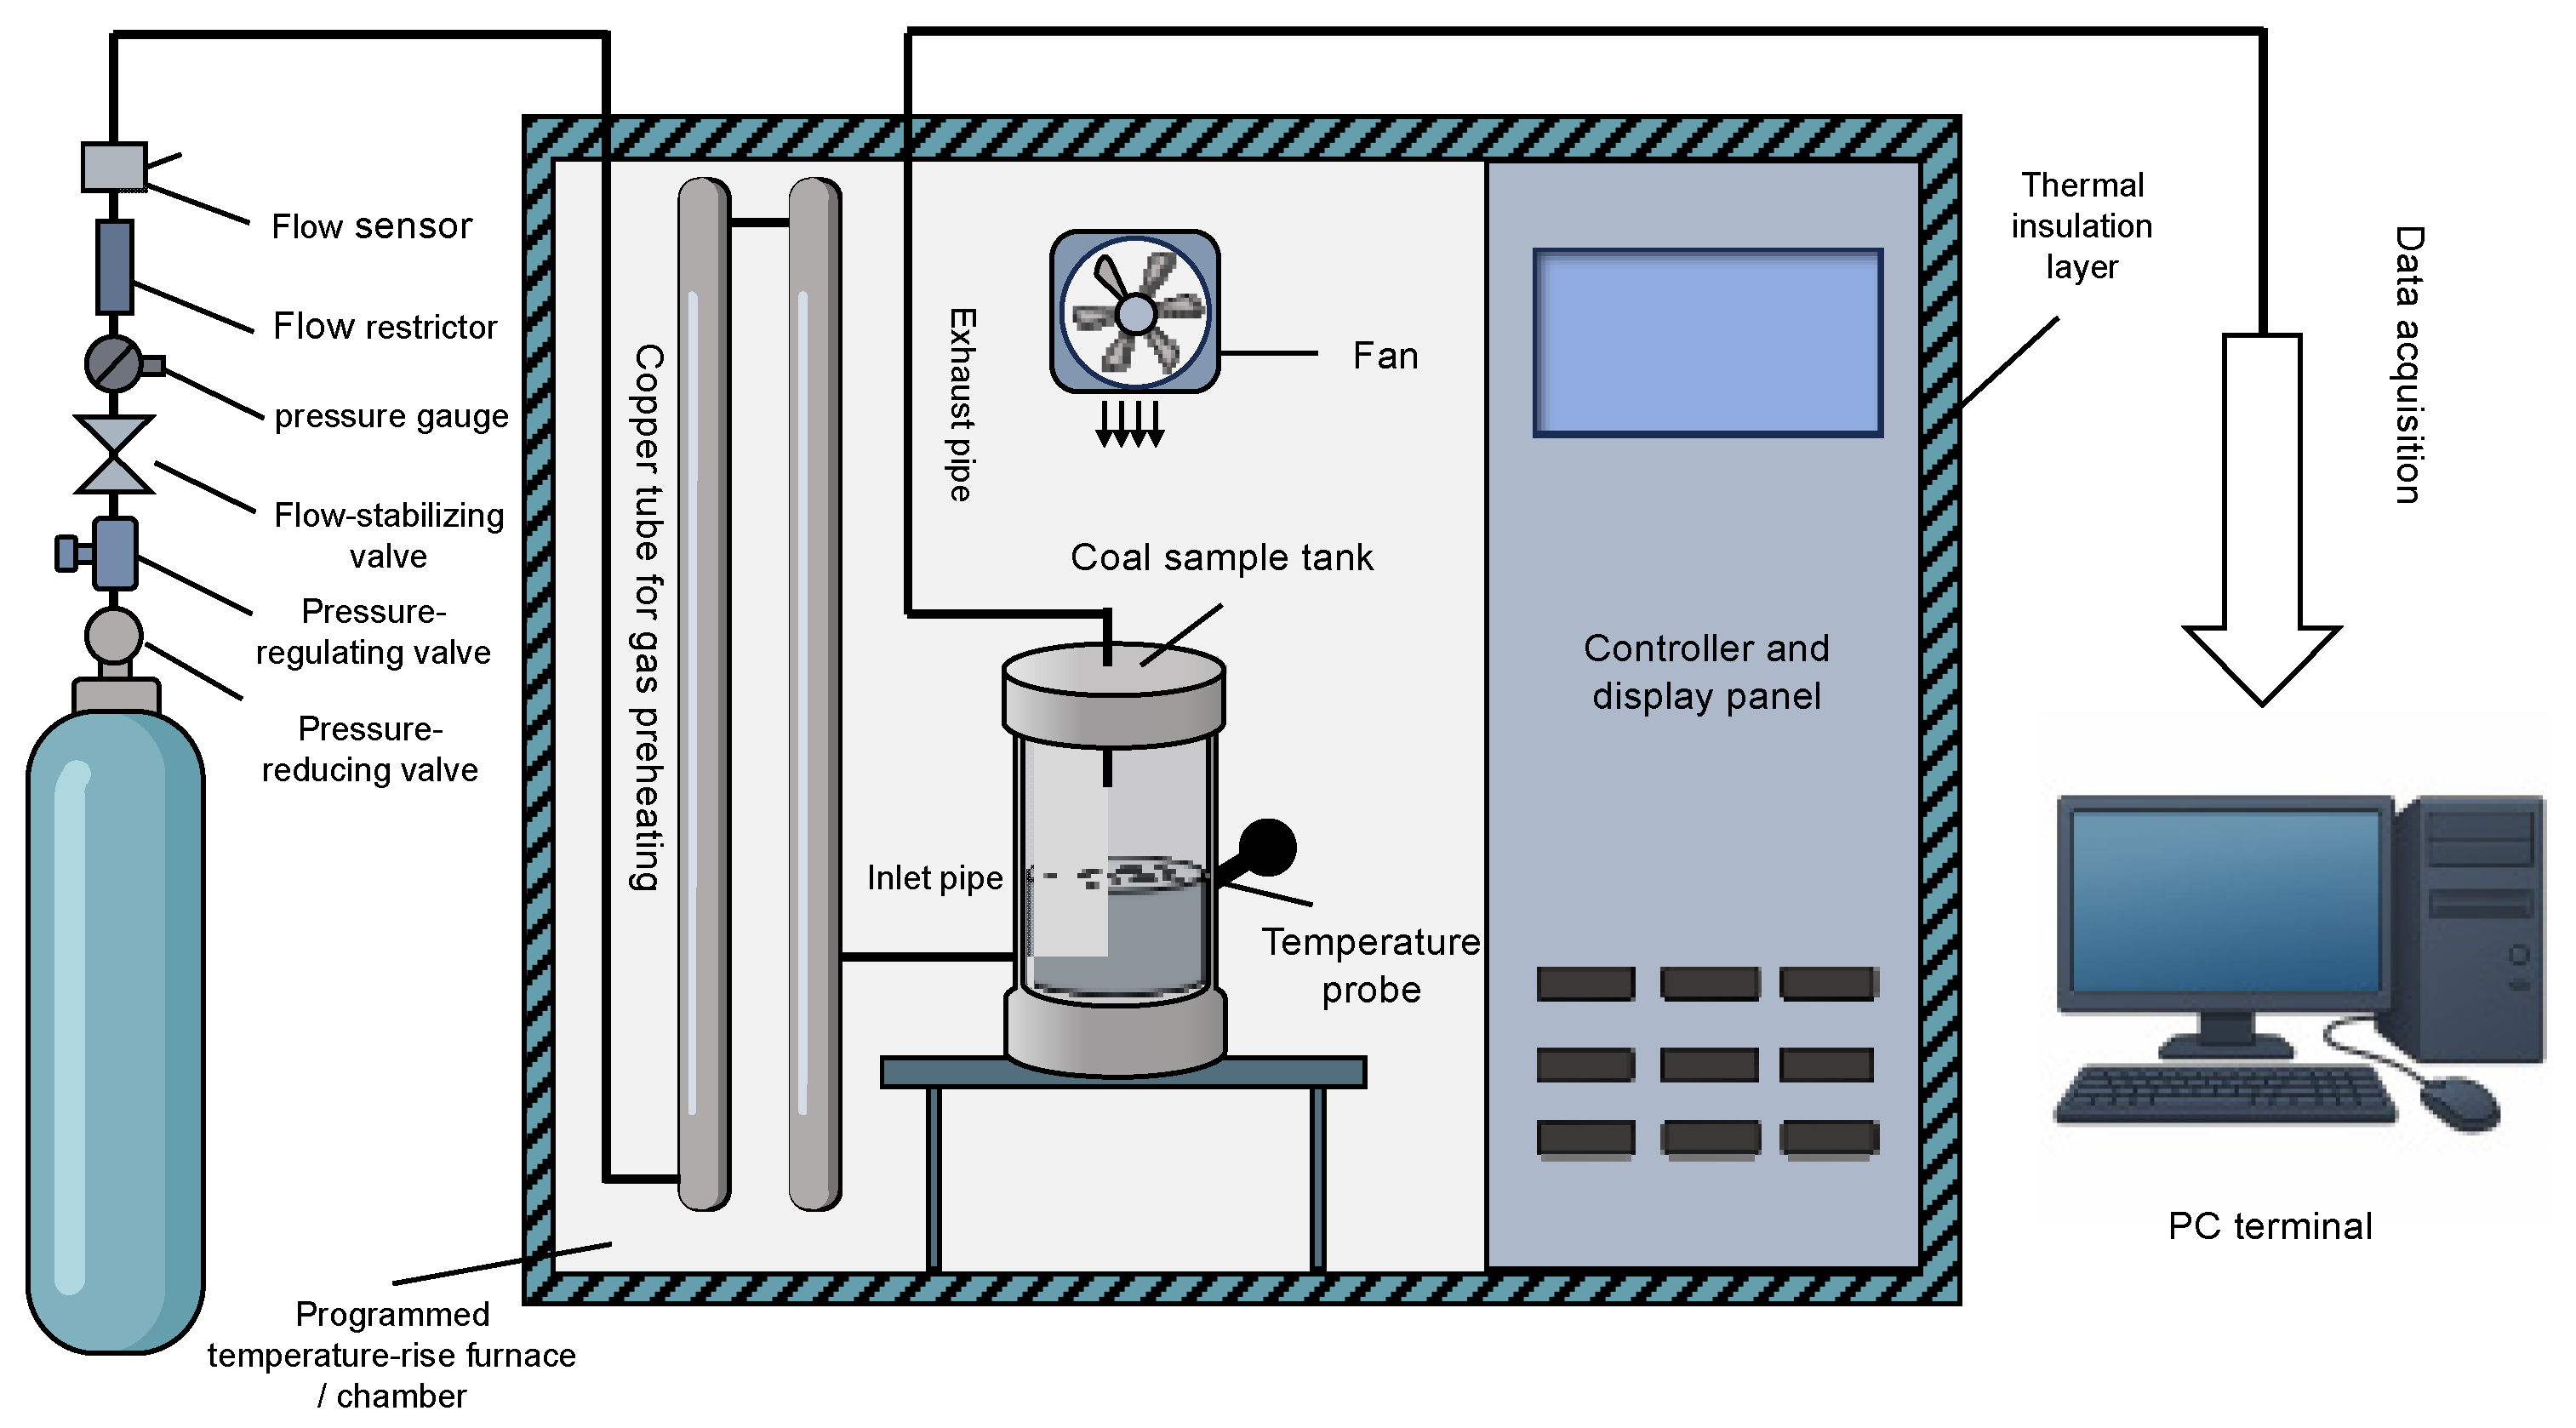
The adiabatic oxidation test device was used in the experiment, as shown in Figure 4.
Figure 4.
Schematic of adiabatic oxidation reactive apparatus.
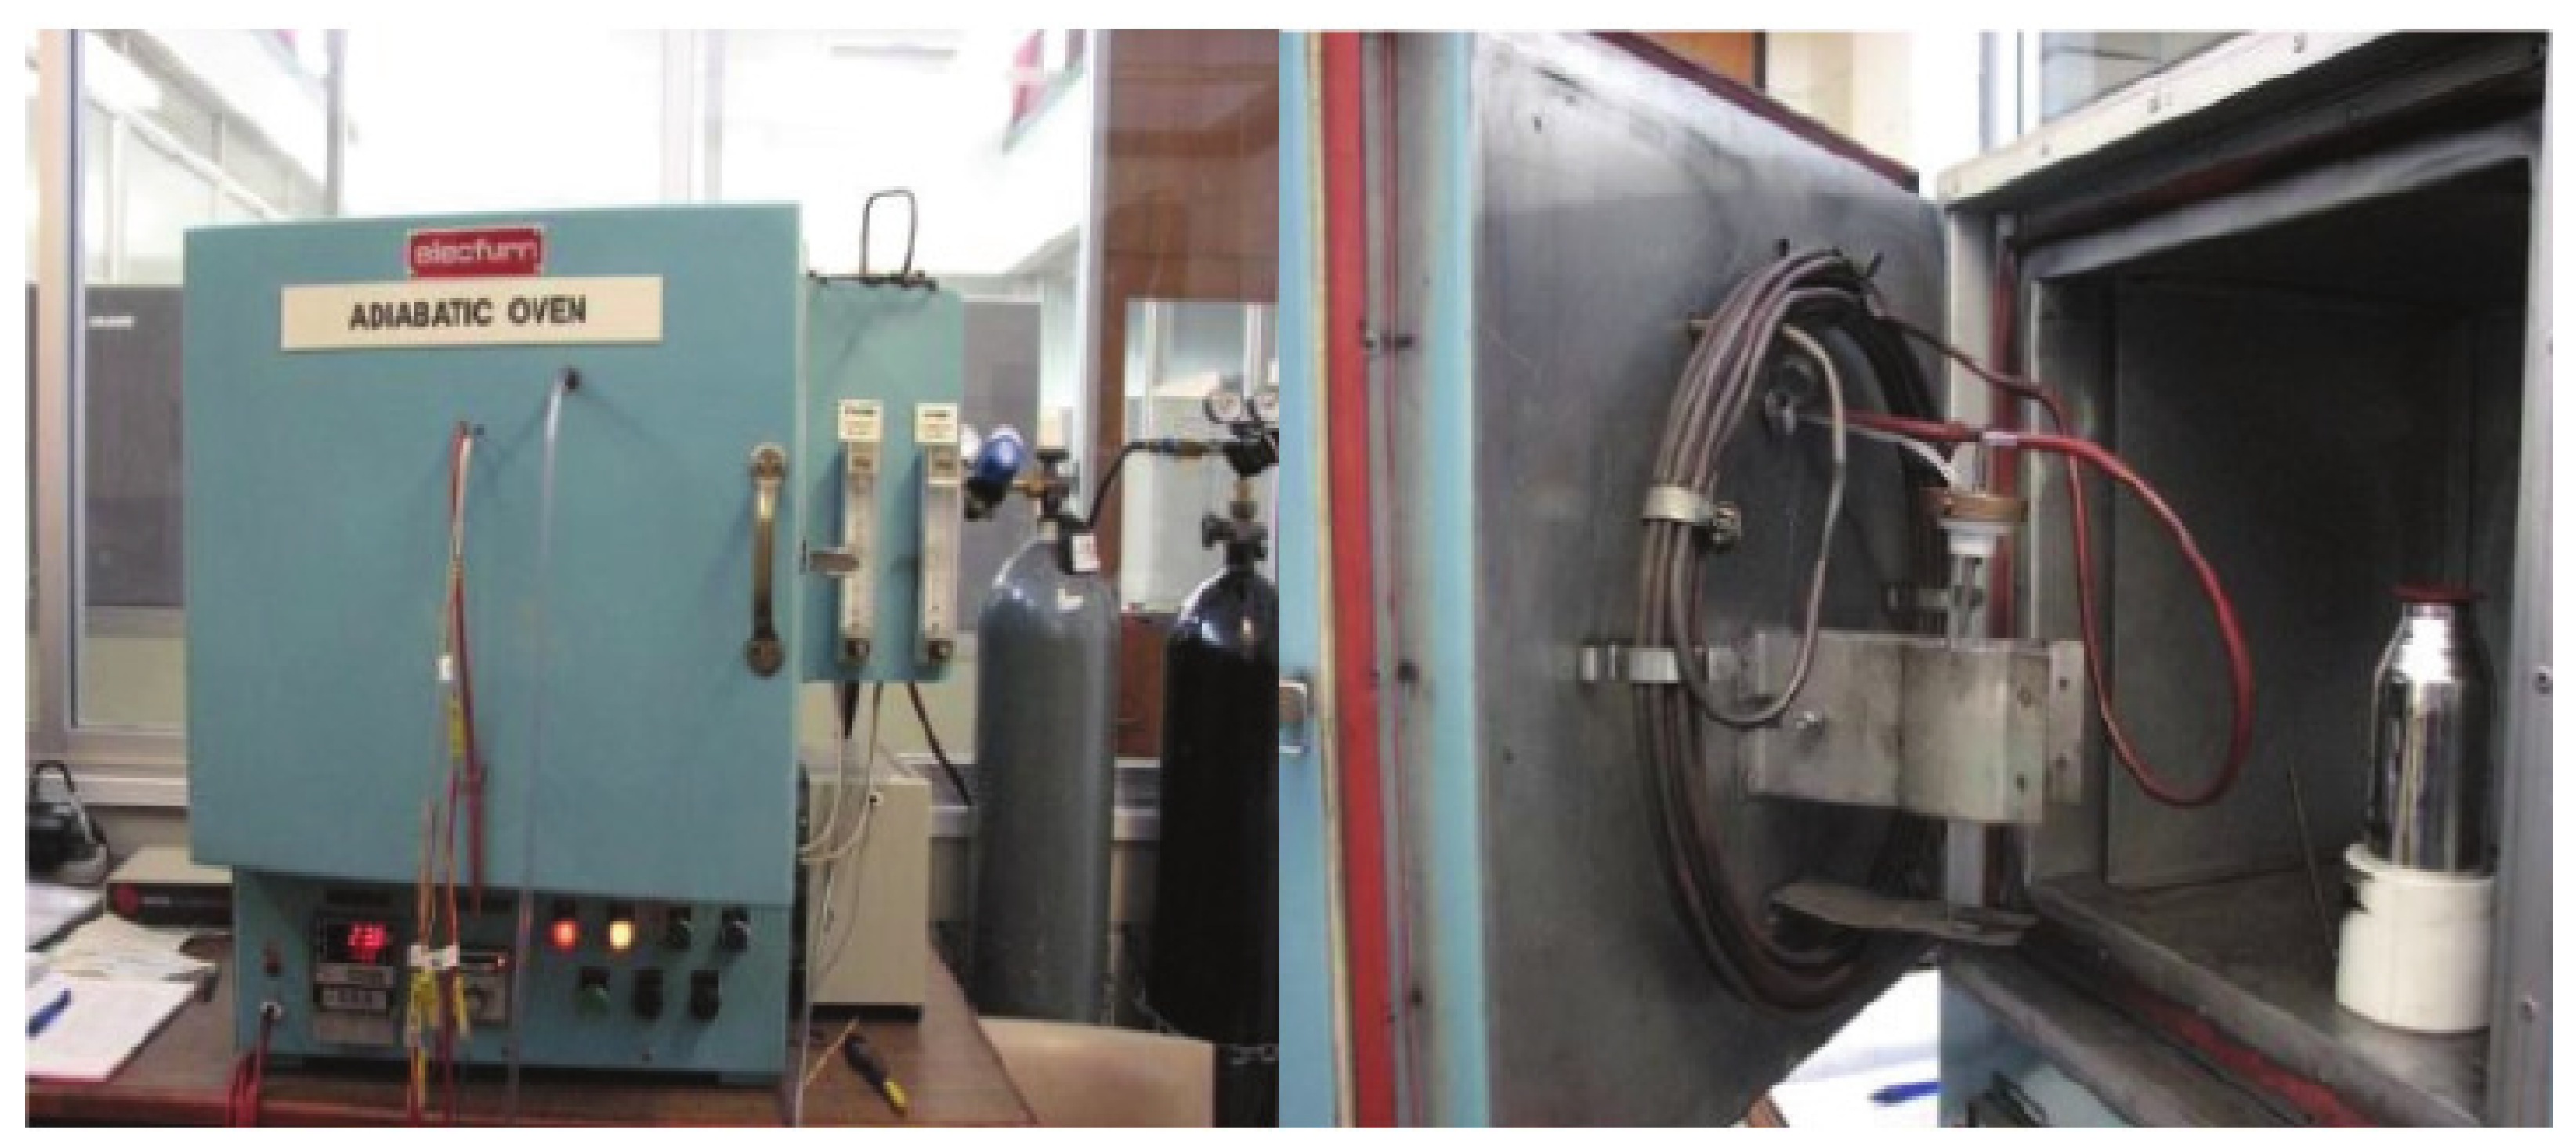
The coal sample treatment and test parameter settings were as follows: 10 g of coal sample with a particle size of < 212 μm was taken, and dried at 105–110°C for 16 h in a nitrogen atmosphere at a flow rate of 30 cm3/min to remove free moisture. After cooling to 40°C, it was quickly transferred to the adiabatic reaction chamber and sealed. Subsequently, an oxygen-enriched gas flow with a volume fraction of 50% was introduced (at a flow rate of 25±2 cm3/min), and the adiabatic state of the reaction chamber was maintained [19,20].
2.3.2. Results and Analysis
The adiabatic oxidation temperature-rise curves of the ten types of coal samples are shown in Figure 5.
Figure 5.
Temperature rise curve of adiabatic oxidation test.
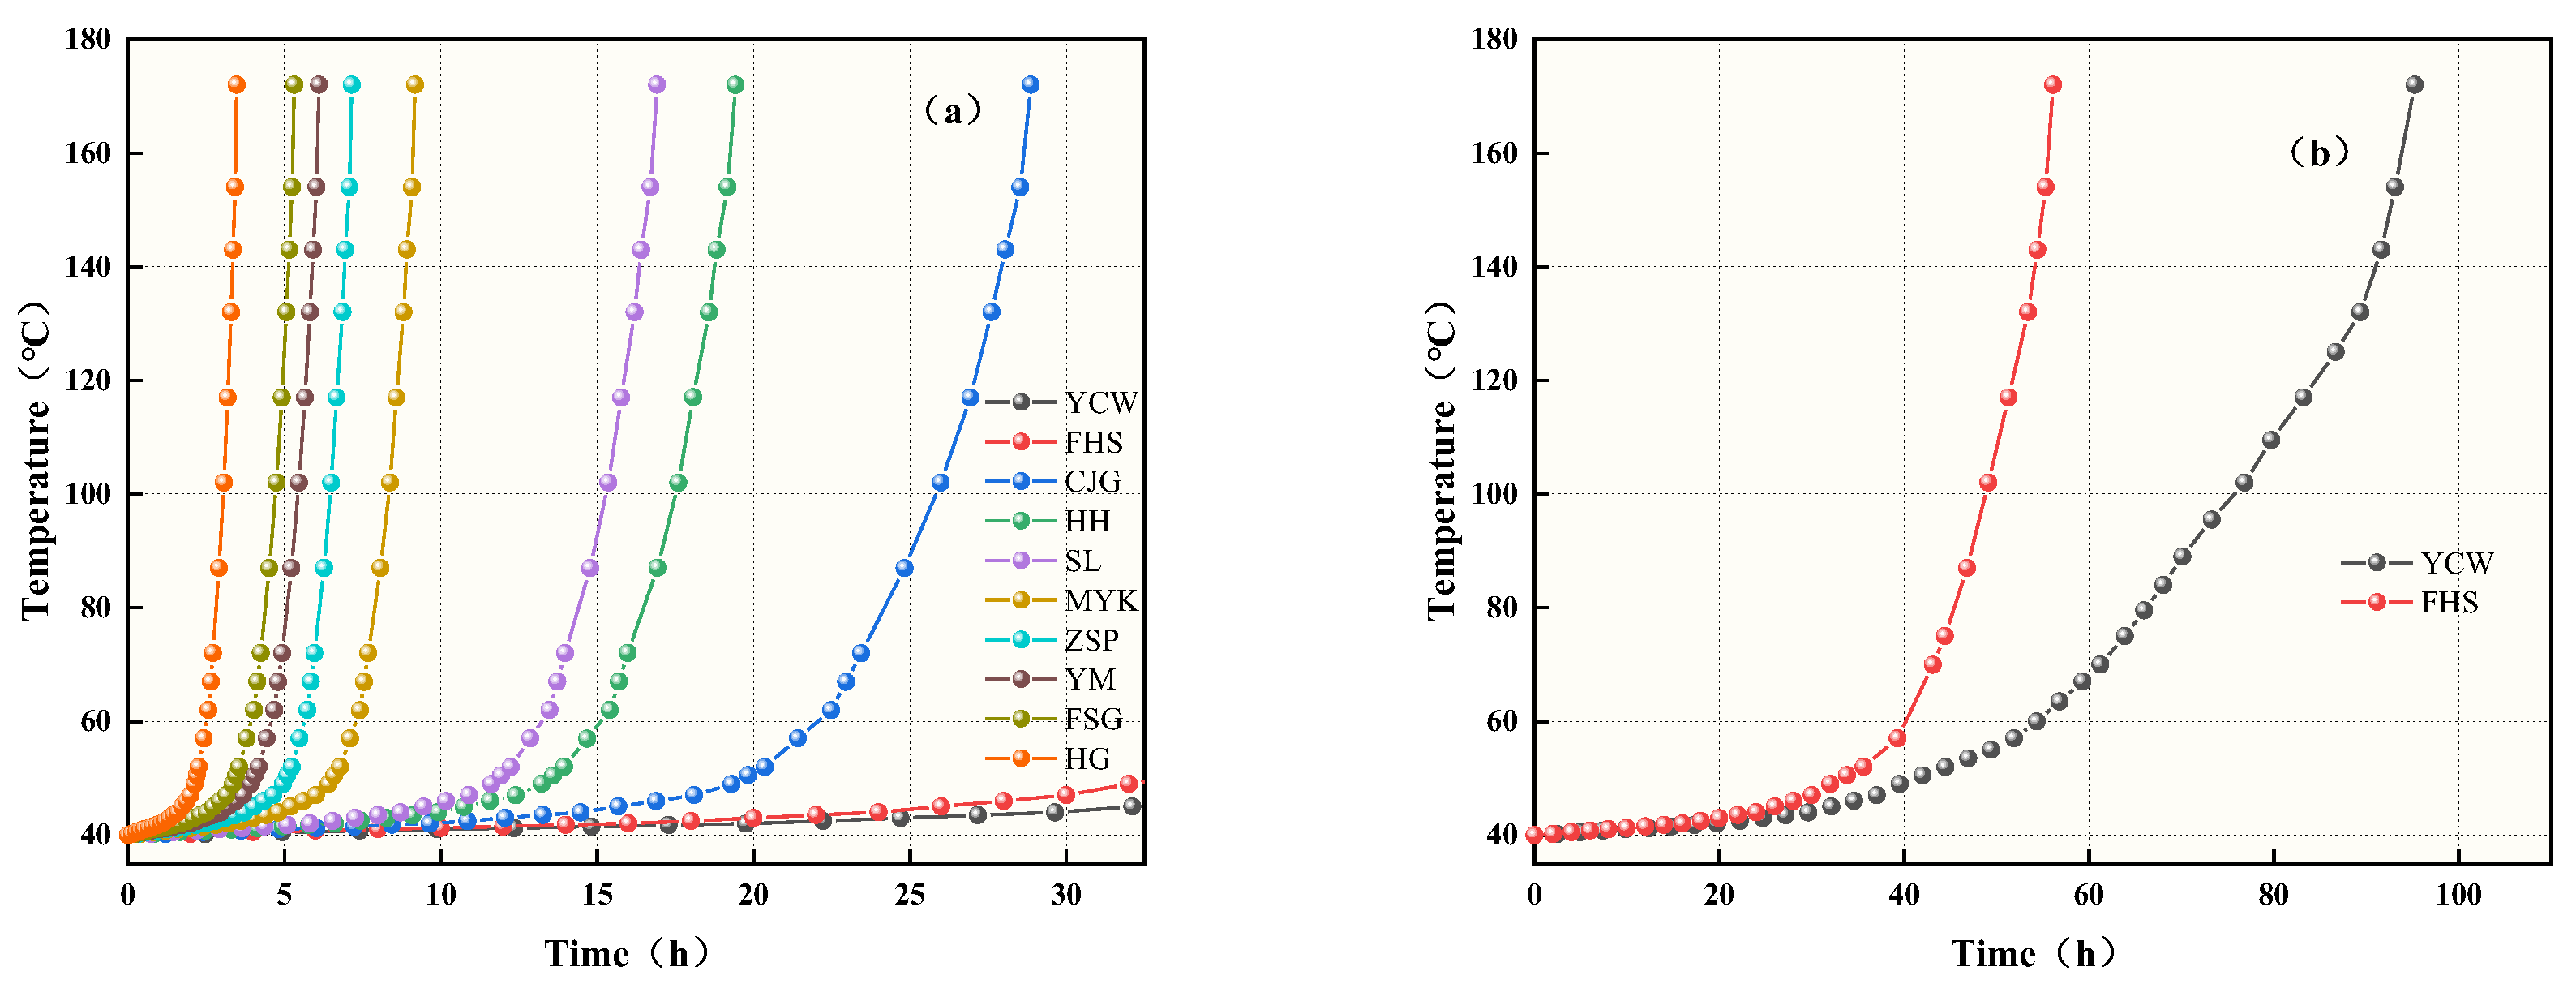
Based on the adiabatic oxidation temperature-rise curve of each coal sample, the average temperature-rise rate from 40°C to 70°C was calculated, which is defined as the R70 value (unit: °C/h). And the calculation results are shown in Figure 6.
Figure 6.
R70 of Different Coal Samples.
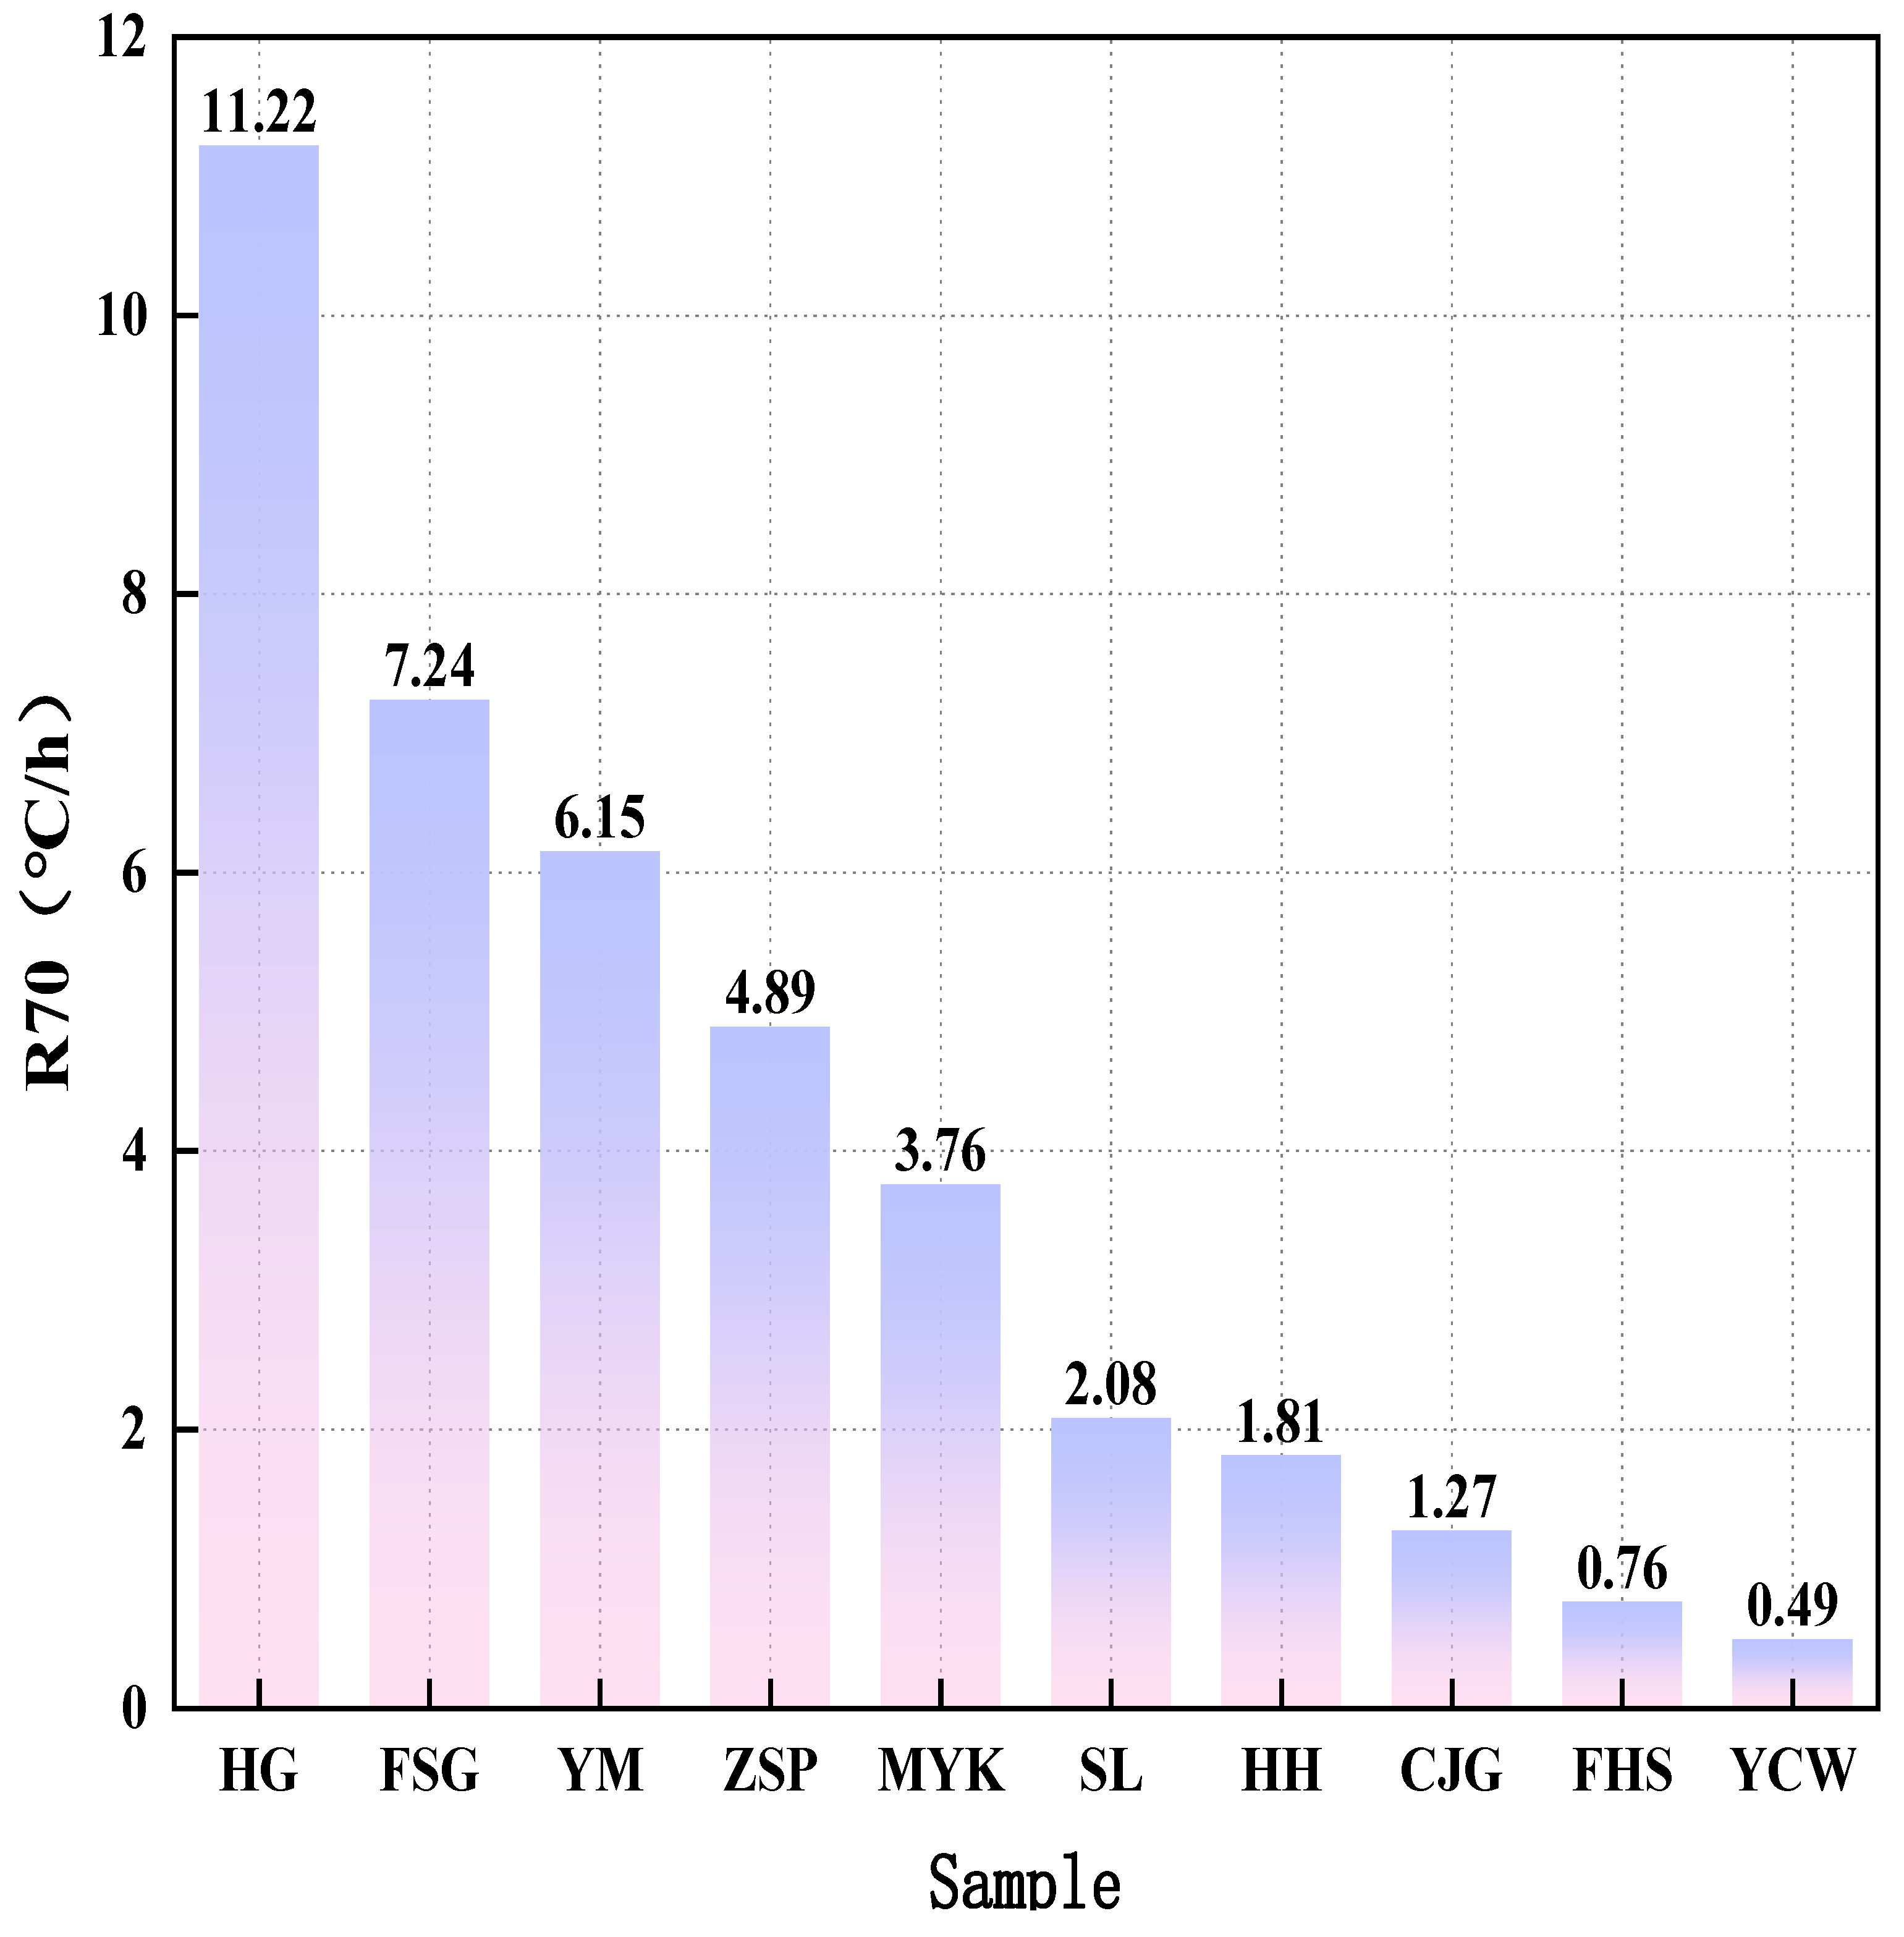
The R70 values of coal samples with different metamorphic degrees show significant differences. The R70 values of low-rank coals (HG, FSG, YM) are generally higher than 6°C/h, while those of high-rank anthracites (FHS, YCW) are all lower than 1°C/h.
This phenomenon is consistent with the rule in Section 2.2 that low-rank coals have a higher proportion of oxygen-containing functional groups and greater oxygen adsorption capacity. By investigating the characteristics of the medium-temperature heat accumulation stage during coal spontaneous combustion, R70 can determine the spontaneous combustion tendency of coal samples and provide key parameters for the establishment of MF-CSCI.
2.4. Acquisition of Key Parameters and Characteristic Analysis in the Rapid Self-Heating Stage
Cross Point Temperature (CPT) characterizes the spontaneous combustion tendency of coal, based on experimental data from the rapid self-heating stage during coal spontaneous combustion.
This experiment aims to obtain the CPT and Average Heating Rate (AHR) of 10 coal samples, and derive the Fuel Combustion Characteristic Index (FCC). This index will serve as the high-temperature end parameter of MF-CSCI, complementing the low-temperature oxygen adsorption capacity.
The following sections will elaborate on the experimental apparatus and conditions, followed by an analysis of the variation laws of CPT and FCC [21].
2.4.1. Experimental Apparatus and Conditions
The ZRD-1 coal low-temperature oxidation kinetics analyzer was used for the CPT experiment, as shown in Figure 7. Coal samples were loaded into a 316L stainless steel wire mesh basket (pore size: 0.5 mm), and a K-type precision thermocouple (temperature measurement range: −200~1372°C; accuracy: ±0.1°C) was embedded in the center of the basket, which was then fixed in the constant-temperature zone inside the furnace.
Figure 7.
Schematic diagram of the ZRD-1 coal low-temperature oxidation kinetics analyzer.
2.4.2. Results and Analysis
The results of the AHR and FCC indices are shown in Figure 8. Among them, coals such as HG and FSG belong to those with high spontaneous combustion tendency; coals like ZSP and HH are classified as having medium spontaneous combustion tendency; while FHS and YCW are coals with low spontaneous combustion tendency.
Figure 8.
Different Coal Samples: AHR and FCC.
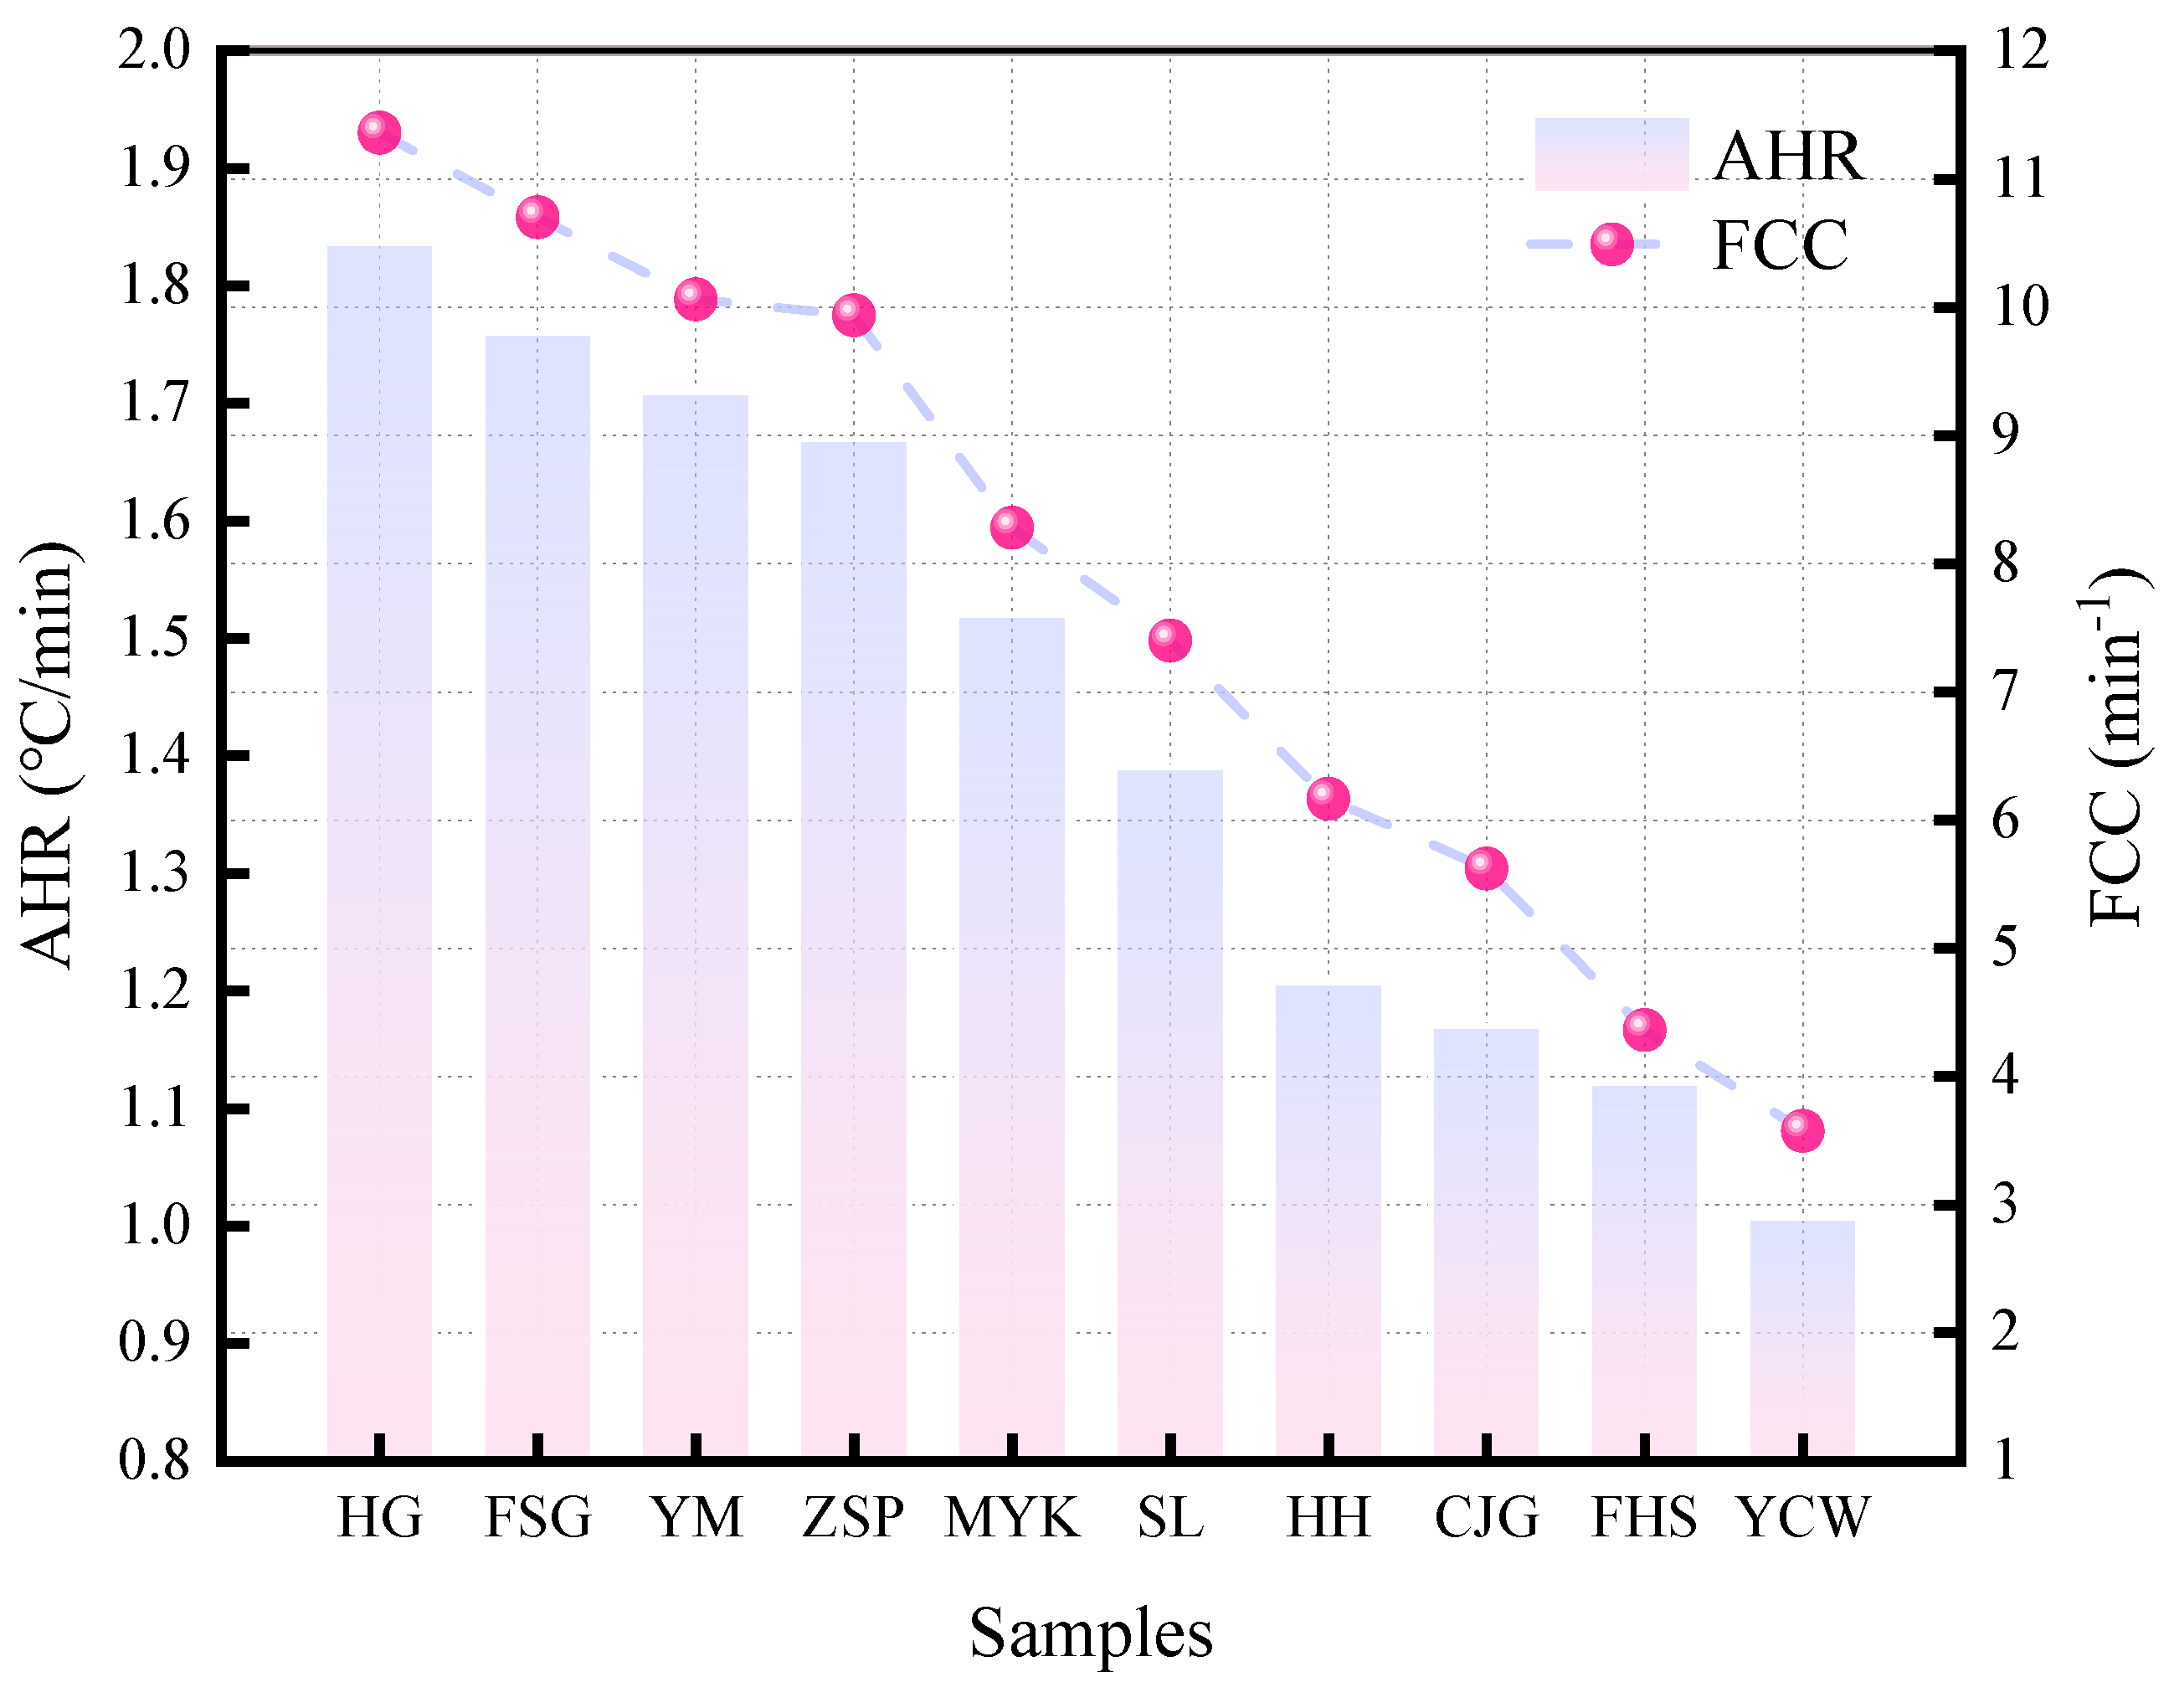
The larger the FCC value, the higher the spontaneous combustion tendency of coal. This is because a larger FCC value indicates that the coal sample has a faster heating rate at lower temperatures, making it more likely to trigger spontaneous combustion.
Conversely, a smaller FCC value corresponds to a slower heating rate, a higher spontaneous combustion critical temperature, and thus a lower spontaneous combustion tendency. Therefore, the spontaneous combustion tendency of coal increases significantly with the increase of AHR (Average Heating Rate) and FCC.
It can be seen from Figure 8 that the AHR of the 10 coal samples decreased from 1.836 (HG) to 1.007 (YCW), with a decrease of approximately 45.16%. The FCC decreased from 11.362 (HG) to 3.576 (YCW), with a decrease of about 68.5%.
This presents the rule that “the higher the coal metamorphic degree, the smaller the AHR and FCC”, and the variation trends of the two are completely opposite to that of CPT (Cross Point Temperature): HG (lignite, with the lowest coalification degree) has the largest AHR and FCC, and its heating rate in the range of 110~230°C is significantly higher than that of YCW (anthracite, with the highest coalification degree).
This is directly related to the characteristics of HG, such as high volatile content and high oxygen-containing functional groups (which easily react with oxygen at low temperatures). In contrast, after metamorphism under high temperature and high pressure, YCW has a large amount of oxygen-containing functional groups removed by deoxidation; the proportion of polycyclic aromatic hydrocarbons increases to form a stable conjugated structure, resulting in significant inhibition of its oxidation activity.
Mechanistically, AHR reduction reflects a decrease in the oxidation reaction rate of coal during the heating stage. The core reason is that high-metamorphic coal contains fewer active groups and has a more stable molecular structure, leading to reduced oxidative heat release. As the ratio of AHR to CPT, FCC decrease is the combined effect of “slower heating rate” and “increased spontaneous combustion critical temperature”. The superposition of these two factors further reduces the spontaneous combustion tendency of coal.
2.5. Construction of Multi-Factor Comprehensive Spontaneous Combustion Index (MF-CSCI)
In the previous sections, three key parameters were obtained through different experiments: the FCC index (characterizing the high-temperature reaction characteristics of coal) via the CPT experiment, the saturated oxygen adsorption capacity (VO2, reflecting the low-temperature adsorption capacity of coal) via the gas chromatography oxygen adsorption experiment, and the R70 value (representing the medium-temperature heat storage characteristics) via the R70 adiabatic oxidation test.
These three parameters correspond to the key stages of the entire coal spontaneous combustion process, namely “low-temperature adsorption — medium-temperature heat storage — high-temperature reaction”. However, all three methods for determining spontaneous combustion tendency have limitations in temperature range coverage.
Therefore, this study constructed MF-CSCI, which scientifically integrates the saturated oxygen adsorption capacity, R70 value, and FCC index. It integrates the characteristic contributions of each stage through weight assignment to achieve full-process and accurate characterization of the spontaneous combustion tendency of different coal ranks.
2.5.1. Standardization of Model Parameters and Formulation of Formulas
Since VO2, R70, and FCC have different dimensions, it is necessary to first eliminate the differences using the min-max standardization method and map the data to the interval [0,1]. After that, the processed data are substituted into the product model to derive the MF-CSCI index. The specific formulas are as follows:
1. Standardization Formula for Saturated Oxygen Adsorption Capacity:
In the formula: 1.732 is the maximum value of saturated oxygen adsorption capacity of 10 coal samples at 30°C (unit: cm3/g); refers to the experimentally measured saturated oxygen adsorption capacity of the coal sample; denotes the standardized low-temperature adsorption parameter.
2. Standardization Formula for R70 Index
In the formula: 11.22 is the maximum R70 value of the 10 coal samples (unit: cm3/g); R70 refers to the experimentally measured average heating rate of the coal sample from 40°C to 70°C.
3. Standardization Formula for FCC Index:
In the formula: 11.362 is the maximum FCC index value of the 10 coal samples (unit: min−1); FCC refers to the standardized high−temperature reaction parameter.
4. Basic Formula of the MF-CSCI Index:
In the formula: MF−CSCI refers to the Multi-Factor Comprehensive Spontaneous Combustion Index for determining coal spontaneous combustion tendency;a is the weight of the low−temperature adsorption stage; b is the weight of the medium−temperature heat storage stage;c is the weight of the rapid self−heating stage; φ is the coupling correction coefficient;and K is the constant for scale calibration.
2.5.2. Weight Calculation Based on the Entropy Weight Method
VO2, R70, and FCC have different contribution weights to the spontaneous combustion tendency of coal, and the entropy weight method (an objective weighting method) is used to calculate the weights a, b, and c.
The core idea is that the more dispersed the indicator data (the smaller the entropy value), the greater the information amount, and the higher the weight. The specific calculation process is as follows: First, the min-max standardization method is adopted to eliminate dimensional differences and map the data to the interval [0,1].
Here, x is the independent variable, and the experimental data of VO2, R70, and FCC are substituted into it respectively.
I denotes the type of coal sample; through calculation, the values of , and for each coal sample are obtained.
Based on the standardized data, the entropy value of each coal sample is then calculated.
Substitute , and (calculated in the first step) respectively. Finally, calculate to obtain , , and .
Here, d denotes the information utility value of VO2, R70, and FCC for each coal sample. Substitute , , and (the entropy values of the corresponding parameters) into the calculation respectively.
Finally, substitute , and into the formula, and calculate the results: a=0.296, b=0.292, c=0.412. Specifically, the influence weights of the low-temperature adsorption stage, medium-temperature heat storage stage, and rapid self-heating stage on coal spontaneous combustion tendency are 0.296, 0.292, and 0.412, respectively. The constant K is a scale translation factor used to calibrate the output range of the index. By setting K to 1, the MF-CSCI values are shifted from a 0 to 10 range to a 1 to 11 range, which aligns with common risk assessment conventions and provides a more intuitive baseline for engineering classification. The final formula of the multi-factor comprehensive index for coal spontaneous combustion tendency.
After substituting the values of VO2, R70, and FCC for calculation, the MF-CSCI values of each coal sample are presented in Table 1:
3. Construction of Microscopic-Driven Coal Spontaneous Combustion Essential Identification Model (MD-CSEI)
Although the MF-CSCI constructed in the previous section has realized the macroscopic determination of coal spontaneous combustion tendency, this method has shortcomings such as extremely long experimental time and cumbersome procedures. Moreover, it fails to achieve the essential determination of coal spontaneous combustion, and its intrinsic correlation with the microscopic structure of coal remains unclear, lacking mechanistic explanations at the microscopic level.
To solve this problem, this study quantifies key functional groups via Fourier Transform Infrared Spectroscopy (FTIR), constructs the microscopically driven MD-CSEI (Microscopic-Driven Coal Spontaneous Combustion Essential Identification) Model, and further reveals the functional group regulation mechanism by combining with MF-CSCI. Eventually, an essential identification system with a closed loop of “macroscopic indicators - microscopic characteristics - molecular mechanism” is formed, providing in-depth theoretical support for engineering applications.
3.1. Acquisition and Analysis of Coal Microscopic Characteristic Parameters
In this section, Fourier Transform Infrared Spectroscopy (FTIR) experiments are used to quantify the key functional groups of coal samples with different coal ranks, providing basic data for subsequent linking of microscopic structures with MF-CSCI and constructing the essential identification model.
3.1.1. Instruments and Sample Preparation
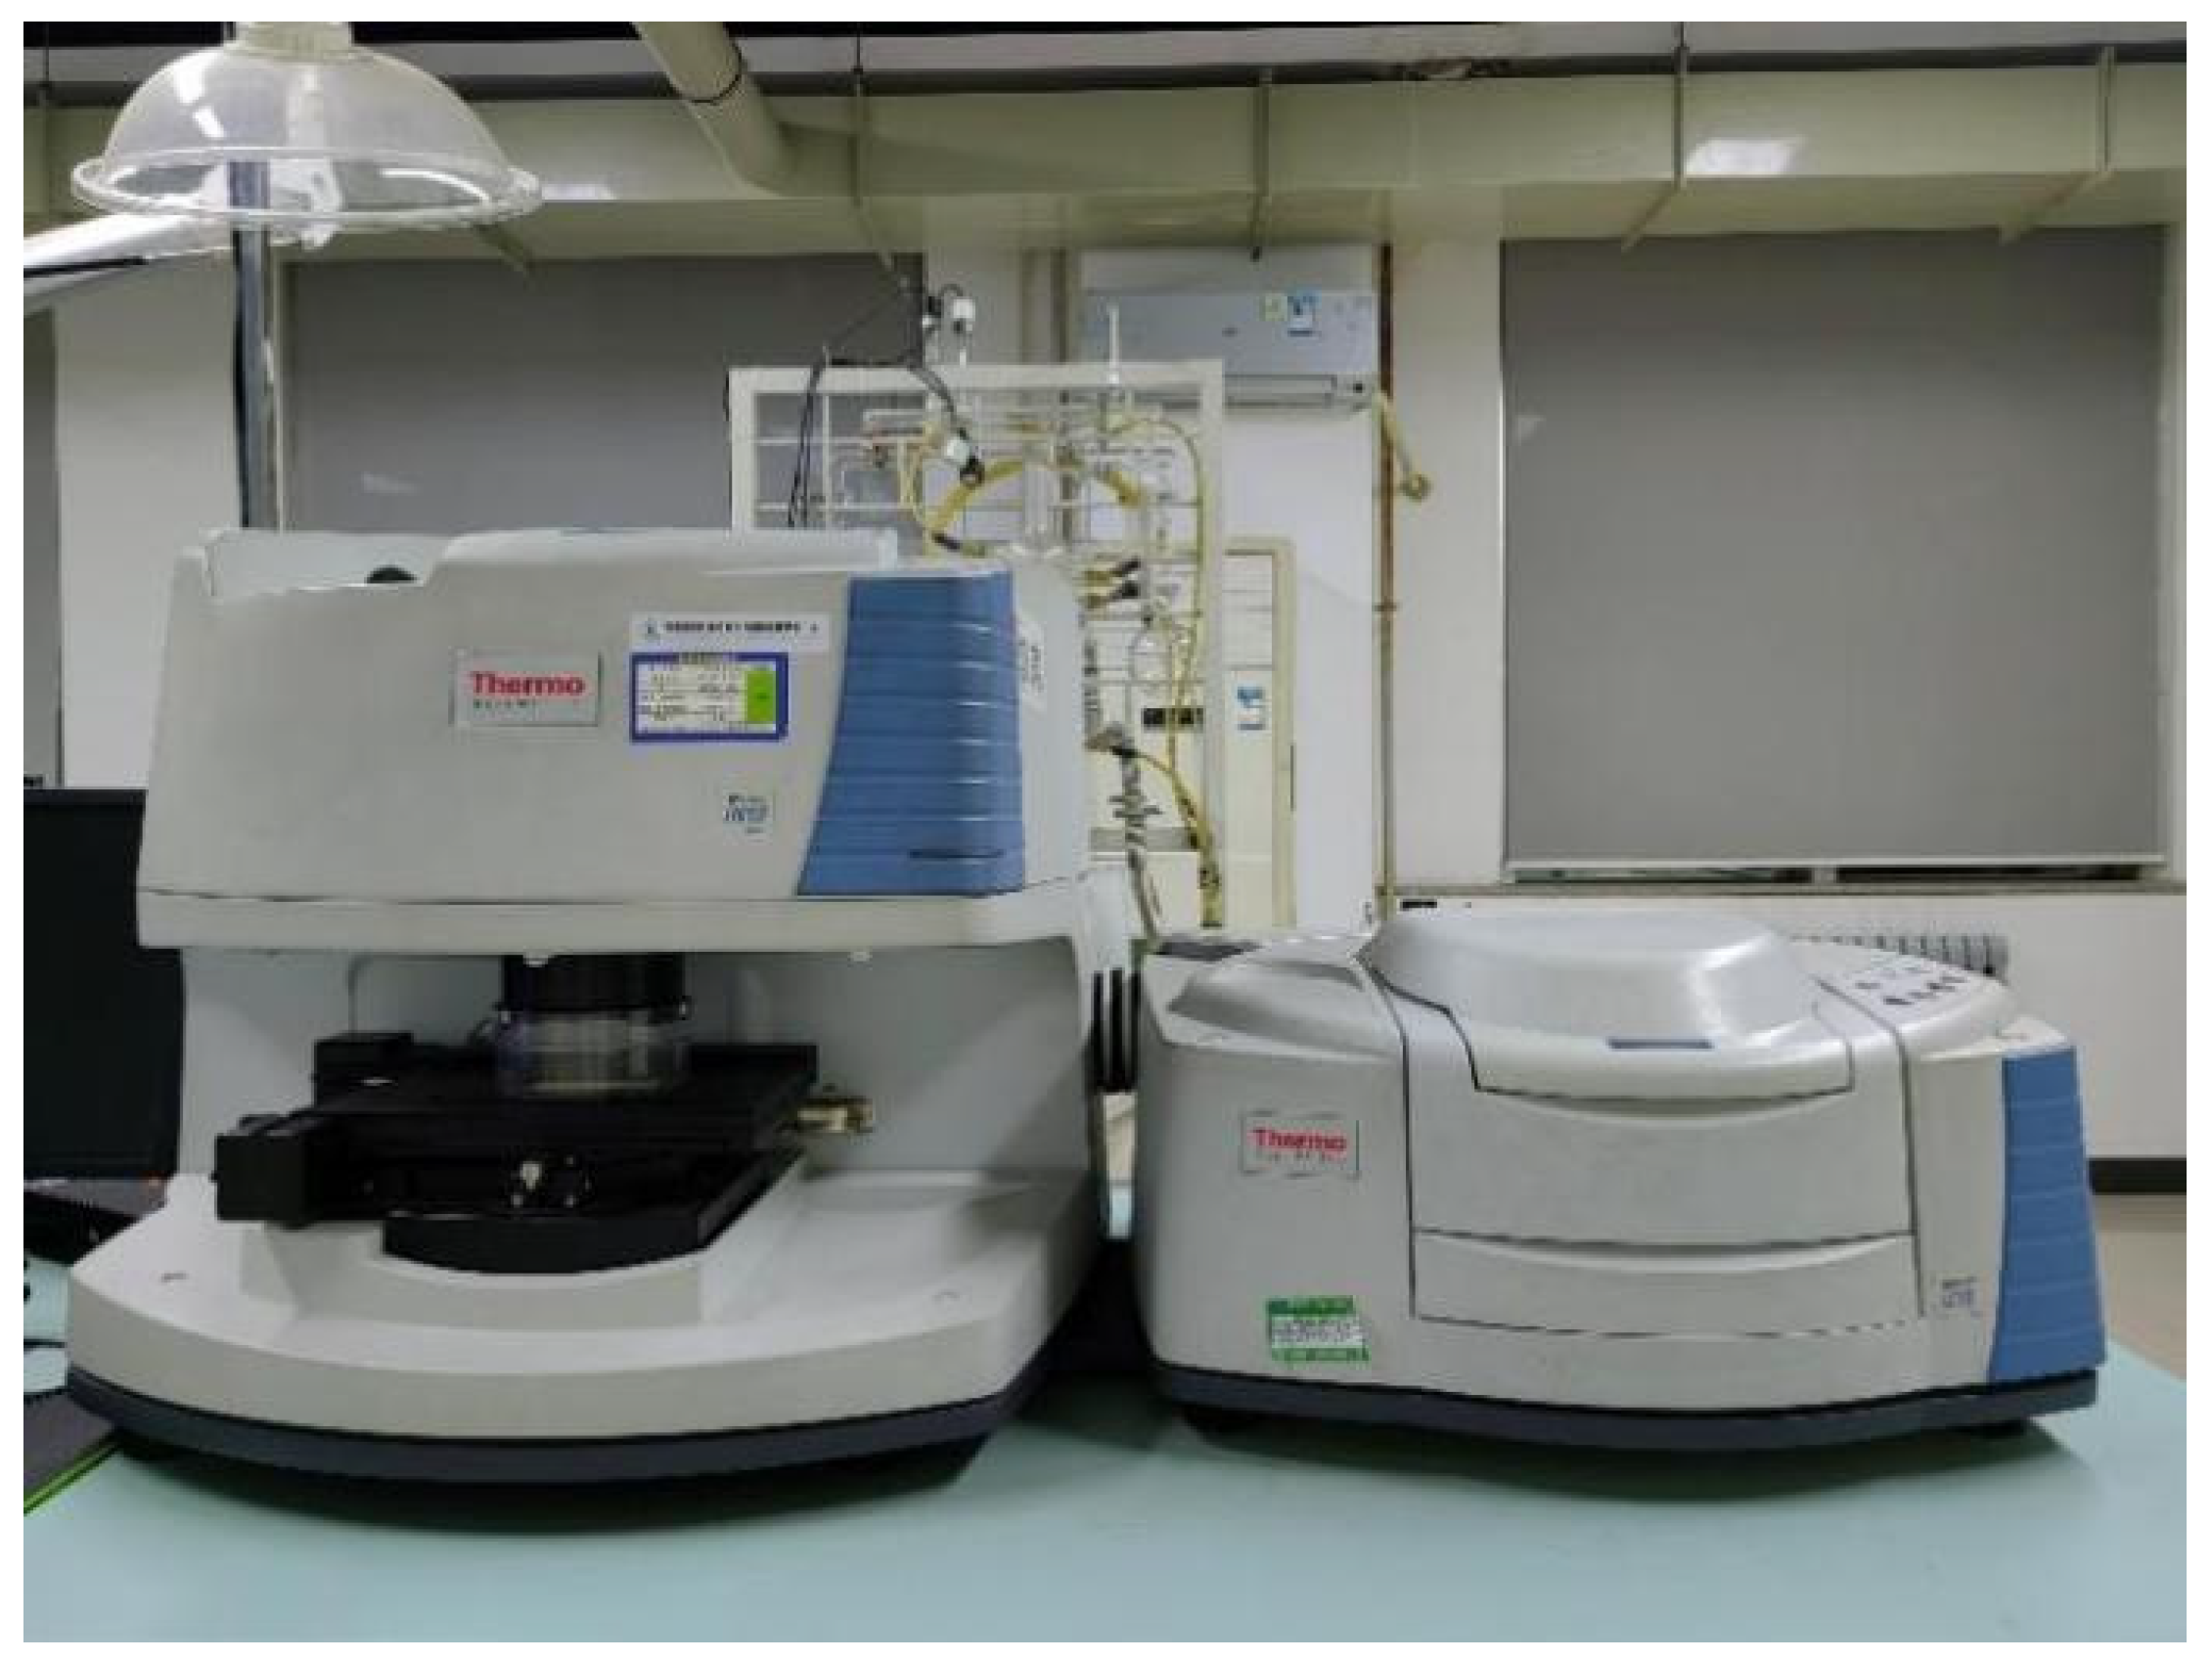
In this study, Fourier Transform Infrared Spectroscopy (FTIR) was used to quantitatively analyze the relative content of functional groups in coal samples. A Nicolet iZ10 spectrometer was employed, with a resolution of 4 cm−1 and a scanning wavenumber range of 400–4000 cm−1.
The samples were prepared by the tableting method: dried coal samples were mixed with dried KBr at a mass ratio of 1:200, ground and then pressed into transparent thin tablets. The tablets were placed in the instrument for scanning to obtain infrared absorption spectra [24,25,26].
Figure 9.
NicoletTM iZ10 Fourier Transform Infrared Spectrometer.
3.1.2. Results and Discussion
The baselines of the infrared spectra of coal samples were corrected, and the corrected spectra are shown in Figure 10.
Figure 10.
Summary Graph of Fourier Transform Infrared (FTIR) Spectra for the Ten Coal Samples.
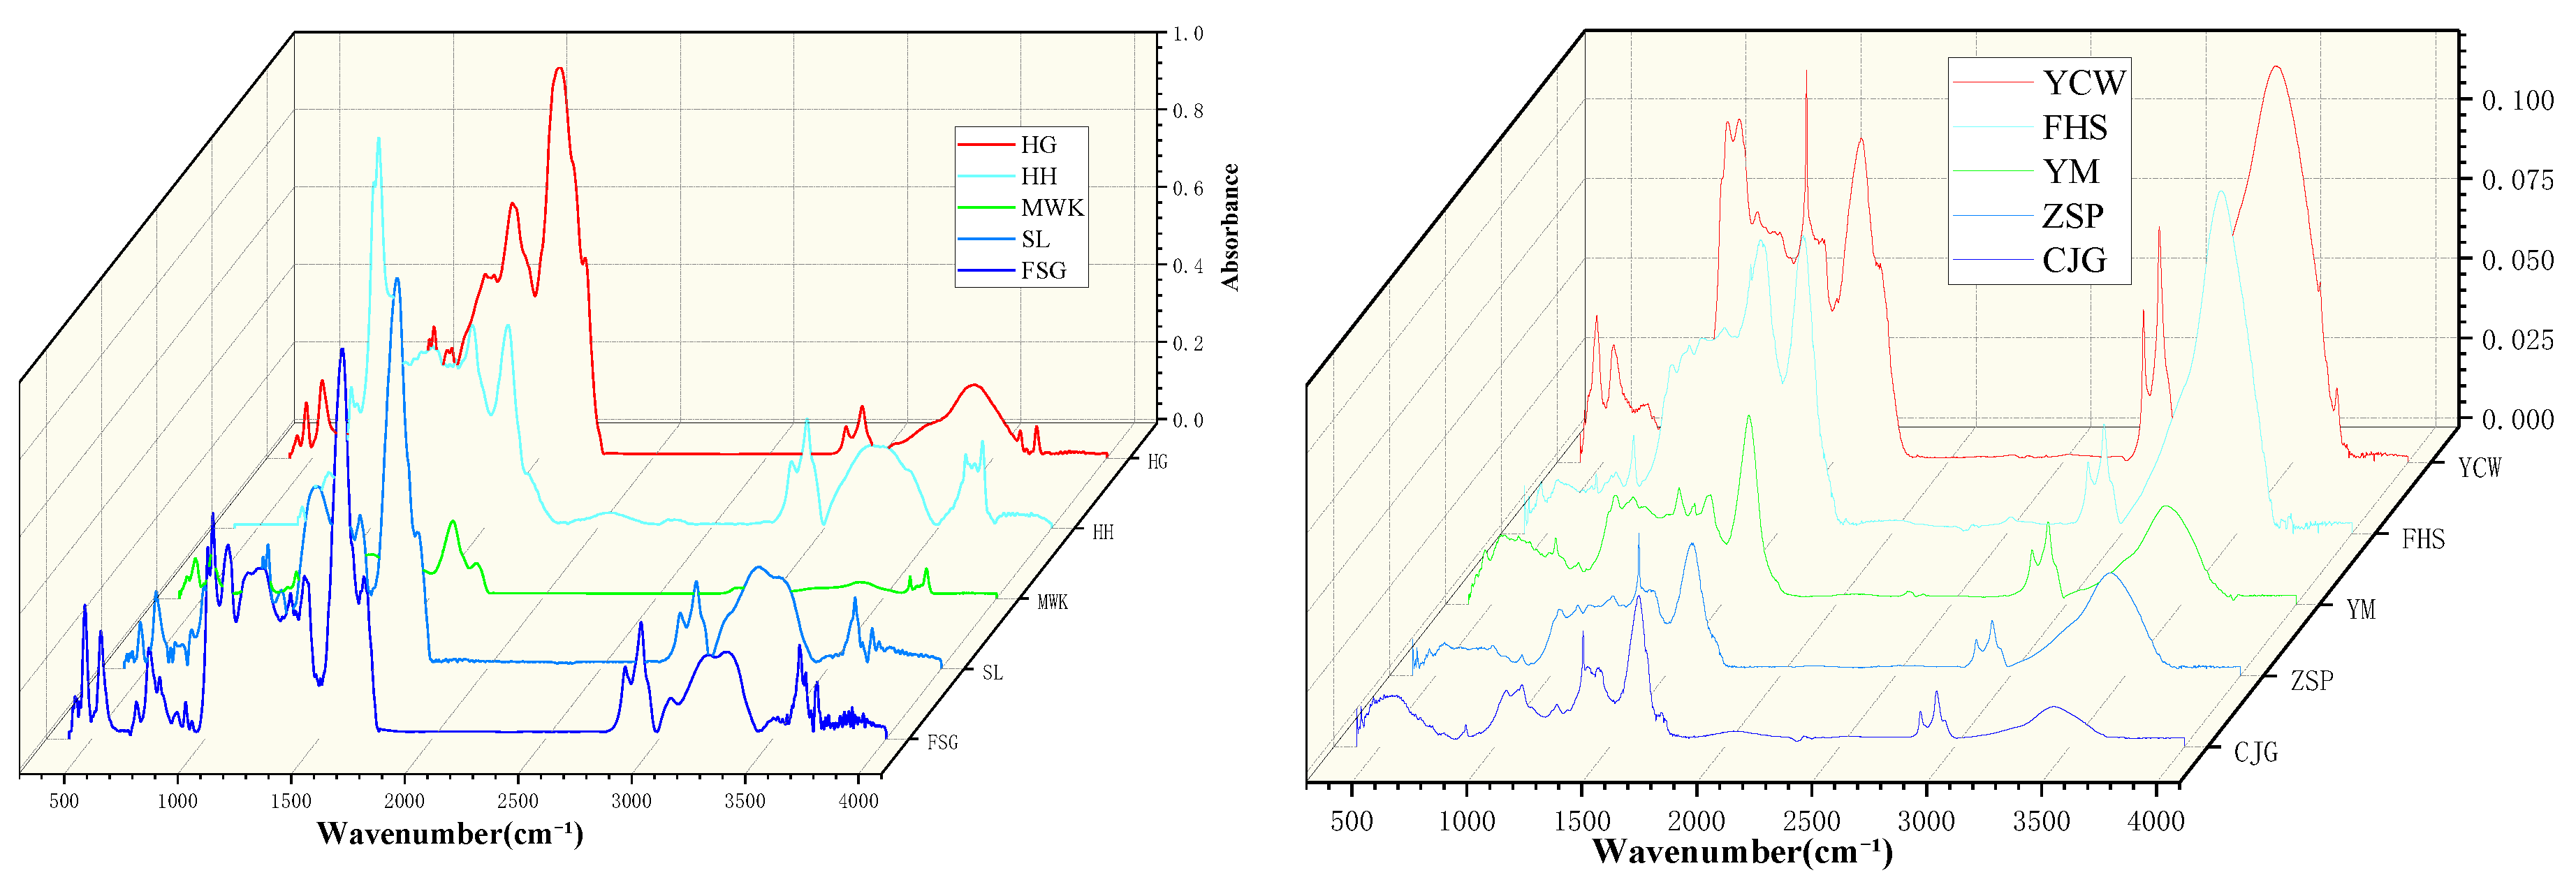
Coal spontaneous combustion is closely related to the functional groups and microscopic structure in coal. The FTIR spectra of the ten coal samples exhibit significant differences in the 2700−3700 cm−1 wavenumber range, which reflect the evolutionary characteristics of their microscopic structures.
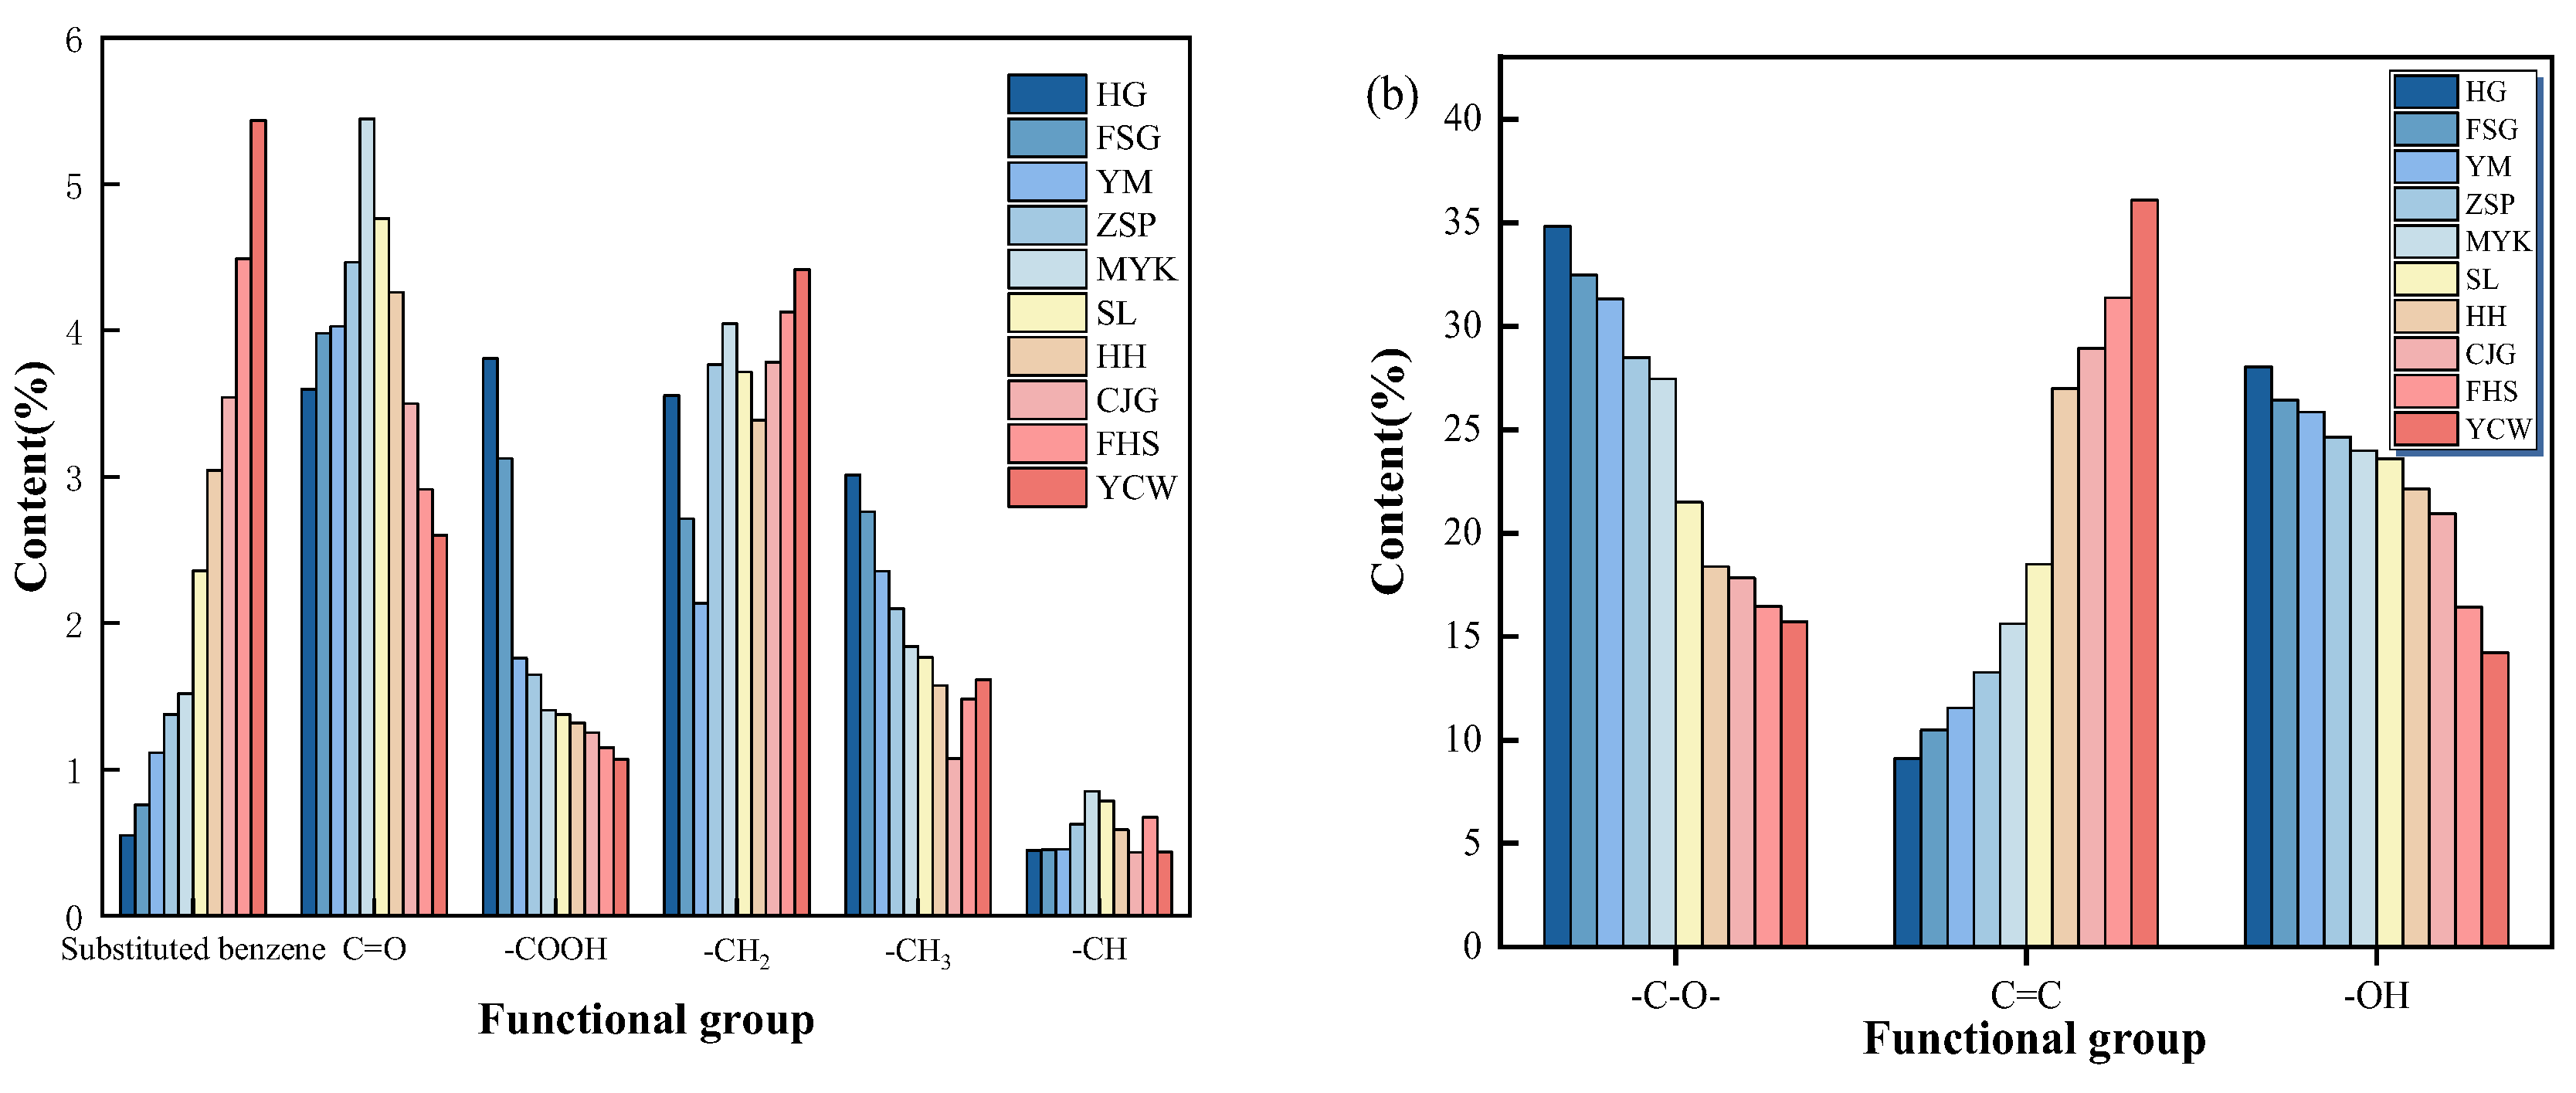
The functional groups in coal are mainly classified into four categories: oxygen-containing functional groups, hydroxyl groups, aliphatic hydrocarbons, and aromatic hydrocarbons, with the corresponding spectra fitted in four wavenumber bands. According to the Beer-Lambert Law, the area of absorption peaks is used to characterize the content of functional groups. After baseline subtraction in each region, the second derivative method in Peakfit software is applied for automatic fitting, and the Lorentz / Gaussian area integration method is used to calculate the peak area to improve accuracy. The comparison results of the content of each functional group in the ten coal samples are shown in Figure 11.
Figure 11.
Contents of Different Functional Groups in the Ten Coal Samples.
3.2. Correlation Analysis Between Microscopic Characteristic Parameters of Coal and MF-CSCI
By introducing the microstructural characteristics extracted via Fourier Transform Infrared (FTIR) analysis, this study constructs the MF-CSCI model. Based on multiple linear regression, the model quantifies the positive and negative regulatory effects of different functional groups on the spontaneous combustion tendency of coal.
This model partially replaces macroscopic experimental data with microstructural parameters, significantly improving determination efficiency and structural explanatory power. Additionally, it provides theoretical support for coal mine fire prevention strategies.
3.2.1. Correlation Analysis Methods
The Pearson correlation coefficient is used to explore the degree of dependence between variables, denoted by r, with a value range of [−1, 1]. When r =1, the variables are exactly positively correlated; when r=0, there is no correlation between the variables; when r=−1, the variables are exactly negatively correlated. The specific calculation formula is as follows:
3.2.2. Identification of Key Functional Groups
To explore the correlation between the microstructural characteristics of coal and tMF-CSCI, this paper uses the Pearson correlation coefficient method for quantitative analysis. Considering the interaction between multiple variables and calculation accuracy, IBM SPSS Statistics 27 software is used to complete the analysis, and a correlation heatmap is plotted (Figure 12). The results show that C=C and −OH groups have a significant positive correlation with MF-CSCI, and they are the key microscopic factors affecting the spontaneous combustion tendency of coal.
Figure 12.
Correlation Matrix Heatmap of Coal’s Microstructural Characteristics and MF-CSCI.
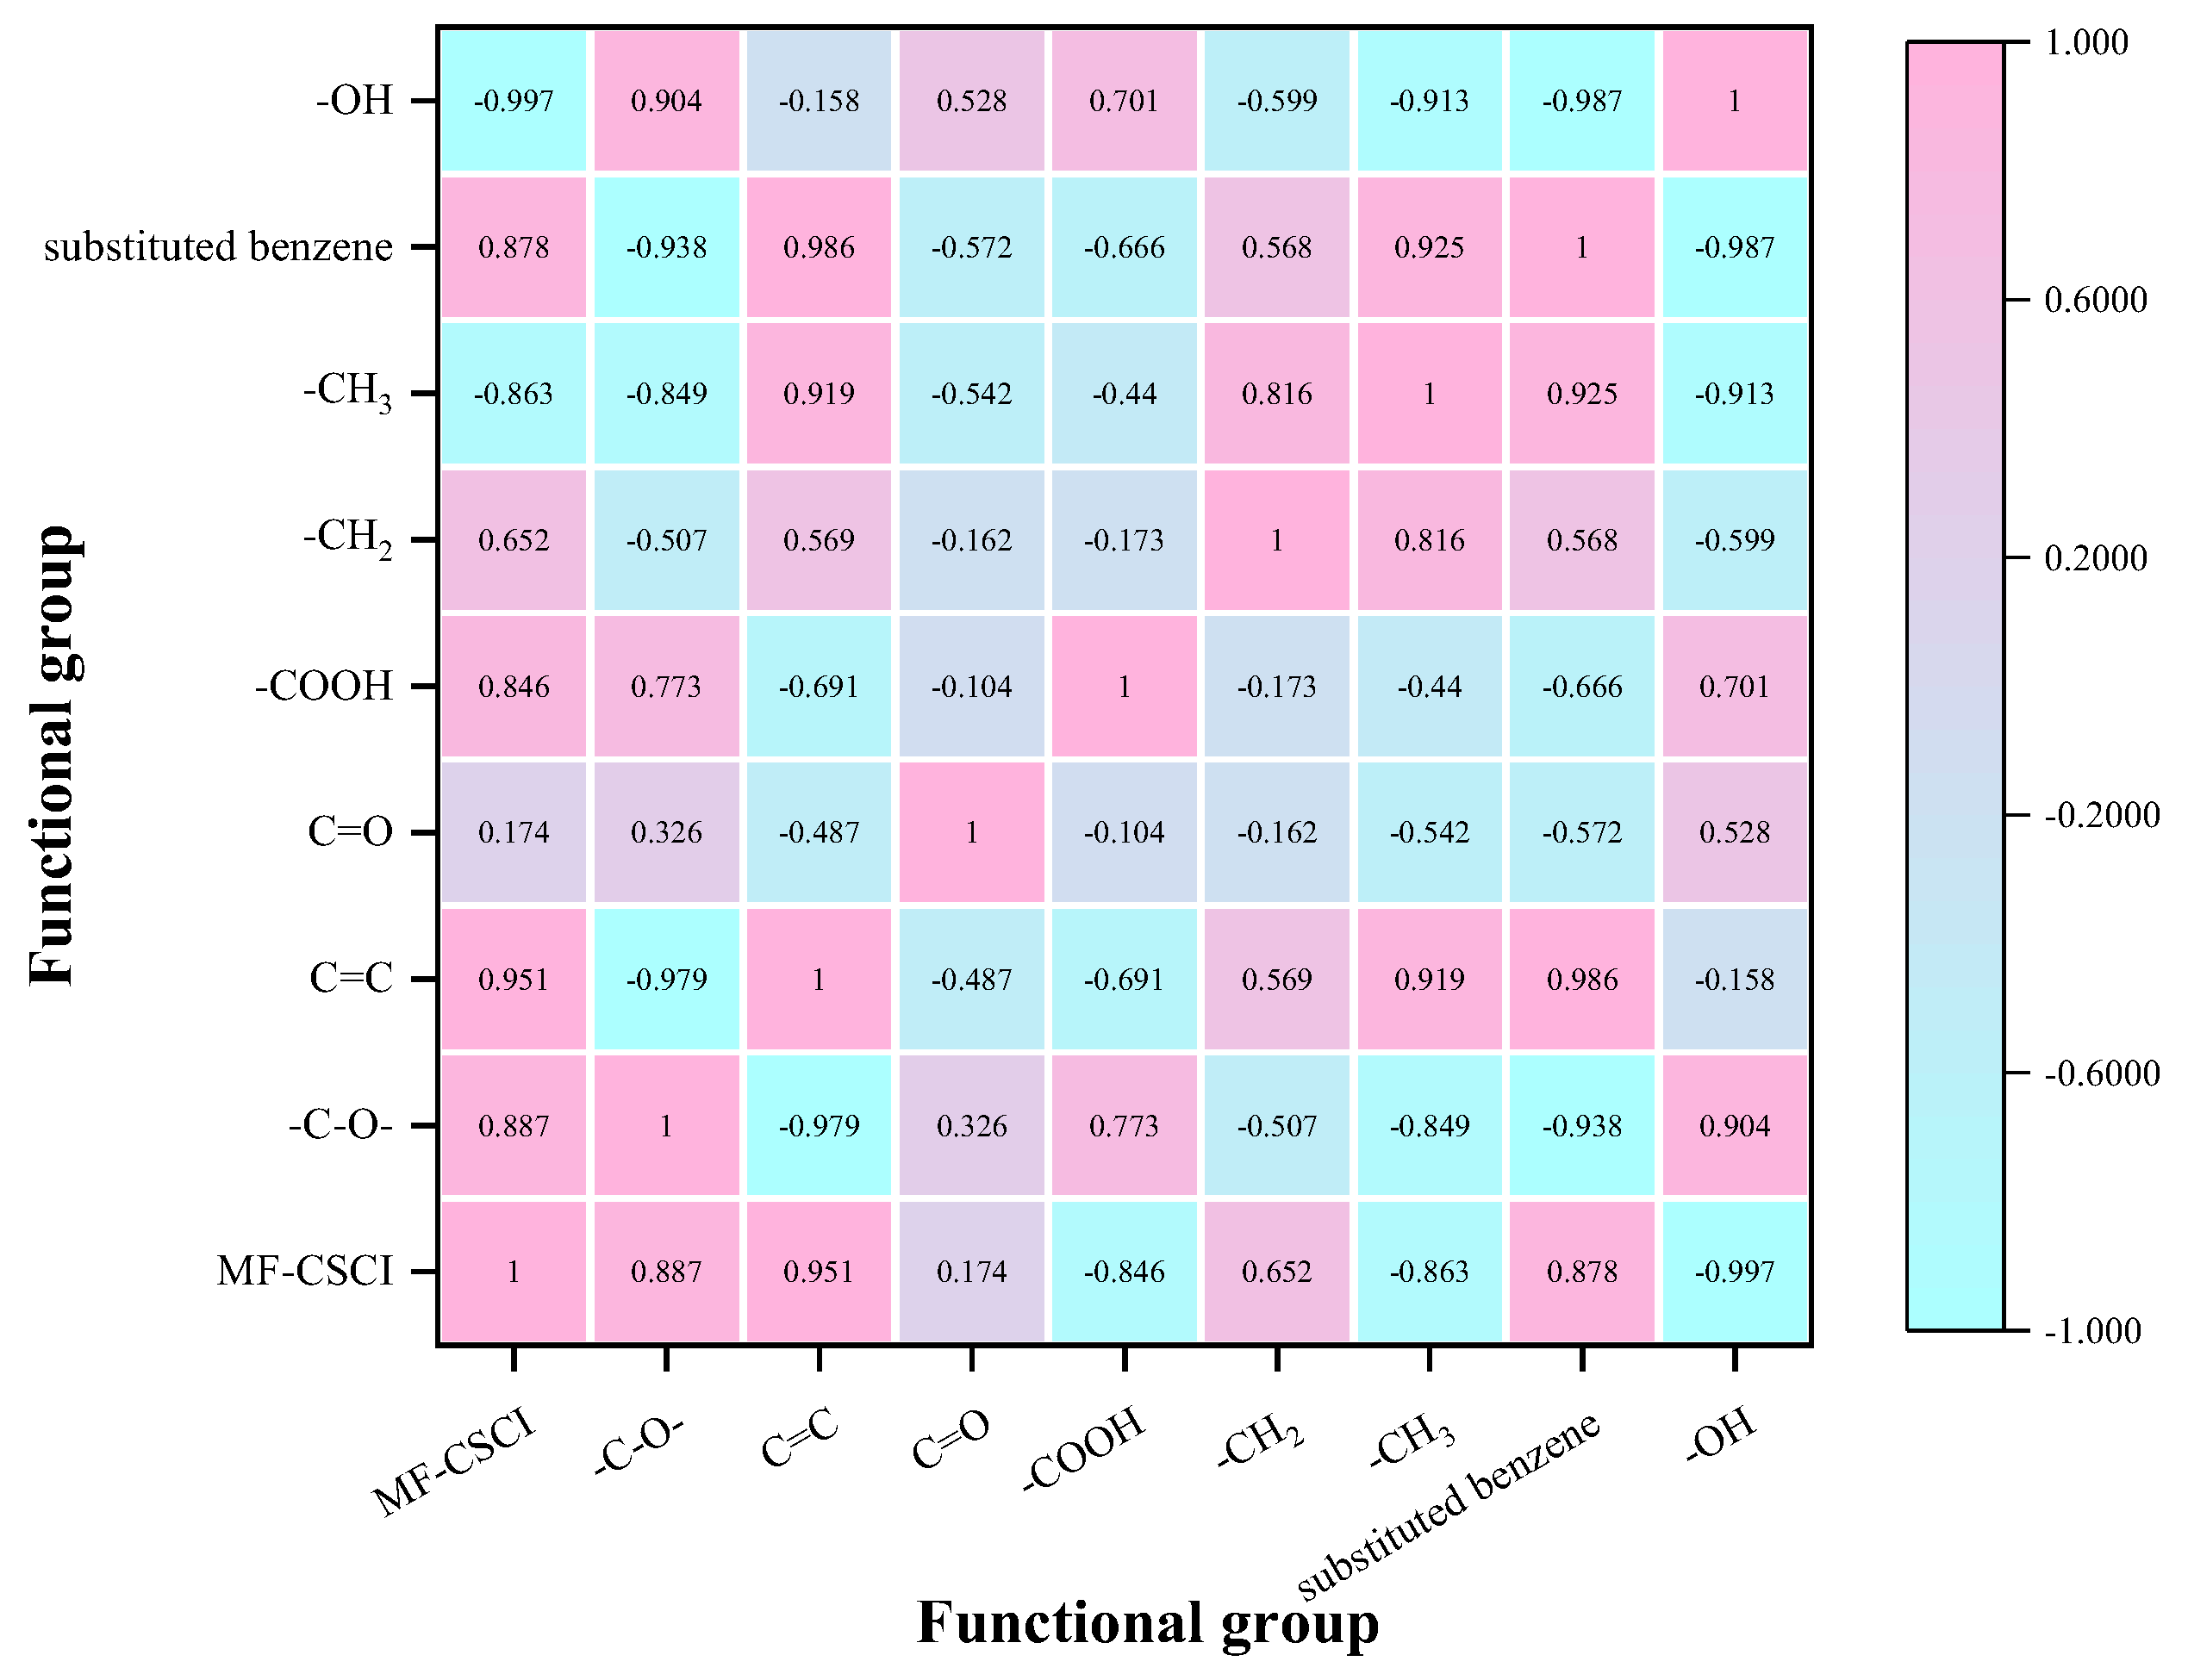
The analysis results show that the C=C group has a significant negative correlation with MF-CSCI (r ≈0.951), and this relationship can be attributed to the mechanism of “aromatic core stabilization – inhibition of early exothermic chain”: the aromatic core possesses high conjugation and electron delocalization characteristics, leading to a significant reduction in the probability of hydrogen abstraction and bond cleavage. At the low-temperature stage, it is difficult for the aromatic core to become a new active center, which suppresses the self-heating and oxidative exothermic processes, thereby resulting in a lower comprehensive spontaneous combustion tendency index. This is consistent with the experimental law that “aliphatic side chains oxidize first, while aromatic structures react later”.
In contrast, the −OH group exhibits a strong positive correlation with MF-CSCI (r≈-0.997), which can be explained by the mechanism of “polarized adsorption – free radical amplification”: the −OH group and its adjacent C−O sites significantly enhance molecular polarity and hydrogen bonding capacity, improving the chemical adsorption and activation level of oxygen molecules. Meanwhile, −OH can act as sites for chain initiation and chain transfer, promoting the cleavage of C−H and C−C bonds as well as the generation of oxygen-containing intermediates, inducing exothermic chain reactions and accelerating the macroscopic self-heating rate.
Under the same dataset, the C=C and −OH groups not only have the highest correlation strength but also opposite signs, representing the “skeletal stability dimension” and “polarity/adsorption-activation dimension” respectively. They can summarize the two key pathways of the early self-heating-exothermic chain at the two-dimensional level. Further considering redundancy and multicollinearity issues, a set of oxygen-containing features related to −OH (such as C−O, C=O, and −COOH) exhibit homologous evolution and information overlap, while the aromaticity indicators related to C=C are also highly collinear. Therefore, selecting these two groups as representative low-redundancy features not only improves model robustness but also conforms to the conventional practice in multi-index evaluation of “replacing highly correlated items of the same type with mechanism-representative items”.
3.3. Reliability Verification of Parameter Selection Based on Quantum Chemical Calculations
In this section, through DFT quantum chemical calculations, the core mechanism by which −OH and C=C regulate the coal spontaneous combustion reaction is revealed at the molecular level, providing theoretical support for the microscopic interpretation of the MD-CSEI model.
3.3.1. Computational Settings
All non-periodic calculations in this section were based on Density Functional Theory (DFT). Gaussian 16 software was used to perform optimization calculations on the established coal sample models and main components of the extractant. The B3LYP hybrid functional method was adopted as the calculation method, and the 6-311G(d) basis set was used as the calculation basis set. Frequency analysis was conducted using this calculation method and basis set, and after the completion of structural frequency optimization, the optimal molecular structures were obtained. Furthermore, Grimme’s D3(BJ) optimization method was employed to calculate the dispersion correction. Meanwhile, the stability of the Kohn-Sham determinant wavefunction in Density Functional Theory (DFT) was tested. If an unstable wavefunction was detected, the constraints were appropriately reduced, re-optimization was performed, and stability testing was repeated until a stable wavefunction was obtained. Finally, Multiwfn and VMD software were used to calculate and plot the electrostatic potential diagrams of the optimized molecular structures. The computational parameter settings are as follows: Job Type: Opt+Freq; Method: Ground State, DFT, Default Spin, B3LYP; Basis set: 6-311G(d) [27,28,29].
3.3.2. −OH Activation Mechanism
From the perspectives of molecular electronic properties and reaction energetics, it can be confirmed that −OH activates the early-stage reaction of coal spontaneous combustion through the pathway of its own H atom abstraction. As shown in Figure 13, the electron distribution characteristics of the −OH group provide a basis for its activation-promoting effect: due to the strong electronegativity of the O atom in −OH, the H atom directly bonded to it (denoted as H−OH) exhibits a positive charge (ESP (H−OH) ≈ +0.02 a.u.), while the O atom itself is in a negative region (ESP (O)≈−0.04 a.u.). The O2 molecule is a polar molecule (with the electron-rich O atom carrying a negative charge), and it will be directionally oriented toward the positive potential region of H−OH during the pre-adsorption stage, forming a stable pre-complex of “O2 (electron-rich end) → H−OH (positive end)”. This lays the spatial and material foundation for the subsequent H atom abstraction reaction.
Figure 13.
Electrostatic Potential Diagram of Molecules Containing Active −OH Groups(red: negative, ≈ -0.04 a.u.; green: positive, ≈ +0.02 a.u.).
Figure 13.
Electrostatic Potential Diagram of Molecules Containing Active −OH Groups(red: negative, ≈ -0.04 a.u.; green: positive, ≈ +0.02 a.u.).
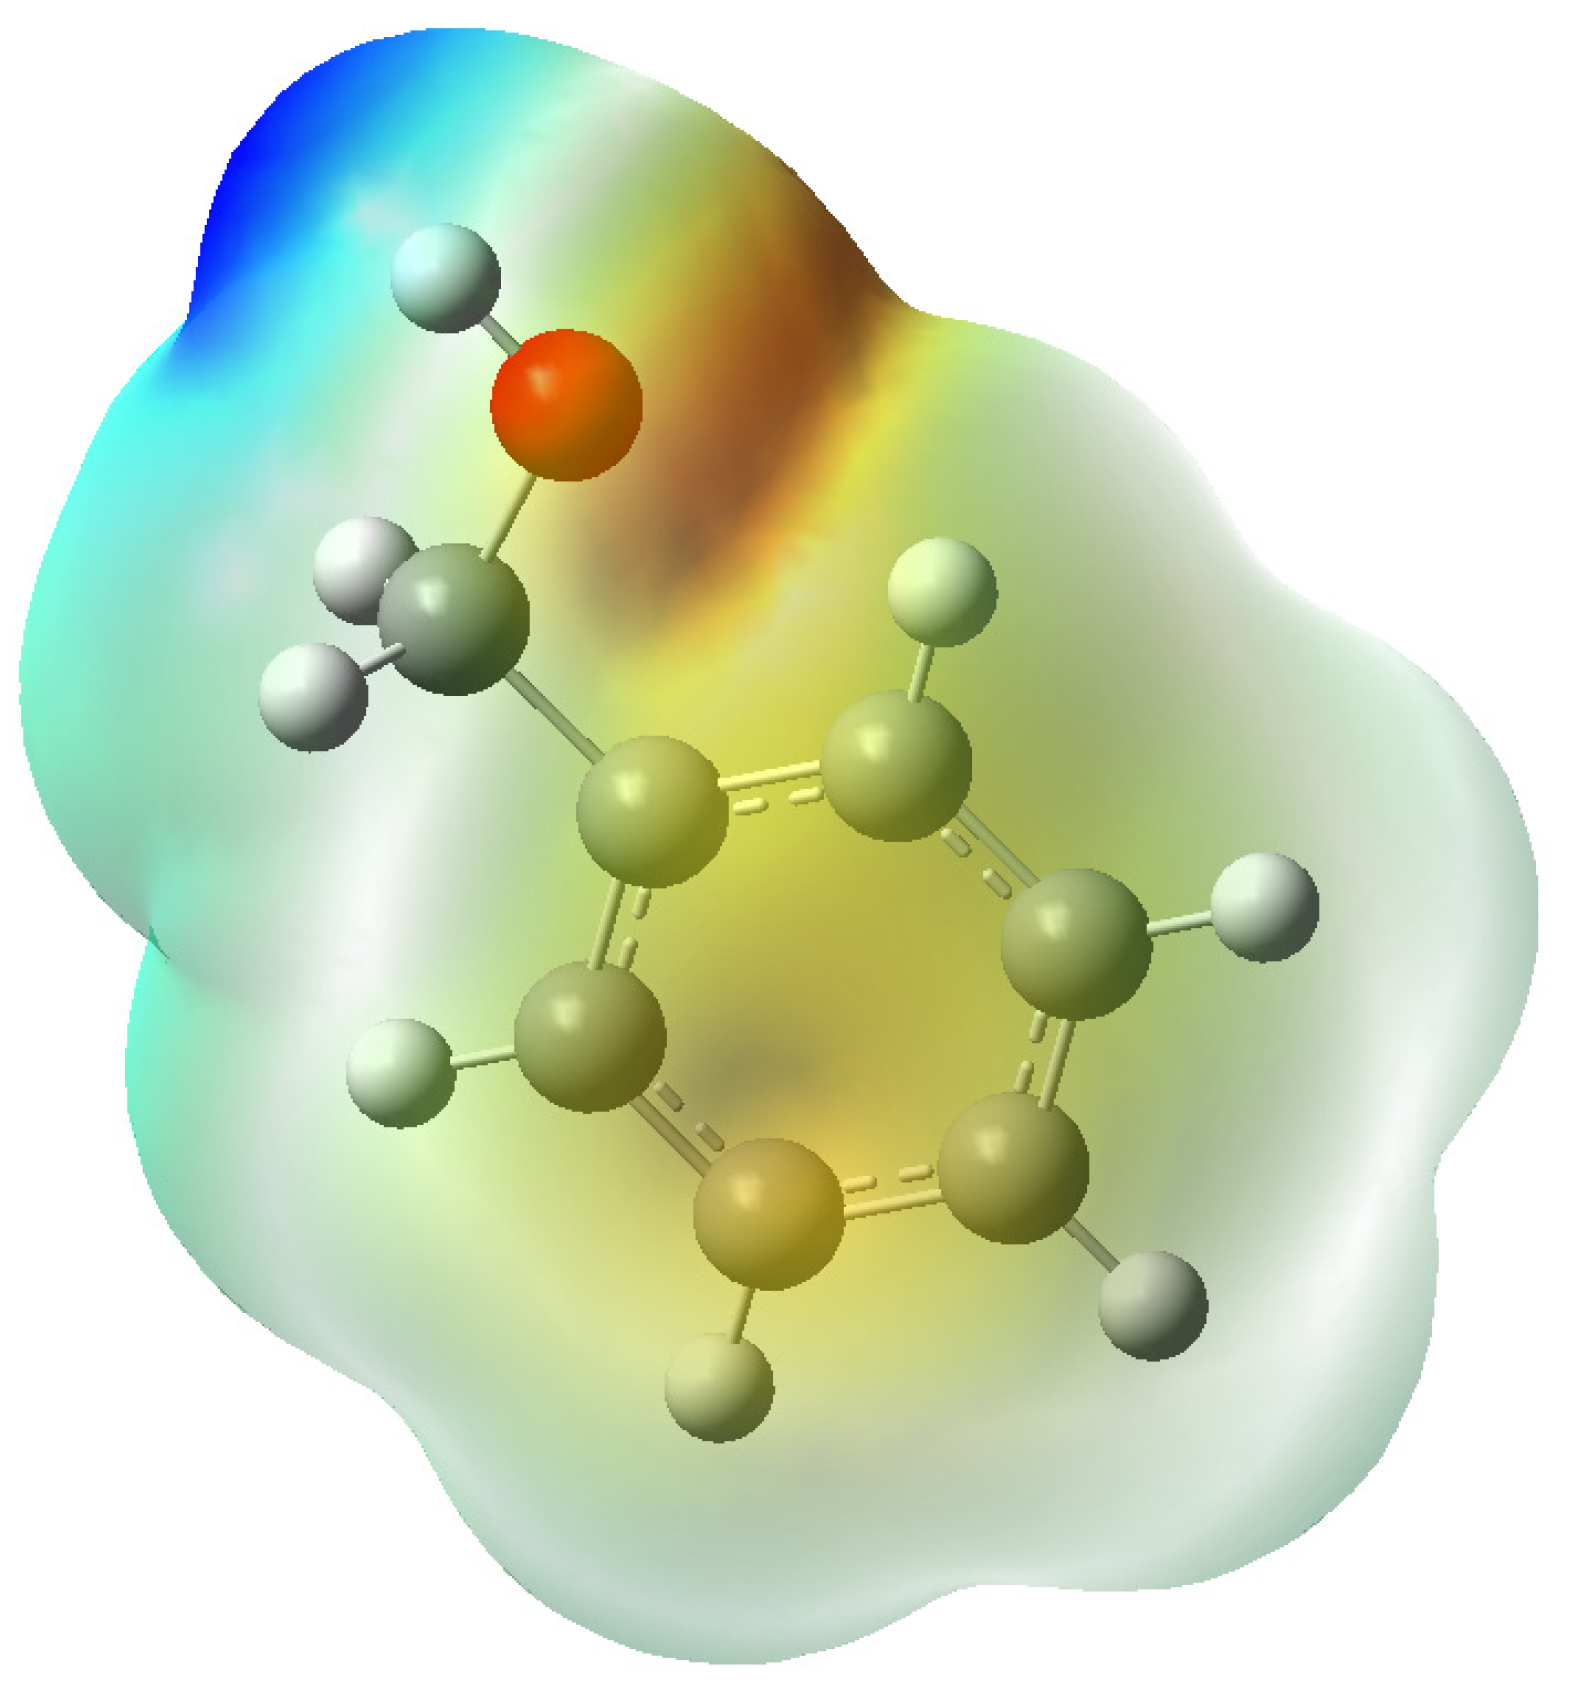
In summary, through the synergistic mechanism of “directed adsorption → electron transfer “, −OH significantly reduces the initiation difficulty of the early-stage coal spontaneous combustion reaction.It is thereby recognized as the key activating factor for the early reactions of coal spontaneous combustion.
3.3.3. C=C Inhibition Mechanism
The electrostatic potential distribution on the surface of the benzene ring where C=C is located is shown in Figure 14. It is approximately balanced with a typical range of −0.01 ~ +0.01 a.u., and there are no obvious positive and negative potential differences.
Figure 14.
Electrostatic Potential Diagram of Molecules Containing Aromatic Groups (red: negative, ≈ -0.01 a.u.; green: positive, ≈ +0.01 a.u.).
Figure 14.
Electrostatic Potential Diagram of Molecules Containing Aromatic Groups (red: negative, ≈ -0.01 a.u.; green: positive, ≈ +0.01 a.u.).
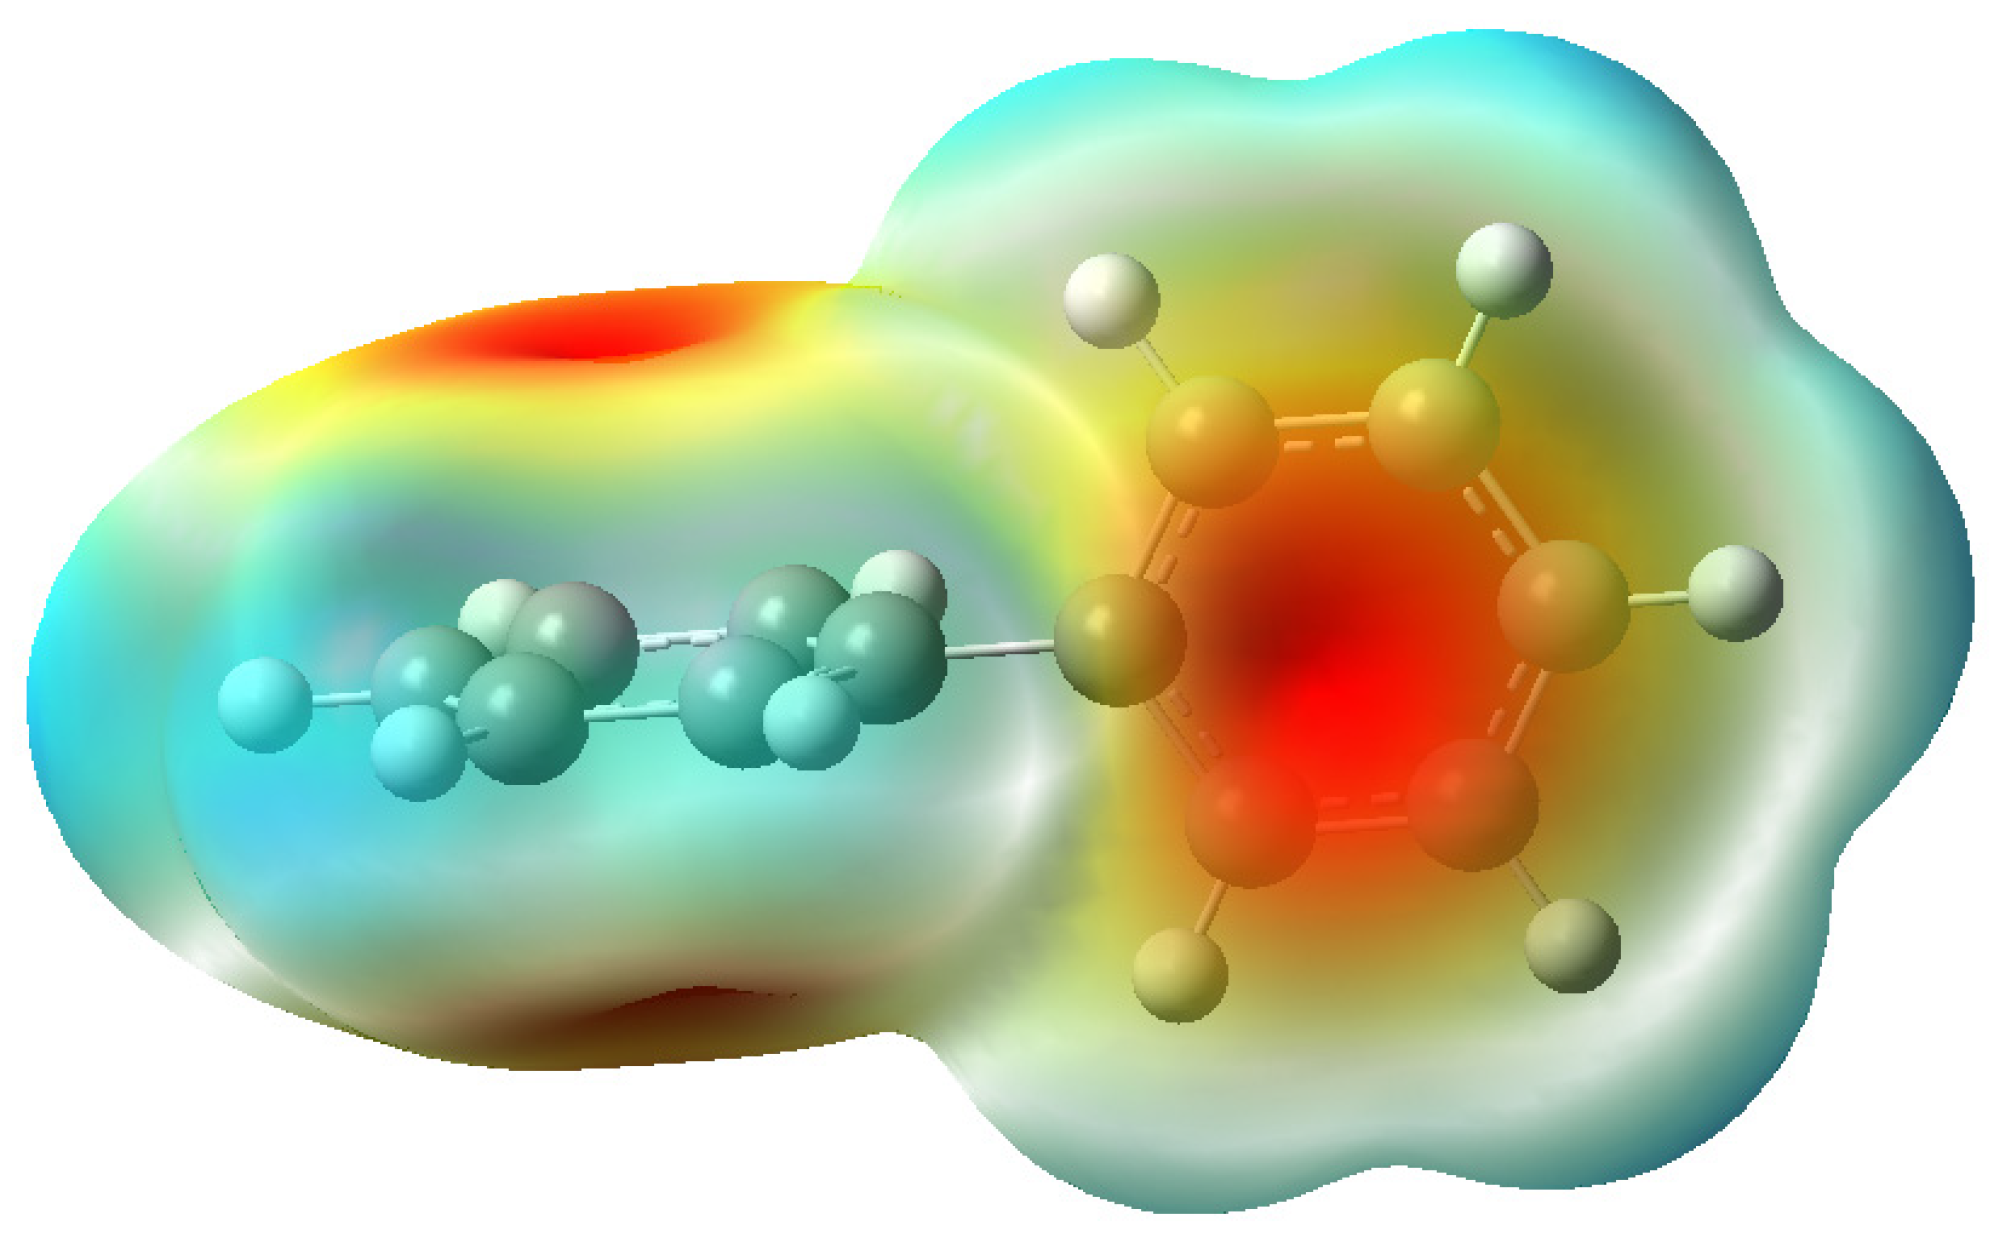
Unlike –OH, which can form polar sites with “negative charge on O atom — positive charge on H-OH” (−OH: ESP (H−OH) ≈ +0.02 a.u., ESP (O) ≈ −0.04 a.u.), the polar O2 molecule lacks “strong attractive sites” for directed adsorption.
During the pre-adsorption stage, it is difficult to form stable oriented complexes, and only reversible physical adsorption can occur. This is completely opposite to the activation-promoting characteristic of −OH, which rapidly forms stable pre-complexes through electrostatic attraction.
It thus weakens the initiation basis of the oxidation reaction from the “substance binding” link at the start of the reaction.
Aromatic compounds are difficult to react directly with oxygen. They need to be activated by hydroxyl radicals (·OH) first.Only when ·OH is generated in the system can it undergo an addition reaction with the aromatic ring (·OH + C6H6 → HO-C6H6), breaking the stable structure of the benzene ring. This creates conditions for the subsequent reaction with O2 (HO-C6H6 + O2 → products)Moreover, this activation process lacks the characteristic of strong exothermicity to drive the spontaneous acceleration of the reaction. Eventually, the reaction between aromatic compounds and O2 is difficult to initiate.
The comparison of molecular electronic properties confirms the differential regulation: –OH forms polar sites that facilitate directional oxygen adsorption and direct activation, whereas the balanced ESP of the aromatic ring containing C=C restricts such interactions. This difference between “active activation by –OH” and “passive restriction by C=C” supports the variable spontaneous combustion propensity observed across different coal ranks. This difference between “active activation by −OH” and “passive restriction by C=C” confirms the conclusion of differential regulation of coal spontaneous combustion by these two types of functional groups.
3.4. Construction of Essential Judgment Model Integrating Microstructure (MD-CSEI)
In this section, based on the key functional groups identified in the previous section −OH (positive) and C=C (negative)—the MD-CSEI model is constructed. It uses microstructural parameters to predict MF-CSCI, providing essential support for the determination of macroscopic spontaneous combustion tendency.
3.4.1. Variable Selection and Redundancy Handling
This study selects the content of C=C groups in the coal molecular skeleton as the negatively correlated parameter for the coal spontaneous combustion prediction model. The −OH group among oxygen-containing functional groups is chosen as the positively correlated parameter.
According to the principle of multiple linear regression, the model with two independent variables is defined as the following equation:
The estimation of regression coefficients was performed using the least squares formula. Regression fitting was conducted with IBM SPSS Statistics 27 software, yielding the regression equation of the Microstructure-Driven Dual-Factor Coupled Evaluation Model as shown in Equation (13) below:
In the equation:MD-CSEI refers to the predicted value of MF-CSEI (the multi-factor comprehensive index for coal spontaneous combustion tendency), and it is dimensionless; denotes the content of C=C groups in the microstructure, in %; represents the content of −OH groups in the microstructure, in %
It can be seen from the equation that an increase in −OH content reduces the MD-CSEI value, leading to an elevated coal spontaneous combustion risk. An increase in C=C content increases the MD-CSEI value, resulting in a decreased coal spontaneous combustion risk. This corresponds to the correlation between coal quality and spontaneous combustion tendency, indicating that the model is consistent with reality.
However, to align with the international standard system, the model is now multiplied by a coefficient of −1 and a constant of 25 is added. This adjustment makes the model’s variation trend such that the smaller the MD-CSEI value, the lower the spontaneous combustion tendency, with the value range falling within (0, 20). The final model is shown in Equation (14):
Along with the derivation of the preliminary regression equation, the corresponding analysis results are obtained. Statistical testing of the equation is required to determine the final regression equation.
It can be seen from Table 2 that the two independent variables—C=C groups and −OH groups—have all entered the model. No variables were removed during the process.
3.4.2. Regression Equation, Significance Test, and Goodness of Fit
It can be seen from Table 3 that the coefficient of determination reflects the fitting status of the model. The closer it is to 1, the more accurate the fitting effect.
The coefficient of determination R is 0.942, with R2 of 0.887 and adjusted R2 of 0.871—all are relatively high values. This indicates that the regression equation has a high fitting accuracy.
It can be seen from Table 4 that the model confirms that both of the two independent variables—C=C groups and −OH groups—have an impact on IDSP (multi-parameter fusion evaluation model for coal spontaneous combustion tendency).
The significance of the model is 0.042**, showing significance at the corresponding level. It rejects the null hypothesis that the regression coefficients are zero, thus the model meets the requirements.
4. Construction and Validation of Microstructure-Driven Essential Evaluation System for Coal Spontaneous Combustion Tendency
To further verify the reliability and universality of MD-CSEI, based on the original 10 cross-rank coal samples, 10 additional coal samples from different mining areas and ranks (covering lignite, bituminous coal, and anthracite) are added in this section. A validation dataset containing 20 coal samples is constructed.
The spontaneous combustion tendency grades of the 20 coal samples are calculated and classified using both the current national standard evaluation system and the essential evaluation system. Through consistency analysis of the determination results from the two systems, combined with the correlation between micro-mechanisms and macro-kinetics, the rationality of the essential evaluation system is systematically verified.
4.1. Construction of the Essential Evaluation System
By substituting the proportion data of –OH and C=C functional groups of different coal samples into Equation (14), it is found that the MD-CSEI values decrease with the rise of coal rank. All anthracite samples have an MD-CSEI value lower than 6.
This trend is consistent with the research results of the chromatographic oxygen absorption method, indicating that within a certain range of coal quality, the MD-CSEI value is negatively correlated with coal rank: the higher the coal rank, the lower the MD-CSEI value and the lower the spontaneous combustion tendency. Low-rank coal shows higher sensitivity to spontaneous combustion.
According to the National Standards of the People’s Republic of China, coal samples are classified into three categories based on spontaneous combustion tendency: “Prone to Spontaneous Combustion”, “Spontaneous Combustion”, and “Not Prone to Spontaneous Combustion”. Based on this standard framework, this study proposes a classification method based on the dual-factor coal spontaneous combustion tendency index, as detailed in Table 5.
4.2. Validation of the Essential Evaluation System
To ensure the cross-coal-rank representativeness and mining area coverage of the validation dataset, 10 additional coal samples were added to the original 10 samples. These new samples are: Zhundong Coal Mine (ZD, lignite), Yunnan Xiaolongtan Coal Mine (XLT, lignite), Shandong Yanzhou Coal Mine (YZ, gas coal), Anhui Huainan Coal Mine (HN, fat coal), Hebei Kailuan Coal Mine (KL, coking coal), Shanxi Jincheng Coal Mine (JC, lean coal), Guizhou Panjiang Coal Mine (PJ, meager coal), Shaanxi Huangling Coal Mine (HL, meager-lean coal), Sichuan Panzhihua Coal Mine (PZH, anthracite), and Gansu Huating Coal Mine (HT, anthracite).
Finally, a validation set of 20 coal samples was established, covering 4 lignite samples, 10 bituminous coal samples (including long-flame coal, gas coal, fat coal, coking coal, lean coal, meager coal), and 6 anthracite samples. It fully covers the main mined coal rank types in China.
For the above 20 coal samples, the spontaneous combustion tendency grades were calculated using two evaluation systems: the national standard evaluation system and the microstructure-driven essential evaluation system. The evaluation results of the two systems are shown in Figure 15.
Figure 15.
Comparison of Tendency Grades Between the National Standard Evaluation System (Chromatographic Oxygen Absorption Method) and the Microstructure-Driven Essential Evaluation System for 20 Coal Samples.
Figure 15.
Comparison of Tendency Grades Between the National Standard Evaluation System (Chromatographic Oxygen Absorption Method) and the Microstructure-Driven Essential Evaluation System for 20 Coal Samples.
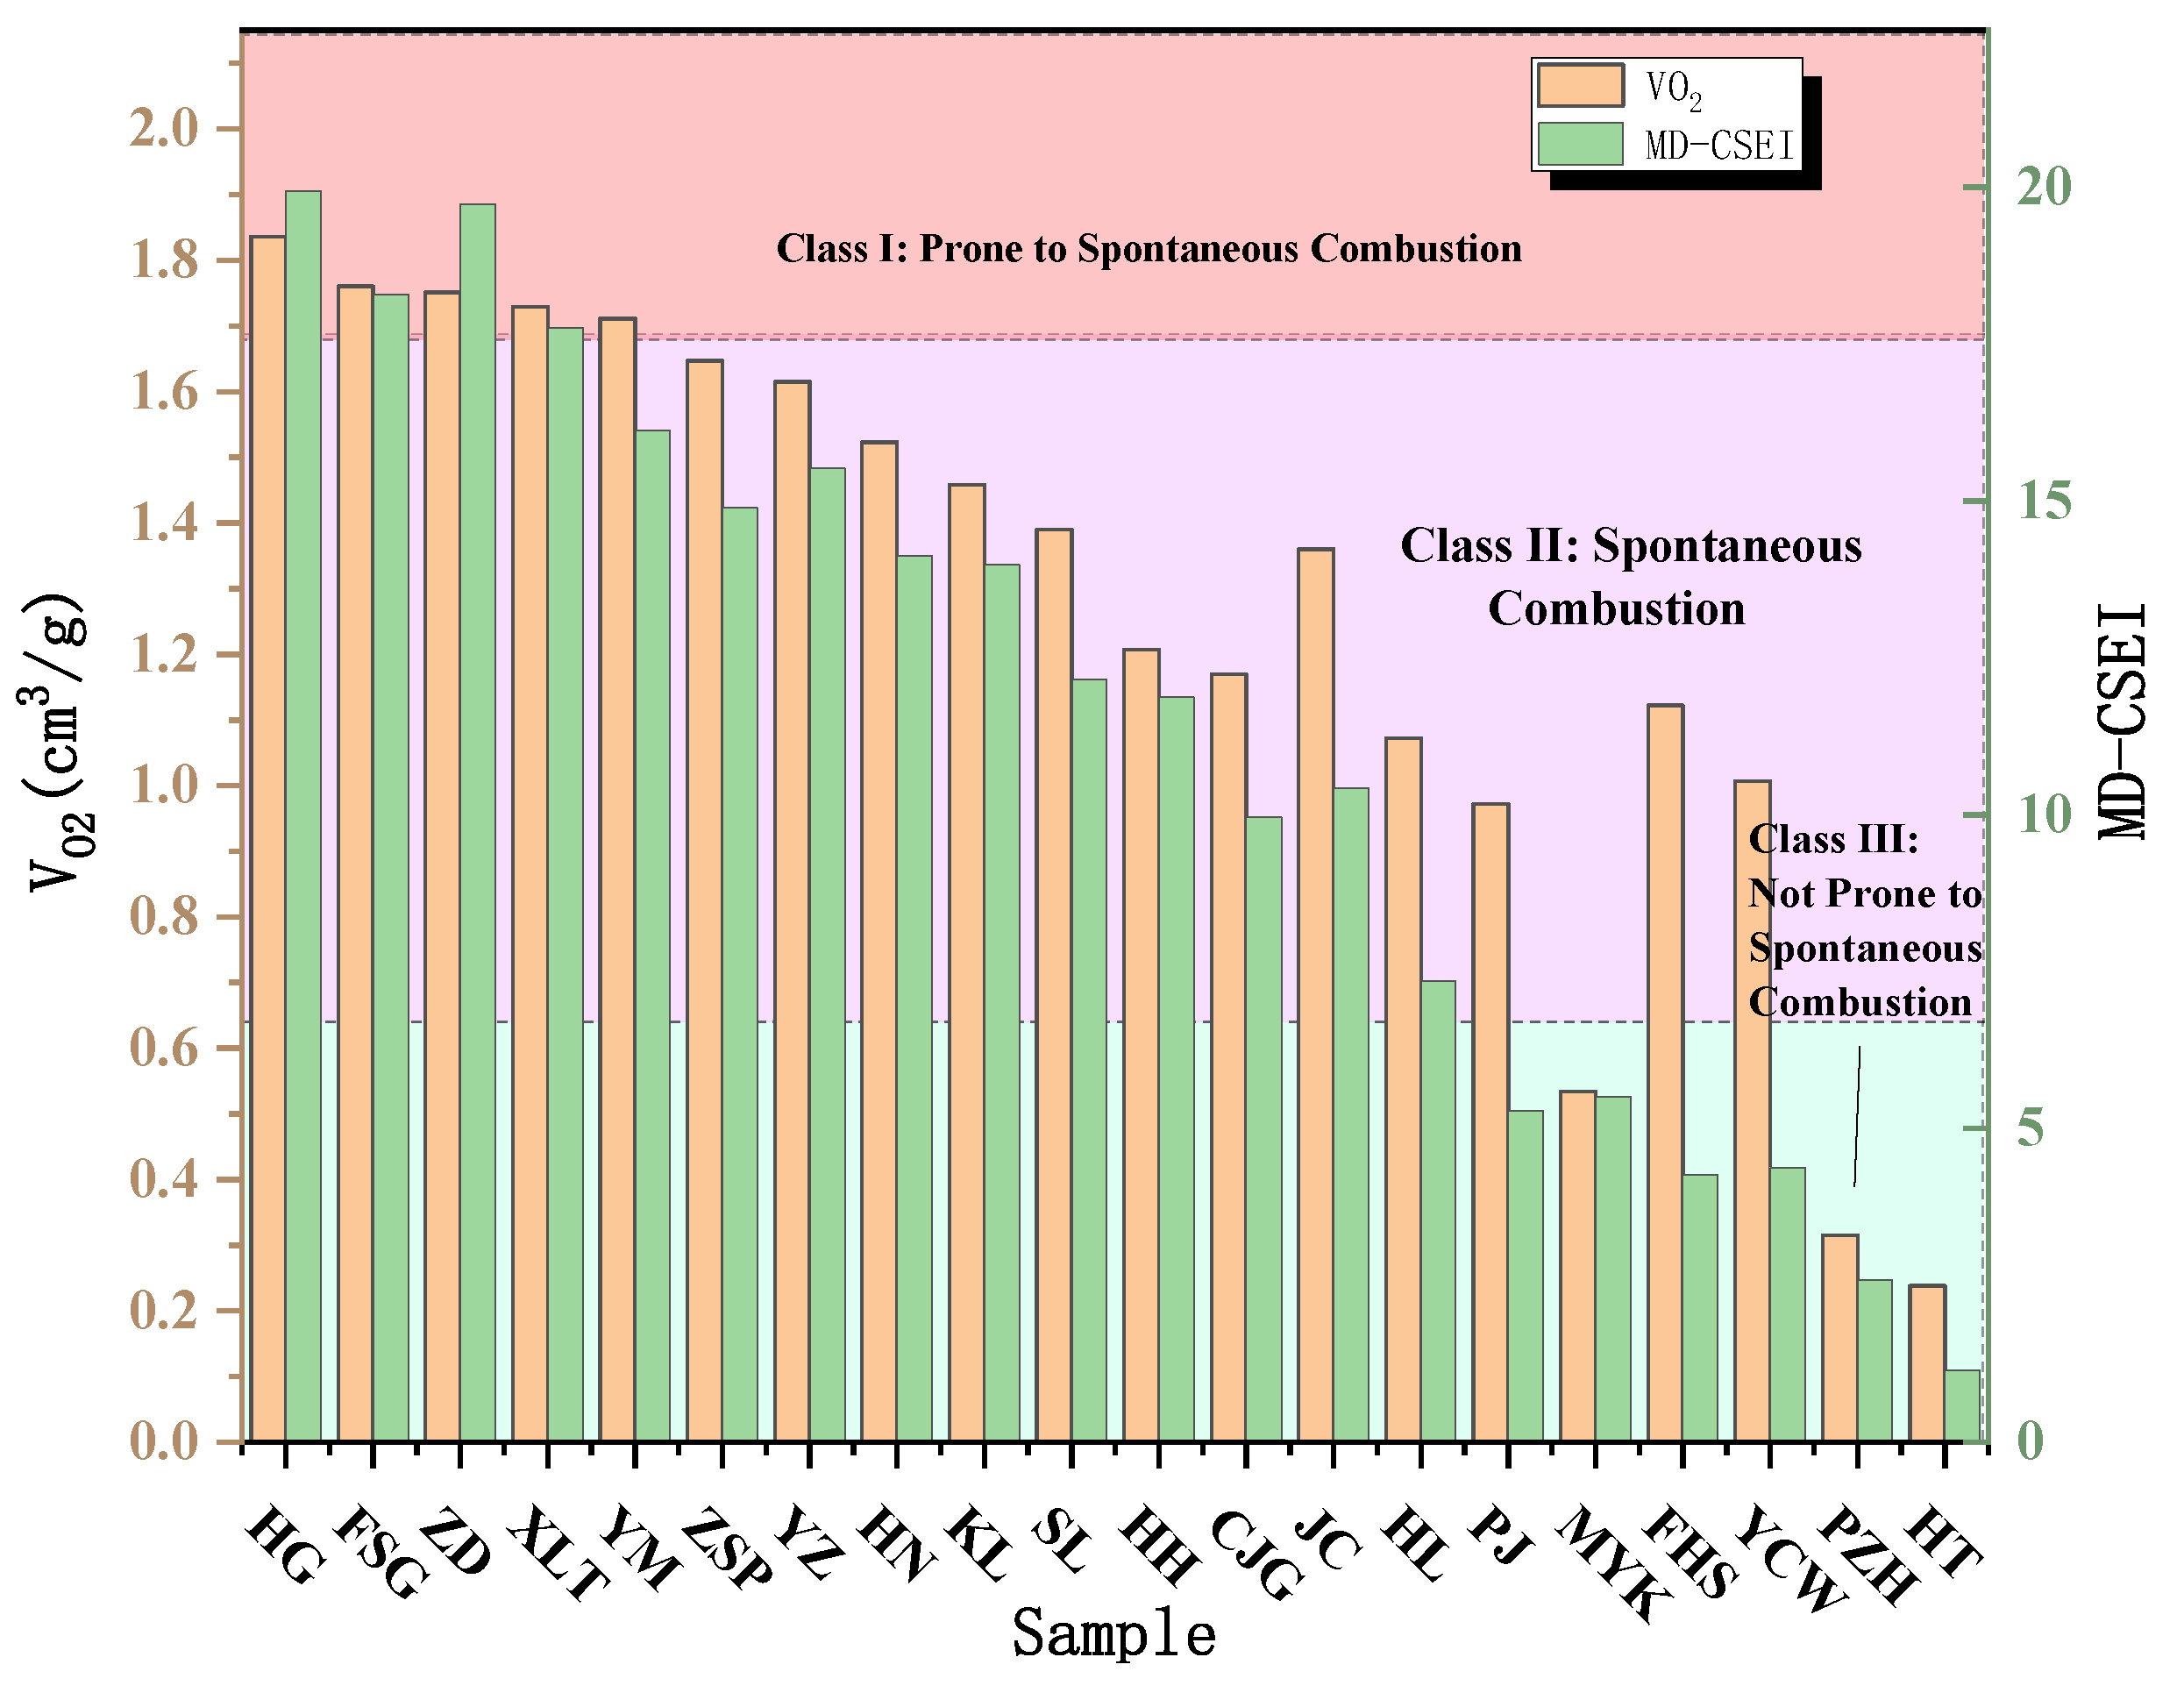
It can be seen from the table that the evaluation results of the 20 coal samples are completely consistent: all 4 lignite samples were classified as Class I (Highly Spontaneously Combustible), 10 bituminous coal samples as Class II (Moderately Spontaneously Combustible), and 6 anthracite samples as Class III (Non-Spontaneously Combustible). There were no grade deviations, directly verifying the accuracy of the essential evaluation system. Firstly, the core advantage of the MD-CSEI model in engineering practice lies in its significant improvement of assessment timeliness. Compared to the experimental cycles of traditional adiabatic oxidation or crossing point temperature methods, which often span several weeks, this model requires only the extraction of microscopic functional group characteristics of coal samples via Fourier Transform Infrared Spectroscopy FTIR to achieve precise classification of coal spontaneous combustion liability within minutes. Furthermore, this efficient detection capability provides coal mine site managers with the possibility of dynamically monitoring risks in the goaf. By periodically collecting coal samples from different mining horizons and inputting them into the model, the mining operators can timely adjust ventilation volumes, nitrogen injection intensity, or inhibitor spraying schemes based on fluctuations in MD-CSEI values, thereby achieving a transition in fire early warning from passive remediation to proactive and precise prevention. In summary, the application of this model will greatly optimize the allocation of fire prevention and extinguishing resources, reduce safety management costs, and provide decision support for the long-term safe production of coal mines.
5. Conclusions
1. Three core parameters from three stages were integrated: low-temperature adsorption (saturated oxygen adsorption capacity at 30°C), medium-temperature heat storage (average heating rate at 40~70°C), and high-temperature self-heating (fuel combustion characteristic index, FCC). Using the information entropy method for objective weighting (VO2: a=0.296; R70: b=0.292; FCC: c=0.412), a multi-factor comprehensive index for coal spontaneous combustion propensity (MF-CSCI) was established. This index effectively overcomes the shortcomings of single indicators (incomplete temperature range coverage and poor cross-coal rank comparability). HG lignite with low MF-CSCI (1) shows high spontaneous combustion propensity, while YCW anthracite with high MF-CSCI (7.98) exhibits low propensity. Its numerical variation correlates clearly with coal rank evolution and spontaneous combustion risk, providing a unified benchmark for quantitative evaluation of cross-coal rank spontaneous combustion propensity.
2. Key functional groups were screened via Fourier transform infrared spectroscopy (FTIR). A microscopically driven prediction model for spontaneous combustion propensity (MD-CSEI) was established, revealing the intrinsic regulatory mechanism of coal spontaneous combustion.Pearson correlation analysis showed a strong positive correlation between hydroxyl (−OH) and the multi-factor coupling index (MF-CSCI) (r≈-0.997), and a significant negative correlation between aromatic carbon-carbon double bond (C=C) and MF-CSCI (r≈−0.951). The MD-CSEI model achieved a goodness of fit of R2=0.863 (P=0.042), verifying its accurate prediction ability for macro spontaneous combustion propensity. Density functional theory (DFT) calculations further confirmed the differential regulatory effects of the two functional groups. −OH drives the directional adsorption of O2 by forming polar sites (surface electrostatic potential ESP of H−OH ≈ +0.02 a.u.). The hydrogen abstraction reaction dominated by –OH exhibits significant exothermic characteristics and facilitates the formation of active radicals, making it the core activation factor. In contrast, the benzene ring containing C=C possesses a stable and balanced ESP distribution, acting as an inhibitor that restricts the initiation of the oxidation chain. This explains the root cause of differences in spontaneous combustion propensity among coal samples of different ranks at the molecular level.
3. A closed-loop intrinsic evaluation system for coal spontaneous combustion propensity was established, integrating coal’s macro/micro characteristics and molecular DFT (mechanism support).Verification with 20 cross-coal rank samples (4 lignites, 10 bituminous coals, 6 anthracites) showed full consistency with the national standard (GB/T 20104-2006, chromatographic oxygen absorption method). All 4 lignites were classified as Class I (easy to spontaneously combust, MD-CSEI≥17.76), 10 bituminous coals as Class II (spontaneously combustible, 5.71≤MD-CSEI≤17.76), and 6 anthracites as Class III (not easy to spontaneously combust, MD-CSEI≤5.71). This system avoids the shortcomings of traditional methods (reliance on complex experiments and long evaluation cycles) and provides theoretical support for targeted fire prevention strategies (e.g., inhibiting −OH activity, enhancing aromatic structure stability). It has significant engineering application value.
Author Contributions
Kexin Liu: Writing – review & editing, Writing – original draft, Validation, Supervision, Methodology, Formal analysis. Yutao Zhang: Writing – review & editing, Supervision, Investigation, Funding acquisition, Conceptualization. Jun Deng: Funding acquisition, Data curation, Conceptualization. Yaqing Li: Writing – review & editing, Validation, Formal analysis, Conceptualization.
Funding
The research received funding from the Shaanxi Provincial Outstanding Youth Science Foundation Program (Grant No. 2025JC-JCQN-024), the Natural Science Basic Research Program of Shaanxi (No. 2025JC-YBQN-467), the Postdoctoral Fellowship Program (Grade C) of CPSF (No. GZC20232138), the China Postdoctoral Science Foundation (No. 2023M742817), and the Shaanxi Postdoctoral Science Foundation (No. 2023BSHEDZZ299).
Institutional Review Board Statement
Not applicable.
Informed Consent Statement
Not applicable.
Data Availability Statement
The raw data supporting the conclusions of this article will be made available by the authors on request.
Conflicts of Interest
The authors declare no conflicts of interest. The funders had no role in the design of the study; in the collection, analyses, or interpretation of data; in the writing of the manuscript; or in the decision to publish the results.
Abbreviations
The following abbreviations are used in this manuscript:
| AHR | Average Heating Rate |
| CPT | Cross Point Temperature |
| FCC | Fuel Combustion Characteristic index |
| MF-CSCI | Multi-Factor Comprehensive Spontaneous Combustion Index |
| MD-CSEI | Microscopic-Driven Coal Spontaneous Combustion Essential Identification Model |
| R70 | Average heating rate from 40−70°C |
| VO2 | saturated oxygen adsorption capacity |
| DFT | Density Functional Theory |
| ESR | Electron Spin Resonance |
| FTIR | Fourier Transform Infrared Spectroscopy |
| TCD | Thermal Conductivity Detector |
| ESP | Electrostatic Potential |
References
- Song, S.; Qin, B.; Xin, H.; Qin, X.; Chen, K. Exploring effect of water immersion on the structure and low-temperature oxidation of coal: A case study of Shendong long flame coal, China. Fuel 2018, 234, 732–737. [Google Scholar] [CrossRef]
- Anghelescu, L. Advances in detection and monitoring of coal spontaneous combustion. Fire 2024, 7(10), 354. [Google Scholar] [CrossRef]
- Liang, Y.; Yang, Y.; Guo, S.; Tian, F.; Wang, S. Combustion mechanism and control approaches of underground coal fires: a review. Int. J. Coal Sci. Technol. 2023, 10, 24. [Google Scholar] [CrossRef]
- Xu, X.; Zhang, F. Evaluation and Optimization of Multi-Parameter Prediction Index for Coal Spontaneous Combustion Combined with Temperature Programmed Experiment. Fire 2023, 6(9), 368. [Google Scholar] [CrossRef]
- Onifade, M.; Genc, B. Spontaneous combustion liability of coal and coal-shale: a review of prediction methods. Int. J. Coal Sci. Technol. 2019, 6, 151–168. [Google Scholar] [CrossRef]
- Tan, B.; Cheng, G.; Zhu, X.; Yang, X. Experimental Study on the Physisorption Characteristics of O2 in Coal Powder are Effected by Coal Nanopore Structure. Sci. Rep. 2020, 10, 6946. [Google Scholar] [CrossRef]
- Zhou, B.; Yang, S.; Jiang, X.; Song, W. Experimental study on oxygen adsorption capacity and oxidation characteristics of coal samples with different particle sizes. Fuel 2023, 331, 125954. [Google Scholar] [CrossRef]
- Chen, X.D.; Chong, L.V. Several Important Issues Related to the Crossing-Point Temperature (CPT) Method for Measuring Self-Ignition Kinetics of Combustible Solids. Process Saf. Environ. Prot. 1998, 76, 90–93. [Google Scholar] [CrossRef]
- Sher, K. Hazardous Use Should Not Be a Diagnostic Criterion for Substance Use Disorders in DSM-5. J. Stud. Alcohol Drugs 2011, 72, 685. [Google Scholar] [CrossRef]
- Gbadamosi, A.R.; Onifade, M.; Genc, B.; Rupprecht, S. Analysis of spontaneous combustion liability indices and coal recording standards/basis. Int. J. Min. Sci. Technol. 2020, 30, 723–736. [Google Scholar] [CrossRef]
- Gao, D.; Guo, L.; Wang, F.; Zhang, Z. Study on the Spontaneous Combustion Tendency of Coal Based on Grey Relational and Multiple Regression Analysis. ACS Omega 2021, 6(10), 6736–6746. [Google Scholar] [CrossRef] [PubMed]
- Slopiecka, K.; Bartocci, P.; Fantozzi, F. Thermogravimetric analysis and kinetic study of poplar wood pyrolysis. Appl. Energy 2012, 97, 491–497. [Google Scholar] [CrossRef]
- Gbadamosi, A.R.; Onifade, M.; Genc, B.; Rupprecht, S. Analysis of spontaneous combustion liability indices and coal recording standards/basis. Int. J. Min. Sci. Technol. 2020, 30, 723–736. [Google Scholar] [CrossRef]
- Bao, R.; Lei, C.; Wang, C.; Zhou, F. Thermal Reaction Process and Thermokinetic Characteristics of Coking Coal Oxidation. Fire 2024, 7(12), 448. [Google Scholar] [CrossRef]
- Hower, J. C.; Mastalerz, M. Funginite-resinite associations in coal and implications for spontaneous combustion. International Journal of Coal Geolog 2010, 82(4), 260–270. [Google Scholar]
- Yoshiie, R.; Onda, M.; Ueki, Y.; Naruse, I. Oxygen chemisorption and low-temperature oxidation behaviors of sub-bituminous coal. Journal of Thermal Science and Technology 2019, 14(1), 00514. [Google Scholar] [CrossRef]
- Yoshiie, R.; Onda, M.; Ueki, Y.; Naruse, I. Oxygen chemisorption and low-temperature oxidation behaviors of sub-bituminous coal Thermochim. Journal of Thermal Science and Technology 2019, 14(1), 00514. [Google Scholar] [CrossRef]
- Anghelescu, L.; Diaconu, B. M. Advances in Detection and Monitoring of Coal Spontaneous Combustion: Techniques, Challenges, and Future Directions. Fire 2024, 7(10), 354. [Google Scholar] [CrossRef]
- Zhang, Y.; Luo, Y. Quantification of Heat of Wetting Effect on Low-Rank Coal’s Self-heating Process. Mining, Metallurgy & Exploration 2023, 40, 181–189. [Google Scholar]
- Arisoy, A. Reaction kinetics of coal oxidation at low temperatures. Fuel 2015, 159, 344–354. [Google Scholar] [CrossRef]
- Kim, J.; Lee, Y.; Ryu, C.; Park, H.; Lim, H. Low-temperature reactivity of coals for evaluation of spontaneous combustion propensity. Korean J. Chem. Eng. 2015, 32, 1297–1304. [Google Scholar] [CrossRef]
- Hamdani, A. H. The spontaneous combustion potency of lignite coal: Functional group characterization using FTIR. European Journal of Geosciences 2022. [Google Scholar]
- Lee, D. G.; Park, K.-H.; Jeon, C. H. Low-temperature oxidation reactivity of low-rank coals and their petrographic properties. Fuel Process. ACS Omega 2020, 5(27), 16843–16851. [Google Scholar] [CrossRef]
- Salmon, E.; Behar, F.; Lorant, F.; Hatcher, P. G.; Marquaire, P. M. Early maturation processes in coal. Part 1: Pyrolysis mass balance and structural evolution of coalified wood from the Morwell Brown Coal seam. Combust. Organic Geochemistry 2009, 40(4), 500–509. [Google Scholar] [CrossRef]
- Ma, T.; Chen, X.; Zhai, X.; Bai, Y. Thermogravimetric and infrared spectroscopic studies of the spontaneous combustion characteristics of different pre-oxidized lignites. RSC Adv. 2019, 9, 32476–32489. [Google Scholar] [CrossRef] [PubMed]
- Ugwumadu, C.; Olson, R., III; Smith, N. L.; Nepal, K.; Al-Majali, Y.; Trembly, J.; Drabold, D. A. Computer simulation of carbonization and graphitization of coal. arXiv 2023, 2308.16091. [Google Scholar] [CrossRef] [PubMed]
- Salmon, E.; Behar, F.; Lorant, F.; Hatcher, P. G.; Marquaire, P. M. Early maturation processes in coal. Part 1: Pyrolysis mass balances and structural evolution of coalified wood from the Morwell Brown Coal seam. arXiv 2009, 0903.4986. [Google Scholar] [CrossRef]
- Zhang, L.; Han, Y.; Xu, D.; Jiang, Q.; Xin, H.; Fu, C.; He, W. Study on the Reaction Path of -CH3 and -CHO Functional Groups during Coal Spontaneous Combustion: Quantum Chemistry and Experimental Research. Energies 2022, 15(13), 4891. [Google Scholar] [CrossRef]
Figure 1.
Industrial analysis and elemental analysis of coal-like material.
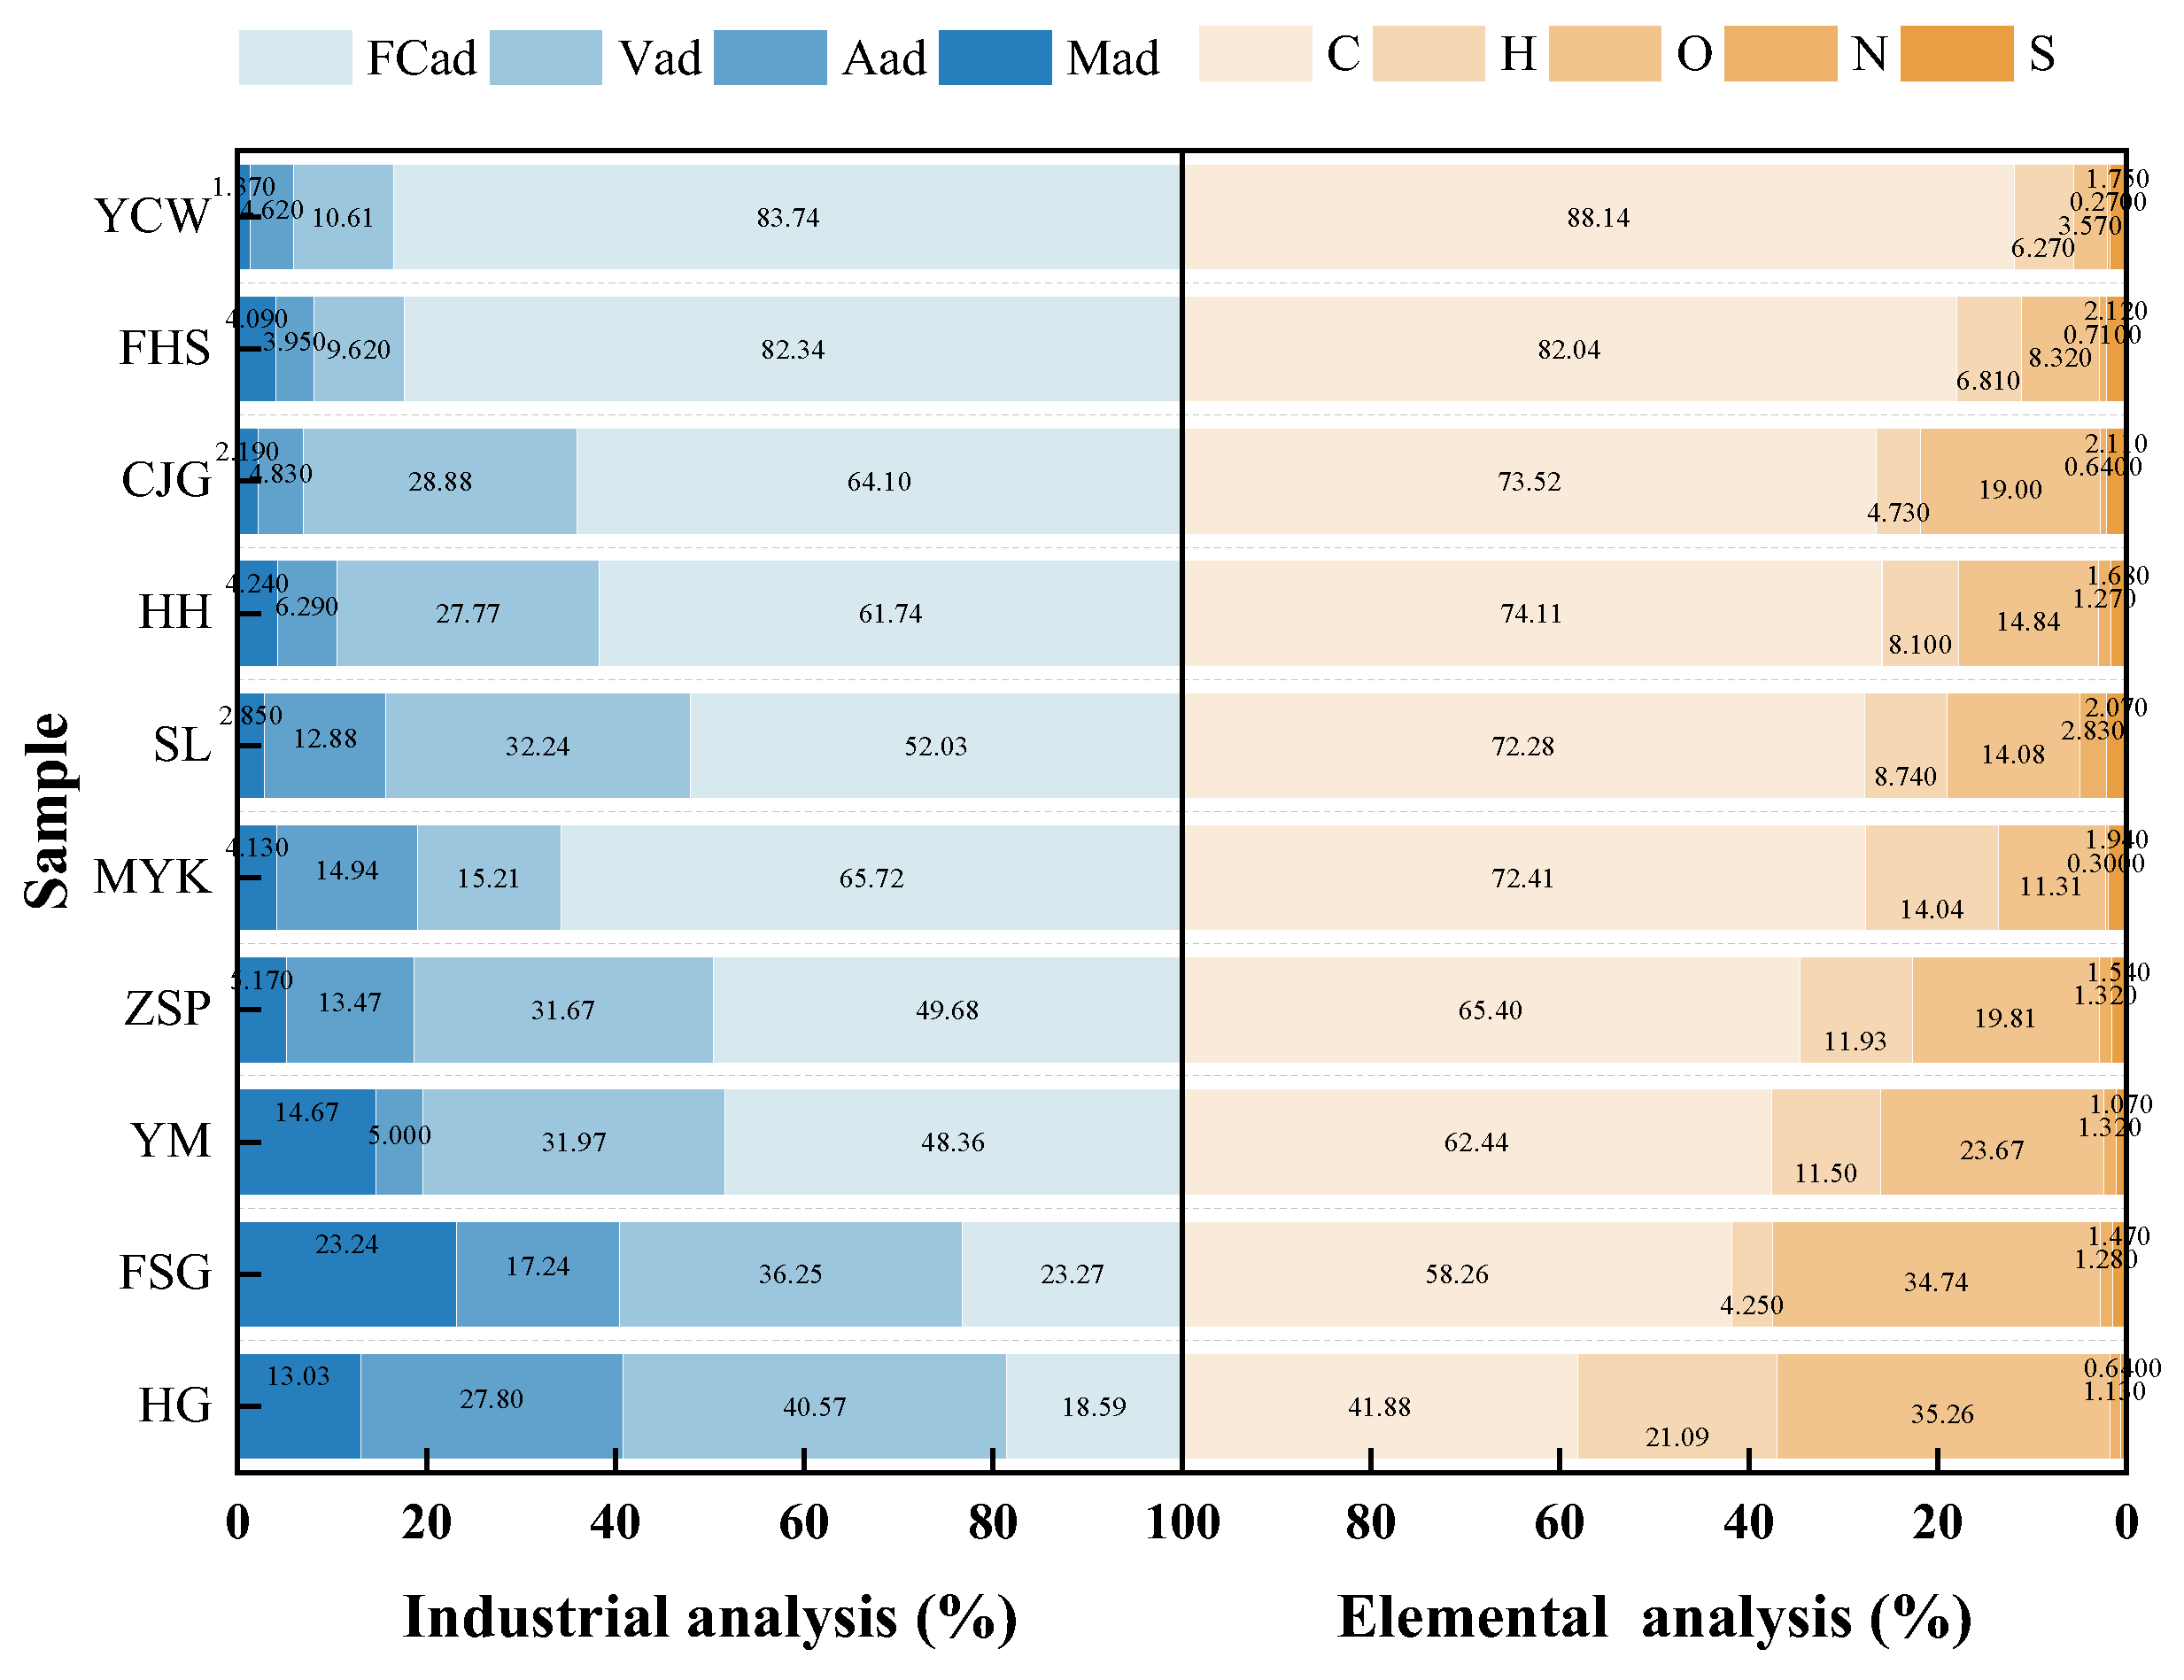

Table 1.
Values of VO2, R70, FCC, and MF-CSCI for each coal sample.
| Sample | VO2 | R70 | FCC | MF-CSCI |
|---|---|---|---|---|
| HG | 1.73 | 11.2 | 11.36 | 1.00 |
| FSG | 1.42 | 7.24 | 10.70 | 2.36 |
| YM | 0.75 | 6.15 | 10.06 | 3.74 |
| ZSP | 0.68 | 4.89 | 9.93 | 4.13 |
| MYK | 0.64 | 3.76 | 8.27 | 5.53 |
| SL | 0.61 | 2.08 | 7.39 | 6.38 |
| HH | 0.56 | 1.81 | 6.16 | 7.13 |
| CJG | 0.56 | 1.27 | 5.62 | 7.54 |
| FHS | 0.76 | 0.76 | 4.36 | 7.76 |
| YCW | 0.82 | 0.49 | 3.57 | 7.98 |
Table 2.
Entered/Removed Variables.
| Entered Variables | Removed Variables | Method |
|---|---|---|
| φC=C; φ–OH | None | Entered |
Table 3.
Summary of Model Parameters.
| Fitted Curve | R | R2 | Adjusted R2 |
|---|---|---|---|
| 0.942 | 0.887 | 0.871 |
Table 4.
ANOVA.
| Sum of Squares | Degrees of Freedom | Mean Square | Regression | |
|---|---|---|---|---|
| Regression | 32.056 | 2 | 16.02 | 0.042** |
| Residual | 0.182 | 2 | 0.091 | |
| Total | 32.238 | 4 |
Table 5.
Microstructure-Driven Classification Standard for Coal Spontaneous Combustion Tendency.
| Spontaneous Combustion Category | Tendency Grade | MD-CSEI |
|---|---|---|
| Class I | Highly Spontaneously Combustible | 17.76≤ MD-CSEI |
| Class II | Moderately Spontaneously Combustible | 5.71≤ MD-CSEI ≤17.76 |
| Class III | Non-Spontaneously Combustible | MD-CSEI ≤5.71 |
Disclaimer/Publisher’s Note: The statements, opinions and data contained in all publications are solely those of the individual author(s) and contributor(s) and not of MDPI and/or the editor(s). MDPI and/or the editor(s) disclaim responsibility for any injury to people or property resulting from any ideas, methods, instructions or products referred to in the content. |
© 2026 by the authors. Licensee MDPI, Basel, Switzerland. This article is an open access article distributed under the terms and conditions of the Creative Commons Attribution (CC BY) license.
Copyright: This open access article is published under a Creative Commons CC BY 4.0 license, which permit the free download, distribution, and reuse, provided that the author and preprint are cited in any reuse.


