
Submitted:
19 January 2026
Posted:
20 January 2026
You are already at the latest version
Abstract
This study examined the association between dietary acid load (DAL) and metabolic syndrome (MetS)-related parameters in Korean adults undergoing eating habit modi-fication. Methods: Forty-eight Korean adults (≥19 years) with at least one MetS risk factor were recruited via public advertisement. Anthropometric and biochemical pa-rameters, Nutrition Quotient (NQ) scores, and nutrient intake were assessed. DAL was calculated and expressed as potential renal acid load (PRAL) and net endogenous acid production (NEAP). Results: A total of 40 participants completed the 8-week interven-tion. After the intervention, overall improvements were observed in NQ, body compo-sition (body weight, body mass index, and body fat percentage), blood pressure, and glycemic parameters. At baseline, DAL scores were not significantly associated with body composition or glycemic indices. After the intervention, however, these parame-ters showed significant associations with DAL, which were more pronounced when DAL was expressed as NEAP rather than PRAL. Conclusion: Eating habit modification may alter DAL in daily life and is associated with meaningful changes in body compo-sition and other metabolic parameters among Korean adults. NEAP appears to be a more relevant indicator of DAL than PRAL.
Keywords:
dietary acid load
; metabolic syndrome
; body composition
; eating habit modification
; nutrition quotient
; potential renal acid load
; net endogenous acid production
1. Introduction
Over the past two decades, the prevalence of metabolic syndrome (MetS) and obesity has increased worldwide, including in Korea [1,2,3,4]. Obesity and MetS contribute substantially to morbidity and mortality, and the proportion of deaths attributable to obesity-related conditions continues to rise in many regions. In Korea, where Westernized dietary patterns have become increasingly common, obesity-related health burdens have also grown considerably [1,2,3,4].
MetS is defined by the presence of three or more of the following components: elevated waist circumference (WC), elevated triglycerides (TG), reduced high-density lipoprotein cholesterol (HDL-C), elevated blood pressure (BP), and elevated fasting glucose [5]. Both obesity and MetS increase the risk of major chronic diseases, including cardiovascular disease, type 2 diabetes, hypertension, certain cancers, and chronic kidney disease [6]. The etiology of obesity and MetS is multifactorial and involves genetic susceptibility, insulin resistance, circadian rhythm disruption, and lifestyle factors such as physical inactivity and unhealthy dietary habits characterized by excessive energy intake [6,7].
Dietary factors—including increased intake of saturated fat and energy-dense foods, reduced consumption of fruits and vegetables, and adoption of Westernized eating habits—are recognized as major contributors to obesity and MetS risk [8,9]. When such dietary patterns persist, visceral adiposity increases and may alter adipokine and cytokine secretion, thereby promoting insulin resistance, metabolic dysregulation, and chronic low-grade inflammation [8,9]. Consistent with this, previous studies have reported positive associations between Westernized dietary patterns and cardiometabolic risk markers such as WC, body mass index (BMI), BP, TG, and abdominal obesity [10,11].
In addition to overall dietary quality, dietary acid–base balance has recently gained attention as a potential determinant of cardiometabolic health. Diets rich in animal protein, processed foods, and refined grains—often accompanied by low fruit and vegetable intake—tend to increase dietary acid load (DAL), which may adversely influence metabolic homeostasis [12,13,14,15]. DAL can be estimated from nutrient intake and is commonly expressed as potential renal acid load (PRAL) and net endogenous acid production (NEAP) [12]. Acid-producing foods typically include meat, fish, eggs, cheese, and refined grains, which provide acid precursors and contribute to higher PRAL and NEAP scores [16]. In contrast, fruits and vegetables are associated with lower PRAL and NEAP scores and may help maintain acid–base balance [16,17]. Emerging evidence suggests that higher DAL is associated with obesity-related chronic diseases and adverse cardiometabolic outcomes [18,19,20].
Moreover, although PRAL and NEAP are widely used indices for DAL estimation, their relative sensitivity and metabolic relevance particularly under lifestyle intervention conditions, remain unclear. Importantly, evidence is especially limited in Korean populations, where dietary patterns are undergoing rapid transitions toward Westernized eating habits. Therefore, this study aimed to investigate the association between DAL (assessed by PRAL and NEAP) and MetS-related anthropometric and biochemical parameters among Korean adults undergoing an 8-week eating habit modification intervention, and to evaluate the relative relevance of PRAL versus NEAP as DAL indicators.
2. Materials and Methods
2.1. Study Participants and Study Design
Sixty Korean adults (aged ≥19 years) who had no diagnosed chronic diseases and had at least one risk factor of MetS were recruited in this quasi-experimental eating habit modification study through a public advertisement. Initially, they underwent baseline screening. Among them, 12 individuals were excluded because they had one or more chronic diseases such as diabetes, cardiovascular disease, stroke, cancer, thyroid, and kidney or liver disease. The remaining 48 individuals were enrolled in the eating habit modification intervention study for 8 weeks. They were asked to visit the study laboratory after 4 and 8 weeks for follow-up for anthropometric measurements (0, 4, and 8 weeks), biochemical tests (0 and 8 weeks), questionnaire surveys (basic information, 24-h recall record sheets, and nutrition quotient (NQ) at 0, 4, and 8 weeks), and eating habit education. During the intervention, eight participants dropped out of the study because of personal reasons (i.e., work time and travel). Overall, 40 participants were finally included in the analyses. Among them, 35 (81.4%) were female, 2 (4.7%) were current smokers, and 26 (60.5%) were current drinkers. The Institutional Review Board of Dong-A University approved the study protocol (no. 2-1040709-AB-N-202103-HR-016-02). To obtain informed consent, the participants were explained about the objectives and contents of the study.
2.2. Definition of MetS
The participants were considered to have MetS when they had three or more of the five factors listed in the NCEP-ATP III guideline: 1) WC criteria for abdominal obesity proposed by the Korean Society for the Study of Obesity ≥90 cm for men and ≥85 cm for women, 2) TG level of ≥150 mg/dL, 3) HDL-cholesterol level of <40 mg/dL for men and <50 mg/dL for women, 4) BP of ≥130/85 mmHg, 5) fasting blood glucose level of ≥100 mg/dL or a history of taking antidiabetic, antihypertensive, or lipid-lowering medications.
2.3. Eating Habit Modification
At the initial visit, study participants attended an one-hour education session on eating habit modification delivered by professional clinical dietitians and received educational materials and books. The sessions covered the definitions of obesity and MetS and the ways to improve eating habits (i.e., appropriate food choice, reduced consumption of foods high in sodium and saturated fatty acid, and guidance on healthy eating-out practices, and food preparation methods). Training for increasing physical activity (light-moderate intensity) in daily life was also provided by health professionals. To increase adherence to the dietary advice, cell phone text messages were also sent to the participants (i.e., low-calorie food selection, stress release, and smart eating-out). This was reinforced by checking their food diary notes.
2.4. Calculation of DAL Scores
We encouraged the study participants to maintain a dietary diaries for at least 3–6 days each month to estimate DAL expressed as NEAP and PRAL scores. NEAP was calculated using protein and potassium intakes, wehreas PRAL was calculated using intakes of protein, potassium, phosphorus, magnesium, and calcium [21].
2.5. Nutrition Quotients
The NQ, a dietary index developed by the Korean Nutrition Society, was used to evaluate the nutritional status and meal quality of the study participants. It consists of 21 questions divided into four domains: balance, diversity, moderation, and eating behavior.
2.6. Anthropometric Measurement and Blood Collection
Participants’ height was measured manually using an InBody extensometer (InBody Co. BSM170, Ltd., Seoul, Korea). Body weight, body fat percentage, body fat volume (BFM), visceral fat area (VFA), skeletal muscle mass, subcutaneous fat (SFA), and BP were automatically measured using InBody 970 (InBody Co.). WC was measured by a tapeline. The blood samples were collected in serum-separating or ethylenediaminetetraacetic acid tubes after fasting overnight at week 0 and 8 visits, separated into serum or plasma, and then stored below –80 °C before analysis.
2.7. Glycemic Control-Related Parameters and Serum Lipid Profiles
Fasting glucose levels in whole blood were measured using CareSens Dual (i-SENS, Inc., Seoul, Korea). Hemoglobin A1c (HbA1c, %) was measured using SD A1cCare (SD Biosensor, Inc., Suwon, Korea). Serum insulin and C-peptide levels were measured by the immunoassay method using a cobas e 801 analyzer (Roche Ltd., Mannheim, Germany). Homeostasis model assessment insulin resistance (HOMA-IR) was calculated as follows: HOMA-IR = [fasting insulin (μIU/mL) × fasting glucose (mg/dL)] / 450. Serum levels of TG, total cholesterol, and LDL-cholesterol were measured using enzymatic assays on a Hitachi LABOSPECT 008AS automatic analyzer (Hitachi, Ltd., Tokyo, Japan). Serum HDL-cholesterol levels were measured using an enzymatic method after the precipitation of chylomicrons with dextran sulfate magnesium.
2.8. Statistical Analysis
The IBM SPSS Statistics version 25.0 (IBM Corp., Armonk, NY, USA) was used for statistical analysis. The Wilcoxon signed-rank test was used to compare the results before and after the intervention. The Friedman test was used to compare the values at weeks 0, 4, and 8 of the intervention after adjusting for sex, age, cigarette smoking, and alcohol drinking. The Spearman correlation test was used to analyze the relationship between the variables. Partial correlation was also used with adjustment for sex and age. A p-value of <0.05 was considered significant.
3. Results
3.1. Body Composition Parameters of the Study Participants After the 8-Week Intervention
Figure 1 shows significantly improvement in body weight (P0 < 0.0001, P1 < 0.0001), WC (P0 = 0.642, P1 = 0.010), BMI (P0 < 0.0001, P1 < 0.0001), BFM (P0 < 0.0001, P1 < 00001), systolic BP (P0 = 0.002, P1 = 0.042), diastolic BP (P0 = 0.035, P1 = 0.039), and SFA (P0 < 0.0001, P1 < 0.0001) after the intervention after the adjustment for sex, age, smoking, and drinking status (P0 for 4 weeks, P1 for 8 weeks).
3.2. NQ and DAL Scores of the Study Participants at Baseline and After 8-Week Intervention
After the 8 weeks of intervention, the mean values of the total NQ scores (51.0 ± 1.84 and 57.5 ± 1.62, P < 0.0001) were significantly improved along with all of its components, except for diversity, i.e., balance (31.1 ± 2.76 and 35.9 ± 2.25, P = 0.013), moderation (70.0 ± 2.29 and 77.0 ± 2.08, P = 0.007), behavior (41.2 ± 2.75 and 52.9 ± 1.88, P < 0.0001), and diversity (56.5 ± 2.55 and 60.0 ± 2.98, P = 0.178). However, no significant difference was found in the mean values of the DAL scores after the intervention, although the NEAP scores showed a slightly decreasing trend (NEAP scores: 67.8 ± 7.67 and 62.1 ± 3.88 mEq/day, P=0.717; PRAL scores: 14.1 ± 3.35 and 15.6 ± 2.17 mEq/day, P=0.717).
3.3. Correlation Between DAL Scores and Anthropometric Parameters During the Intervention Period
At baseline, DAL scores expressed as both NEAP and PRAL were not significantly correlated with most anthropometric parameters, however, NEAP scores were negatively correlated with WC after adjustment (Figure 2). After 4 weeks, both PRAL and NEAP scores showed significant positive correlations with body composition parameters including BMI, WC, and SFA. However, the statistical significance disappeared after adjustment (Figure 3). After 8 weeks, PRAL and NEAP scores were significantly and positively correlated with BMI, WC, VFA and SFA. but the significant association between PRAL scores and WC, and between PRAL and SFA disappeared after adjustment (Figure 4).
3.4. Correlation Between DAL Scores and Biochemical Parameters During the Intervention Period
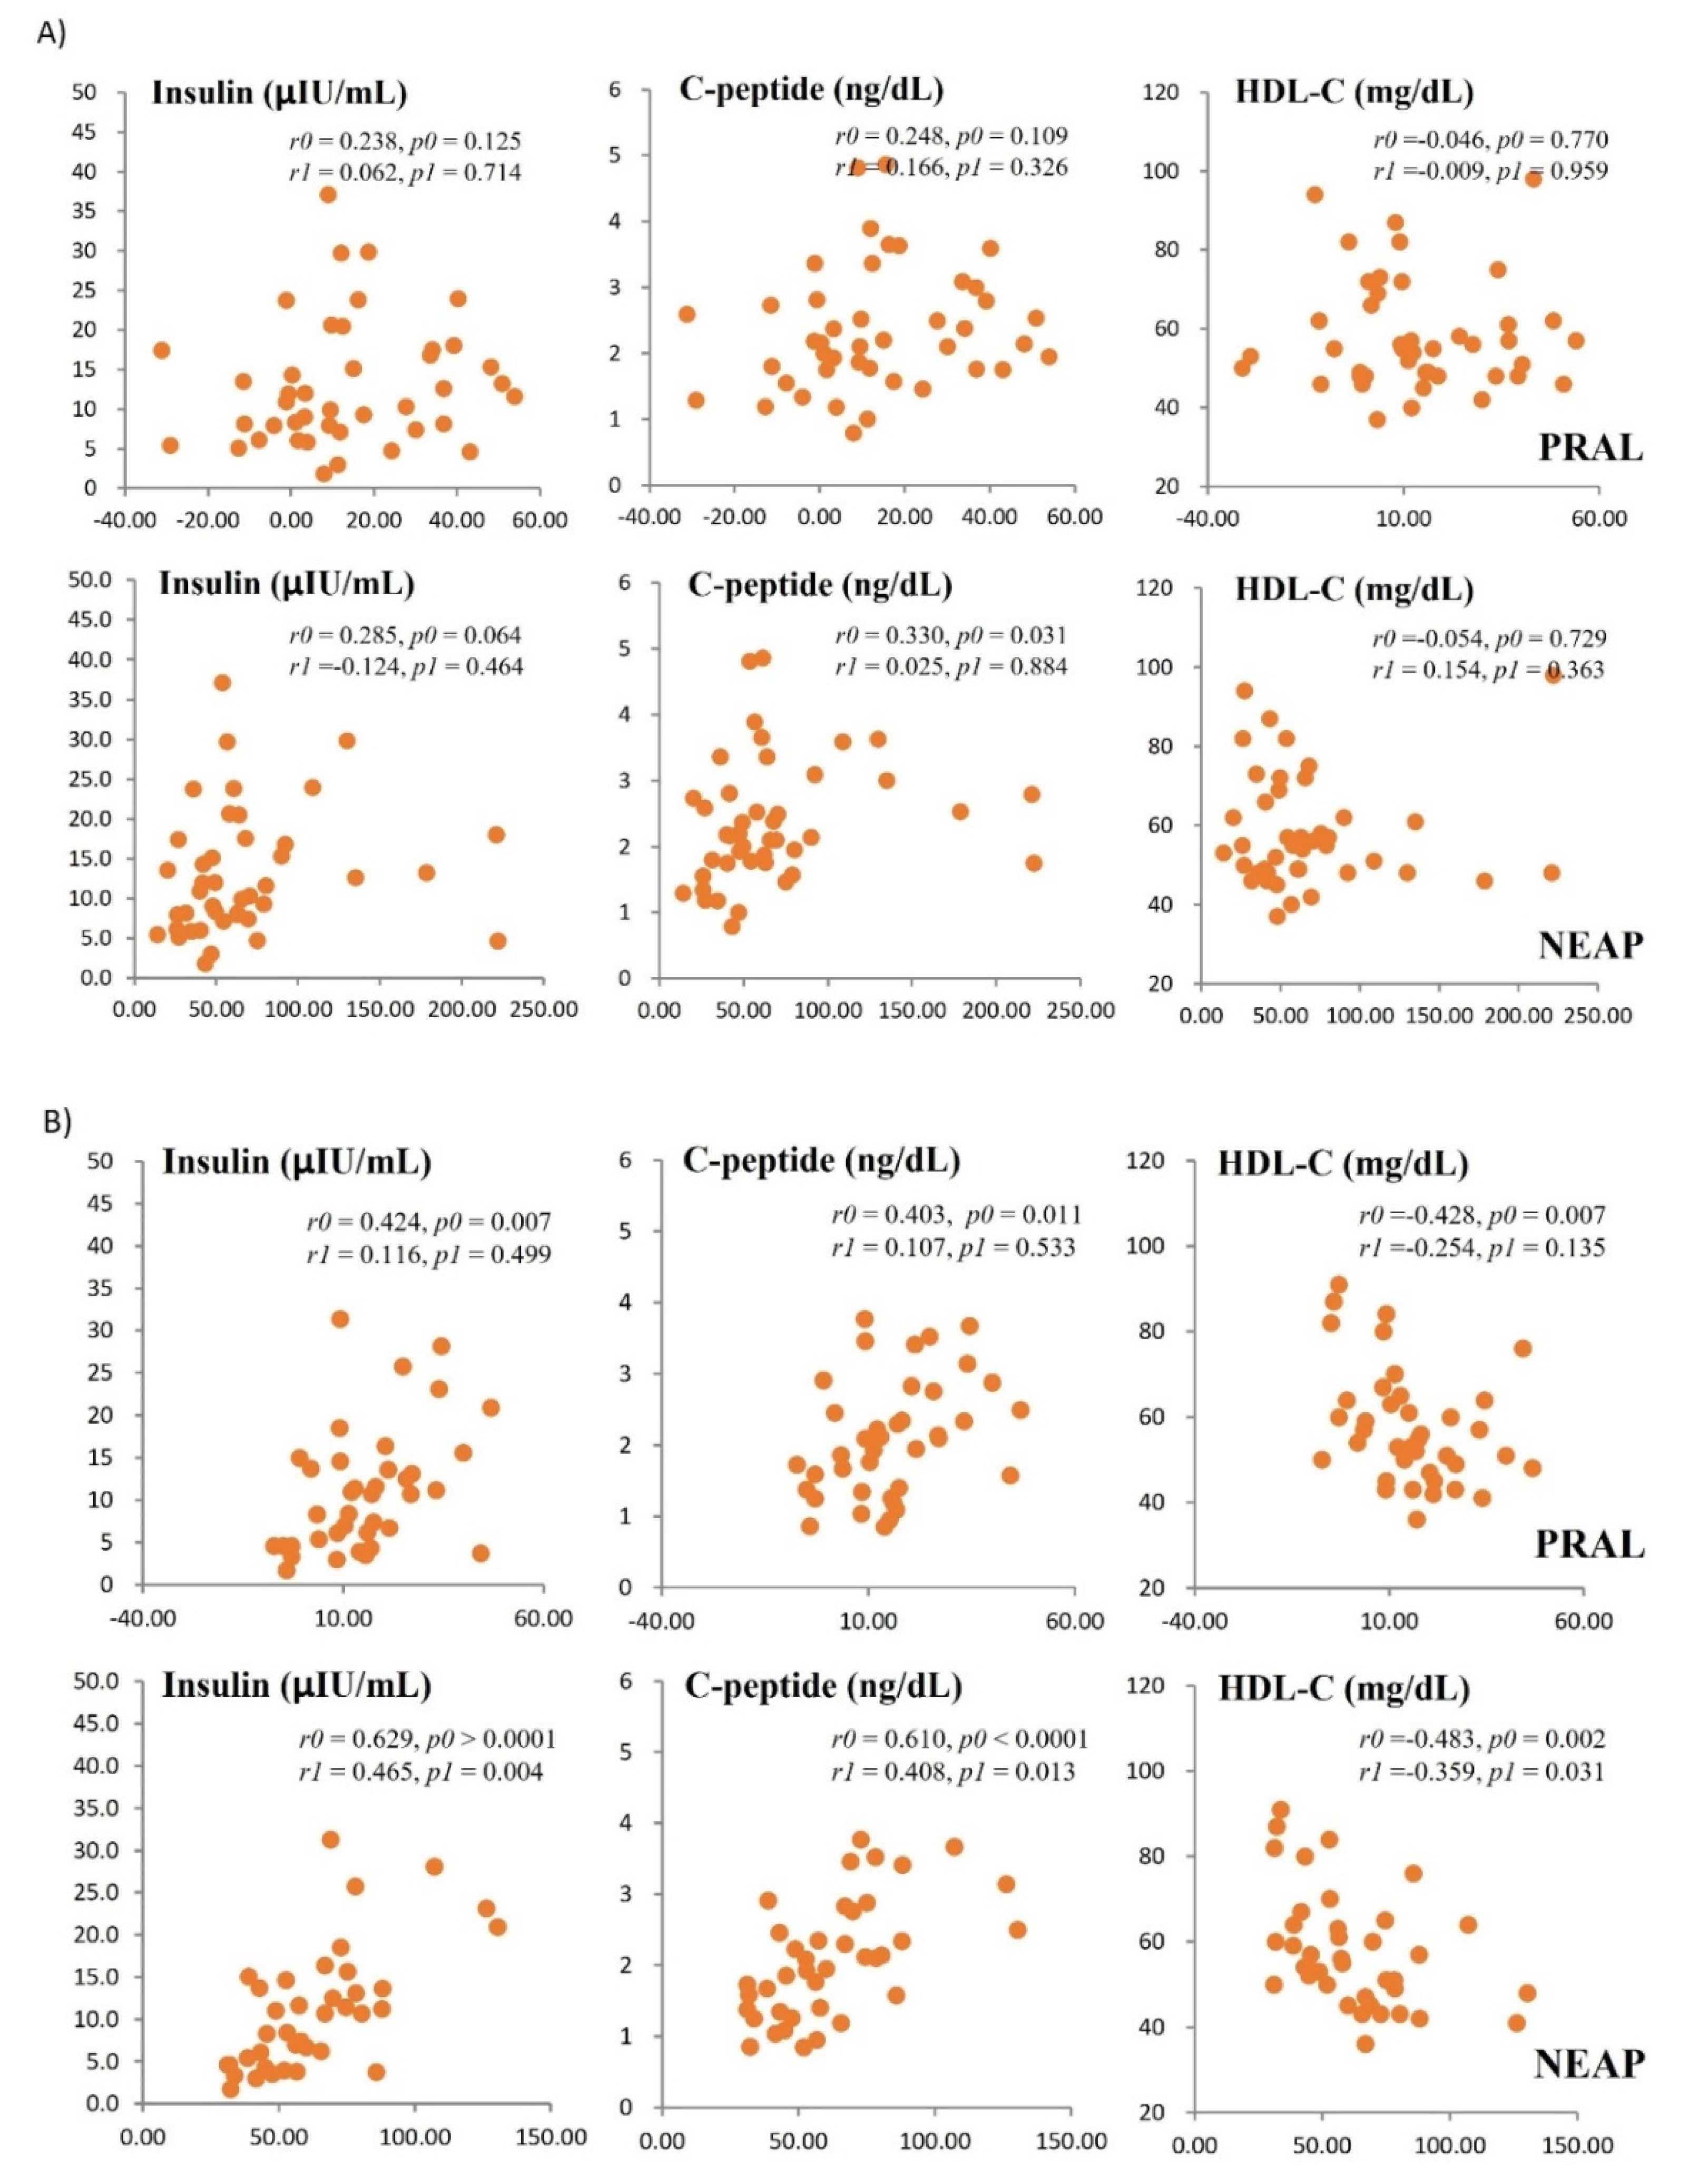
At baseline, PRAL and NEAP scores were not significantly correlated with fasting insulin, HDL-C, or C-peptide levels (Figure 5A); however, significant association with these biochemical parameters were observed at week 8 (Figure 5B). Notably, after adjustment, the associations remained significant when DAL was expressed as NEAP, but not when expressed as PRAL (Figure 5B). NEAP scores were significantly correlated with fasting glucose at baseline and with HOMA-IR at week 8; however, these associations were no longer significant after adjustment. In contrast, neither PRAL nor NEAP scores were significantly correlated with other lipid profiles, including TG, LDL-C, and total cholesterol, throughout the intervention period.
4. Discussion
Previous studies have shown that chronic metabolic disorders including obesity and cardiovascular diseases are associated with DAL scores such as NEAP and PRAL [18,19,20,26]. Women with higher NEAP scores showed higher levels of body weight, WC, and TG levels, and overweight/obese adolescents with higher PRAL and NEAP scores exhibited higher fasting glucose levels [19,24]. However, one study reported that cardiovascular disease risk was significantly associated with NEAP, but not with PRAL [27]. Consistent with these findings, both NEAP and PRAL were associated with metabolic parameters after the intervention in this present study; however, NEAP appeared to be more sensitive DAL indicator than PRAL. Whereas most previous studies on the association between DAL and MetS have been cross-sectional, our intervention study evaluated this relationship following eating habit modification.
In this present study, body composition parameters such as BMI, body fat, SFA, and whole-blood glucose were significantly improved after the intervention. BP and HbA1c levels were also significantly improved at week 4, and insulin resistance decreased significantly at week 8. Correlations between DAL scores (NEAP and PRAL) and MetS-related parameters, which were not significant at baseline, reached statistical significance after the intervention. These findings indicates that eating habit modification may improve MetS-related parameters, potentially through changes in DAL (NEAP and PRAL). In addition, the results imply that at least one month of customized education focusing on eating behavior modification may substantially improve NQ scores and contribute to improvements in DAL-related metabolic outcomes.
In a randomized clinical trial involving a 16-week plant-based dietary intervention, PRAL and NEAP scores were positively correlated with body weight and body fat [18]. Another study reported that insulin resistance due to impaired glucose homeostasis may be effectively managed by consuming a diet rich in alkaline vegetables and fruits [22]. Conversely, Westernized dietary patterns have been shown to increase the levels of TG, systolic BP, and blood glucose whilie decreasing HDL-C levels, there by elevating the risk of obesity and metabolic diseases [25]. Animal-derived foods such as cheese, eggs, fish, meat, and refined grains, increase acid production because they are rich in sulfur-containing amino acids, phosphorus, and chloride. On the other hand, fruits and vegetables, which contain relatively higher levels of glutamate and citrate, induce base production to help maintain acid–base equilibrium in the body [28]. Therefore, diets characterized by high intake of acid-producing foods and low intake of alkaline foods may increase endogenous acid production and, consequently, elevate DAL scores. Such disturbances in acid–base balance may lead to metabolic acidosis and increase the risk of hypertension, insulin resistance, and cancer [13,23,29]. In healthy individuals, acid–base homeostasis is maintained through buffering systems in the blood, respiration, and renal excretion.
This study suggests that eating habit modification in daily life may influence DAL scores and, thereby, contribute to favorable changes in body composition and metabolic parameters. Accordingly, reducing the intake of high-fat and/or high-carbohydrate foods that may promote dietary acidification and increasing the consumption of vegetables and fruits may help maintain metabolic health.
However, this study has several limitations. First, more than 80% of the study population were women. Although sex was adjusted for in the analyses, further studies need to include a sufficient number of men, because metabolic status may differ by sex due to biological and hormonal factors. Second, after adjustment for sex and age, PRAL showed weaker correlations with metabolic parameters than NEAP. It is assumed that NEAP scores calcuated based on protein and potassium intake more simply and sensitively reflects dietary modification than PRAL scores claculated with multiple nutrients including protein, calcium, potassium and magenesuim. It also need to be further elucidated in the future studies.
5. Conclusions
This study suggests that eating habit modification in daily life may influence DAL scores, and thereby contribute to significant change in body composition and other metabolic parameters. Further large-scale studies with long-term interventions are needed to confirm these findings.
Author Contributions
Study concept and design: OYK; acquisition of data: YJK, and OYK; analysis and interpretation of data: YJK, CK JP, MC, WSA, and OYK; drafting of the manuscript: YJK, and OYK; critical revision of the manuscript: OYK; statistical analysis: YJK, CK and JP; obtained funding: OYK; administrative, technical, or material support: MC, WSA, and OYK; and study supervision: OYK. All authors have read and approved the final manuscript.
Funding
This study was supported by grants from the National Research Foundation of Korea (RS-2022-NR069592 and RS-2025-00562728).
Institutional Review Board Statement
The Institutional Review Board of Dong-A University approved the study protocol (no. 2-1040709-AB-N-202103-HR-016-02).
Informed Consent Statement
Informed consent was obtained from all subjects involved in the study.
Data Availability Statement
The data supporting the conclusions of this article will be available from the corresponding author upon reasonable request.
Conflicts of interest
The authors declare no conflict of interest.
References
- Hanfei Xu, L Adrienne Cupples, Andrew Stokes, Ching-Ti Liu. Association of Obesity with Mortality Over 24 Years of Weight History: Findings From the Framingham Heart Study. JAMA Netw Open 2018;1(7). [CrossRef]
- Edward Yu, Sylvia H Ley, JoAnn E Manson, Walter Willett, Ambika Satija, Frank B Hu, Andrew Stokes et al. Weight History and All-Cause and Cause-Specific Mortality in Three Prospective Cohort Studies. Ann Intern Med 2017;166(9):613-620. [CrossRef]
- Global Burden of Disease Collaborative Network. Global Burden of Disease Study 2019 (GBD 2019) Results. Seattle, United States: Institute for Health Metrics and Evaluation (IHME), 2021. https://ourworldindata.org/obesity. Accessed 22 May 2022.
- Korean society for the study of obesity. 2025 Obesity Fact sheet. 2025. ISSN 2982-4966.
- Metabolic syndrome fact sheet in Korea 2024. Korean society of cardiometabolic syndrome. 2024.
- Hyun-Jin Kim, Dae Ryong Kang, Jang Young Kim, Wonjin Kim, Yong Whi Jeong, Kyeong-Hyeon Chun. Metabolic Syndrome Fact Sheet 2024: Executive Report. Cardiometab Syndr J. 2024 Sep;4(2):70-80. [CrossRef]
- Robert H Eckel, KGMM Alberti, 1. Scott M Grundy, Paul Z Zimmet. The metabolic syndrome. Lancet 2010;375(9710):181-183. [CrossRef]
- Gracia Fahed, Laurence Aoun, Morgan Bou Zerdan, Sabine Allam, Maroun Bou Zerdan, Youssef Bouferraa, Hazem I Assi. Metabolic Syndrome: Updates on Pathophysiology and Management in 2021. Int J Mol Sci 2022;23(2):786. [CrossRef]
- Dario Giugliano, Antonio Ceriello, Katherine Esposito. The Effects of Diet on Inflammation: Emphasis on the Metabolic Syndrome. Journal of the American College of Cardiology 2006;48(4):677-685. [CrossRef]
- Dimitra Rafailia Bakaloudi, Lydia Chrysoula, Evangelia Kotzakioulafi, Xenophon Theodoridis, Michail Chourdakis. Impact of the Level of Adherence to Mediterranean Diet on the Parameters of Metabolic Syndrome: A Systematic Review and Meta-Analysis of Observational Studies. Nutrients 2021;13(5):1514. [CrossRef]
- Drake I, Sonestedt E, Ericson U, Wallström P, Orho-Melander M. A Western dietary pattern is prospectively associated with cardio-metabolic traits and incidence of the metabolic syndrome. Br J Nutr. 2018;119:1168–76. [CrossRef]
- Clemente-Suárez VJ, Beltrán-Velasco AI, Redondo-Flórez L, Martín-Rodríguez A, Tornero-Aguilera JF. Global Impacts of Western Diet and Its Effects on Metabolism and Health: A Narrative Review. Nutr. 2023;15(12):2749. [CrossRef]
- Lynda A Frassetto, Karen M Todd, R Curtis Morris Jr, and Anthony Sebastian. Estimation of net endogenous noncarbonic acid production in humans from diet potassium and protein content. Am J Clin Nutr 1998;68(3):576-583. [CrossRef]
- Elnaz Daneshzad, Fahimeh Haghighatdoost, Leila Azadbakht. Dietary acid load and cardiometabolic risk factors: a systematic review and meta-analysis of observational studies. Public Health Nutrition 2019;22(15):2823-2834. [CrossRef]
- Tulay Omma, Nese Ersoz Gulcelik, Fatmanur Humeyra Zengin, Irfan Karahan, Cavit Culha. Dietary Acid Load Associated with Hypertension and Diabetes in the Elderly. Current Aging Science 2022;15(3):242-251. [CrossRef]
- Eugene Han, Gyuri Kim, Namki Hong, Yong-Ho Lee, Dong Woo Kim, Hyun Joon Shin, Byung-Wan Lee, Eun Seok Kang, In-Kyu Lee, Bong-Soo Cha. Association between dietary acid load and the risk of cardiovascular disease: nationwide surveys (KNHANES 2008-2011). Cardiovasc Diabetol 2016;15(1):122. [CrossRef]
- Sajjad Khalili Moghadam, Zahra Bahadoran, Parvin Mirmiran, Maryam Tohidi, Fereidoun Azizi. Association between Dietary Acid Load and Insulin Resistance: Tehran Lipid and Glucose Study. Prev Nutr Food Sci 2016;21(2):104-109. [CrossRef]
- Joanna Ostrowska, Justyna Janiszewska, Dorota Szostak Węgierek. Dietary Acid Load and Cardiometabolic Risk Factors-A Narrative Review. Nutrients 2020;12(11):3419. [CrossRef]
- Hana Kahleova, James McCann, Jihad Alwarith, Emilie Rembert, Andrea Tura, Richard Holubkov, Neal D Barnard. A plant-based diet in overweight adults in a 16-week randomized clinical trial: The role of dietary acid load. Clinical Nutrition ESPEN 2021;44:150-158. [CrossRef]
- Hadis Mozaffari, Nazli Namazi, Bagher Larijani, Nick Bellissimo, Leila Azadbakht. Association of dietary acid load with cardiovascular risk factors and the prevalence of metabolic syndrome in Iranian women: A cross-sectional study. Nutrition 2019;67-68. [CrossRef]
- Mahdieh Abbasalizad Farhangi, Leila Nikniaz, Zeinab Nikniaz. Higher dietary acid load potentially increases serum triglyceride and obesity prevalence in adults: An updated systematic review and meta-analysis. PLoS One 2019;14(5). [CrossRef]
- Guy Fagherazzi, Alice Vilier, Fabrice Bonnet, Martin Lajous, Beverley Balkau, Marie-Christine Boutron-Rualt, Francoise Clavel-Chapelon. Dietary acid load and risk of type 2 diabetes: the E3N-EPIC cohort study. Diabetologia, 2014;57(2):313-320. [CrossRef]
- Andrew J. Cooper, Stephen J. Sharp, Marleen A.H. Lentjes, Robert N. Luben, Kay-Tee Khaw, Nicholas J. Wareham, and Nita G. Forouhi. A Prospective Study of the Association Between Quantity and Variety of Fruit and Vegetable Intake and Incident Type 2 Diabetes. Diabetes Care 2012;35(6):1293-1300. [CrossRef]
- Pascale Khairallah, Julia J. Scialla. Role of Acid-Base Homeostasis in Diabetic Kidney Disease. Current Diabetes Reports 2017;17(4):28. [CrossRef]
- Mahsa Rezazadegan, Saeideh Mirzaei, Ali Asadi, Masoumeh Akhlaghi, Parvane Saneei. Association between dietary acid load and metabolic health status in overweight and obese adolescents. Scientific reports 2022;14. [CrossRef]
- Gina L. Ambrosini, Rae-Chi Huang, Trevor A. Mori, Beth P. Hands, Therese O’Sullivan, Nicholas H. de Klerk, Lawrence J. Beilin, Wendy H. Oddy. Dietary patterns and markers for the metabolic syndrome in Australian adolescents. Nutr Metab Cardiovasc Dis 2010;20(4):274-283. [CrossRef]
- Maryam Abshirini, Fariba Bagheri, Behzad Mahaki, Fereydoun Siassi, Fariba Koohdani, Maryam Safabakhsh, Gity Sotoudeh. The dietary acid load is higher in subjects with prediabetes who are at greater risk of diabetes: a case-control study. Diabetol Metab Syndrome 2019;11:52. [CrossRef]
- Parvin Mirmiran, Zeinab Houshialsadat, Zahra Bahadoran, Sajjad Khalili-Moghadam, Mohammad Karim Shahrzad, Fereidoun Azizi. Dietary acid load and risk of cardiovascular disease: a prospective population-based study. BMC Cardiovascular Disorders 2021;21(1):432. [CrossRef]
- Maria M Adeva, Gema Souto. Diet-induced metabolic acidosis. Clinical nutrition 2011;30(4):416-421. [CrossRef]
Figure 1.
Body composition measures of the study participants over the 8-week intervention period. Means ± standard error. Tested by the Friedman test (nonparametric repeated measures analysis of variance) with adjustment for age, sex, cigarette smoking, and alcohol drinking. P0, P-values compared between the values at 0 and 4 weeks. P1, P-values compared between the values at 0 and 8 weeks. BFM, body fat mass; BMI, body mass index; DBP, diastolic blood pressure; SBP, systolic blood pressure; SFA, subcutaneous fat area.
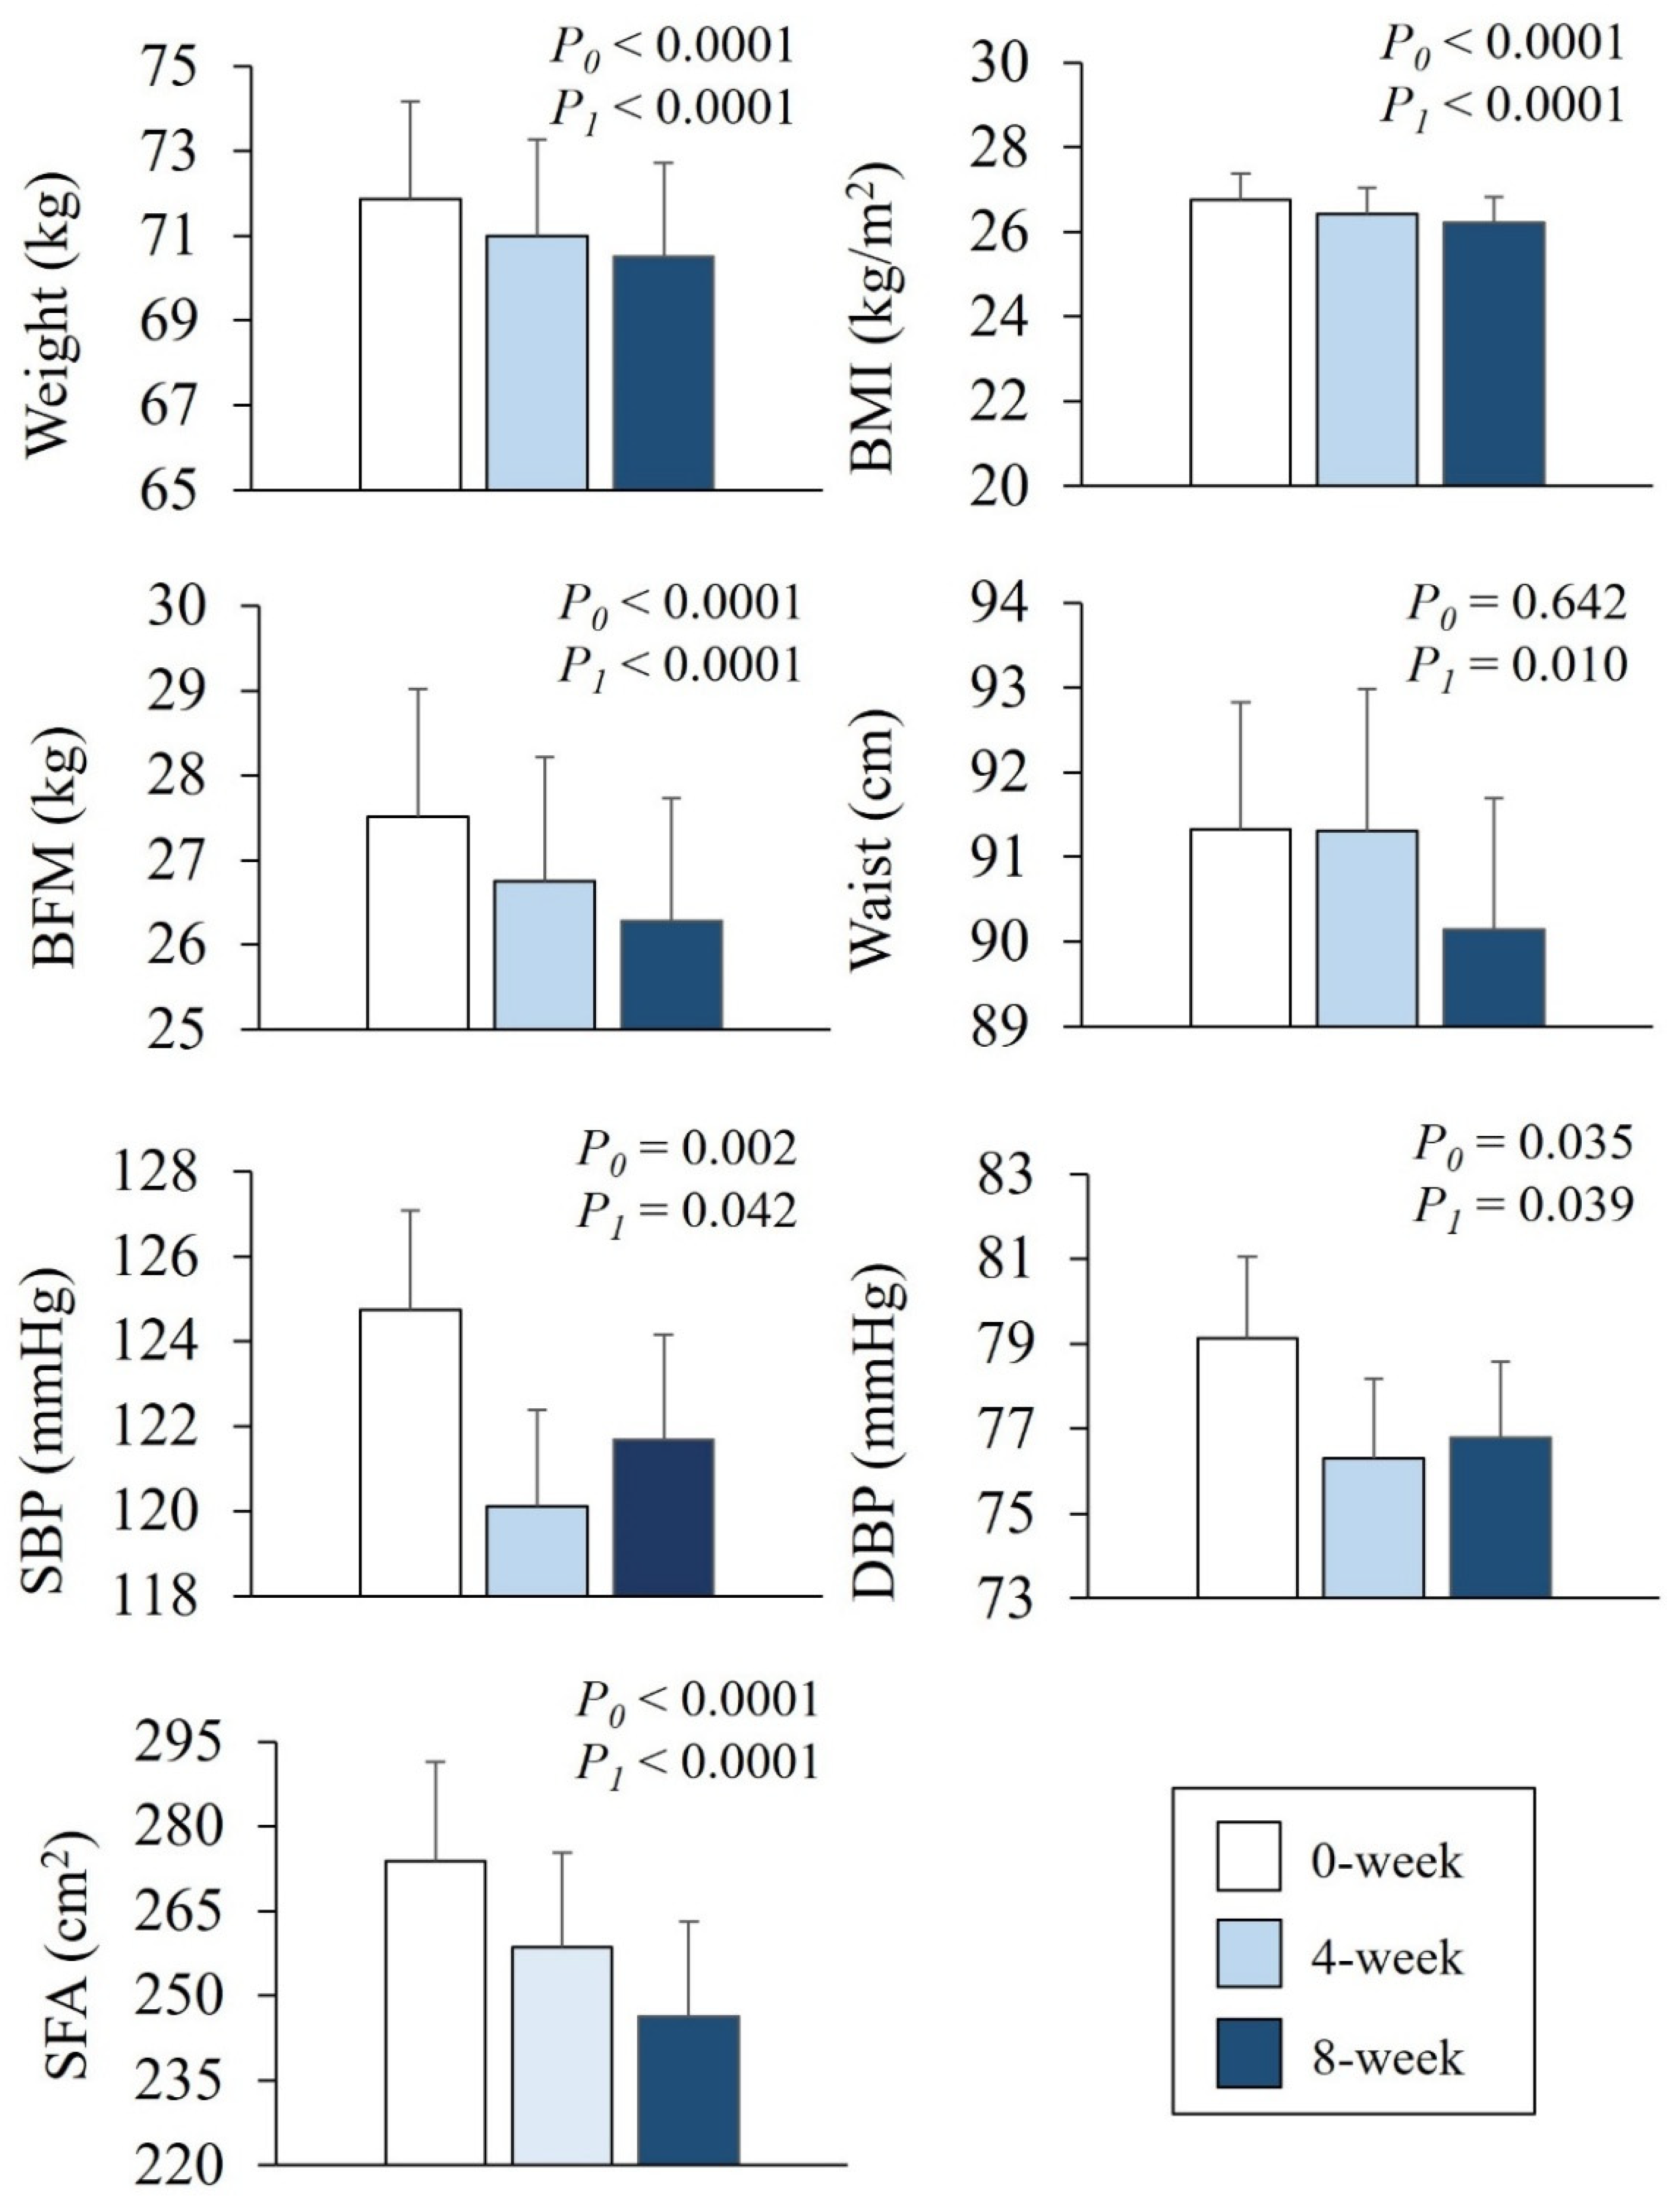
Figure 2.
Correlations between dietary acid load scores (PRAL and NEAP) and anthropometric measures at baseline. r, correlation coefficient; r0 and p0, tested by the Spearman correlation analysis (unadjusted); r1 and p1, tested by the partial correlation analysis (adjusted for age and sex). BMI, body mass index; SFA, subcutaneous fat area; VFA, visceral fat area.
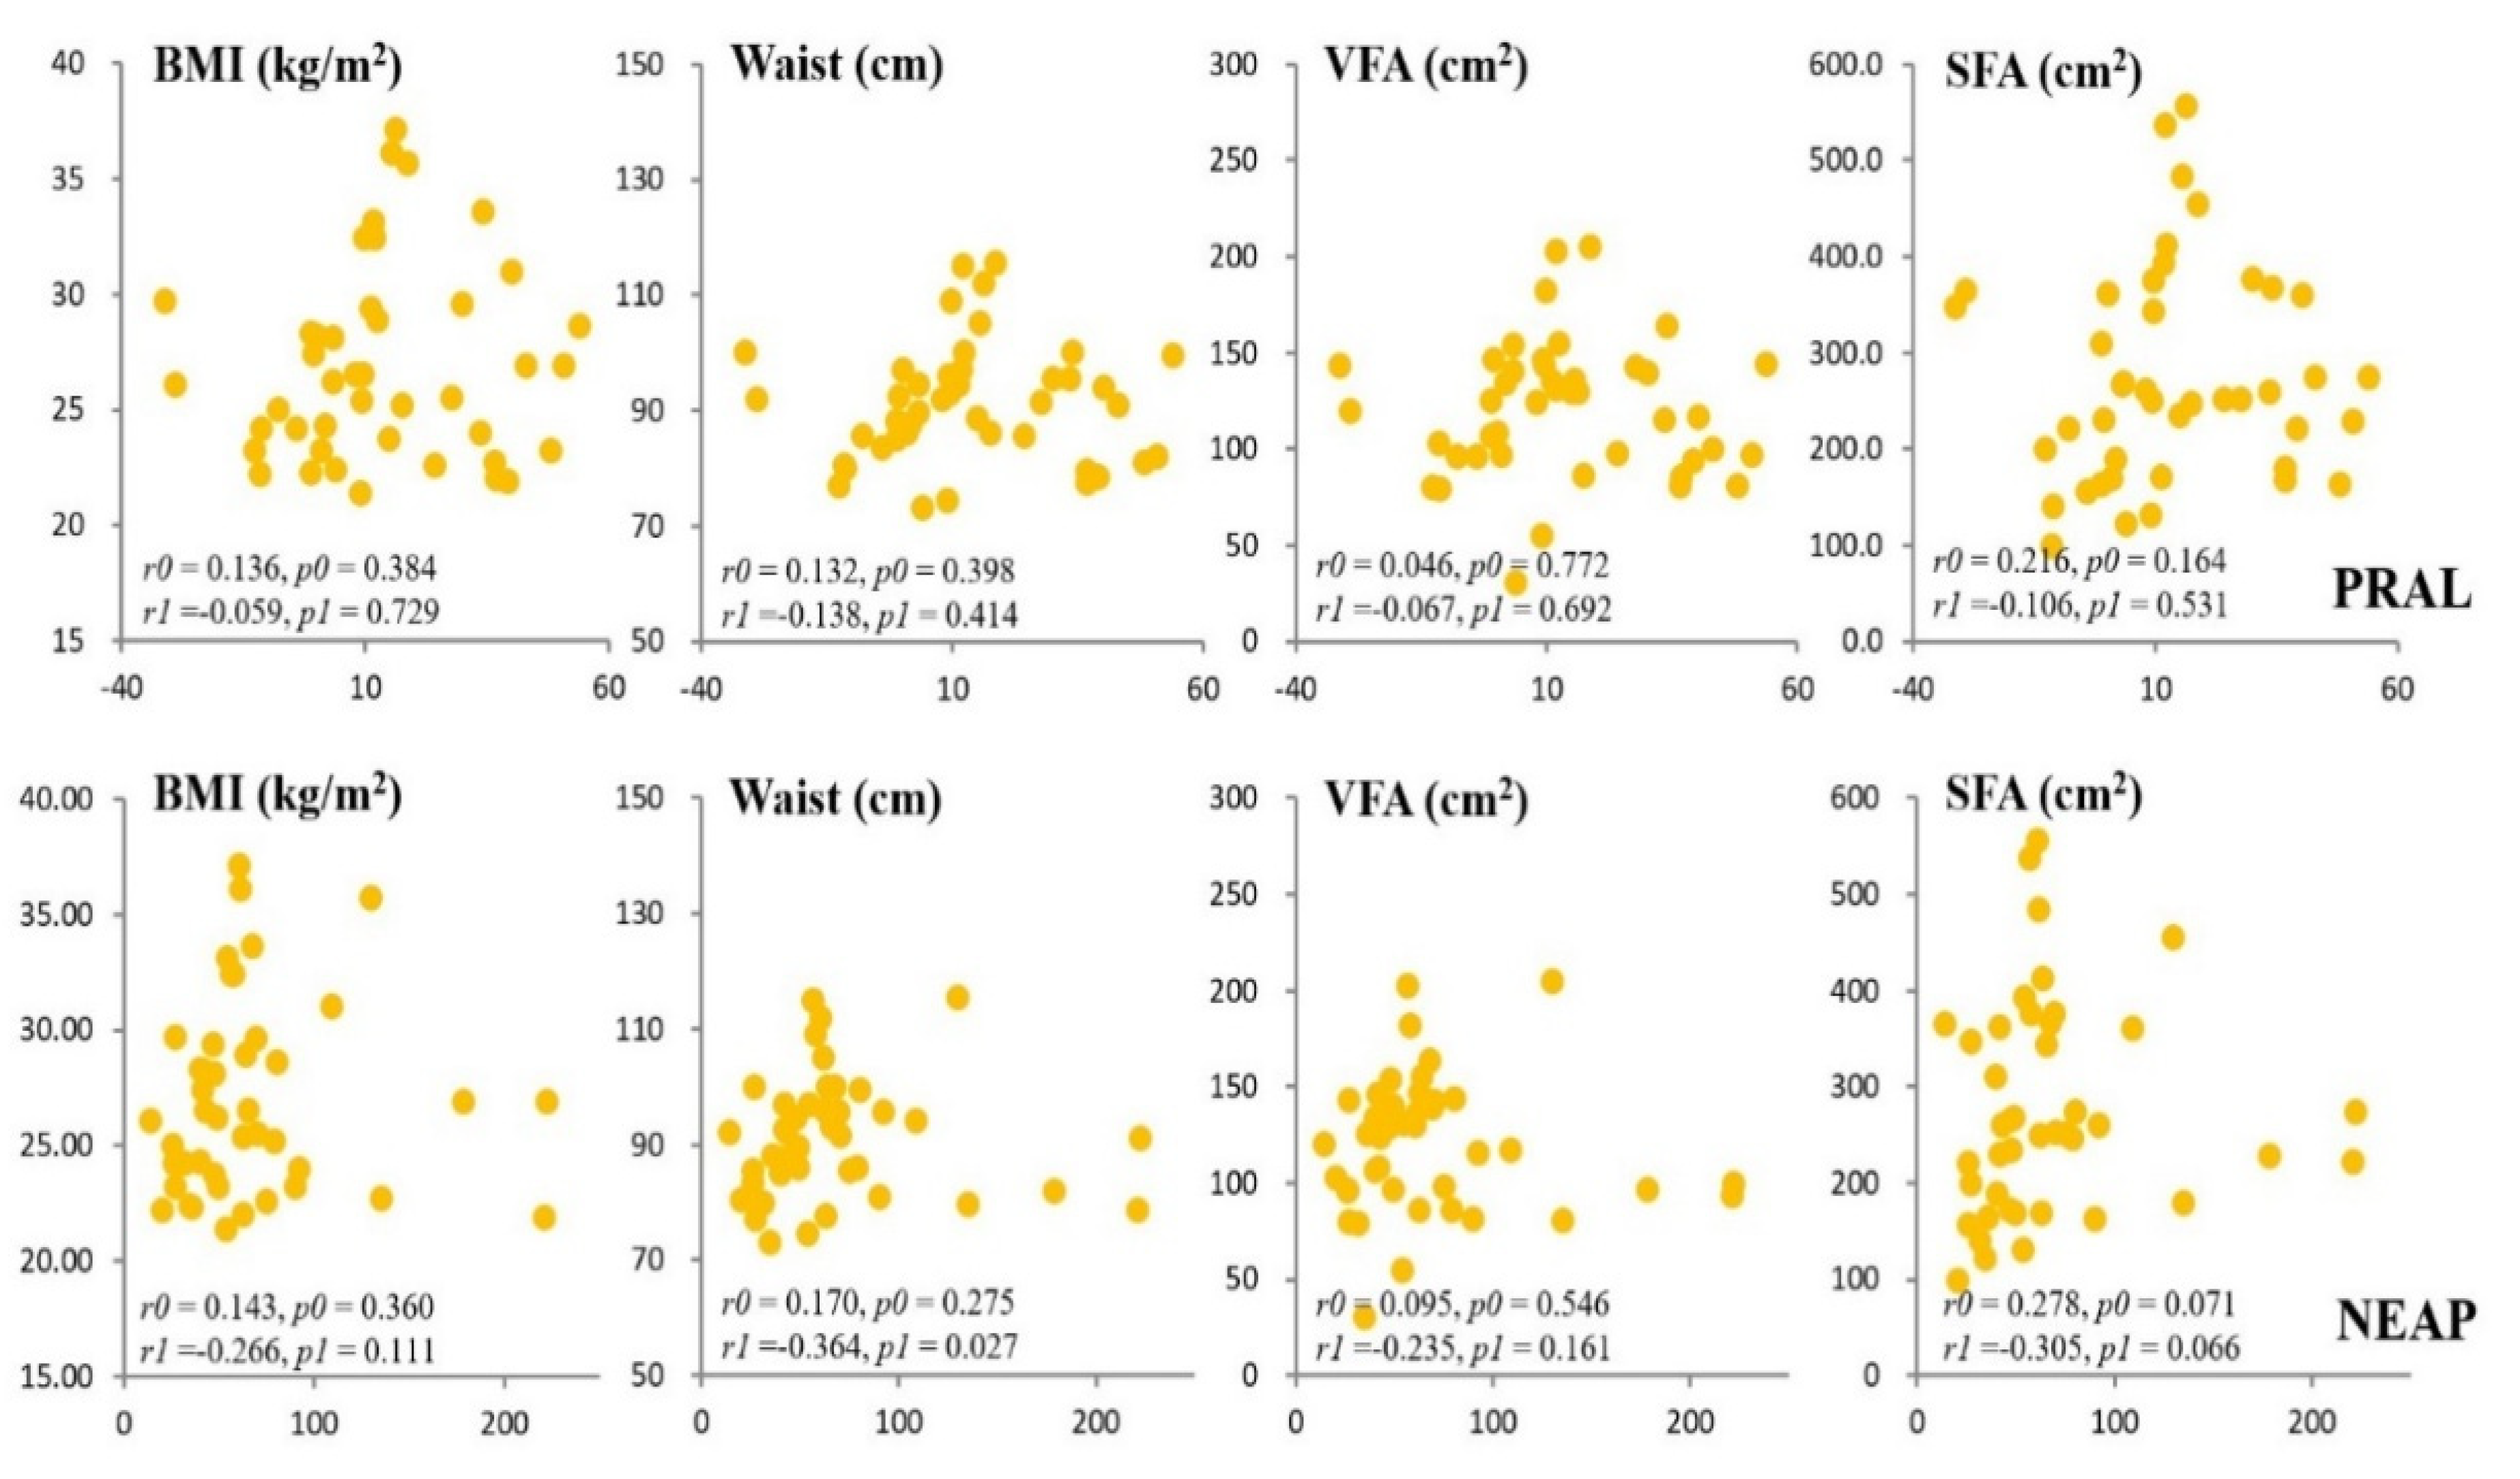
Figure 3.
Correlations between dietary acid load scores (PRAL and NEAP) and anthropometric measures after 4 weeks of intervention. r, correlation coefficient; r0 and p0, tested by the Spearman correlation analysis (unadjusted); r1 and p1, tested by the partial correlation analysis (adjusted for age and sex). BMI, body mass index; SFA, subcutaneous fat area; VFA, visceral fat area.
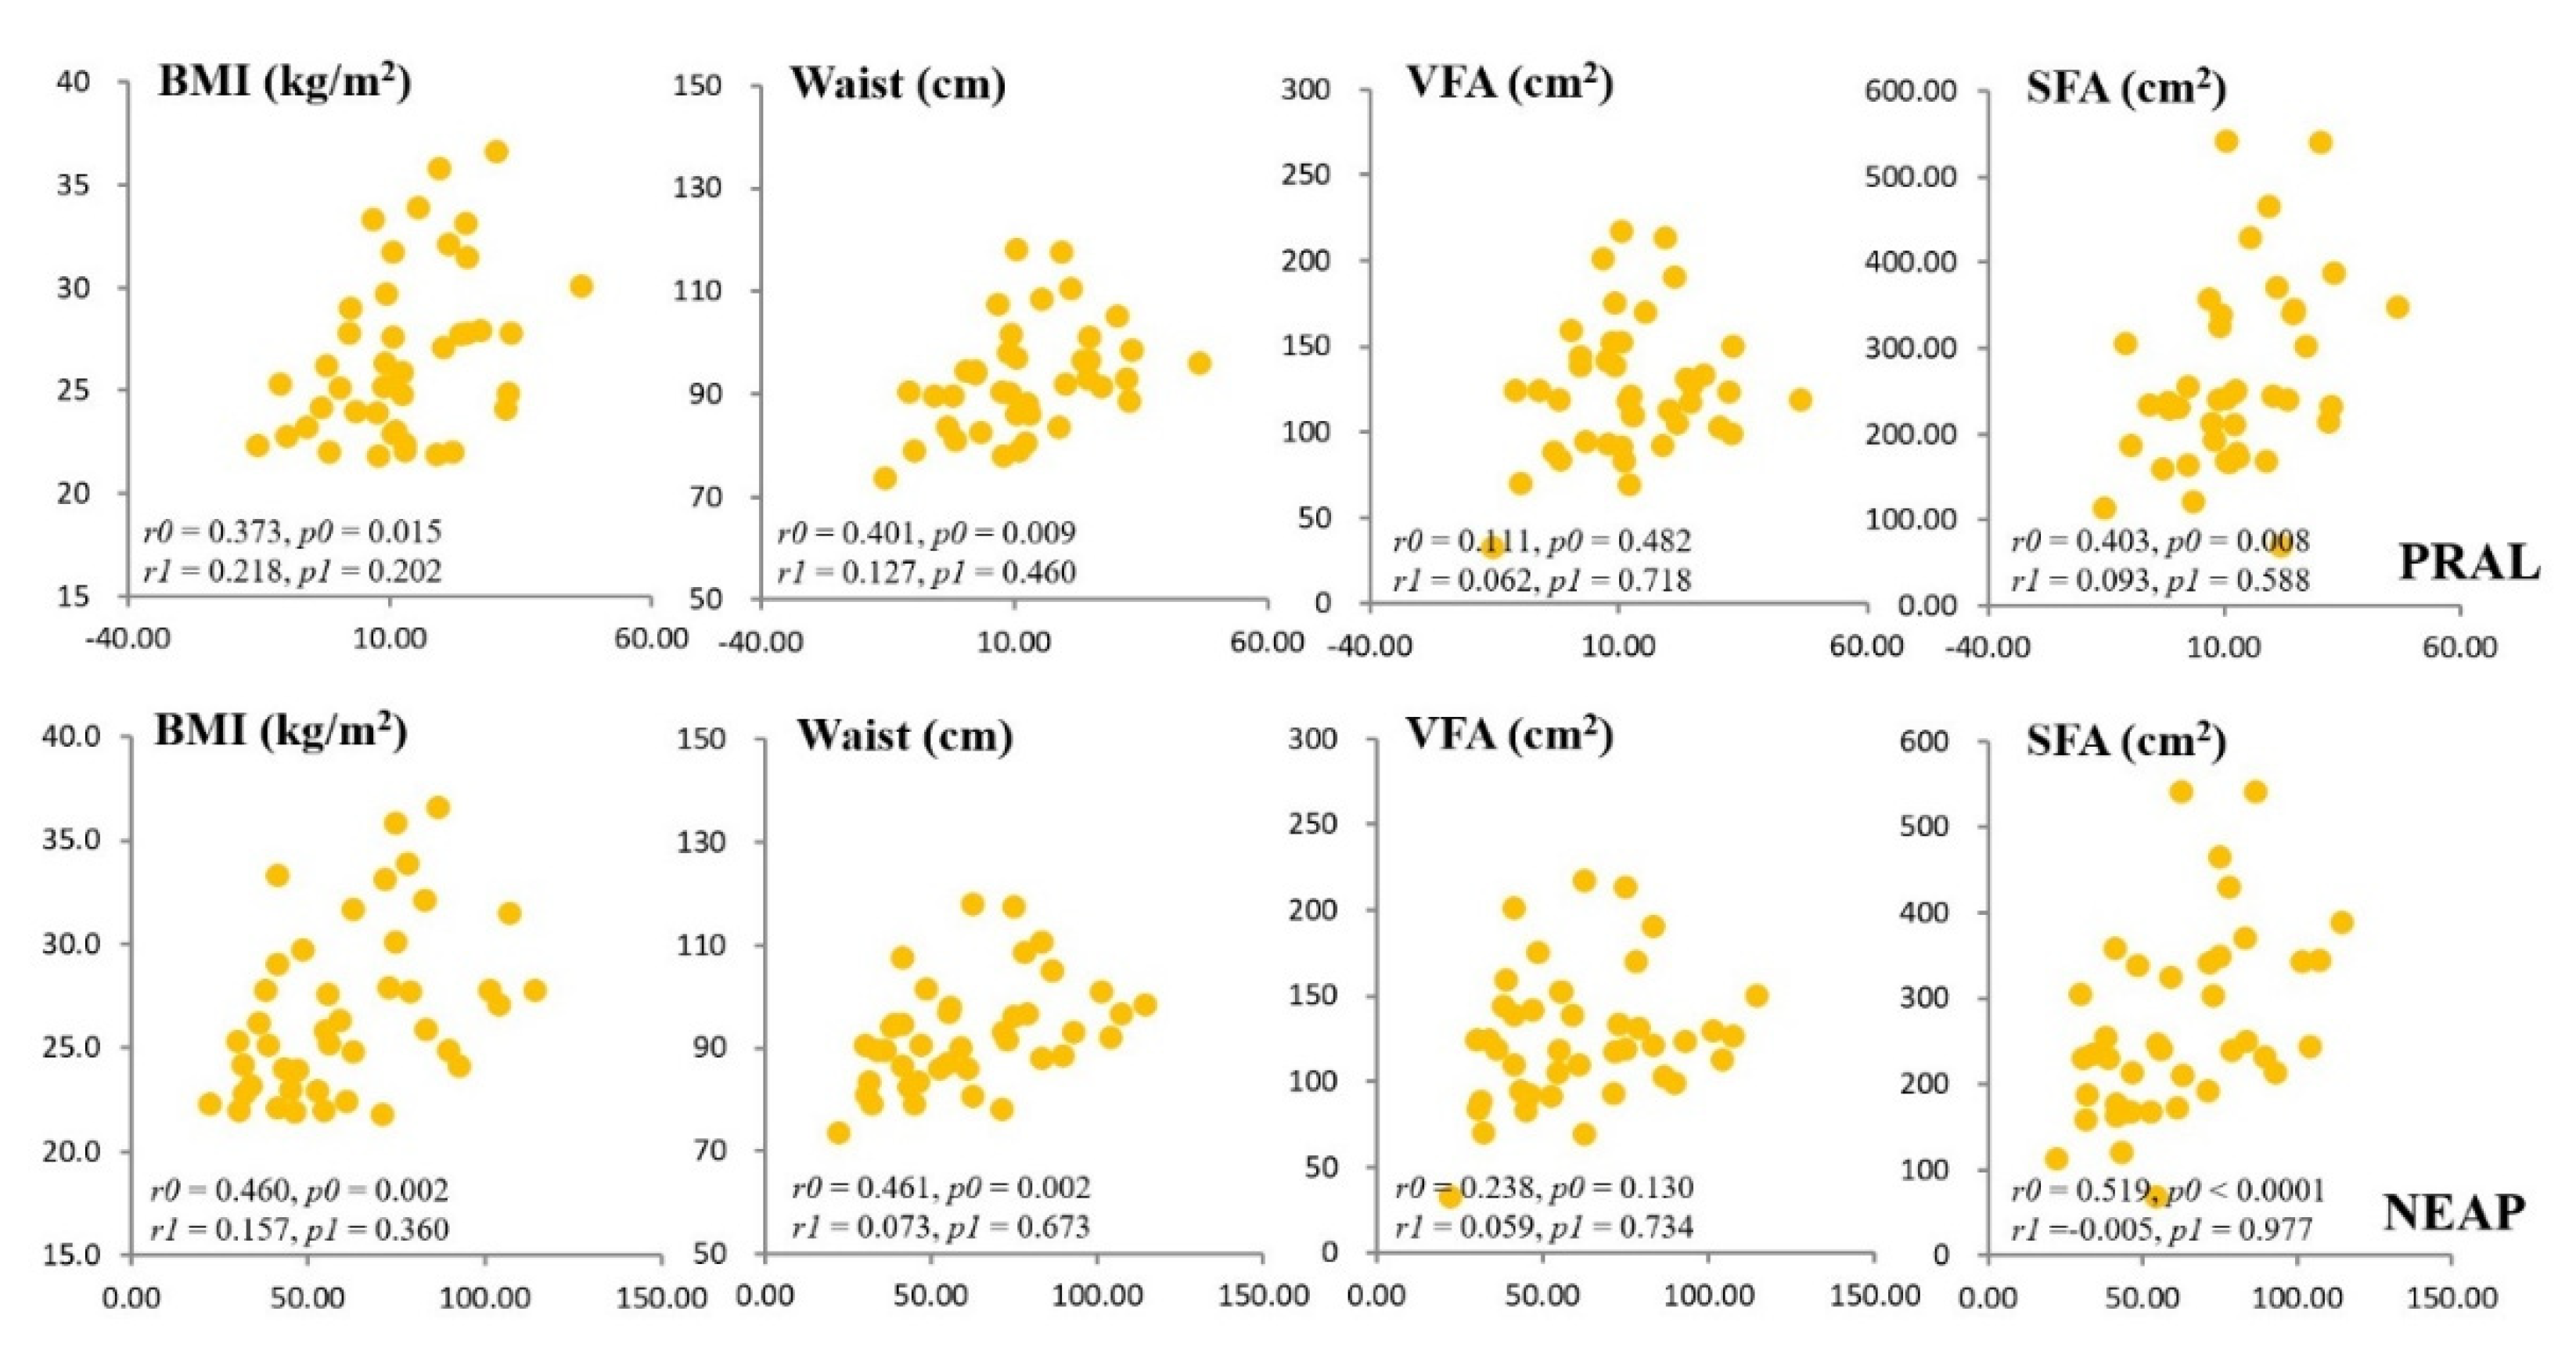
Figure 4.
Correlations between dietary acid load scores (PRAL and NEAP) and anthropometric measures at baseline.after 8 weeks of intervention. r, correlation coefficient; r0 and p0, tested by the Spearman correlation analysis (unadjusted); r1 and p1, tested by the partial correlation analysis (adjusted for age and sex). BMI, body mass index; SFA, subcutaneous fat area; VFA, visceral fat area.
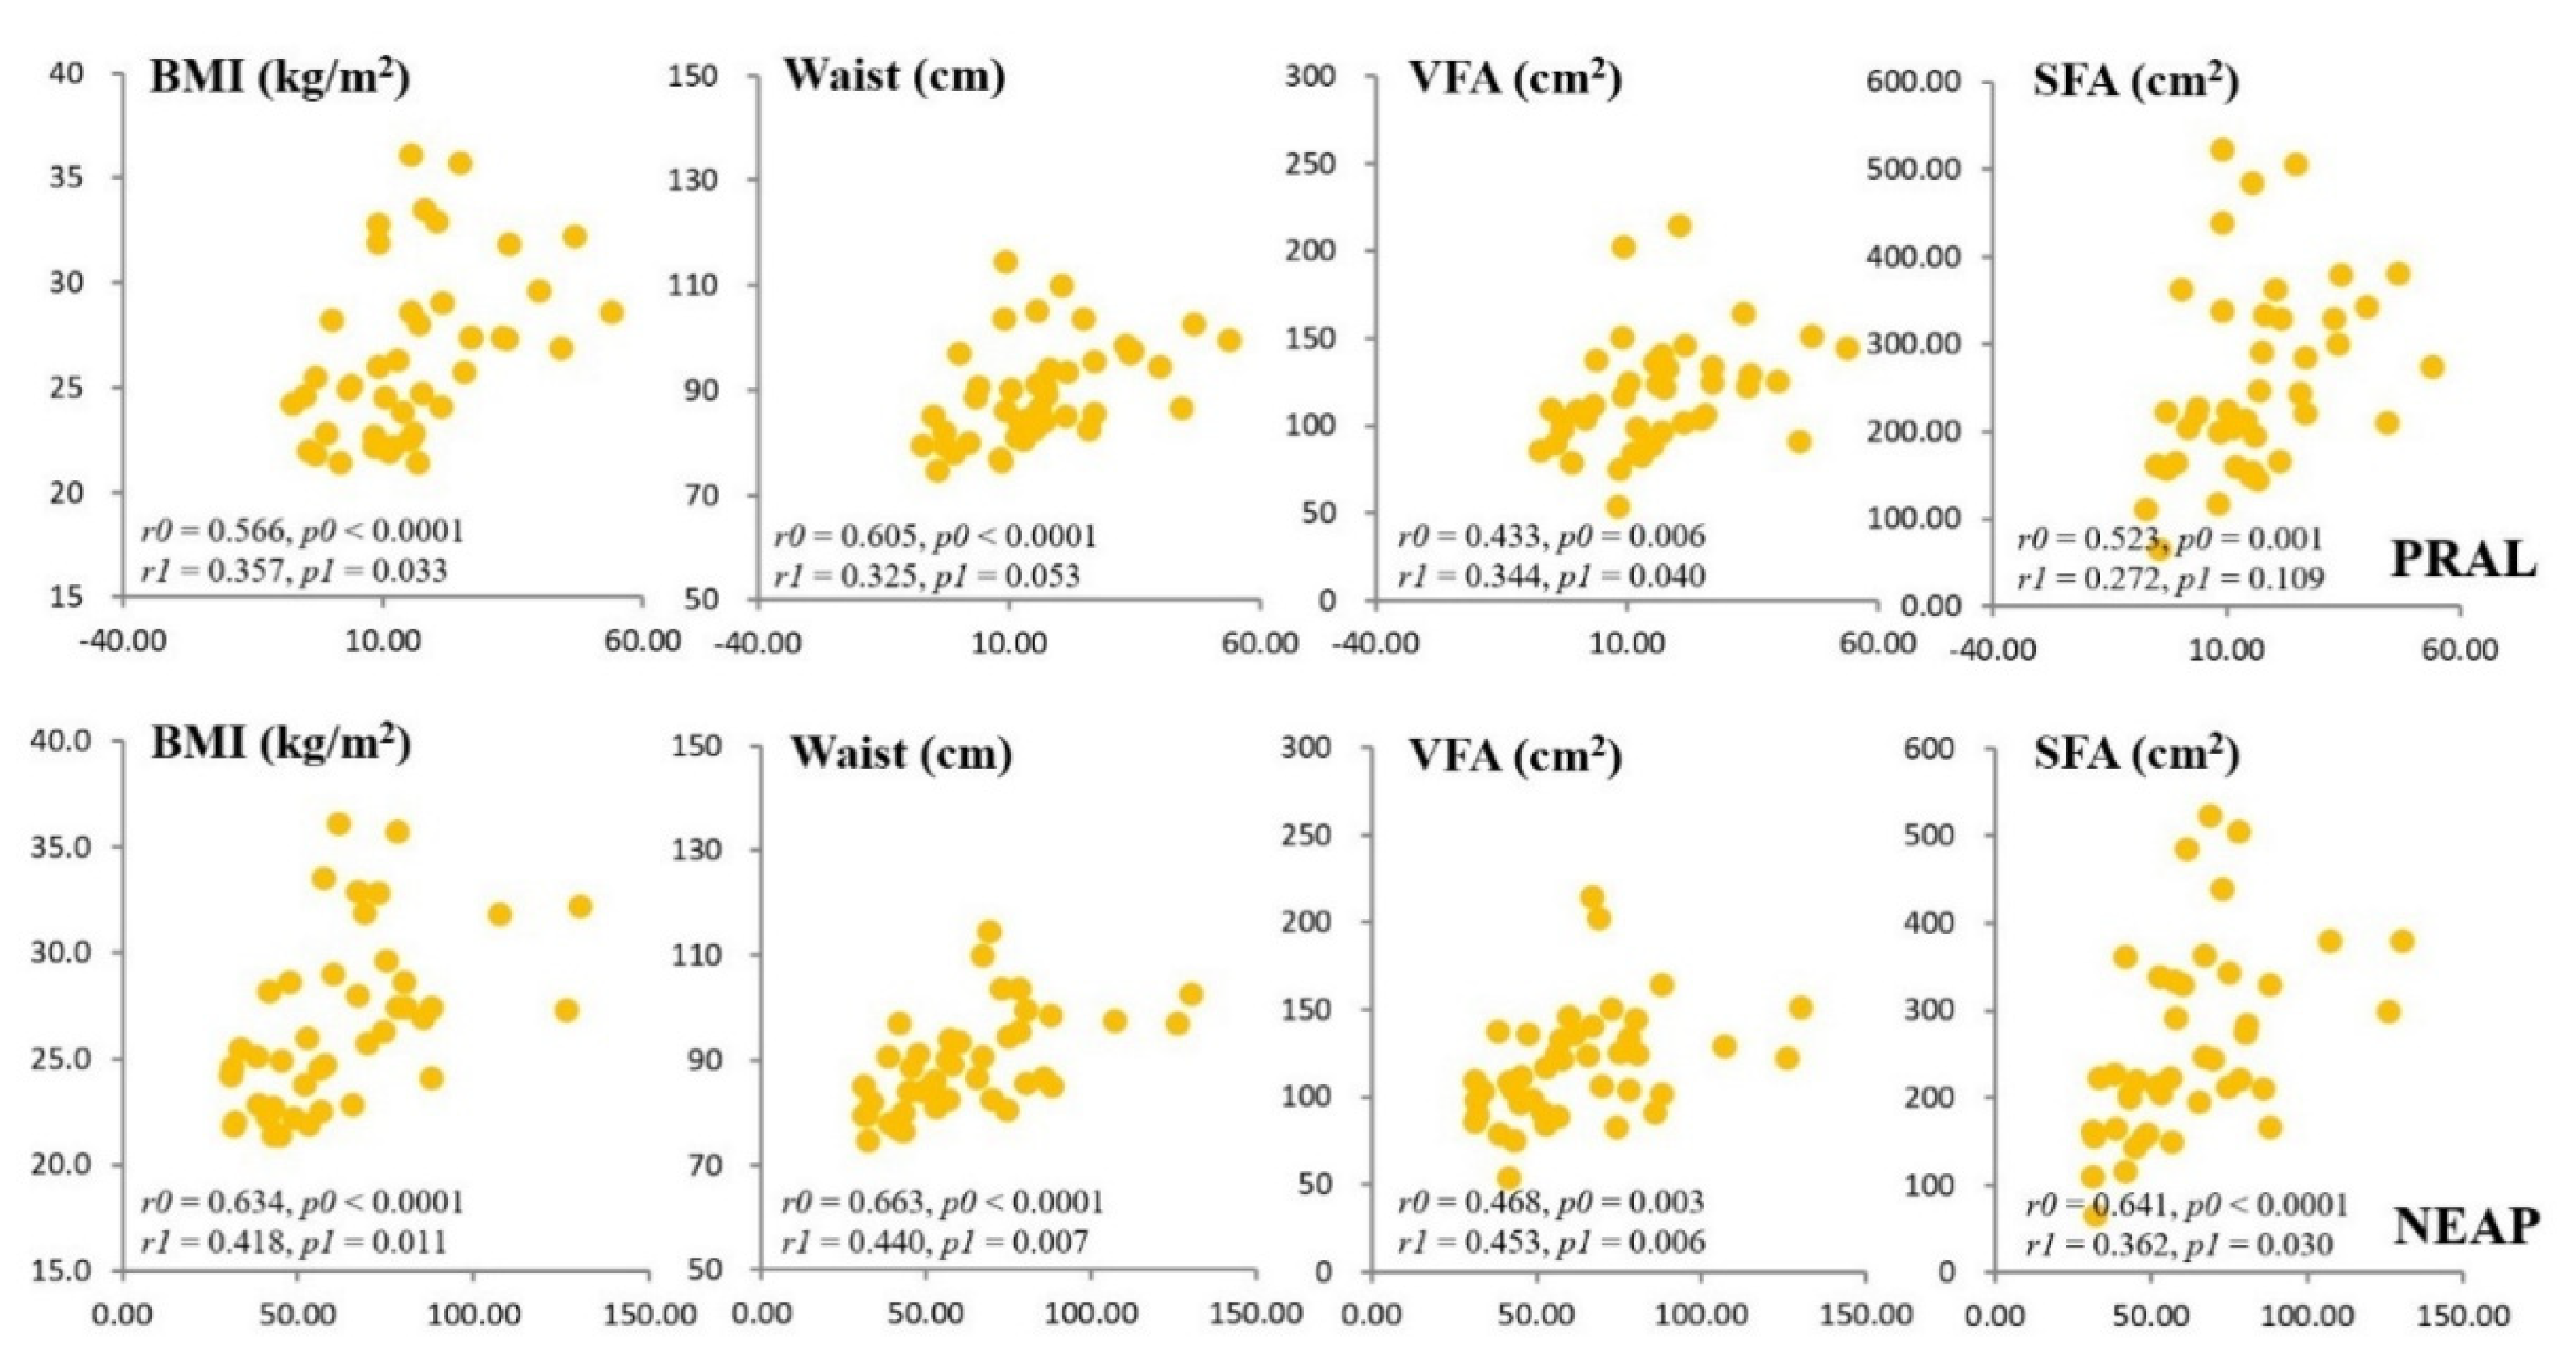
Figure 5.
Correlation between dietary acid load scores (PRAL and NEAP) and glycemic control-related parameters and HDL-cholesterol at baseline (A) and during the 8-week intervention period(B). r, correlation coefficient; r0 and p0, tested by the Spearman correlation analysis (unadjusted); r1 and p1, tested by the partial correlation analysis (adjusted for age and sex). C, cholesterol.
Disclaimer/Publisher’s Note: The statements, opinions and data contained in all publications are solely those of the individual author(s) and contributor(s) and not of MDPI and/or the editor(s). MDPI and/or the editor(s) disclaim responsibility for any injury to people or property resulting from any ideas, methods, instructions or products referred to in the content. |
© 2026 by the authors. Licensee MDPI, Basel, Switzerland. This article is an open access article distributed under the terms and conditions of the Creative Commons Attribution (CC BY) license (http://creativecommons.org/licenses/by/4.0/).
Copyright: This open access article is published under a Creative Commons CC BY 4.0 license, which permit the free download, distribution, and reuse, provided that the author and preprint are cited in any reuse.


