
Submitted:
16 January 2026
Posted:
20 January 2026
You are already at the latest version
Abstract
During aging, bone marrow stromal (a.k.a. mesenchymal stem) cells (BMSC) shift their lineage commitment away from osteogenesis and towards adipogenesis, resulting in bone loss and marrow fat accumulation. We previously reported that during osteogenesis, BMSCs activate mitochondrial oxidative phosphorylation (OXPHOS) by downregulating cyclophilin D (CypD) expression and, consequently, mitochondrial permeability transition pore (MPTP) activity. We also reported that in contrast, during adipogenesis, BMSCs upregulate CypD/MPTP, activate glycolysis, and inhibit OXPHOS. To further study the role of CypD/MPTP in BMSC bioenergetics and adipogenesis and bone marrow fat accumulation, we used CypD/MPTP loss-of-function (LOF) or gain-of-function (GOF) models in osteoadipoprogenitors in vitro and in vivo. We found that CypD/MPTP LOF impairs while GOF enhances adipogenesis in vitro and in ectopic bone grafts in vivo. In addition, bioenergetic profiling and metabolomics analyses show evidence of corresponding metabolic reprogramming in CypD/MPTP LOF and GOF cells. In summary, our study demonstrated the role of CypD/MPTP activity during BMSC adipogenesis, facilitating the understanding of stem cell fate determination and molecular mechanism of age-related bone loss as well as bone marrow fat accumulation.
Keywords:
BMSCs
; cyclophilin D
; mitochondrial permeability transition
; adipogenesis
; marrow fat
Introduction
Bone aging is a natural process that involves decreased bone mass and strength. It is associated with increased risk of fracture and bone disorders such as osteoporosis. With aging, a series of physiological changes occur in bone and marrow compartments, resulting in accelerated bone loss, decreased marrow cellularity and increased marrow fat content [1]. While several factors contribute to these changes, the exact underlying mechanisms are not fully understood.
The bone marrow (BM) niche is a complex microenvironment that contains a variety of cell types. It plays a crucial role in regulating the function of hematopoietic stem cells (HSCs) and bone marrow stromal, a.k.a. mesenchymal stem, cells (BMSCs). BMSCs are multipotent cells in BM niche that can self-renew and differentiate into different lineages including osteoblasts, chondrocytes, and adipocytes [2]. Osteolineage cells are essential for bone development, mineralization and remodeling. BMSC-derived osteoblasts form new bones and produce bone matrix proteins. They also secrete a range of growth factors and signaling molecules that can regulate osteogenesis, other marrow cell activities, and even systemic functions [3,4]. Bone marrow adipocytes (BMAs) are the major components of bone marrow adipose tissue (BMAT). They store energy in the form of fat and secrete adipokines e.g. leptin, adiponectin, and TNFα to regulate bone cell metabolism [5]. Different from other types of adipose tissue such as white adipose tissue (WAT) and brown adipose tissue (BAT), BMAs were characterized as a distinct population with unique metabolic features [6].
During aging, BMAT expands and accumulates in the BM niche along with a disrupted balance between bone formation and resorption, leading to BM fat accumulation and bone loss. Although the mechanisms behind it remain not fully understood, several pathological conditions e.g. estrogen deficiency, mechanical unloading and obesity have been linked to these changes [7]. It is also widely recognized that aging alters BMSCs lineage commitment [8]. During aging, the differentiation potential of BMSCs shifts from osteogenesis toward adipogenesis, resulting in decreased osteolineage cells and increased BMAs.
Mitochondria are critical for stem cell homeostasis and differentiation. While undifferentiated stem cells rely on glycolysis [9], metabolic reprogramming manifested by activation of oxidative phosphorylation (OXPHOS), is frequently observed during stem cell differentiation. Several studies including ours have shown that OXPHOS activation is required for osteogenesis of BMSCs [10,11,12,13,14,15], potentially in response to the energy demand and high metabolic requirement during cell differentiation and maturation.
The mitochondrial permeability transition pore (MPTP) is a large non-selective calcium-dependent channel in the inner mitochondrial membrane [16,17]. Though the exact structure and forming mechanisms of MPTP are still under debate, recent studies indicated that FOF1-ATP synthase in the inner mitochondrial membrane undergoes conformational changes, forming the MPTP [18]. MPTP opening allows molecules up to 1.5kDa to diffuse across the membrane. Transient opening of MPTP is involved in the regulation of calcium homeostasis [19,20], reactive oxygen species (ROS) signaling [21,22], cellular metabolic stress response [23], and stem cell differentiation [24]. During stem cell pool maintenance, it may play a physiological role in cell metabolism, maintaining prevalence of aerobic glycolysis over OXPHOS. On the other hand, sustained opening of MPTP leads to pathological conditions including dissipation of mitochondrial membrane potential, mitochondrial swelling, and eventually cell death [18]. Cyclophilin D (CypD), encoded by nuclear gene Ppif, is a highly conserved peptidyl-prolyl cis-trans isomerase in the mitochondrial matrix. It is the only genetically proven positive regulator of MPTP, which promotes pore opening in response to stimuli such as excessive calcium and ROS. CypD has also been reported to regulate MPTP activity by interacting with p53 [25,26]. Besides its role in MPTP regulation, CypD binds to Bcl-2 to regulate apoptosis [27]. Post-translational modifications (PTMs) play an important role in regulating CypD functions, including phosphorylation, oxidation, S-nitrosylation, S-glutathionylation, and acetylation. Acetylation of lysine 166 (K166) is critical for CypD function. Its deacetylation is catalyzed by mitochondrial deacetylase sirtuin 3 (SIRT3) [28]. Though its effect on the enzymatic activity is controversial, CypD K166 acetylation promotes MPTP opening and apoptosis [29].
CypD/MPTP axis is closely related to mitochondrial function and is critical for BMSCs fate. We previously reported that during osteogenesis of BMSCs, CypD is downregulated via BMP/Smad signaling pathway to inhibit MPTP activity [30], leading to higher mitochondrial membrane potential and OXPHOS activity [12,13,14,30,31,32]. We also reported that CypD knockout or pharmacological inhibition by NIM811, a non-immunosuppressive derivative of cyclosporin A and a potent cyclophilin inhibitor, improves bone fracture healing in aging mice [31]. In contrast, we found that CypD overexpression via a constitutively active K166Q acetylation-mimetic CypD mutant impairs BMSC osteogenic differentiation leading to impaired fracture healing in adult mice [33] and accelerated bone loss in aged mice [32]. Therefore, it appears that mitochondrial dysfunction, a well-known hallmark of aging, and high CypD expression in aged bone cells [30] may lead to a glycolytic shift which impairs osteogenic differentiation potential of BMSCs. On the other hand, we recently reported that BMAs activate glycolysis and maintain low mitochondrial respiration by upregulating CypD/MPTP activity via C/EBPα- and NF-κB-mediated transcriptional activation of CypD expression [34]. The increased CypD expression during adipogenesis of BMSCs leads to MPTP opening and a metabolic shift towards glycolysis. However, it remains unclear whether CypD/MPTP activity plays a role in adipogenic lineage commitment as well as in age-related BMAT accumulation.
Here, to further explore the role of CypD during adipogenesis of BMSCs, we introduced shRNA against Ppif or pCMV6-caPpif vector expressing constitutively active K166Q CypD mutant in C3H10T1/2 mesenchymal cell line as loss-of-function (LOF) or gain-of-function (GOF) in vitro model, respectively. To study the effects in vivo, we utilized Prx1-Cre mouse model to generate BMSC-specific deletion (Prx1-Cre;Ppiff/f) or overexpression (Prx1-Cre;R26caPpif/+) of CypD. Due to the complexity of the conditions in vivo, we also performed ectopic bone formation assay using primary mouse BMSCs from the above mouse models to evaluate the impact of CypD manipulation on BMSCs cell fate decision.
Methods
Cell Culture and Adipogenic Differentiation
C3H10T1/2 cells were purchased from ATCC. C3H10T1/2 cells were expanded in low-glucose DMEM (Gibco, 11885084) supplied with 10% fetal bovine serum and 1% penicillin-streptomycin. For adipogenic differentiation, cells were induced in high-glucose (25 mM) DMEM supplied with 10% fetal bovine serum, 1% penicillin-streptomycin, 1 μM dexamethasone, 0.5 mM IBMX, 1 μM rosiglitazone and 10 μg/mL insulin for 2 days, and with rosiglitazone and insulin only afterwards. Media was changed every 2-3 days. Adipogenic differentiation was assessed by Nile Red staining and adipogenic gene expression analysis. Fluorescence intensity was normalized to cell number assessed via nuclear Hoechst 33342 staining and measured by Celigo multiwell plate imager.
Transfection and Stable Clone Selection
As previously described [27], C3H10T1/2 cells were transfected with SureSilencing CypD shRNA vector (SABiosciences) or pCMV6-caPpif vector encoding K166Q constitutively active CypD (caCypD) mutant or corresponding empty vector using X-tremeGENE HP DNA Transfection Reagent (Sigma, 6366236001). For stable CypD knockdown clones, cells were selected with 2 μg/ml puromycin for 2 weeks and maintained in puromycin at 0.4 μg/ml. For stable caCypD clones, cells were selected with G418 (Invitrogen) at 750 μg/ml for 2 weeks and maintained in G418 at 200 μg/ml.
Real-Time RT-qPCR
Total RNA was purified using the Qiagen RNeasy kit (74106) and reversed transcribed into cDNA using the qScript cDNA supermix (Quantabio, 95048-500). cDNA was subjected to RT-qPCR. The primer pairs are outlined in Table S3. RT-qPCR was performed with SYBR Green (Quantabio, 95072-012) using the Qiagen RotorGene system. Reaction efficiency was calculated based on a standard curve. β2-microglobulin (B2m) was used as a reference gene. Raw Ct value was normalized using 2-∆∆Ct method.
Western Blot
Cells were lysed in buffer containing protease inhibitors and subjected to 4-12% sodium dodecyl sulfate polyacrylamide gel electrophoresis (SDS-PAGE) followed by polyvinylidene difluoride (PVDF) membrane transfer. Membrane was then blocked in 5% dry milk reconstituted in PBST (PBS with 0.1% Tween 20). All antibodies were diluted in either in 2% dry milk or 1% BSA in PBST. Membrane was incubated with anti-CypD antibody (RRID: AB 478283, 1:3000), anti-beta Actin antibody (RRID: AB_476697, 1:30000) and secondary HRP conjugated goat anti-mouse or -rabbit antibody (1:3000). Signals were developed with West Femto Substrate (Thermal Fisher Scientific, 34094). Images were taken using Bio-Rad ChemiDoc Touch Imaging System.
Calcium Retention Capacity (CRC) Assay
CRC assay was performed as previously described [31]. C3H10T1/2 cells (1x10⁵) were permeabilized with 0.01% digitonin for 3 min on ice in a KCI-based buffer [30]. Permeabilization was confirmed with Trypan Blue staining (data not shown). Cells were then washed, resuspended, and plated in 100 μL KCI-based buffer containing 1 μM Calcium GreenTM-5N (Invitrogen, C3737) in a 96-well black-walled and clear-bottom plate. Then cells were exposed to pulses of Ca2+ (10 μM increments). Steady-state fluorescent signal after each pulse was measured using BioTek plate reader. 1 μM Cyclosporin A (CsA) was added to inhibit MPTP opening as a negative control. To calculate CRC, two trendlines were created before and after the Ca2+-releasing point, respectively. The x-value of intersection point was calculated as CRC.
Seahorse Assay
Oxygen consumption rate (OCR) and extracellular acidification rate (ECAR) were measured using Seahorse XFe96 Analyzer (Agilent). C3H10T1/2 cells were plated at a density of 20,000 cells per well in a Seahorse 96-well plate and adipogenically induced for 7 days. Immediately before the experiment, media was replaced with unbuffered DMEM media containing 1 mM L-glutamine (Gibco, 25030-08), 5 mM or 25 mM D-glucose (Sigma, G8270) and no pyruvate (pH 7.4). OCR and ECAR baseline were measured, and then an inhibitory analysis was performed with sequential injections of 4 μM oligomycin, 2 μM FCCP, 2 μM rotenone + 2 μM antimycin A, and 2 μM 2-deoxyglucose with 3 μg/mL Hoechst 33342. After analysis, total cell number was measured using Celigo cytometer based on Hoechst signal. The OXPHOS and glycolytic indexes were calculated as previously described [32].
Metabolomics
Samples were prepared as described previously [32]. Cells were washed with 1x PBS and extracted with 80% methanol. After evaporation under nitrogen stream, samples were reconstituted in 50% methanol and analyzed using reverse phase liquid chromatography (LC) with an ion pairing reagent in a Shimadzu HPLC coupled to a Thermo Quantum triple-quad mass spectrometer (MS). Significance level was set as fold change below or above 1.5 and p value below 0.05. Metabolite enrichment analysis was done using MetaboAnalyst web server (https://www.metaboanalyst.ca/) and false discovery rate set below 0.1.
Mouse Strains
C57BL/6J mice were obtained from the Jackson Laboratory (RRID: IMSR_JAX:000664) and bred in house. Ppiff/f transgenic mice were obtained from the Jackson Laboratory (RRID: IMSR_JAX:005737) and bred in house. R26caPpif with C57BL/6 genetic background mice were generated by our lab and Dr. George Porter’s lab in the University of Rochester Gene Targeting and Transgenic Core Facility as described previously [32]. In brief, the CypD gain-of-function (GOF) mice contain a knock-in transgene encoding K166Q constitutively active CypD mutant at Rosa26 locus. Constitutive Prx1-Cre transgenic mice were obtained from the Jackson Laboratory (RRID: IMSR_JAX:005584) and bred in house. The Ppiff/f mice and R26caPpif mice were crossed to constitutive Prx1-Cre transgenic mice, respectively, to generate BMSC-specific CypD deletion (Prx1-Cre+/-; Ppiff/f) or overexpression (Prx1-Cre+/-; R26caPpif). Animal husbandry and experiments were performed upon approval of University of Rochester Institutional Animal Care and Use Committee and in accordance with state and federal law. All mice were housed at 23°C on a 12-h light/dark cycle with free access to water and PicoLab Rodent Diet 20 (LabDiet #5053, St. Louis, MO). Mice were in group housing when applicable based on weaning. The assessments of animal studies were performed in a blinded and coded manner.
Isolation and Culture of Mouse Primary BMSCs
Primary BMSCs were isolated from tibial and femoral bone marrow. Cells were seeded in physiologically relevant low-glucose DMEM (Gibco, 11885084) supplied with 10% fetal bovine serum and 1% penicillin-streptomycin at 20×106 total bone marrow cells per 10 cm dish and incubated at 37°C, 5% CO2 and physiological 5% O2. Media were changed every day for three days to remove nonadherent cells. When large colonies were observed on the dish, cells were trypsinized and purified by magnetic immunodepletion with CD45 (Invitrogen, 13045182) and CD31 (Invitrogen, 13031182) antibody. BMSCs were then seeded and expanded on collagen-coated dishes. Cells before passage number 10 were used for experiments.
Ectopic Bone Formation Assay
mBMSCs were mixed with Matrigel (Corning, CLS354230-1EA) at a concentration of 106 per 50 μL of low-glucose DMEM supplemented with 50 ng/mL of mouse recombinant BMP-2 (R&D systems, 355-BM-010) and subcutaneously implanted into the backs of immunocompromised nude mice. Bone formation was assessed at 4 weeks after implantation by DEXA scan, μCT analysis, histology, and histomorphometry and IF analysis.
Micro-Computed Tomography (μCT) Analysis
Femurs and tibiae were isolated and cleaned of remaining soft tissue. Afterwards, bones were fixed in 10% neutral buffered formalin for 3 days at 4°C with gentle agitation. Before scanning, bones were washed with 1x PBS for 30min at room temperature. Scanning and analysis were performed by Histology, Biochemistry, and Molecular Imaging (HBMI) Core at Center for Musculoskeletal Research (University of Rochester). In brief, bones were scanned using Scanco VivaCT 40 (Scanco Medical) with high resolution acquisition (10.5 μm voxel size).
Dual-Energy X-Ray Absorptiometry (DEXA)
Isoflurane-anesthetized mice were scanned and area of interest selected using Lunar PIXImus2 system. For our purpose, BMSC grafts were analyzed in terms of bone mineral density (BMD), bone mineral content (BMC) and fat percentage.
Osmium Tetroxide Staining
Bone marrow fat staining was performed as described in the previous literature [35]. Femurs and tibiae were isolated and cleaned to get rid of excessive soft tissue. Then bones were fixed in 10% neutral buffered formalin for 24h at 4°C with gentle agitation and then washed with 1x PBS and decalcified in Webb Jee solution (14% EDTA solution) for 2 weeks at 4°C with gentle agitation. Decalcification solution was replenished every three to four days. Before staining, bones were washed with cool tap water for 1h. Fresh 1% osmium tetroxide solution was prepared in distilled water with 2.5% potassium dichromate (Sigma). Osmium tetroxide was allowed to dissolve slowly in the solution for 48h. Bones were incubated in the 1% osmium tetroxide solution for 48h in a fume hood and then washed with cool tap water for 2h. μCT scanning and analysis were performed by Histology, Biochemistry, and Molecular Imaging (HBMI) Core at Center for Musculoskeletal Research (University of Rochester). Scanning parameters were set up as described in the literature [35].
Histology
After μCT scanning, bones were decalcified as described above. Paraffin embedding was performed by Histology, Biochemistry, and Molecular Imaging (HBMI) Core at Center for Musculoskeletal Research (University of Rochester). Bones were sectioned at 5 μm and stained for H&E, alcian blue hematoxylin/orange G (ABH/OG), or for IF staining. Slides were imaged using an Olympus VS120 Virtual Slide Microscope. Bone area from ABH/OG sections was quantified using ImageJ.
Immunofluorescence (IF) Staining
Bone tissue sections were deparaffinized and rehydrated, then air-dried. Antigen retrieval was performed in sodium citrate at 60°C overnight. Then sections were washed with 1x PBS and blocked with 2.5% goat serum for 30 min and incubated with Perilipin-1 primary antibody (Cell Signaling #9349) at 1:100 dilution in PBS + 0.1% Tween-20 and 5% normal goat serum at room temperature for 2 hours. Sections were then incubated with anti-rabbit IgG secondary antibody conjugated with Alexa Fluor® 647 (RRID: AB_2338072) at 1:200 dilution for 1 hour. Fluoroshield Mounting Medium with DAPI (ab104139) was used to counterstain. Perilipin positive area and cell number was quantified using ImageJ.
Statistics
A power analysis of in vivo experiment data was performed since it showed the highest variance. It was determined that some quantitative outcomes would require 7 mice per group. At least three independent experiments were performed for each panel of the figures. A two-tailed unpaired t-test was used for analysis when two groups were compared, and sample data were normally distributed. When more than two groups were compared, we performed Ordinary one-way ANOVA with either Tukey or Dunnett test based on normal spread of the data. With a significance level at 5%, we calculated mean values and standard deviations using GraphPad Prism Software.
Results
CypD Knockdown Decreases MPTP Activity and Impairs Adipogenesis, Whereas caCypD Expression Increases MPTP Activity and Enhances Adipogenesis
Similar to what is observed in aging humans, C57BL/6J mice show progressively decreased bone mass and strength during aging [36]. Bone marrow fat in aged mice is significantly increased when compared to young mice (Figure S1). In the meantime, CypD expression is upregulated in aged BMSCs [30,37]. We also previously have shown that CypD is increased during adipogenesis [34]. To further study the role of CypD in bone marrow adipogenesis, we generated stable CypD knockdown cell line using shRNA against Ppif gene as we previously described [27]. C3H10T1/2 mesenchymal cell line is a commonly used model of osteoadipoprogenitors. These cells were transfected with either shRNA against Ppif or control shRNA and stably selected with puromycin. Knockdown of CypD was confirmed by mRNA expression (Figure 1C) and protein level (Figure S2A). CypD knockdown showed significantly lower lipid droplets accumulation after 7-day of adipogenesis when compared to control (Figure 1A and 1B). Expression of adipogenic genes, Pparg, Adipoq and Cebpa, was significantly decreased in cells with CypD knockdown vs controls (Figure 1D), which is consistent with the data of Nile Red staining. To determine whether CypD knockdown increases osteogenic potential during adipogenesis, we analyzed Runx2 gene expression, a master regulator of osteogenesis. We found that in CypD knockdown cells, Runx2 was expressed at a higher level and downregulated to a lesser extent during adipogenesis (Figure 1D), suggesting a compromised adipogenic process. NIM811 is a nonimmunosuppressive derivative of cyclosporin A and a potent cyclophilin inhibitor. Pharmacological inhibition of CypD by NIM811 also showed decreased lipid droplets (Figure S3A and S3B) and adipogenic marker gene, Pparg, expression (Figure S3C) in adipo-induced C3H10T1/2 cells on day 7. To evaluate MPTP activity, we performed calcium retention capacity (CRC) assay as described in Methods. We found that CypD knockdown showed significantly higher CRC in undifferentiated cells and adipocytes compared to control (Figure S2B and S2C) indicating lower MPTP activity. In summary, these results demonstrate that CypD knockdown decreases MPTP activity and impairs adipogenesis of osteoadipoprogenitors.
As a CypD gain-of-function model, we generated stable caPpif overexpression cell line as described in our previous work [27]. We transfected C3H10T1/2 cells with either pCMV6-caPpif vector encoding constitutively active K166Q CypD (caCypD) mutant or empty vector control and performed selection with G418. Ppif gene was expressed at a higher level in caCypD cells during adipogenesis when compared to control (Figure 1G and S2D). The higher molecular weight of caCypD protein was due to presence of Myc- and DDK-tags (Figure S2D). Nile Red staining showed that caCypD expression increased lipid droplet accumulation (Figure 1E and 1F). Adipogenic genes were expressed at a significantly higher level in caCypD cells on day 7 of adipogenesis (Figure 1H). By performing CRC assay, we found that undifferentiated caCypD cells had lower CRC and, therefore, higher MPTP activity when compared to control (Figure S2E and S2F). On day 7 of adipogenesis, caCypD cells showed lower CRC when compared to day 0 (Figure S2E and S2F). However, the CRC of caCypD expression and control was similar on day 7, which might be because they have reached the maximum MPTP activity. Taken together, our data demonstrate that caCypD expression increases MPTP opening and enhances adipogenic potential of osteoadipoprogenitors.
CypD Knockdown Improves Mitochondrial Function, Whereas caCypD Expression Impairs Mitochondrial Function and Activates Glycolysis
To evaluate the effects of CypD manipulation on cell bioenergetics, we measured OXPHOS and glycolysis level using Seahorse XFe96 Analyzer. On day 7 of adipogenesis, CypD knockdown significantly upregulated basal respiration, ATP-linked respiration, maximal respiration, and reserved capacity (Figure 2A and 2C), indicating that CypD knockdown activates mitochondrial OXPHOS function. Furthermore, CypD knockdown showed significant decrease in basal glycolysis and glycolytic capacity (Figure 2B and 2D), suggesting a metabolic shift towards OXPHOS in CypD knockdown cells. Taken together, these data demonstrate that CypD knockdown decreases MPTP activity, activates mitochondrial OXPHOS function, decreases glycolysis, and impairs adipogenic potential of osteoadipoprogenitors likely in favor of osteogenesis.
In contrast, adipogenically induced caCypD cells showed significantly lower basal respiration, ATP-linked respiration, proton leak, maximal respiration, and reserved capacity (Figure 2E and 2G). However, glycolytic level remained unchanged when compared to control cells (Figure 2F and 2H), which might be because adipocytes already activate glycolysis and thus have reached a threshold. In conclusion, these results demonstrate that caCypD expression increases MPTP opening, decreases OXPHOS and enhances adipogenic potential of osteoadipoprogenitors.
We next performed untargeted LC-MS metabolomics analysis in undifferentiated CypD knockdown and caCypD expression cells. In CypD knockdown cells, we found that isocitrate, acetoacetate, L-acetylcarnitine and L-threonine were significantly enriched (Figure 3A). NAD+/NADH ratio and reduced to oxidized glutathione (GSH/GSSG) ratio were also increased, suggesting enhanced OXPHOS and lower oxidative stress. Meanwhile, lactate was significantly downregulated, which is consistent with the observed decreased glycolysis level (Figure 2B and 2D). The top 30 differentially expressed metabolites were clustered and visualized by heatmap. CypD knockdown showed several upregulated metabolites in TCA cycles such as succinate and acetyl-CoA as well as ATP/ADP ratio (Figure 3B), indicating active mitochondrial function and energy production.
On the other hand, caCypD expression cells significantly increased glycolytic glucose-6-phosphate, fructose-6-phosphate and dihydroxyacetone phosphate (DHAP) (Figure 4A), consistent with upregulated glycolysis level (Figure 2F and 2H). Taurine, an amino acid that protects cells against oxidative stress, was enriched in caCypD expression cells, likely indicating compensation against increased ROS level due to increased MPTP activity. Several metabolites were significantly downregulated including NADP+, L-tyrosine, D-erythrose-4-phosphate, phosphocreatine and glutathione. The hierarchically clustered heatmap also revealed increased glycolysis features such as upregulated lactate (Figure 4B). The decreased ATP/ADP ratio could be attributed to low mitochondrial function and high MPTP activity.
In summary, CypD knockdown and caCypD expression induce metabolic reprogramming in mouse osteoadipoprogenitors. CypD knockdown decreases MPTP activity and improves mitochondrial function, whereas caCypD expression increases MPTP activity, impairs mitochondrial function and activates glycolysis.
BMSC-Specific CypD Knockout Decreases Whereas caCypD Expression Increases Fat Accumulation During Ectopic Bone Formation in Mice
To evaluate the effects of CypD knockout in primary mouse BMSCs, we crossed Prx1-Cre mice to Ppiff/f mice to achieve BMSC-specific CypD deletion. Western blot analysis was performed to validate CypD knockout in mBMSCs isolated from Prx1-Cre; Ppiff/f mice (Figure 5A). After 7-day adipogenic induction, CypD knockout cells show decreased lipid droplet accumulation compared to control (Figure 5B and 5C). Expression of adipogenic genes, Pparg, Cebpa and Adipoq, were also decreased after CypD knockout (Figure 5D). Taken together, similar to C3H10t1/2 cells, CypD deletion in primary mouse BMSCs impairs adipogenesis.
CaCypD expression in primary mBMSCs was achieved by crossing Prx1-Cre mice to R26caPpif mice that we generated earlier and described in our previous reports. Expression of constitutively active K166Q CypD mutant with Myc and DDK tags was confirmed by western blot analysis (Figure 5E). Interestingly, in undifferentiated BMSCs, caCypD expression already showed increased lipid droplets compared to control cells (Figure S4A and S4B). After 7-day adipogenic induction, caCypD cells showed significantly higher lipid droplet accumulation (Figure 5F and 5G). Adipogenic genes, Pparg and Cebpa, were expressed at higher levels in caCypD BMSCs when compared to control cells (Figure 5H). To summarize, caCypD expression in primary mouse BMSCs enhances adipogenesis.
Next, we sought to evaluate how CypD knockout and caCypD expression in BMSCs affect bone and bone marrow fat accumulation during aging. At 12 months of age, CypD knockout in BMSCs did not affect bone marrow fat accumulation compared to control mice (Figure S5). CaCypD expression, on the other hand, showed decrease in femur marrow fat in male mice (Figure S6), which was an unexpected finding. The data were summarized in Table S1 and S2. Taken together, BMSC-specific CypD manipulation had little effect on bone marrow adiposity and showed sexual dimorphism, potentially due to some systemic compensatory effects in vivo [38,39].
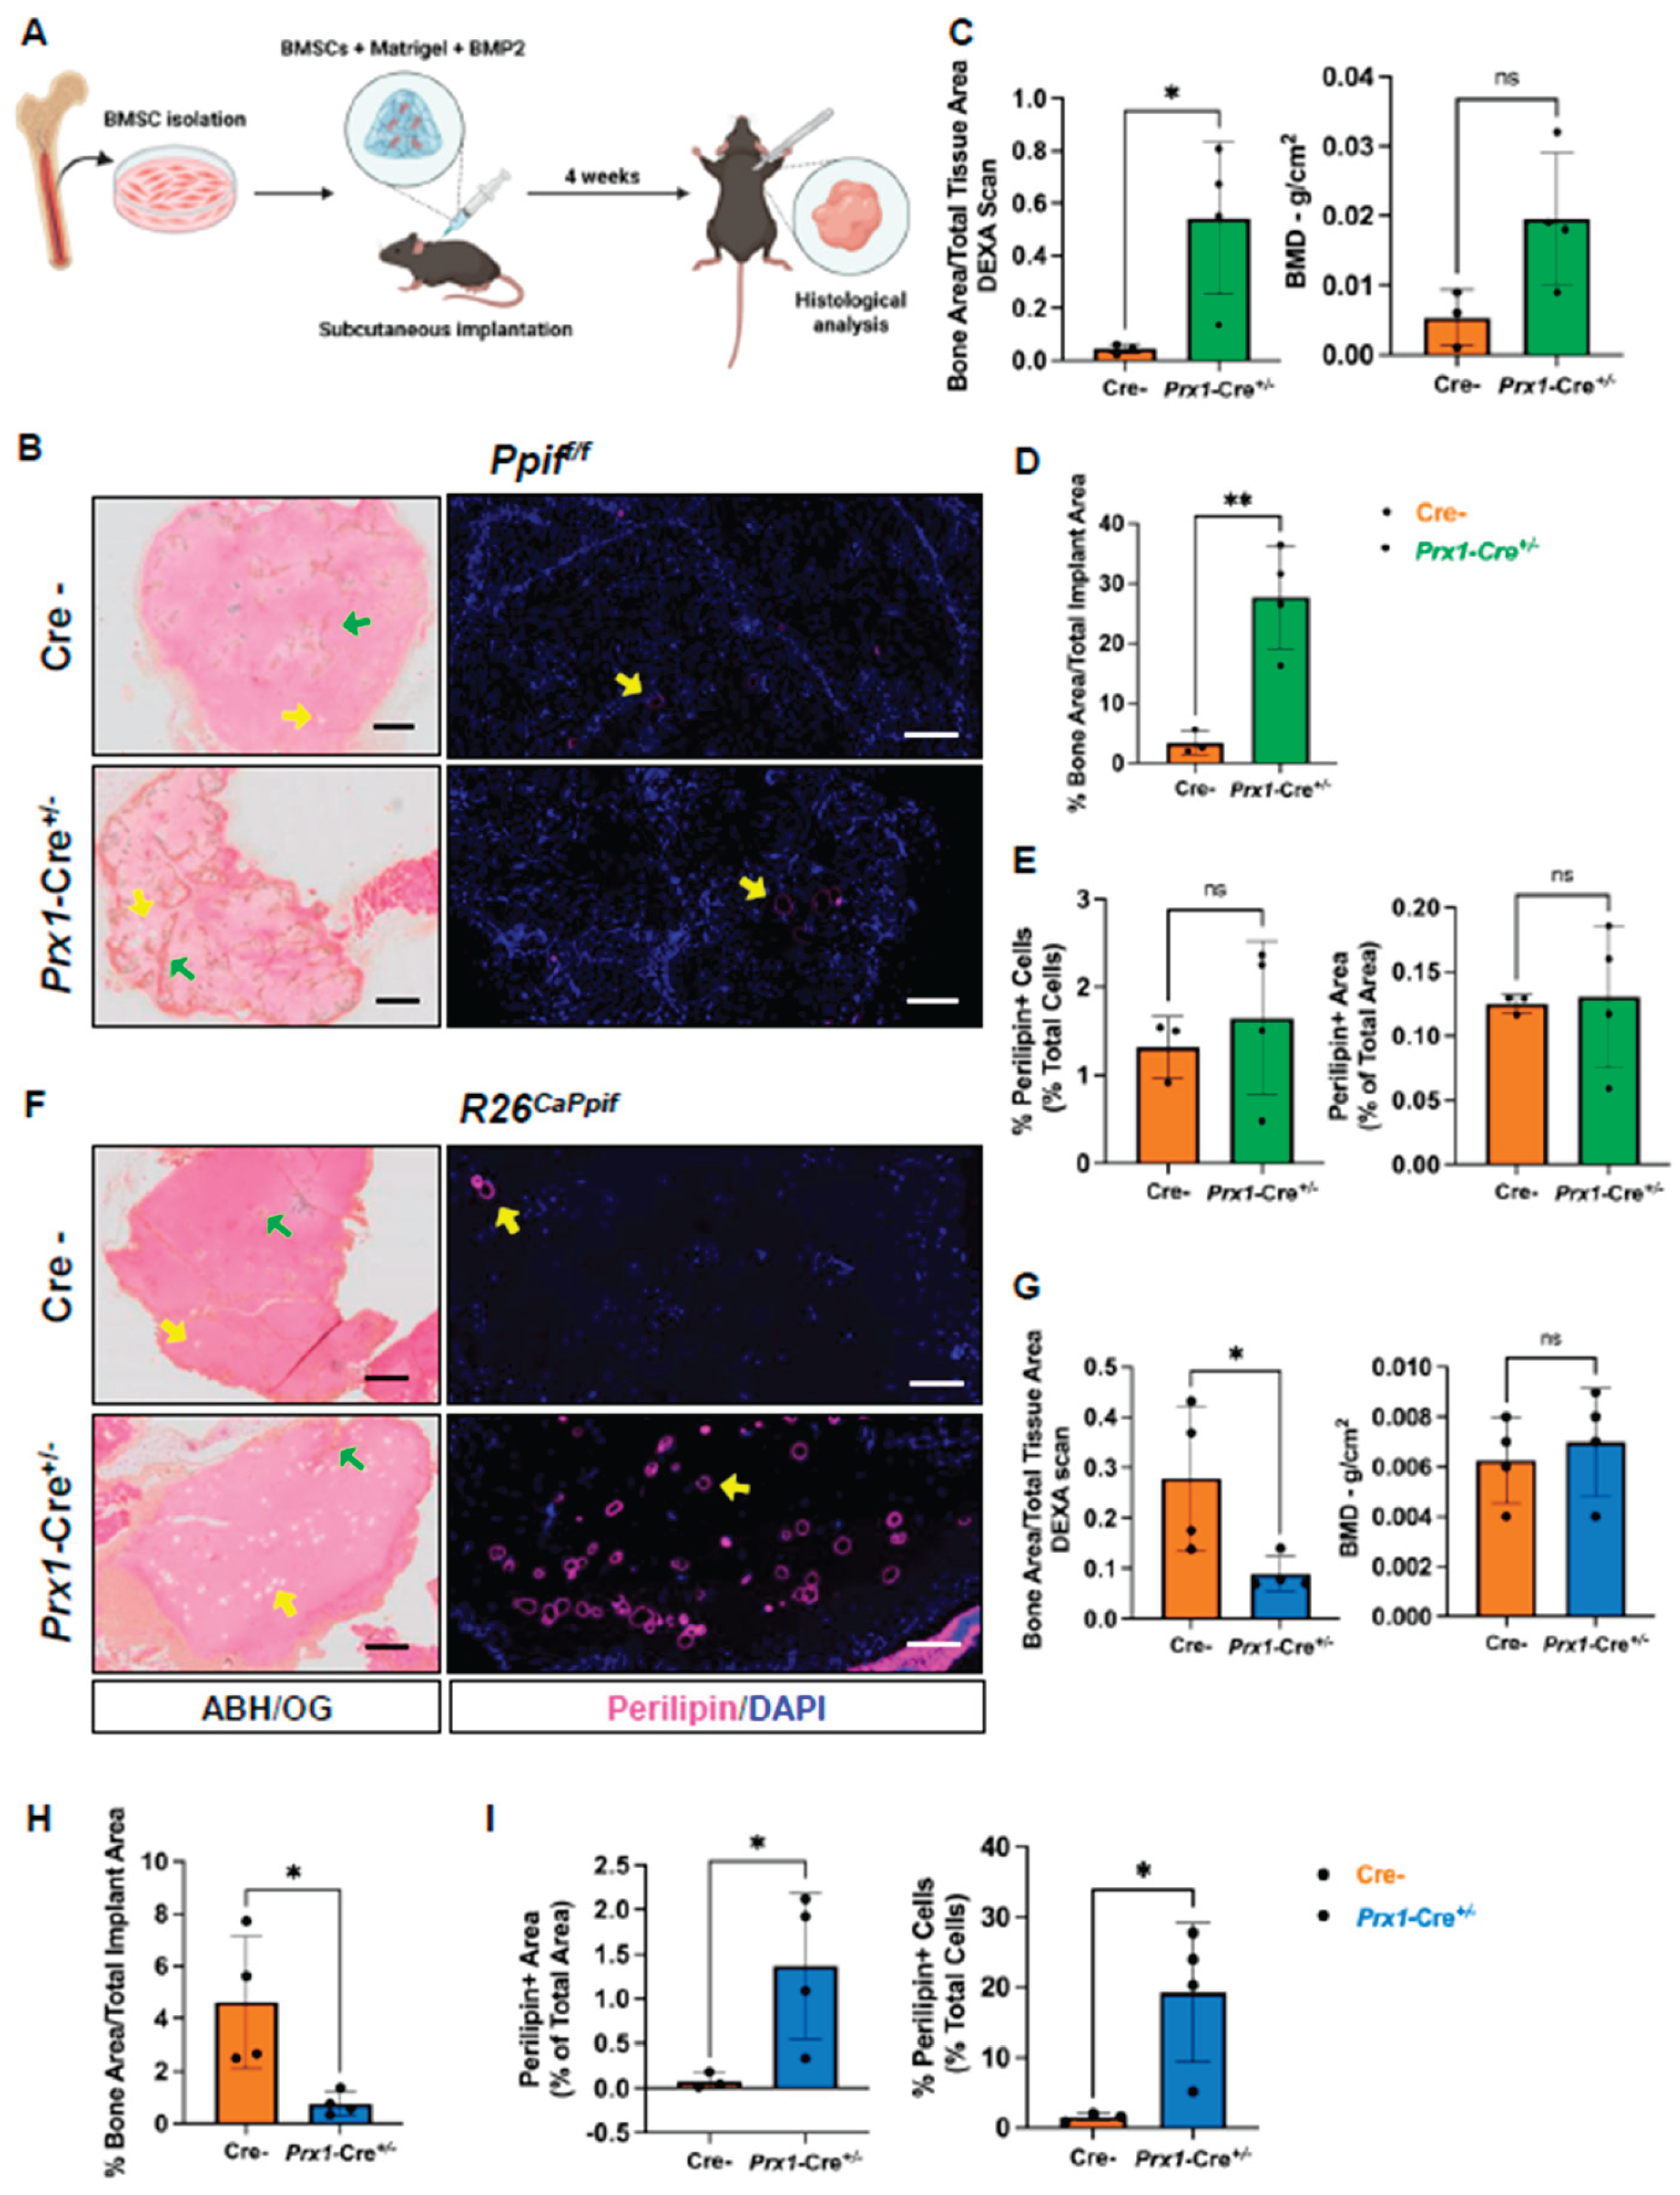
In order to demonstrate the effects of BMSC-specific CypD manipulation on bone adiposity and minimize systemic interferences, we performed ectopic bone formation assay (Figure 6A). Mouse BMSCs were expanded in vitro, mixed with Matrigel with 50 ng/mL BMP2 and implanted subcutaneously into the recipient nude mice. After four weeks, CypD knockout BMSC grafts showed significantly increased ectopic bone area by DEXA scan and ABH/OG staining (Figure 6C, 6G and 6H), whereas adipocyte size and number were not affected (Figure 6C and 6I). In contrast, caCypD expression BMSC grafts had significantly less ectopic bone (Figure 6B, 6D and 6E) and significantly higher adipocyte number and size (Figure 6B and 6F). In conclusion, these data confirm that CypD/MPTP loss-of-function BMSCs increases osteogenic and decreases adipogenic potential in BMSCs, whereas CypD/MPTP gain-of-function decreases osteogenic and increases adipogenic potential.
Discussion
The pretext for this study was our previous data and the literature showing the following: 1) At the adult stage and in the absence of fracture, BMSCs differentiate into either osteoblasts or bone marrow adipocytes, cells that have very different metabolic and biosynthetic requirements [12,13,14]; 2) Activation of mitochondrial OXPHOS is essential for osteogenic differentiation and is achieved at least in part via downregulation of CypD and, thereby, suppression of MPTP activity during osteogenesis [12,13,14,30,31,32,33,34,36]; and 3) In contrast, adipocytes upregulate CypD gene, Ppif, transcription due to C/EBP-mediated activation of Ppif gene promoter and increase MPTP opening, resulting in less active mitochondrial OXPHOS and elevated glycolysis when compared to osteoblasts. The current study was aimed at further investigating the role of CypD/MPTP in BMSC fate decisions by manipulating CypD expression and activity during BMSC adipogenesis.
We observed that CypD LOF in C3H10T1/2 mesenchymal cell line and in primary BMSCs (Prx1-Cre; Ppiff/f) inhibits MPTP opening in both undifferentiated cells and adipogenically induced cells, thereby increasing mitochondrial membrane integrity and stimulating OXPHOS. During adipogenic induction, CypD LOF BMSCs display higher Runx2 levels indicating the role of CypD/MPTP in BMSC fate decisions since Runx2 is a major osteogenic factor that was also shown before to suppress adipogenesis [40]. On the other hand, CypD/MPTP GOF via caCypD overexpression in C3H10T1/2 cells and in primary BMSCs (Prx1-Cre; R26caPpif/+) reduces OXPHOS activity and enhances glycolysis, eventually favoring adipogenic differentiation. Notably, undifferentiated BMSCs with CypD GOF display increased Cebpa expression and lipid droplet accumulation, indicating an early metabolic shift toward adipogenesis.
Consistent with this, the metabolomics analysis revealed important metabolic changes triggered by CypD manipulation. In undifferentiated CypD LOF cells, key TCA cycle intermediates, including isocitrate, succinate, and acetyl-CoA, were enriched, accompanied by increased ATP/ADP ratio, suggesting enhanced OXPHOS. In the meantime, reduced lactate level indicates decreased glycolysis. CypD LOF cells also show increased levels of acetoacetate, L-threonine, and L-acetylcarnitine, metabolites important for maintaining levels of mitochondrial acetyl-CoA to fuel the TCA cycle and ATP production [41,42,43]. Acetoacetate can also regulate mitochondrial redox balance and protect cells from oxidative stress [44,45,46,47]. L-Cysteine, a precursor for glutathione (GSH), was downregulated, which may suggest active GSH synthesis. Together with the observed increases in NAD+/NADH and GSH/GSSG ratios, this result supports better protection against oxidative stress. Overall, these metabolic profiling and metabolomics data indicate that CypD LOF activates OXPHOS while lowering MPTP activity and protecting cells from ROS. Conversely, CypD GOF cells expressing caCypD exhibited accumulation of glycolytic intermediates including glucose-6-phosphate, fructose-6-phosphate, and DHAP, along with increased lactate levels. ATP/ADP ratio was reduced, which might be due to impaired mitochondrial function. D-erythrose-4-phosphate, an intermediate in the pentose phosphate pathway (PPP), was significantly decreased, suggesting a less active biosynthesis state for amino acids and nucleotides, similar to the aging phenotype in cells. In addition, TCA cycle metabolites and precursors of fatty acids, isocitrate and citrate, were increased. Together with the fact that a marker of reductive carboxylation of glutamine, 2-hydroxyglutarate (2-HG), was also increased, this may indicate increased fatty acid biosynthesis. Reductive carboxylation of glutamine was shown before to promote lipid biosynthesis [48,49,50]. It is also consistent with our previous findings in the osteoblast-specific CypD GOF model [32]. Collectively, these results indicate that CypD/MPTP regulates metabolic reprogramming and influences fate decisions in BMSCs.
Our previous studies showed that global CypD knockout or use of a systemic CypD/MPTP inhibitor in mice promotes fracture healing and prevents age-related bone loss [31,36]. Others reported protection effects of CypD/MPTP LOF against diet-induced obesity [51,52,53,54]. To examine the role of CypD in BMSCs specifically, we used Prx1-Cre to conditionally knock out CypD and assessed effects on bone and marrow fat. BMSC-specific CypD deletion did not alter marrow fat and appeared to negatively affect trabecular bone, with some sex- and age-dependent differences, despite in vitro findings of reduced adipogenesis and enhanced osteogenesis. These discrepancies may result from compensatory effects of hormones such as growth hormone or estrogen [38,39] and influence of the microenvironment superceding any cell-autonomous effects. In females, trabecular changes observed at a young age were absent in middle age, possibly reflecting developmental effects, whereas in males, differences emerged only at middle age, suggesting an age-related effect induced by CypD knockout. Overall, BMSC-specific CypD knockout did not replicate the systemic benefits seen in global knockout mice at the age of 12 months.
We previously showed that osteoblast-specific CypD overexpression impairs osteoblast function and bone strength [30,32]. With Prx1-Cre-mediated BMSC-specific caCypD overexpression, female mice exhibited no changes in bone parameters, possibly due to compensatory mechanisms. In males, middle-aged mice showed reduced tibial cortical thickness but increased femoral trabecular bone density. Regarding marrow fat, females had reduced fat at a young age, which normalized by middle age, suggesting a developmental effect. In contrast, males showed decreased femoral marrow fat only at middle age. Overall, this gain-of-function model displays sexual dimorphism, and the variable outcomes may be attributed to systemic compensatory signaling in vivo.
BMP2-mediated ectopic bone formation assay provides an alternative strategy to evaluate cell-autonomous effects of CypD knockout or overexpression on BMSC differentiation in vivo [55,56,57]. Using this assay, we showed that CypD-deficient BMSCs formed significantly more ectopic bone with fewer adipocytes, whereas caCypD-expressing BMSCs showed reduced bone formation and increased fat accumulation. These results are consistent with the in vitro data suggesting a cell-autonomous pro-osteogenic effect of CypD/MPTP LOF and a pro-adipogenic effect of CypD/MPTP GOF. Overall, it indicates that CypD is an important regulator of BMSC lineage commitment, likely through its effects on mitochondrial function and MPTP activity.
In summary, here we show that CypD LOF impairs while GOF enhances adipogenesis in BMSC both in vitro and in vivo in cell-autonomous manner. During aging, CypD is upregulated in both BMSCs and osteoblasts [30,37], resulting in high MPTP activity and mitochondrial dysfunction. The caCypD expression model provides important evidence for understanding the bone and marrow aging phenotypes as increased CypD/MPTP activity and metabolic shift toward glycolysis favor adipogenesis, leading to age-related accelerated bone loss and accumulated marrow fat.
Supplementary Materials
The following supporting information can be downloaded at the website of this paper posted on Preprints.org.
Author Contributions
R. A. E. conceptualization; R. A. E., S. E. C., and C. Y. methodology; C. Y. and S. E. C. investigation; C. Y. and S. E. C. formal analysis; C. Y. and S. E. C. writing—original draft; R. A. E writing, review and editing; R. A. E. resources; C. Y. and S. E. C. data curation; R. A. E. supervision; R. A. E. project administration; R. A. E. funding acquisition; C. Y. visualization.
Funding and additional information
Funding was provided by the National Institute of Health grants R01 AR072601, R01 AG080188, R01 AG076786 to R.A.E., R21 AR070928 to R.A.E, and P30 AR069655 to the Center for Musculoskeletal Research.
Abbreviations
| BMSCs | bone marrow stromal cells |
| HSCs | hematopoietic stem cells |
| BMAs | bone marrow adipocytes |
| OBs | osteoblasts |
| BM | bone marrow |
| BMAT | bone marrow adipose tissue |
| WAT | white adipose tissue |
| BAT | brown adipose tissue |
| OXPHOS | oxidative phosphorylation |
| MPTP | mitochondrial permeability transition pore |
| CypD | Cyclophilin D |
| caCypD | K166Q constitutively active CypD |
| ROS | reactive oxygen species |
| PTMs | post-translational modifications |
| LOF | loss of function |
| GOF | gain of function |
| OCR | oxygen consumption rate |
| ECAR | extracellular acidification rate |
| LC-MS | liquid chromatography-mass spectrometry |
| BMD | bone mineral density |
| BMC | bone mineral content |
| ABH/OG | alcian blue hematoxylin/orange G |
| CRC | calcium retention capacity |
| DHAP | dihydroxyacetone phosphate |
| GSH | glutathione |
| GSSG | glutathione disulfide |
| PPP | pentose phosphate pathway |
| 2-HG | 2-hydroxyglutarate |
References
- Boskey, A.L.; Coleman, R. Aging and bone. J Dent Res 2010, 89(12), 1333–48. [Google Scholar] [CrossRef]
- Kfoury, Y.; Scadden, D.T. Mesenchymal cell contributions to the stem cell niche. Cell Stem Cell 2015, 16(3), 239–53. [Google Scholar] [CrossRef]
- Han, Y.; et al. Paracrine and endocrine actions of bone-the functions of secretory proteins from osteoblasts, osteocytes, and osteoclasts. Bone Res 2018, 6, 16. [Google Scholar] [CrossRef]
- Karsenty, G. Update on the Biology of Osteocalcin. Endocr Pract 2017, 23(10), 1270–1274. [Google Scholar] [CrossRef]
- Shin, E.; Koo, J.S. The Role of Adipokines and Bone Marrow Adipocytes in Breast Cancer Bone Metastasis. Int J Mol Sci 2020, 21(14). [Google Scholar] [CrossRef] [PubMed]
- Suchacki, K.J.; et al. Bone marrow adipose tissue is a unique adipose subtype with distinct roles in glucose homeostasis. Nat Commun 2020, 11(1), 3097. [Google Scholar] [CrossRef] [PubMed]
- Hamrick, M.W.; McGee-Lawrence, M.E.; Frechette, D.M. Fatty Infiltration of Skeletal Muscle: Mechanisms and Comparisons with Bone Marrow Adiposity. Front Endocrinol (Lausanne) 2016, 7, 69. [Google Scholar] [CrossRef] [PubMed]
- Nehlin, J.O.; et al. Aging and lineage allocation changes of bone marrow skeletal (stromal) stem cells. Bone 2019, 123, 265–273. [Google Scholar] [CrossRef]
- Rafalski, V.A.; Mancini, E.; Brunet, A. Energy metabolism and energy-sensing pathways in mammalian embryonic and adult stem cell fate. J Cell Sci 2012, 125 Pt 23, 5597–608. [Google Scholar] [CrossRef]
- Chen, C.T.; et al. Coordinated changes of mitochondrial biogenesis and antioxidant enzymes during osteogenic differentiation of human mesenchymal stem cells. Stem Cells 2008, 26(4), 960–8. [Google Scholar] [CrossRef]
- Forni, M.F.; et al. Murine Mesenchymal Stem Cell Commitment to Differentiation Is Regulated by Mitochondrial Dynamics. Stem Cells 2016, 34(3), 743–55. [Google Scholar] [CrossRef]
- Shares, B.H.; et al. Active mitochondria support osteogenic differentiation by stimulating β-catenin acetylation. J Biol Chem 2018, 293(41), 16019–16027. [Google Scholar] [CrossRef]
- Shum, L.C.; et al. Energy Metabolism in Mesenchymal Stem Cells During Osteogenic Differentiation. Stem Cells Dev 2016, 25(2), 114–22. [Google Scholar] [CrossRef] [PubMed]
- Smith, C.O.; Eliseev, R.A. Energy Metabolism During Osteogenic Differentiation: The Role of Akt. Stem Cells Dev 2021, 30(3), 149–162. [Google Scholar] [CrossRef] [PubMed]
- Yu, Y.; et al. Glutamine Metabolism Regulates Proliferation and Lineage Allocation in Skeletal Stem Cells. Cell Metab 2019, 29(4), 966–978.e4. [Google Scholar] [CrossRef] [PubMed]
- Kinnally, K.W.; Campo, M.L.; Tedeschi, H. Mitochondrial channel activity studied by patch-clamping mitoplasts. J Bioenerg Biomembr 1989, 21(4), 497–506. [Google Scholar] [CrossRef]
- Petronilli, V.; Szabò, I.; Zoratti, M. The inner mitochondrial membrane contains ion-conducting channels similar to those found in bacteria. FEBS Lett 1989, 259(1), 137–43. [Google Scholar] [CrossRef]
- Bernardi, P.; et al. Identity, structure, and function of the mitochondrial permeability transition pore: controversies, consensus, recent advances, and future directions. Cell Death Differ 2023, 30(8), 1869–1885. [Google Scholar] [CrossRef]
- Bernardi, P.; von Stockum, S. The permeability transition pore as a Ca(2+) release channel: new answers to an old question. Cell Calcium 2012, 52(1), 22–7. [Google Scholar] [CrossRef]
- Ichas, F.; Jouaville, L.S.; Mazat, J.P. Mitochondria are excitable organelles capable of generating and conveying electrical and calcium signals. Cell 1997, 89(7), 1145–53. [Google Scholar] [CrossRef]
- Wang, W.; et al. Superoxide flashes in single mitochondria. Cell 2008, 134(2), 279–90. [Google Scholar] [CrossRef]
- Zorov, D.B.; et al. Reactive oxygen species (ROS)-induced ROS release: a new phenomenon accompanying induction of the mitochondrial permeability transition in cardiac myocytes. J Exp Med 2000, 192(7), 1001–14. [Google Scholar]
- Ding, Y.; et al. Mitoflash altered by metabolic stress in insulin-resistant skeletal muscle. J Mol Med (Berl) 2015, 93(10), 1119–30. [Google Scholar] [CrossRef]
- Folmes, C.D.; et al. Mitochondria in control of cell fate. Circ Res 2012, 110(4), 526–9. [Google Scholar] [CrossRef] [PubMed]
- Chen, M.B.; et al. C6 ceramide dramatically increases vincristine sensitivity both in vivo and in vitro, involving AMP-activated protein kinase-p53 signaling. Carcinogenesis 2015, 36(9), 1061–70. [Google Scholar] [CrossRef]
- Wolff, S.; et al. p53's mitochondrial translocation and MOMP action is independent of Puma and Bax and severely disrupts mitochondrial membrane integrity. Cell Res 2008, 18(7), 733–44. [Google Scholar] [CrossRef]
- Eliseev, R.A.; et al. Cyclophilin D interacts with Bcl2 and exerts an anti-apoptotic effect. J Biol Chem 2009, 284(15), 9692–9. [Google Scholar] [CrossRef] [PubMed]
- Hafner, A.V.; et al. Regulation of the mPTP by SIRT3-mediated deacetylation of CypD at lysine 166 suppresses age-related cardiac hypertrophy. Aging (Albany NY) 2010, 2(12), 914–23. [Google Scholar] [CrossRef] [PubMed]
- Porter, G.A., Jr.; Beutner, G. Cyclophilin D, Somehow a Master Regulator of Mitochondrial Function. Biomolecules 2018, 8(4). [Google Scholar] [CrossRef]
- Sautchuk, R.; et al. Transcriptional regulation of cyclophilin D by BMP/Smad signaling and its role in osteogenic differentiation. Elife 2022, 11. [Google Scholar] [CrossRef]
- Shares, B.H.; et al. Inhibition of the mitochondrial permeability transition improves bone fracture repair. Bone 2020, 137, 115391. [Google Scholar] [CrossRef]
- Sautchuk, R., Jr.; et al. Role of the Mitochondrial Permeability Transition in Bone Metabolism and Aging. J Bone Miner Res 2023, 38(4), 522–540. [Google Scholar] [CrossRef]
- Sautchuk, R., Jr.; et al. Cyclophilin D, regulator of the mitochondrial permeability transition, impacts bone development and fracture repair. Bone 2024, 189, 117258. [Google Scholar] [CrossRef]
- Yu, C.; et al. Mitochondrial permeability transition regulator, cyclophilin D, is transcriptionally activated by C/EBP during adipogenesis. J Biol Chem 2023, 299(12), 105458. [Google Scholar] [CrossRef]
- Scheller, E.L.; et al. Use of osmium tetroxide staining with microcomputerized tomography to visualize and quantify bone marrow adipose tissue in vivo. Methods Enzymol 2014, 537, 123–39. [Google Scholar]
- Shum, L.C.; et al. Cyclophilin D Knock-Out Mice Show Enhanced Resistance to Osteoporosis and to Metabolic Changes Observed in Aging Bone. PLoS One 2016, 11(5), e0155709. [Google Scholar] [CrossRef] [PubMed]
- Ambrosi, T.H.; et al. Aged skeletal stem cells generate an inflammatory degenerative niche. Nature 2021, 597(7875), 256–262. [Google Scholar] [CrossRef] [PubMed]
- Wabitsch, M.; et al. The role of growth hormone/insulin-like growth factors in adipocyte differentiation. Metabolism 1995, 44((10) Suppl 4, 45–9. [Google Scholar] [CrossRef] [PubMed]
- Cooke, P.S.; Naaz, A. Role of estrogens in adipocyte development and function. Exp Biol Med (Maywood) 2004, 229(11), 1127–35. [Google Scholar] [CrossRef]
- Zhang, Y.Y.; et al. Down-regulation of type I Runx2 mediated by dexamethasone is required for 3T3-L1 adipogenesis. Mol Endocrinol 2012, 26(5), 798–808. [Google Scholar] [CrossRef]
- Schroeder, M.A.; et al. The cycling of acetyl-coenzyme A through acetylcarnitine buffers cardiac substrate supply: a hyperpolarized 13C magnetic resonance study. Circ Cardiovasc Imaging 2012, 5(2), 201–9. [Google Scholar] [CrossRef]
- Fukao, T.; et al. Ketone body metabolism and its defects. J Inherit Metab Dis 2014, 37(4), 541–51. [Google Scholar] [CrossRef]
- Kim, J.; et al. L-threonine promotes healthspan by expediting ferritin-dependent ferroptosis inhibition in C. elegans. Nat Commun 2022, 13(1), 6554. [Google Scholar] [CrossRef]
- Massieu, L.; et al. Acetoacetate protects hippocampal neurons against glutamate-mediated neuronal damage during glycolysis inhibition. Neuroscience 2003, 120(2), 365–78. [Google Scholar] [CrossRef] [PubMed]
- Noh, H.S.; et al. Acetoacetate protects neuronal cells from oxidative glutamate toxicity. J Neurosci Res 2006, 83(4), 702–9. [Google Scholar] [CrossRef] [PubMed]
- Haces, M.L.; et al. Antioxidant capacity contributes to protection of ketone bodies against oxidative damage induced during hypoglycemic conditions. Exp Neurol 2008, 211(1), 85–96. [Google Scholar] [CrossRef]
- Board, M.; et al. Acetoacetate is a more efficient energy-yielding substrate for human mesenchymal stem cells than glucose and generates fewer reactive oxygen species. Int J Biochem Cell Biol 2017, 88, 75–83. [Google Scholar] [CrossRef]
- Yoo, H.; et al. Quantifying reductive carboxylation flux of glutamine to lipid in a brown adipocyte cell line. J Biol Chem 2008, 283(30), 20621–7. [Google Scholar] [CrossRef]
- Du, J.; et al. Reductive carboxylation is a major metabolic pathway in the retinal pigment epithelium. Proc Natl Acad Sci U S A 2016, 113(51), 14710–14715. [Google Scholar] [CrossRef] [PubMed]
- Mullen, A.R.; et al. Reductive carboxylation supports growth in tumour cells with defective mitochondria. Nature 2011, 481(7381), 385–8. [Google Scholar] [CrossRef]
- Devalaraja-Narashimha, K.; et al.; Diener, A.M.; et al.; Padanilam, B.J. Cyclophilin D deficiency prevents diet-induced obesity in mice. FEBS Lett 2011, 585(4), 677–82. [Google Scholar] [CrossRef]
- Laker, R.C.; et al. The Mitochondrial Permeability Transition Pore Regulator Cyclophilin D Exhibits Tissue-Specific Control of Metabolic Homeostasis. PLoS One 2016, 11(12), e0167910. [Google Scholar] [CrossRef] [PubMed]
- Tavecchio, M.; et al. Deletion of Cyclophilin D Impairs beta-Oxidation and Promotes Glucose Metabolism. Sci Rep 2015, 5, 15981. [Google Scholar] [CrossRef]
- Li, X.; et al. Liver cyclophilin D deficiency inhibits the progression of early NASH by ameliorating steatosis and inflammation. Biochem Biophys Res Commun 2022, 594, 168–176. [Google Scholar] [CrossRef]
- Scott, M.A.; et al. Brief review of models of ectopic bone formation. Stem Cells Dev 2012, 21(5), 655–67. [Google Scholar] [CrossRef] [PubMed]
- Kusuma, G.D.; et al. Ectopic Bone Formation by Mesenchymal Stem Cells Derived from Human Term Placenta and the Decidua. PLoS One 2015, 10(10), e0141246. [Google Scholar] [CrossRef] [PubMed]
- Hashimoto, K.; et al. In vivo dynamic analysis of BMP-2-induced ectopic bone formation. Sci Rep 2020, 10(1), 4751. [Google Scholar] [CrossRef]
Figure 1.
CypD knockdown impairs whereas caCypD overexpression enhances adipogenesis at day 7 in C3H10T1/2 cells. C3H10T1/2 cells were transfected with either shRNA against Ppif (LOF) or caPpif (GOF) vector or control vector. After 48h, cells were exposed to puromycin or G418 selection for 10 days. Cells were cultured in adipogenic media for 7 days. A) and E) Cells were stained with Nile Red/Hoechst at D0 and D7. B) and F) Quantification of Nile Red staining. C), D), G) and H) Real-time RT-PCR analysis of Ppif and adipogenic gene expression was normalized to B2m. Data are mean±SD (n=3). *p<0.05, **p<0.01, ***p<0.001 via unpaired t-test.
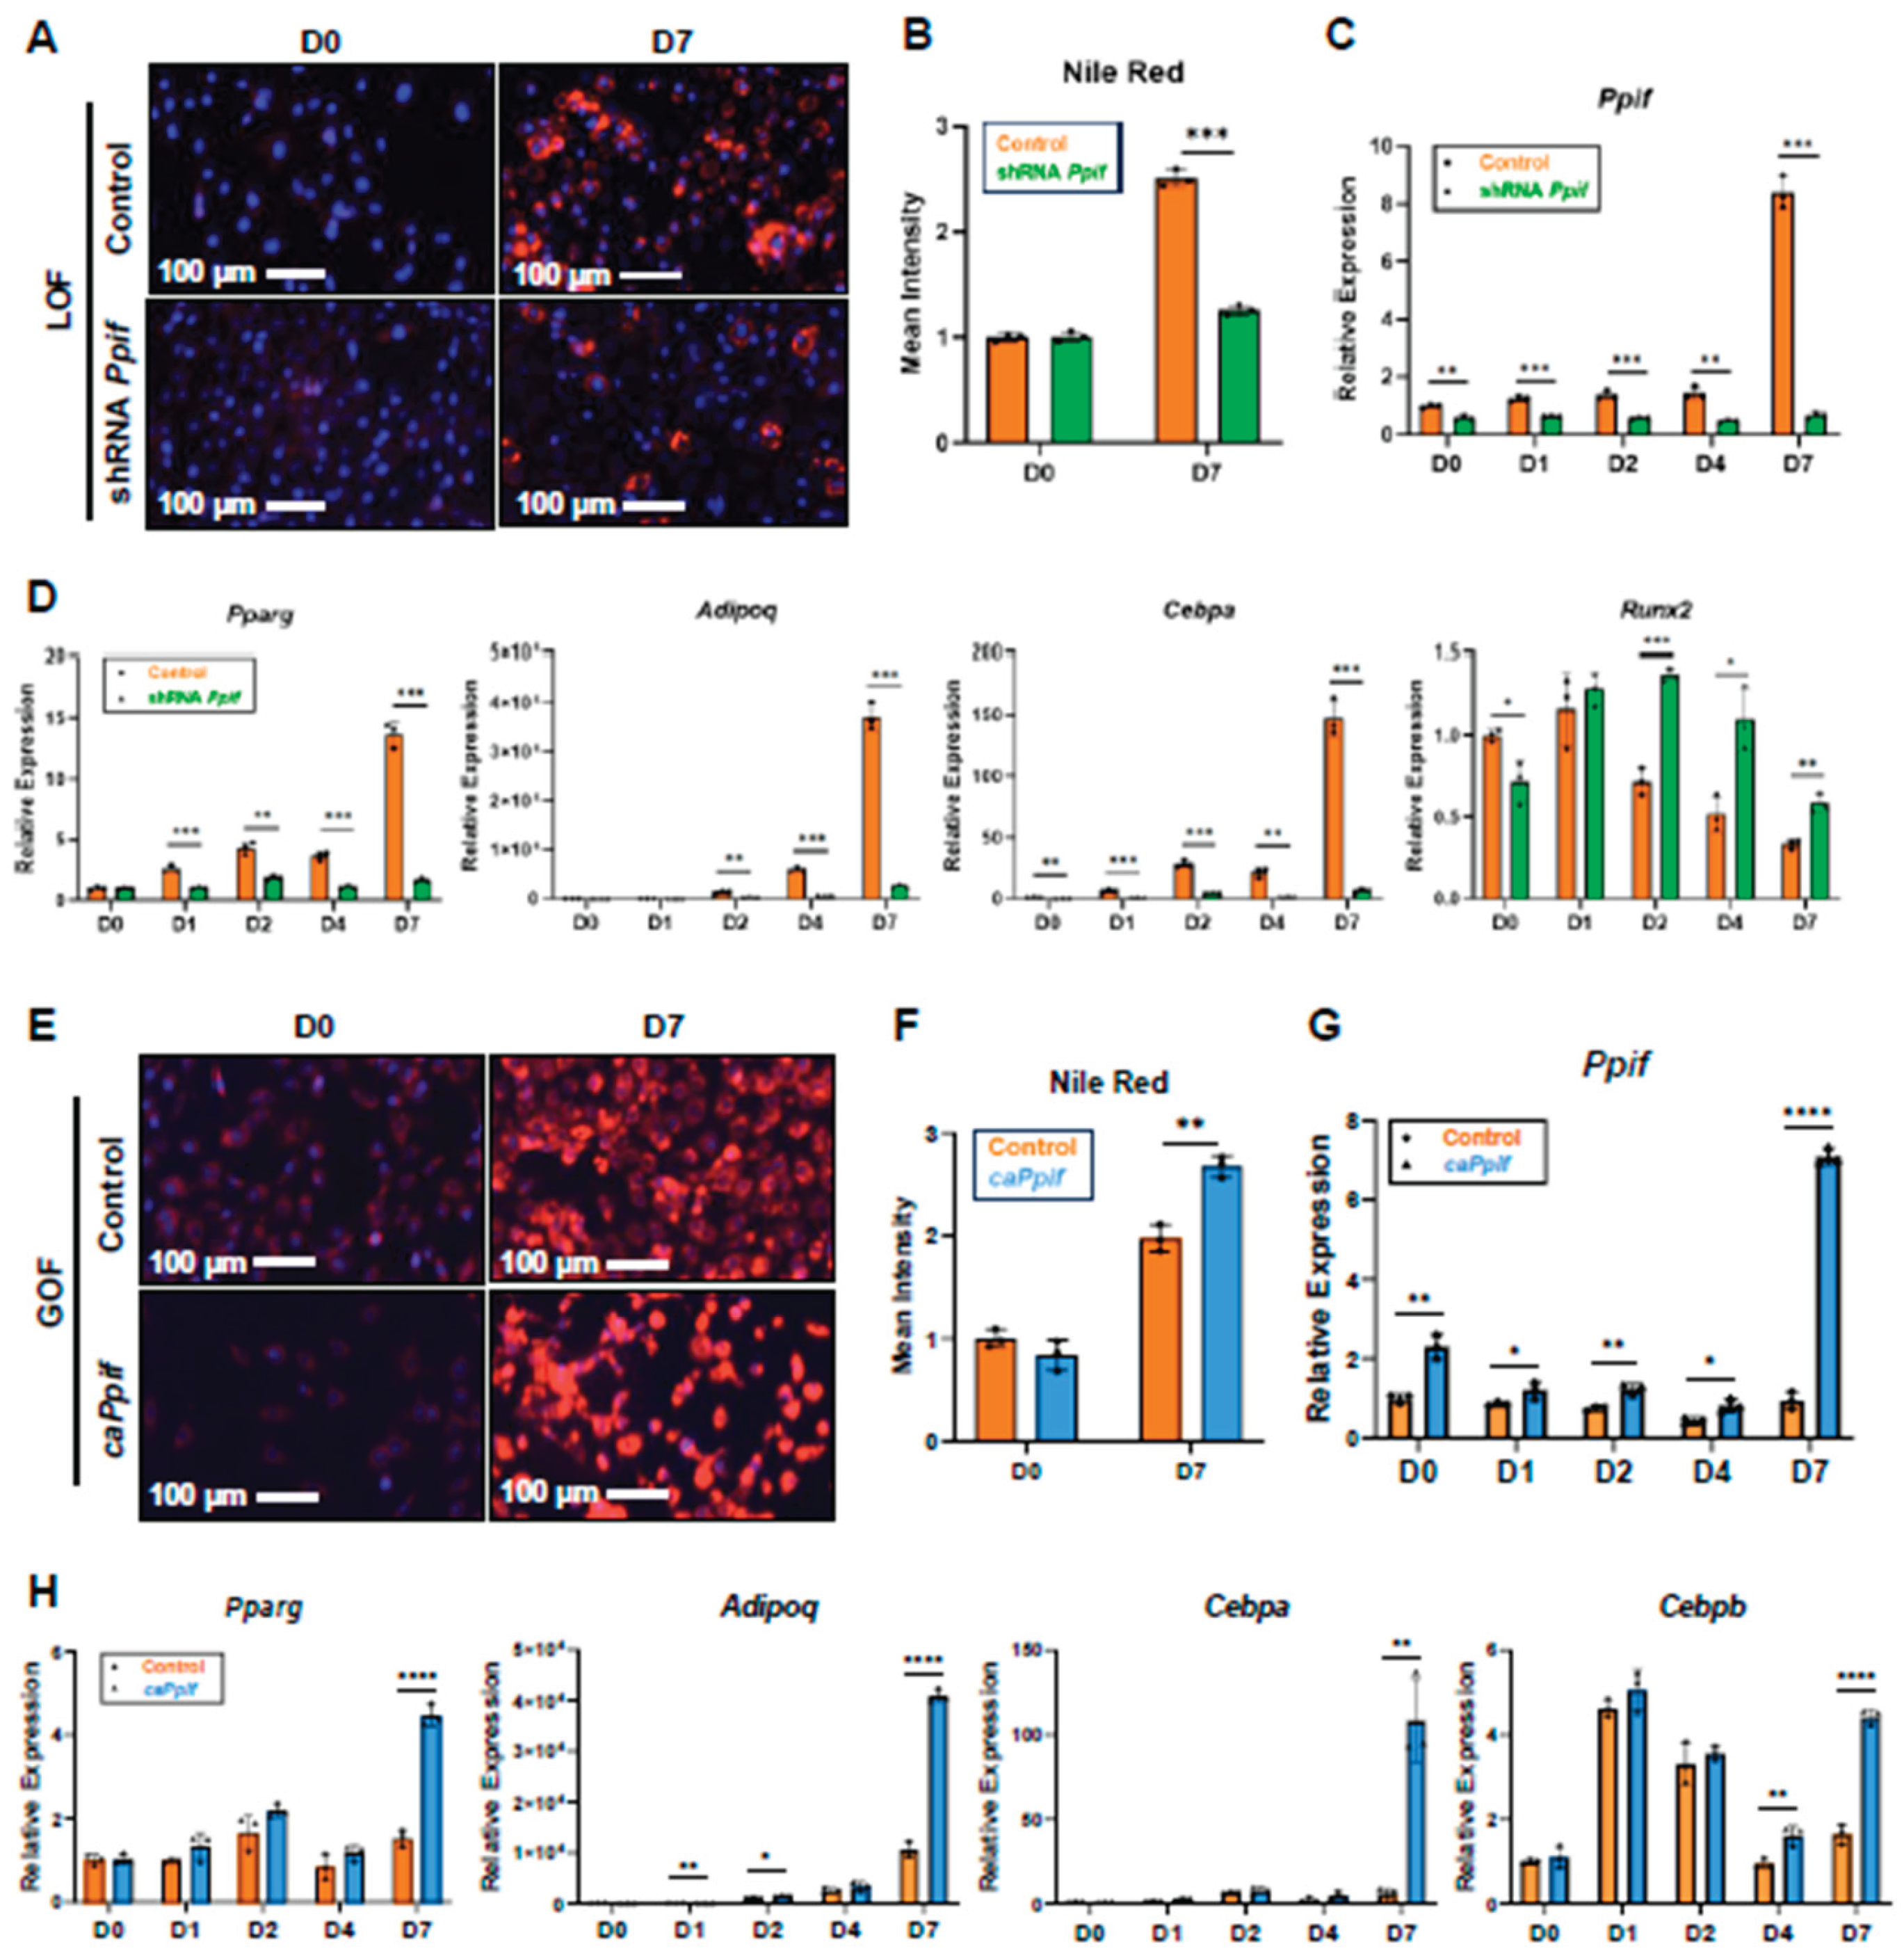
Figure 2.
CypD knockdown improves mitochondrial function whereas caCypD overexpression impairs mitochondrial function and activates glycolysis in adipogenically induced C3H10T1/2 cells. C3H10T1/2 LOF and GOF cells were cultured in adipogenic media for 7 days. A) and B) Kinetic profiles of OCR and ECAR in CypD knockdown C3H10T1/2 cells at day 7. E) and F) Kinetic profiles of OCR and ECAR in CypD overexpression C3H10T1/2 cells at day 7. C), D), G) and H) Quantification of OCR and ECAR data. Data are mean±SD (n=3). *p<0.05, **p<0.01, ***p<0.001 via unpaired t-test.
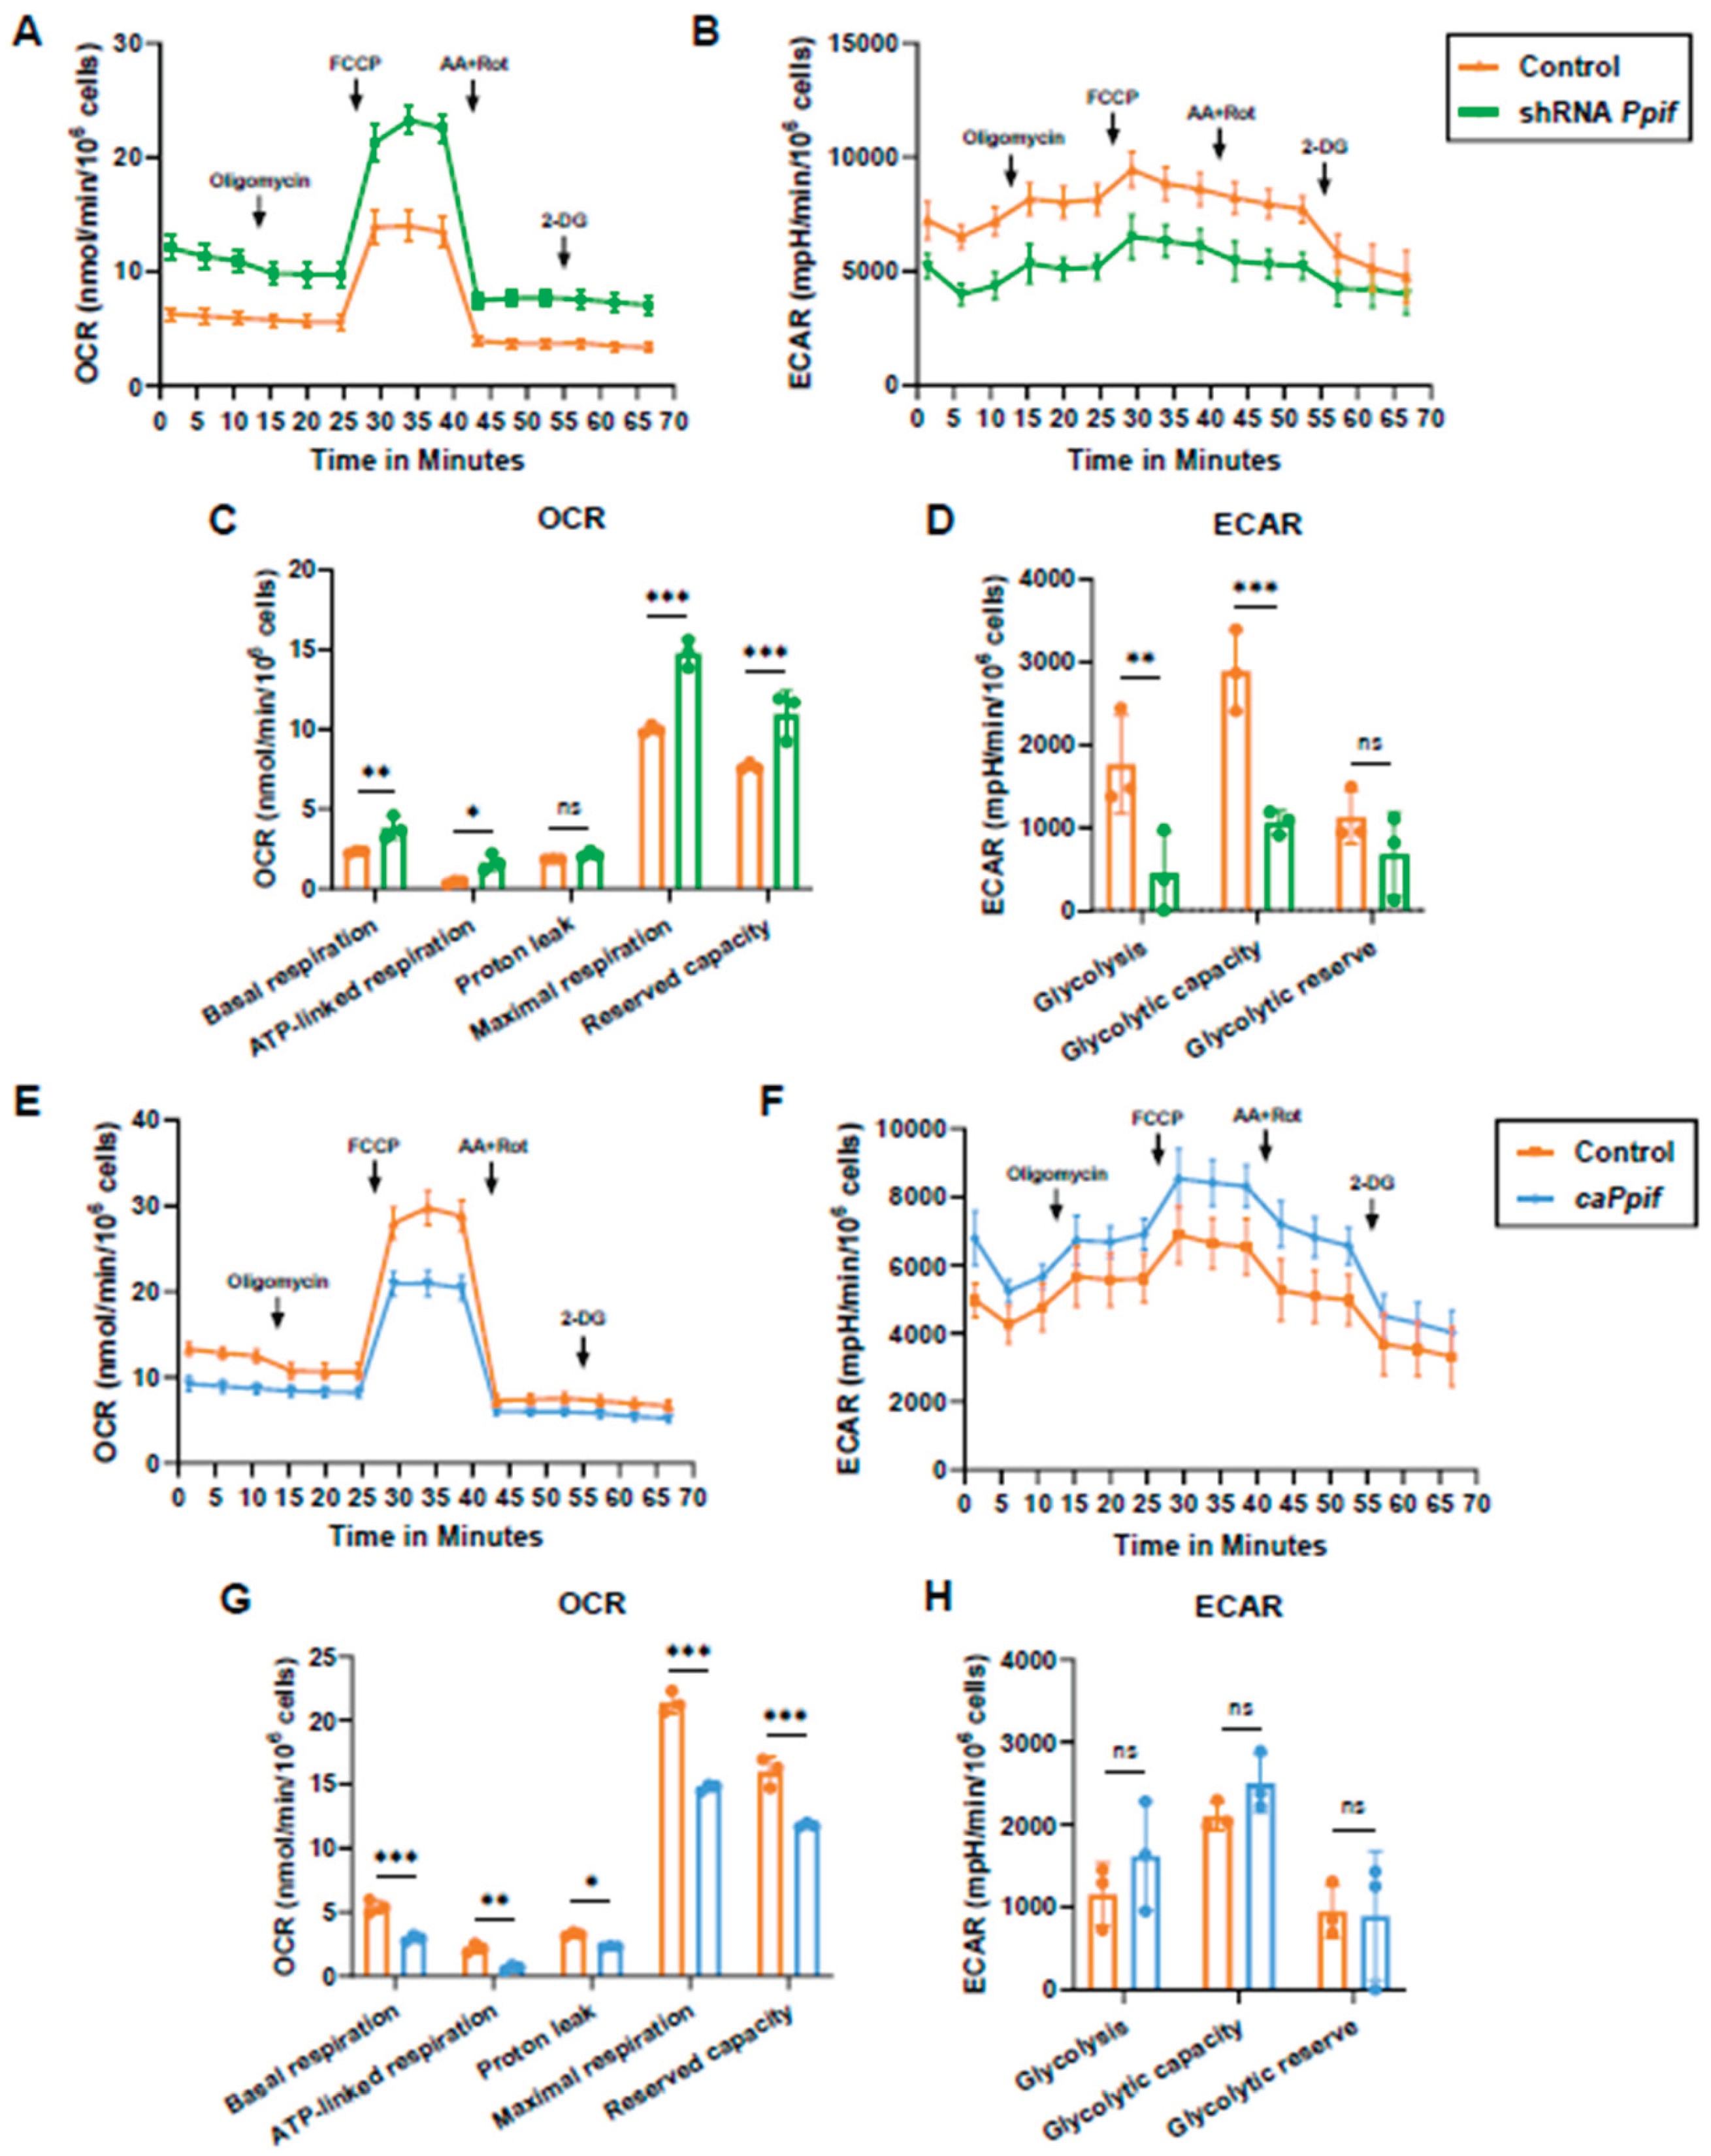
Figure 3.
Differential abundance of metabolites were detected in undifferentiated C3H10T1/2 CypD knockdown versus control cells. Metabolites were extracted from C3H10T1/2 LOF cells and analyzed by LC-MS. A) Volcano plot showing the significant decreased (in blue) and increased (in red) metabolites. Means and p values were calculated using unpaired t-test with FDR<0.1. B) Heatmap showing top 30 differentially expressed metabolites based on p values with ward clustering algorithm. Means and p values were calculated using unpaired t-test.
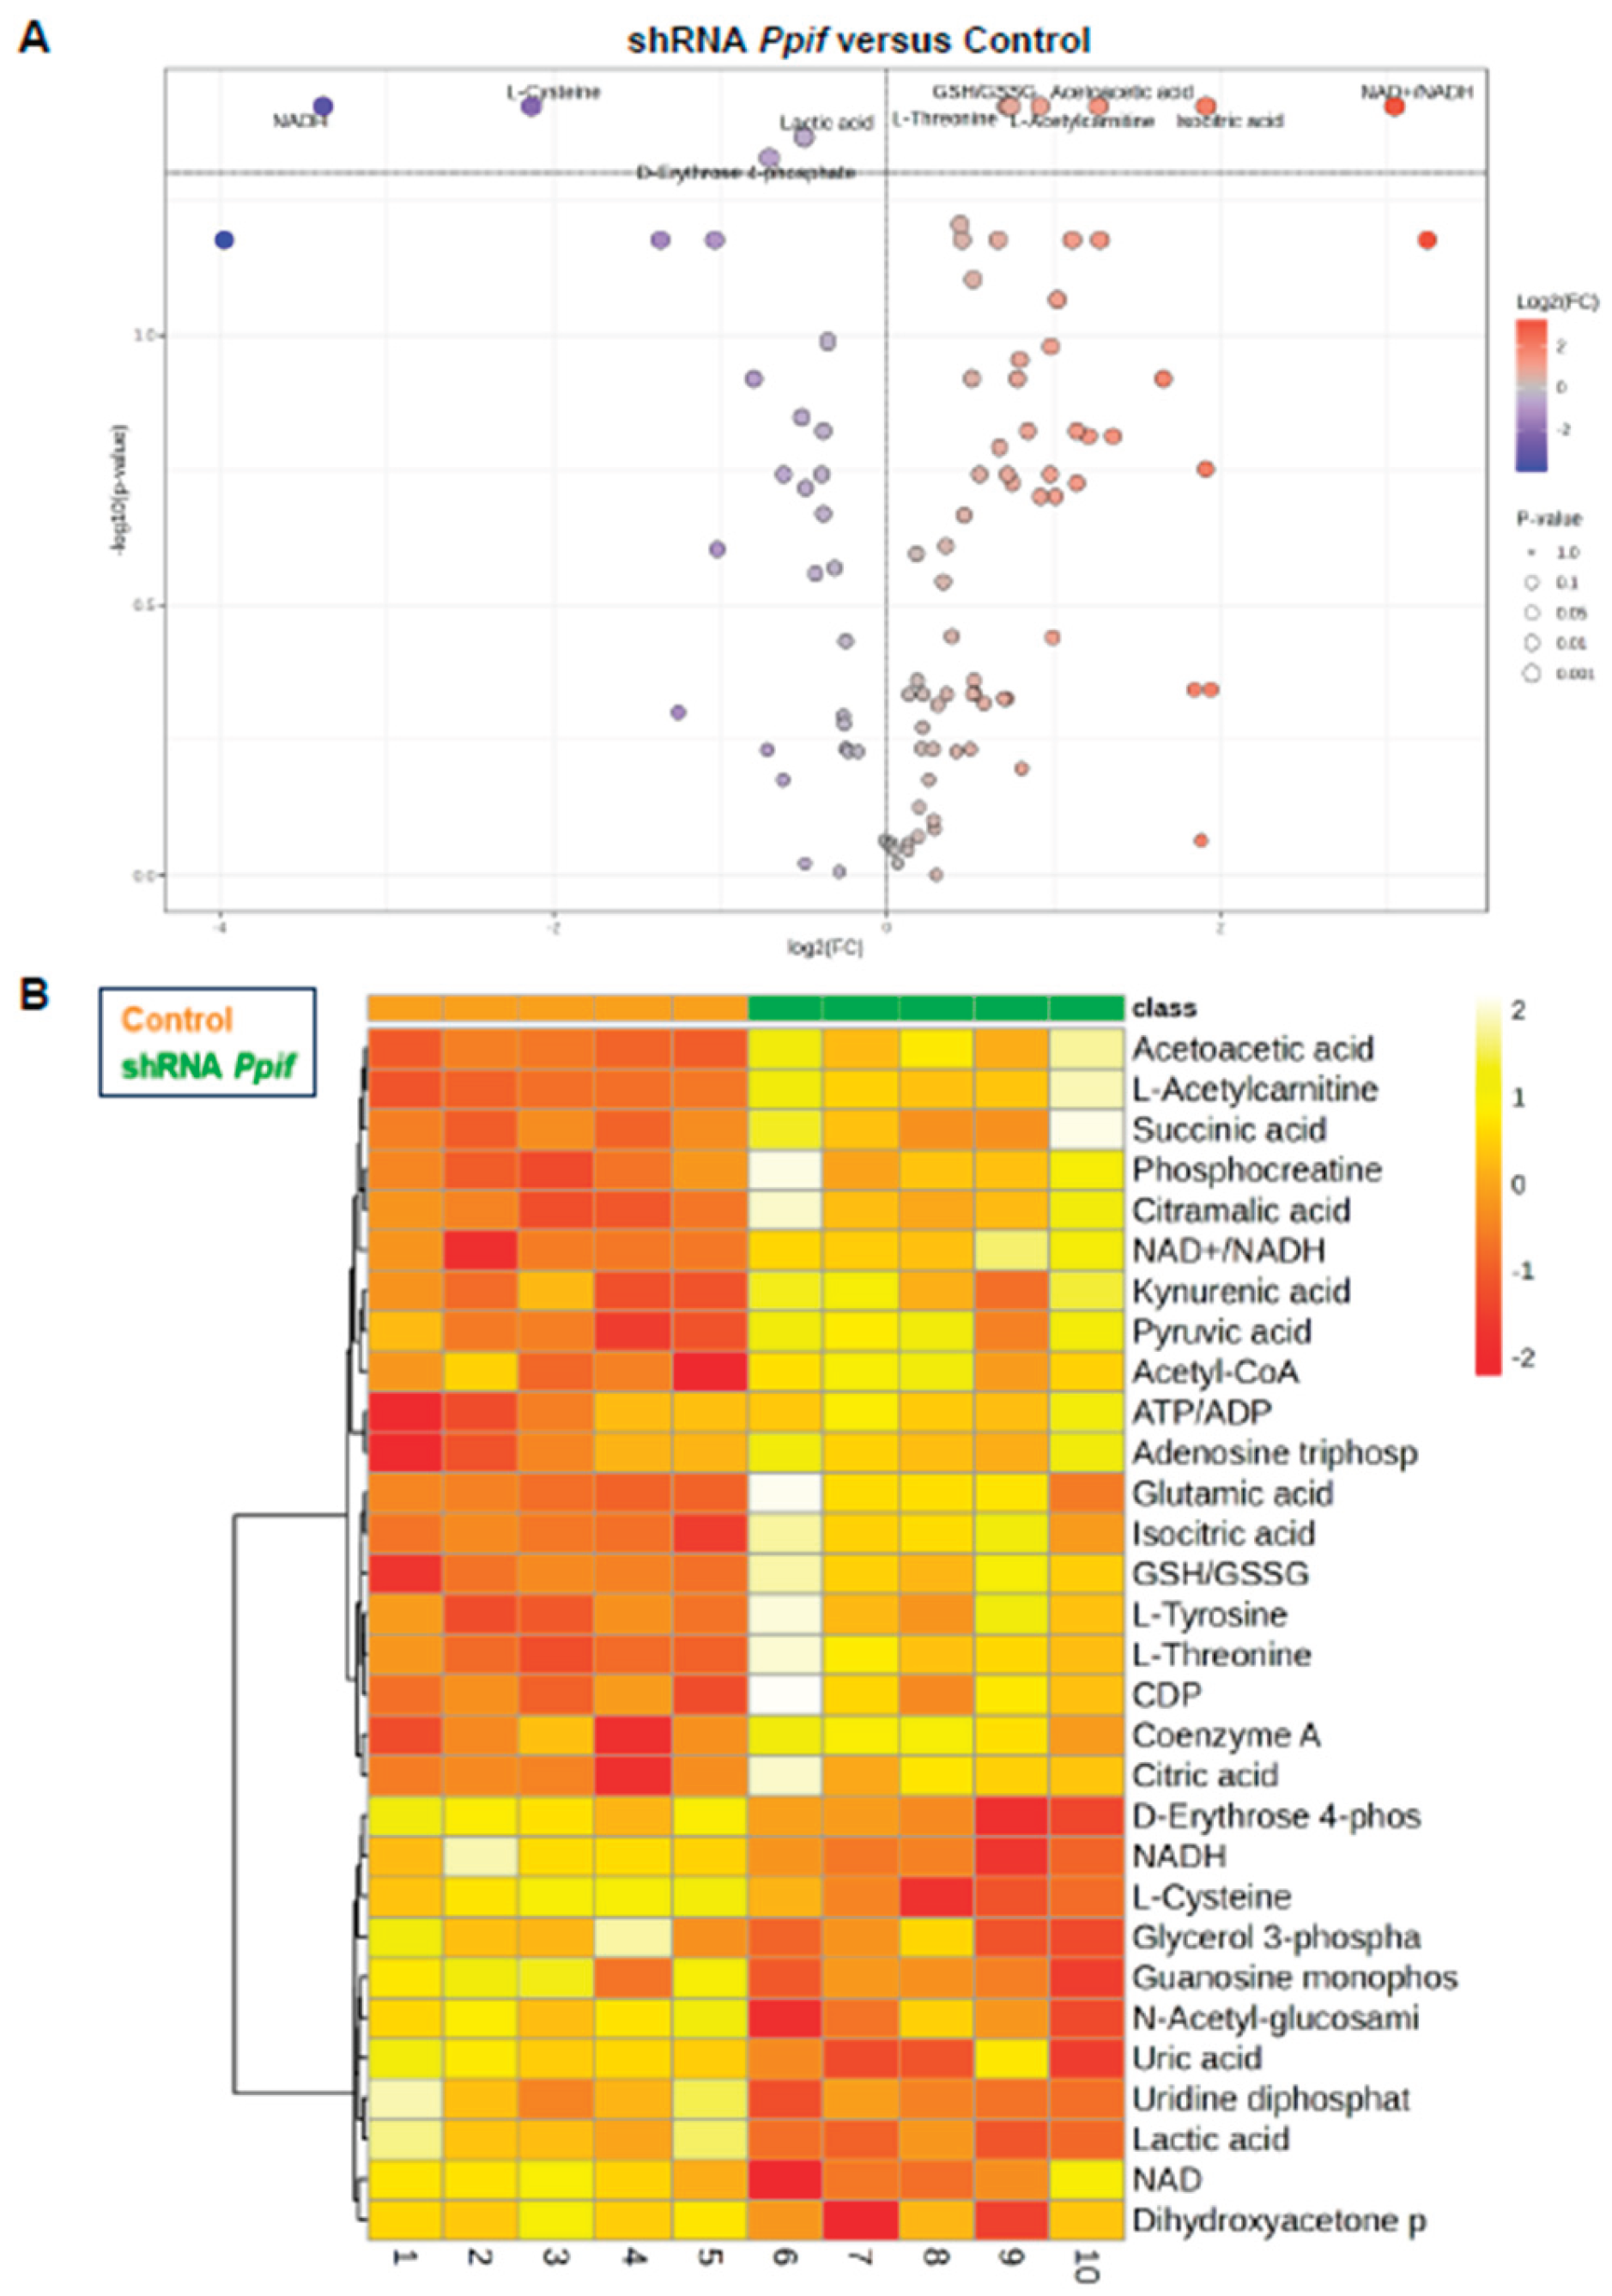
Figure 4.
Differential abundance of metabolites were detected in undifferentiated C3H10T1/2 caCypD overexpression versus control cells. Metabolites were extracted from C3H10T1/2 GOF cells and analyzed by LC-MS. A) Volcano plot showing the significant decreased (in blue) and increased (in red) metabolites. Means and p values were calculated using unpaired t-test with FDR<0.1. B) Heatmap showing top 30 differentially expressed metabolites based on p values with ward clustering algorithm. Means and p values were calculated using unpaired t-test.
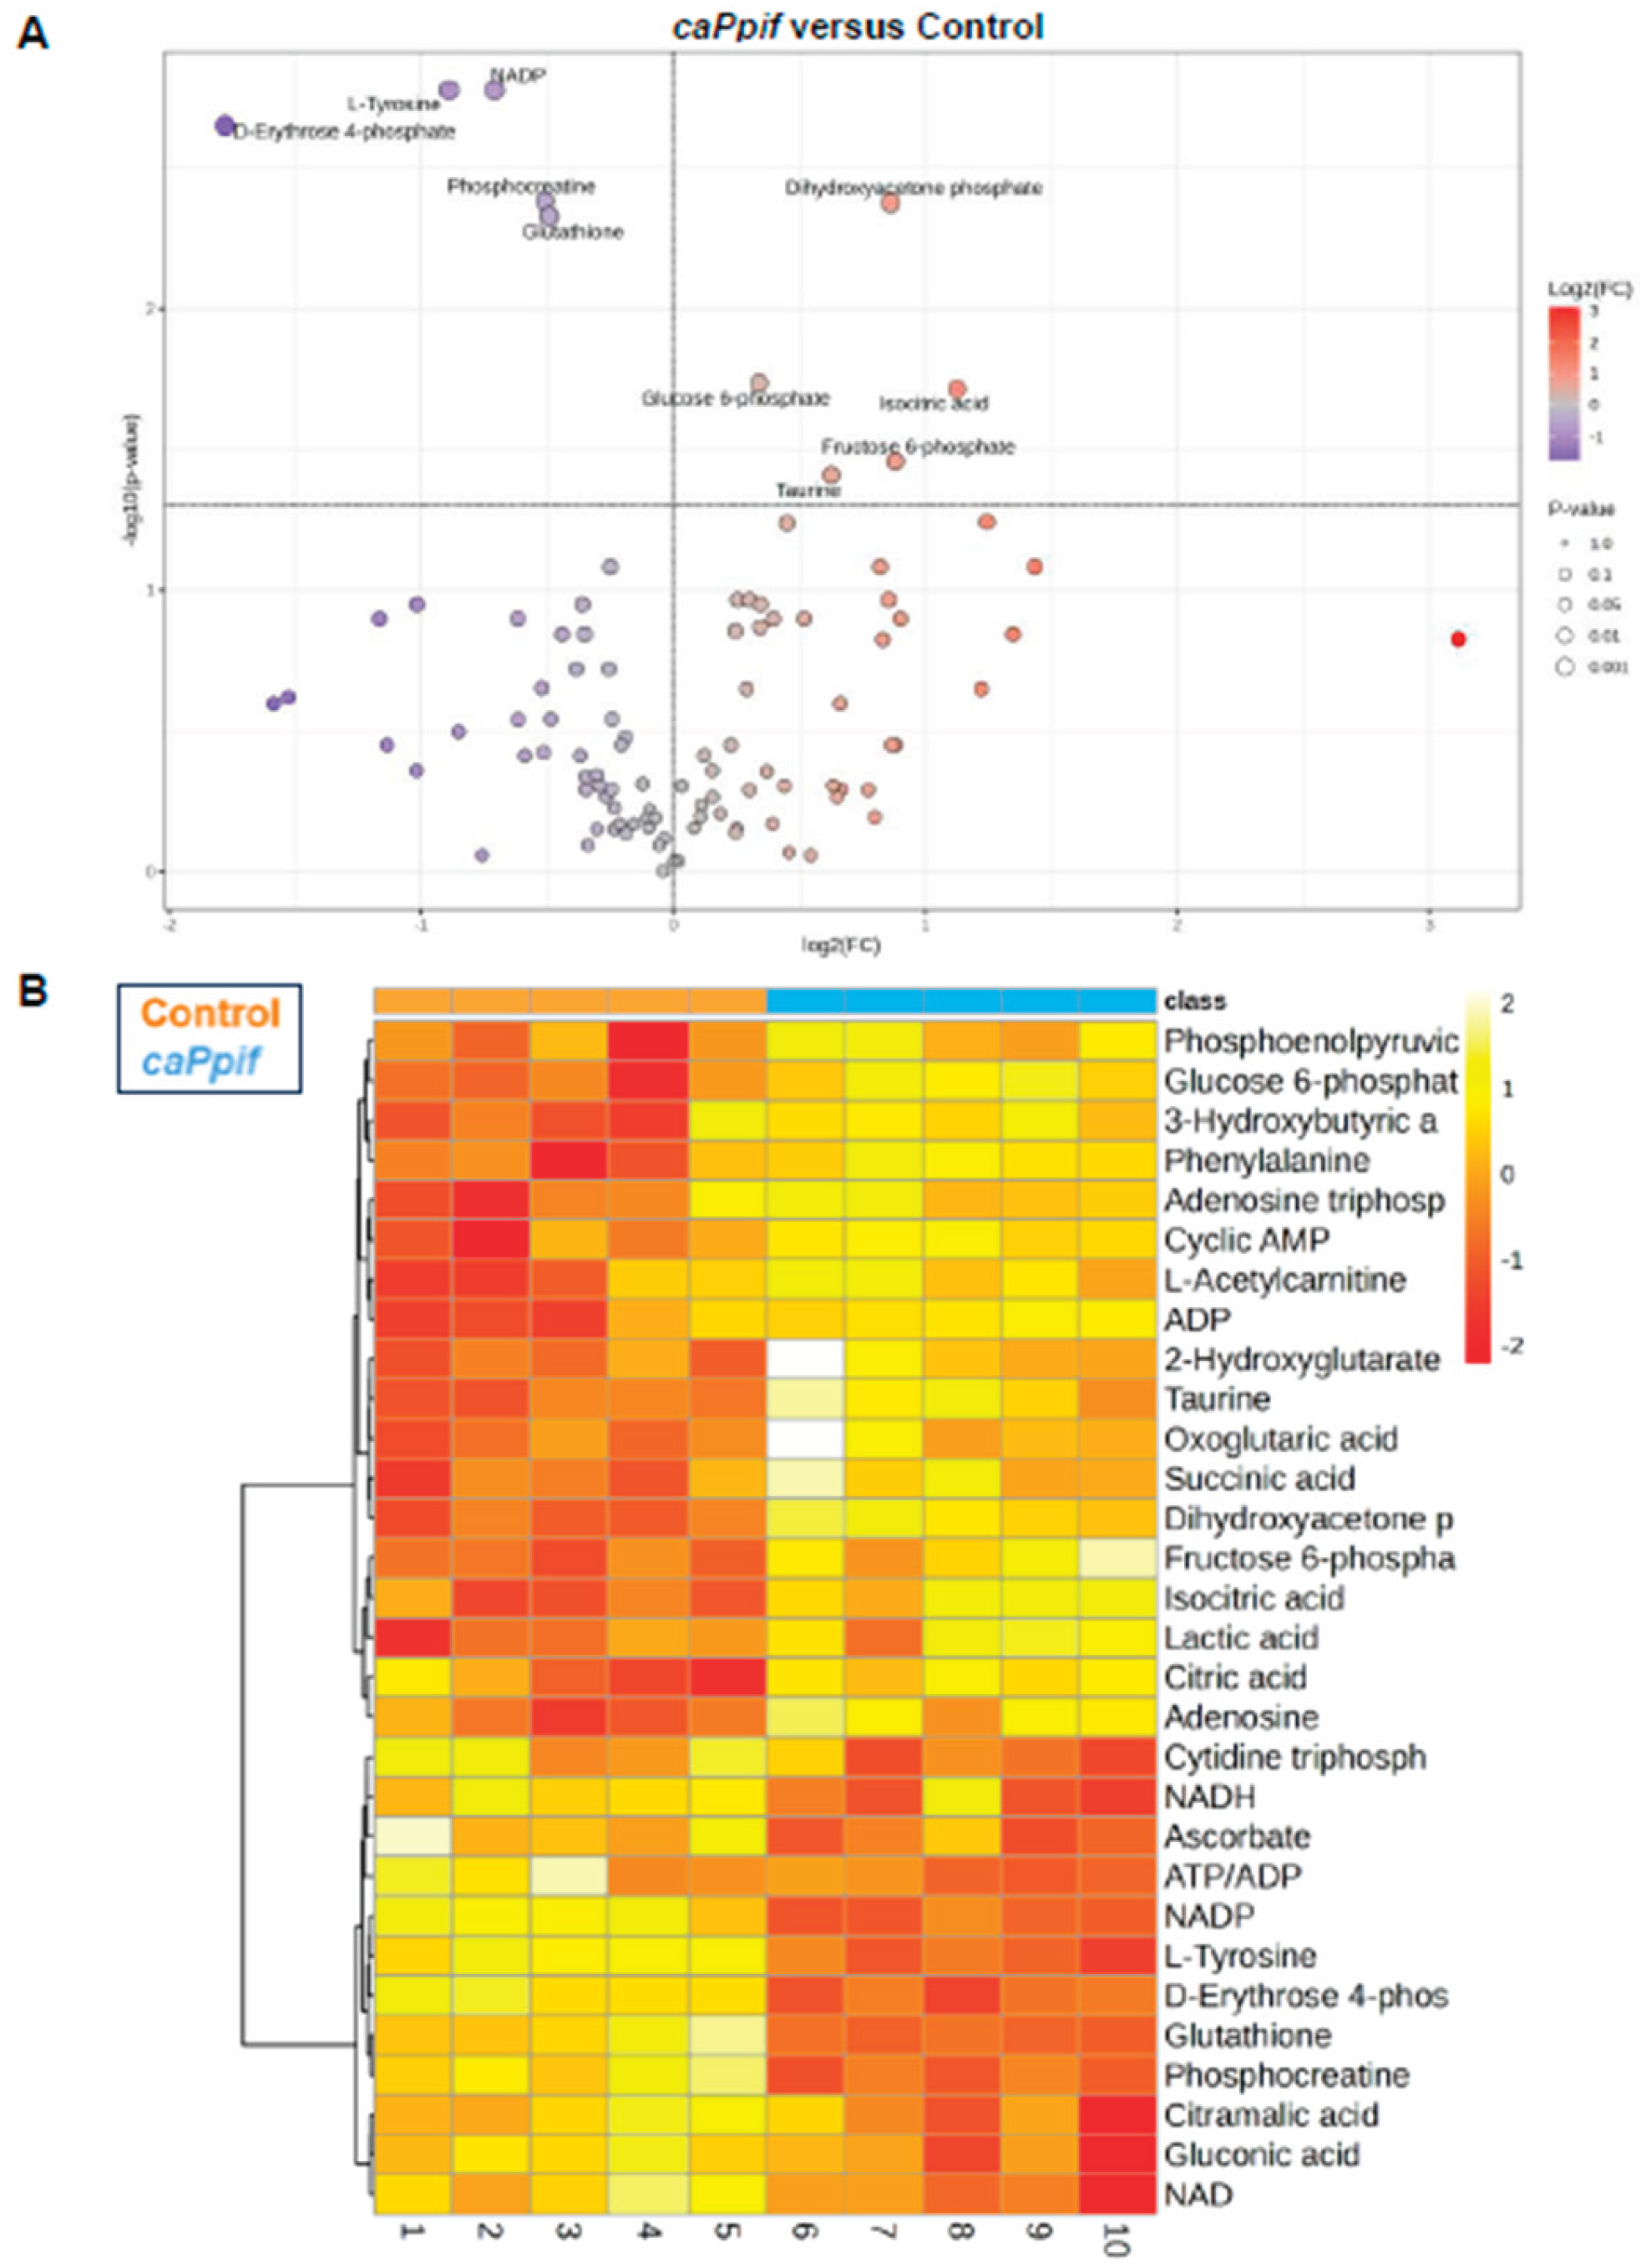
Figure 5.
CypD deletion in primary mouse BMSCs impairs adipogenesis whereas caCypD overexpression enhances adipogenesis. Primary BMSCs were isolated from Prx1-Cre;Ppiff/f (CypD/MPTP LOF) or Prx1-Cre;R26caPpif (CypD/MPTP GOF) mice and cultured in adipogenic media for 7 days. A) and E) Representative western blot images of CypD protein expression. B) and F) Cells were stained with Nile Red/Hoechst at D7. C) and G) Quantification of Nile Red staining. D) and H) Real-time RT-PCR analysis of adipogenic gene expression was normalized to B2m. Data are mean±SD (n=3). *p<0.05, **p<0.01, ***p<0.001 via unpaired t-test or unpaired multiple t-test with Dunn-Bonferroni post-hoc test.
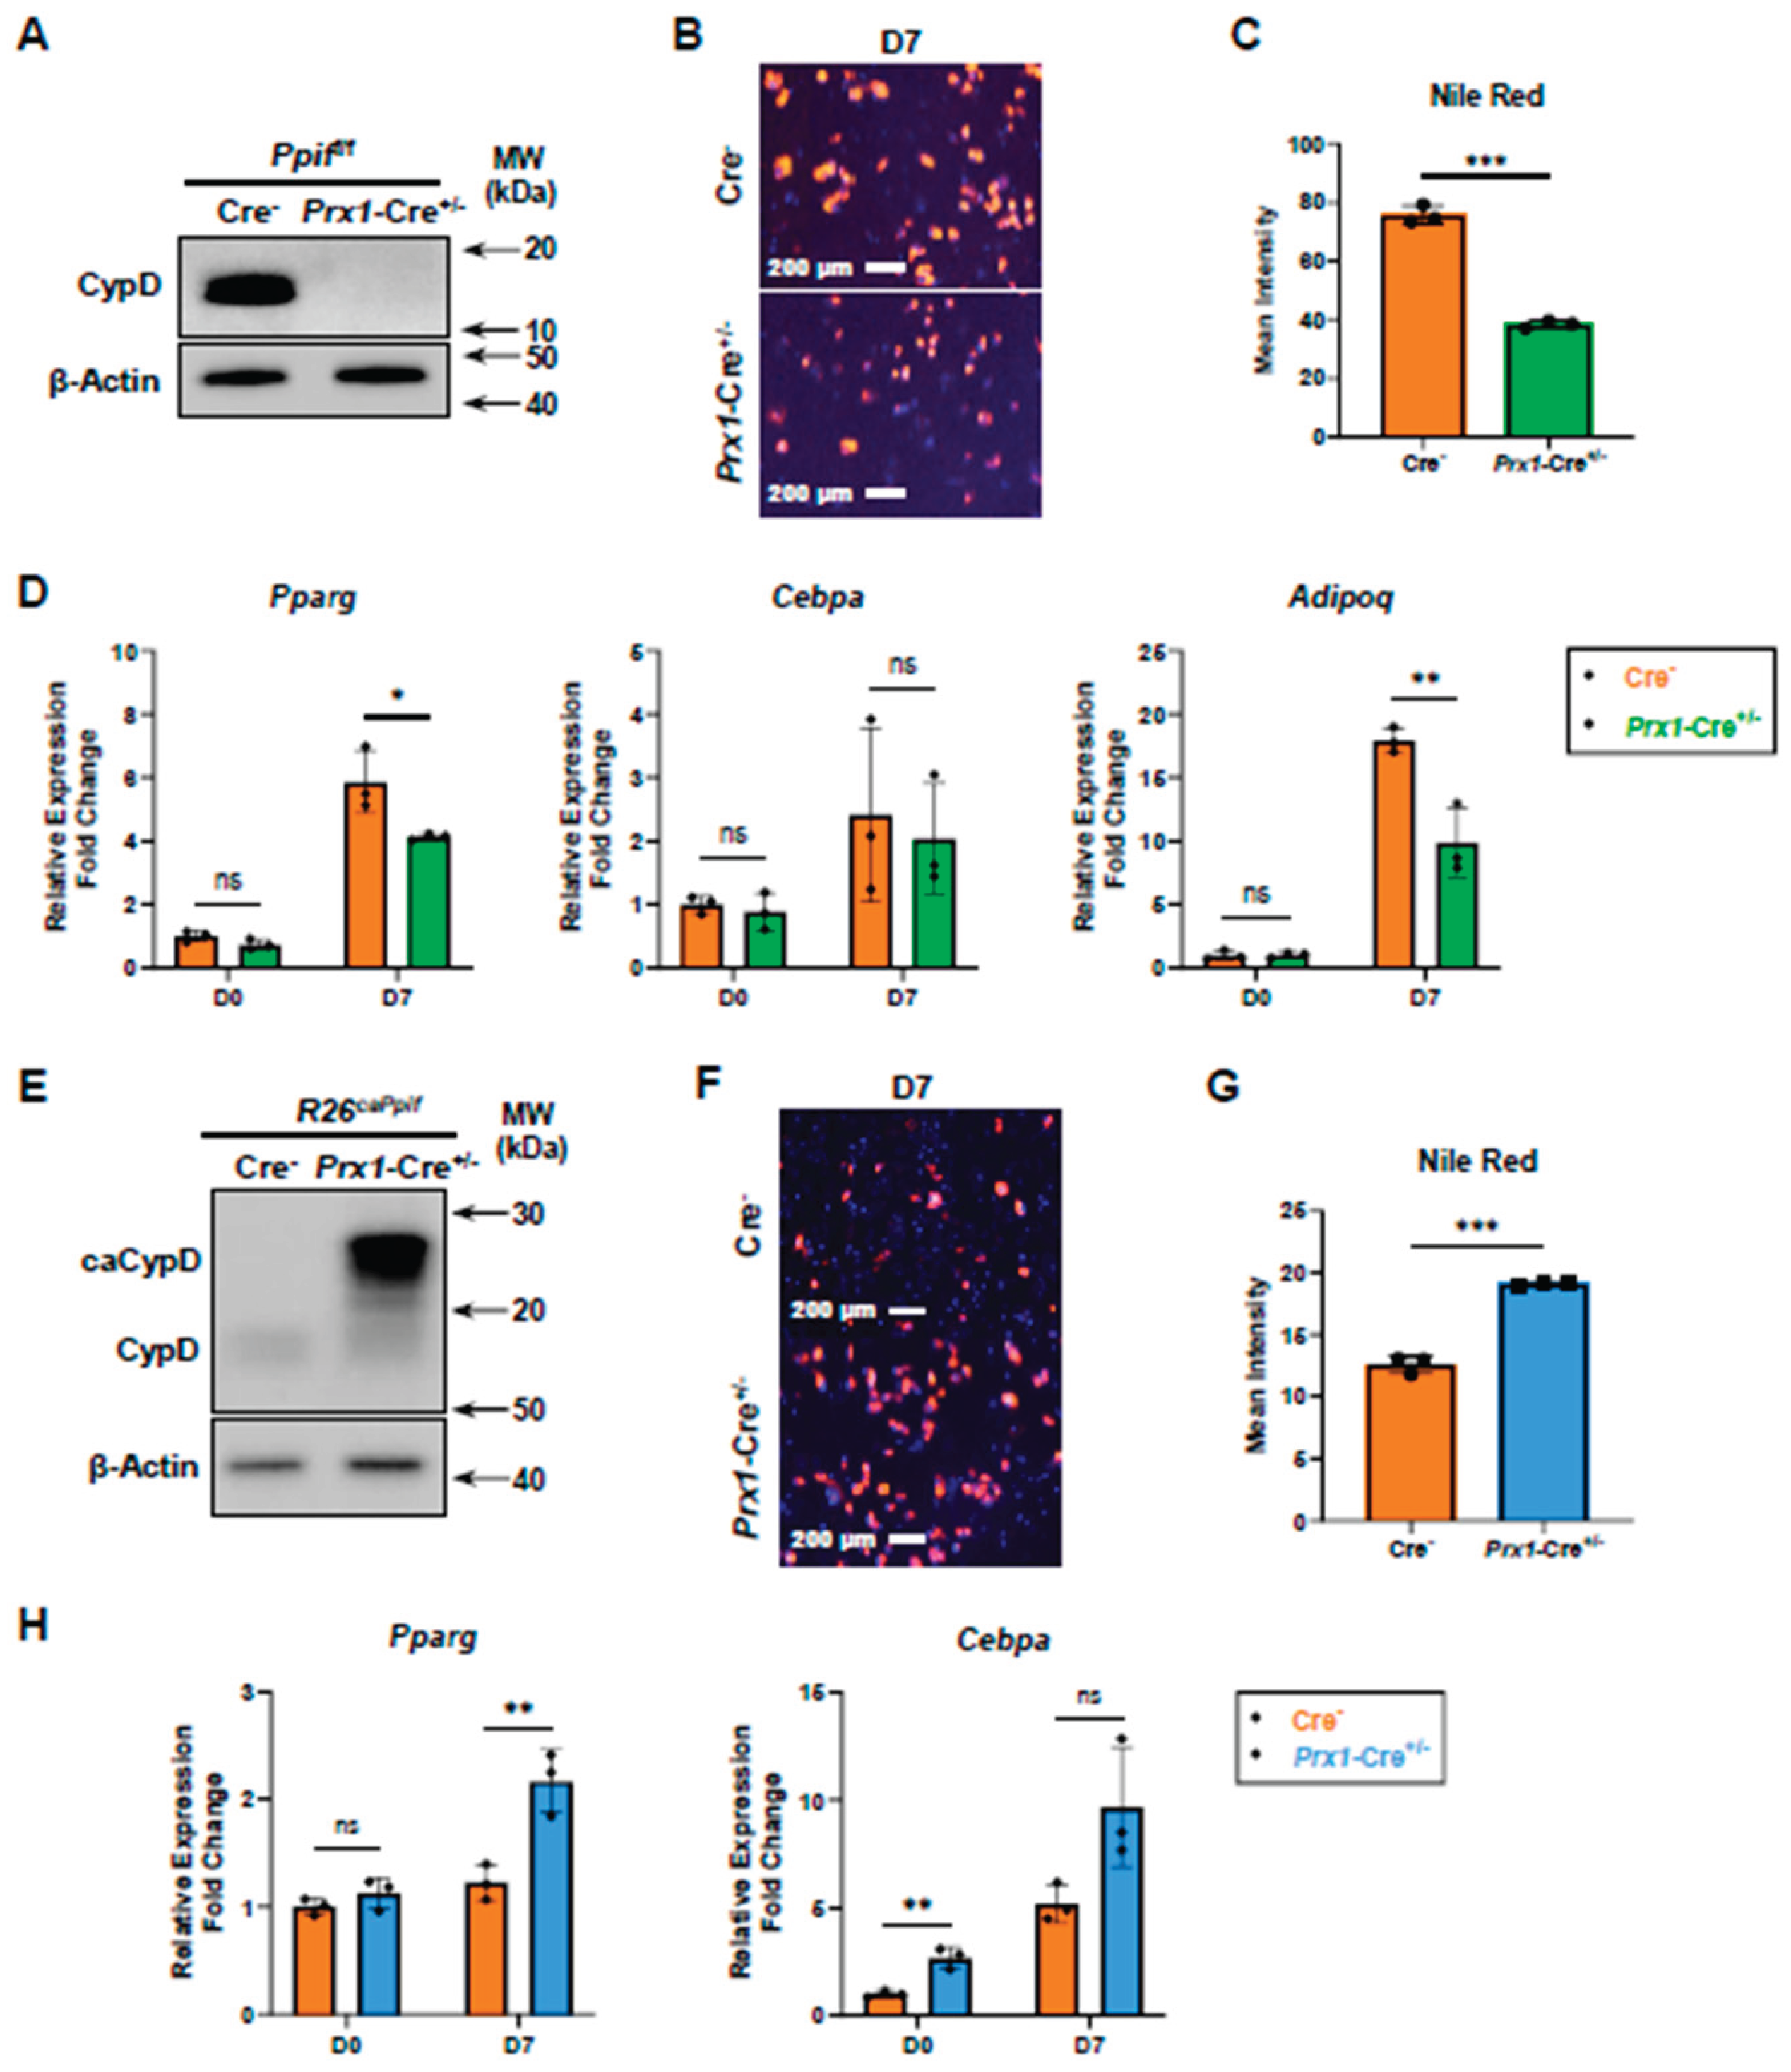
Figure 6.
CypD deletion in primary mouse BMSCs increases ectopic bone formation, whereas caCypD overexpression decreases ectopic bone and increases fat formation. Primary BMSCs from Prx1-Cre;Ppiff/f or Prx1-Cre; R26caPpif mice were subcutaneously transplanted into nude mice and grafts evaluated after one month. A) Diagram showing the procedure of ectopic bone formation assay. Representative 1x Alcian Blue Hematoxylin/Orange G of ectopic bone implants (left, 500 µM scale bar shown in blue) and 4x perilipin-1 IF staining (right, 200 µM scale bar shown in yellow) from Cre negative and Prx1-Cre;Ppiff/f mice (B) or Cre negative and Prx1-Cre;R26caPpif mice (F). Green arrow indicates ectopic bone. Yellow arrow indicates adipocytes. C, G) DEXA scan quantification of bone area/total implant area and bone mineral density in ectopic implants. D, H) Bone area/implant area measured in histology images. E, I) Perilipin positive cells as a percentage of total cell number and Perilipin positive area as a percent of total area measured in histology images. Data are mean±SD (n=3-4). *p<0.05, **p<0.01 via unpaired t-test.
Disclaimer/Publisher’s Note: The statements, opinions and data contained in all publications are solely those of the individual author(s) and contributor(s) and not of MDPI and/or the editor(s). MDPI and/or the editor(s) disclaim responsibility for any injury to people or property resulting from any ideas, methods, instructions or products referred to in the content. |
© 2026 by the authors. Licensee MDPI, Basel, Switzerland. This article is an open access article distributed under the terms and conditions of the Creative Commons Attribution (CC BY) license (http://creativecommons.org/licenses/by/4.0/).
Copyright: This open access article is published under a Creative Commons CC BY 4.0 license, which permit the free download, distribution, and reuse, provided that the author and preprint are cited in any reuse.


