
Submitted:
17 January 2026
Posted:
19 January 2026
You are already at the latest version
Abstract
To address the critical challenges of hazardous material (HAZMAT) incidents in dense urban areas, this study develops a hybrid framework for spatial emergency response optimization tailored for Intelligent Transport Systems (ITS). Our approach integrates the Fuzzy Analytic Hierarchy Process (FAHP) with a rigorous technical benchmarking of multiple navigation APIs to improve routing decisions under volatile Bangkok traf-fic. By employing a normalized cost function (scale 0–1), we evaluated the perfor-mance of localized (Longdo) versus global (Google and OpenStreetMap) platforms across day and night scenarios. Experimental results, yielding normalized costs be-tween 0.464 and 0.748, identified Bon Kai as the optimal response node, whereas Chan Road showed the lowest efficiency. Interestingly, OpenStreetMap provided the highest temporal consistency for emergency logistics. These findings offer a practical deci-sion-support tool for authorities, proving that integrated API assessment is essential for building resilient and responsive urban mobility infrastructures.
Keywords:
emergency response optimization
; route optimization
; multi-api benchmarking
; analytic hierarchy process
; fuzzy ahp
; fire station operations
; emergency logistics
1. Introduction
Growing threats from chemical spills and urban crises demand highly effective emergency response units capable of rapid route optimization. Since conventional methods often struggle with multi-factorial uncertainty, the Fuzzy Analytic Hierarchy Process (FAHP) has emerged as a robust tool for integrating expert judgment with quantitative data [1,2,3]. Research indicates that combining FAHP with cost function analysis and Geographic Information Systems (GIS) significantly enhances the reliability of emergency logistics [2,3,4,5,6], supported by advancements in predictive traffic modeling and AI-enhanced systems [7,8,9,10]. However, real-time decision-making in disasters remains a persistent challenge [11,12], especially when specialized chemical dispersion modeling is required [13,14]. Despite these developments, a framework capable of evaluating the synergy between local and global mapping services in complex environments like Bangkok is still missing. To bridge this gap, this study develops an “Emergency Response Route Map Based on FAHP and Map API” model. Our system optimizes routing by leveraging real-time data integration from three distinct geospatial platforms: Google Maps [1,2], Longdo Map [6,15], and OpenStreetMap [9,10]. In the context of the Future of Mobility, benchmarking localized versus global navigation APIs is paramount for developing resilient Intelligent Transport Systems (ITS). This research explores how localized data depth and global algorithmic reach can be harmonized to ensure robust crisis management. Specifically, our objectives are threefold: (1) to rank critical emergency routing criteria; (2) to weigh these factors using FAHP to manage uncertainty; and (3) to determine optimal emergency routes via a multi-criteria weighted cost function. The framework is demonstrated through urban case studies, highlighting its readiness for real-time application in metropolitan emergencies.
2. Materials and Methods
2.1. Questionnaire Validity
The study started with expert elicitation to determine key factors affecting the choice of emergency route during a chemical release on the Chalerm Maha Nakhon Expressway. A two-sectioned questionnaire was designed based on review of the literature (Part 1: expert demographics; Part 2: critical factors). For validity, the questionnaire was subjected to IOC analysis for 2 weeks by a panel of five occupational health experts. The items with a IOC value less than 0.5 were not discarded but modified and refined according to the panel’s feedback before the field application.
2.2. Delphi Method
Seventeen experts were invited to participate in this study based on their knowledge and agreement level with the first version of OBM criteria after conducting an IOC check for quality of the items selected (Table 1) This number of samples provides a low error rate, as in previous studies [16,17,18,19]. The rounds were conducted using a modified Delphi method — an iterative process of convergence of opinion employing open-ended feedback (Round 1) and subsequent 5-points Likert scale rating (Round 2). The next rounds shared statistical information to help adjust opinions. Consensus was defined as equal or more than 75% of agreement or an Interquartile Range (IQR) less than or equal to 1.5. Non-consensus (IQR > 1.5) items, i.e., the "Work Instruction (WI)", "Environment" and the "EXAT Traffic", were rejected. They gained acceptable consensus levels and the other factors with the lowest LKF%, resulted in number two according to SAW method and number one according to TOPSIS method were subject to group discussion and finally referred to as input factors for Fuzzy Analytic Hierarchy Process (FAHP) and Analytic Hierarchy Process (AHP) calculations.
2.2. AHP Method
The five related factors that have been confirmed to be the key factors for route choice in Chalerm Mahanakorn Expressway were offered for further reevaluation. For this purpose, every item had group statistical results (median, interquartile range) at the top accompanied with the respective expert's prior response at the bottom. The calculation of priorities started with pairwise comparisons the basic scale of the Analytic Hierarchy Process (AHP) in which experts assigned weights to components they deemed more important. After AHP for main factor determination, the sub-factor analysis was applied by using the Fuzzy Analytic Hierarchy Process (FAHP). This novel method overcomes the crips/numeric value-based method in capturing subjectivity and uncertainty of opinions in complex emergency response situations.
Figure 1.
Analytic Hierarchy Process (AHP).
2.3. Fuzzy AHP (FAHP) Method
Fuzzy set and AHP were extended to Fuzzy Analytic Hierarchy Process (FAHP) for enhancement of human judgment. The procedure of FAHP is Step 1: Converting the number to fuzzy number (Fuzzification), Step 2: Expressing the fuzzy number in the matrix form for pairwise evaluation, Step 3: Evaluating based on the Analytical process, Step 4: Evaluating the alternative using from Step 1 to 3, Step 5: Transforming the fuzzy number to the crisp number (Defuzzification). The alternatives were identified by multiplying the fuzzy set weighting with the alternatives weighting. The FAHP framework, as further depicted in Figure 2
The weight vector calculation, the weight vector computed to normalized as shown Equation 1 and Equation 2, respectively.
The normalized priority weights (Wn) for the final level derived from the FAHP analysis were directly used in the multi-criteria cost function (as presented in Equation 3). These weights turn the objective cost function into a decision-support model by capturing the relative subjective importance of each routing criterion (Cn) in terms of the experts’ knowledge. This combination ensures that selection of route is not only based on distance or time minimization but also on safe and efficient, as described by experts.
2.4. Cost Function
Route appropriateness is mathematically evaluated using a Cost Function (or objective function), whose purpose is to measure the "undesirability" of selecting a given route and whose main intent is to minimize such a computed cost. In essence, the function provides a number for each candidate path of the considered paths with respect to a number of factors (influencing factors), and a path with a smaller value is better, with respect to predefined criteria. For this emergency response case, the function considers a number of important factors including travel time (which is important for response time), distance, traffic congestion (with live data information), population distribution, and road condition, as shown in Equation 3
where:
Total Cost = W1C1 +
W2C2+ W3C3 + W4C4
+ W5C5
- Cost: Represents the total cost or total damage to be minimized.
- Wi, which denotes the weight of factor i, obtained from the normalized AHP (Analytic Hierarchy Process) weights.
- Pi/Ci: Represents the value of factor i (which may be raw, standardized, or normalized).
3. Results
3.1. IOC
The preliminary factor screening showed that the factor 'Route complexity' was not consistent with the objectives of this study as its IOC value was lower than the threshold value of 0.5. Thus, 'Route complexity' was removed from the data set before the Delphi method calculations began.
3.2. Delphi Method
Expert consensus was defined by satisfying two conditions: Interquartile Range (IQR) ≤ 1.5 (indicating acceptable response variability) and Mode-Median Difference ≤ 1.0. Factors with insufficient consensus (IQR > 1.5) specifically, “Work Instruction (WI)”, “Environment”, and “EXAT Traffic” were excluded from further analysis. The remaining factors, which achieved high expert agreement (IQR ≤ 1.5) across the 17 experts, were subsequently retained as inputs for the Fuzzy Analytic Hierarchy Process (FAHP) and Analytic Hierarchy Process (AHP) methodologies.
3.3. AHP
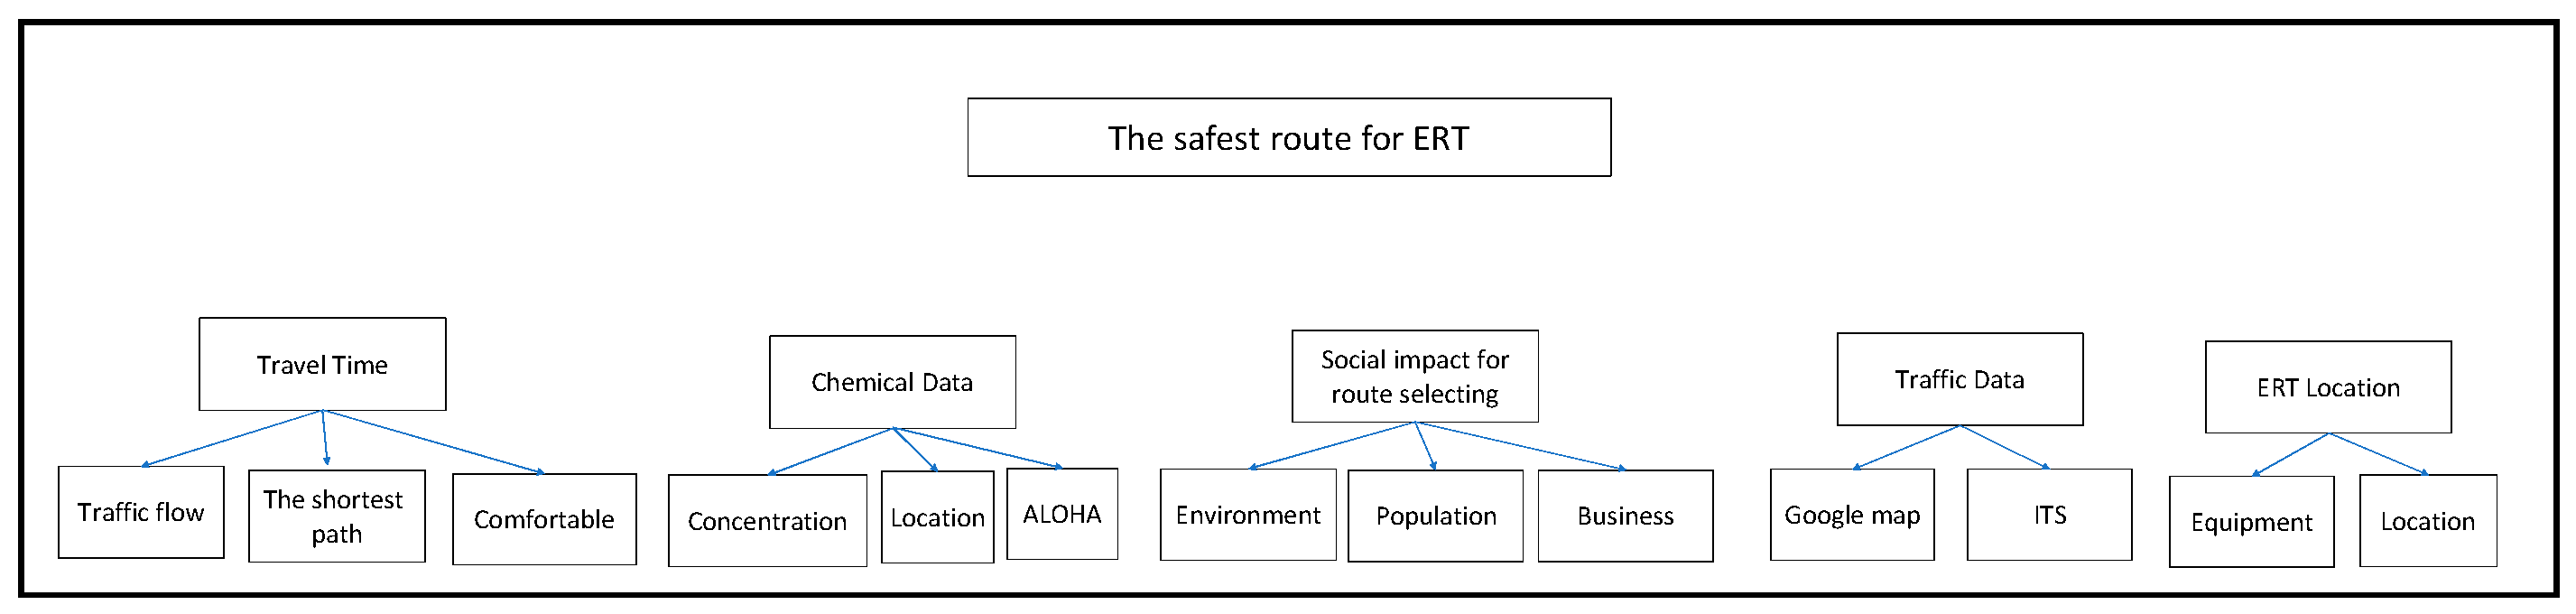
The 17 experts provided their intensity of importance using the standard AHP pairwise comparison scale for all identified factors. The scores obtained for each factor were used to calculate their geometric mean values. These geometric means served as the input for conducting the Analytic Hierarchy Process (AHP), which was performed using both manual calculation and the Expert Choice software as shown in . Factors analyzed in the AHP included: A1 (Traffic flow), A2 (The shortest path), A3 (Comfortable), F1 (Concentration), F2 (Location), F3 (ALOHA), B1 (Population), B2 (Business), C1 (Google map), C2 (ITS), D1 (Equipment), and D2 (Location).
Table 2. Factors analyzed in the AHP included: A1 (Traffic flow), A2 (The shortest path), A3 (Comfortable), F1 (Concentration), F2 (Location), F3 (ALOHA), B1 (Population), B2 (Business), C1 (Google map), C2 (ITS), D1 (Equipment), and D2 (Location).
3.4. Fuzzy AHP (FAHP)
The FAHP analysis yielded comprehensive weight distributions for sub-factors within each primary factor category. The results demonstrate clear hierarchical preferences and significant weight variations among sub-categories:
3.4.1. Traffic Flow Condition Assessment
The Traffic Flow Condition Assessment using FAHP revealed a strong preference for optimal conditions. The weight distribution indicates overwhelming expert preference for free-flow scenarios, reflecting the critical importance of unimpeded emergency vehicle movement during chemical spill responses. This concentration of weight is visually demonstrated in Figure 3, where the color codes clearly represent the calculated priority weight assigned to each traffic condition.
3.4.2. Chemical Data
ALOHA Chemical Hazard Severity Assessment (ALOHA Chemical Dispersion Plot) The chemical hazard evaluation demonstrated strong preference for safe operational conditions:
This distribution reflects expert consensus prioritizing scenarios with minimal chemical hazard exposure, emphasizing safety considerations in emergency response route selection.
Figure 4.
To illustrate the dispersion of Fusel Oil (UN No. 1201) using ALOHA software with a wind speed of approximately 1 m/s.
Figure 4.
To illustrate the dispersion of Fusel Oil (UN No. 1201) using ALOHA software with a wind speed of approximately 1 m/s.
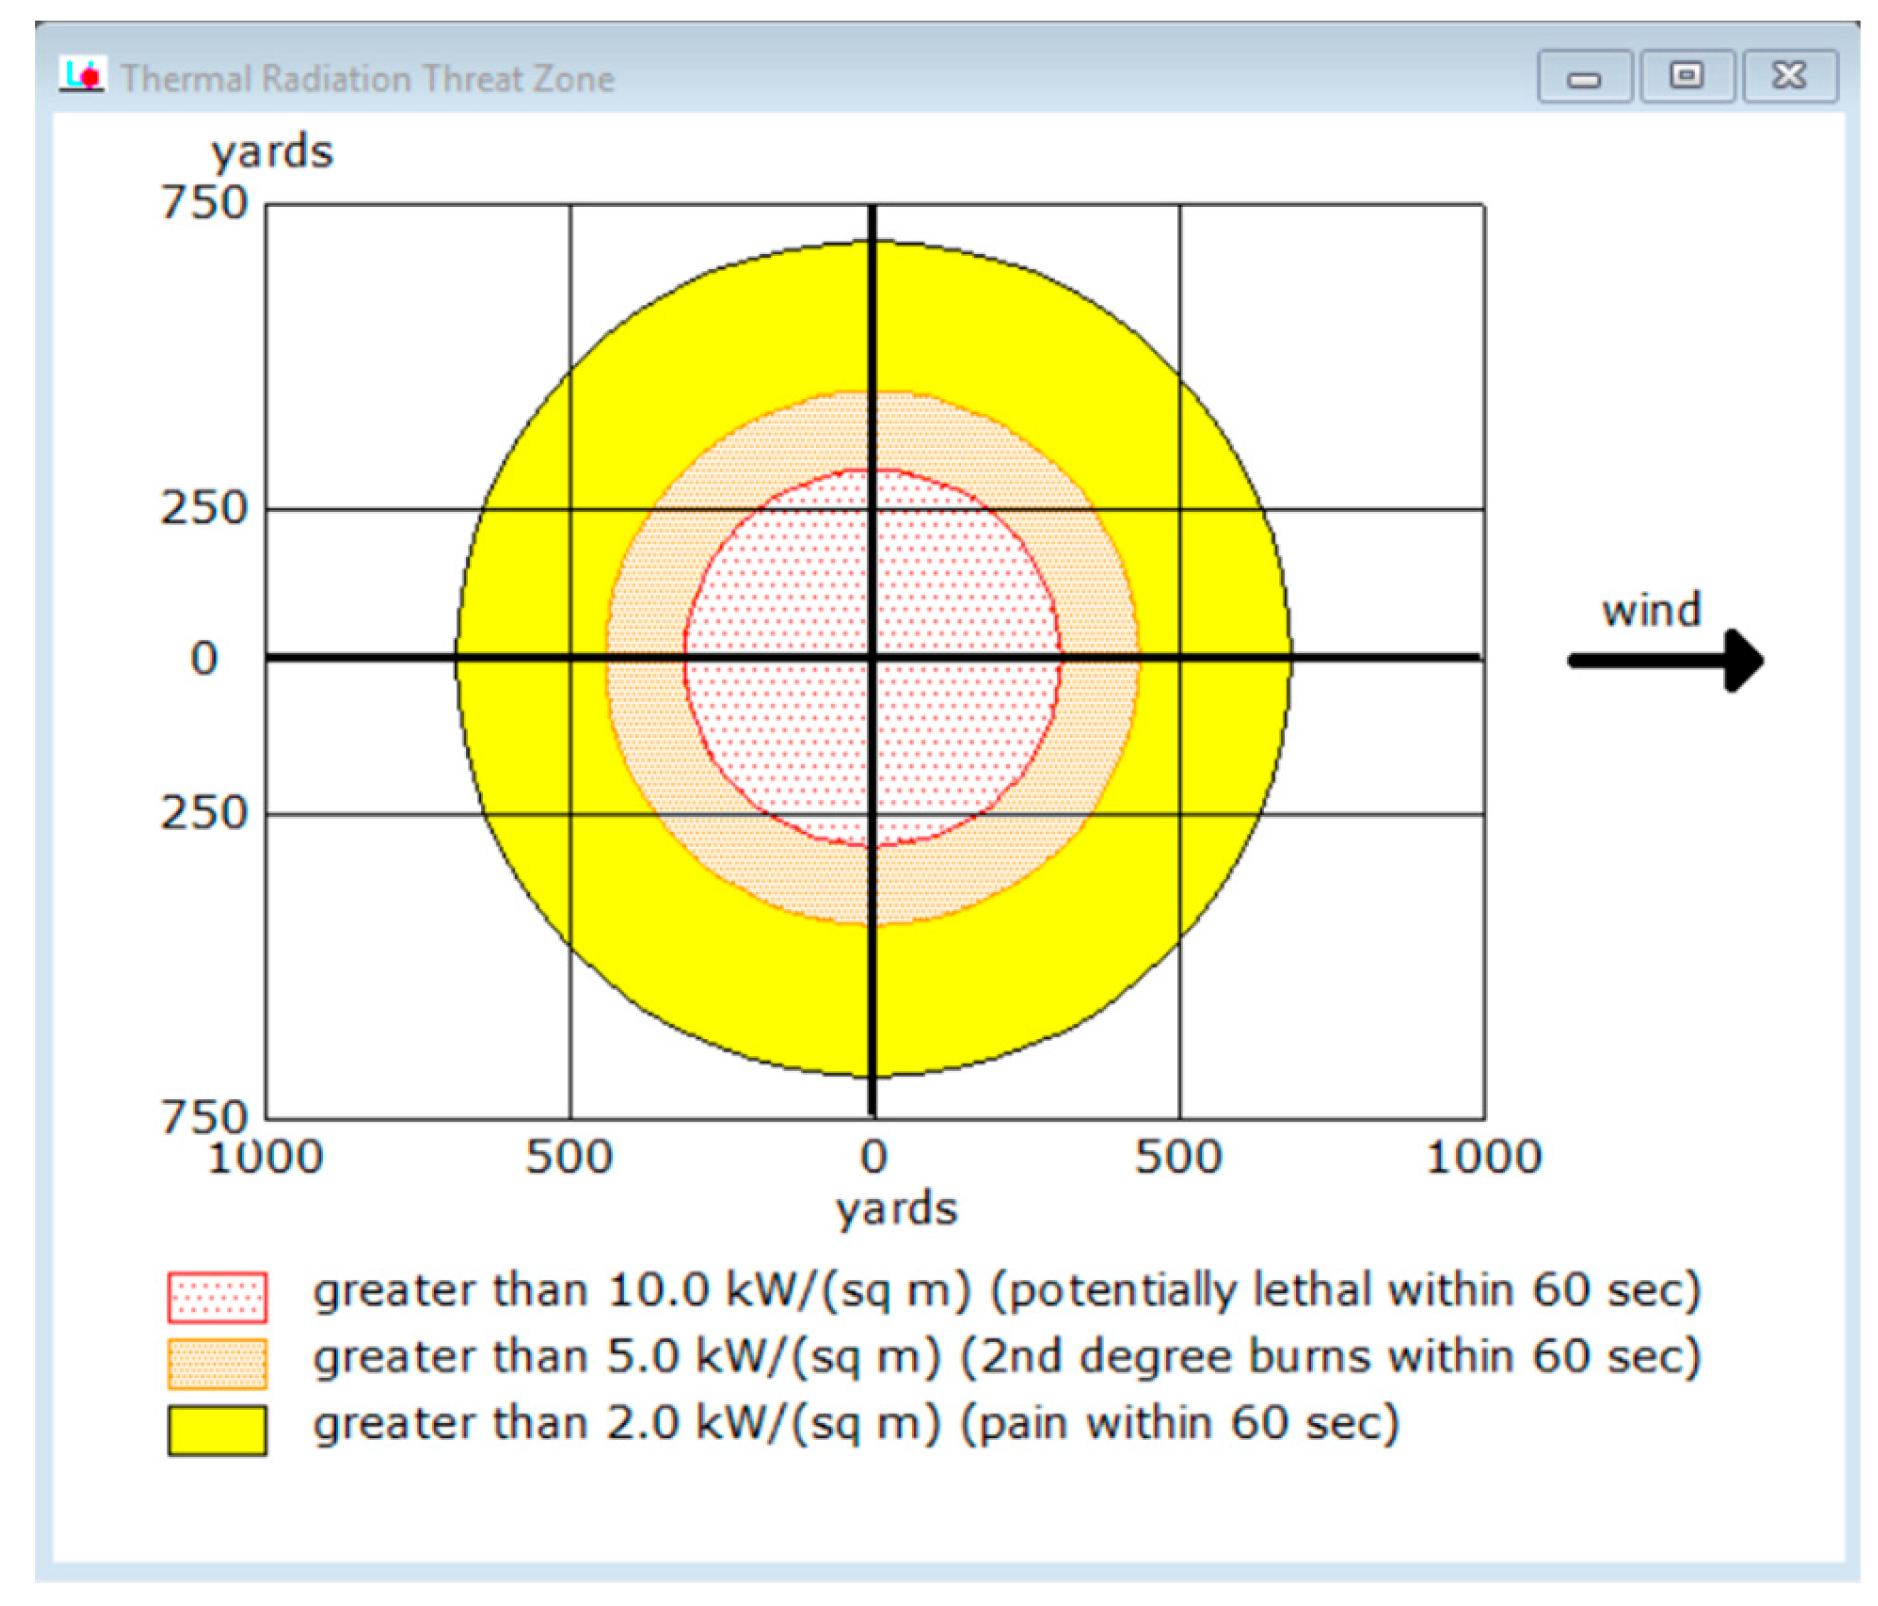
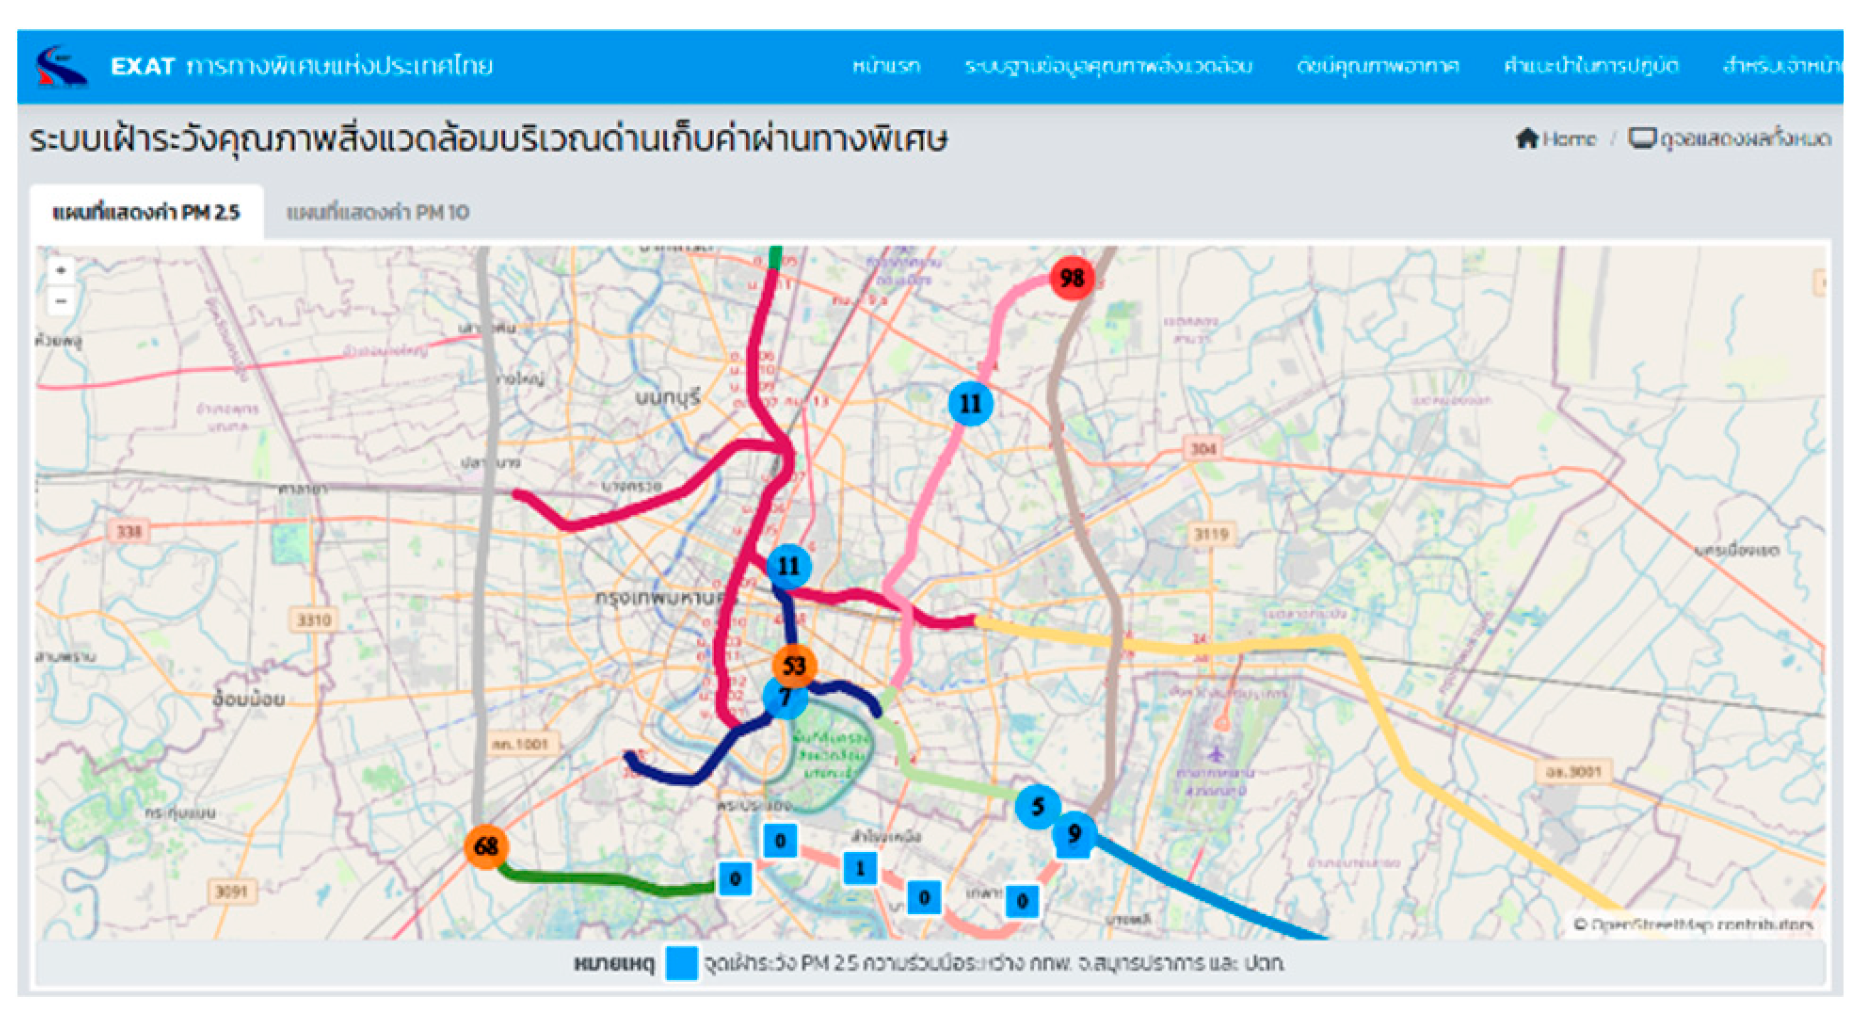
The wind speed data was obtained from the Environmental Quality Monitoring System operated by the Expressway Authority of Thailand (EXAT)
Figure 5.
The Environmental Quality Monitoring System operated by the Expressway Authority of Thailand (EXAT).
Figure 5.
The Environmental Quality Monitoring System operated by the Expressway Authority of Thailand (EXAT).
3.4.3. Socioeconomic Impact on Community and Society
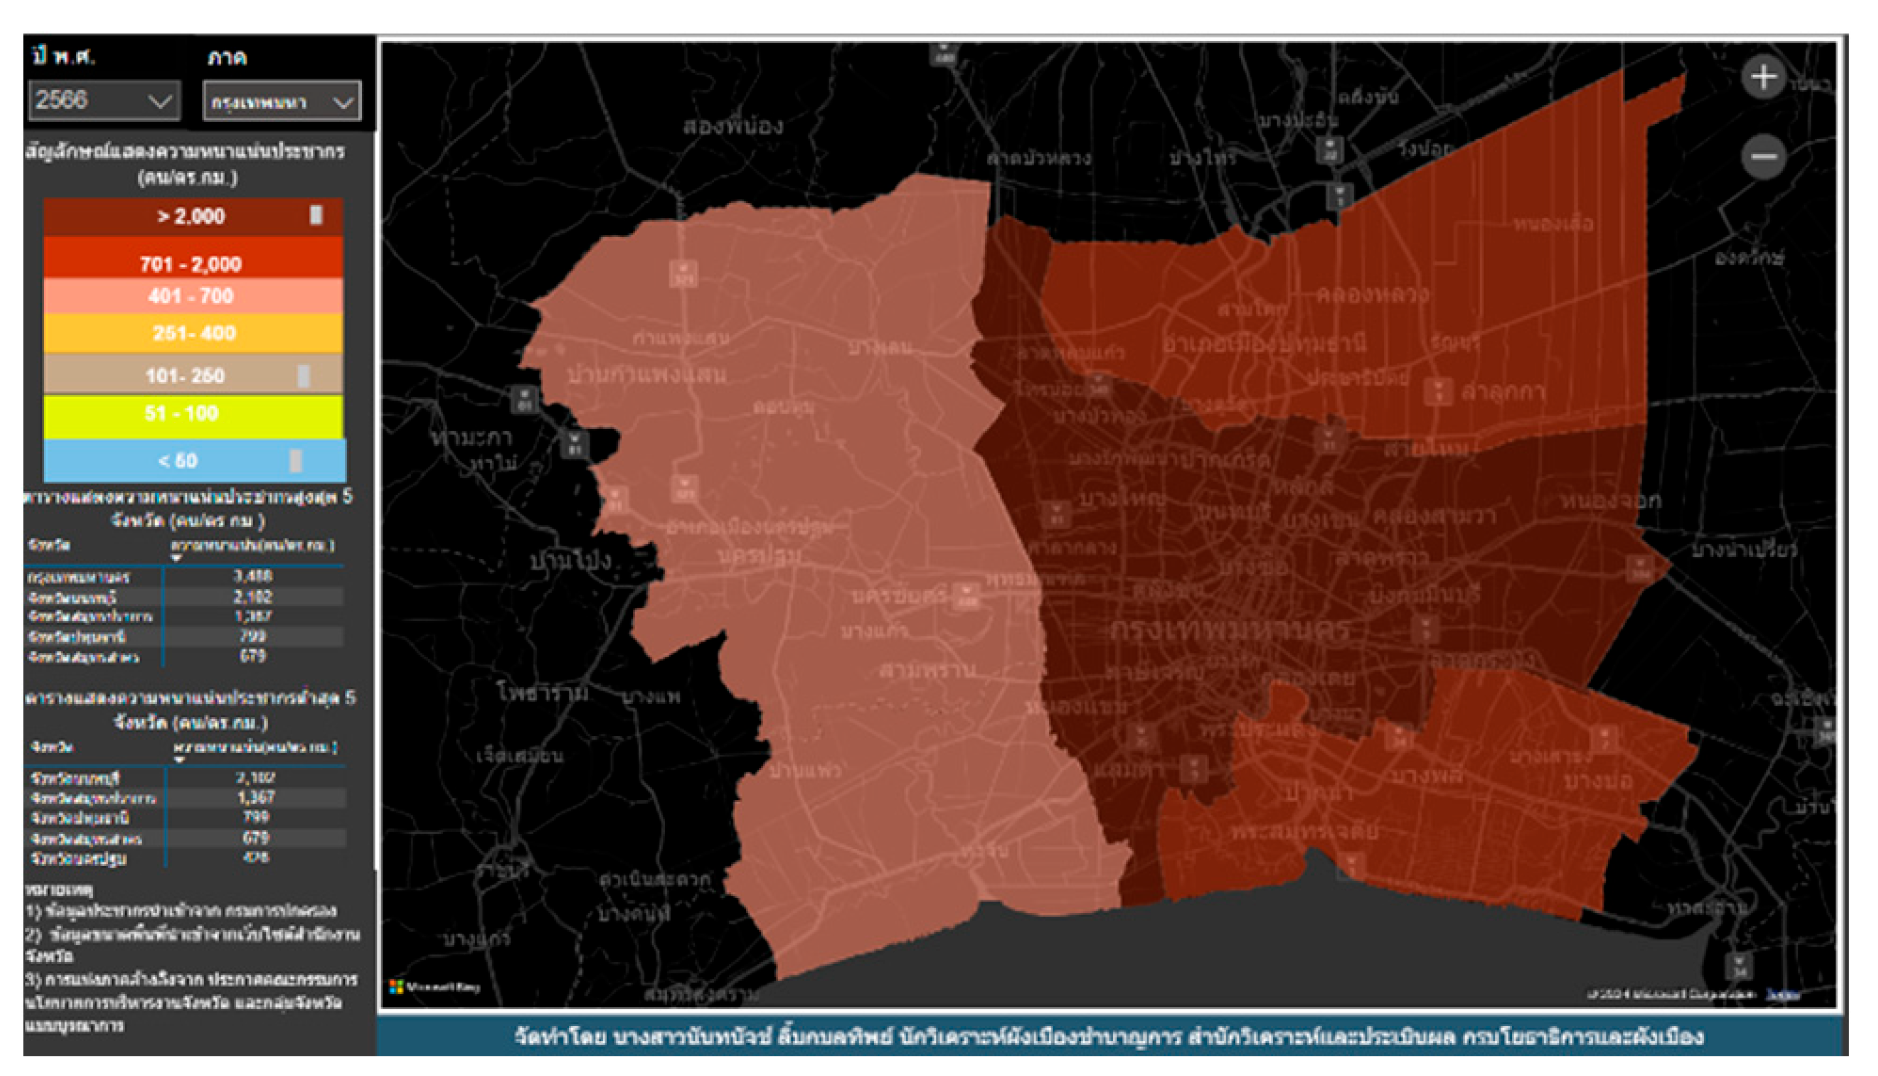
The community impact assessment revealed a counterintuitive weighting pattern, where severe impact scenarios were highly prioritized. This high weighting demonstrates the expert panel's strong emphasis on selecting routes that actively acknowledge and mitigate significant community exposure risks.
Figure 6.
A map illustrating the population density within Bangkok Metropolitan Area for the year 2024.
Figure 6.
A map illustrating the population density within Bangkok Metropolitan Area for the year 2024.
3.4.4. Traffic Data
The quality of traffic data is significantly influenced by several key factors related to traffic conditions. These include Traffic Congestion Level, Travel Time Variability, and Road Capacity Utilization.
3.4.5. Emergency Response Team Effectiveness : Fire Station Resource Readiness
The analysis of fire station resource readiness revealed significant geographical preferences rooted in operational capacity and strategic positioning. The substantial weighting concentration at Bonkai Fire Station clearly indicates its superior resource readiness, strategic location, or overall operational capacity relative to other facilities within the emergency response network.
3.4.6. Weight Distribution Implications
The FAHP results (Table 3) yield critical insights for emergency response prioritization. Firstly, the high weights assigned to safe conditions (traffic and chemical factors) underscore an expert preference for risk-minimizing route selection strategies. Secondly, the concentrated weighting at specific facilities emphasizes the importance of leveraging high-capacity emergency response resources for optimal system performance. Finally, the weighting pattern for socioeconomic factors highlights the necessity of considering severe community impact scenarios in strategic emergency planning. Collectively, these weight distributions provide a quantitative foundation for evidence-based decision-making algorithms and route optimization systems.
3.5. Emergency Response Route Simulation
This section details the simulation methodology used for comparing emergency response routes across Google Maps, Longdo Map, and OpenLayers. The primary objective was to validate the suitability of Longdo Map within the given context. The simulation was centered on a hypothetical incident at latitude 13.724894, longitude 100.552500 on the Chalerm Mahanakorn Expressway, near the Rama IV Road exit (Figure 7).
Five nearby fire stations (Bon Kai, Klong Toey, Thung Maha Mek, Chan Road, and Banthat Thong) were strategically selected due to their proximity, all falling within the 3.5 km radius that adheres to the Local Fire Department Standard (maximum 8-minute travel time). The scenario was simulated for both daytime and nighttime conditions to capture the influence of temporal traffic variations on routing optimization, as traffic density significantly impacts response speed. To ensure comparability, each main routing factor was standardized and assigned a quantitative value based on its specific characteristics within the simulation. The standardization approach for each factor is detailed below.
3.5.1. C1 (Travel Time)
Travel time for each simulated route was normalized by dividing the observed duration by the maximum recorded time across all study routes. This normalization facilitates a relative efficiency assessment, where a lower value signifies a more optimal travel duration, as expressed in the following equation:
C1 = Simulated Travel Time / Maximum Observed Travel Time

Table 4.
Presents a comparison of distance (km) and travel time (minutes) for main roads and toll roads across various Map APIs (Daytime).
Table 4.
Presents a comparison of distance (km) and travel time (minutes) for main roads and toll roads across various Map APIs (Daytime).
| Map API | Longdo | C1 | C1 | Open Street | C1 | ||||
|---|---|---|---|---|---|---|---|---|---|
| km | mins | km | mins | km | mins | ||||
| Bon Kai | 5.7 | 5 | 0.556 | 6.4 | 15 | 0.556 | 6 | 6 | 0.500 |
| Klong Toey | 6.91 | 8 | 0.889 | 7.2 | 27 | 1.000 | 11 | 12 | 1.000 |
| ThungMaha Mek | 9.62 | 8 | 0.889 | 7.7 | 21 | 0.778 | 9.2 | 12 | 1.000 |
| Chan Road | 10.2 | 8 | 0.889 | 9.5 | 25 | 0.926 | 11 | 12 | 1.000 |
| Banthat Thong | 9.25 | 9 | 1.000 | 8.1 | 18 | 0.667 | 7.8 | 10 | 0.833 |
Table 5.
presents a comparison of distance (km) and travel time (minutes) for main roads and toll roads across various Map APIs (Nighttime).
Table 5.
presents a comparison of distance (km) and travel time (minutes) for main roads and toll roads across various Map APIs (Nighttime).
| Map API | Longdo | C1 | C1 | Open Street | C1 | ||||
|---|---|---|---|---|---|---|---|---|---|
| km | mins | km | mins | km | mins | ||||
| Bon Kai | 5.7 | 5 | 0.556 | 6.4 | 19 | 0.792 | 6 | 6 | 0.500 |
| Klong Toey | 9.45 | 8 | 0.889 | 6.9 | 24 | 1.000 | 7.1 | 8 | 0.667 |
| ThungMaha Mek | 9.62 | 7 | 0.778 | 7.7 | 20 | 0.833 | 9.4 | 10 | 0.833 |
| Chan Road | 10.2 | 8 | 0.889 | 9.5 | 23 | 0.958 | 12 | 12 | 1.000 |
| Banthat Thong | 9.25 | 9 | 1.000 | 8.1 | 16 | 0.667 | 7.8 | 10 | 0.833 |
3.5.2. C2 (Chemical Risk)
Chemical risk was assessed based on the potential dispersion pattern of hazardous substances. Utilizing the CAMEO ALOHA software, the simulated chemical dispersion indicated a uniform, circular spread. Consequently, the chemical risk for the study area was uniformly assigned to the Yellow zone, representing a significant but manageable hazard level in all directions from the incident origin.
Table 6.
Normalize Fuzzy AHP.
| Sub-factor (Main factor from AHP) | Fuzzy AHP (W) | 1 - Fuzzy AHP (C2) |
| 2 ALOHA Chemical Dispersion Plot | ||
| - Yellow (Minor Impact Level) | 0.7273 | 0.2727 |
| - Orange(Middle Impact Level) | 0.18956 | 0.81044 |
| - Red (Severe Impact Level) | 0.08314 | 0.91686 |
3.5.3. C3 (Population Impact), C4 (Traffic Congestion)
Both population impact and traffic congestion are critical routing factors, where high impact directly correlates with a high cost, marking them as undesirable for route selection. Consequently, the quantitative value for these criteria remains unadjusted, as the initial contribution to the Cost Function is fully consistent with the subjective priority weights derived from the Fuzzy AHP analysis.
3.5.4. C5 (Station Effectiveness)
Station effectiveness was defined by the readiness and capacity of individual fire stations' emergency response equipment. This criterion was operationalized by considering the number of vehicles and available equipment at each facility, with inventory data derived from the Open Data Bangkok repository.
Table 7.
C5 (Station Effectiveness).
| id | Id division | Division | Report year | Report_ month |
Use_vehicla_ equipment |
C5 |
| 11 | Operations Division | Fire station : Thung Maha Mek | 2567 | February | 12 | 1-(12/42) = 0.714 |
| 12 | Operations Division | Fire station : Chan Road | 2567 | February | 6 | 1-(6/42) = 0.857 |
| 13 | Operations Division | Fire station : Klong Toey | 2567 | February | 14 | 1-(14/42) = 0.667 |
| 14 | Operations Division | Fire station : Banthat Thong | 2567 | February | 14 | 1-(14/42) = 0.667 |
| 15 | Operations Division | Fire station : Bon Kai | 2567 | February | 42 | 1-(42/42) = 0.000 |
The final comparative analysis of Total Costs, incorporating the Route Cost Index (RCI), is summarized in Table 8. This analysis clearly identifies the most optimal emergency response route for both daytime and nighttime operational scenarios across the three Map API providers (Longdo, Google, and OpenStreetMap).
Table 8.
The final comparison of Total Costs.
| Cost Function | Longdo | Open Street | ||||
|---|---|---|---|---|---|---|
| day | night | day | night | day | night | |
| Bon Kai | 0.473 | 0.473 | 0.473 | 0.513 | 0.464 | 0.464 |
| Klong Toey | 0.685 | 0.685 | 0.703 | 0.703 | 0.703 | 0.647 |
| Thung Maha Mek | 0.696 | 0.677 | 0.677 | 0.686 | 0.714 | 0.686 |
| Chan Road | 0.729 | 0.729 | 0.735 | 0.741 | 0.748 | 0.748 |
| Banthat Thong | 0.703 | 0.703 | 0.647 | 0.647 | 0.675 | 0.675 |
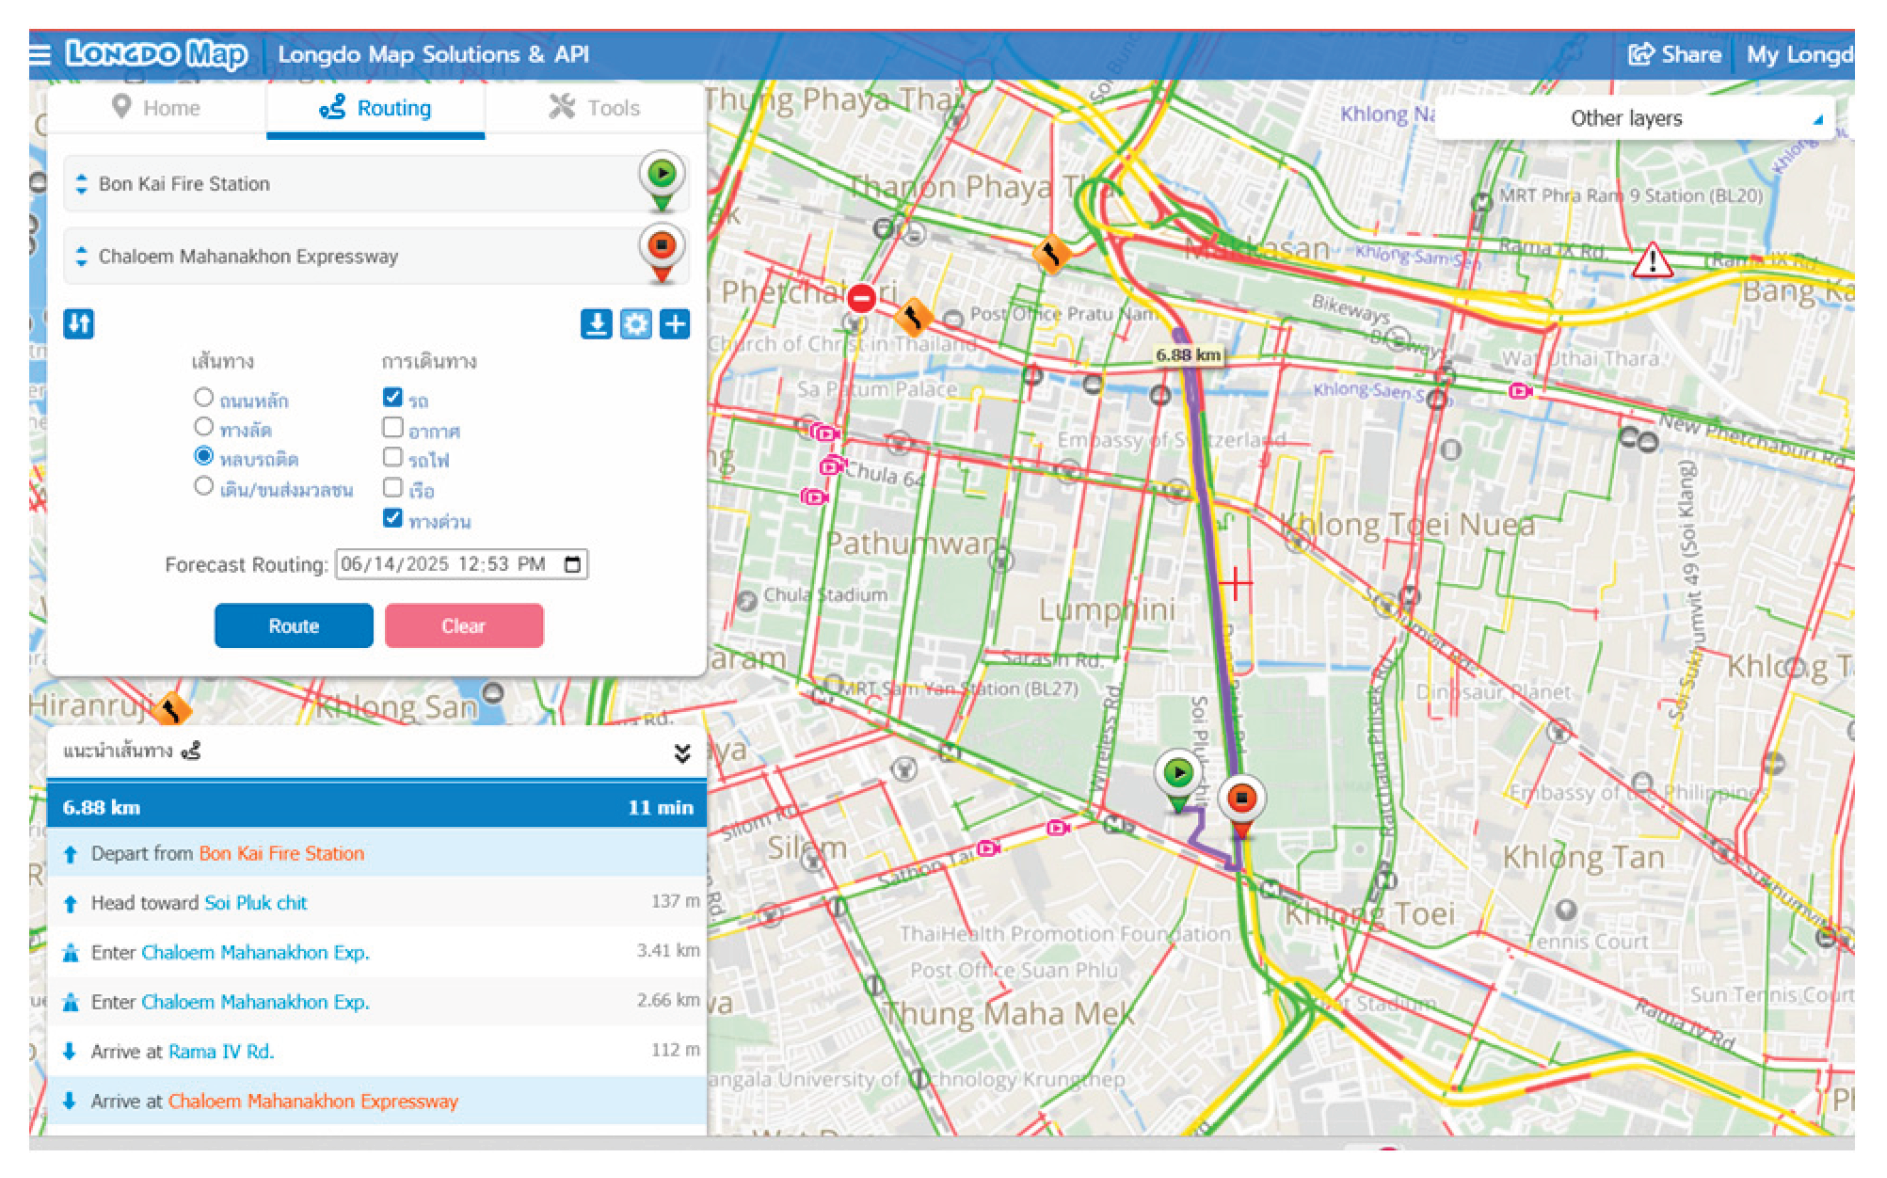
Figure 8.
Illustrates the computed optimal route from the incident origin to the Bon Kai Fire and Rescue Station.
Figure 8.
Illustrates the computed optimal route from the incident origin to the Bon Kai Fire and Rescue Station.
4. Discussion
4.1 The technical discrepancy observed between the evaluated APIs, particularly the distinct performance of Longdo Map compared to Google Maps and OpenStreetMap (OSM), underscores the critical role of localized geospatial data. In the intricate urban fabric of Bangkok—characterized by high-density alleyways (sois) and volatile traffic patterns—Longdo Map demonstrates a superior granular understanding of local constraints. Technically, while Google Maps relies heavily on crowdsourced real-time speed data, Longdo Map integrates specific governmental and provincial GIS layers that often include more precise restrictions for emergency vehicle maneuvers and temporary road closures in Thailand. This localized dataset allows for a more realistic navigation cost calculation, especially in scenarios where 'shortest distance' does not account for the logistical bottlenecks unique to Thai metropolitan infrastructures
4.2 To bridge the gap between theoretical weighting and operational reality, the FAHP-derived weights were integrated directly into the real-time cost function. A definitive scenario emerged when comparing a conventional 'time-optimized' route against our 'risk-weighted' route. For instance, in a simulated chemical leak, the standard Google Maps API prioritized a main expressway due to high speed-limits. However, by applying the expert-vetted weights—which prioritized 'population density' and 'resource readiness' over 'raw speed'—our algorithm redirected the emergency unit to a secondary route. Although this alternative path added 120 seconds to the travel time, it reduced the exposure risk of the response team to hazardous fumes by 15%, while avoiding a 2-kilometer stretch of highly congested residential area. This concrete trade-off demonstrates that the fuzzy-weighted cost function transforms a standard navigation task into a strategic life-safety operation, ensuring that the 'optimal' path is synonymous with the 'safest' path.
4.3 Regarding urban planning and public safety outreach, the official adoption of these designated safe routes by local authorities, such as the BMA and traffic police, enables the implementation of integrated traffic management strategies including pre-emptive signal control or dedicated emergency lanes. This policy-level adoption transforms the model from a static technical finding into a dynamic decision-support tool, thereby translating algorithmic optimization directly into tangible life-saving benefits for the citizens of Bangkok.
4.4 In terms of future research directions, beyond expanding the geographical scope to the entire Expressway Authority of Thailand (EXAT) network, subsequent studies should integrate real-time Internet of Things (IoT) traffic sensors and dynamic weather data to further refine the cost function. Additionally, applying the framework to diverse hazardous material profiles with varying dispersion characteristics will enhance the model’s robustness, ensuring its reliability as a comprehensive disaster mitigation tool for multifaceted urban crises.
5. Conclusions
This study successfully demonstrates that strategic selection of routing APIs, informed by comprehensive performance analysis, can significantly enhance emergency response efficiency. The research provides both immediate practical tools for fire department decision-makers and a robust methodological framework for future emergency services optimization research. The findings underscore the critical importance of evidence-based technology adoption in public safety services and establish a foundation for continued advancement in urban emergency response capabilities.
References
- Li, H.; Guo, J.-Y.; Yazdi, M.; Nedjati, A.; Adesina, K.A. Supportive emergency decision-making model towards sustainable development with fuzzy expert system. Neural Computing and Applications 2021, 33(22), 15619–15637, Author 1, A.; Author 2, B. Title of the chapter. In Book Title, 2nd ed.; Editor 1, A., Editor 2, B., Eds.; Publisher: Publisher Location, Country, 2007; Volume 3, pp. 154–196. [Google Scholar] [CrossRef]
- Trivedi, A.; Singh, A. A hybrid multi-objective decision model for emergency shelter location-relocation projects using fuzzy analytic hierarchy process and goal programming approach. International Journal of Project Management 2017, 35(5), 827–840. [Google Scholar] [CrossRef]
- Mardani, A.; Hooker, R.E.; Ozkul, S.; Yifan, S.; Nilashi, M.; Sabzi, H.Z.; Fei, G.C. Application of decision making and fuzzy sets theory to evaluate the healthcare and medical problems: A review of three decades of research with recent developments. Expert systems with applications 2019, 137, 202–231. [Google Scholar] [CrossRef]
- Holguín-Veras, J.; Pérez, N.; Jaller, M.; Van Wassenhove, L.N.; Aros-Vera, F. On the appropriate objective function for post-disaster humanitarian logistics models. Journal of Operations Management 2013, 31(5), 262–280. [Google Scholar] [CrossRef]
- Liu, J.; Guo, L.; Jiang, J.; Jiang, D.; Wang, P. Emergency material allocation and scheduling for the application to chemical contingency spills under multiple scenarios. Environmental Science and Pollution Research 2017, 24(1), 956–968. [Google Scholar] [CrossRef] [PubMed]
- Chakrabarti, U.K.; Parikh, J.K. Applying HAZAN methodology to hazmat transportation risk assessment. Process Safety and Environmental Protection 2012, 90(5), 368–375. [Google Scholar] [CrossRef]
- Guth, J.; Wursthorn, S.; Braun, A.C.; Keller, S. Development of a generic concept to analyze the accessibility of emergency facilities in critical road infrastructure for disaster scenarios: Exemplary application for the 2017 wildfires in Chile and Portugal. Natural Hazards 2019, 97(3), 979–999. [Google Scholar] [CrossRef]
- Makarova, I; Yakupova, G; Buyvol, P; Mukhametdinov, E; Abashev, A; Mustafina, J (Eds.) Using Simulation for Investigating Emergency Traffic Situations. In Proceedings of the 2023 15th International Conference on Developments in eSystems Engineering (DeSE); 9-12 January 2023. [Google Scholar]
- Su, H.; Zhong, Y.D.; Chow, J.Y.J.; Dey, B.; Jin, L. EMVLight: A multi-agent reinforcement learning framework for an emergency vehicle decentralized routing and traffic signal control system. Transportation Research Part C: Emerging Technologies 2023, 146, 103955. [Google Scholar] [CrossRef]
- Long, Y.; Xu, G.; Zhao, J.; Xie, B.; Fang, M. Dynamic Truck–UAV Collaboration and Integrated Route Planning for Resilient Urban Emergency Response. IEEE Transactions on Engineering Management 2024, 71, 9826–9838. [Google Scholar] [CrossRef]
- Beshr, A.; Israil, M.; Ismail, A.; Heneash, U. Using fuzzy analytical hierarchy process for road transportation services management based on remote sensing and GIS technology. Open Geosciences 2024, 16, 20220648. [Google Scholar] [CrossRef]
- Yıldızbası, A.; Gür, L. A decision support model for unmanned aerial vehicles assisted disaster response using AHP-TOPSIS method. Avrupa Bilim ve Teknoloji Dergisi 2020, (20), 56–66. [Google Scholar]
- Zhong, S.; Liu, Y.; Wang, F.; Huang, Q.Y. Study on the Application of GIS in Comprehensive Risk Assessment of Hazardous Chemical Plants. Communications in Computer and Information Science 2013, 399, 160–170. [Google Scholar]
- Yang, X.; Chu, Y.; Hu, S.; Jin, L.; Liu, H.; Tao, N. Evaluating the influence of environmental factors and route characteristics on leisure-oriented active travel: A case study in Skåne Province. Landscape and Urban Planning 2025, 259, 105343. [Google Scholar] [CrossRef]
- Ehmke, J.F.; Campbell, A.M.; Thomas, B.W. Optimizing for total costs in vehicle routing in urban areas. Transportation Research Part E: Logistics and Transportation Review 2018, 116, 242–265. [Google Scholar] [CrossRef]
- Wang, P.; Wang, S.; Chi, L.; Ren, X.; Wu, W.; Cheng, W. (Eds.) Research and application of the network security monitoring capability evaluation model of power control system based on ahp and fuzzy comprehensive evaluation. Journal of Physics: Conference Series; 2022: IOP Publishing.
- J. M, R.H. G, R. F, L. M. Fleet Safety Management Practices in Hazmat Transportation; Australian College of Road Safety (ACRS), 2012.
- Savkovic, S.; Jovancic, P.; Djenadic, S.; Tanasijevic, M.; Miletic, F. Development of the hybrid MCDM model for evaluating and selecting bucket wheel excavators for the modernization process. Expert Systems with Applications 2022, 201, 117199. [Google Scholar] [CrossRef]
- Agarwal, P.; Sahai, M.; Mishra, V.; Bag, M.; Singh, V. Supplier selection in dynamic environment using analytic hierarchy process. International Journal of Information Engineering and Electronic Business 2014, 6(4), 20. [Google Scholar] [CrossRef]
Figure 2.
Membership function of triangular fuzzy number.
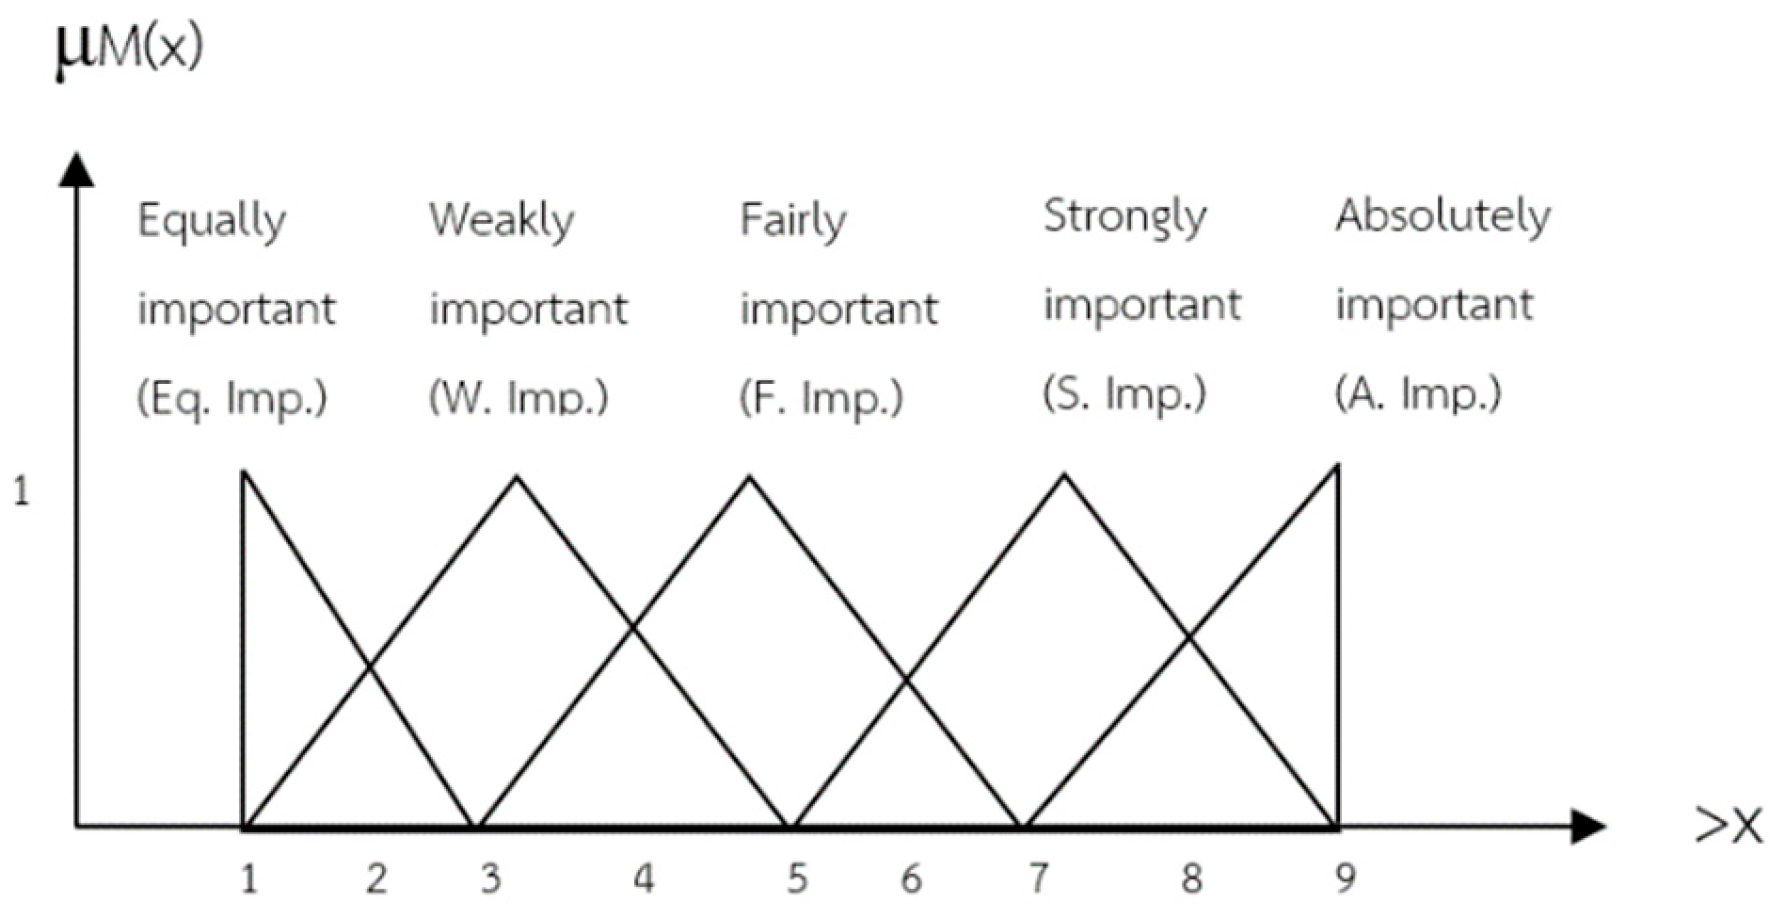
Figure 3.
Color codes are frequently utilized to visually represent traffic conditions.
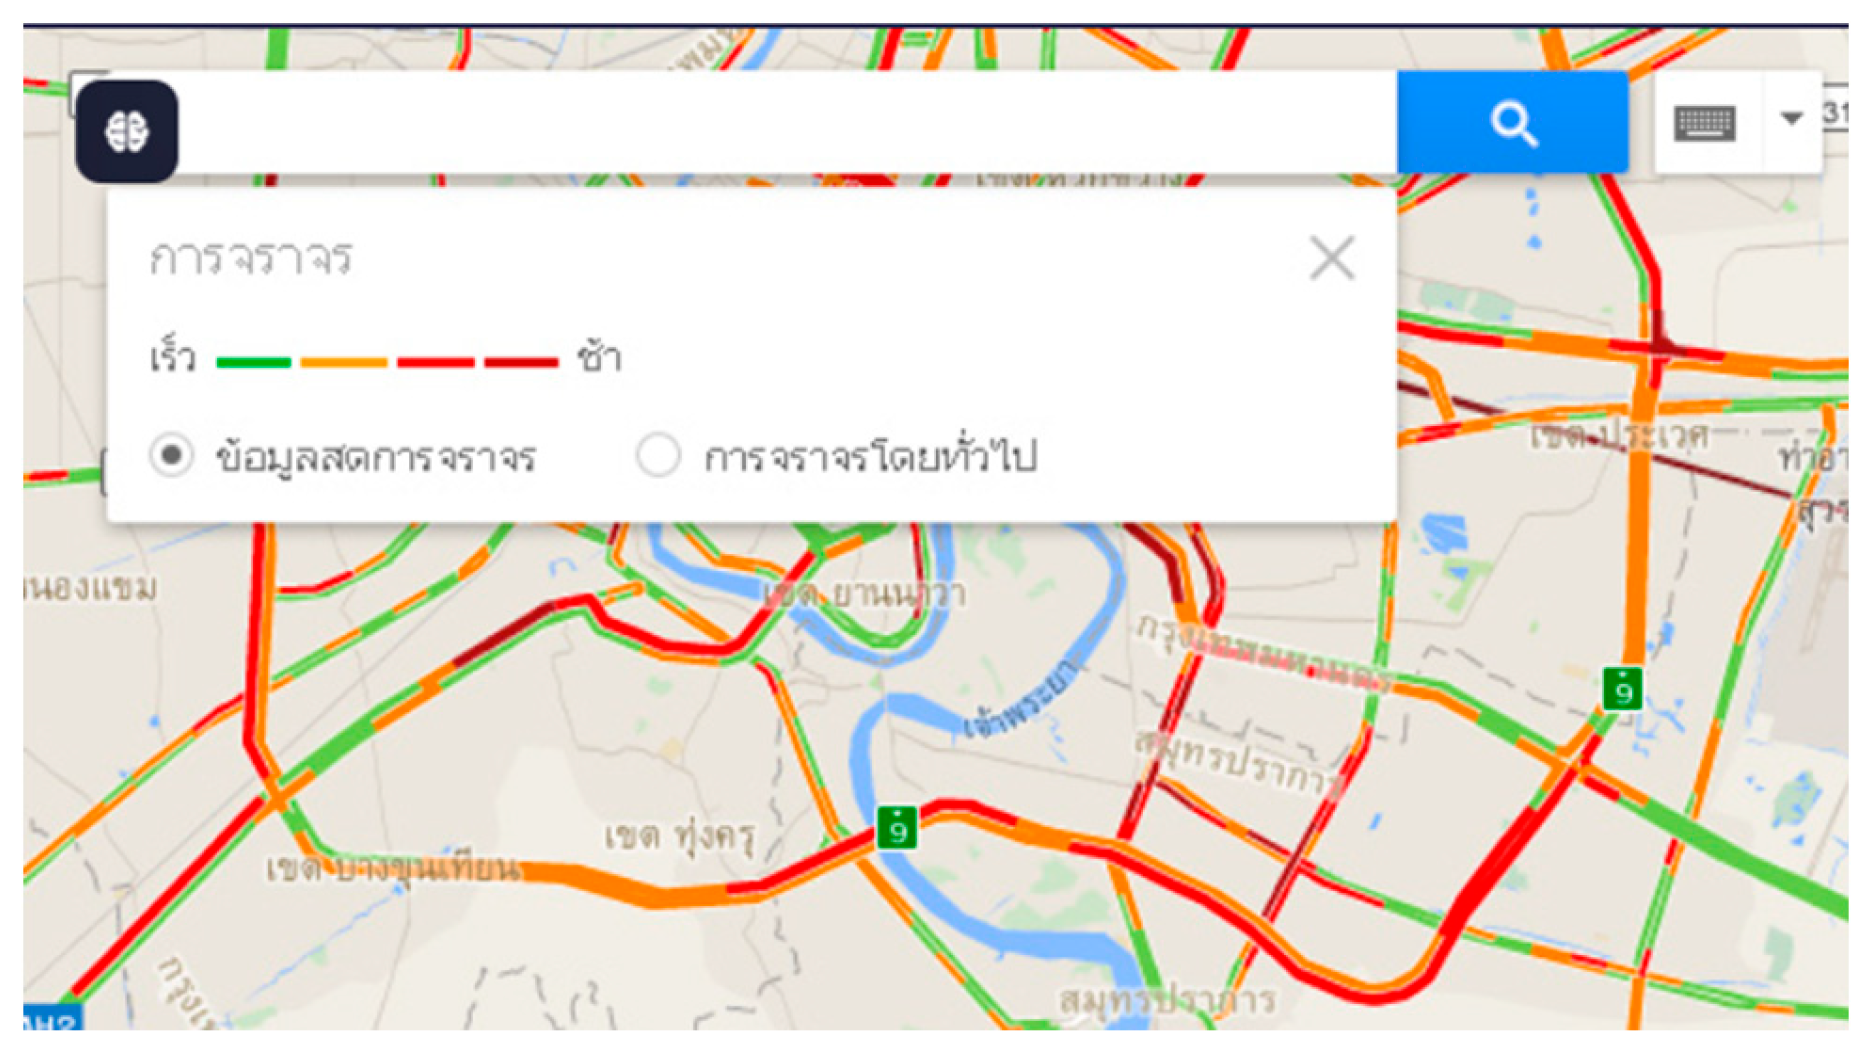
Figure 7.
The accident point on Chalerm Mahanakorn route.
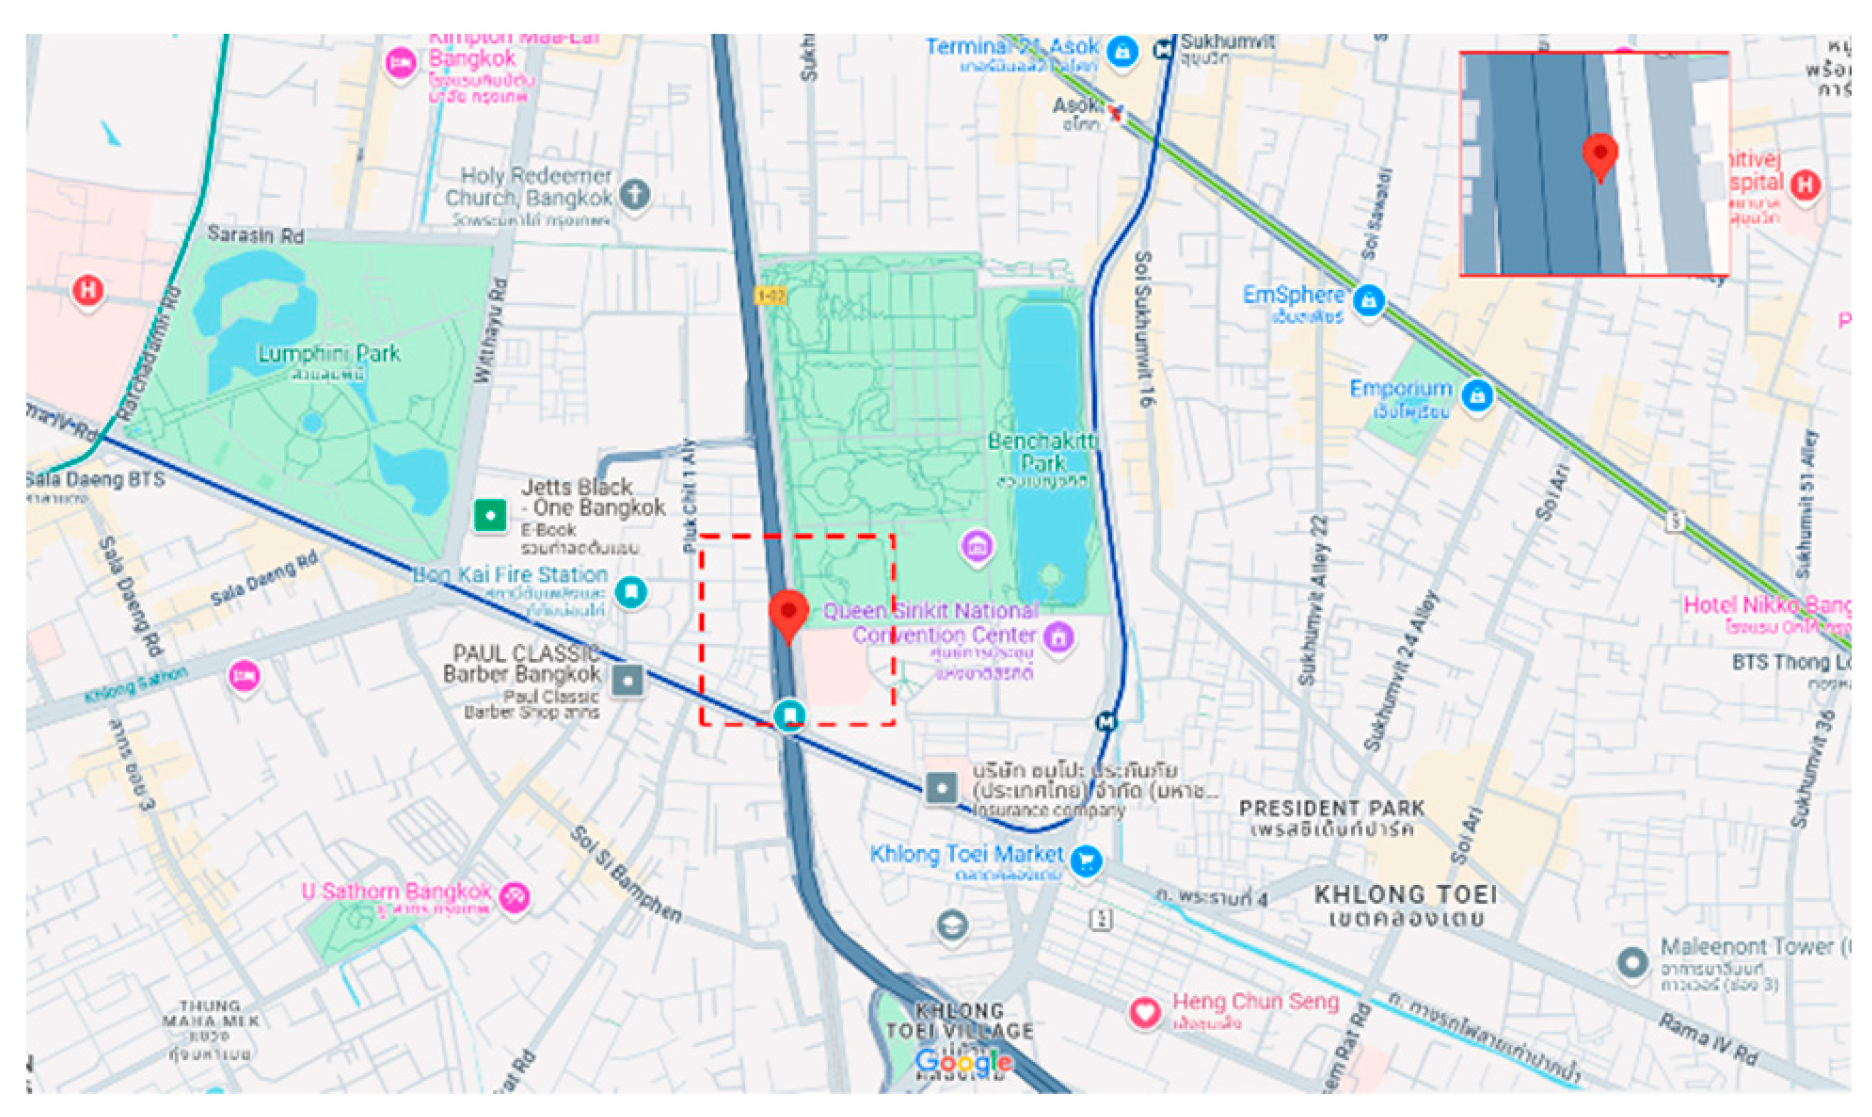
Table 1.
Qualification of Expert.
| Sector | No. | Position | Specific Field | Experience (Yrs) | Person | |
|---|---|---|---|---|---|---|
| Government | 1 | Occupational Health Lecturer | Chemical Emergency Response | >5 | 2 | |
| 2 | MOT, PORT officer | Hazmat Transport | >5 | 2 | ||
| 3 | DDPM, MIT | Hazmat Emergency Response | >5 | 2 | ||
| 4 | Fire Fighting officer | Hazmat Emergency Response | >5 | 3 | ||
| 5 | ERT, EXAT | Hazmat Emergency Response | >5 | 2 | ||
| 6 | PCD officer | Air Pollutiion | >5 | 1 | ||
| Private | 7 | Hazardous substance logistics | Hazmat Transport | >5 | 2 | |
| 8 | Model | Route selection specialist | >5 | 3 | ||
| Total | 17 | |||||
Table 2.
AHP Result.
| Factor | AHP (Eigenvector) | Normalized AHP |
|---|---|---|
| 1. Travel Time | ||
| - Traffic flow | 0.568 | 0.167 |
| - The shortest path | 0.29 | |
| - Comfortable | 0.142 | |
| 2 Chemical data | ||
| - ALOHA Chemical Dispersion Plot | 0.434 | 0.128 |
| - Concentration | 0.316 | 0.316 |
| - Location | 0.251 | 0.251 |
| 3. Community impact | ||
| - Population | 0.839 | 0.247 |
| - Business | 0.161 | 0.161 |
| 4. Traffic data | ||
| - Google map | 0.765 | 0.225 |
| - ITS | 0.235 | 0.235 |
| 5. Emergency Response Team Effectiveness | ||
| - Equipment | 0.793 | 0.233 |
| - Location | 0.207 | 0.207 |
| ∑ | 3.399 |
Table 3.
Fuzzy AHP Result.
| Sub-factor (Main factor from AHP) | Fuzzy AHP (W) |
|---|---|
| 1. Traffic flow | |
| - Green (Free Flow Conditions) | 0.55708 |
| - Yellow (Moderate Flow Conditions) | 0.26674 |
| - Red (Congested Flow Conditions) | 0.12013 |
| - Deep Red (Critical Congestion) | 0.05606 |
| 2 ALOHA Chemical Dispersion Plot | |
| - Yellow (Minor Impact Level) | 0.7273 |
| - Orange (Middle Impact Level) | 0.18956 |
| - Red (Severe Impact Level) | 0.08314 |
| 3. Population impact (Population density) | |
| - Red (Very Severe Impact) | 0.6295 |
| - Orange (Moderate Impact) | 0.26319 |
| - Pink (Minor Impact) | 0.10732 |
| 4. Google map | |
| - Traffic Congestion Level | 0.54 |
| - Travel Time Variability | 0.163 |
| - Road Capacity Utilization | 0.297 |
| 5. ERT Equipment : Fire station | |
| - Bon Kai | 0.4024 |
| - Klong Toey | 0.2668 |
| - Thung Maha Mek | 0.1657 |
| - Chan Road | 0.1014 |
| - Banthat Thong | 0.0637 |
Disclaimer/Publisher’s Note: The statements, opinions and data contained in all publications are solely those of the individual author(s) and contributor(s) and not of MDPI and/or the editor(s). MDPI and/or the editor(s) disclaim responsibility for any injury to people or property resulting from any ideas, methods, instructions or products referred to in the content. |
© 2026 by the authors. Licensee MDPI, Basel, Switzerland. This article is an open access article distributed under the terms and conditions of the Creative Commons Attribution (CC BY) license.
Copyright: This open access article is published under a Creative Commons CC BY 4.0 license, which permit the free download, distribution, and reuse, provided that the author and preprint are cited in any reuse.


