Submitted:
19 January 2026
Posted:
19 January 2026
You are already at the latest version
Abstract
To enhance Customer Lifetime Value (CLV) within the lifecycle management of automated equipment, this study addresses the lack of foresight in traditional cost analysis by establishing an AI-based lifecycle cost modelling and CLV decision-making methodology grounded in multi-stage forecasting. Utilising operational and maintenance data, costs across distinct lifecycle phases are projected, with these forecasts integrated into a CLV optimisation model for empirical analysis.Results indicate this approach reduces cost prediction errors by approximately 30% and increases average equipment CLV by around 18%. The study concludes that decision mechanisms grounded in predictive costs effectively support value enhancement and refined management of automated equipment.
Keywords:
automated equipment
; life‐cycle cost
; multi‐stage forecasting
; customer life‐cycle value (CLV)
; decision optimisation
1. INTRODUCTION
As manufacturing continues to evolve from product-oriented to service-oriented approaches, the lifecycle costs generated during the operation, maintenance, and service phases of automated equipment are increasingly becoming critical factors influencing customer lifecycle value. Compared to the one-time investment during the equipment procurement phase, costs in the operation and service phases exhibit characteristics such as continuous accumulation, complex structures, and high volatility. Their fluctuation directly impacts the overall profitability of the equipment throughout its lifecycle. Existing cost management approaches predominantly rely on retrospective statistics and experiential judgments, making it challenging to capture the dynamic evolution of costs across different lifecycle stages or provide forward-looking support for value management. Focusing on the intrinsic link between lifecycle cost forecasting and value transformation, this study uses automated equipment as its research subject. It constructs an analytical framework integrating phased cost forecasting with customer lifecycle value decision-making. Based on real operational data, empirical analysis is conducted to provide a data-driven technical pathway for managing the full lifecycle value of automated equipment[1].
2. LIFECYCLE COST DATA
2.1. Cost Composition Analysis
The costs incurred throughout the lifecycle of automated equipment exhibit distinct phased and structural characteristics, forming the foundation for cost forecasting and CLV modelling analysis. Based on engineering operational data from medium-sized industrial automation equipment, lifecycle costs primarily comprise delivery and installation, operational energy consumption, maintenance and repairs, downtime losses, and upgrades/retrofitting. Their distribution is shown in Table 1.
Table 1 demonstrates that operational, maintenance, and downtime-related costs constitute the predominant proportion of lifecycle expenditures. Figure 1 further illustrates the distribution characteristics of various cost categories throughout the lifecycle, indicating that mid-to-late-stage operational maintenance and upgrade/retrofit costs exert a significant influence on the overall cost level. This characteristic provides a basis for subsequent multi-stage cost forecasting model development[2].
2.2. Data Acquisition and Processing
The data utilised herein originates from operational and service records of automated equipment at a manufacturing enterprise. The sample spans an eight-year operational cycle, encompassing 120 units of identical equipment. The dataset includes equipment operational energy consumption, maintenance records, fault-related downtime incidents, and corresponding cost information.Following data screening and processing, a unified input dataset comprising 95 devices and 6,800 valid samples was formed for the multi-stage lifecycle cost prediction model, providing the foundational data for subsequent model training and empirical analysis[3].
2.3. Definition of CLV Metric
In a service-oriented scenario, Customer Lifetime Value (CLV) is defined according to a one-to-one correspondence between "device and customer," meaning that each device serves a customer, and CLV reflects the lifecycle value of that device. To uniformly characterize the net economic value created by automated equipment for the enterprise on a lifecycle indicator, Customer Lifetime Value (CLV) is introduced as an evaluation metric. CLV is defined as the net economic value of a device over its entire service life, expressed mathematically as follows:
where: represents the economic revenue generated by the automated equipment during the th service cycle through operational support, maintenance services, etc.; denotes the lifecycle costs incurred during the corresponding cycle, including expenditures on operation, maintenance, downtime, and upgrades; is the discount rate, reflecting the time value of money; is the length of the equipment service cycle[4].
3. LIFE CYCLE COST FORECASTING MODEL
3.1. Forecasting Objectives and Characteristics
The objective of lifecycle cost forecasting is to depict the cost evolution trends of automated equipment across different operational phases, providing forward-looking cost inputs for the CLV decision-making model. This paper focuses on phase-specific costs within the equipment's next service cycle, prioritising operational, maintenance, and downtime-related cost items. Forecasting characteristics are selected based on principles of engineering accessibility and operational relevance, comprehensively reflecting equipment operational status and lifecycle attributes[5].When using predicted costs for decision analysis, predicted life cycle costs are used instead to obtain the CLV under predicted conditions, which can then be used to support forward-looking value assessment and decision optimization.
3.2. Multi-Stage Forecasting Model
Lifecycle stages are determined based on change points of maintenance frequency and downtime rate.Input features include load, energy consumption, maintenance count, fault rate, and equipment age.Each stage uses a regression-based cost prediction model trained independently.Training and testing sets are split chronologically to avoid future information leakage.Given the aforementioned characteristics of the lifecycle cost structure, automated equipment exhibits differentiated cost evolution patterns across distinct operational phases, rendering a single predictive model inadequate to account for the specificities of each stage. Consequently, this paper adopts a multi-stage predictive modelling approach, segmenting the lifecycle into distinct phases while maintaining a unified feature space. Let the equipment lifecycle be divided into phases, with their respective time index sets denoted as . The cost prediction model for the next cycle may then be expressed as Equation (2):
where: denotes the predicted cost of the equipment within the next service cycle, represents the unified state feature vector for the th cycle, and is the prediction function corresponding to the lifecycle stage. This model achieves stage-specific prediction within a unified feature system through the mapping relationship between time indices and stage sets, effectively capturing the differences in cost generation mechanisms across distinct stages. In practical engineering applications, the division of life cycle stages is not arbitrarily defined but determined based on equipment operational characteristics and cost evolution patterns. Statistical results indicate that as equipment service life increases, maintenance frequency, failure rates, and downtime duration exhibit significant phased variations, with cost fluctuations in the mid-to-late stages being markedly higher than in the initial stage. Using a unified prediction model risks weakening the cost distribution differences between stages, thereby reducing prediction accuracy. The multi-stage prediction model introduces stage indices within a unified feature system. This enables the prediction function to fit the cost generation mechanisms specific to different life cycle stages, effectively capturing the cost differences between the stable operation period and the high-risk maintenance period. Figure 2 illustrates the multi-stage lifecycle prediction structure, visually presenting the stage divisions and the model switching relationships between stages[6].
In engineering practice, the lifecycle phase division is determined based on the statistical characteristics of equipment failure rate, maintenance frequency, and cost change rate. When equipment reaches a critical inflection point in its service life, maintenance costs and downtime losses show a significant upward trend. Therefore, the lifecycle is divided into an initial stable phase, a mid-term enhanced maintenance phase, and a late high-risk phase. This segmentation method ensures relatively consistent cost distribution within each phase, thus providing a clear engineering basis for constructing phased prediction functions.
3.3. Model Training and Optimisation
Following the establishment of the multi-stage prediction model structure, the objectives of model training and optimisation are to enhance the accuracy and stability of cost predictions across all lifecycle stages.This paper divides the sample set according to lifecycle stages and trains the prediction functions for each stage independently. During training, samples are constructed using a rolling time window approach, where historical state features predict the next cycle's costs, thereby avoiding the introduction of future information. Model parameters are optimised to minimise prediction error, and cross-validation is employed to assess the model's predictive stability across different lifecycle stages, ensuring the multi-stage model possesses robust generalisation capabilities[7].
4. COST-DRIVEN CLV MODEL
4.1. Cost-CLV Mapping
Upon obtaining lifecycle cost predictions, these projected costs must be integrated into the CLV evaluation framework to translate forecast outcomes into decision metrics. Based on the original CLV definition in Section 2.3, substituting the actual cost with the predicted cost from the multi-stage model yields the predicted CLV expression, as shown in Equation (3):
where: denotes the forecasted lifetime cost for the period , with the remaining variables retaining the same meanings as in Equation (1).
4.2. Customer Value Stratification
Based on the calculated CLV under forecast conditions, a stratification analysis of customer value is conducted. Customers are categorised into three groups—high-value, potential, and low-value—using the forecast CLV level as a benchmark, combined with equipment service lifecycle and cost structure characteristics. This stratification underpins differentiated resource allocation and strategy selection within subsequent CLV decision models[8].
4.3. CLV Decision Model
Building upon the CLV mapping results under predictive conditions, this paper further constructs a decision model aimed at maximising customer lifetime value. By introducing adjustable management and service decision variables ( ), the process of cost control and value enhancement is integrated into a unified optimisation framework. The decision objective function is defined as shown in Equation (4):
In practical applications, the decision-making process must be constrained by cost budgets and resource conditions, which can be expressed as:
where: denotes the acceptable cost ceiling, and represents the feasible region of the decision variabl [9].
5. EXPERIMENTAL VALIDATION AND ANALYSIS
5.1. Experimental Design
The experimental data originates from empirical analysis of long-term operational data collected from 120 identical automated devices at a manufacturing enterprise, covering an 8-year service cycle. Following a time-sequential approach, the first 70% of the data was designated as the training set, while the remaining 30% served as the test set for training and evaluating the cost prediction model. Based on prediction validation, effective samples from 95 devices were selected to embed the predicted costs into the CLV decision-making model. This enabled a comparison of CLV changes before and after decision implementation. The experimental design validated the model's engineering applicability and decision effectiveness from two perspectives: prediction accuracy and value enhancement.
5.2. Predictive Performance Analysis
To evaluate the performance of the multi-stage lifecycle cost prediction model, MAE and RMSE were employed as evaluation metrics and analysed against the comparison model. Error reduction is measured relative to the single-stage prediction model in Table 2.
Table 2 demonstrates that the multi-stage forecasting model proposed in this paper significantly outperforms the comparison models in both MAE and RMSE metrics, indicating its superior ability to capture the non-uniform characteristics of cost variations across different life cycle stages. To further analyze how model prediction errors vary across lifecycle stages, Figure 3 presents a comparison of error variations for different prediction models. It can be observed that the multi-stage prediction model maintains a low error level even during stages with significant fluctuations in operation and maintenance costs, validating its prediction stability and engineering applicability under complex operating conditions[10].
To further analyze the applicability of multi-stage prediction models across different life cycle stages, Figure 4compares prediction errors from a life cycle stage perspective. The results indicate that compared to single-stage prediction models, multi-stage prediction models exhibit a more pronounced reduction in errors during the mid-to-late stages of the lifecycle. During this phase, equipment maintenance frequency and downtime uncertainty significantly increase, while cost volatility intensifies. Multi-stage modeling can fit the evolving cost characteristics within this stage, thereby enhancing prediction stability and engineering applicability.
5.3. CLV Effectiveness Evaluation
CLV improvement is calculated relative to the baseline decision without predicted cost integration.Building upon the validation of predictive performance, we further evaluate the value enhancement achieved by embedding forecasted costs into the CLV decision model. Based on the experimental sample, we compare CLV changes before and after decision implementation, with results presented in Table 3.
Table 3 demonstrates that after incorporating predictive costs and implementing CLV-based decision optimization, the average CLV of the sample equipment increased by approximately 18.9%. Concurrently, operational and maintenance-related costs were effectively controlled, indicating that introducing predictive costs into the decision-making process significantly enhances the overall lifecycle value of equipment. To visually demonstrate the CLV enhancement effect, Figure 5 compares CLV changes before and after decision-making. It further reveals that the overall CLV distribution has shifted toward higher-value intervals. These results validate the effectiveness and practical application value of the proposed cost prediction and CLV decision-making model in engineering practice[11].
Figure 6: Decomposition Analysis of CLV Improvement Sources from a Cost Structure Perspective. It can be seen that the growth in lifetime value primarily stems from effective control of maintenance and downtime-related costs, followed by continuous optimization of operational energy consumption costs. This indicates that embedding predicted lifetime costs into the decision-making process facilitates proactive intervention on highly volatile, high-risk cost items, thereby achieving systematic enhancement of equipment's full lifecycle value.
6. CONCLUSIONS
Addressing the disconnect between cost uncertainty and value assessment in the full lifecycle management of automated equipment, this paper constructs an analytical framework integrating phased cost forecasting with customer lifecycle value decision-making, based on the structural characteristics of lifecycle costs. By embedding forecasted lifecycle costs within the CLV evaluation and optimisation framework, the approach achieves effective translation of cost forecast outcomes into value-driven decisions. Empirical results demonstrate that this methodology not only enhances cost forecast accuracy but also significantly improves equipment lifecycle value levels.This research provides quantitative support for the transition from cost control to value management in automated equipment. Future studies may further extend the lifecycle stage classification and decision constraints by incorporating equipment type variations and evolving service models, thereby enhancing the model's applicability in complex engineering scenarios.
References
- Liu, J. Lifecycle Building Cost and Carbon Impact Analysis and Visualisation: Design Sampling and Predictive Modelling. Forum on Research and Innovation Management 2025, 3(12). [Google Scholar] [CrossRef]
- Özmen, A; Hui, S N. Predictive modelling for levelised cost of green ammonia. Applied Energy 2025, 398, 126399–126399. [Google Scholar] [CrossRef]
- Akter, J; Roy, A; Rahman, S; et al. Artificial Intelligence-Driven Customer Lifetime Value (CLV) Forecasting: Integrating RFM Analysis with Machine Learning for Strategic Customer Retention. Journal of Computer Science and Technology Studies 2025, 7(1), 249–257. [Google Scholar] [CrossRef]
- Ali, N; Shabn, S O. Customer lifetime value (CLV) insights for strategic marketing success and its impact on organisational financial performance. Cogent Business & Management 2024, 11(1). [Google Scholar] [CrossRef]
- Firmansyah, B E; Machado, R M; Moreira, R L J. How can Artificial Intelligence (AI) be used to manage Customer Lifetime Value (CLV)—A systematic literature review. International Journal of Information Management Data Insights 2024, 4(2), 100279. [Google Scholar] [CrossRef]
- Almahameed, A B; Bisharah, M. Applying Machine Learning and Particle Swarm Optimization for predictive modelling and cost optimisation in construction project management. Asian Journal of Civil Engineering 2024, 25(2), 1281–1294. [Google Scholar] [CrossRef]
- R., E A; Amarpreet, K; Nihar, K; et al. Impact of Financial and Nonfinancial Constructs on Customer Lifetime Value (CLV): U.S. Retailer’s Perspective. Journal of Relationship Marketing 2023, 22(3), 202–237. [Google Scholar]
- Hashem, T A; Claudio, P D; Fabrizio, L; et al. Machine learning for performance prediction in smart buildings: Photovoltaic self-consumption and life cycle cost optimisation. Applied Energy 2023, 334. [Google Scholar]
- Ahmed, M; Karim, E; Mohamed, B; et al. Implementation of a Life Cycle Cost Deep Learning Prediction Model Based on Building Structure Alternatives for Industrial Buildings. Buildings 2022, 12(5), 502–502. [Google Scholar] [CrossRef]
- Kessara, K; Jongsawas, C. Integrated customer lifetime value (CLV) and customer migration model to improve customer segmentation. Journal of Marketing Analytics 2022, 11(2), 172–185. [Google Scholar] [CrossRef]
- Sukwon, J; Bumho, L; Yong, M Y. Building life-span prediction for life cycle assessment and life cycle cost using machine learning: A big data approach. Building and Environment 2021, 205. [Google Scholar]
Figure 1.
Distribution of lifecycle cost components.
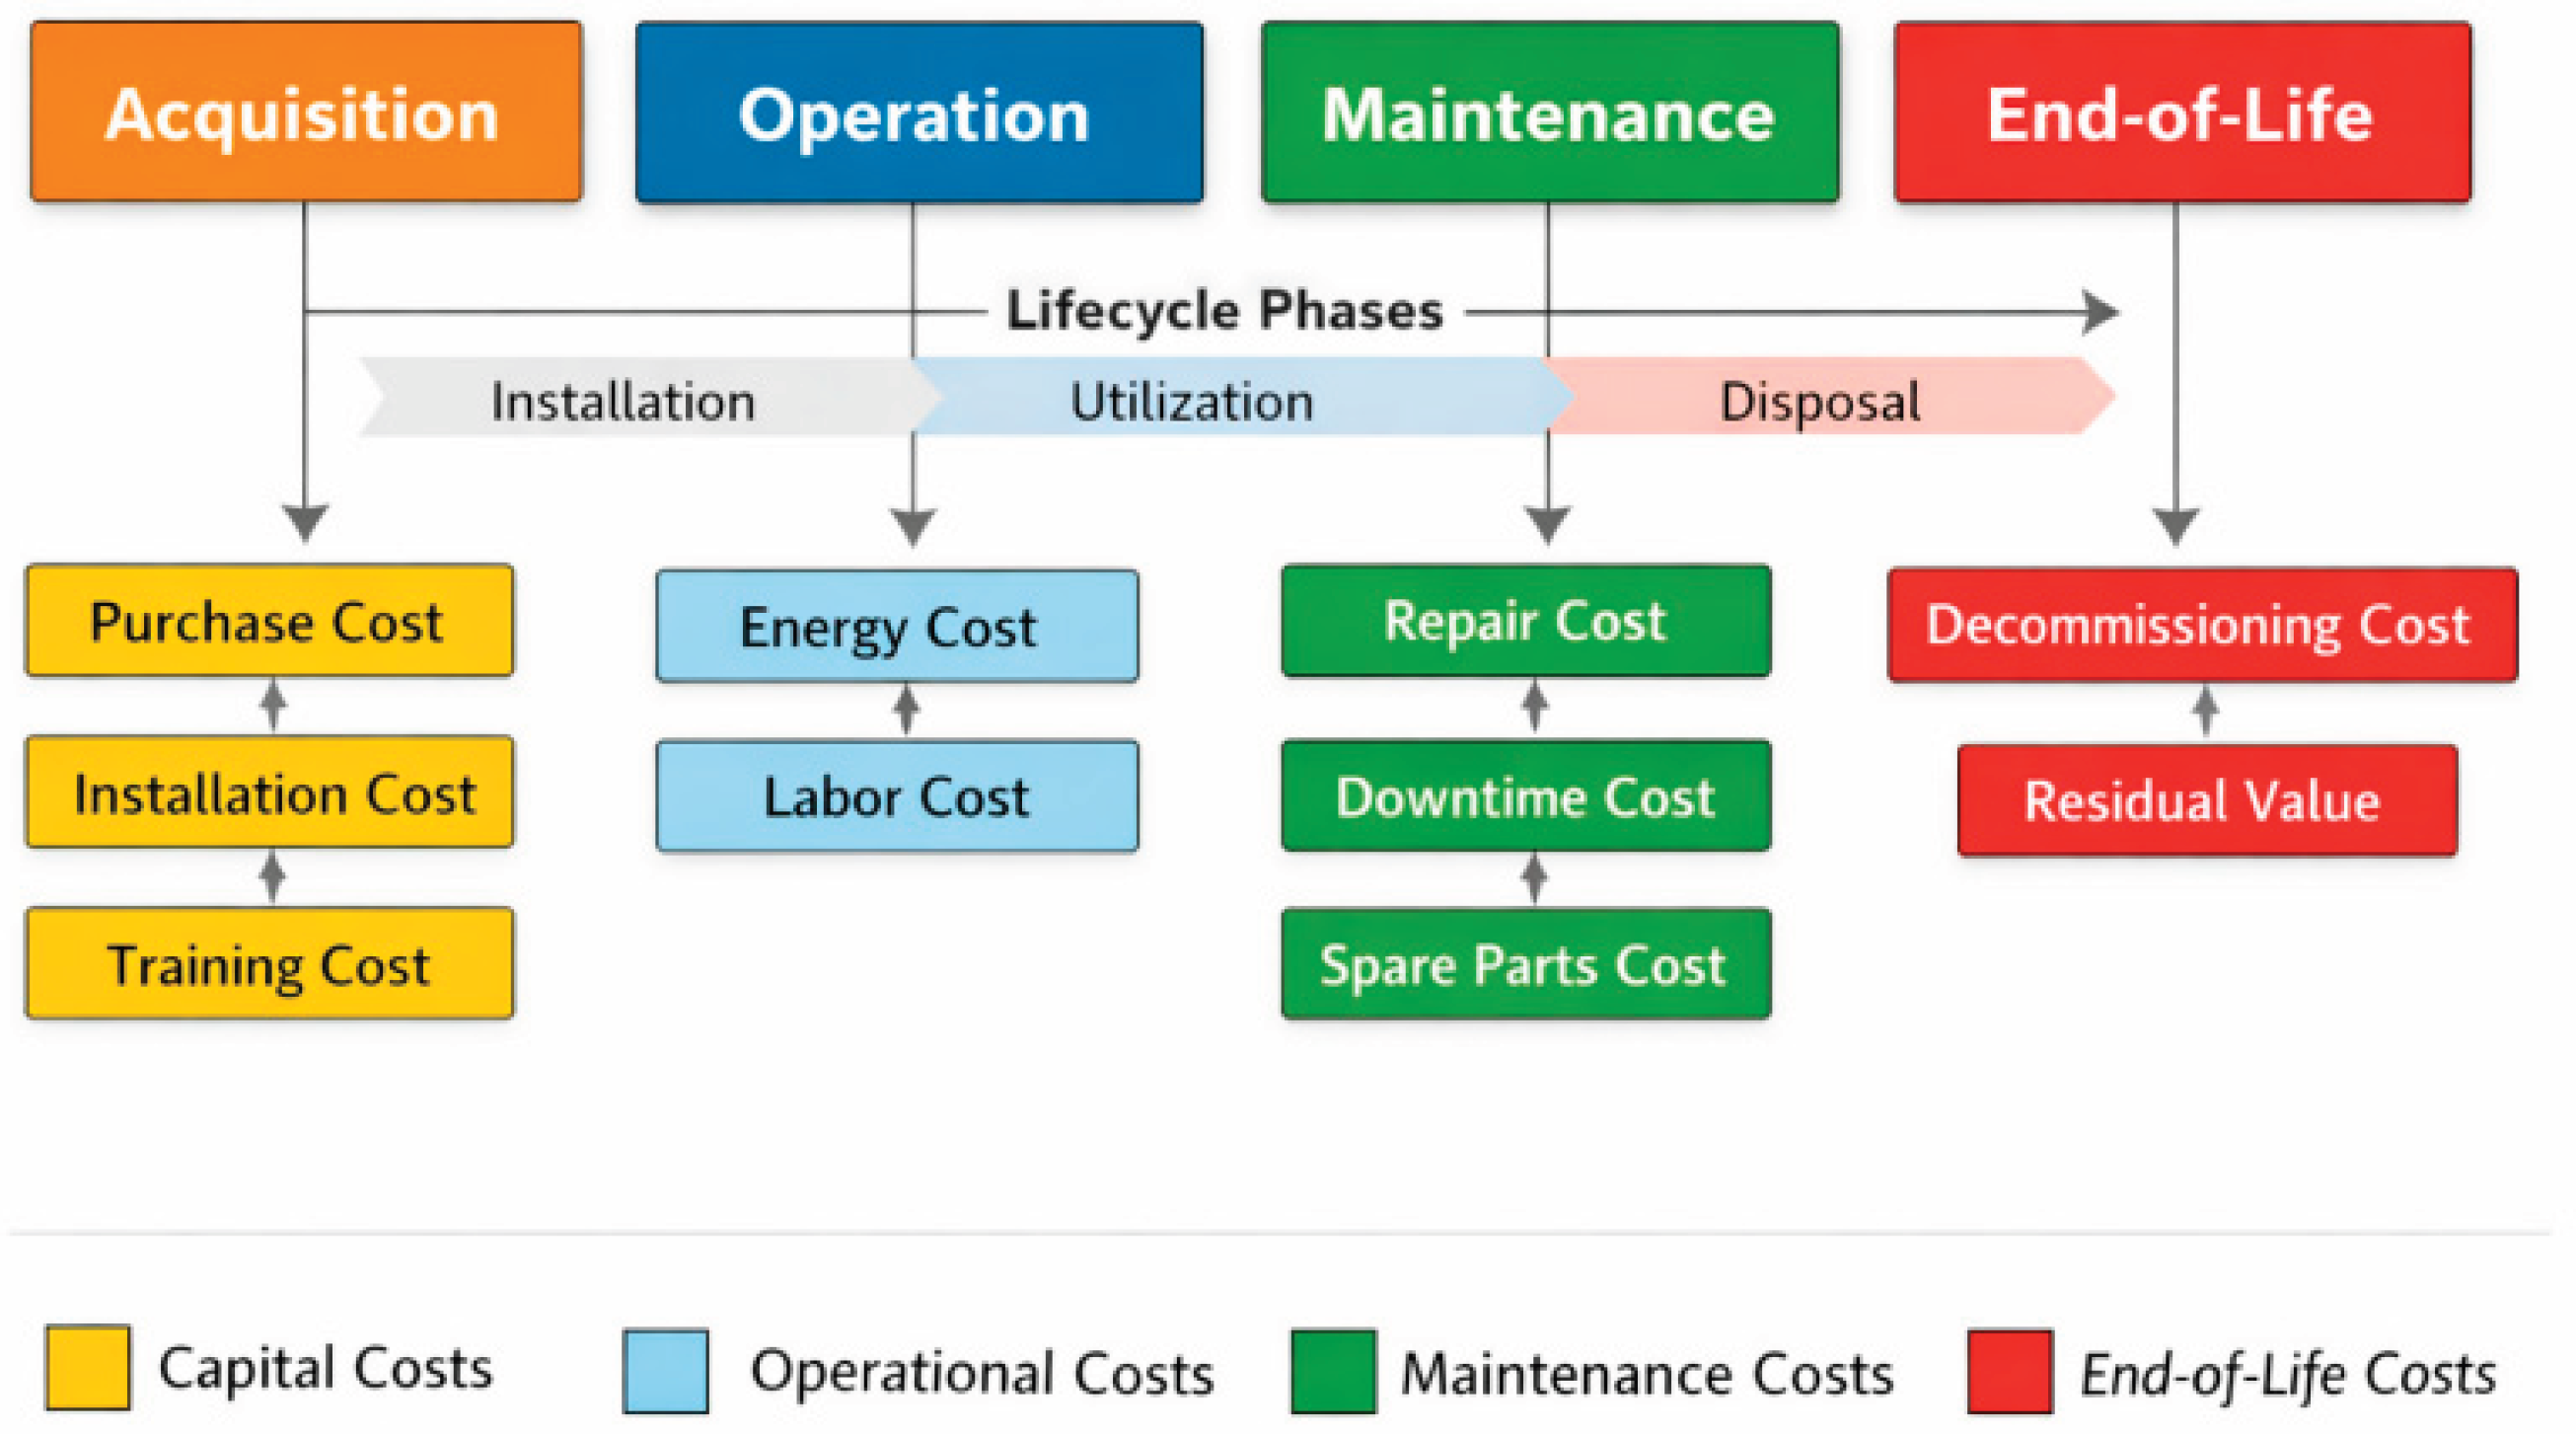
Figure 2.
Multi-stage lifecycle prediction architecture diagram.
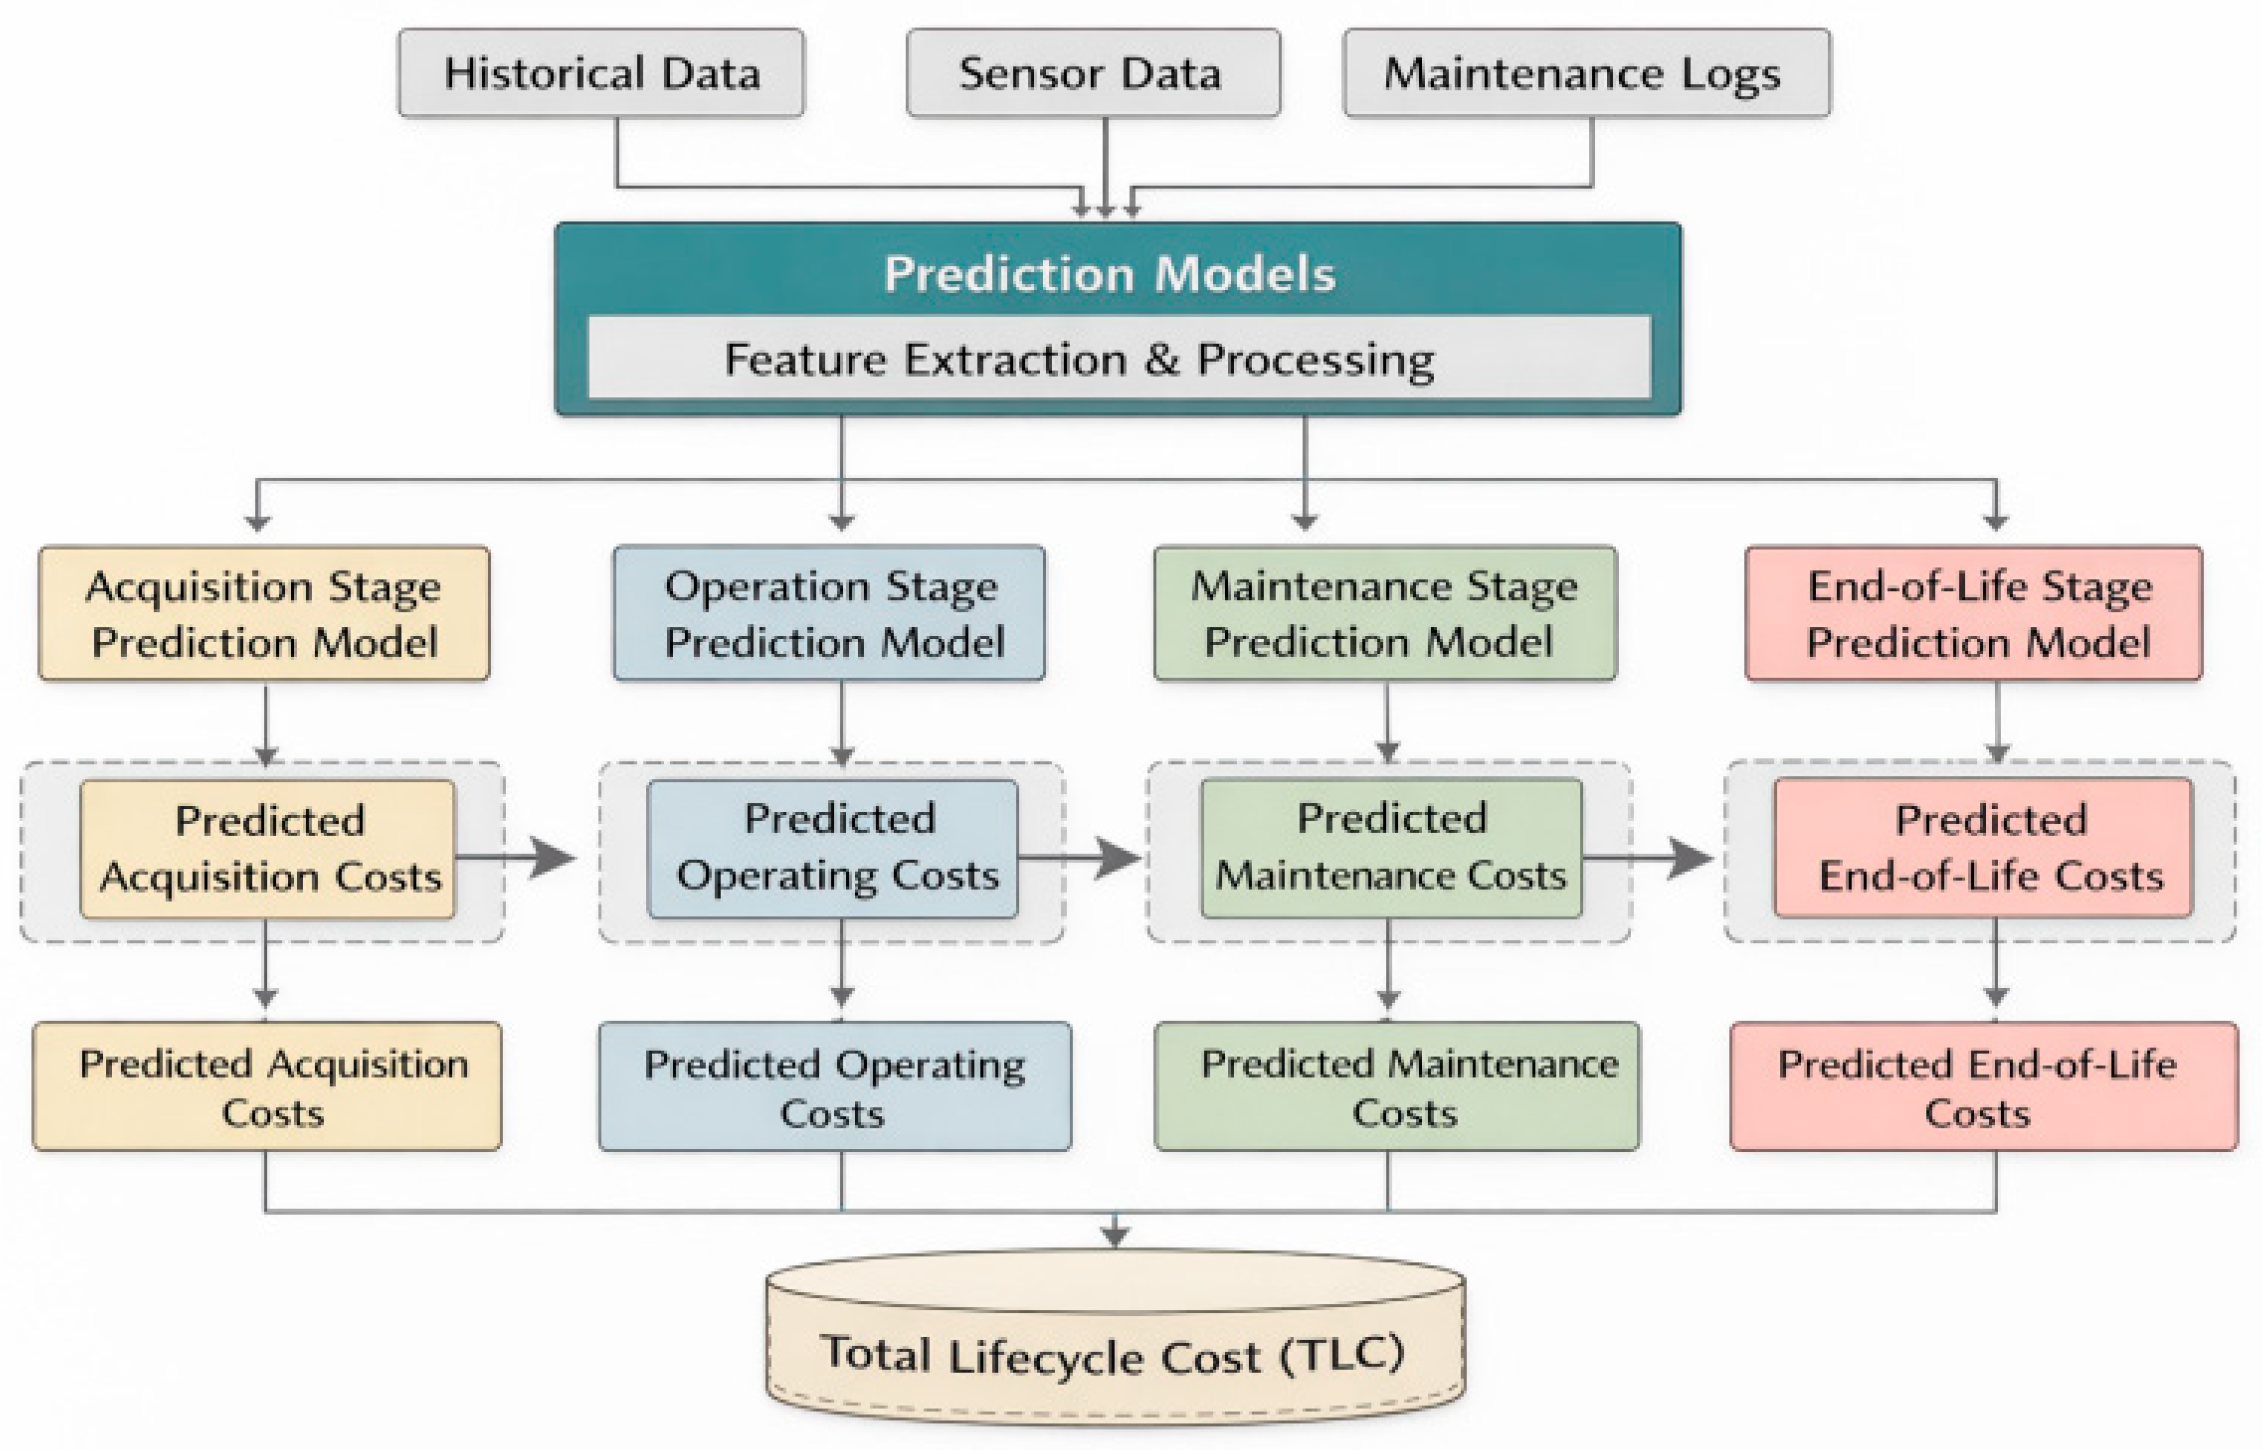
Figure 3.
Cost Prediction Model Error Comparison Chart.
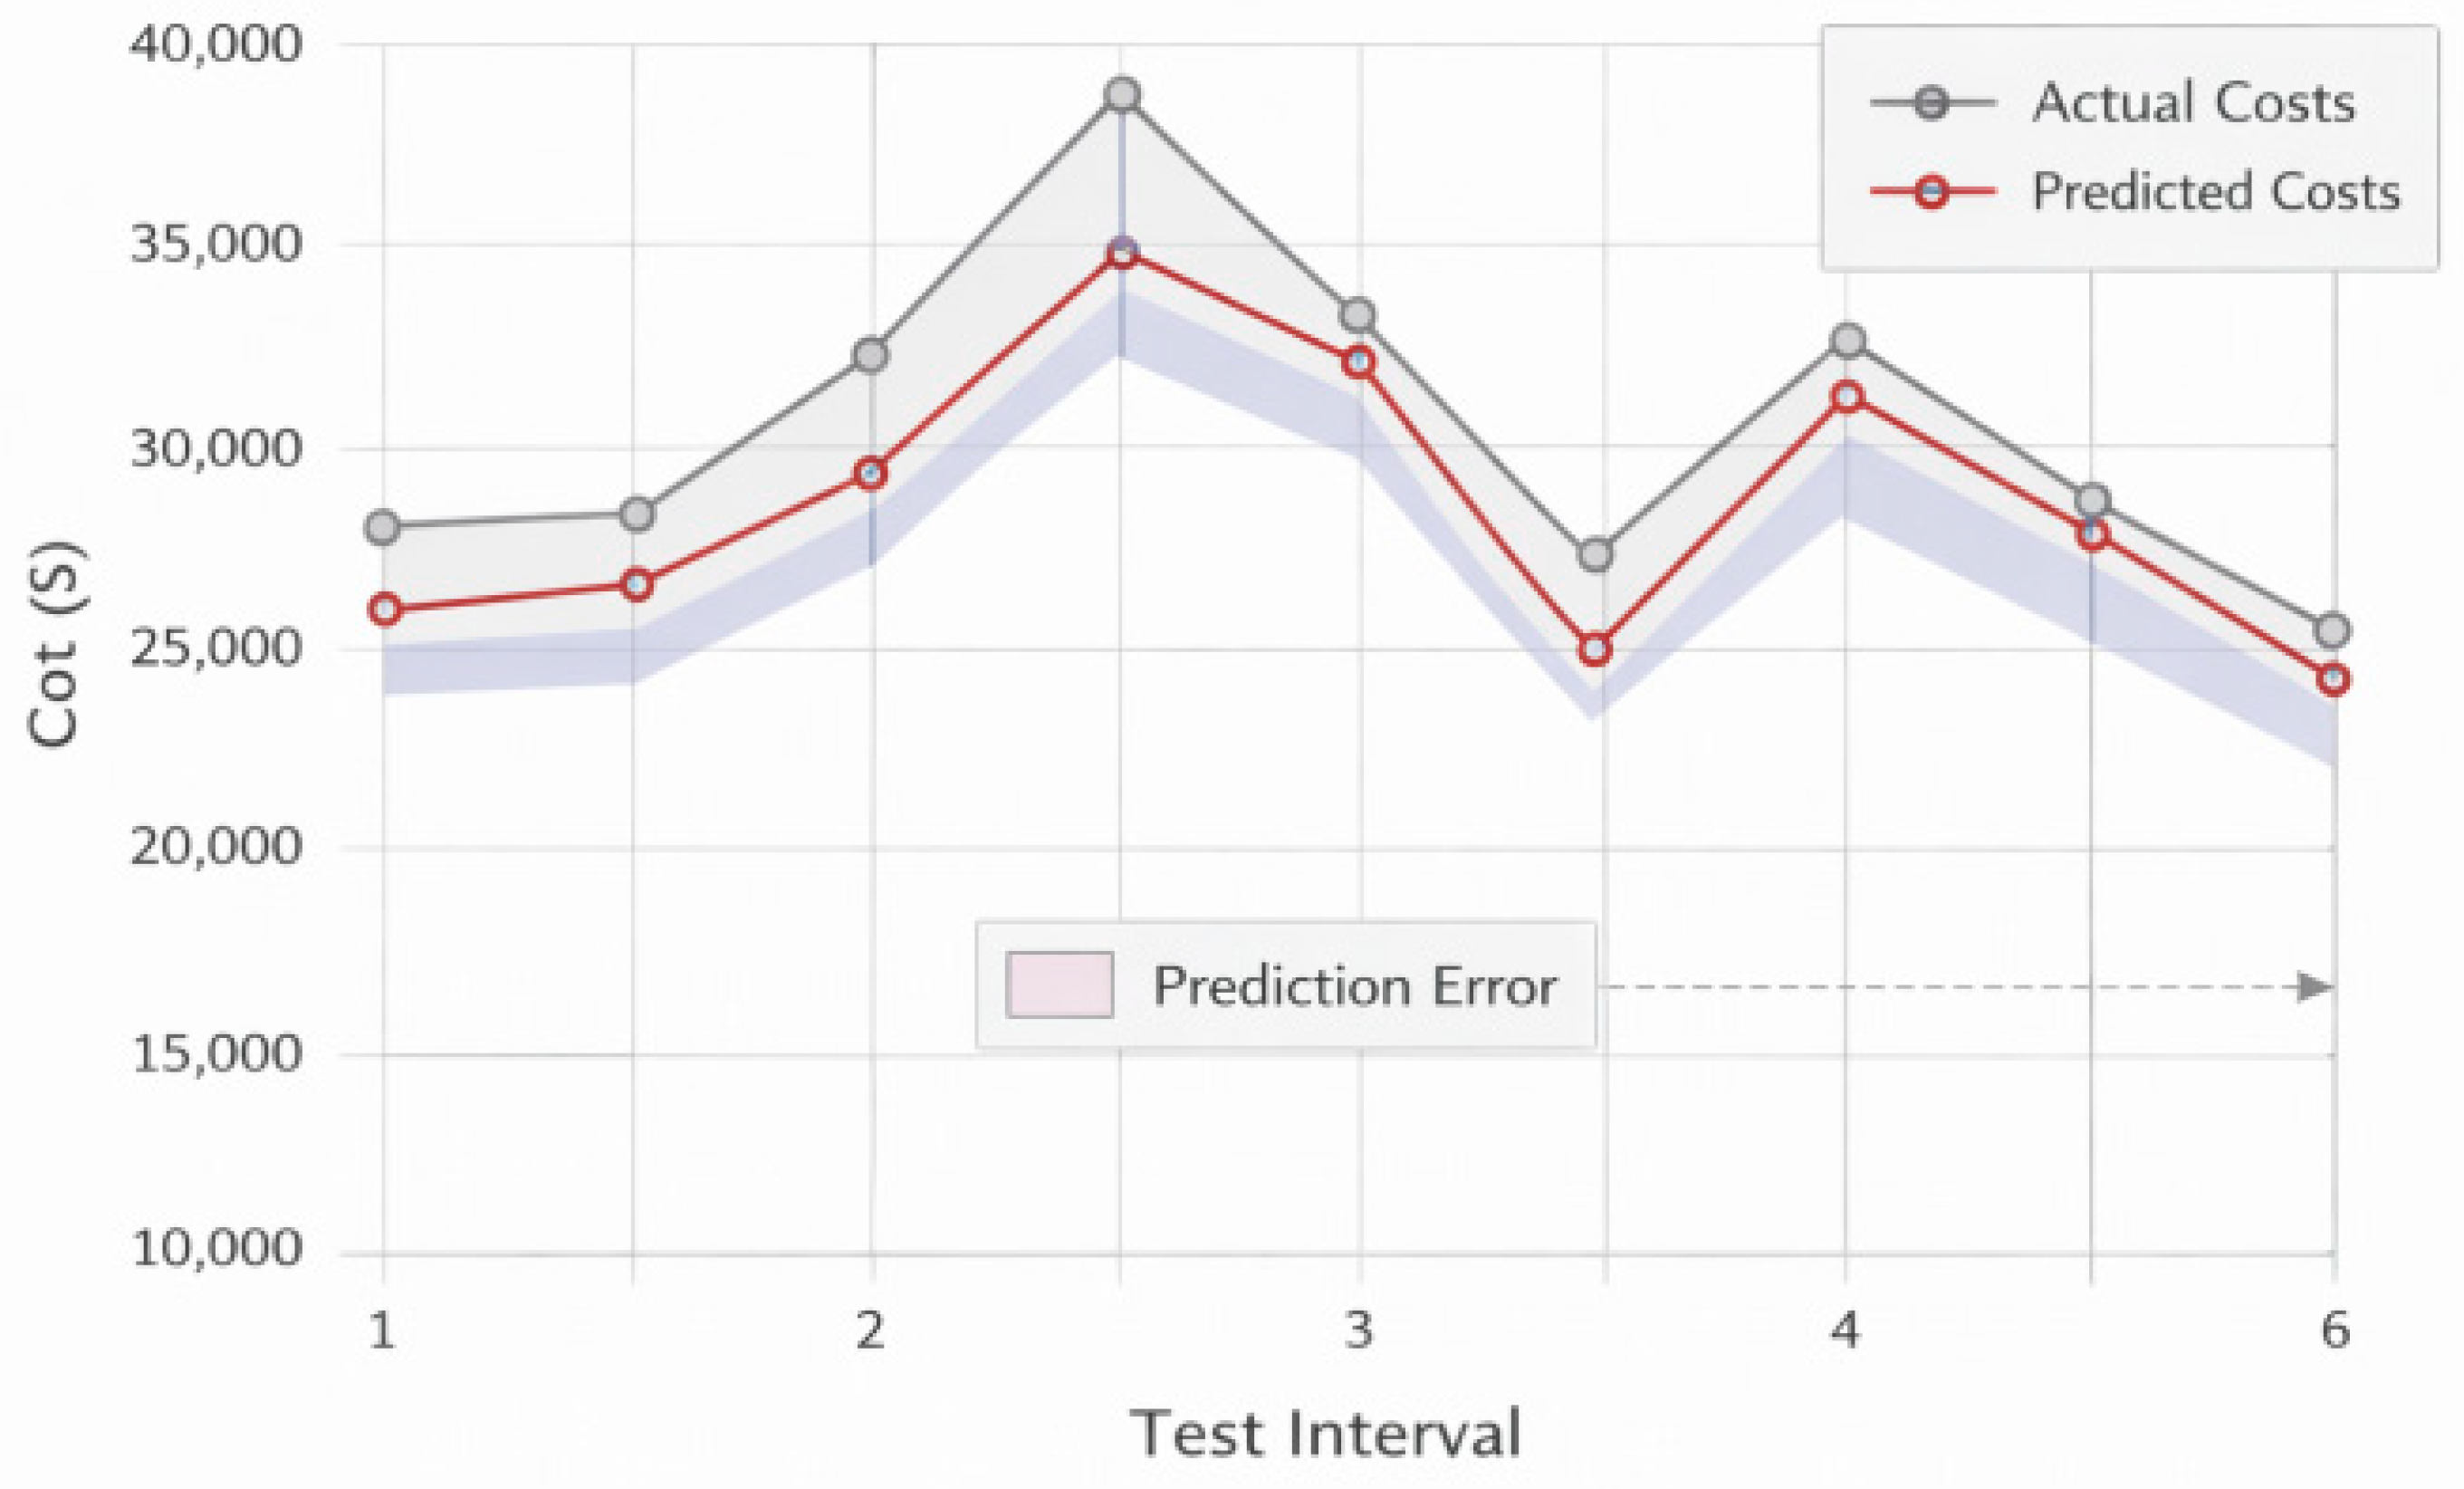
Figure 4.
Distribution of Cost Forecast Errors Across Life Cycle Stages.
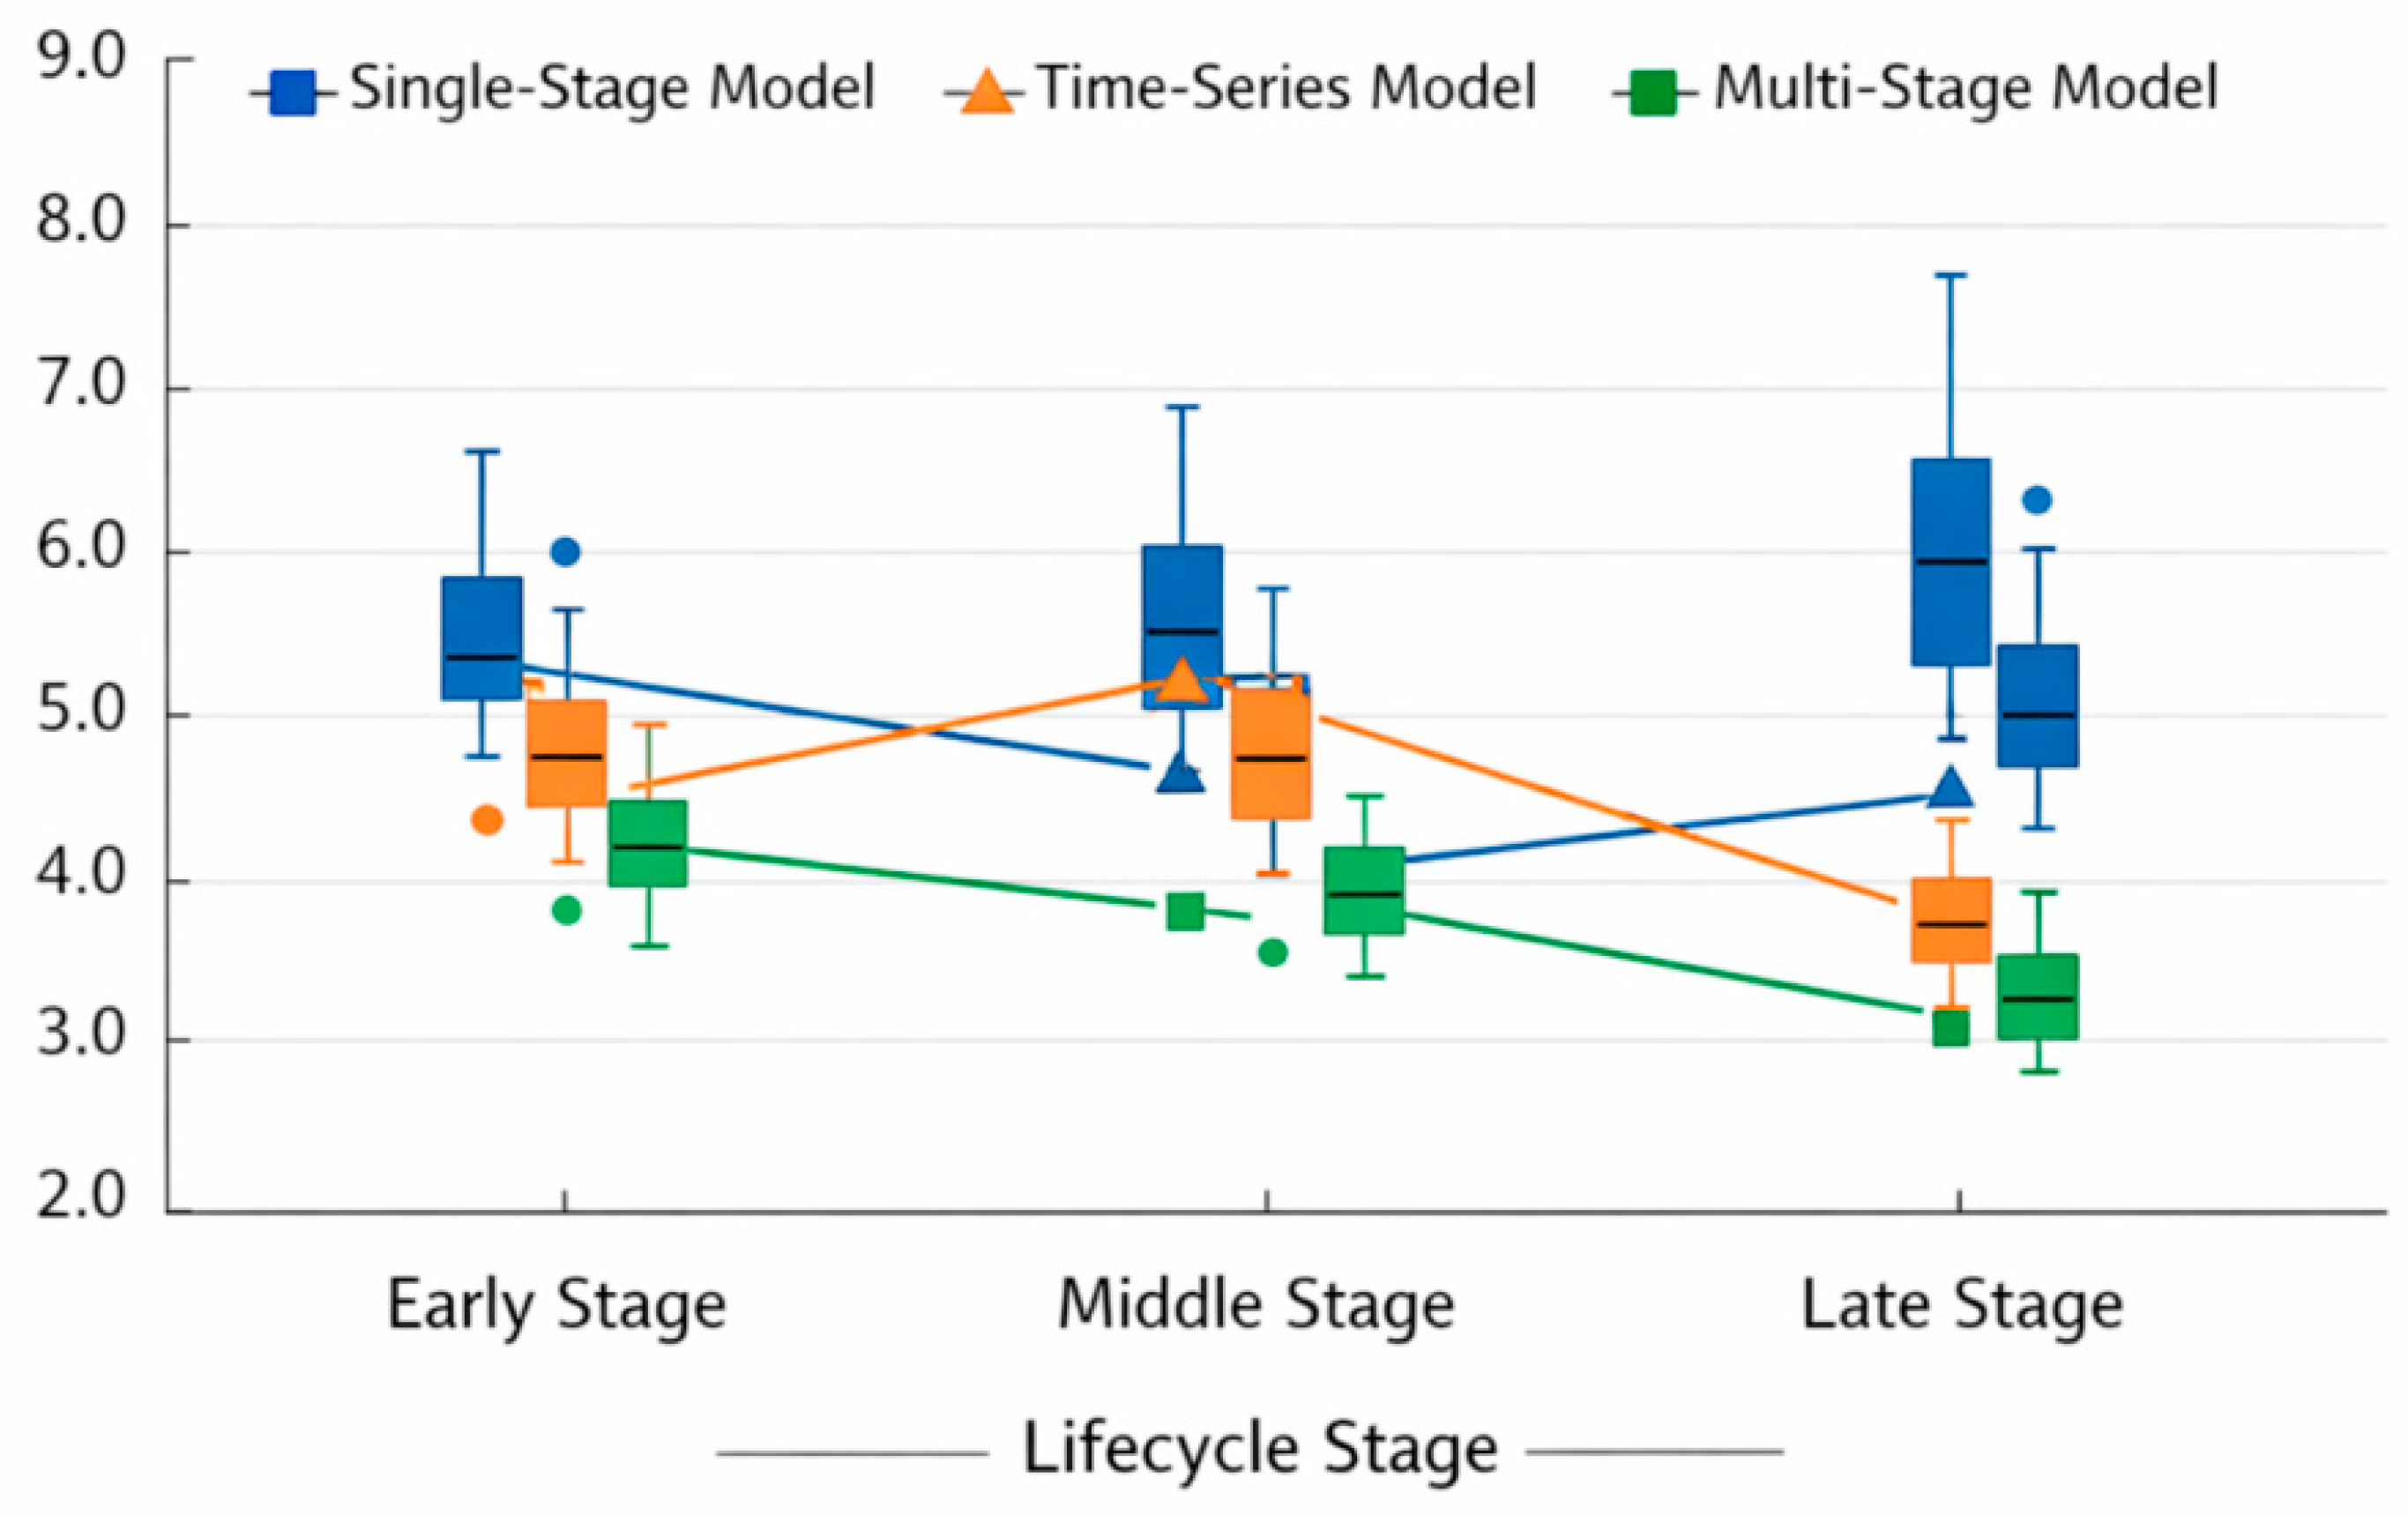
Figure 5.
Comparison of CLV Enhancement Effects.
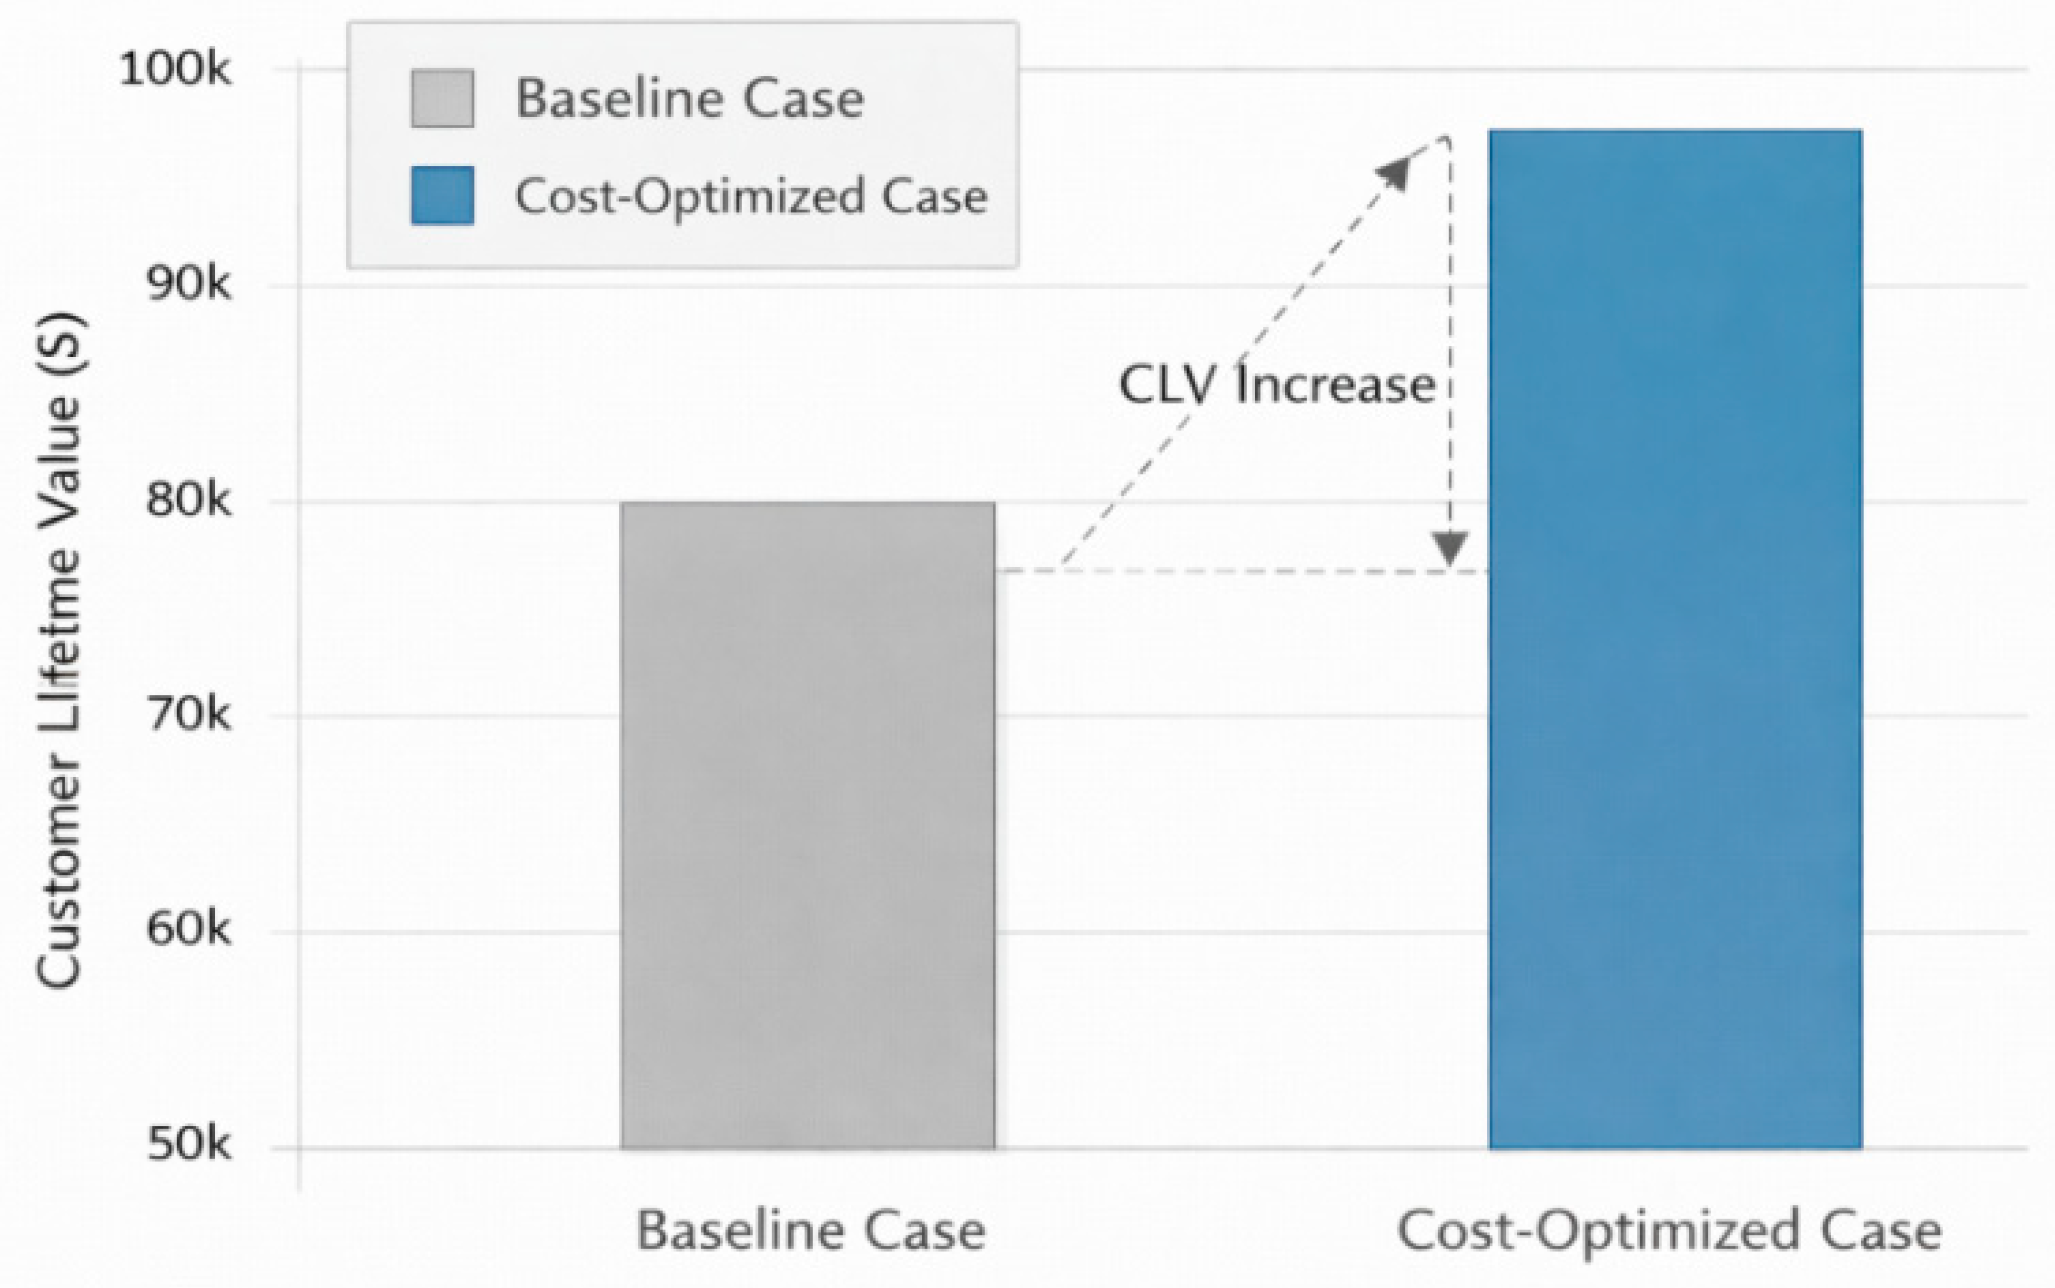
Figure 6.
CLV Improvement Contribution Decomposition Diagram.
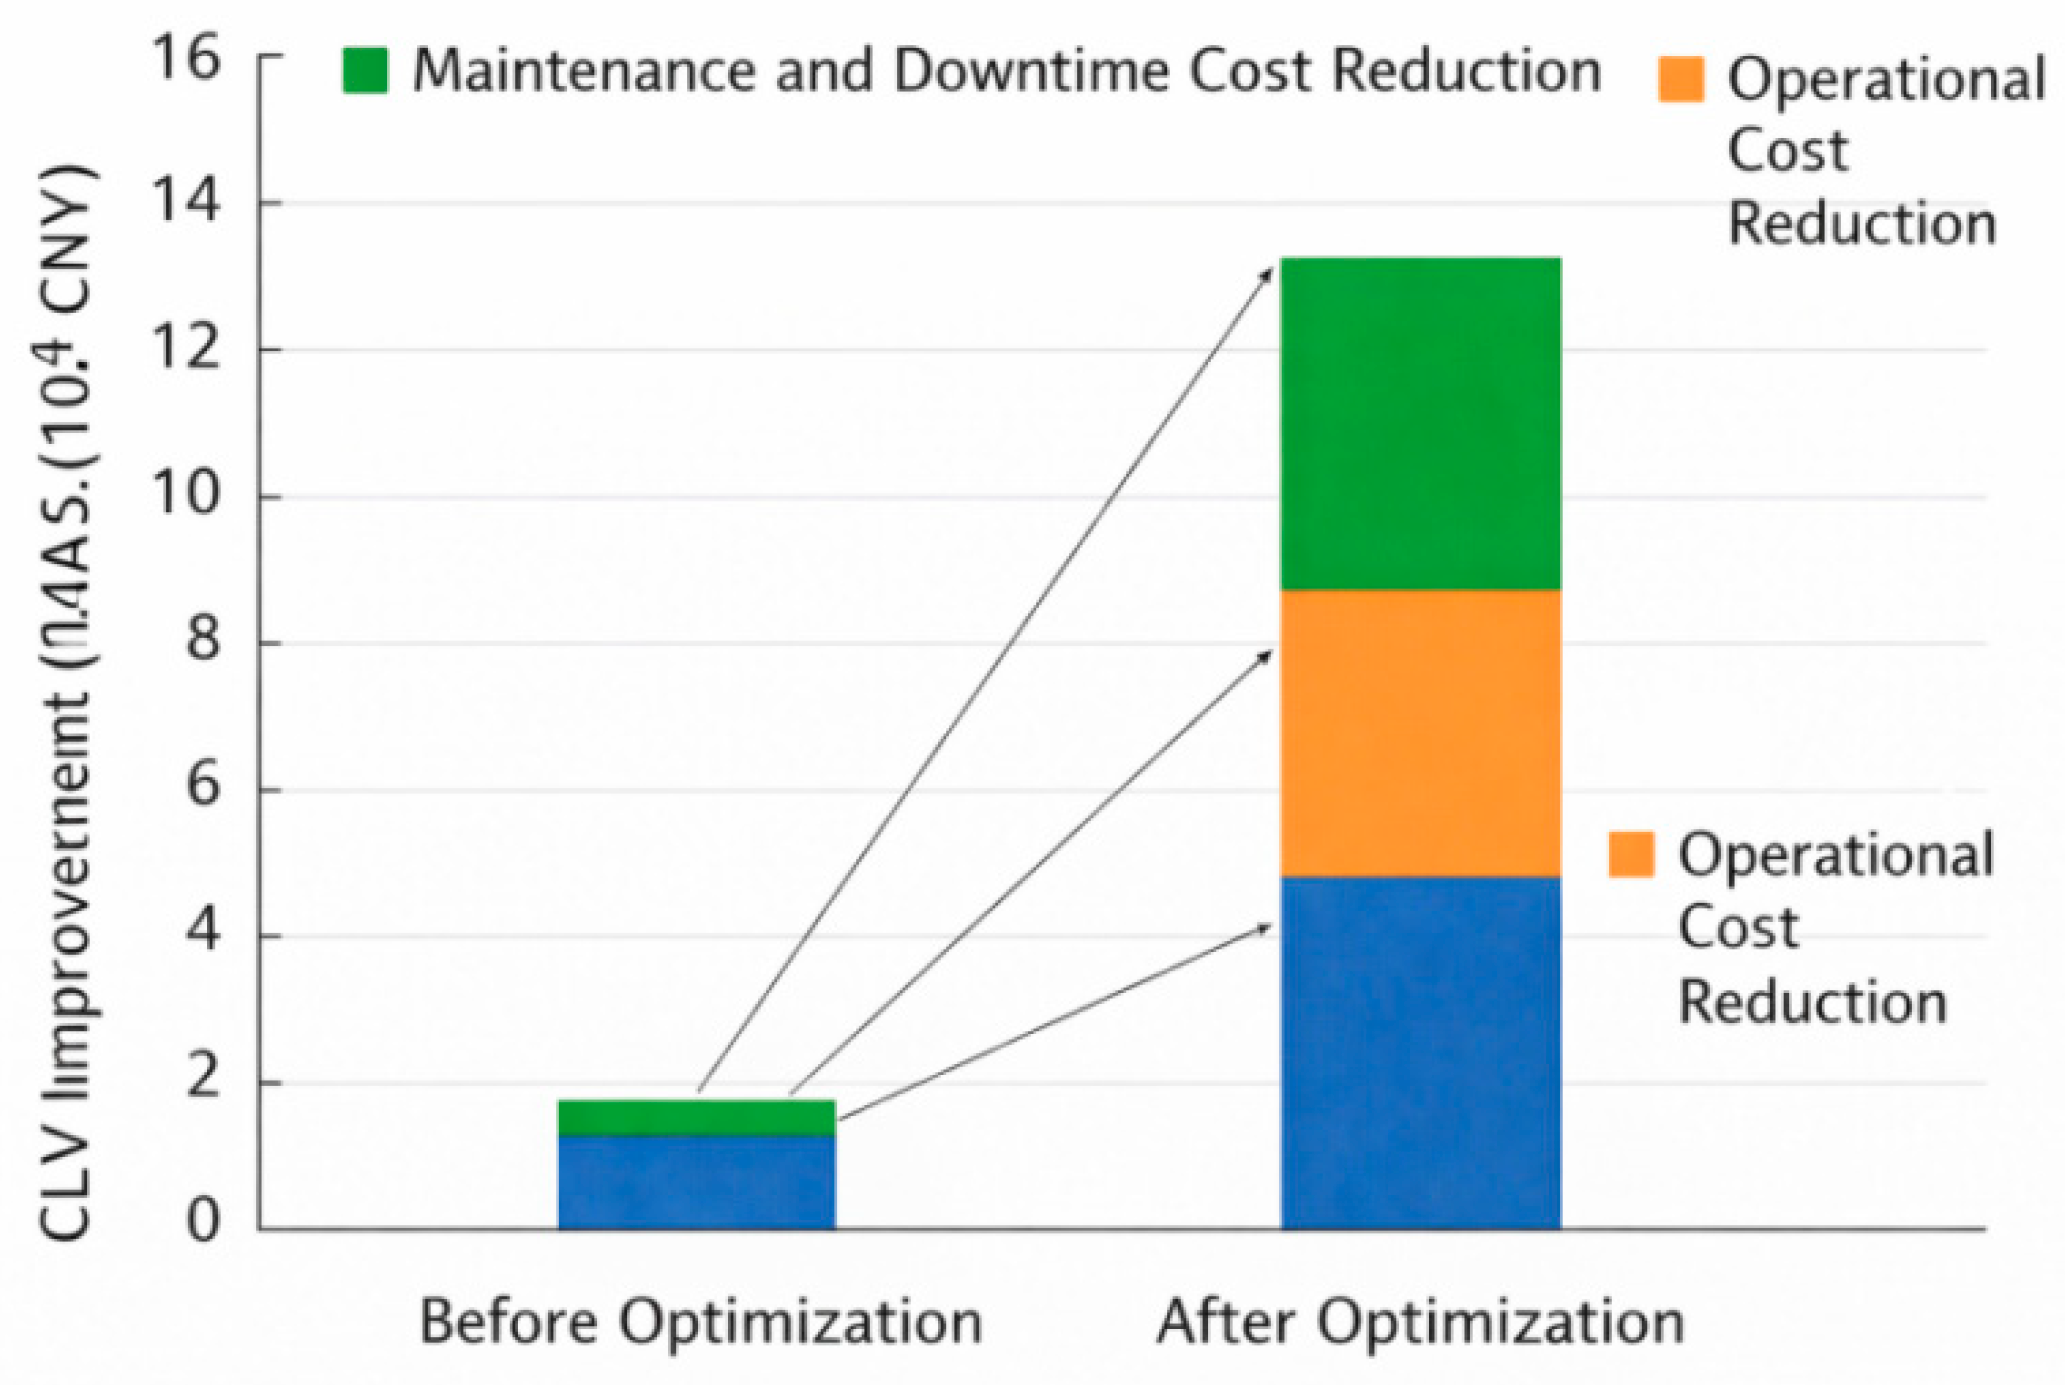

Table 1.
Cost Composition Data for Automation Equipment Lifecycle.
| Cost Category | Lifecycle Stage | Equivalent Annual Cost (10⁴ CNY) | Lifecycle Share (%) |
| Delivery and Installation Cost | Initial Deployment Stage | 18.5 | 12.3 |
| Operational Energy Cost | Stable Operation Stage | 22.8 | 15.2 |
| Maintenance and Repair Cost | Entire Lifecycle | 31.6 | 21.1 |
| Downtime Loss Cost | Fault and Abnormal Stage | 36.4 | 24.3 |
| Upgrade and Retrofit Cost | Mid-to-Late Lifecycle Stage | 40.7 | 27.1 |
| Total | — | 150.0 | 100.0 |
Table 2.
Cost Prediction Model Performance Comparison.
| Prediction Model | MAE (10⁴ CNY) | RMSE (10⁴ CNY) |
| Single-Stage Prediction Model | 5.42 | 7.18 |
| Time-Series Regression Model | 4.76 | 6.35 |
| Proposed Multi-Stage Prediction Model | 3.68 | 5.02 |
Table 3.
Comparison of CLV Enhancement Effects.
| Evaluation Item | Before Optimisation | After Optimisation | Improvement (%) |
| Average CLV (10⁴ CNY) | 86.4 | 102.7 | 18.9 |
| Operating Cost (10⁴ CNY) | 41.8 | 36.5 | −12.7 |
| Maintenance and Downtime Cost (10⁴ CNY) | 52.3 | 45.1 | −13.8 |
Disclaimer/Publisher’s Note: The statements, opinions and data contained in all publications are solely those of the individual author(s) and contributor(s) and not of MDPI and/or the editor(s). MDPI and/or the editor(s) disclaim responsibility for any injury to people or property resulting from any ideas, methods, instructions or products referred to in the content. |
© 2026 by the authors. Licensee MDPI, Basel, Switzerland. This article is an open access article distributed under the terms and conditions of the Creative Commons Attribution (CC BY) license (http://creativecommons.org/licenses/by/4.0/).
Copyright: This open access article is published under a Creative Commons CC BY 4.0 license, which permit the free download, distribution, and reuse, provided that the author and preprint are cited in any reuse.


