Submitted:
19 January 2026
Posted:
20 January 2026
You are already at the latest version
Abstract
Agricultural carbon emissions, a key part of terrestrial carbon emissions, affect global carbon accounting, with historical data scarcity adding to calculation difficulty. Exploring agricultural planting structure evolution can supplement historical data and improve ac-counting accuracy. Based on local chronicles and statistics, this study reconstructs Northeast China’s planting structure of six major crops during the 1950s–1980s via threshold classification and transfer matrix methods. Results show high-carbon crops (corn in particular) expanded notably, while low-carbon crops (especially sorghum) de-clined. Planting patterns varied regionally, with the most complex structural changes oc-curring in the 1960s–1970s. Agricultural carbon emissions fluctuated in phases; the planting scale effect dominated emission growth, the intensity effect inhibited it, and the structural effect played a heterogeneous auxiliary role. This study provides a historical basis for low-carbon agricultural planning and differentiated carbon reduction policies.
Keywords:
rop pattern
; planting structure types
; spatiotemporal changes
; agricultural low-carbon
1. Introduction
To attain the country's "dual carbon" goals, carbon emissions have emerged as a prominent research topic in the field of geography [1,2,3]. Agricultural carbon emissions constitute a crucial part of terrestrial carbon emissions [4]. Specifically, the adjustment of the agricultural planting structure represents a significant area of research focus [5]. Consequently, researching the evolution of agricultural planting structures is of great significance for estimating agricultural carbon emissions, guiding agricultural emission-reduction efforts, and formulating reasonable arrangements [6]. The Northeast region, serving as a vital national grain production base [7,8], has witnessed a complex and long-standing evolutionary history in its planting structure [9]. It is not merely a key area for studying agricultural planting structures; rather, it is also of great importance for safeguarding national food security by clarifying its evolutionary process [10].
In recent years, research on agricultural carbon emissions has achieved a series of results. Zhang N. et al[11]. found that national agricultural carbon emissions showed an overall fluctuating upward trend from 2011 to 2022, with the total emissions in the eastern and central regions accounting for nearly 60%. Based on China's provincial panel data from 2012 to 2022, Jiang Y. Y. et al[12]. revealed that the planting structure has obvious heterogeneity in carbon emissions of different degrees. Zhang Y. et al[13]. argued that the increase in the proportion of grain crop planting area has a significant promoting effect on agricultural carbon emissions. In terms of driving effect research, based on China's provincial panel data from 2000 to 2019, Yang C. et al[14]. found that the implementation of policies in major grain-producing areas can effectively reduce the total agricultural carbon emissions, and the increase in the proportion of grain planting is one of the effective mechanisms for policy-based carbon reduction in major grain-producing areas. However, the impact of agricultural technological progress on agricultural carbon emissions is somewhat random[15,16], mainly because it includes both technologies aimed at improving agricultural labor productivity and green technologies aimed at reducing environmental pollution. Dai X. W. et al[17]. pointed out that the planting industry production efficiency and the scale of agricultural labor force show a negative growth effect, while the agricultural production structure, agricultural development level and urbanization rate show a positive effect of growth or fluctuating growth.
In terms of research on planting structure, Geeta et al. [18] proposed that studying crop combinations can lay the foundation for the regionalization of Indian agriculture. Zivaljevic B. et al. [19] utilized a machine-learning classification model based on the random forest algorithm and Sentinel-2 images to provide a crop spatial map for the Vojvodina region (Serbia), revealing the crop transition frequencies and spatial distribution patterns in this region. Smith B. W. et al. [20] sampled 1253 fields in central California, USA, and manually identified the crop types in each inspected year using high-resolution images and Landsat Normalized Difference Vegetation Index (NDVI) time-series. They clarified the crop type classification, trends, and patterns from 2005 to 2020, which can assist in agricultural resource planning or disaster reduction.
The agricultural planting structure in Northeast China is also a research hotspot. From a temporal perspective, the majority of existing results focus on the period following the reform and opening up policy, specifically from the 1980s to the present. Li et al. [21] introduced a high precision automatic labeling approach to accomplish the automatic labeling of crop categories, which was applied to map corn crops in Northeast China from 2019 to 2022. Xiao et al. [22] utilized multi - source data and a variety of digital agriculture technologies to map the annual spatiotemporal distribution of effective precipitation, crop water demand, irrigation water demand, and water supply-demand conditions in the Northeast region from 2000 to 2020. Through this, they analyzed the impacts of crop types and climate change on agricultural water dynamics, uncovering the causes of its spatiotemporal heterogeneity and associated policy implications. Notwithstanding, research on the continuous evolution of the planting structure from the founding of the People's Republic of China until the early stages of reform and opening up remains relatively scarce. Yang et al. [23] carried out a period-based analysis of the planting structure from the late Qing Dynasty to the 1980s. Their study indicated that the collectivization movement in the 1950s led to a substantial decline in the proportion of traditional crops such as sorghum and millet. In contrast, the proportion of corn planting soared from 11.9% in 1952 to 36.2% in 1980.
Spatially, most studies have centered on Northeast China as a whole or on provincial - level administrative units. Chen et al. [24] investigated the temporal and spatial pattern changes in grain production in the western part of Northeast China. They found that since 2003, the planting areas of corn and rice have increased, while the proportion of the soybean planting area has significantly decreased. Li et al. [25], relying on panel data of corn from 2001 to 2016 in the prefecture-level cities of the three northeastern provinces, discovered that promoting adjustments in the corn planting structure could enhance the overall grain total factor productivity. There has been comparatively less research at the county level. Guo et al. [26], through integrating county-level data archived in the Dalian Archives, identified significant changes in the crop planting structure in Northeast China from the 1920s to the 1940s. Overall, from a century-long perspective, current research predominantly focuses on county-level agricultural practices after the 1980s, especially after 2000, while historical county-level data remains scarce.
Consequently, on a centennial timescale, existing studies have mainly focused on county-level agricultural research after the 1980s, especially after 2000. In contrast, county-level data from historical periods remain extremely scarce, and the quantitative relationship between the evolution of crop-planting structure and changes in regional agricultural carbon emission intensity in Northeast China from 1950 to 1980 is still unclear. To address this issue, this study systematically analyzes the spatiotemporal evolution characteristics of the crop-planting structure in Northeast China during this period and examines the impact of crop planting on carbon emissions in different decades. This not only fills the gap in fine-grained, long-term time-series data for modern agricultural geography research in Northeast China and provides a typical regional case for agricultural historical geography, but also improves the accuracy and scientificity of carbon emission estimation. Furthermore, it offers an important historical reference and scientific basis for formulating contemporary regional agricultural low-carbon development policies.
2. Materials and Methods
2.1. Data Source
This article delineates the Northeast region to encompass Heilongjiang, Jilin, and Liaoning provinces, along with four areas within the Inner Mongolia Autonomous Region: Tongliao City, Hulunbuir City, Chifeng City, and Xing'an League.(Figure 1.)
The data primarily consists of statistical yearbooks and local literature from each region. The statistical yearbook data is sourced from the "Northeast Region Crop Sowing Area Dataset (1840 - 1949)" provided by the National Earth System Science Data Center (hereafter referred to as the dataset; available at https://www.geodata.cn/), and from the statistical publication "Inner Mongolia: A Splendid 70 Years", issued by the Inner Mongolia Statistics Bureau. The local literature mainly originates from a set of national local chronicles revised in the 1990s. A total of 304 local chronicles were collected from the three northeastern provinces. Specifically, there are 56 from Jilin Province, 137 from Liaoning Province, 108 from Heilongjiang Province, and an additional 3 volumes of The Comprehensive Agriculture Book of China, which document provincial-level data for the northeastern provinces. These books and local chronicles are primarily sourced from the Changchun Library and the Information Center of the Chinese Academy of Sciences. The data for Heilongjiang Province in the 'dataset' is relatively comprehensive. For Jilin and Liaoning provinces, their data in the dataset are supplemented with information from local chronicles. However, county-level data in Inner Mongolia is severely scarce. Given the vast expanse of Inner Mongolia and the substantial variations in its natural geographical conditions, the calculation errors for provincial - level data are substantial. Consequently, city-level data from Hulunbuir is utilized to disaggregate county-level data for the research. This approach aims to reconstruct the spatial distribution of agricultural planting structures in various counties of the Northeast during the 1950s, 1960s, 1970s, and 1980s.
Given the lack of systematic data support for county-scale research during the period 1950–1980, local chronicles have become the core data source for this study to reconstruct the planting structure of Northeast China in this period. Although the records are not completely accurate and consistent across provinces and do have certain biases due to incomplete documentation, local chronicles remain the most feasible choice for conducting county-scale agricultural research in this period in the absence of other data sources. In terms of reliability, the agricultural-related data in the local chronicles of Northeast China are mostly derived from the original ledgers archived by county-level bureaus of agriculture and statistics, which are primarily first-hand materials. Moreover, as an important national grain production base, the region had relatively standardized grassroots agricultural statistical work during this period, with strong continuity and completeness in data recording, which laid a core foundation for the reliability of the data in local chronicles.

Table 1.
Data source statistics.
| Source Category | Quantity |
| Local Chronicles | 289 |
| Compiled Materials | 11 |
| Books and Monographs | 4 |
* Detailed information: Appendix A.1.
2.2. Data Processing
Based on the comprehensive compilation of recorded information, the sown areas of corn, soybeans, rice, wheat, sorghum, and millet are each recorded as a distinct category. However, the recording of the overall crop sown area is inconsistent. For instance, Dongliao County in Jilin Province only documented the area for grain-beans, without specifying the total crop sown area. According to The Comprehensive Agriculture Encyclopedia of China, in Heilongjiang Province, the sown area of grain-beans accounts for over 90% of the total sown area. In Liaoning Province, food crops constitute the largest proportion within the agricultural sector. From the data recorded in Jilin Province, it can be deduced that the sown area of food crops accounts for more than 95% of the total sown area. Evidently, from the founding of the People's Republic of China to the early stage of reform and opening up, the proportion of cash-crop sown areas in Northeast China was relatively small, and food crops were the dominant type of sown area in this region. Consequently, when calculating the proportion of different crop sown areas, choosing either the sown area of grain - beans or the total crop sown area will not alter the main crop- planting structure in the area. Therefore, this article employs the percentage of six major crops, including corn and soybeans, in the crop sown area or the grain-beans crop sown area as a key indicator to reflect the spatiotemporal changes in the crop planting structure.
Due to the disparity in data sources, unit conversions are necessary when recording data. All area data are converted to hectares. In cases of missing data, production and yield data from various regions are used for conversion, as is the case with the grain-beans area data from Yanji City in Jilin Province. Moreover, considering the adjustments in agricultural policies and the stages of agricultural development in Northeast China, data from years with consistent policies and external environments are utilized. For example, the 1952 data for Lvshunkou District in Dalian City is used. The overall data processing flow is shown in Figure 2.
2.3. Analysis Method
2.3.1. Classification Methods
This study is grounded in the crop classification approach put forward by Liu et al. [27]. This crop classification method is characterized by unified quantitative thresholds, full coverage of county-level units, simplified focus on dominant crop combinations, and strong adaptability to county-scale research. At the county-level, the proportion of the sown areas of six major crops in Northeast China was classified. By computing the sown area ratio (Rs) of the main crop in relation to either the total crop sown area or the sown area of grain and leguminous crops, the evolutionary traits of the planting structure were reconstructed. The detailed classification rules are as follows: (1) Single crop and composite types based on threshold. When the Rs of an individual crop is ≥ 30%, it is categorized as single crop type. In cases where two or more crops exceed this 30% threshold concurrently, the top two or three crops, ranked from highest to lowest Rs values, are chosen to form a composite type. For example, in Huadian City in 1950, if only one crop had an Rs exceeding 30%, it was designated as single corn dominant type (assuming corn was the crop in question). When two to three crops simultaneously crossed the 30% mark, combinations like soybean - sorghum or corn - wheat - millet were established. The 30% threshold is set to quantitatively define the dominant characteristics of county-level cropping structures. When the sown area proportion of a single crop reaches or exceeds 30%, its production layout, resource consumption patterns, and agricultural carbon emission characteristics will dominate the overall attributes of the regional agricultural system. Such a crop can thus be identified as a "dominant crop" at the county level, which avoids the subjectivity inherent in qualitative classification. (2) Crop combination types for counties with low Rs values. In counties where the Rs of all crops fails to reach 30%, the top three crops are selected to form a crop combination type. Consider Keshan County in 1950, where corn (13.5%), soybean (24.7%), and wheat (18.2%) were the top ranked crops, resulting in its classification as corn-soybean-wheat type. However, if the Rs of the third-ranked crop is less than 10%, only the top two crops are retained. It aims to simplify the crop combination types in counties with low dominance while retaining core information, avoiding an overly complex classification system. When the proportion of the third-ranked crop is less than 10%, its contribution to the county's agricultural production layout, resource allocation, and carbon emission characteristics is extremely low, and it is difficult to exert a substantive impact on the overall characteristics of the cropping structure. This allows the research to focus more on the "characteristics of dominant crop combinations". (3) Simplification of combinations with the same dominant crop. Given that the study's focus is on characterizing crop combination features, types that have the same dominant crop but different arrangements are treated as unified type, without differentiating based on internal sorting. For example, the soybean-sorghum-corn type and the sorghum-soybean-corn type are considered identical.
2.3.2. Administrative Division Processing.
Between 1950 and 1980, substantial changes occurred in the administrative divisions of Northeast China. For example, in 1954, Liaodong and Liaoxi provinces were abolished and merged to form Liaoning Province. Songjiang Province was dissolved and incorporated into Heilongjiang Province. Guisui was renamed Hohhot. In 1955, Rehe Province was abolished, and its territory was divided among Hebei, Liaoning, and the Inner Mongolia Autonomous Region. In 1969, the Hulunbuir League of the Inner Mongolia Autonomous Region (excluding Tuquan County and Horqin Right Front Banner) was transferred to Heilongjiang Province. The territories of the Zhelimu League of Inner Mongolia and the parts of the Hulunbuir League including Tuquan County and Horqin Right Front Banner were transferred to Jilin Province. The Zhaowuda League of Inner Mongolia was transferred to Liaoning Province. In 1979, the regions that had been transferred in 1969 were once again placed under the jurisdiction of the Inner Mongolia Autonomous Region. In 2014, the county - level city of Jiutai was abolished, and the Jiutai District of Changchun City was established. On June 19, 2020, Gongzhuling City was officially transferred from the jurisdiction of Siping City to that of Changchun City.(Appendix A.2.)
In light of the above circumstances, the data for different years were processed as follows: (1) For regions with relatively straightforward administrative changes, direct matching with modern administrative boundaries is feasible. For example, the data for Helong County can be directly correlated with that of Helong City, and the data for Longjing County is equivalent to that of Longjing City. (2) In cases of areas with substantial administrative changes, the modern map is taken as the benchmark, and the historical map is aligned with it. For instance, the data for the Jiutai District of Changchun City and Gongzhuling City is derived from that of Jiutai City and Siping's Gongzhuling City. Meanwhile, the data for Siping City is adjusted by subtracting the data for Gongzhuling City. The data for the Daowai District of Harbin City, which was formed in 1956 through the merger of the East and West Fujia Districts [33], is obtained by summing the data of the East and West Fujia Districts as of 1950. (3) In certain urban districts, there is a significant lack of sown area data, and often only city-level data is accessible. To address this, the city area data is used for downward distribution to each district within the city. For example, the data for the Changchun urban area is utilized to substitute the data for the Nanguan District, Kuancheng District, Chaoyang District, Erdao District, and Luyuan District in Changchun City. Similarly, the data for the Jilin urban area is used in place of the data for the Changyi District, Longtan District, Chuanying District, and Fengman District.
2.3.3. Type Change
This article employs the matrix transfer method for type change analysis, the specific calculation formula is as follows:
and are any two periods of data, represent the planting structure type and its spatial distribution. We first identify the types of changes from period k to period k+1, and then derive the original transition matrix of transformation quantities between planting structure types based on these changes. Subsequently, the quantities and proportions of changes among various types can be obtained from the original transition matrix.
For example, let period k (1950) have a cropping structure type code =1, and period k+1 (1960) have code =2. Substituting into the formula , we calculate =1×10000+2=10002. This C=30006 represents County X’s shift from cropping structure type 1 (1950) to type 2 (1960); counting such C values across multiple counties allows analysis of cropping structure type transfer patterns.
The advantages of this planting type change method are as follows: First, it is simple to calculate and its meaning is intuitive. Second, it facilitates cross-year comparison, can effectively support the macro investigation of the evolution trend of planting structure types at the county scale, and meets the needs of this study.
3. Results
3.1. Temporal and Spatial Changes in the Proportions of Crop Cultivation
This article takes the main crops in Northeast China over nearly a century as the object of reconstruction. It reconstructs the sown area ratios of six major crops, namely sorghum, millet, rice, corn, soybean, and wheat, from the 1950s to the 1980s (as shown in Figure 3 and Figure 4). The results are as follows:
Throughout the period from the 1950s to the 1980s, corn had the largest proportion of sown area among the main crops in different counties and districts of Northeast China (Figure 3). More than 50% of the counties had a corn sown area ratio exceeding 20%, and approximately 30% of the counties had a corn sown area ratio exceeding 30% (Figure 2). As presented in Figure 3, during the 1950s, the main corn-producing areas (Rs≥30%) were mainly located in the Songnen Plain region. Here, 54% of the counties had a corn sown area ratio above 20%, and 23% had a ratio above 30%. In the 1960s, 51% of the counties in the study area had a corn sown area ratio exceeding 20%, and 26% had a ratio exceeding 30%. An increase-decrease conjugate relationship was observed. Evidently, the status of corn in crop planting was ascending during this period. Compared to the 1950s, in the central and southern parts of the study area in the 1960s, especially in the Songnen Plain and the northern Liaohe Plain, the corn sown area increased, suggesting a southward shift of the main corn-producing areas. In the 1970s, 62% of the counties in the study area had a corn sown area ratio exceeding 20%, and 42% had a ratio exceeding 30%. Compared to the 1950s and 1960s, the growth of the corn sown area in the 1970s was particularly remarkable. This highlighted its favorable position in crop planting, representing the peak growth rate within the research period. In the 1980s, 66% of the counties in the study area had a corn sown area ratio exceeding 20%, and 48% had a ratio exceeding 30%. Although the growth trend became somewhat more moderate, the corn sown area continued to increase. Corn dominance expanded southward from Songnen Plain to Liaoning by the 1980s. Overall, between 1950 and 1980, the proportion of cities/counties in Northeast China with a corn sown area ratio ≥ 20% cumulatively increased by 12 percentage points, and the proportion of cities/counties with a ratio ≥ 30% cumulatively rose by 25 percentage points, which clearly confirms the sustained upward trend in the planting status of corn.
Soybeans ranked second among the major crops in terms of planting scale, following corn, in the counties of the northeastern region from the 1950s to the 1980s. In the Northeast, over 30% of the districts and counties had a soybean sown area ratio exceeding 20%, and approximately 10% had a soybean sown area ratio exceeding 30%. As depicted in Figure 3, during the 1950s, the main soybean-producing areas (Rs≥30%) were mainly concentrated in the central region of Heilongjiang Province. Here, 57% of the districts and counties had a soybean sown area ratio above 20%, and 17% had a ratio above 30%. In the 1960s, 54% of the districts and counties in the study area had a soybean sown area ratio exceeding 20%, and 13% had a ratio exceeding 30%. Both figures showed a downward trend. This indicates that the status of soybeans in crop planting was in a decline during this period. Compared to the 1950s, in the 1960s, the soybean sown area decreased in the northern districts and counties of the study area, particularly in the eastern regions of Heilongjiang Province and Inner Mongolia. Conversely, Liaoning Province witnessed an increasing trend in soybean planting. In the 1970s, 37% of the districts and counties in the study area had a soybean sown area ratio exceeding 20%, and 9% had a ratio exceeding 30%. Compared to the 1950s and 1960s, the decline in the soybean sown area in the 1970s was especially notable. During this time, the number of districts and counties with a soybean sown area ratio over 20% changed from being greater than that of corn in the 1950s - 1960s to being less than that of corn, with the gap widening. In the 1980s, 35% of the districts and counties had a soybean sown area ratio exceeding 20%, and 12% had a ratio exceeding 30%. Overall, there was a slight increase, but the gap compared to corn planting continued to widen, reaching its maximum within the study period in the 1980s. Evidently, soybean sowing declined continuously from the 1950s to the 1980s, and the main soybean-producing areas have shifted from the eastern Songnen Plain and the western Sanjiang Plain in the study area to the eastern Sanjiang Plain and the Wusuli River basin. Overall, between 1950 and 1980, the proportion of districts and counties in Northeast China with a soybean sown area ratio ≥ 20% cumulatively decreased by 22 percentage points, and the proportion of districts and counties with a ratio ≥ 30% cumulatively declined by 5 percentage points, which clearly confirms the sustained downward trend in the planting status of soybeans.
Sorghum, a crop in the Northeast region of China from the 1950s to the 1980s, experienced substantial alterations in its sown area proportions. In the 1950s, 34% of the counties had a sorghum sown-area proportion surpassing 20%. However, by the 1980s, this percentage had decreased significantly to a mere 6%. Similarly, the proportion of counties with a sorghum sown-area above 30% declined from 22% in the 1950s to 2% in the 1980s. As indicated in Figure 3, during the 1950s, the principal sorghum-producing areas (Rs≥30%) were predominantly situated in the western Songnen Plain and the Liaohe Plain. In terms of the proportion of counties with a sown-area exceeding 30%, sorghum ranked second, trailing only corn and preceding soybeans. In the 1960s, only 8% of the counties in the study area had a sorghum sown-area proportion exceeding 20%, and 3% had a proportion exceeding 30%. Compared to the 1950s, this downward trend was strikingly evident. The main sorghum-producing areas contracted to just a small portion of the Liaohe Plain. During the 1970s, 10% of the counties in the study area had a sorghum sown-area proportion above 20%, and 2% had a proportion exceeding 30%. Although this represented a marginal increase in the sorghum sown area compared to the 1960s, the overall impact remained limited, and sorghum cultivation persisted at a low level. In the 1980s, 6% of the counties had a sorghum sown area proportion above 20%, and 2% had a proportion exceeding 30%. The sown area continued to decline, reaching its nadir within the research time-frame. Clearly, sorghum cultivation demonstrated a downward trajectory from the 1950s to the 1980s, with the most pronounced decline occurring from the 1950s to the 1960s. Overall, between 1950 and 1980, the proportion of cities/counties in Northeast China with a sorghum sown area ratio ≥ 20% decreased by 28 percentage points cumulatively, and the proportion of cities/counties with a ratio ≥ 30% decreased by 20 percentage points cumulatively.
Millet is a crop with a long-standing history and has held a notable position in crop cultivation. In the 1950s, the main millet producing areas (Rs≥30%) were mainly located in the Songnen Plain and the western part of the Liaoxi Hills. In 22% of the counties, the sown area of millet constituted more than 20% of the total sown area, while in 5% of the counties, it accounted for more than 30%. In the 1960s, 14% of the counties in the research area had millet sown areas exceeding 20%, and 3% had areas exceeding 30%. This represented a significant decline compared to the 1950s. In the 1970s, 11% of the counties in the research area had millet sown areas above 20%, and no counties had millet sown areas exceeding 30%. By the 1980s, millet planting in the research area had declined further, with only 3% of the counties having millet sown areas that exceeded 20%. Overall, between 1950 and 1980, the proportion of counties in Northeast China with a millet sown area ratio ≥ 20% decreased by 19 percentage points cumulatively, and the proportion of counties with a ratio ≥ 30% decreased by 5 percentage points cumulatively.
From the 1950s to the 1980s, the proportion of rice cultivation exhibited a pattern of first decreasing and then increasing. In the 1950s, the main rice producing areas (Rs≥30%) were predominantly located in the Liaohe Plain and the Liaodong Hills. At this time, 11% of the counties had a rice sowing area exceeding 20% of the total sown area, and 9% had a rice sowing area exceeding 30%. In the 1960s, 8% of the counties in the research area had a rice sowing area exceeding 20%, and 8% had an area exceeding 30%. Compared to the 1950s, this represented a decline in rice cultivation. In the 1970s, 11% of the counties in the research area had a rice sowing area exceeding 20%, while 6% had an area exceeding 30%. This indicated a slight increase in the rice sowing area compared to the 1960s. The main rice producing areas were distributed in a band-like pattern along the Liaohe River. In the 1980s, 13% of the counties in the research area had a rice sowing area exceeding 20%, and 8% had an area exceeding 30%. The upward trend continued, and the main rice producing areas expanded to the Tumen River area. Overall, between 1950 and 1980, the proportion of cities/counties in Northeast China with a rice sown area ratio ≥ 20% increased by 2 percentage points cumulatively, and the proportion of cities/counties with a ratio ≥ 30% decreased by 1 percentage point cumulatively.
Wheat cultivation showed an increasing trend from the 1950s to the 1980s. In the 1950s, the principal wheat-producing areas were predominantly situated in the eastern part of Heilongjiang Province. At this time, 9% of the districts had wheat sowing areas exceeding 20% of the total sown area, and 2% had areas exceeding 30%. In the 1960s, 12% of the districts in the study area had wheat sowing areas exceeding 20%, and 2% had areas exceeding 30%. Compared to the 1950s, wheat cultivation demonstrated an upward trend, and the main wheat producing area shifted to northern Heilongjiang Province. In the 1970s, wheat sowing areas continued to increase. In the study area, 14% of the districts had wheat sowing areas greater than 20%, and 8% had areas exceeding 30%. The scope of the main wheat producing areas expanded to cover northern Heilongjiang and northern Inner Mongolia. In the 1980s, the scale of wheat cultivation remained nearly unchanged, and the main production areas also became stable. Overall, between 1950 and 1980, the proportion of districts in Northeast China with a wheat sown area ratio ≥ 20% increased by 5 percentage points cumulatively, and the proportion of districts with a ratio ≥ 30% increased by 6 percentage points cumulatively.
Overall,From the 1950s to the 1980s, the planting area proportion and distribution of main producing areas of major crops in Northeast China showed significant spatiotemporal changes. Corn was the crop with the largest planting area proportion in all periods, and its planting status continued to rise. Its main producing areas gradually expanded southward from the Songnen Plain, eventually covering the entire Jilin and Liaoning provinces as well as the southern part of Heilongjiang Province. Soybean planting scale was second only to corn, but showed an overall continuous downward trend. Its main producing areas gradually shifted from the eastern Songnen Plain and western Sanjiang Plain to the eastern Sanjiang Plain and the Wusuli River Basin, and the gap in planting scale with corn continued to widen. Sorghum planting scale showed a continuous downward trend, with the most significant decline occurring from the 1950s to the 1960s. Its main producing areas shrank sharply from the western Songnen Plain and Liaohe Plain to a small part of the Liaohe Plain. Millet planting scale continued to decline, and the scope of its main producing areas continued to narrow. The proportion of rice planting area showed a trend of first decreasing and then increasing. Its main producing areas were initially distributed in the Liaohe Plain and Liaodong Hills, then distributed in a band-like pattern along the Liaohe River, and further expanded to the Tumen River Basin in the later period. Wheat planting scale showed an increasing trend and stabilized in the later period. Its main producing areas gradually moved northward from eastern Heilongjiang Province and expanded to northern Heilongjiang Province and northern Inner Mongolia, and the production areas finally stabilized.
3.2. Spatial Distribution Characteristics of Crop Planting Structure Types
Based on the proportion of crops, the crop types were classified (Figure 5), and the number of counties with different planting structure types was counted (Table 2). The results are as follows:
From the 1950s to the 1980s, a total of 19 types of crop structures were identified in the Northeast region. These were categorized into single crop planting types and mixed crop planting types. Among the single crop planting types, the single corn type was the most prevalent. In the case of mixed crop planting types, the corn-soybean-wheat type was dominant. Overall, corn, soybeans, and the corn-soybean mixed type persisted as the main planting categories.
In the 1950s, the planting structure in the Northeastern region was predominantly composed of composite planting structure types (Figure 5a), which accounted for 61.5% of the available county-level data. Among these composite types, the corn-soybean-wheat type was the most widespread, with 25 counties. These counties were mainly located in the southwestern and southeastern areas of Hohhot City in Inner Mongolia and in Heilongjiang Province. Regarding single crop planting types, the single corn type had the largest number of counties, reaching 21, only slightly fewer than the corn-soybean-wheat type. This type was mainly distributed in the central -western and southern regions of Jilin Province and the southwestern region of Heilongjiang Province. In the 1960s, composite planting structure types in the Northeastern region accounted for 57.8% of the available county-level data (Figure 5b). This represented a downward trend compared to the 1950s, while the proportion of counties with single crop planting structure types started to increase. Nevertheless, composite planting structure types still dominated, with the corn-soybean-wheat type remaining the most prevalent planting structure, found in a total of 43 counties. Significantly, the number of counties with the single corn type exceeded that of the corn-soybean-wheat type, reaching 47. This indicates that the status of corn planting was ascending during this period.
In the 1970s, the single type planting structure in the northeastern region surpassed the composite type, accounting for 66.7% of the counties with available data (Figure 5c). Among these, the number of counties with single corn planting areas increased to 76. These were mainly distributed in the northern part of Liaoning Province, the eastern part of Jilin Province, and the southern part of Heilongjiang Province. During this period, the number of counties with single wheat planting also increased rapidly, reaching a peak of 28. The areas of growth were mainly in the eastern part of Inner Mongolia, including Hohhot. In Liaoning Province, the cultivation of rice and sorghum experienced a slight increase, though the growth was not substantial. In Heilongjiang Province, the area of single wheat cultivation further expanded in the Xiaoxing'an Mountains, while soybean cultivation was more prominent in the Sanjiang Plain. In the 1980s, compared to the 1970s, overall changes were not substantial. The proportion of single crop types further increased to 68.9% (Figure 5d). Among them, the number of counties that planted only corn reached 84, the highest within the study period. Nevertheless, the overall scope of changes was limited, and the degree of variation was also relatively small.
3.3. Characteristics of Changes in Crop Planting Structure Types
By assigning values to the planting structure types of various counties from the 1950s to the 1980s, we utilized transition matrices to obtain the changes in crop planting structure types across four phases: 1950s - 1960s, 1960s - 1970s, 1970s - 1980s, and 1950s - 1980s (Figure 6, Table 3).
During the 1950s - 1960s period, 70.9% of the counties underwent changes, while 29.1% remained unchanged. The primary areas of change were concentrated in Liaoning Province, Heilongjiang Province, and the central region of Jilin Province. A total of 11 main types of change occurred, accounting for 44.7% of the total changes. The most notable change was from the single rice type to the single-corn type, which was observed in the southeastern part of Liaoning Province (Figure 6a). In the 1960s - 1970s period, 67% of the counties experienced changes, while 33% remained unchanged. Although the overall rate of change in the 1960s - 1970s was slightly lower than in the previous 1950s - 1960s period, the types of changes grew more complex, increasing to 15. The most notable change was from the single rice type to the single-corn type, which was observed in the southeastern part of Liaoning Province (Figure 6a).
In the 1960s - 1970s period, 67% of the counties experienced changes, while 33% remained unchanged. Although the overall rate of change in the 1960s - 1970s was slightly lower than in the previous 1950s - 1960s period, the types of changes grew more complex, increasing to 15. These accounted for 69.1% of the total changes. The scope of change expanded to cover the entire Northeast region. The most significant change was the transition from the corn-soybean-wheat type to the single wheat type, predominantly distributed in the northeastern part of Inner Mongolia and the central-northern regions of Heilongjiang Province (Figure 6b).
In the 1970s - 1980s period, only 13.5% of the counties witnessed changes, while 86.5% remained unchanged. The overall changes were minor, with just 3 main types of changes accounting for 42.2% of the total changes. The primary change was from the sorghum- millet-soybean type to the single corn type, occurring in the central region of Jilin Province (Figure 6c).
In the 1950s - 1980s period, 81.6% of the counties underwent changes, while 18.4% remained unchanged. The main areas of change were concentrated in the northeastern part of Inner Mongolia, the southeastern part of Liaoning Province, the central and western parts of Jilin Province, and the southern and western parts of Heilongjiang Province. There were 13 main types of changes, which accounted for 65.8% of the total changes. The most significant change was from the corn-soybean-wheat type to the single wheat type, distributed in the northeastern part of Inner Mongolia (Figure 6d).
Overall, three primary types of changes in planting types can be identified. The first is the shift from other planting types to the single corn type, which constitutes 12.9% of the total statistical data. The second is the transition from other planting types to the corn -soybean composite type, accounting for 6.6% of the total statistical data. The third is the change from the corn-soybean-wheat type to the single wheat type, representing 2.7% of the total statistical data. Evidently, during the period from the 1950s to the 1980s, the planting structure in Northeast China showed a tendency towards simplification. The three eastern provinces (Liaoning, Jilin, and Heilongjiang) predominantly trended towards single corn planting, while the northeastern region of Inner Mongolia mainly inclined towards single wheat planting.
4. Discussion
4.1. The Impact of Planting Structure on Carbon Emissions
To clarify the internal mechanism underlying the complex evolution of the planting structure during the study period, this paper will start from the planting areas of major crops in Northeast China from 1950 to 1980, estimate the carbon emissions generated thereby, and discuss their impacts on carbon emissions from three aspects: the intensity effect, scale effect, and structural effect of crop planting.
The current international accounting of agricultural carbon emissions takes the IPCC emission factor method as the core methodological basis and forms a hierarchical accounting system[28,29]. The calculation formula adopted in this paper is as follows:
Where: is the total agricultural carbon emissions; is the carbon emissions from various carbon sources; is the emissions from various carbon emission sources; is the emission factor corresponding to the i-th emission source. The following adjustments are made in accordance with the research objectives of this paper:
Where: is the total carbon emissions from crops; is the planting area of rice; is the carbon emission factor of rice; is the planting area of the x-th category of dryland crops; is the carbon emission factor of the x-th category of dryland crops. In this paper, dryland crops mainly include sorghum, millet, maize, soybean and wheat. The selection of emission factors is shown in Table 4. Finally, all emissions are uniformly converted into carbon equivalent according to the Global Warming Potential (GWP) of IPCC Sixth Assessment Report (IPCC AR6). The results are as follows:
4.1.1. Temporal Characteristics of Agricultural Carbon Emissions
1. Total carbon emissions exhibited a phased fluctuation characteristic of "rise - decline - rise".
In 1950, the total agricultural carbon emissions in Northeast China were 1,925.14 wt CO₂eq; they climbed to a peak of 3,799.58 wt CO₂eq in 1960; fell back to 2,038.20 wt CO₂eq in 1970; and rose slightly to 2,288.75 wt CO₂eq in 1980, showing an overall changing trend of "initial expansion, subsequent contraction, and then recovery".
2. The carbon emission share of traditional low-yield crops continued to shrink.
The carbon emission shares of the three traditional crops, namely millet, sorghum, and wheat, mainly showed a shrinking trend: the share of millet decreased from 9.39% in 1950 to 3.13% in 1980, and the share of sorghum dropped from 14.31% to 8.92%. Although the share of wheat slightly increased from 0.95% to 1.75%, the growth rate was limited; the combined carbon emission share of the three crops shrank from 24.65% to 13.80%, which reflects the continuous reduction of traditional low-yield crops.
3. High-yield crops dominated carbon emissions, and soybean carbon emissions exhibited a characteristic of "first increasing and then decreasing"
Two high-yield crops, maize and rice, emerged as the core contributors to carbon emissions: the share of maize increased from 34.85% in 1950 to 45.38% in 1980 and remained the crop with the highest share throughout the period; the share of rice rose from 12.41% to 25.35%. The combined carbon emission share of these two crops increased from 47.26% to 70.73%, making them the core driving force behind the fluctuations in total carbon emissions. In contrast, the carbon emission share of soybeans decreased from 28.09% to 15.47%, and its carbon emissions exhibited the characteristic of "increasing from 1950 to 1960 and declining after 1960"(Table 5;Figure 7).
4.1.2. Spatial Characteristics of Agricultural Carbon Emissions
For wheat, soybean, and maize, the northern Songnen Plain served as a long-term stable high-carbon concentration core area. Specifically, the intensity of wheat’s core area remained consistent, while the high-carbon patches in the central and southern regions showed a trend of "continuous contraction after expansion", leaving only the northern core area in the end. The pattern of soybean’s core area stayed stable throughout, and the high-carbon patches in the central and southern regions exhibited a fluctuating and dispersed feature of "expansion-contraction-slight re-expansion", without forming a contiguous zone. In contrast, maize, based on the stability of its northern core, saw gradual expansion of the southern high-carbon area, which eventually connected with the northern core, forming a cross-regional contiguous pattern and becoming the high-carbon crop with the widest coverage during this period.
Sorghum and millet remained concentrated in counties in the southern Northeast (central-southern Liaoning and southern Jilin) and did not spread to the northern regions. Taking the 1960s as a dividing line, both crops followed a consistent temporal trend: first expanding into contiguous patches in the south, then contracting back to the core counties in the south, and finally maintaining a pattern of small-scale concentrated distribution in the southern area.
Starting from initial small patches in the south, rice gradually expanded toward central-eastern Jilin and southeastern Heilongjiang, eventually forming a large-scale contiguous high-carbon pattern consisting of a southern core area and a central-eastern expansion area (Figure 8).
4.2. Analysis of Driving Factors and Mechanisms
To explore the driving factors and their underlying mechanisms influencing the complex process of agricultural carbon emissions in Northeast China from 1950 to 1980, this paper adopts the Logarithmic Mean Divisia Index (LMDI) decomposition model to decompose the dynamic changes in carbon emissions into three factors: the carbon emission intensity effect (△I), the planting scale effect (△L), and the planting structure effect (△S). Within the planting structure effect, single crops are taken as the research objects to discuss the contribution degree of different crops to agricultural carbon emissions during the study period. The LMDI decomposition model is widely used in contribution studies of agricultural carbon emissions due to its residual-free decomposition and flexible decomposition forms[35,36,37]. Based on the research context of this paper, the decomposition is carried out using the following formula:
In Formula (4), denotes the total agricultural carbon emissions, represents the carbon emissions of the i-th crop, is the planting area of the i-th crop, stands for the total planting area of all crops, indicates the change in carbon emissions, is the intensity effect, represents the structural effect, denotes the scale effect, is the carbon emissions of the i-th crop in year t, and stands for the total planting area of all crops in year t.
* The intensity effect can be defined as carbon emissions per unit output and carbon emissions per unit area. Considering the research objects and data availability of this paper, the intensity effect is defined as carbon emissions per unit area in this study.
4.2.1. Analysis of Driving Factors of Agricultural Carbon Emissions
Based on the Logarithmic Mean Divisia Index (LMDI) decomposition model, this study simultaneously analyzes the phased effects and long-term cumulative effects of agricultural carbon emissions in Northeast China from the 1950s to the 1980s, and clarifies the dynamic and long-term mechanisms of multiple driving factors and the evolution of planting structure on carbon emissions(Figure 8). The conclusions are as follows:
1. The scale effect is the dominant driving factor for the growth of carbon emissions.
From the perspective of decadal effects, the contribution values of the planting scale effect (ΔL) in the 1950s, 1960s, and 1970s were 1,569.7 wt CO₂eq, 1,627.324 wt CO₂eq, and 1,240.9 wt CO₂eq, respectively. It showed a significant positive contribution in each decade and was the core driving force for the growth of carbon emissions in the corresponding period. From the perspective of long-term cumulative effects, the cumulative contribution of the planting scale effect (ΔL) from 1950 to 1970 reached 3,197.0 wt CO₂eq, and further increased to 4,437.9 wt CO₂eq from 1950 to 1980. This indicates that the continuous expansion of planting scale not only promoted the growth of carbon emissions in each period, but also its positive driving effect showed a cumulative strengthening characteristic over time, making it the long-term dominant factor for the growth of carbon emissions during the study period.
2. The intensity effect is the core inhibitory factor for the growth of carbon emissions.
From a phased perspective, the carbon emission intensity effect (ΔI) exerted a negative inhibitory effect in each decade: it reduced emissions by 138.6 wt CO₂eq in the 1950s, its inhibitory effect was significantly strengthened with an emission reduction of 4,044.9 wt CO₂eq in the 1960s, and it reduced emissions by 1,500.8 wt CO₂eq in the 1970s. From the perspective of long-term accumulation, the cumulative emission reduction contribution of the carbon emission intensity effect (ΔI) from 1950 to 1970 reached 4,183.5 wt CO₂eq, and further expanded to 5,684.3 wt CO₂eq from 1950 to 1980. These findings indicate that the carbon emission intensity effect not only served as a consistent negative inhibitory factor across all decadal periods, but also that its emission reduction capacity experienced a significant enhancement in the 1960s. More importantly, the growing cumulative emission reduction contribution over time verifies the feasibility and effectiveness of reducing agricultural carbon emissions by improving carbon emission intensity per unit area, providing a critical path reference for low-carbon agricultural development in Northeast China.
3. The structural effect is a positive contributing factor to the growth of carbon emissions, with heterogeneous contributions at the crop level.
From the perspective of the overall structural effect, the contribution values of the phased structural effect (ΔS) are as follows: 443.3 wt CO₂eq in the 1950s, 656.2 wt CO₂eq in the 1960s, and 510.5 wt CO₂eq in the 1970s, showing a fluctuating positive characteristic of "first increasing and then decreasing". In the long-term accumulation, the cumulative contribution of the structural effect (ΔS) reached 1,099.5 wt CO₂eq from 1950 to 1970 and rose to 1,607.0 wt CO₂eq from 1950 to 1980, making it an important auxiliary driving factor for the growth of carbon emissions.
From the perspective of structural contributions at the crop level: In each time period, the structural effect of rice (ΔS_rice) was 356.0 wt CO₂eq in the 1950s, 497.5 wt CO₂eq in the 1960s, and 397.8 wt CO₂eq in the 1970s, while the structural effect of corn (ΔS_corn) was 194.4 wt CO₂eq in the 1950s, 212.9 wt CO₂eq in the 1960s, and 183.6 wt CO₂eq in the 1970s. Both remained the core positive contributors to the structural effect throughout the periods. In contrast, the structural effect of sorghum (ΔS_sorghum) was -182.4 wt CO₂eq in the 1950s, -128.0 wt CO₂eq in the 1960s, and -120.6 wt CO₂eq in the 1970s, exerting a continuous negative inhibitory effect. In terms of long-term accumulation, the positive contributions of the rice structural effect (ΔS_rice) and corn structural effect (ΔS_corn) accumulated to 1,251.4 wt CO₂eq and 590.9 wt CO₂eq, respectively, while the negative inhibitory effect of the sorghum structural effect (ΔS_sorghum) further intensified with a cumulative value of -431.1 wt CO₂eq. Meanwhile, the structural effects of millet (ΔS_millet), soybean (ΔS_soybean), and wheat (ΔS_wheat) remained at a low level over the long term, with cumulative contributions of -8.7 wt CO₂eq, 125.6 wt CO₂eq, and 81.8 wt CO₂eq, respectively. The differences in structural contributions among crops remained stable during the study period.
4.2.2. Analysis of the Driving Mechanism of Carbon Emission Changes
Combined with the fluctuating trend of "rise - fall - rise" in agricultural carbon emissions in Northeast China from 1950 to 1980, the results of LMDI decomposition, and the historical facts of agricultural development in Northeast China during this period, the driving mechanisms of carbon emission changes in each stage are discussed as follows:
1.1950s: Period of Rapid Rise in Carbon Emissions
The land reform and the "Beidahuang" development strategy drove the scale effect to become the dominant factor: In the early 1950s, the land reform was completed in Northeast China, stimulating farmers' enthusiasm for production; after 1956, the state launched the large-scale development strategy of "Beidahuang", organizing demobilized officers and soldiers, and educated youth to reclaim wasteland in Northeast China. This policy directly promoted the planting scale effect (ΔL) to rise from 1,569.7 wt CO₂eq to 1,627.3 wt CO₂eq, making it the core factor of carbon emission increase in this period. With the start of industrialization in 1953, the chemical fertilizer industry initially developed. As a heavy industry base, Northeast China's chemical fertilizer supply capacity was significantly improved. Meanwhile, to meet the national grain demand, local governments vigorously promoted high-yield crops such as rice and corn, and reduced the planting area of low-yield crops such as sorghum and millet. This structural adjustment led to the rice structural effect (ΔS_rice) rising from 356.0 wt CO₂eq to 497.5 wt CO₂eq, and the corn structural effect (ΔS_corn) rising from 194.4 wt CO₂eq to 212.9 wt CO₂eq, which drove the overall structural effect (ΔS) to increase from 443.3 wt CO₂eq to 656.2 wt CO₂eq, becoming an important auxiliary factor for carbon emission increase. However, the backward production methods and technical level in this period resulted in a weak inhibitory effect of the intensity effect.
2.1960s: Period of Rapid Contraction in Carbon Emissions
After 1961, in response to the problem of excessive agricultural development during the "Great Leap Forward" period, the state implemented the Eight-Character Policy. Northeast China suspended large-scale wasteland reclamation, and even converted some ecologically fragile cultivated land back to forests and grasslands. At the same time, it strengthened the planned management of agricultural production and controlled the disorderly expansion of planting scale. This policy stabilized the positive contribution of the planting scale effect (ΔL), with its value ranging from 1,569.7 wt CO₂eq to 1,627.3 wt CO₂eq, and the driving force for carbon emission increase dropped significantly. The state continued to promote high-yield crops in this stage, and the structural effect reached its peak. However, during this period, the state vigorously promoted advanced agricultural technologies in Northeast China, including rational close planting, scientific fertilization, and integrated pest management. The application of these technologies significantly reduced the carbon emission intensity per unit output, making the inhibitory effect of the intensity effect (ΔI) reach its peak, which became the main factor for emission reduction in this period, and the emission reduction effect was far greater than the emission increase effect.
3.1970s: Period of Slight Recovery in Carbon Emissions
After 1978, the household contract responsibility system was gradually piloted and promoted in Northeast China. Farmers obtained the autonomy in production and operation, and their enthusiasm for production was reactivated. However, due to the state's encouragement of diversified management, on the basis of ensuring grain cultivation, farmers moderately expanded the planting scale of cash crops, resulting in a decrease in the scale effect from 1,627.3 wt CO₂eq to 1,240.9 wt CO₂eq. In the early stage of reform and opening up, the rural commodity economy initially developed. As an important commodity grain base in the country, the market demand for high-yield and high-quality crops such as rice and corn in Northeast China gradually increased. To adapt to the market demand, farmers further optimized the planting structure, and the structural effect continued to make positive contributions. In the early 1980s, the progress of agricultural technology in Northeast China entered a plateau period. The growth rate of chemical fertilizer use efficiency and mechanization level slowed down compared with the 1960s; at the same time, with the increase of farmers' income, the investment in agricultural means of production such as chemical fertilizers and pesticides increased synchronously, and the decline rate of carbon emission intensity per unit output slowed down. The inhibitory effect of the intensity effect (ΔI) dropped significantly from -4,044.9 wt CO₂eq to -1,500.8 wt CO₂eq, which could not further offset the combined emission increase effect of the scale and structural effects, and ultimately promoted a slight recovery in carbon emissions.
4.3. Comparison of Research Results and Uncertainty Analysis
4.3.1. Comparison with Other Research Results
Due to the scarcity of historical estimation results on agricultural carbon emissions in Northeast China from the early days of the founding of the People's Republic of China to the reform and opening up, and the lack of direct comparable research data for the same period, this paper mainly conducts a comparative analysis with existing research results on agricultural carbon emissions in Northeast China during the modern stage [38,39]. The accounting results show that agricultural carbon emissions in Northeast China from 1950 to 1980 presented a trend of "rapid increase from 1950 to 1960, and a gentle decline and stabilization after 1960". Among them, the peak value in 1960 reached approximately 38 million tons of CO₂eq, and stabilized at about 23 million tons of CO₂eq in 1980. This trend mutually confirms the core logic that agricultural carbon emissions in Northeast China increase in stages with the agricultural development stage, which is consistent with the characteristics of continuous and steady growth of agricultural carbon emissions in the three northeastern provinces from 1996 to 2013 calculated by Li Zhengtong[38] et al., and the fluctuating increase from 2012 to 2021 calculated by Hu Boyang[39]. To a certain extent, it reflects the common driving effect of regional agricultural production expansion on carbon emissions.
In addition to the consistency in the trend direction, the fluctuation range of this paper from 1950 to 1980 is significantly larger than the research results of Li Zhengtong et al[38]. and Hu Boyang[39]. The possible reason lies in the different development stages corresponding to the time scales: this study focuses on the agricultural production stage dominated by strong policy interventions in the early days of the founding of the People's Republic of China, including the wasteland reclamation strategy and the adjustment of the Eight-Character Policy, while the modern studies correspond to the market-driven commodity grain expansion stage and the technology stage of modernization transformation respectively. The differences in production logic and intervention intensity have led to the differentiation of trend fluctuation characteristics. In addition, the research area of this paper includes the eastern part of Inner Mongolia in addition to the three northeastern provinces, with a wider research spatial scope, which is another important reason for the difference.
4.3.2. Uncertainty Analysis
The year 1960 fell within the period of the Great Leap Forward. Most of the data used in this paper are from local chronicles, which were mainly reported by grass-roots units. Such data may be overstated, leading to an overestimation of the total carbon emissions in 1960 compared with the actual situation.
The IPCC emission factors adopted in the carbon emission calculation of this paper are based on the modern period. However, there are significant differences between the crops in the study period and modern crops in terms of variety improvement, growth process, and planting methods. In future research, the emission factors should be modified to conform to the characteristics of the historical period, so as to improve the accuracy of carbon emission estimation.
5. Conclusions
This article, grounded in the reconstruction of six major crops — sorghum, millet, rice, corn, soybeans, and wheat — from the 1950s to the 1980s, arrives at the following conclusions:
The planting structure demonstrated a trend where corn was dominant, the proportion of coarse grains decreased, and the areas of rice and wheat increased slightly. Corn consistently maintained the highest proportion of sown area, and its advantage gradually expanded. Although the status of soybeans declined to some extent, it still firmly held the second - place in sown area, thus forming a "corn-soybean" dual-core pattern with corn. The significant decline of sorghum and millet reflected the gradual marginalization of traditional low-yield coarse grains under the then-prevailing circumstances, verifying the crucial role of high-yield crops in addressing the regional food-supply shortage.
The types of planting structures became more complex, with significant spatial differentiation. During the period from the 1950s to the 1980s, a total of 19 types of crop structures emerged. The most complex changes occurred from the 1960s to the 1970s, with 15 types of crop changes. The direction of transformation was from non-corn-related types to corn-related types. This shift was closely related to the grain-yield-increasing policies and the initial promotion of agricultural mechanization at that time. From the 1970s to the 1980s, it entered a stable stage. The number of crop types tended to stabilize, and the amplitude of transformation slowed down significantly. This marked that the regional crop structure gradually adapted to the agricultural production mode at that time, forming a relatively mature planting system. Influenced by the arid climate and planting traditions, the single-wheat type became the absolutely dominant type in the eastern region of Inner Mongolia, resulting in a crop spatial differentiation pattern that was significantly different from that of the Northeast Plain, which was dominated by corn.
During the study period, agricultural carbon emissions in Northeast China exhibited a phased fluctuation characteristic of "rise - decline - recovery", and the carbon emission structure showed an evolutionary law that the proportion of traditional low-yield crops (such as millet and sorghum) continued to shrink, while high-yield crops such as maize and rice became the core contributors to carbon emissions. The LMDI decomposition results indicated that the planting scale effect was the long-term dominant driving factor for carbon emission growth, the carbon emission intensity effect was the core inhibitory factor, and the structural effect existed as a positive auxiliary driving factor with heterogeneous contributions at the crop level.
The county-level agricultural planting structure data constructed in this study fills the gap in the historical dataset of agricultural carbon emissions in Northeast China from the early days of the founding of the People's Republic of China to the reform and opening up. The revealed correlation law of "policy-production-carbon emissions" and phased driving characteristics not only mutually confirm the core logic of modern research on agricultural carbon emissions in Northeast China, but also provide key data support and historical experience reference for the research on regional agricultural low-carbon transformation. At a time when the scale effect and intensity effect have stabilized, the adjustment of structural effect will become an important means for the low-carbon transformation and development of agriculture in the future. On the premise of ensuring China's food security, expanding the planting scale of low-carbon crops and constructing a diversified agricultural structure are of great significance for achieving low-carbon goals.
Supplementary Materials
The following supporting information can be downloaded at the website of this paper posted on Preprints.org. The content of the attachment is voluminous and has all been placed in the supplementary document.
Data Availability Statement
The statistical yearbook data is obtained from the “Northeast Region Crop Sowing Area Dataset (1840 - 1949)” provided by the National Earth System Science Data Center, accessible at https://www.geodata.cn/. The local chronicles data is derived from library collections, primarily those of the Chinese Academy of Sciences (CAS) Information Center and Changchun Municipal Library. The collection catalog can be found in Appendix A.
Acknowledgments
Thanks to Changchun Library, the Information Center of the Chinese Academy of Sciences, and the National Earth System Science Data Center for their assistance.
Appendix A
The content of the attachment is voluminous and has all been placed in the supplementary document.
References
- Wei, C. Historical trend and drivers of China's CO2 emissions from 2000 to 2020. Environ Dev Sustain 2024, 26, 2225–2244. [Google Scholar] [CrossRef]
- Byrne, B.; Liu, J.J.; Bowman, K.W.; Pascolini-Campbell, M.; Chatterjee, A.; Pandey, S.; Miyazaki, K.; van der Werf, G.R.; Wunch, D.; Wennberg, P.O.; et al. Carbon emissions from the 2023 Canadian wildfires. Nature 2024, 633. [Google Scholar] [CrossRef]
- Wang, B.X.; Duan, M.S. Have China's emissions trading systems reduced carbon emissions? Firm-level evidence from the power sector. Appl Energ 2025, 378. [Google Scholar] [CrossRef]
- Sokal, K.; Kachel, M. Impact of Agriculture on Greenhouse Gas Emissions-A Review. Energies 2025, 18. [Google Scholar] [CrossRef]
- Yang, X.L.; Xiong, J.R.; Du, T.S.; Ju, X.T.; Gan, Y.T.; Li, S.; Xia, L.L.; Shen, Y.J.; Pacenka, S.; Steenhuis, T.S.; et al. Diversifying crop rotation increases food production, reduces net greenhouse gas emissions and improves soil health. Nat Commun 2024, 15. [Google Scholar] [CrossRef] [PubMed]
- Li, R.S.; Lian, Z.Y.; Xu, D.D. Non-agricultural transfers and the restructuring of farmers'' cultivation: “grainification” or “non-grainification”. Chin J Eco-Agric 2025, 33, 1–13. [Google Scholar] [CrossRef]
- Wu, Z.L.; Fang, X.Q.; Ye, Y.; Hu, Z.Q.; Zhao, Z.L. Optimization of cropland cover data in jilin province over the past 300 years and it's spatial-temporal change charateristics. Chin. J. Agric Resour Regional Plan 2025, 46, 53–68. [Google Scholar] [CrossRef]
- Jia, R.; Fang, X.Q.; Yang, Y.D.; Yokozawa, M.; Ye, Y. A 28-time-point cropland area change dataset in Northeast China from 1000 to 2020. Earth Syst Sci Data 2024, 16, 4971–4994. [Google Scholar] [CrossRef]
- Hu, X.H.; Xu, Y.; Huang, P.; Yuan, D.; Song, C.H.; Wang, Y.T.; Cui, Y.L.; Luo, Y.F. Identifying Changes and Their Drivers in Paddy Fields of Northeast China: Past and Future. Agriculture-Basel 2024, 14. [Google Scholar] [CrossRef]
- Xin, F.F.; Xiao, X.M.; Dong, J.W.; Zhang, G.L.; Zhang, Y.; Wu, X.C.; Li, X.G.; Zou, Z.H.; Ma, J.; Du, G.M.; et al. Large increases of paddy rice area, gross primary production, and grain production in Northeast China during 2000-2017. Sci Total Environ 2020, 711. [Google Scholar] [CrossRef]
- Zhang, N.; Luan, Y.J.; Wang, S.Y. Driving mechanism of carbon emissions in China’s agriculture and the economic decoupling effect. Environ Sci 2026, 1–26. [Google Scholar] [CrossRef]
- Jiang, Y.Y.; Wu, X.B. The impact of planting structure on agricultural carbon emissions. J Hebei Agric Sci 2026, 1–7.
- Zhang, Y.; Li, H.; Zhao, Z.H. Research om effects of grain crop p;amtomh changes om agricultural carbon emissions between provinces in China. Chin J Agric Resour Reg Plann 2023, 44, 29–38. [Google Scholar]
- Yang, C.; Hu, P.Q.; Diao, B.T.; et al. Environmental performance evaluation of policies in main grain producing areas:from the perspective of agricultural carbon emissions. Chin J Popul Resour Environ 2021, 31, 35–44. [Google Scholar]
- Tian, Y.; Zhang, J.B.; Li, B. Study on agricultural carbon emissions in China: measurement, spatiotemporal comparison and decoupling effect. Chin J Resour Sci 2012, 34, 2097–2105. [Google Scholar]
- Li, G.Z.; Li, Z.Z. Study on regional differences and influencing factors of carbon dioxide emissions in China. Chin J Popul Resour Environ 2010, 20, 22–27. [Google Scholar]
- Dai, X.W.; Yang, Y.X. Calculation, driving effect and temporal and spatial characteristics of carbon emissions in China's provincial planting industry from 2007 to 2016. J Sichuan Agric Univ 2020, 38, 241–250. [Google Scholar]
- Geeta, D.; Das, P. North-East India: a comprehensive geography; EBH Publishers (India), 2018. [Google Scholar]
- Zivaljevic, B.; Markovic, M.; Mimic, G.; Marko, O.; Woznicki, S. Multi-annual crop maps reveal cropping patterns in the Vojvodina region (Serbia). Int Conf Agro-Geoinf 2024, 65–68. [Google Scholar] [CrossRef]
- Smith, B.W.; Soulard, C.E.; Walker, J.J. Crop type classification, trends, and patterns of central California agricultural fields from 2005 to 2020. Agrosys Geosci Env 2024, 7. [Google Scholar] [CrossRef]
- Li, Z.Q.; Xuan, F.; Dong, Y.; Huang, X.D.; Liu, H.; Zeng, Y.L.; Su, W.; Huang, J.X.; Li, X.C. Performance of GEDI data combined with Sentinel-2 images for automatic labelling of wall-to-wall corn mapping. Int J Appl Earth Obs 2024, 127. [Google Scholar] [CrossRef]
- Xiao, X.Y.; Zhang, J.; Liu, Y.Q. Impacts of Crop Type and Climate Changes on Agricultural Water Dynamics in Northeast China from 2000 to 2020. Remote Sens-Basel 2024, 16. [Google Scholar] [CrossRef]
- Yang, G.Z. Study on the changes of planting structure in northeast china over the past 70 years. Chin Agric Hist 1985, 1, 12–21. [Google Scholar]
- Chen, Y.J.; Zhang, P.Y.; Liu, S.W.; Tan, J.T. The spatio-temporal pattern change and optimum layout of grain production in the west of northeast china. Sci Geogr Sin 2016, 36, 1397–1407. [Google Scholar] [CrossRef]
- Li, M.; Zhen, S.J.; Gao, Q.; Li, Q.; Yan, J.Y. Research on the evolution characteristics of crop planting structure and adjustment countermeasures in Heilongjiang province. Chin J Agric Resour Regional Plan 2018, 39, 46–53. [Google Scholar] [CrossRef]
- Guo, Y.; Ye, Y.; Jiang, J.F.; Fang, X.Q. Spatio-temporal changes of cropping types in northeast china during 1920-1940s. J Chin Hist Geogr 2025, 40, 96–106. [Google Scholar] [CrossRef]
- Liu, Z.H.; Tang, P.Q.; Fan, L.L.; Yang, P.; Wu, W.B. Spatio-temporal variation characteristics of planting structure in Northeast China from 1980 to 2010. Sci Agric Sin 2016, 49, 4107–4119. [Google Scholar] [CrossRef]
- IPCC. Climate change 2021 : the physical science basis : Working Group I contribution to the 6th assessment report of the Intergovernmental Panel on Climate Change[J]. 2024, 2, 103–105. [Google Scholar]
- Gao, Q.X. Evolution of guidelines for greenhouse gas inventories and analysis and prospects of models, procedures and guidelines for the transparency framework. Adv Clim Change Res 2025, 21, 593–601. [Google Scholar]
- Wang, Z.P. Estimation of Nitrous Oxide Emission of Farmland in China. Rural Ecol Environ 1997, 13, 51–55. [Google Scholar]
- Min, J.S.; Hu, H. Calculation of Greenhouse Gases Emission from Agricultural Production in China. Chin Popul Resour Environ 2012, 22. [Google Scholar]
- Huang, G.H.; Chen, G.X.; Wu, J.; et al. N₂O and CH₄ Fluxes from Typical Upland Fields in Northeast China. Chin J Appl Ecol 1995, 6, 383–386. [Google Scholar]
- Wang, S.B.; Su, W.H. Estimation of Nitrous Oxide Emission and Its Future Change in China. Chin Environ Sci 1993, 14, 42–46. [Google Scholar] [CrossRef]
- Yu, K.W.; Chen, G.X.; Yang, S.H.; et al. Role of Several Upland Crops in N₂O Emission from Farmland and Its Response to Environmental Factors. Chin J Appl Ecol 1995, 6, 387–391. [Google Scholar]
- Shen, X.M.; Yan, R.; Jiang, M.D. How Does Planting Structure Change Affect the Agricultural Net Carbon Sink? Evidence from the Jiangsu Coastal Economic Belt. Ecol Indic 2025, 170, 112949. [Google Scholar] [CrossRef]
- Zhang, N.; Luan, Y.J.; Zhang, Z.T. The Regional Differences and Driving Factors Decomposition of Agricultural Carbon Emissions in China Based on the LMDI Model. Environ Prot Sci 2025. [Google Scholar] [CrossRef]
- Gao, B.; Yu, Y. Simulation of Agricultural Carbon Emissions and Assessment of Emission Reduction Effects in Jalaid Banner Based on Synergistic Models. J Environ Eng Technol 2025, 15, 1958–1970. [Google Scholar]
- Hu, B.Y. Temporal and Spatial Evolution Characteristics of Agricultural Carbon Offset Rates in the Three Northeastern Provinces and Analysis of Carbon Emission Trends. Jilin Univ 2025. [Google Scholar] [CrossRef]
- Li, Z.T.; Bai, C.Q.; Xiao, W.W. Measurement and Decomposition of Agricultural Carbon Emissions in Northeast China Based on the LMDI Model. Agric Res Arid Areas 2017, 35, 145–152. [Google Scholar]
Figure 1.
Research area topographic map.
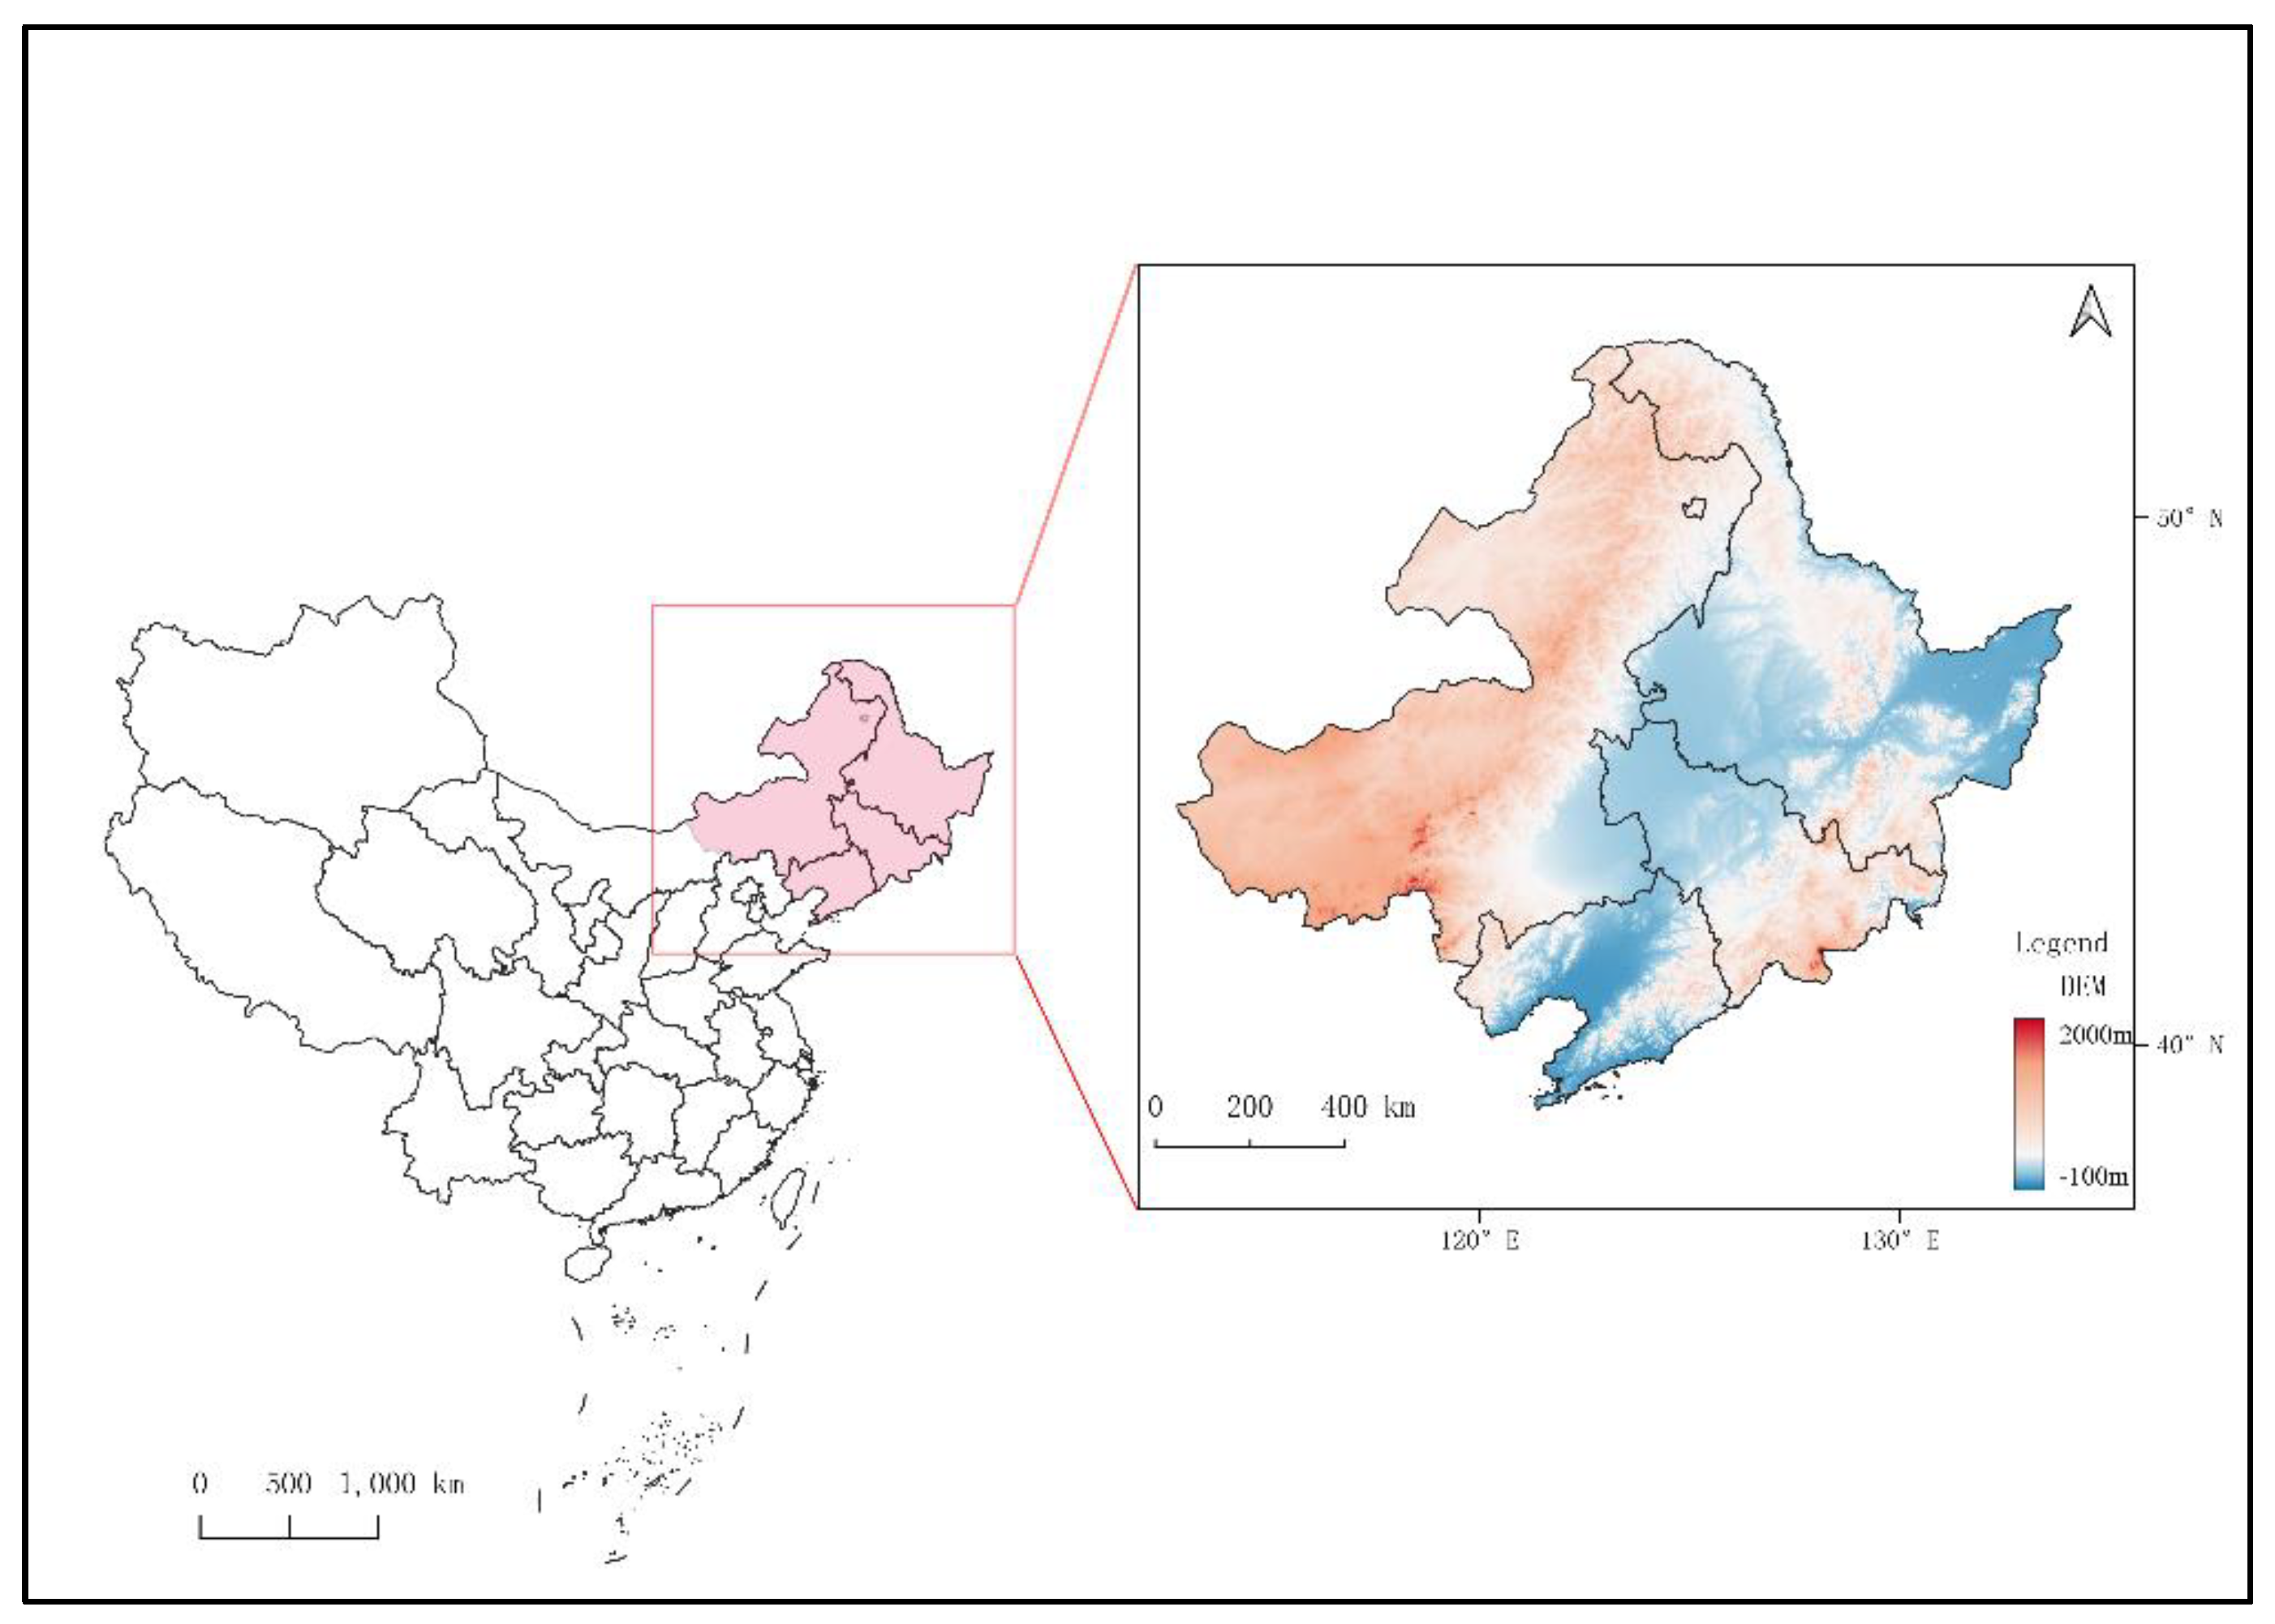
Figure 2.
Data processing flow.
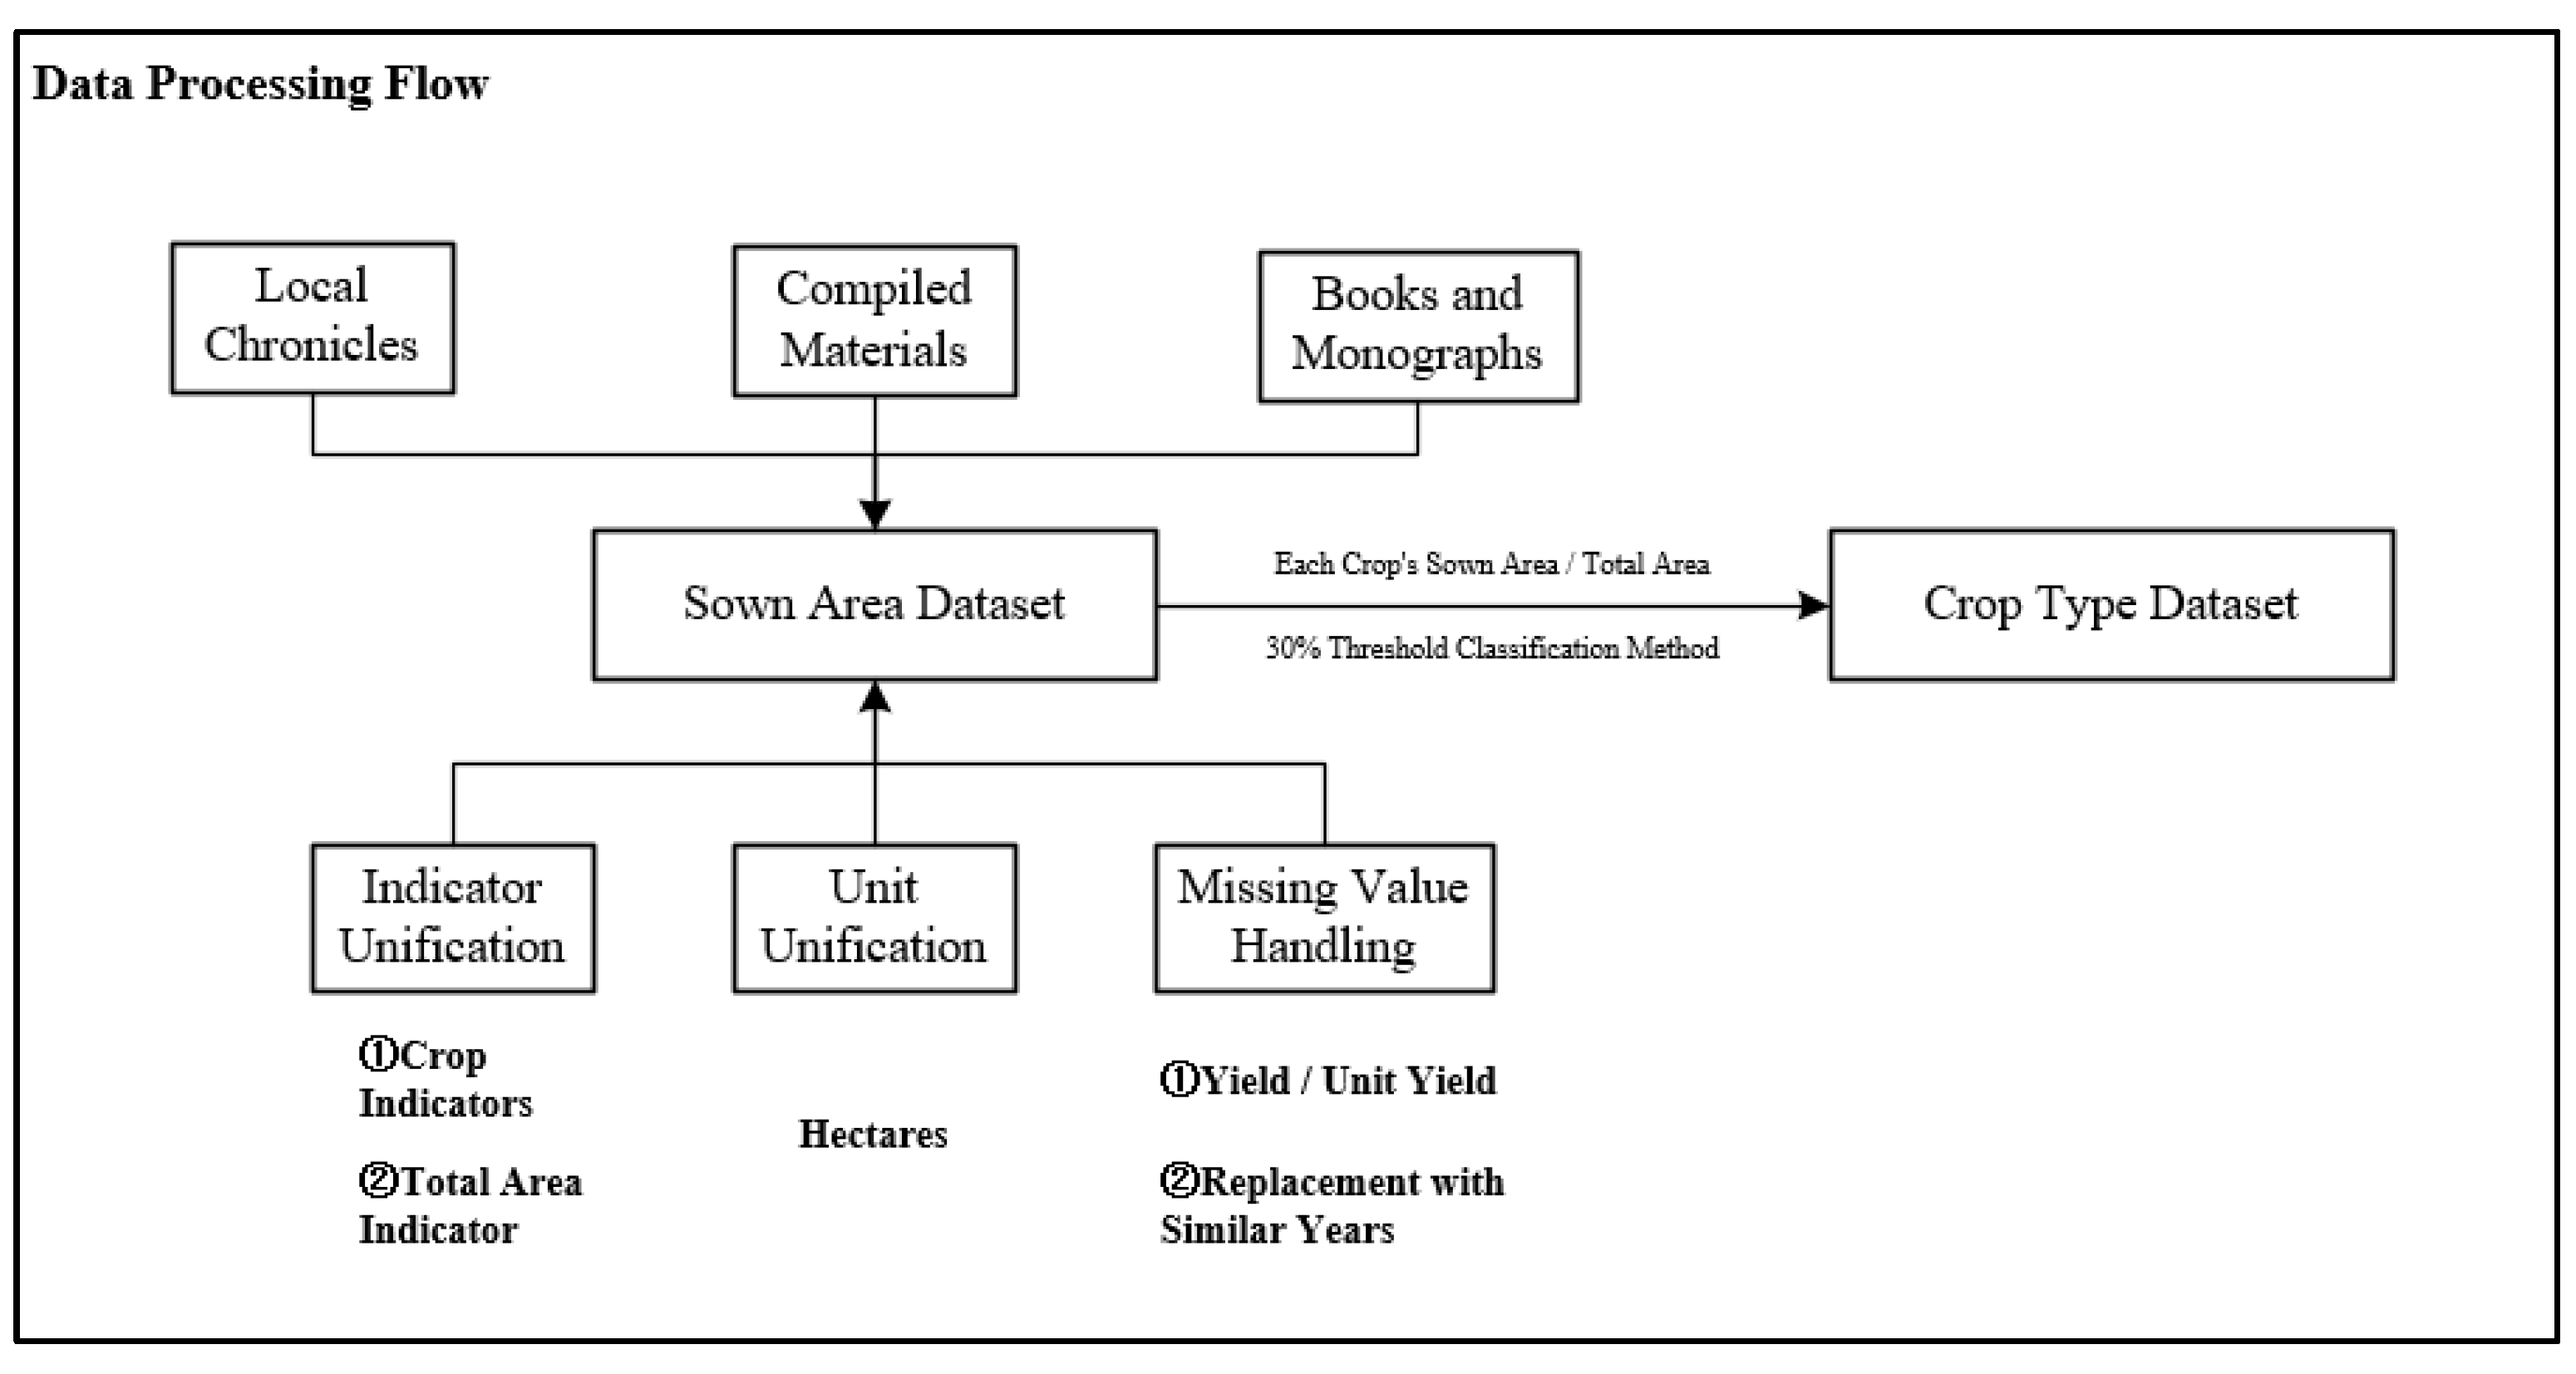
Figure 3.
Proportion of Major Crops Sown Area in Northeast China from the 1950s to the 1980s. Review number: GS Jing (2022) No. 1061.
Figure 3.
Proportion of Major Crops Sown Area in Northeast China from the 1950s to the 1980s. Review number: GS Jing (2022) No. 1061.
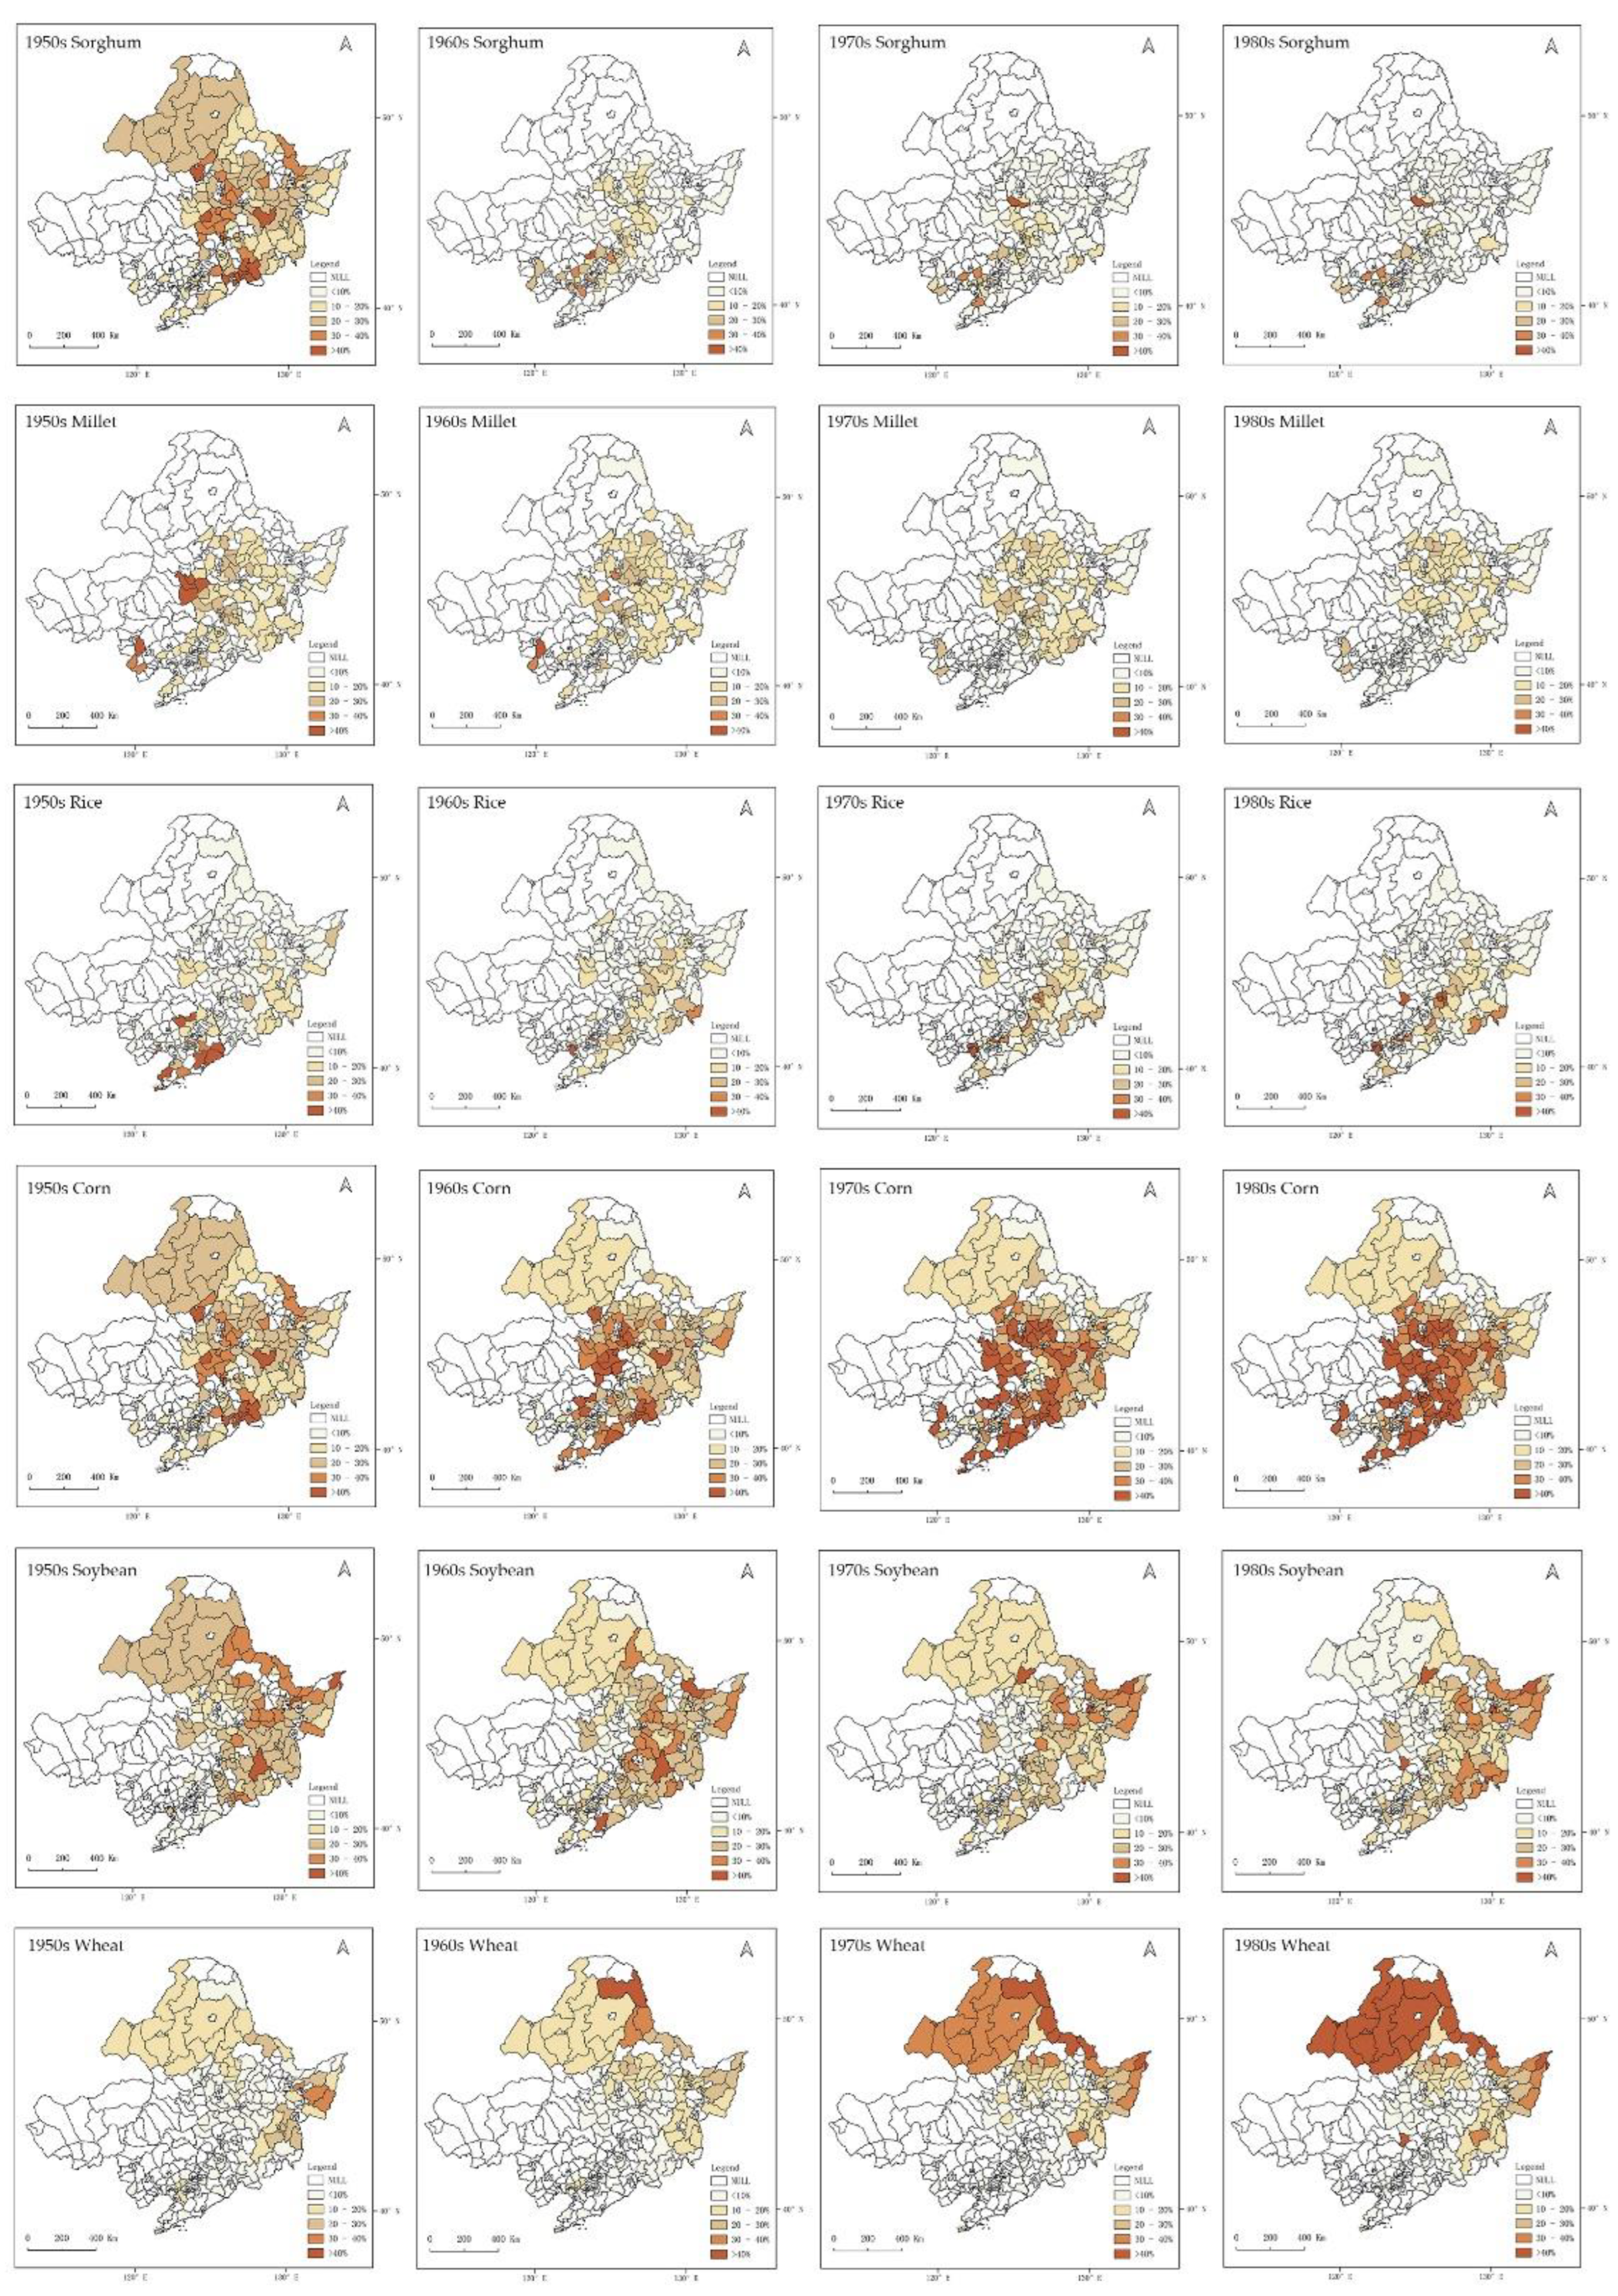
Figure 4.
Proportion of major crop planting area in Northeast China from the 1950s to the 1980s, with districts having over 20% (a) and over 30% (b) shown in the proportion chart. Explanation: The number of districts and counties with data records at the four time points is 138, 172, 177, and 178 respectively.
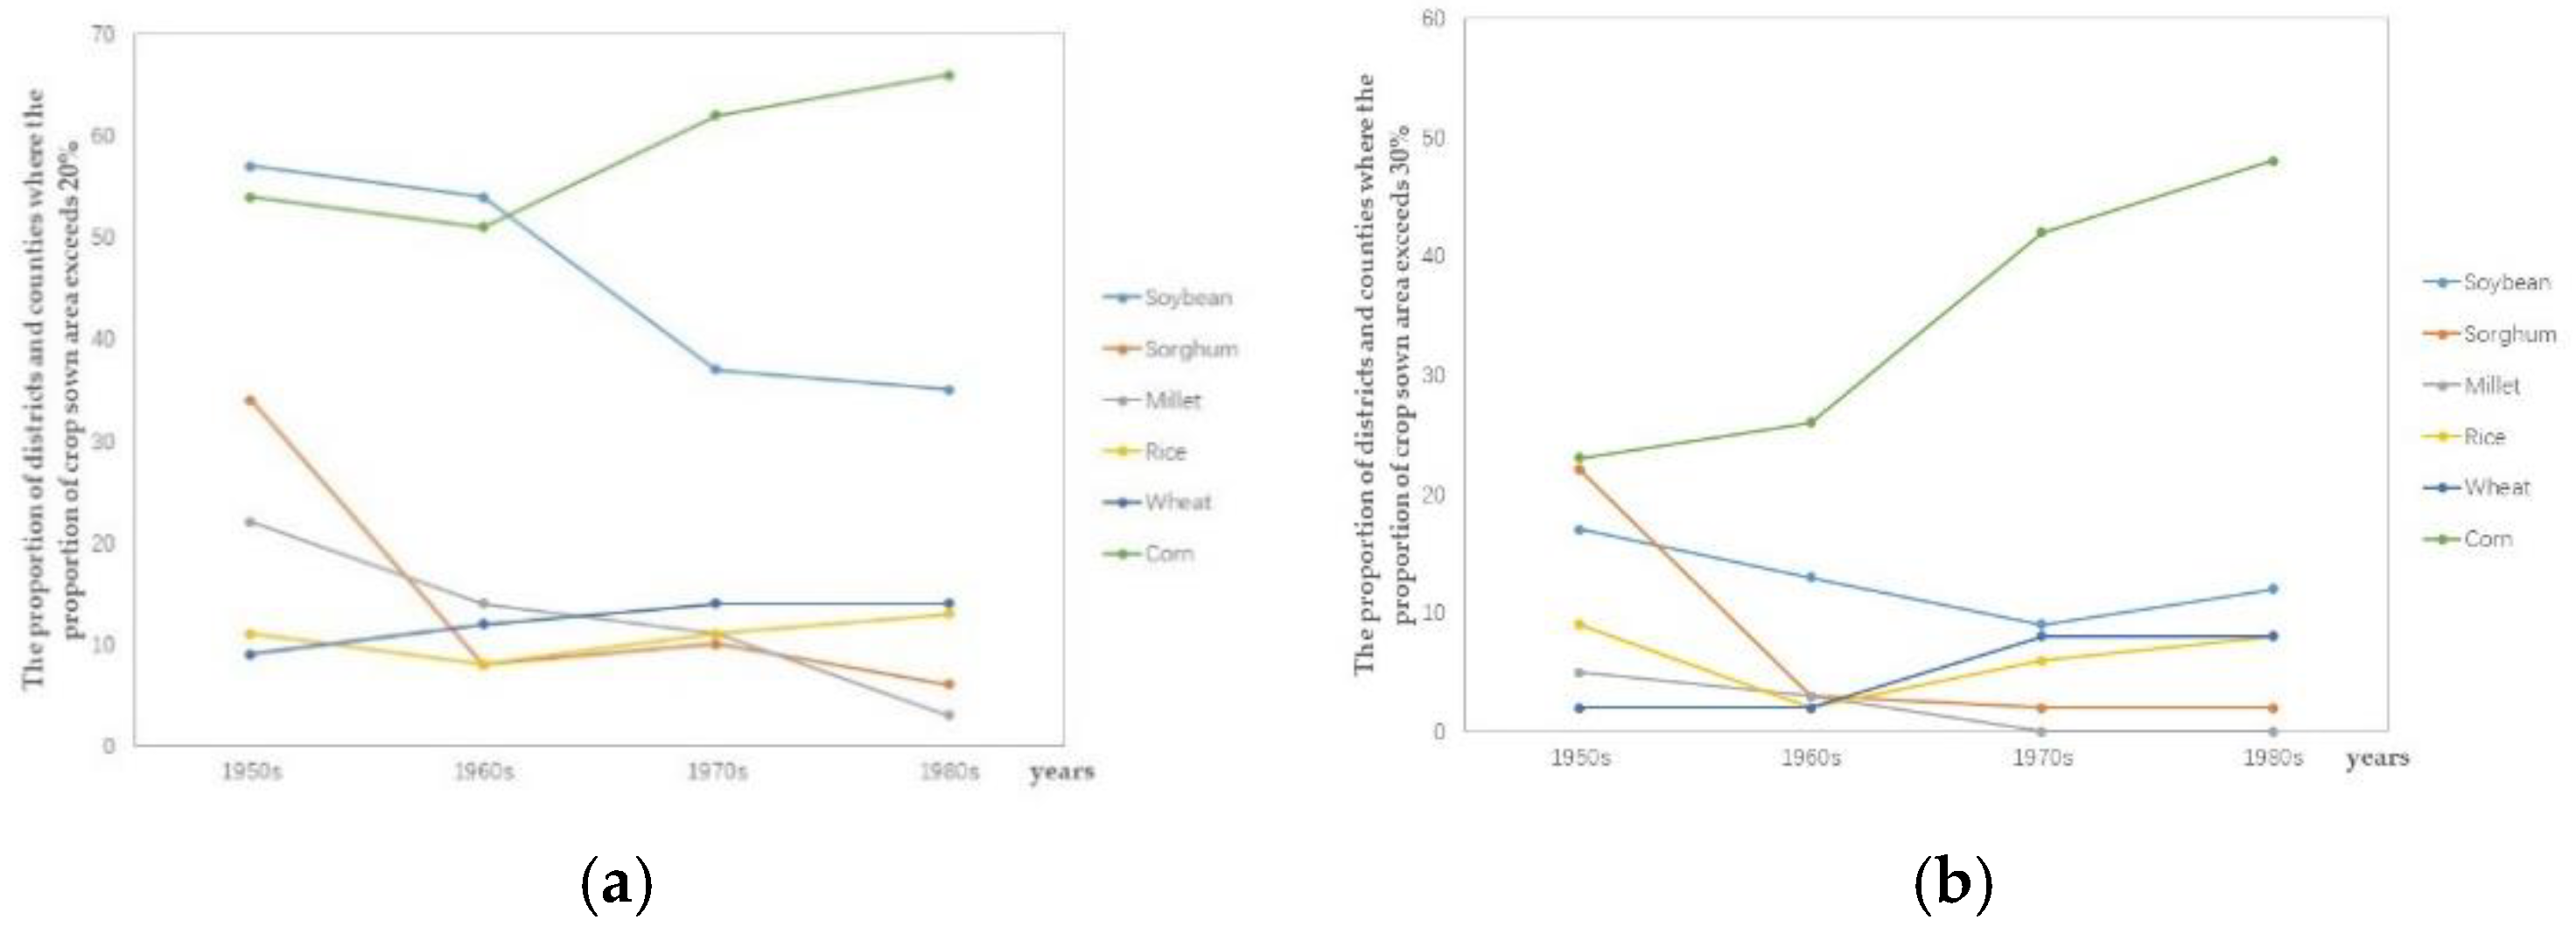
Figure 5.
Spatial Distribution of Crop Planting Structure Types in Northeast China from the 1950s to the 1980s.
Figure 5.
Spatial Distribution of Crop Planting Structure Types in Northeast China from the 1950s to the 1980s.
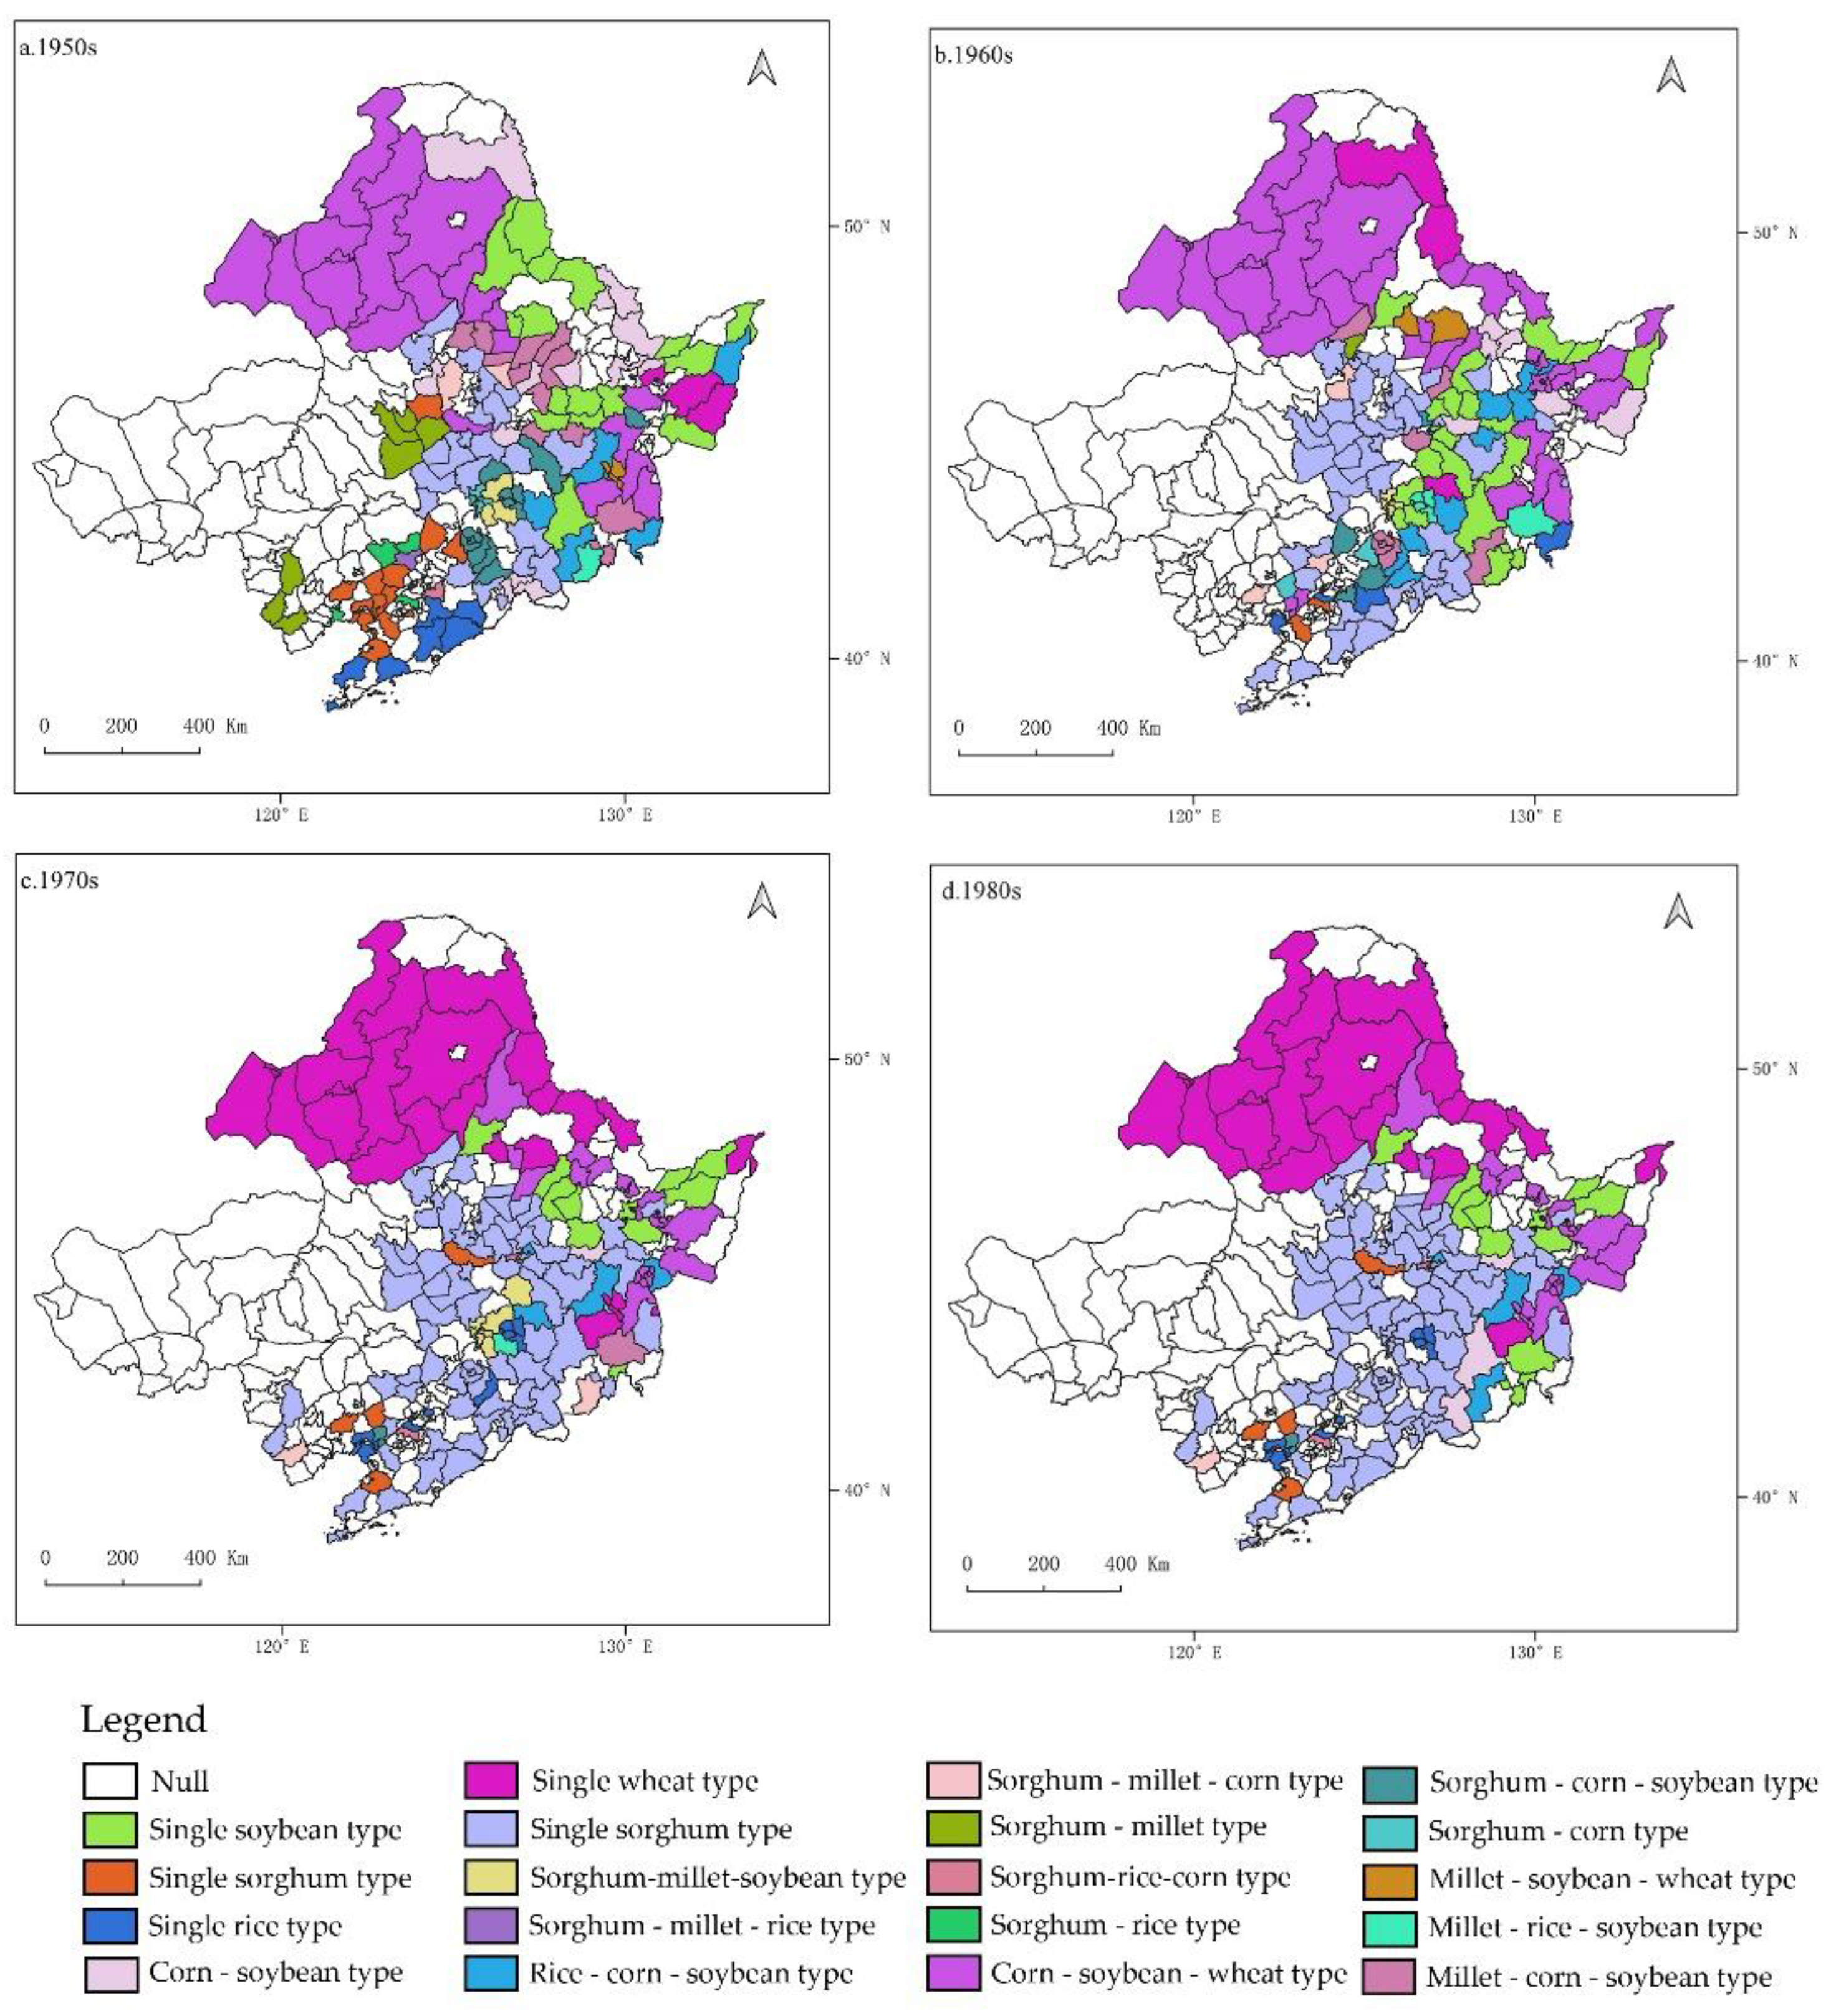
Figure 6.
Changes in Crop Planting Structure Types in Northeast China from the 1950s to the 1980s.
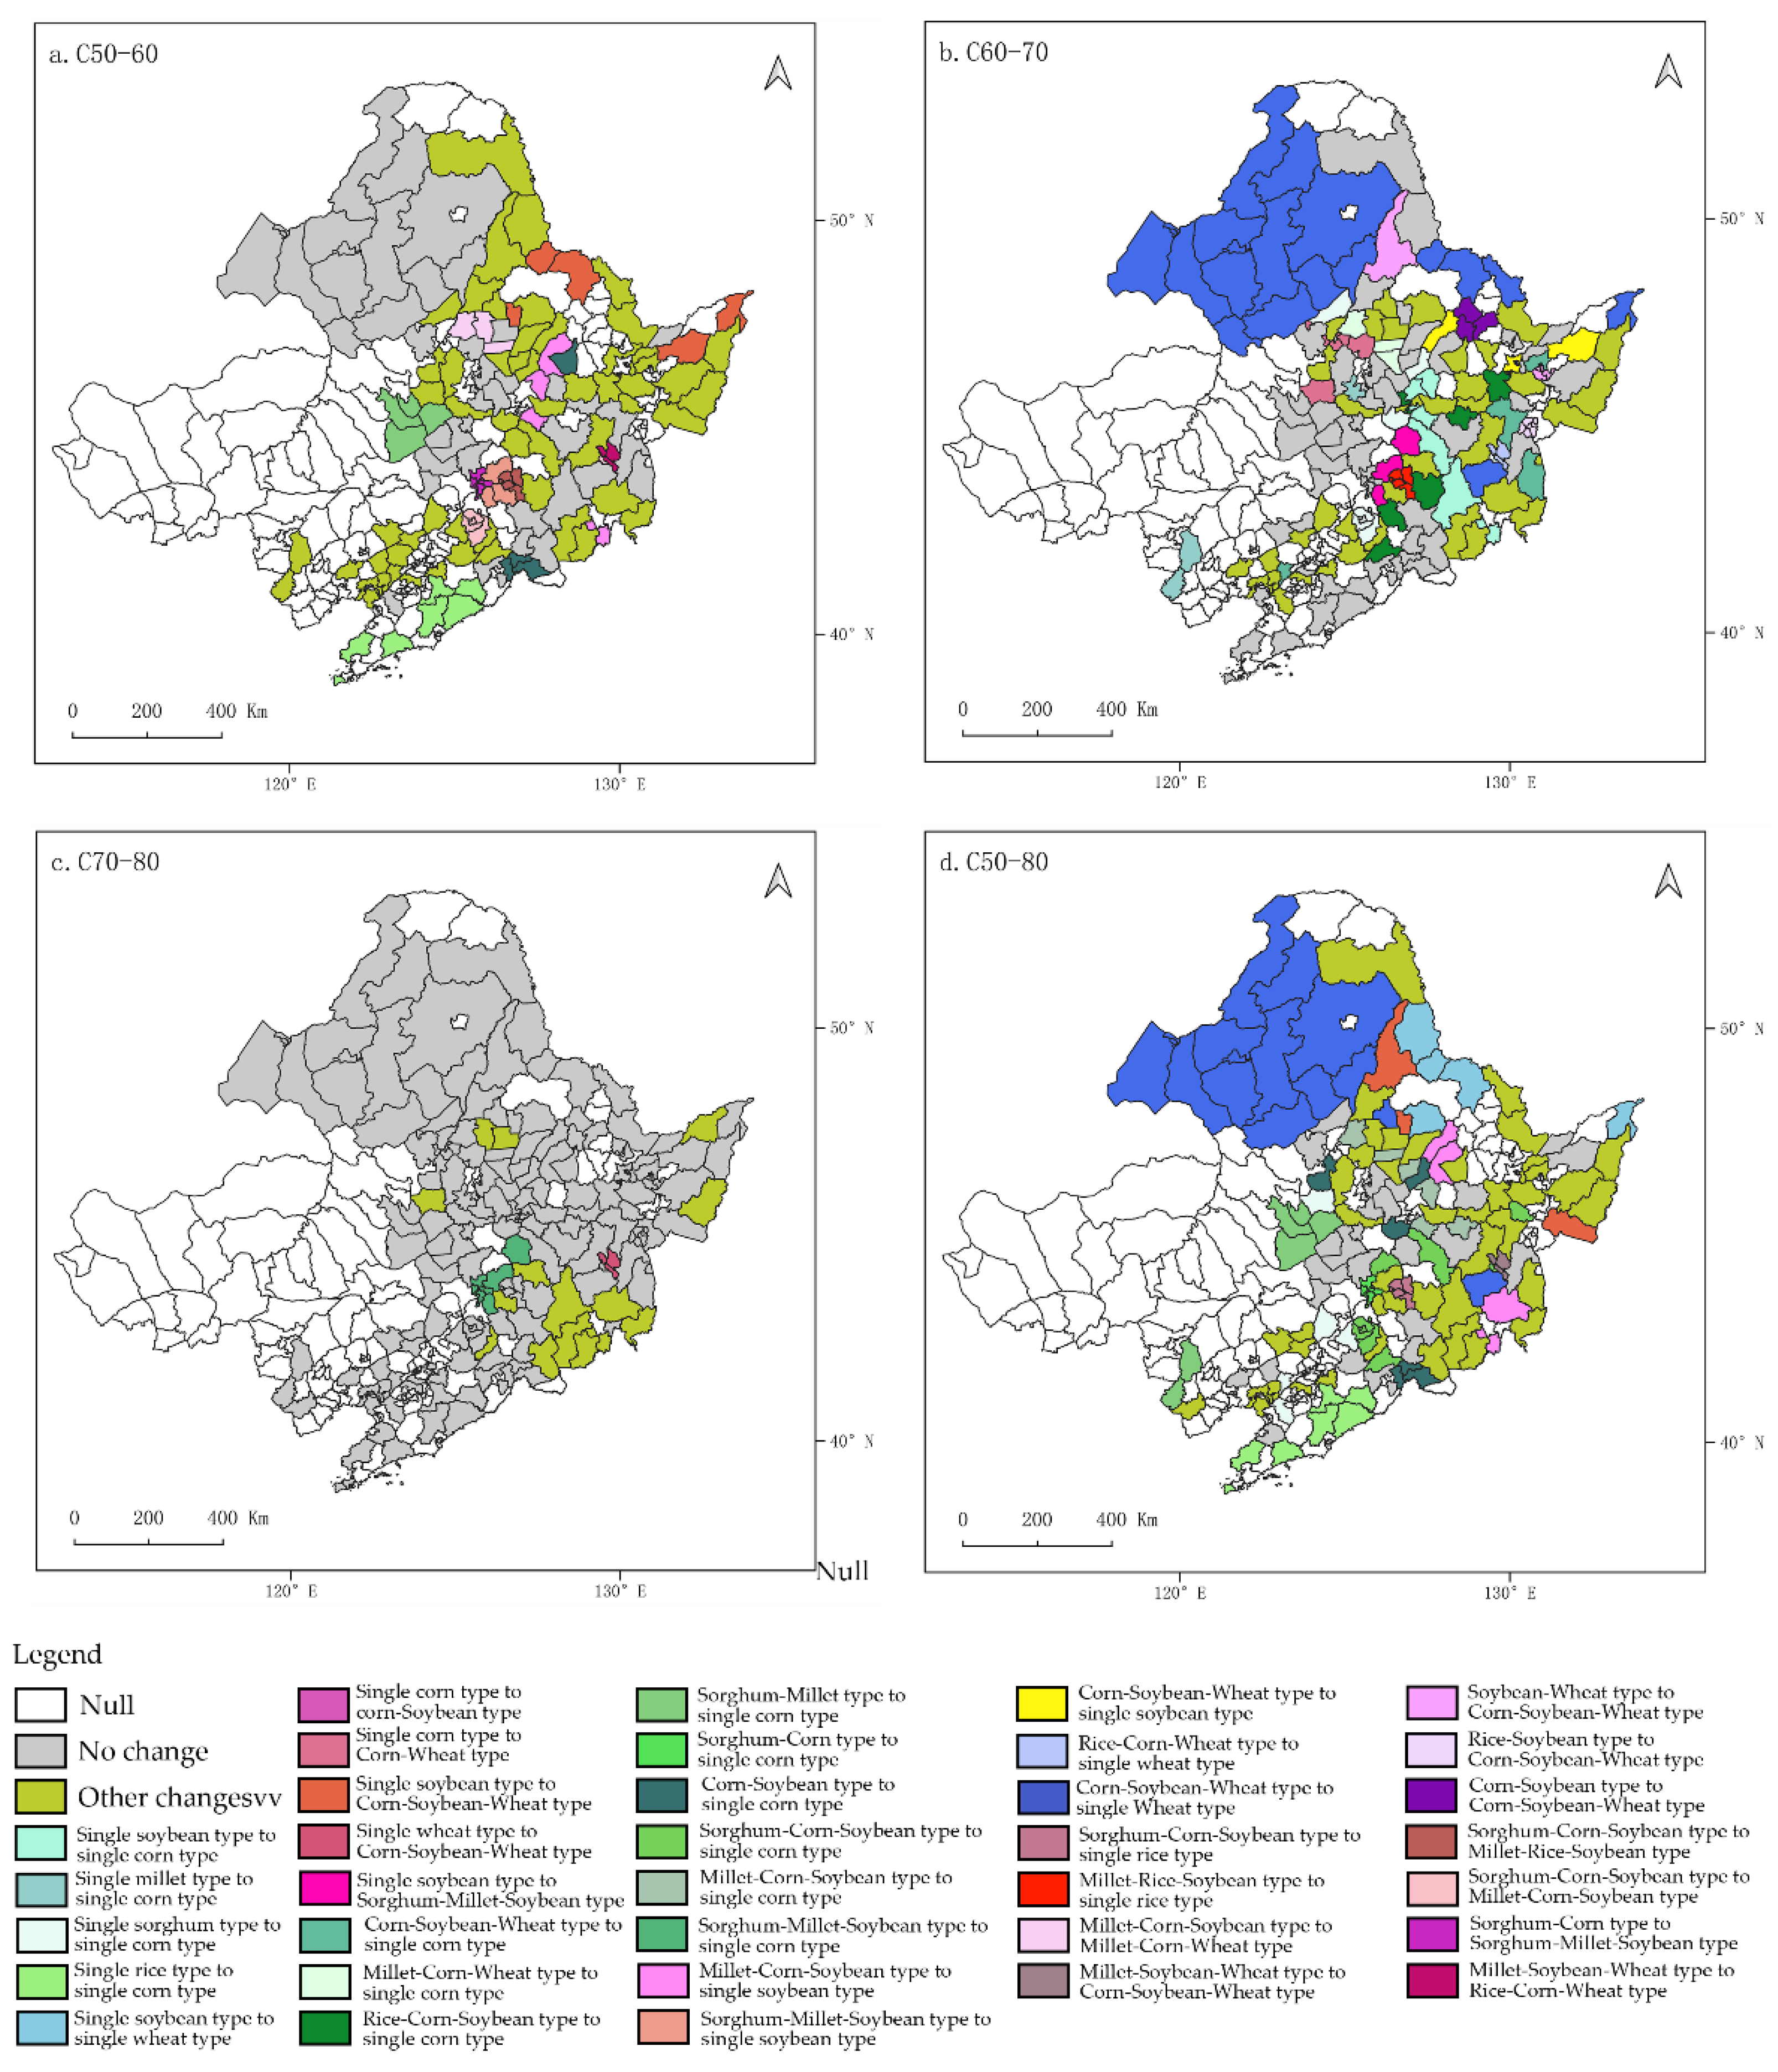
Figure 7.
Carbon Emissions of Major Crops in Northeast China from 1950 to 1980.
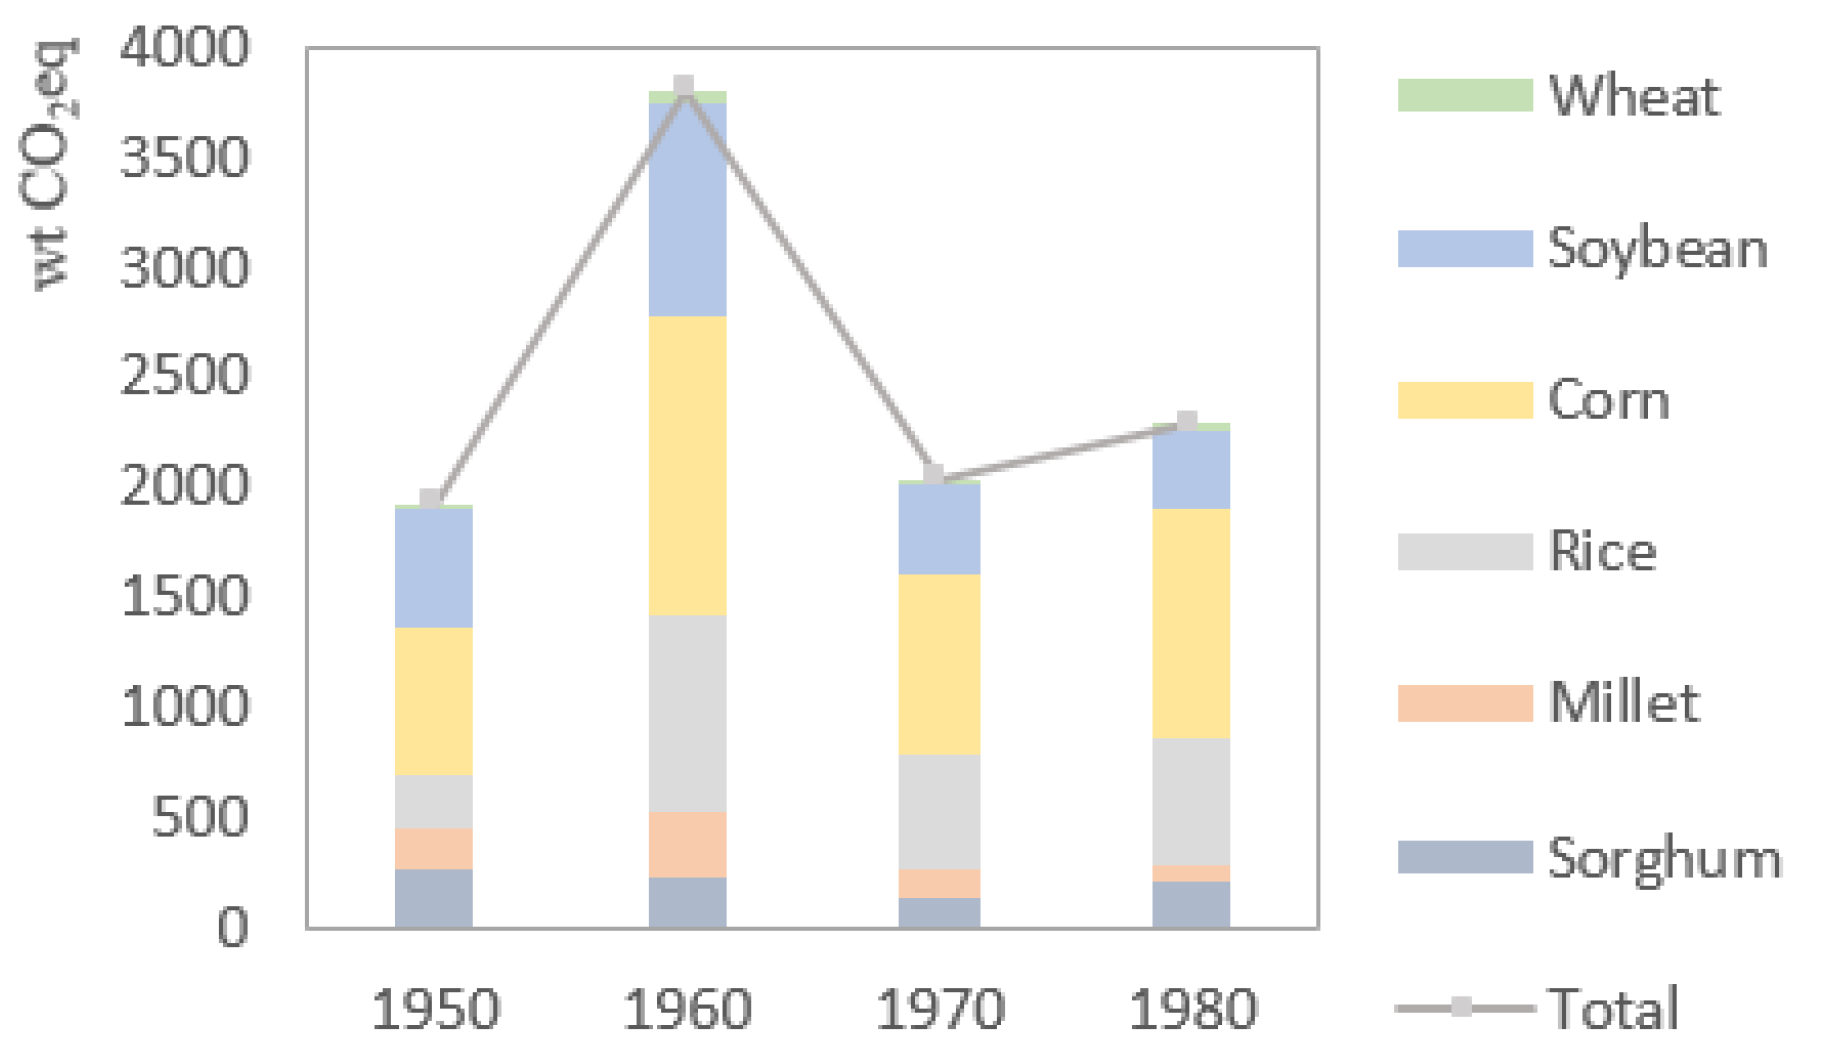
Figure 8.
Spatiotemporal Distribution Map of Crop Carbon Emissions( 1950-1980).*:A value of 0 indicates missing data.
Figure 8.
Spatiotemporal Distribution Map of Crop Carbon Emissions( 1950-1980).*:A value of 0 indicates missing data.
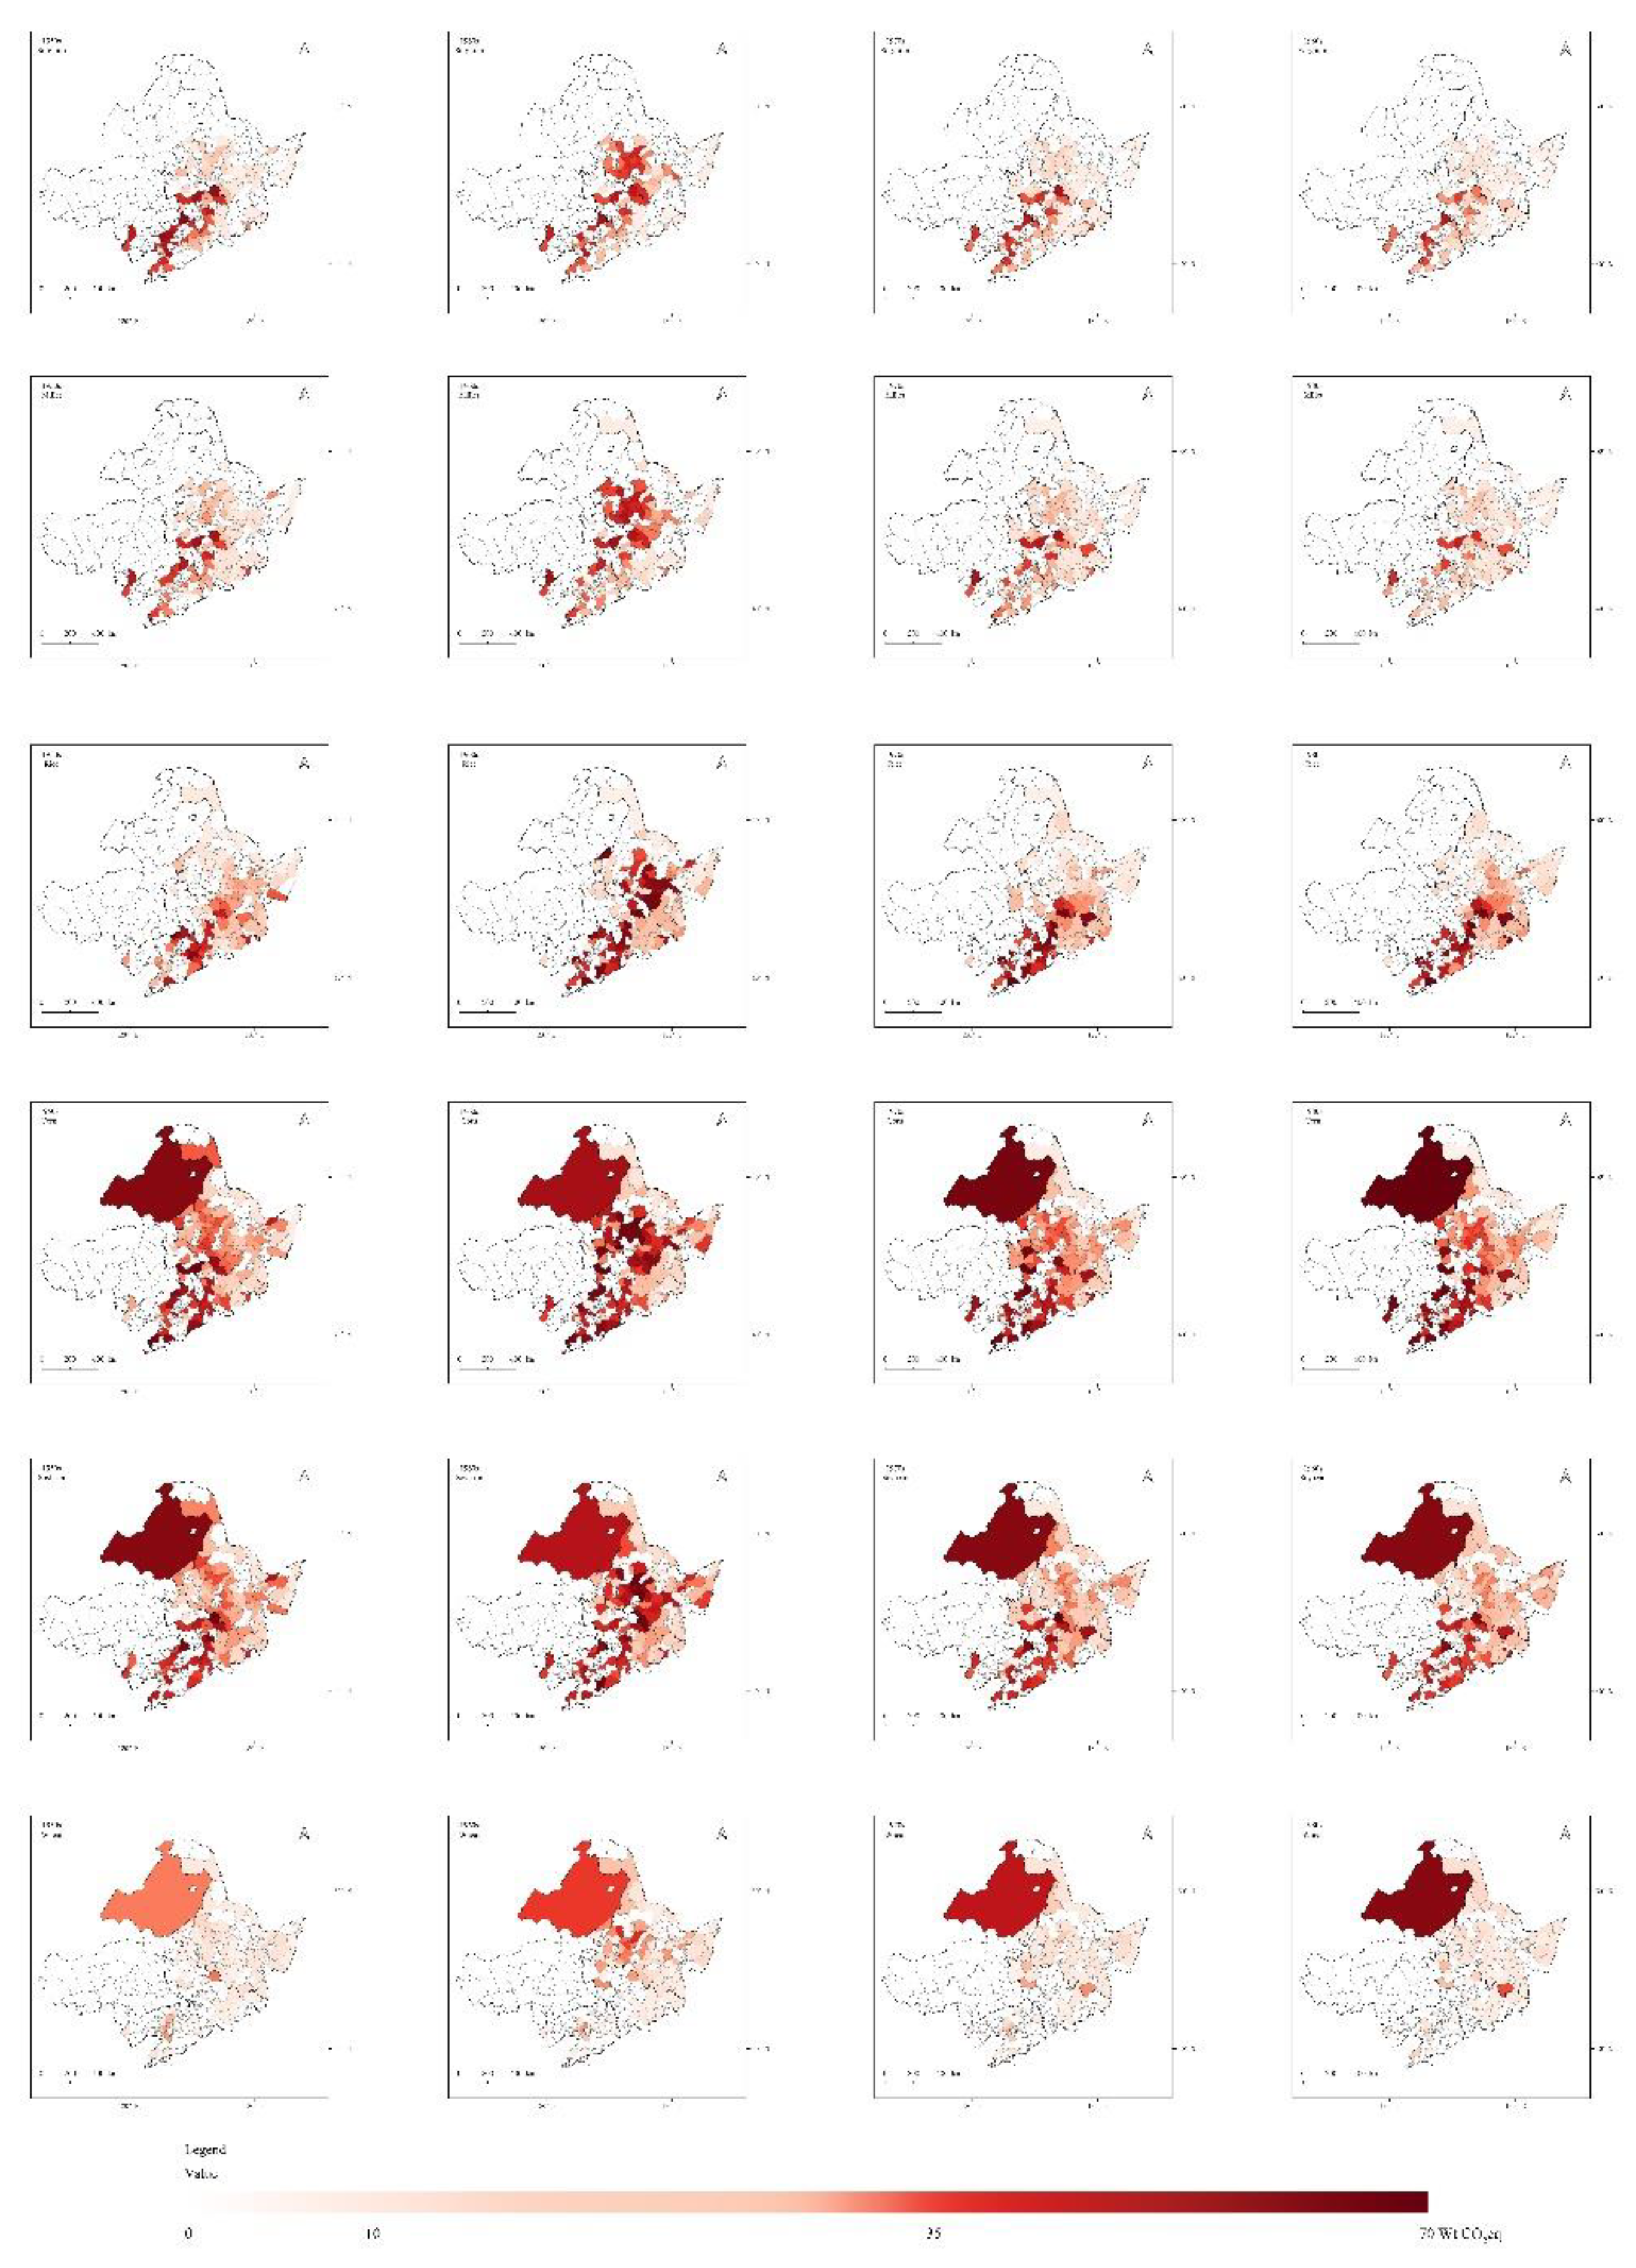
Figure 8.
Decadal effect (a) and cumulative effect (c) of agricultural carbon emission intensity, planting structure, and planting scale on agricultural carbon emissions; Decadal effect (b) and cumulative effect (d) of individual crop structures on agricultural carbon emissions.
Figure 8.
Decadal effect (a) and cumulative effect (c) of agricultural carbon emission intensity, planting structure, and planting scale on agricultural carbon emissions; Decadal effect (b) and cumulative effect (d) of individual crop structures on agricultural carbon emissions.
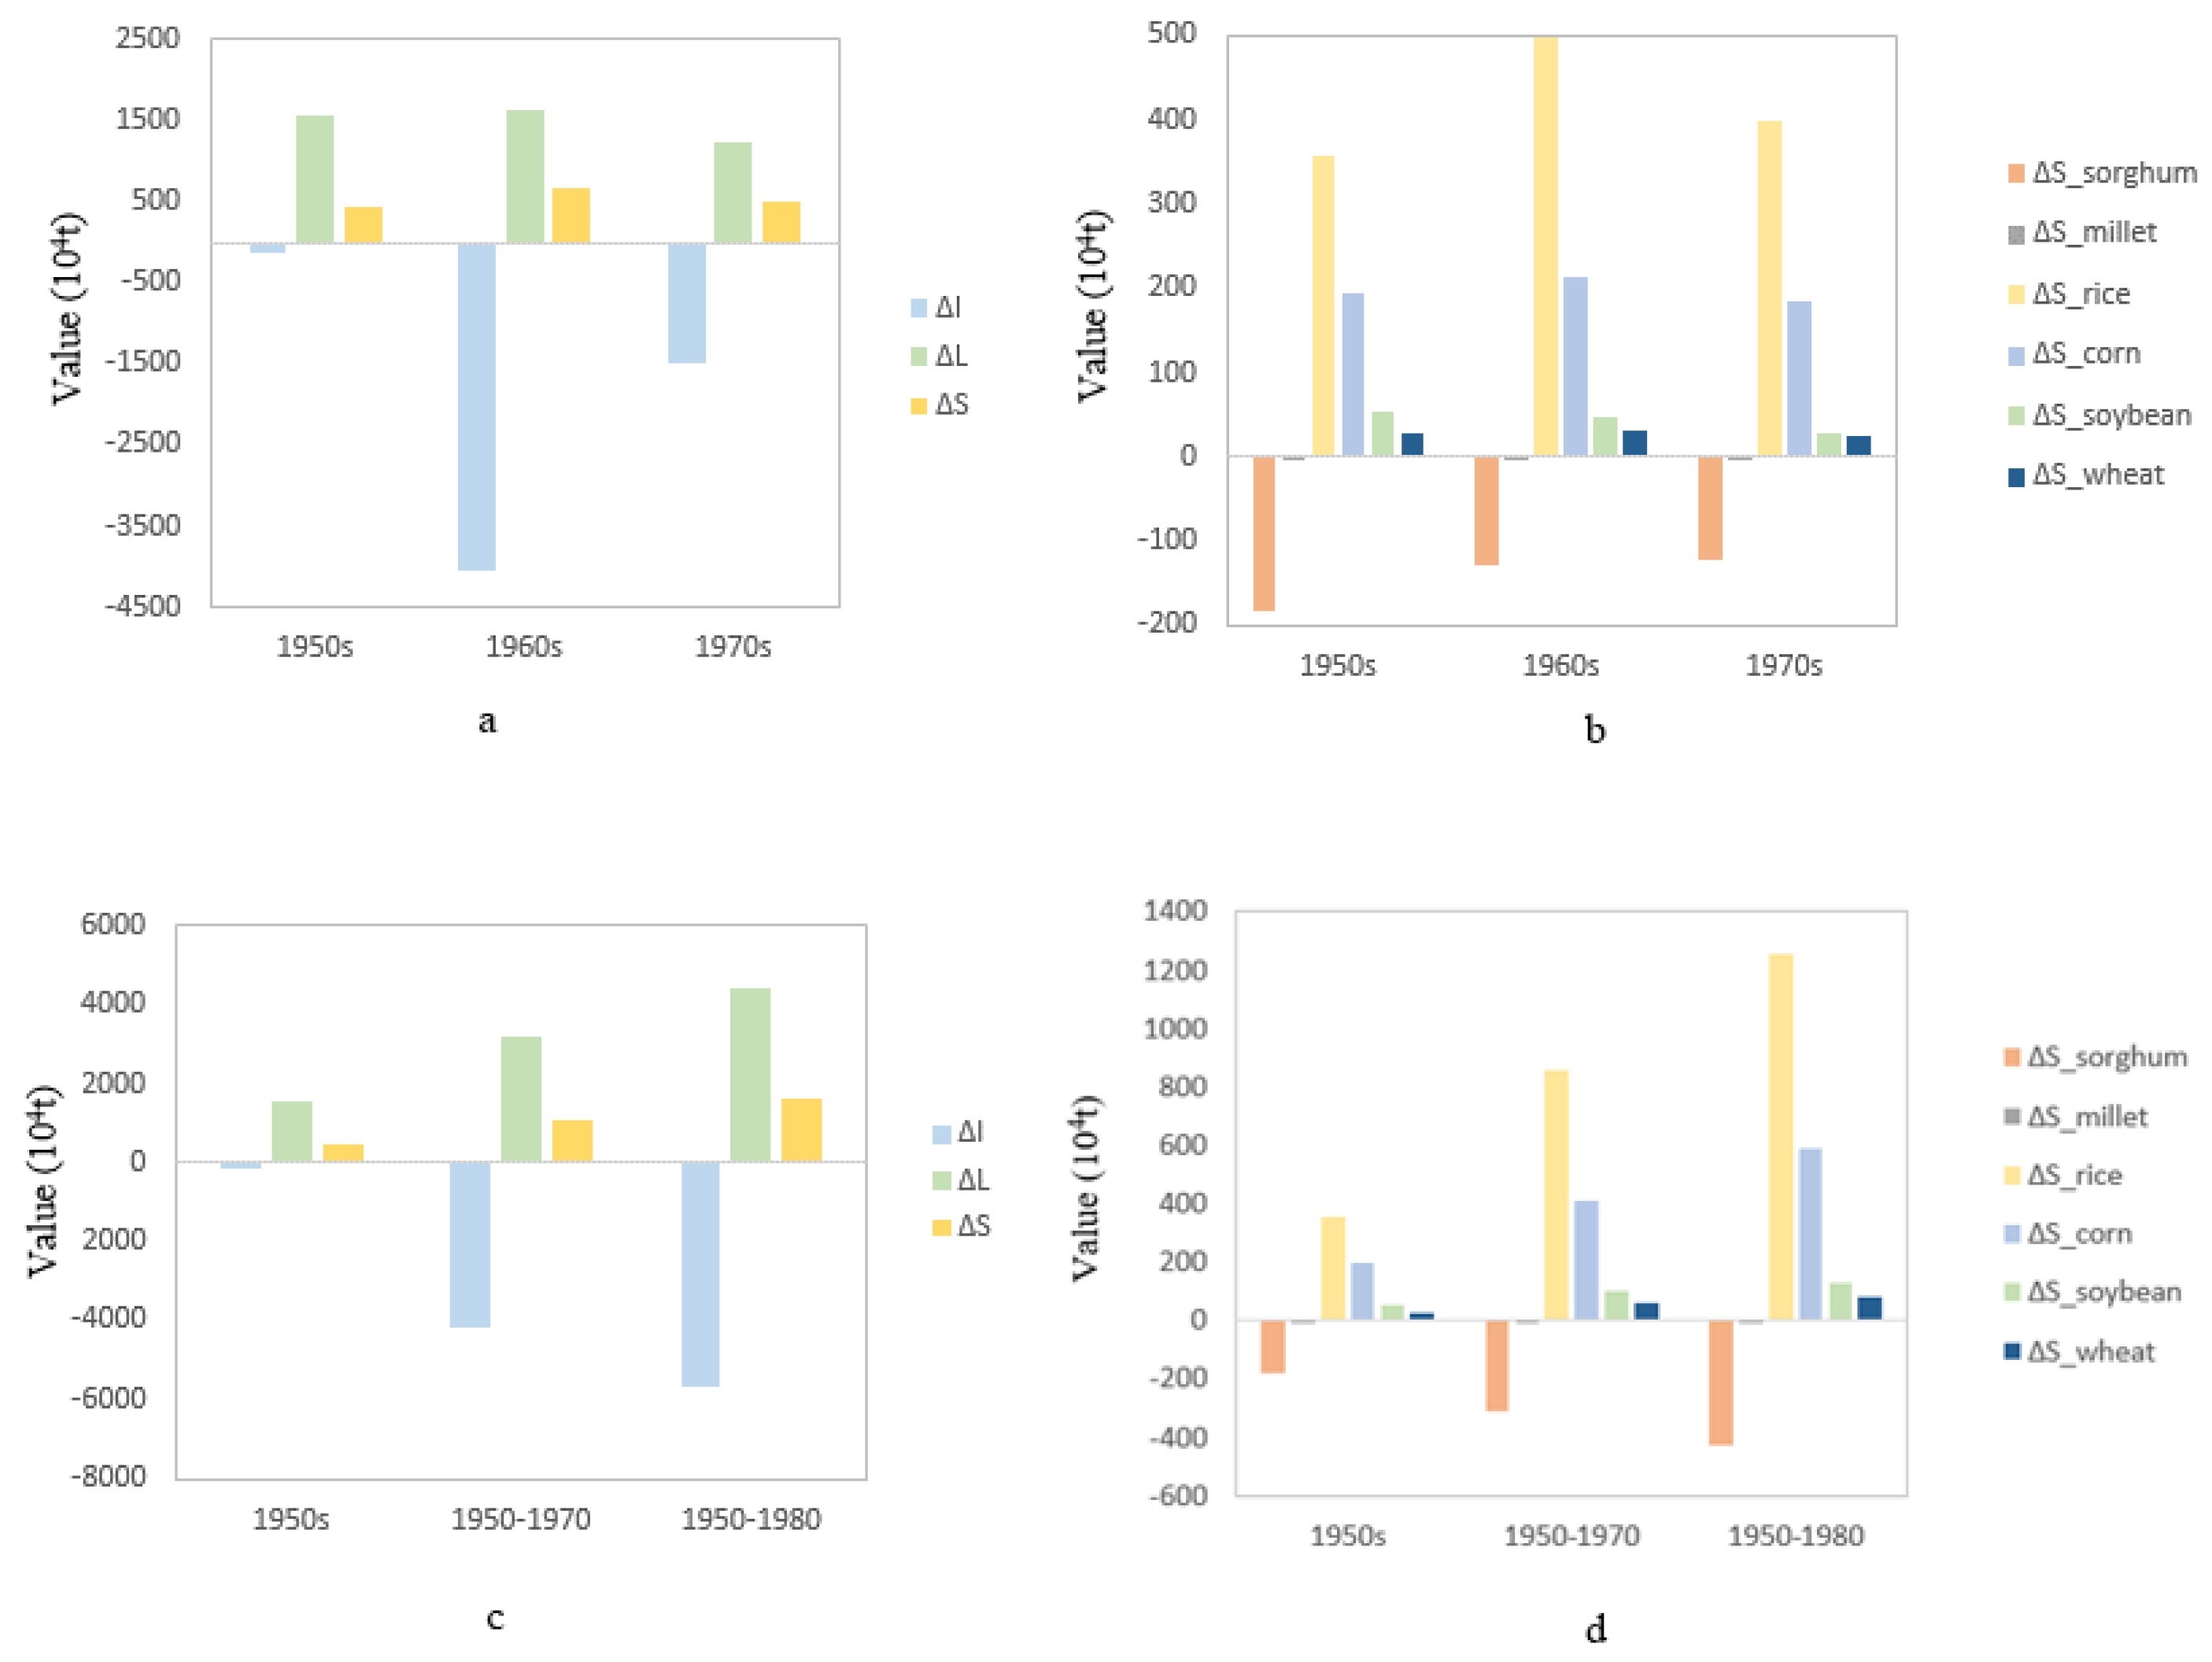
Table 2.
Statistics of different planting structure types in Northeast China from 1950s to 1980s.Unit:%
Table 2.
Statistics of different planting structure types in Northeast China from 1950s to 1980s.Unit:%
| Planting structure type | 1950s | 1960s | 1970s | 1980s | |||||||||||
| Dist. & Cnty. Count | Dist. & Cnty. Prop. | Ordering | Dist. & Cnty. Count | Dist. & Cnty. Prop. | Ordering | Dist. & Cnty. Count | Dist. & Cnty. Prop. | Ordering | Dist. & Cnty. Count | Dist. & Cnty. Prop. | Ordering | ||||
| Corn-soybean-wheat type | 25 | 15.9 | 1 | 43 | 22.4 | 2 | 29 | 14.9 | 2 | 33 | 16.8 | 2 | |||
| Single corn type | 21 | 13.4 | 2 | 47 | 24.5 | 1 | 76 | 39.0 | 1 | 84 | 42.9 | 1 | |||
| Single soybean type | 16 | 10.2 | 3 | 20 | 10.4 | 3 | 11 | 5.6 | 4 | 12 | 6.1 | 4 | |||
| Single sorghum type | 14 | 8.9 | 4 | 2 | 1.0 | 18 | 4 | 2.1 | 9 | 4 | 2.0 | 8 | |||
| Corn-soybean type | 13 | 8.3 | 5 | 6 | 3.1 | 6 | 1 | 0.5 | 14 | 3 | 1.5 | 10 | |||
| Sorghum-corn-soybean type | 13 | 8.3 | 6 | 3 | 1.6 | 14 | 1 | 0.5 | 17 | 1 | 0.5 | 17 | |||
| Millet-corn-soybean type | 12 | 7.6 | 7 | 9 | 4.7 | 5 | 2 | 1.0 | 11 | 1 | 0.5 | 14 | |||
| Single rice type | 8 | 5.1 | 8 | 5 | 2.6 | 8 | 10 | 5.1 | 5 | 9 | 4.6 | 5 | |||
| Sorghum-millet type | 7 | 4.5 | 9 | 1 | 0.5 | 21 | 0 | 0.0 | 27 | 0 | 0.0 | 27 | |||
| Sorghum-corn type | 5 | 3.2 | 10 | 2 | 1.0 | 19 | 0 | 0.0 | 25 | 0 | 0.0 | 25 | |||
*This table only lists the top 10 planting structure types by the proportion of districts and counties in each period; for details, see Appendix A 3.
Table 3.
Statistics of different planting structure types in Northeast China from 1950s to 1980s.
| 1950s-1960s | 1960s-1970s | 1970s-1980s | 1950s-1980s | ||||||||
| Type changes | Dist. & Cnty. Count | Prop. (%) | Type changes | Dist. & Cnty. Count | Prop. (%) | Type changes | Dist. & Cnty. Count | Prop. (%) | Type changes | Dist. & Cnty. Count | Prop. (%) |
| Single rice type to single corn type | 7 | 4.7 | Corn-Soybean-Wheat type to single wheat type | 20 | 10.6 | Sorghum-Millet-Soybean type to single corn type | 8 | 4.1 | Corn-Soybean-Wheat type to single wheat type | 16 | 10.9 |
| Sorghum-Corn type to Sorghum-Millet-Soybean type | 5 | 3.4 | Rice-Corn-Soybean type to single corn type | 8 | 4.3 | Single wheat type to Corn-Soybean-Wheat type | 3 | 1.6 | Sorghum-Corn-Soybean type to single corn type | 9 | 6.1 |
| Sorghum-Corn-Soybean type to Millet-Corn-Soybean type | 5 | 3.4 | Millet-Corn-Soybean type to single corn type | 8 | 4.3 | Other changes | 15 | 7.8 | Single rice type to single corn type | 7 | 4.8 |
| Single soybean type to Corn-Soybean-Wheat type | 5 | 3.4 | Single corn type to Corn-Wheat type | 7 | 3.7 | No change | 167 | 86.5 | Corn-Soybean type to single corn type | 6 | 4.1 |
| Corn-Soybean type to single corn type | 4 | 2.7 | Single soybean type to single corn type | 7 | 3.7 | Summary | 193 | 100 | Millet-Corn-Soybean type to single corn type | 6 | 4.1 |
* This table only lists the top 5 planting structure types by the proportion of districts and counties in each period; for details, see Appendix A 4.
Table 4.
Emission factors for major crops.
| Type |
Emission factor (kg(N2O)/hm2) |
Emission factor (g(CH4)/m2) |
Source |
| Rice | 0.24 | 8.93(Inner Mongolia)9.24(Liaoning)5.57(Jilin)8.31(Heilongjiang) | Wang Zhiping[30]; Min Jisheng[31]. |
| Corn | 2.53 | Huang Guohong[32]; Wang Shaobin[33]. | |
| Soybean | 2.29 | Huang Guohong; Yu Kewei[34]. | |
| Wheat | 0.4 | Yu Kewei[34]. | |
| Sorghum | 0.95 | Wang Zhiping[30]. | |
| Millet | 0.95 | Wang Zhiping[30]. |
Table 5.
Emission factors for major crops Unit: wt CO2eq; %.
| Type | 1950 | Race | 1960 | Race | 1970 | Race | 1980 | Race |
| Sorghum | 275.43 | 14.31 | 228.15 | 6.00 | 132.76 | 6.51 | 204.20 | 8.92 |
| Millet | 180.82 | 9.39 | 295.65 | 7.78 | 132.11 | 6.48 | 71.69 | 3.13 |
| Rice | 238.94 | 12.41 | 887.27 | 23.35 | 525.19 | 25.77 | 580.12 | 25.35 |
| Corn | 670.89 | 34.85 | 1372.63 | 36.13 | 820.90 | 40.28 | 1038.58 | 45.38 |
| Soybean | 540.82 | 28.09 | 951.68 | 25.05 | 400.26 | 19.64 | 354.17 | 15.47 |
| Wheat | 18.25 | 0.95 | 64.20 | 1.69 | 26.99 | 1.32 | 39.98 | 1.75 |
| Total | 1925.14 | 100.00 | 3799.58 | 100.00 | 2038.20 | 100.00 | 2288.75 | 100.00 |
Disclaimer/Publisher’s Note: The statements, opinions and data contained in all publications are solely those of the individual author(s) and contributor(s) and not of MDPI and/or the editor(s). MDPI and/or the editor(s) disclaim responsibility for any injury to people or property resulting from any ideas, methods, instructions or products referred to in the content. |
© 2026 by the authors. Licensee MDPI, Basel, Switzerland. This article is an open access article distributed under the terms and conditions of the Creative Commons Attribution (CC BY) license (http://creativecommons.org/licenses/by/4.0/).
Copyright: This open access article is published under a Creative Commons CC BY 4.0 license, which permit the free download, distribution, and reuse, provided that the author and preprint are cited in any reuse.


