
Submitted:
13 January 2026
Posted:
19 January 2026
You are already at the latest version
Abstract
The study investigated the effect of Green Information and Communication Technology Adoption (GICTA) on adolescents’ perceptual, attitudinal, and behavioral adaptations regarding environmental sustainability at the higher secondary level. To determine causal relationships, a true experimental randomized pretest–post-test design was adopted. The sample comprised 84 adolescent boys and girls from schools of Kolkata, representing Science, Commerce, and Arts streams by one-to-one matched process to get equivalent experimental and control groups. A standardized questionnaire was used to collect data that measured perception, attitude and behavioral adaptation across the three environmental dimensions, i.e. pollution, energy efficiency and waste management. The experimental group received a structured GICTA-based intervention across 16 instructional sessions, while the control group received no intervention. Analysis of data was carried out using t-tests, ANOVA and MANOVA which demonstrated that GICTA produced significant and substantial improvements in perceptual, attitudinal, and behavioral adaptations among adolescents, with large effect sizes in the experimental group and negligible changes in the control group. The intervention was gender-neutral, which effectively removed the pre-existing gender differences in all domains. Behavioral adaptation was found to have the highest gains, then attitudinal and perceptual changes. Stream-wise analysis showed that Science students had experienced the greatest gains, Commerce students had a neutral effect and Arts students had weaker results, with no significant interactions effects. Comprehensively, the results make GICTA an effective, comprehensive, and pedagogically viable method of instilling complete environmental adaptation in adolescents.
Keywords:
adolescent
; attitudinal adaptation
; behavioral adaptation
; Green ICT Adoption
; higher secondary education
; perceptual adaptatio
1. Introduction
During the last several decades, global warming and climate change have become one of the top priority issues of the world, as they have turned into one of the most urgent problems of civilization. Anthropogenic activities that result in the destruction of the environment ecosystem are mainly due to political, economical, and social factors worldwide. In recent years, it was reported that global temperatures have been rising at an alarming rate and that the temperature in the last two years has been over 0.4deg C (0.7deg F), which is a significant risk to the survival of humans and the geological stability (Abbass et al., 2022; Hansen et al., 2025). To overcome these international problems, we should use multidimensional strategies in a bid to guarantee continuity of sustainable global society. In this respect, Green ICT especially Sustainable Information and Communication Technology (ICT) has become one of the major concerns of the management. Green ICT is a collection of plans and projects that are designed to decrease the environmental footprint of technology (Suryawanshia & Narkhedeb, 2015). Due to the fast development of ICT, people have revolutionized their communication, learning and interaction with the world. Although these technologies have brought tremendous positive things in the lives of the people in the current times, they have also led to environmental degradation in the form of excessive consumption of energy, production of electronic waste and high carbon emissions. As such, the notion of Green ICT has developed as a green strategy to reduce the unfriendly environmental effects of digital technologies.
However, digital innovation is not enough to be sustainable using technology. In order to overcome these challenges, creativity, knowledge-based economies, and financial resources have to collaborate as the building blocks towards the realization of the objectives of the Sustainable Development Goals (SDGs) (United Nation, 2015). The concept of green ICT thus does not just focus on designing, using, maintaining, and disposing ICT devices and infrastructure in an environmentally friendly manner, but it also seeks to achieve efficiency and sustainability during the lifecycle of the product. With the ever-increasing adoption of digital technologies in the educational system of all countries, it is now necessary to emphasize on inculcating eco-friendly values and practices in young individuals at an early age (Parveen & Ramzan, 2024).
Teenagers (especially) are a very valuable target audience in promoting this agenda. Being active and frequent users of digital tools, their behaviors and attitudes to the digital world are a reflection of the current trends in the digital realm and affect the further patterns of using ICT. Promoting Green ICT among student teenagers is therefore an important step to a sustainable digital future. This includes creating sensitization regarding the environmental effects of technology, promoting responsible use practices, and incorporating concepts of sustainability in the learning programs of the school systems. Moreover, adolescence is a developmental period of cognitive, emotional and moral growth where people are more susceptible to incorporating values of environmental stewardship and social responsibility. Through the application of the latest concepts of Green ICT adoption to adolescents, the educators and policymakers can raise the generation of digitally literate, environmentally aware individuals who are able to make well-informed decisions that will have a positive impact on society and the planet. Although this matter has been gaining popularity, the study on the adoption of Green ICT adoption among adolescents is still insignificant, particularly in relation to gaining insights on their awareness, motivation, and the obstacles that prevent the adoption of sustainable technologies. This research will fill this gap by establishing the level in which adolescent students embrace Green ICT practices, factors that influence their behavioral engagement, and ways of increasing their participation in sustainable technological practices. In this question, the research aims to add to the larger goal of designing a digital education process to incorporate environmental sustainability and practice a digital ecological culture.
Information and Communication Technology (ICT) is an important means of different educational institutions that not only facilitates the educational teaching-learning process, but also the pedagogical innovation with the use of digital pedagogy. In this regard, the perception and attitudes of adolescents would form part of the era of Green Information and Communication Technology Adoption (GICTA). In the contemporary world, almost all people can hardly imagine their existence devoid of ICT, but, in case of the lack of awareness of sustainability, Green ICT adoption and adaptation cannot be actively introduced into all the spheres of everyday life. Thus, to be relevant and efficient in the long term, the promotion of the Green ICT practices is essential. The adoption and adaptation of green ICT is not only linked to environmental conservation but also involved in creation of healthy and sustainable ways of living. It is essential in ensuring that the environment remains clean and minimises the amount of carbon footprint. With the implementation of environmentally friendly technological decisions, people and organizations can greatly reduce carbon dioxide (CO2) emissions, which will contribute to a more clean and sustainable community (Yoshinov et al., 2023). Adoption of Green ICT among teens is an environmental requirement and it is also an educational obligation. It is a crucial attempt to reconcile the digital literacy with the ecological self-consciousness and conscience, so that the technological advancement could harmonize with the principles of sustainable development.
1.1. Review of Literature
Technological convergence has become a necessity that can no longer be ignored by the contemporary society. The fast-tracked implementation and the dynamic trends of technological incorporation have altered all the aspects of education and learning. The teaching-learning process is not an exception as the task of substituting traditional hard copies and paper-based resources with digital screens, tablets, and stylus pens continues to expand to all areas (UNESCO, 2023). Increased use of electronic devices is thus inevitable given the constantly increasing technologizing nature. Nonetheless, the dumping of the unexpired or outdated technological products without any consideration of the environmental issues endangers the environment significantly. Therefore, the implementation of green technologies has become an urgent step towards the preservation of the natural environment and welfare of society (Dwivedi et al., 2022; United Nations, 2024).
In this context, Green Information and Communication Technology Adoption (GICTA) has become a topic that attracts more attention within the context of educational systems. As an interdisciplinary construct, GICTA is based on theories in the field of psychology, education, environmental studies, and adaptation of technologies. Many studies have been conducted looking into the positive influence of adoption and adaptation of Green ICT in shaping the perceptions, attitudes and behaviours of learners towards sustainability. It is stressed in the research that the green ICT practices can help not only lead to the environmentally responsible behavior due to the right perceptions and attitudes but also help decrease the socio-economic disparities and increase social equity (Billanes & Accad, 2025; Booth et al., 2024; Wu et al., 2024). In turn, the youngsters who are exposed to GICTA have a higher probability of internalizing values that are based on sustainability, fairness, and inclusiveness (Adnyana et al., 2023; Kamarudin et al., 2021).
Researchers have been proposing the incorporation of green computing concepts in secondary education to teach the young generation to be nature-conscious. An example is that Ojo et al. (2019) have stressed the significance of teaching such concepts at the early stages of education to instil sustainable values. Converging evidence proves the point that with the help of energy-efficient hardware and software, as well as sustainable ICT practices, the carbon footprints of institutions may be decreased by a considerable margin, which in turn helps to make adolescents think of ICT as a way of ensuring sustainable development (Adhikari et al., 2023; Hariyani et al., 2025).
The attitudinal aspect of GICTA has received a lot of research attention with studies looking at the key success factors of introducing green ICT in higher education, especially in energy saving and ICT waste minimization (Suryawanshi & Narkhede, 2014; Yudatama et al., 2025). Teenagers exposed to these practices, will have a higher tendency of being more favourable to eco-responsibility and eco-innovation. Doncheva et al. (2024) also found out that the incorporation of ICT in environmentally oriented classes not only leads to cognitive but also to socio-emotional development and creativity, which highlights the holistic developmental prospects of green ICT in learning.
Behaviourally, the adoption and adaptation of ICT have been indicated to contribute to the improvement of the collaborative learning behavior and skill development (Dezdar, 2017; Su & Yang, 2023). According to Kuş (2025), a structured use of ICT enhances sustainable technological behavior, which leads to better academic performance in the end. Behavioral changes have been reported to present environmental and economic positive outcomes in the green ICT setting and influence adolescents to adopt sustainable values in their personal behavior (Salles et al., 2022; Thabit et al., 2021). However, the problems are still not eliminated, with certain research warning about adverse psychological effects caused by excessive screen time, stating the necessity to take a balance between ICT activity and the exposure to natural conditions (Chakraborty & Thakur, 2024; Oswald et al., 2020).
The gender has been cited as a major determinant of the perceptions, attitudes, and behavioural adoption of adolescents towards ICT. Evidence actually shows that teenage girls often cite lesser ICT competence as compared to boys, although the access level is similar. This difference is usually explained by the gendered patterns of ICT usage, with girls having more communication-oriented applications and boys more technical or instrumental applications (Qazi et al., 2022; Tobishima, 2020). Therefore, the issues of GICTA should be evaluated in a gendered perspective. Although, boys can exhibit confidence in the technical adaptation, the perception, attitudinal and behavioral reaction of girls is usually influenced by the collaborative and communicative engagement styles. So far environmental knowledge and sustainability attitudes are concerned, the gender differences are also found in different studies. Biancolin et al. (2025) and Zhao et al. (2021) discovered that women tend to be more ready than men to pay extra to obtain green belongings, indicating that the pro-environmental feelings of females are more powerful. This is in line with the results of Fraccascia et al. (2023) and Li et al. (2022) who found that females always display a greater amount of environmental concern. Nonetheless, the differences in gender regarding environmental knowledge, attitudes, and behavior can also be indicative of knowledge gaps, which at least partly account for the differences (Aguilar-Gomez et al., 2025; Ramstetter & Habersack, 2019). In contrast to these few studies revealed no significant gender differences with regard to the perception on sustainable ICT (Tariq & Khalid, 2023), this evidence might be associated by contextual factors such as institutional exposure along with experience, support from family, socio-economic background, and curriculum design. In addition, Borgonovi et al. (2023) and Lehner (2025) found out that the use of ICT among adolescents depends more on the factors of pressure to study, the academic stream, and learning experiences than on gender alone. These results indicate that the contextual setting, and not gender disparities by itself, influence the way adolescents embrace and adjust to ICT in the academic setting.
The relationship between the perceptions, attitudes and behaviors is a common theme in both ICT and environmental education studies. As Msambwa and Daniel (2024) pointed out, the motivation of students and teachers, their attitudinal orientation, and alignment of their curricula can all play a vital role in the successful integration of ICT in schools, as they all influence the development of initial perceptions into tangible actions. The empirical data also confirms that the motivational traits of the adolescents are effective predictors of their involvement to sustainable ICT adoption. Attitudinal reactions are affected by the perception of ICT usefulness and competency that, in their turn, lead to behavioral changes (Areepattamannil & Khine, 2017; Dalvi-Esfahani et al., 2020).
Also, the attitudes of adolescents towards sustainable ICT are reported to be more likely to correlate with reading skills and academic involvement than with the availability of technologies or access to infrastructures (Xiao et al., 2019; Yu et al., 2023). This highlights the fact that constructive attitudes towards sustainable ICT learning benefits, are propagated into positive attitudes towards learning, which lead to the active and responsible behaviour of use. Some articles emphasize that the attitude of users to green ICT plays a crucial role in the large-scale effectiveness that confirmation of the attitude is the basis of the further attitudinal and behavioral change (Cheng et al., 2024; Shahzad et al., 2022).
The exposure to education has also proved to play a significant role in the perception of sustainable development of students, with a demonstration of the reciprocal relationships between perception and attitude, and behavior (Abowardah et al., 2024; Lampropoulos et al., 2024). On the other hand, problematic ICT use may damage study time and academic achievement, and Diaz-Lopez et al. (2023) presented this information as an example of how negative perceptions or attitudes could lead to mal-adaptive behaviors. The result supports the necessity to develop responsible attitudes towards the use of ICT to get positive changes in behavior (González-Zamar et al., 2020; Mosca et al., 2024).
Although the studies of stream-specific GICTA are rare, the literature on the usage of ICT in different academic disciplines provides useful information. Students of other academic streams; science, commerce and arts which may differ significantly in their perceptions, adoption and adaptation to the green ICT practices. Research shows that despite the fact that green ICT adoption remains in its initial stages, a number of institutions of higher learning have demonstrated an impressive advancement in the application of sustainable ICT across the fields (Ajina et al., 2024; Podder & Samanta, 2022; Tudu & Mishra, 2025). Fors et al. (2024) and Shah (2023) noted that sustainable ICT means the difference between its effects on society and the environment, based on institutional practices and disciplinary orientations.
Nevertheless, there are several obstacles like environmental, financial, and organizational constraints affecting mass adoption and adaptation. These barriers might have a disproportionately high impact on some fields. Indicatively, science students, whose activity is often based on laboratory technologies, have various difficulties in using green ICT compared to students in the field of arts or commerce, who use ICT to conduct their tasks mainly as an analytical or communicative tool (Ramli et al., 2021; Soriano-Sánchez, 2025). Besides, innovation and market dynamics influence entrepreneurial intentions to adopt and adapt green ICT. Green ICT can also be perceived as a business or entrepreneurial opportunity by students in commerce, as a technical innovation by students in science, and as a socio-environmental implication by students in arts (Bhardwaj and Parveen, 2024; Kirchner-Krath et al., 2024; Ramli et al., 2025).
Majority of the past research has been inclined toward investigating the linear relations in the GICTA framework that research into, for example, the effect of perception affecting an attitude, or an attitude predicting behavior. On the same note, the gender-based knowledge gaps have been analyzed in their relationship to attitude towards green or sustainable ICT in everyday life and education. There are also a few studies which examine differences of perception between attitude and behavior by discipline, and in some few cases, a study on how discipline specific attitudes toward green ICT influence behavioral consequences. But, the literature available is not conclusive enough on how perception, attitude, and behavior are related in a cyclic manner in the context of sustainable or green ICT adoption, taking into consideration the gender and disciplinary differences together. In order to provide some answers to these gaps, the current study has followed an experimental research design to provide a solid empirical evidence which can be used by future researchers and policymakers. This research, by focusing on unexploited areas of intersection of knowledge including the relationship between perception, attitude, and behavior between gender and academic fields that will help to change the need-based curriculum design to ensure awareness of green ICT and responsible use. Therefore, the study is appropriate and relevant as it provides evidence based approaches to the improvement of innovative, sustainable technologies integration in the Indian education. Finally, it aims at enhancing learning outputs and creating a more future-ready and environmentally conscious learning environment using GICTA.
As to its novelty and originality, this research paper goes further in determining the cognitive, affective, and behavioral surfaces of adolescents in formal schooling. It also brings out personal and organizational aspects of green ICT adoption. Being experimental research, the study lays down a theoretical basis that interweaves the ideas of psychology, education, environmental research, and adaptation of technology. It highlights the importance of the perception, attitude, and behavior in influencing the adoption and adaptation process of sustainable information and communication technology in adolescents. Also, it explores the stream and gender difference to present the current situation of the perception and attitude of adolescent learners towards sustainable or green ICT adoption (GICTA). This multidimensional approach shows the effects of these factors on the evaluation judgment, affective reaction and the real action of learners in embracing the eco-friendly ICT tools. The study, by explaining these complicated interrelationships, does not only contribute to the theoretical development, but also gives practical information to educators, curriculum developers and policymakers. It highlights why the idea of creating digital responsibility, environmental consciousness, and technological innovation must go hand in hand to ensure that adolescents become long-term sustainable digital citizens with the ability to use the green ICT to not only improve themselves but the society too.
1.2. Objectives
- To study the effect of GICTA on adolescents’ perceptual, attitudinal and behavioural adaptations in higher secondary education.
- To investigate the effect of GICTA on adolescent boys’ and girls’ perceptual, attitudinal and behavioural adaptations in higher secondary education.
- To examine the effect of GICTA on adolescents’ perceptual, attitudinal and behavioral adaptations and their relationship in higher secondary education.
- To analyse stream and dimension wise effect of GICTA on adolescents’ perceptual, attitudinal and behavioral adaptations and their relationship in higher secondary education.
1.3. Hypotheses
H1: There would have significant effect of GICTA on adolescents’ perceptual adaptations in higher secondary education.
H02: No significant difference would be there on the effect of GICTA among adolescent boys’ and girls’ perceptual adaptations at higher secondary level.
H3: Effect of GICTA would significantly influence positive attitudinal adaptations among adolescents in higher secondary education.
H04: Adolescent boys and girls would have significantly no difference on attitudinal adaptation to the effect of GICTA at higher secondary education level.
H5: There would have significantly positive effect of GICTA on promoting desirable behavioral adaptations among adolescents in higher secondary education.
H06: Adolescent boys would be expected to demonstrate significantly no difference on behavioural adaptation to the effect of GICTA compared to adolescent girls in higher secondary education.
H07: Significance difference would not be there on the effect of GICTA regarding adolescents’ perceptual, attitudinal and behavioral adaptations and their relationship in higher secondary education.
H08: There would have no significant difference in the effect of GICTA on adolescents’ perceptual, attitudinal and behavioural adaptations across different streams (Science, Commerce, and Social Science) in higher secondary education.
H09: The effect of GICTA on the perceptual, attitudinal and behavioural adaptations of adolescents in the various dimension (pollution and digital, green energy efficiency and waste management) in higher secondary education, would not have been significantly different.
2. Methodology
2.1. Design
This study was based on a true experimental design, which is strict in studying the cause and effect linkage of variables. In particular, a randomized group pretest-post-test design was adapted in order to provide the validity and reliability of the results.
2.2. Sample
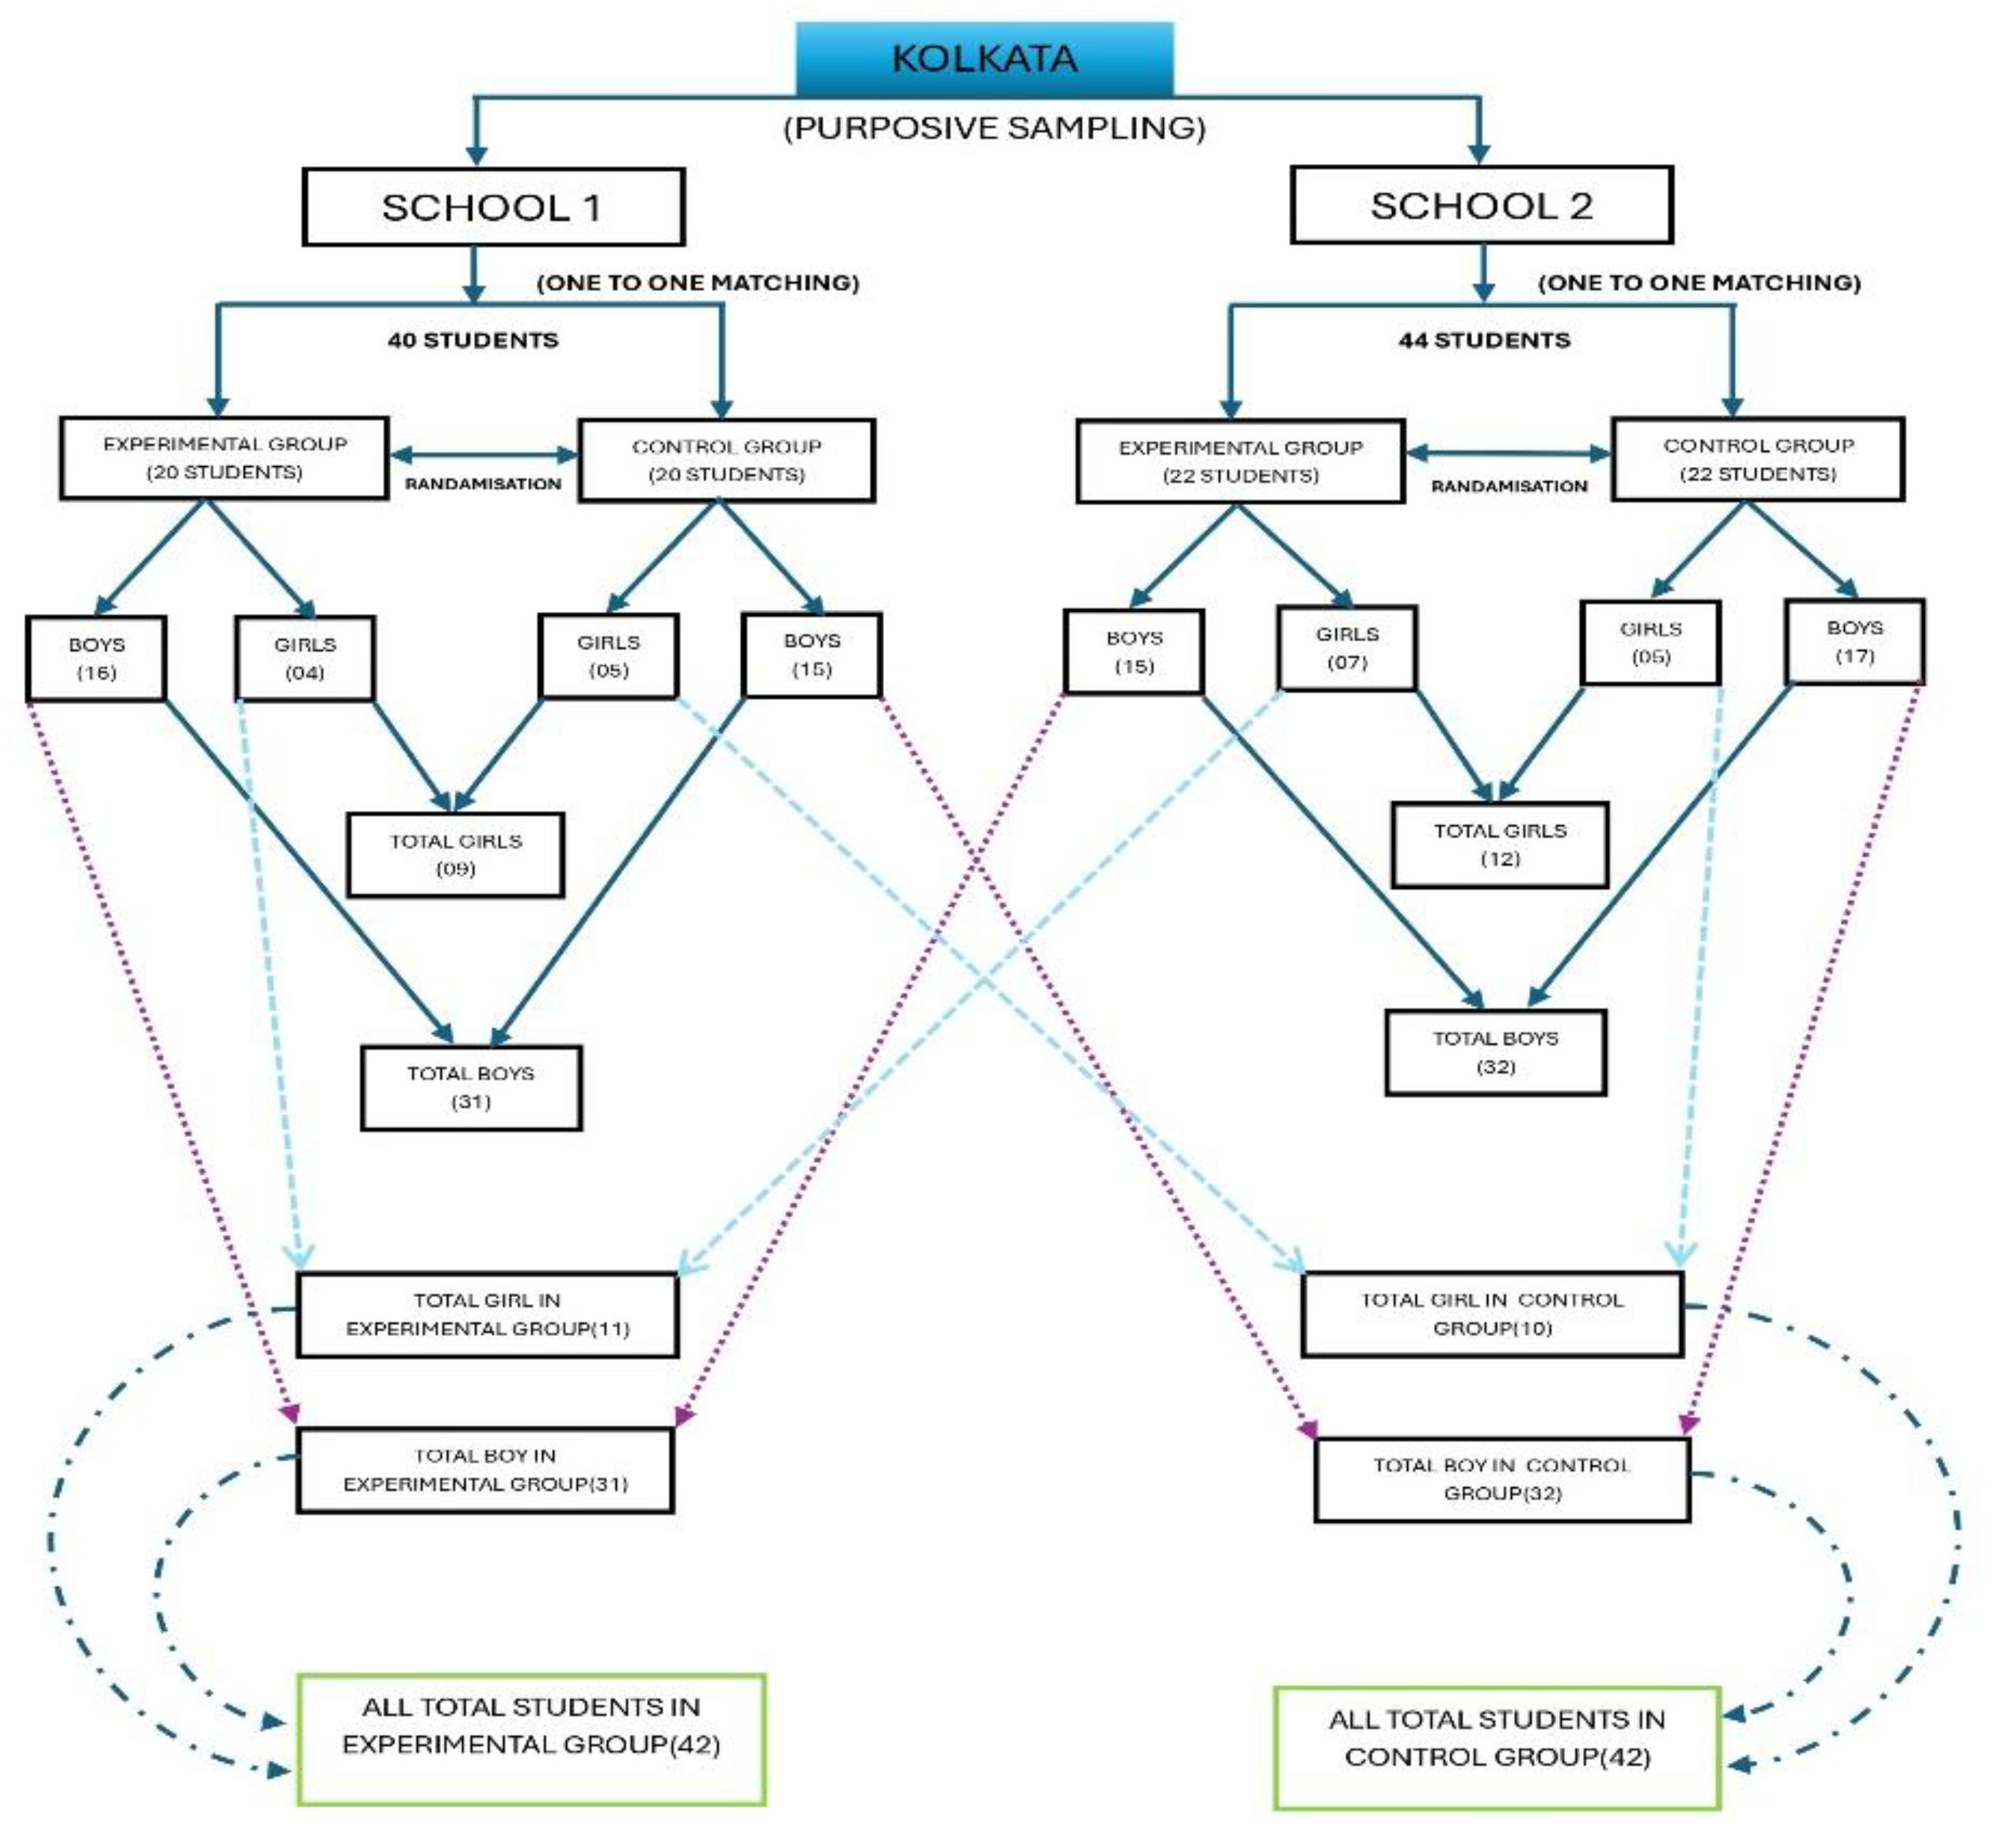
The research sample in this study was designed to involve boys and girls of two Higher Secondary (HS) schools in Kolkata which represented boys and girls in Science, Commerce, and Arts streams. The schools were sampled by purposive selection and all the participating students were in the government institutions located in the urban areas. In addition, the students themselves were urban locality dwellers. The research was conducted in an experimental design as the students were separated into experimental and control group according to their secondary examination marks which were matched in a 1:1 procedure. A total of 84 students were chosen and 42 students in the experimental group and 42 students in the control groups. The 1:1 matching (one to one) process was followed after which 40 students were sampled in the first school and 44 students in the second school. Both the control and experimental group had 20 students in the first school. The girls and boys in the experimental group were 16 and 4 respectively and the control group included 15 boys and 5 girls. In the second school, the groups were 22 students in each. The experimental group had 15 boys and 7 girls as compared to the control group which had 17 boys and five girls. The total number of the sample was 63 boys and 21 girls (63+21=84). In particular, the control group had 32 boys and 10 girls (32+10=42), and 31 boys and 11 girls in the experimental group (31+11=42).
Figure 1.
Sampling design.
2.3. Tools
A standardized questionnaire was formulated by measuring the perception, attitude, and behavioral adaptation of the students towards Green Information and Communication Technology Adoption (GICTA) on three broad dimensions, which include pollution and digital, green energy efficiency, and waste management. The tool was made up of 30 questions that were aimed at measuring the perception and the correct answers given were all counted as 3, whereas the wrong answers given were all counted as 0, which gave a maximum possible total of 90 (30×3). In order to capture variations in attitude that are relative to perception, 18 questions were formulated on 5 point Likert scale (Strongly Agree to Strongly Disagree) with a score ranging as 5, 4, 3, 2 and 1 giving a total mark of 90 (18×5). On the same note, behavioral adaptation towards GICTA was measured using 18 items developed based on a 5-point scale (Always to Never) scored on a scale of 5, 4, 3, 2, 1 with a maximum score of 90 (18×5). In positive statements, the scoring pattern was the same (5 to 1) but in negative statements, the scoring was reversed (1 to 5) (Alhassan et al., 2022; Joshi et al., 2015; Tanujaya et al., 2022). The 30, 18, and 18 items enabled the aspect of straightforward comparison of the three domains and dimensions. Therefore, a learner responding to each of the items in the correct way may obtain up to 270 marks (90+90+90). Five experts in the field were used to face and content validate the instrument. A Test-Retest procedure was done with 30 participants in order to achieve some reliability. The internal consistency was verified, with the Kuder–Richardson coefficient of perception at 0.81, Cronbach alpha at 0.77 and 0.83 in the attitude and behavioral adaptation, respectively (Wadkar et al., 2016).
2.4. Procedure of Data Collection
In the beginning, the students were not informed about Green ICT adoption. The initial data collection of both the control and experimental groups was based on the pre-test data which was collected without prior instructions or intervention. After this, the experimental group was specifically taught about adoption of Green ICT with 16 classes that took place during two months, each session lasted 45 min. These lessons were established on the basis of 16-day lesson plan and study materials prepared by the researchers. Conversely, the control group was not taught or informed on the subject at all, and was therefore not affected by the intervention. Following the two months of intervention, data were once again gathered again with the use of the same questionnaire in both groups but as post-test data. Thereby, the same tool was used two times, the first time it was used prior to any intervention in either group or the second time when teaching was given to the experimental group but none to the control group.
In this experimental research, a mixed sampling design was used comprehensively to achieve the sufficient representation of learners in the experimental and control groups. The sampling method was a mixture of probability and non-probability methods that brought balance between representativeness and accessibility. In order to collect data, two co-ed schools of higher secondary were purposely chosen out of the entire state of West Bengal. The choice was informed by the fact that all state-owned schools and those assisted by the government in the state have the same curriculum, instructional pattern and system of examination. Besides, there are relatively fewer schools of co-education in West Bengal that provide higher secondary education. The choice of two institutions in effect guaranteed uniformity in the learning setting, the quality of teachers and cooperation of administration, which all worked to minimize extraneous variables that might have affected the results of the experiment. The purposive sampling method was also beneficial in the aspect of ensuring that the researchers enjoyed easy accessibility to administer the intervention, as well as pre-test and post-test assessments in a controlled setting.
One-to-one matching of students in terms of previous academic achievements was considered to come up with the experimental and control groups after which students were randomized to form equal numbers in each group. As a result, each group consisted of 42 students, 31 and 11 boys and girls respectively, which comprised an experimental group and a control group, and a total of 84 students. Though, the achievement of the gender balance was impossible, the small difference was the result of matching and randomization process and the image of real gender distribution in co-educational higher secondary institutions in the state. The gender disparity is indicative of the long-standing socio-economic and cultural conditions affecting a reduced number of female enrolments in the upper secondary level, especially in Science and ICT-related courses in co-ed institutions (MHRD, 2022; UNESCO, 2023).
The collected data were interpreted with the help of the descriptive and inferential statistical methods. The mean and standard deviation were first computed to summarize the data and describe its general characteristics. The t-test was used to identify the importance of difference between the means of two variables, and the F-test (ANOVA) was applied to identify the difference in the means of more than two variables (Kumar, 2024; Mishra et al., 2019). Moreover, multiple relationship (MANOVA) was performed to investigate the nature and strength of the relationships between the investigated variables. These statistical methods were taken into consideration to ensure rigorous, valid, and comprehensive understanding of the research findings.
3. Result and Analysis
3.1. Hypothesis1
Table 1 shows the Mean (M), Standard Deviation (SD), Standard Error of the Mean (SEM), Number of Participants (N), Standard Error of the Difference (SED), Degrees of Freedom (df), t-values, and p-values that are obtained from the gain scores of perceptual adaptations according to the results of the pre-test and post-test between the experimental and the control groups towards GICTA.
In the case of the experimental group, the mean score of the perceptual adaptation experienced significantly improved between the pre-test (M1=46.79, SD1=17.85, SEM1=2.75) and the post-test (M2=71.64, SD2=8.25, SEM2=1.27) with a total number of 42 participants. The Standard Error of the Difference (SED) stood at 2.280 and calculated paired t-test value is equal to 10.9026 and p- value is less than 0.0001. The Degrees of Freedom (df=41) and the critical t values of the 0.05 (2.02) and 0.01 (2.69) significance levels are less than the t-value obtained and the result is located in the rejection region of the 95% and 99% confidence intervals. These results suggest that there is a most important enhancement of the perceptual adaptation after the use of GICTA. The p-value less than 0.0001 (p<0.05) also indicates a probability of less than 0.01% of Type I error (rejecting the null hypothesis incorrectly). Similarly, the corresponding effect size, determined with the help of Cohen’s d of dependent means, is massive (d≈1.68), which denotes a strong effect of the intervention. This significant effect is not only statistically significant, but also has substantial practical significance in showing that the treatment actually had meaningful learning effects on the participants. Thus, there is strong support of the hypothesis (H1) according to which the GICTA plays important positive role in the perceptual adjustments of adolescents in the experimental group.
Conversely, the control group experienced only significant increment in the mean perceptual change score after testing before (M1=47.71, SD1=17.43, SEM1=2.69) and after (M2=48.50, SD2=16.85, SEM2=2.60) of 42 participants. The calculated paired t-test value is 1.8606 with the SED of 0.422 and p-value of 0.0700. The observed t-value is lower than the critical t-values at the 0.05 (2.02) and the critical t-value at the 0.01 (2.69) level, therefore, the result is within the acceptance region of both the confidence levels. This shows that, the difference between the pre-test and post-test scores is not significant at the 5 percent level. The p-value 0.0700 (p>0.05) also indicates that there is a probability of a Type I error which is 7%, and it is more than the usual 5%. Similarly, the effect size that corresponds to this is also small (d≈0.19), which implies that there is no significant practical change that would be obtained, in the absence of the intervention. On the whole, the effect size comparison makes it obvious that the experimental treatment caused significant learning improvements, but the control group did not show any significant changes with time passing. Therefore, GICTA intervention led to statistically significant improvement in perceptual adaptation in the experimental group but not in the control group. The findings allow concluding that GICTA can significantly influence the improvement of the perceptual adaptations of adolescents.
Table 2 shows the post-test outcomes of the perceptual adaptation of the control group and experimental group. The experimental group has a higher score (M2=71.64) than the control group (M1=48.50). This is evidently improved among the students who were under GICTA intervention. The t-value (7.9924) is significantly larger than the critical t-values, at the 0.05 (1.99) and 0.01 (2.63) level of significance, which shows that the difference between the two groups is statistically significant. The p-value 0.0001 (p<0.05) ensures that the probability of such a difference to be as a result of chance is extremely small less than 0.01. The standard deviation of the experiment group (8.25) is considerably lower than the standard deviation in the experimental control group (16.85), which indicates that the results of the students in the experimental group were more predictive. The reliability of this comparison is also indicated by the standard error of difference (2.896). Correspondingly, the pooled standard deviation was used in calculating Cohen’s d to determine the size of the difference. The effect size that was obtained is large (d≈.74) which shows that the intervention was of strong and significant influence on the performance of the learners. This high effect size validates the fact that the performance of the experimental group students was significantly higher than that of the control group students, which identifies the treatment as practical. These findings are strong evidence of the hypothesis (H1) that GICTA produces a significant positive impact on the perceptual adaptations in adolescents. The guided and systematic learning process under GICTA probably contributed to better cognitive and perceptual abilities of the students resulting in higher and more consistent post-test scores. The results are very clear in that GICTA is a viable intervention to enhance perceptual adaptation in adolescents and the experimental group demonstrated significantly better results compared to the control group.
Figure 2 shows experimental group’s t-value (10.90) which lies far in the rejection region, and clearly indicating a highly significant result (p<0.0001), while the control group’s t-value (1.86) falls closer to the centre, showing no significant difference (p>0.07). Similarly, post-test for experimental and control group’s t value (7.9924) falls in the extreme tail of the distribution and this is representing a highly significant result (p<0.0001). Hence, GICTA intervention led to statistically significant enhancement of perceptual adaptation among the experimental group, but not the control group. The results show that GICTA is closely associated with positive effects on the improvement of perceptual adaptations of adolescents. On balance, the findings leave no doubt that GICTA is a successful intervention, as the participants of the experimental group showed significantly higher results in relation to the participants of the control group.
3.2. Hypothesis2
Table 3 shows the descriptive and inferential analysis of the post-test gain scores of perceptual adaptations in both the experimental and control group of adolescent boys and girls. The mean scores of girls (M1=71.73, SD1=9.14, SEM1=2.76, N1=11) and boys (M2=71.61, SD2=8.08, SEM2=1.45, N2=31) in the experimental group are nearly the same, which means there is not much gender-based variation after the GICTA intervention. The t-test of difference (SED=2.933) and the extremely small t-test (t=0.0390, df=40) and the large p=0.9691 (p>0.05) make it clear that the difference observed does not have any statistical significance. These values facilitate the rejection of the alternative hypothesis (H02) which ascertains that GICTA brings the same effects on the perceptual adaptation between boys and girls. The insignificant value of the effect size (Cohen’s d=0.01) also supports the fact that any difference between males and females’ adolescents is insignificant and can be explained by random differences and not by differences in responsiveness to the intervention. The variability of the group of girls is slightly higher because of its smaller size, but it is not significant in terms of the final result. Collectively, these findings indicate that GICTA is a gender-neutral teaching intervention, which facilitates equal amounts of perceptual adaptation between the two genders, and its efficacy/use in instruction in inclusive education.
Conversely, in the control group, there exists an obvious and statistically significant gender difference in the post-test scores of perceptual adaptations in the boys and girls when the affected grouped is compared with the GICTA. The female girls (M1=37.20, SD1=12.02, SEM1=3.80, N1=10) scored significantly lower than boys (M2=52.03, SD2=16.72, SEM2=2.96, N2=32), with the difference in means of 14.83 points. The t-test result without a paired t-value was t=2.5932 (df=40), and its p-value was 0.0132 which is lower than the level of 0.05 (p<0.05). Further evidence of the reliability of this gender gap is the standard error of the difference (SED=5.719) and the 95% confidence interval (3.27 to 26.39) which does not include zero. The effect size (Cohen’s d=1.02) is a large and significant gap between boys and girls indicating that boys naturally are better in perceptual adaptations when no intervention is used. Nevertheless, this strong gender difference is completely absent in the experimental group which means that GICTA is a levelling factor because it balances performance between genders. These results indicate that although there are natural differences in the control group, the GICTA intervention can successfully reduce these variations and indicate that it can be a strong, fair, and gender-neutral method of learning.
This Figure 3 demonstrates a normal probability curve where there are two t-values, one is t= 0.039 (p=0.9691) that is associated with the experimental group indicates nothing significant and another t=2.5932 (p=0.0132) that is with the control group shows statistically significant.
3.3. Hypothesis3
Table 4 shows the impact of the Green ICT Adoption (GICTA) on the attitudinal adaptations of adolescents based on the scores of pre-test and post-test scores of both experimental and control groups. The t-values are added to the table, and the p-values are obtained based on the gain scores. The mean score of the experimental group in the pre-test (M1=62.45, SD1=9.59, SEM1=1.48) demonstrates a significant increase in the post-test (M2=77.74, SD2=6.88, SEM2=1.06), which is calculated in terms of 42 respondents. The very high paired t-test value (t=10.9063) and the SED value (1.402) show that there is a strong statistically significant difference between the pre- and post-test scores p=0.0001. This p-value (p<0.05) is equivalent to a probability that is below 0.01 percent and that the result is very reliable. Given that the value of t-value is way above the critical t-values at the level of 0.05 (2.02) and at the level of 0.01 (2.69), the null hypothesis is rejected convincingly. On the other hand a critical measure of practical importance is effect size that relies on pooled SD and lastly the value of Cohen’s d is 1.83 that is insignificantly strong as it suggests that GICTA generated a substantive and significant increase in attitudinal adaptation. This is in line with the lower SD in the post-test, which indicates how participants were more consistent in the responses given after the intervention. The findings indicate that GICTA is a very powerful approach to enhancing the attitude of adolescents to the Green ICT practices.
In the control group, pre-test scores (M1=61.26, SD1=7.54, SEM1=1.16) indicate that there is a very small increase in post-test scores (M2=61.81, SD2=7.33, SEM2=1.13) based on the same number of participants. The SED (0.255) and the paired t-test value (t=2.1434) are used to show the level of a slight but significant improvement at the 0.05 level (p=0.0381). This t-value is very close to the critical value at the 95% confidence level (2.02) and it is below the critical value at the 99% (2.69) which indicates that the t-value is only reasonably significant. The probability of a Type I error at 3.81 percent is acceptable in educational research. Likewise, the Cohen’s d=0.07, which is insignificant effect size. This implies that the difference is statistically significant but the amount of change is too minimal and not material. The SD values (7.54 to 7.33) and SEM values (1.16 to 1.13) are similar and uniform in nature, and this aspect points out that it is due to the external factors like routine classroom exposure and not the GICTA-specific intervention.
The critical insights of these two groups, so far as is concerned, are shown to be improved in large, meaningful, and highly significant (d=1.83) by the experimental group as opposed to minimal and statistically insignificant improvement (d=0.07) by the control group. This is a significant contrast that creates the dominance of the structured GICTA intervention. The fact that the experimental group gained significantly (15.29 points) in comparison with the control group (0.55 points) proves that attitudinal adaptations are neither the consequence of natural evolution nor the accidental exposure but the direct consequence of GICTA treatment. In line with this, SD reduction in the experimental group and victims of stable SD in the control group also point to the fact that GICTA did not only raise the attitudes but also established a more consistent and unified positive change across the participants. The hypothesis (H3), therefore, is highly acceptable: GICTA plays a considerable and practically useful role in attitudinal adaptations of adolescents in higher secondary school.
Table 5 measures the impact of GICTA on the attitudinal adaptations of adolescents (H3). The experimental group (post-test M2=77.74, SD2= 6.88, SEM2=1.06) scored significantly higher than the control group (M1=61.81, SD1=7.33, SEM1=1.13) with an equal number of respondents (N= 42 each; total N=84). The SED=1.551 and the calculated t=10.2697 for 82 df, which is well above the critical t-values at the 0.05 (1.99) and 0.01 (2.63) significance levels, puts the result well within the rejection region. The p-value of less than 0.0001 is less than a 0.01 (p<0.05) probability of Type I error and the difference between groups is highly significant. The average difference of 15.93 points indicates the high treatment effect. As pooled SD=7.11 there is a calculated Cohen’s d=2.24, which is a very large effect size. This outcome is strongly in favour of H3 and indicative that GICTA has substantial and significant effects in attitudinal adaptation, where the experimental group exhibits significantly better positive attitudinal results compared to the control group.
The graph in Figure 4 shows a comparison between experimental and control groups in terms of normal score distribution during pre-test and post-test. The post-test experimental curve moves significantly to the right, which indicates high improvements whereas the control group has slight variation. Vertical markers indicate three significance tests, and each of the tests has statistically meaningful differences, the largest increase is reported in the experimental group.
3.4. Hypothesis4
Table 6 shows the gain scores of the attitudinal adaptations between boys and girls in accordance with the post-test results of the experimental and control groups subjected to GICTA. The null hypothesis (H04) tested in the analysis is that there would be no significant difference in adolescent boys and girls in their attitudinal adaptation after GICTA intervention. Mean attitudinal adaptation in the experimental group (M1=79.36, SD1=5.32, SEM1=1.60) is a little bit high compared to the boy students (M2=77.16, SD2=7.34, SEM2=1.32) with a total sample of 42 students (11 girls and 31 boys). The difference is minimal though the girls were rated slightly higher. To establish the significance of such difference, the t-value of 0.9108 and standard error of difference (SED=2.418) at a df=40 is calculated and this results in a non-significant p-value of 0.3678 (p>0.05). The t value obtained is quite small relative to critical values when the t is compared with the critical values in the 0.05 (2.02) and 0.01 (2.71) levels. The effect size, calculated using Cohen’s d, is 0.30, indicating a small effect. This small effect size signifies that gender accounts for only a minimal proportion of variance in attitudinal adaptation scores. Therefore, the average deviation between boys and girls is not significant to discard the null hypothesis. Practically speaking, there is no data suggesting that GICTA has a different effect on the attitudinal adaptation of boys and girls. The fact that the variability among girls (SD=5.32) is slightly lower than that of boys (SD=7.34) could be explained by the fact that the sample sizes are different, but it does not alter the result. In general, the evidence shows that GICTA is a gender-neutral intervention, which facilitates positive attitudinal adaptation in both boys and girls that were involved in the experimental group.
Conversely, the statistical analysis of the results of post-test scores shows that there is a statistically significant gender difference. The mean score (M2=62.97, SD2=7.52) of boys is higher than of girls (M1=55.80, SD1=4.52) which led to a gap of 7.17 points. The independent-samples value of 2.8439 with p of 0.0070 (p<0.05) obtained using the independent-samples df (40) and t-test has a low probability of occurrence due to chance. The 95% confidence interval of the difference in means (2.07-12.26) does not cover the zero, which once again proves that the difference is statistically credible. This difference is of large size (Cohen’s d=1.03), which proves that gender explains a significant portion of the variance in the post-test performance scores. This implies that such a difference is not attained by attitudinal adaptation which is not influenced by gender as is found in the case of performance outcomes of students where there is a strong and significant benefit of boys. This effect is so significant that it highlights the educational and psychological significance of the gender difference found in the area of performance.
This graph in Figure 5 displays a normal probability curve, where the t-values of the experimental and control groups are different. The t-value (0.9108) and p-value (0.3678) of experimental group are near the mean which implies no difference between them. On the other hand, the t-value of the control group (2.8439) with p=0.007 is at the tail and represents a statistically significant difference.
3.5. Hypothesis5
Table 7 shows the results regarding the impact of Green ICT Adoption (GICTA) on behavioral change among adolescents in higher secondary school. In order to test Hypothesis (H5), that GICTA has a significantly positive impact on the promotion of desirable behavioral adaptations, the gain scores between the pre-test and post-test of the experimental and the control group were evaluated. The experimental group in this table show significant increase in the behavioral adaptation after the GICTA intervention. The average score of pre-test (M1=61.29, SD1=8.93, SEM1=1.38) is significantly boosted in the post-test (M2=79.07, SD2=5.49, SEM2=0.85) in the sample of 42 subjects. This is a very important difference between pre-test and post-test scores of 17.78 points that proves the strong impact of the GICTA intervention. The significant difference in standard deviation between 8.93 and 5.49 indicates that there are greater consistency and uniformity in behavioral changes among the participants after the intervention. In order to determine the approximate practical importance of this enhancement, the Cohen’s d was computed based on the pooled standard deviation with the resultant effect size approximated to be 2.00-2.20 and this is in the range of a very large effect. It means that GICTA influences significantly changing behavioral patterns of adolescents in the experimental group. The paired-sample t-test provides a t-value of 13.2450 with a standard error of the difference (SED) of 1.343 and a df of 41. The p-value (<0.0001) shows that the improvement is extremely significant and it is much lower than the 0.05 and 0.01 levels. Since the observed t-value is much larger than the critical values at 95% (2.02) and 99% (2.69) level of confidence, the null hypothesis is rejected and high confidence is established.
Comparatively, only a slight improvement in behavioral adaptation is validated by the control group. The mean (M1=62.45, SD1=8.59 and SEM1=1.33) of pre-test scores (42 participants) rises slightly to the mean (M2=62.98, SD2=8.95 and SEM2=1.38) of post-test scores (42 participants). Whereas the resulting change of 0.53 points shows a statistically significant change, it is not practically significant as it represents a difference of only 0.53 points. The similarities between pre- and post-tests in terms of standard deviation (8.59 and 8.95) indicate that the variation in the values do not change significantly, and the increment is equally modest. The computed Cohen’s d (d ≈ 0.06-0.07) indicates insignificant effect size which means that no substantial effect on behavioral adaptations can be detected in the control group in the absence of structured exposure to GICTA. The paired-sample t-test however gives a t-value of 2.2363 whose df=41 and SED=0.234 and hence the p-value=0.0308. This is lower than the 0.05 value showing that there is a statistically significant but insignificant change. The t-value is found to be greater than the critical value of the 95% confidence level (2.02) and less than that of the 99% confidence level (2.69), which puts the result in the acceptance region of moderate significance.
A distinct line of difference occurs between the two groups. There is a very significant improvement in the behavioral adaptation in the experimental group, and both the effect size and the statistical values are very large and significant. Conversely, control group has very little and practically no change though statistically important. This disparity underscores the decisive influence of structured GICTA intervention in deriving desirable outcomes in regard to behavioral change among the adolescents. The results are a strong argument in favour of Hypothesis (H5) and the enormous effect of GICTA in the case of the systematic application in a pedagogically balanced way.
Table 8 shows the effect of Green ICT Adoption (GICTA) on behavioral adjustments in adolescents in higher secondary education using a comparison of post-test gain score by the experimental and control group. The average post-test score of the control condition (M1=62.98, SD1=8.95, SEM1=1.38) is significantly lower than the experimental one (M2=79.07, SD2=5.49, SEM2=0.85) since both groups comprise 42 individuals (total N=84). Such a significant difference in the mean scores demonstrates an obvious benefit in students who obtained the GICTA-based intervention. This difference is also confirmed by the independent samples t-test results. This standard error of the difference (SED)=1.619, and t-value calculated of = 9.9391 at the significance level of 0.05=1.99 and 0.01 = 2.63 are much larger than the critical values. The p-value (<0.0001) means that there is less than 0.01% chance of committing a Type I error, which is outstanding evidence against the null hypothesis. Thus, there is a strong probability that the results prove Hypothesis (H5), which hypothesizes that GICTA substantially facilitates favourable behavioral changes in adolescents. The effectiveness of the intervention is also better as it is noted in the comparison. The high disparity in the means of post-test (62.98 vs. 79.07) illustrates the improved desirable behaviors of the experimental group. This enhancement may be explained by the fact that practices of GICTA have been organized in a systematic way, and they seem to promote positive and stable changes in behavior. The smaller standard deviation in the experimental group (5.49 versus 8.95) also shows a higher level of uniformity in the behavioral adaptation outcomes that there is a more consistent intervention group of students than the control group who only adapts behaviourally through routine practices. Similarly, Cohen’s d, calculated using the pooled standard deviation, ranges from d ≈ 1.80 to 2.00, representing a very large effect size. This shows that GICTA intervention has not merely created statistically significant effects but had a tremendous and significant influence on the behavioral adaptations of the students. Therefore, the results are a great way of supporting the idea that GICTA is a transformative teaching and learning tool. The significantly greater post-test score of the experimental group clearly shows that the intervention is effective in enhancing desirable behavioral changes and provides a strong argument in support of the hypothesis and the importance of applying GICTA-based interventions to the process of educating adolescents.
The Figure 6 represents a graph that compares the normal distributions of the pre-test and post-test scores of experimental and control groups. The experimental post-test curve changes sharply to the right, with a high degree of improvement, whereas there is almost no improvement in the control group. There are three noteworthy t-tests on vertical markers as they show huge treatment effects, and the experimental and control outcomes are distinct.
3.6. Hypothesis6
Table 9 is scrutinized in order to assess how GICTA effects the behavioral changes of adolescent boys and girls by comparing the results of both experimental and the control group. Girls (M1=79.64, SD1=4.39, SEM1=1.32) and boys (M2=78.87, SD2=5.88, SEM2=1.06) have almost the same mean behavioral adaptation scores, with the sample size of 11 and 31 respectively. The value of standard error of the difference (SED=1.946), extremely small unpaired t-test value 0.3933, and high p-value 0.6962 (p>0.05) show that the difference is statistically irrelevant and falls well within the region of acceptance at a confidence level of 95 and 99% (df=40). The very small effect size (Cohen’s d=0.12) also supports the fact that the difference is so small. The large p-value implies that the probability of committing a Type I error by rejecting the null hypothesis would be 69.62 percent, which is much higher than a reasonable threshold, and indicates that the observed minor difference is not caused by gender differences in difference, but, ironically, by random sampling. These results confirm that GICTA acts as a gender-neutral determinant of behavioral adaptation, and is advantageous to both boys and girls.
Conversely, the difference in gender in the control group is statistically significant. Unpaired t-test provides a p-value equal to 0.0172, which means that there is a 1.72 percent chance that the Type I error is present, and the mean score difference between boys and girls is equal to 7.29 and 95 percent confidence interval is 1.36 to 13.21. The value of t (t=2.4856, df=40) is not within the acceptance region (-2.0211 to 2.0211), indicating that there is a significant difference between the two means. The large effect size (Cohen’s d=0.9) and standard error of the difference (SED=2.932) indicate that there is a significant practical difference between genders. This result indicates that boys and girls are quite different in their behavioral adaptation, in the absence of GICTA. Nonetheless, when GICTA is involved, the difference does not exist, which demonstrates that GICTA is effective in eliminating gender differences and is more likely to lead to behavioral adjustment similarity in both groups. However, these findings imply that GICTA reduces or eliminates pre-existing gender differences in behavioral adaptation, functioning as an equitable intervention that benefits boys and girls equally. It strengthens behavioral adaptation overall while promoting inclusiveness.
This graph in Figure 7 clearly shows that the Control Group’s difference between Girls’ and Boys’ scores is statistically significant, while the Experimental Group’s difference is not.
3.7. Hypothesis7
Table 10 has provided the mean scores of gains, standard deviation, and test statistics of both perceptual and attitudinal adaptations in the experimental group that was exposed to GICTA. The analysis will assess the null hypothesis (H07) that is there is no significant difference between the two domains with GICTA producing differentiated effects in both domains. The average score in the post-test of perceptual adaptation (M1=71.64, SD1=8.25) is significantly lower than the average score in attitudinal adaptation (M2=77.74, SD2=6.88) in the 42 participants. The t-value of 6.0748 (df=41) is of great significance at a standard error of the difference (SED) of 1.003 (p < 0.0001). Both significant t at the 0.05 (2.02) and the 0.01 (2.69) are significantly below the observed t making the result highly enclosed within the rejection region of the null hypothesis. In order to determine the magnitude of this difference, Cohen’s d was computed with the help of the pooled standard deviation. The resultant effect size is a value of about d=0.80 that is a large effect. It implies that perceptual and attitudinal adaptations differ not just statistically but also practically significantly enough, with attitudinal adaptation having a much more pronounced reaction to GICTA. The smaller value of standard deviation in attitudinal adaptation (6.88 vs. 8.25) indicates a greater consistency in this area. Together with the enormous effect size and almost negligible p-value, the results give sufficient evidence that GICTA affects attitudinal adaptation of adolescents with a stronger impact compared to the perceptual adaptation. All in all, the findings underline that the GICTA elements, perhaps, its motivational, collaborative, or reflective practices, can be more efficient in influencing attitudes as compared to perceptual abilities. Such unequal effect implies that more needs to be refined in the perceptual elements of GICTA so that cognitive and affective domains can be developed alike.
3.8. Hypothesis8
Table 12 gives a detailed analysis of the stream-wise effect of GICTA’s post-test scores of experimental group on the perception, attitude, and behavioral change of adolescents in higher secondary school. Analysis in three academic streams; Arts, Commerce and Science is done with null hypothesis (H08) where it is decided that there is no significant difference in the effect of GICTA among the three streams. The t-tests are used in making pair-wise comparisons between the streams and the results are interpreted in relation to the statistical significance, the effect size, and the educational relevance. The perceptual adaptation is the first domain under investigation. The comparison of the Arts and Commerce streams shows no significant difference. The Arts students (M1=68.12, SD1=6.52, N1=17) scored marginally less than the Commerce students (M2=71.18, SD2=7.72, N2=11) with a calculated t-value of 1.1306 (df=26, p=0.2685). The t-value obtained is smaller than the critical values of 0.05 and 0.01 of significance and the effect size is small to moderate (d≈0.42). These findings show that the observed difference in means is not significant and could probably be due to deviation. As such, the null hypothesis is adopted and this indicates that GICTA does not have different effects on perceptual adaptation in Arts and Commerce students. The same trend is witnessed in the comparison of the Commerce and Science streams. The perceived adaptation scores of Commerce students (M2=71.18, SD2=7.72, N2=11) are a bit less than that of the Science students (M1=76.29, SD1=8.78, N1=14). Nevertheless, this is not a statistically significant difference (t=1.5195, df=23, p=0.1423). The effect size of the analysis is moderate (d ≈ 0.59), but the p-value is more than the traditional 0.05 cut-off, and the t-value does not show significant numbers to the critical level. Thus, H08 is retained to make this comparison which shows similar perceptual adaptation benefits of GICTA in the Commerce and Science streams. Conversely, there existed a statistically significant difference between Arts and Science streams. There is a significant difference in the perceptual adaptation of science students (M2=76.29, SD2=8.78, N2=14) and Arts students (M1=68.12, SD1=6.52, N1=17) and the t-value is 2.9712 (df=29, p=0.0059). The t-values obtained are higher than the critical values at both levels of 0.05 and 0.01 and the effect size is high (d ≈ 1.06) which suggests the existence of large and significant difference. This comparison therefore rejects the null hypothesis. These results indicate that although GICTA results in similarities in perceptions between Arts-Commerce and Commerce-Science comparisons, it works well in comparison with Science students, as compared to Arts students.
Attitudinal adaptation is the second domain addressed in this Table. The comparison of Arts and Commerce streams once again do not reveal any statistically significant difference. The Arts students (M1=74.47, SD1=8.37, N1=17) score lower than Commerce students (M2=79.09, SD2=4.76, N2=11) but the difference is insignificant (t=1.6588,df=26, p=0.1092). The effect size is moderate (d ≈ 0.61), but the t-value is not larger than the critical values. Therefore, H08 will be accepted, which means GICTA has similar effect on attitudinal adaptation of Arts and Commerce streams. The results of the comparison of the Commerce and Science streams are also non-significant. Students of Commerce (M2=79.09, SD2=4.48, N2=11) and Science (M1=80.64, SD1=4.57, N1=14) show almost the same mean scores with t-value of 0.8277 (df=23, p=0.4164). It has a low effect size (d ≈ 0.32) and a large p-value, which justifies accepting the null hypothesis. This shows that GICTA leads to the development of such similar attitudinal results among students enrolled in Commerce and Science. But there is a statistically significant difference in comparison of Arts and science streams. The reason is that Science students (M2=80.64, SD2=4.57, N2=14) show a much higher attitudinal adaptation as compared to those of Arts (M1=74.47, SD1=8.37, N1=17), t=2.4690 (df=29, p=0.0197). The t-value is more than the critical value at the 0.05 level, and the effect size is large (d ≈ 0.88), which means that there is a meaningful difference. Based on this, H08 is rejected at level 0.05 in this comparison. The findings indicate that GICTA has a better adaptation to attitudinal change in students of the Science as compared to Arts.
The third domain evaluated in the same table is the behavioral adaptation. The test of the similarity of the Arts and Commerce streams is not statistically significant. The students of Arts (M1=76.65, SD1=6.28, N1=17) score lower as compared to the students of Commerce (M2=80.36, SD2=4.23, N2=11), but the difference is not significant (t=1.7203, df=26, p=0.0973). The effect size (d ≈ 0.64) is moderate; however, the t-value is not significant (t=0.21033). Therefore, H08 is accepted meaning that there are similar behavior adoptions outcomes among Arts and Commerce students. In the same way, no major difference is established between the streams of Commerce and Science. The scores of behavioral adaptations are almost the same in Commerce students (M2=80.36, SD2=4.23, N2=11) and in Science students (M1=81.00, SD1=4.42, N1=14). The high p-value and the very small effect size (d ≈ 0.14) confirm the acceptance of H08, according to which GICTA has an equal effect on the behavioral adaptation of both streams. However, the comparison of Arts and Science streams shows that the difference is statistically significant. The behavioral adaption of Science students (M2=81.00, SD2 = 4.42, N2 = 14) is significantly higher than that of Arts students (M1=76.65, SD1=6.28, N1=17), the t-value of which is 2.1822 (df=29, p=0.0373). The t-value is more than a critical value at the 0.05 level, and the magnitude of the effect is close to a large value (d ≈ 0.77). By implication, this comparison rejects H08 at the 0.05 level, which means that GICTA is more effective in facilitating behavioral adaptation among students of the Science subject as compared to students of Arts subject.
Collectively, the results of Table 12 suggest that GICTA is usually consistent and stream neutral in the Commerce stream and its comparison with Arts and Science in perceptual, attitudinal and behavioral adaptations. The null hypothesis (H08) is accepted in the majority of Arts-Commerce and Commerce-Science comparisons, which indicate that GICTA performs equally in these streams. Nevertheless, a consistent and distinct trend of statistically significant differences is evident in the comparison of the Science and Arts streams. In all three domains of adaption, including perceptual, attitudinal, and behavioral, the outcomes of Science students are much higher than those of Arts students, with moderate to high effects. The findings allow rejecting H08 in the Science-Arts comparisons and point out that when comparing the effectiveness of GICTA, significant stream-wise differences are observed. Altogether, although the influence of GICTA can be deemed as significant as that of streams, the Science stream seems to have a greater positive effect on all areas of adaptation. This can be explained by the fact that the Science curriculum is structured, analytical, and application-oriented and can be more oriented towards the instructional strategies of GICTA. Such findings highlight the value of adopting stream-sensitive academic settings in which GICTA can be applied to education at higher secondary level and propose avenues of future research that can be used to investigate such dissimilar impacts further.
The graph (Figure 10) illustrates a normal (bell-shaped) t-distribution with marked t-values (A–G) representing stream-wise comparisons of GICTA effects. Dashed lines indicate observed t-statistics, while their positions relative to critical regions show which comparisons are statistically significant or non-significant based on corresponding p-values.
The data in Table 13 are analyzed using a two-way ANOVA to examine the stream-wise effects of GICTA on post-test scores related to adolescents’ perceptions, attitudes, and behavioral adaptations (Factor B: constructs) across Science, Commerce, and Social Science streams (Factor A: streams) at the higher secondary level in the experimental group. For Factor A (streams), the analysis reveals a statistically significant effect, F(2,117)=10.8244, p<.001. The corresponding effect size (η²=0.126) indicates a moderate to large effect, suggesting that academic stream membership significantly influences adolescents’ perceptual, attitudinal, and behavioral adaptations under GICTA. The obtained F-value exceeds the critical F-values at both the 0.05 (3.07) and 0.01 (4.78) levels, confirming rejection of the null hypothesis for stream-wise differences. Similarly, Factor B (constructs) shows a statistically significant main effect, F(2,117)=15.5368, p<.001, with a large effect size (η²=0.181). This finding indicates that GICTA differentially affects perceptions, attitudes, and behavioral adaptations, highlighting a strong and meaningful variation across learning domains. The observed F-value substantially exceeds the critical thresholds, reinforcing the robustness of this effect. In contrast, the interaction effect (Streams × Constructs) is non-significant, F(4,117)=0.5162, p=0.724, with a negligible effect size (η²=0.012). As the observed F-value is below the critical value at the 0.05 level (2.45), the interaction does not reach statistical significance, indicating that stream-wise differences do not alter the pattern of GICTA’s influence across the constructs.
These results demonstrate that the significant differences in the streams and constructs are large enough to reject the null hypothesis (H08) of main effects, and accept that there is no interaction effect. The very low p-values for streams (0.00004861) and constructs (0.000001037) indicate an extremely low probability of Type I error, confirming statistically robust effects. In contrast, the interaction effect is non-significant (F=0.5162, p=0.724), suggesting that rejecting the interaction hypothesis would entail a high risk of error. Thus, GICTA’s impact varies significantly across Science, Commerce, and Social Science streams and among perceptions, attitudes, and behavioral adaptations, but these factors do not interact. The significant stream effect implies differential effectiveness of GICTA across academic disciplines, likely due to variations in curricular and cognitive demands. The significant construct effect confirms that GICTA influences cognitive, affective, and behavioral domains to differing extents. The absence of interaction indicates that the effect of GICTA on these areas is similar across streams, which highlights the necessity of stream-sensitive but construct-stable instructional interventions.
The graph (Figure 11) shows factor A and factor B have large F-values with very small p-values, indicating significant effects. The interaction effect has a small F-value and a high p-value, showing no significant interaction.
3.9. Hypothesis9
Table 14 shows the dimension-wise effect of GICTA on the perceptual, attitudinal and behavioral adaptation of adolescents with regard to pollution, energy efficiency, and waste management in the higher secondary level. Paired sample t-tests were used to compare pre- and post-test gain scores between experimental (exposed to GICTA) and control groups. Effect size estimates (Cohen’s d) that involved the t-values and sample size (N=42) were used to interpret the magnitude of the intervention effect. In Perceptual Adaptation, all the three dimensions shows statistically significant improvements in the experimental group. The mean score in pollution improve to 22.79, with a very significant t-value (t=10.2357, p<0.0001). The size of the corresponding effect is large (d ≈1.58), meaning that GICTA has a strong effect on the perceptual understanding of pollution in adolescents. Equally, the effect sizes of energy efficiency (t=10.6589, p<0.0001, d≈1.64) and waste management (t=10.6520, p<0.0001, d≈1.64) are also large, indicating that GICTA produce significant improvement in the perceptual awareness of students regarding environmental domains. Conversely, the control group has no significant improvements in pollution and energy efficiency, with insignificant effect sizes, whereas waste management has a small but statistically significant change (t=2.6724, p=0.0108), indicating that little effect is produced by natural or teaching intervention without GICTA exposure.
In the case of Attitudinal Adaptation, the experimental group once again shows significant post-test improvements in all three dimensions. The t-value of 11.4062 (p<0.0001), in pollution, indicates a very large effect size (d≈1.76), which suggests a significant positive change in attitudes after the intervention. Large effects are also found in energy efficiency (t=10.7631, p<0.0001, d≈1.66) and waste management (t=10.3228, p<0.0001, d≈1.59), which indicate that GICTA is very effective in promoting positive environmental attitudes. Although the control group shows statistically significant changes in some dimensions, the effect sizes are small, likely attributable to maturation or routine academic exposure rather than targeted instruction.
As far as Behavioral Adaptation is concerned, the strongest effects were registered in the experimental group among all three dimensions. For pollution, a highly significant t-value of 13.7521 (p<0.0001) produced a very large effect size (d≈2.12), reflecting substantial improvements in pro-environmental behaviors. Energy efficiency (t=13.8588, p<0.0001, d≈2.14) and waste management (t=11.8216, p<0.0001, d≈1.82) also prove very large effects, highlighting the effectiveness of GICTA in translating knowledge and attitudes into actual behavioral change. The control group shows either small or non-significant effects across behavioral dimensions. Overall, the paired t-test findings continuously show that GICTA significantly and educationally resulted in changes in perceptions, attitudes, and behaviours among adolescents in respect of pollution, energy efficiency, and waste management. The extremely high effect sizes in all domains and dimensions of the experimental group validate the strength and practical value of the intervention and the small change in the control group highlight that these gains are as a result of GICTA exposure and not as a result of some other extraneous effect.
This bell-shaped curve (Figure 12) has 18 experimental and control group effects represented by A to R. A single coloured dashed line has the exact t-value of the normal distribution. Values closer to zero represent weaker or non-significant effects whereas those further than zero imply stronger statistical significance.
Table 15 shows the outcomes of a one-way multivariate analysis of variance (MANOVA) on the effect of environmental dimension (pollution, energy efficiency and waste management) on the perceptual, attitudinal, and behavioural adaptation in the post-test of the experimental group. Pillai’s Trace, the most robust multivariate test statistic, was used for analysis. The multivariate effect of environmental dimension was not statistically significant, Pillai’s Trace=0.1143, F(12, 369)=1.2175, p=0.2687, partial η²=0.0381. The effect size is small and indicates that the environmental dimension can explain only a small percentage of the variance between the outcomes of the adaptation. Based on this, it is not possible to reject the null hypothesis, which states that the average levels of perceptual, attitudinal, and behavioural adoptions are equal in all the dimensions of the environment. Descriptive trends show that there are slight differences in areas, but not enough to be statistically significant at the multivariate level. Notably, this insignificant finding does not prove the null hypothesis but it means that there is not enough evidence available to prove the reliable multivariate effect. The results in general indicate low statistical and practical variance across the environmental domains in the context of adaptation outcomes.
Figure 13.
Effect of GICTA on adaptation domains within environmental dimensions.
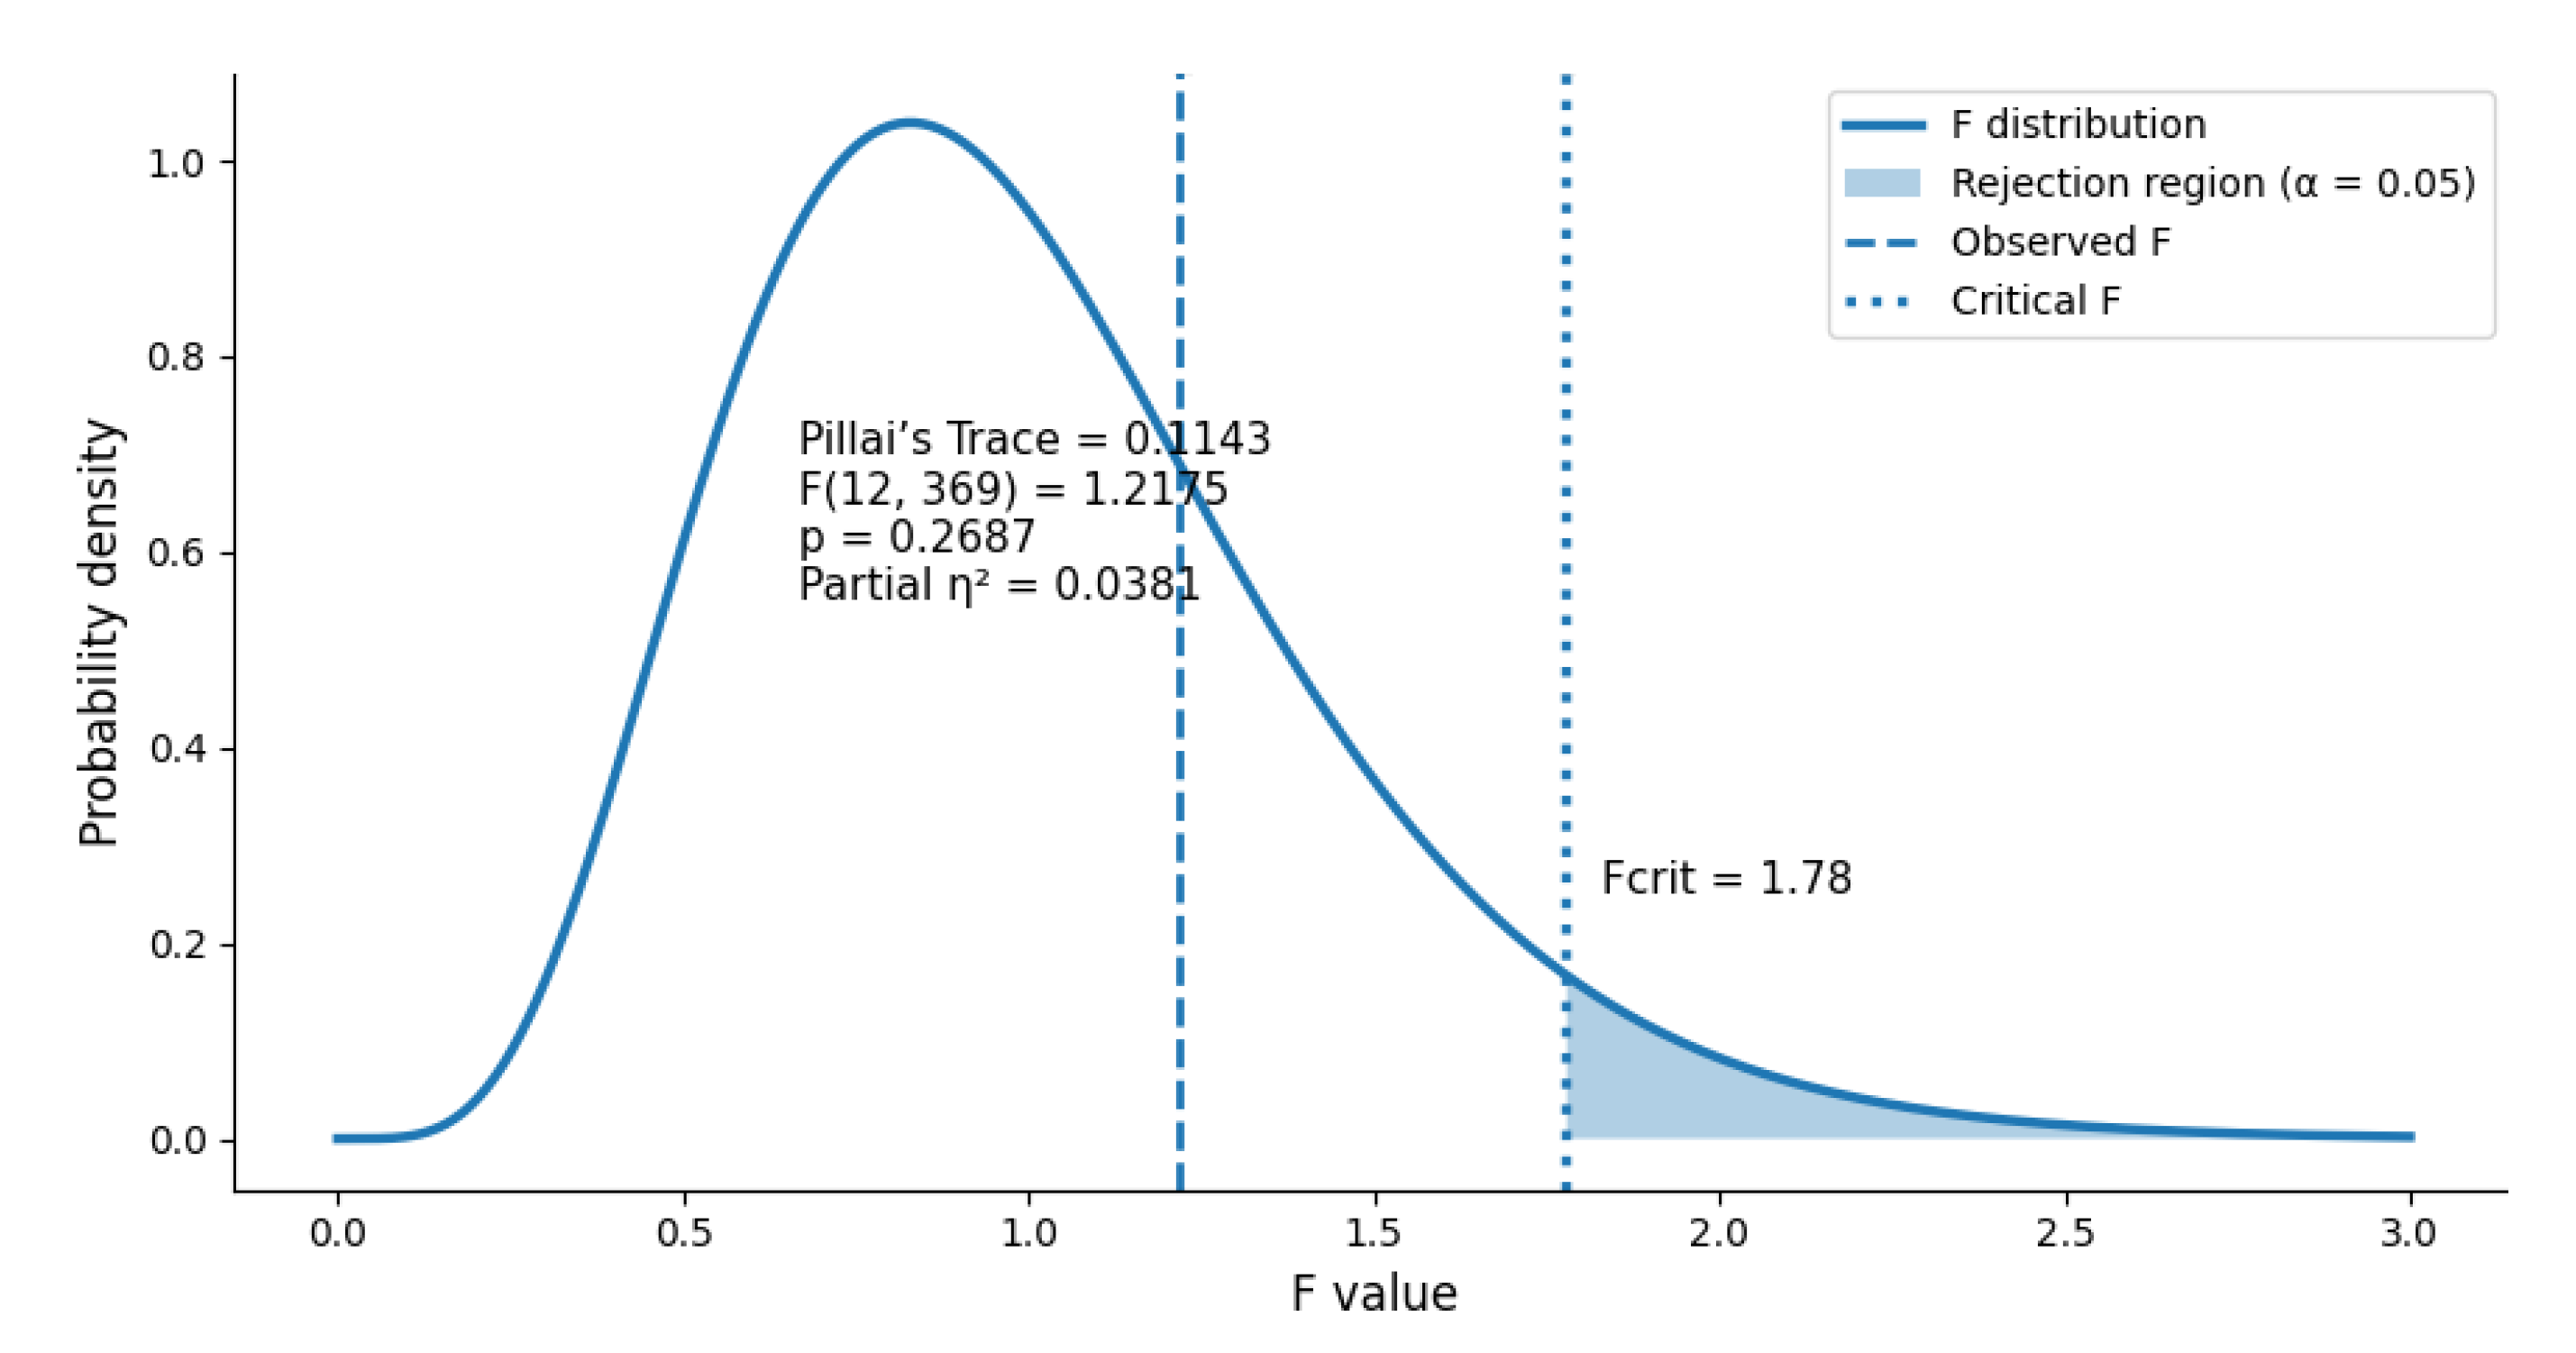
The graph indicates that the GICTA does not have statistically significant impact on any domain of adaptation among the environmental dimensions because the observed F value is less than the critical value and p > 0.05.
3.10. Major Findings
The GICTA had a considerable positive effect on the perceptual adaptation of adolescents, the experimental group signifying a high level of pre-post gains and large effect sizes, and no significant changes in the control group.
GICTA was found to be gender neutral, with no difference in perceptual adaptation between the boys and girls, and no significant differences in gender difference that existed in the control group.
GICTA had very large effect on the attitudinal adaptations of adolescents in experimental group, but the effect was minimal with no significance in the control group.
In the experimental group, GICTA resulted into gender-neutral adaptation of attitudinal, whereas in the control group, the gender difference between boys and girls was significant and large, indicating the influence of GICTA in eliminating the gender disparity.
GICTA resulted in a very large, and highly significant improvement in the behavioral adaptation of adolescents, whereas the control group presented the minimum, practically insignificant change, which is a strong argument in favour of the effectiveness of the intervention.
GICTA also removed preexisting gender differences in behavioral adaptation, with no significant difference between experimental and nonexperimental groups but an equal improvement in behavioral adaptations in both boys and girls.
GICTA also had a significant effect on the perceptual, attitudinal, and behavioral adjustments of adolescents with the strongest effect on behavior followed and moderately on attitudes and the least on perceptions indicating great variability in construct responsiveness and practical implications on refinement.
GICTA produced substantial effects on the perceptions, attitudes and behaviours of adolescents with the greatest effect being on the students in the Science disciplines, neutral on the students in the Commerce disciplines and negative on the students in the Arts disciplines and had no interaction effects among streams, as well as showed stream-sensitive, construct-focused effects.
GICTA had a very large effect on the perceptual, attitudinal, and behavioral adaptation of adolescents in pollution, energy efficiency, and waste management, and control groups showed very little changes; the difference in environmental dimension was small and statistically non-significant.
Table 10 also compares the perceptual and behavioral adoptions in the experimental group that has been exposed to GICTA. The averaged perceptual adaptation score (M1=71.64, SD1=8.25) is significantly less than the behavioral adaptation score (M2=79.07, SD2=5.49) of 42 participants. The t-value of 8.8101 (df=41, p < 0.0001) is very significant with a standard error of the difference (SED)=0.843 and this is greater when compared to both the critical value of 0.05 and 0.01 critical values and therefore the null hypothesis (H07) is rejected. In order to determine the scale of this difference, Cohen’s d was computed based on the pooled standard deviation and the effect size was of approximately d=1.00 which is a large effect. This signifies the existence of a large and practically significant distinction between the behavioral and perceptual adaptations. The reduced standard deviation of behavioral adaptation(5.49 vs. 8.25) indicates more consistency in the responses in the behavior. The results indicate that GICTA is much more effective in shaping behavioral outcomes than perceptual development as this group of activities is more action-centered and thus, can be more reinforcing to behavioral change.
The effect of GICTA on attitudinal and behavioral adaptations among adolescents is also investigated in Table 10 and the null hypothesis (H07) is tested in that the null hypothesis states that there is no significant difference in the attitudinal and behavioral adaptations. The attitudinal adaptation (M1=77.74, SD1=6.88) and behavioral adaptation (M2=79.07, SD2=5.49) among 42 participants have a mean post-test score that is slightly lower. The t-value of 2.4326 (df=41) with standard error of the difference (SED=0.548) is not statistically significant at the 0.10 level but it is statistically significant at the 0.05 level. Cohen’s d was determined using the pooled standard deviation to determine the level of practical significance, and the effect size is about d=0.38, which is a small-to-moderate effect. This is to show that though the difference between attitudinal and behavioral adaptations is statistically significant, it is relatively small. The difference in the standard deviation of behavioral adaptation (5.49 vs. 6.88) shows that the former is more consistent, which implies that GICTA can be more effective at improving behavioral results than the attitudinal ones. On the whole, the findings allow rejecting H07 at the 0.05 level, which can be interpreted as a slight yet significant difference in the effect of GICTA, which may be due to the influence of the practical and action-oriented aspects of the GICTA on the development of behavior.
The graph in the Figure 8 shows a t-distribution with three significant t-values marked. Each value lies far in the distribution’s tail, with corresponding low p-values, indicating strong statistical significance across all comparisons.
The findings of the one-way ANOVA-based Table 11 shows that there are significant differences in the post-test scores of perceptions, attitudes, and behavioral adaptations in the GICTA-exposed experimental group, which means that the intervention does not have homogeneous effects on the constructs. The result of the analysis was a high value of F=13.581 (p=0.000004685), which indicates a significant statistical significance. In order to have a further insight into the size of these differences, effect size was estimated by means of Eta squared (η2) and Eta squared is 1317.5874 / 7284.135 = 0.18. By traditional standards, this is a significant effect size meaning that about one-fifth of the variance in post-test scores of the three constructs can be explained by the dissimilar effect of GICTA. This significant impact implies that the instructional and technological aspects of GICTA have a significant impact on the cognitive (perceptions), affective (attitudes), and behavioral (self-regulation) domains of adolescents to a significantly different extent. This is to be anticipated in complex educational interventions, in which every construct might react differently according to the type of feedback and involvement procedures as well as the task requirements inherent in the program. The findings, consequently, result in rejection of hypothesis7, which was that there are no significant differences between the constructs. Along with that, the p-value (lower than 0.001) is extremely low, which means that there is a very low chance of a Type I error, which also enhances the credibility of such results. On the whole, the high F-statistic, high level of significance, as well as large effect-size, indicates that GICTA has varied and significant effects on perceptions, attitudes, and behavioral readjustments. The findings have practical implications in terms of curriculum improvement, as it can be indicated that certain elements of GICTA require improvement or adjustment to achieve the most output in all the three areas.
The graph in the Figure 9 displays the F-distribution with a marked F-value of 13.581, indicating where the observed statistic lies. Its position far in the tail shows a very low p-value (4.685e-06), meaning the result is highly significant. This confirms strong differences among the studied groups.
4. Discussion
Findings in Table 1, Table 2, Table 3, Table 4, Table 5, Table 6, Table 7, Table 8, Table 9, Table 10, Table 11, Table 12, Table 13, Table 14 and Table 15 presented congruent and convincing arguments that GICTA was a successful teaching program in terms of improving the perceptual, attitudinal, and behavioral changes among adolescents towards green environmental concerns in the higher secondary level. The strength, integration, and educational validity of the intervention were supported by the presence of consistency of results across various analytical lenses such as within-group (Table 1 and Table 4 and Table 7), between-group (Table 2 and Table 5, and 8), gender-wise (Table 3, Table 6 and Table 9), relational (Table 10 and Table 11), and stream-wise (Table 12 and Table 13) analyses (Dwivedi et al., 2022; Haddock et al., 2022). The significant pre-post improvements recorded repeatedly in the experimental conditions of perceptual, attitudinal, and behavioral adaptations (Table 1, Table 4 and Table 7) due to meaningfully explained by the structured and learner-focused nature of GICTA (Rakha, 2025). The intervention was more participatory and offered the students an experience of learning through experience, reflection, discussion, and scenario-based contextualization, which was broadly regarded as critical success factors in promoting profound and significant learning (Kong, 2021). The significant positive changes in the mean scores in domains (Table 1, Table 4 and Table 7) demonstrated that students were not only exposed to the information about the green environment but they could process, internalize, and apply it (Aulina et al., 2025). The resulting reduction in the post-test variability also implied that GICTA facilitated more homogenous learning that allowed students with divergent backgrounds to achieve similar levels of cognition, understanding, adaptation and adjustment (Carvajal-Morales et al., 2024; Roy, 2023).
Conversely, the unstable shifts in the control groups on the perceptual, attitudinal, and behavioral domains (Table 1, Table 4 and Table 7) showed that the conventional methods of instruction, knowledge-action gap, lack of active engagement, systemic inertia and lock-in effects, behavioral and cultural barriers, insufficient support systems, passive exposure to green environmental content were not enough to cause any significant adaptations (Li et al., 2025). Although we observed small but statistically significant positive changes in some areas in the control groups (Table 4 and Table 7), they were generally small and not always consistent, indicating that they could be caused by incidental learning, placebo effect, history effect, maturation, test familiarity, or external factors, as opposed to a systematic impact of instruction on them (Farjam et al., 2019). This unambiguous contrast between experimental and control groups reinforced the need to employ specific, structured interventions like GICTA in realising substantial educational results in environmental education.
As indicated in Table 1 and Table 2, the domain was that of perceptions, which revealed that GICTA causes the progress of awareness and knowledge of the green environment among the adolescents. The experimental group (Table 1) registered a significant difference between pre-test and post-test perceptual scores with very significant statistical values (Cubillas-Para et al., 2024). This escalation was a sign that GICTA was able to strengthen cognitive sensitivity of students to green environmental issues and allowed them to better recognize, interpret, and assess environmental issues (Bogerd et al., 2021). The reduction in the standard deviation of the post-test (Table 1) also suggested that the intervention contributed to creating a common conceptual framework among learners (Radu, 2016). Compared to that (Table 1), the control group experienced only non-significant yet marginal gains (Wei & Zhang, 2023), highlighting the inefficiency of the traditional teaching to facilitate perceptual change. The large post-test difference between experimental and control groups (Table 2) established the fact that perceptual gains could be directly attributed to GICTA (Castelli & Longaray, 2022).
The gender-wise perceptual adaptation comparisons as indicated in Table 3 further analysed the inclusive nature of GICTA. The fact that there were no significant gender differences within the experimental group did not mean that the intervention was not effective in boys and girls (Hassan et al., 2025). In contrast, the significant gender gap in the control group (Table 3) encouraged the view that, in the absence of an organized intervention, the results of perceptions could be different due to social or other contextual influences (Hejri et al., 2022; Mishra & Akman, 2014). GICTA seems to have countered these differences by offering equal learning opportunities and inclusive pedagogical practices (Mhlongo et al., 2023).
The same trends were observed in the attitudinal domain, as it is indicated by Table 4 and Table 5. Furthermore, the results obtained with the experimental group indicated significant positive changes in environmental attitudes between pre-test and post-test (Table 4) with high statistical values (Nusraningrum et al., 2024). This drop in post-test variability (Table 4) was an indication that GICTA was not only enhancing attitudes, but also matching student value orientations in a more coherent way as a result of participatory activities, real-life problem situations, and collaborative decision-making, students were persuaded to internalize green environmental values and not to simply express positive attitudes. This continued interaction minimized the knowledge-attitude-value gap between the two, resulting in more consistent and congruent value orientations influencing the environmental judgments and intentions of students across contexts (Kirby & Zwickle, 2021). In spite of the fact that the result of the control group was relatively modest in terms of attitudinal change (Table 4). The degree of change was relatively small because of the daily experience of life, the availability of general information, or personal development that was not covered by the experiment (Hlaba & Shava, 2025). The substantial between-group differences at the post-test stage (Table 5) affirmed that GICTA was a significant factor to influence the environmental attitudes of adolescents (Kuang et al., 2022).
The fair effect of GICTA was further supported by the gender-based analysis of the attitudinal adaptation shown in Table 6. Both males and females in the experimental group had similar post-test scores but there were marked gender differences in control group. It could be explained by the inclusion design of GICTA, which focuses on equal chances to express, discuss critically, and negotiate values in a participative learning process based on dialog and collaborative reflections. This attitude allowed both boys and girls to achieve similar attitudinal orientations to problems related to the green environment (Peng et al., 2024; UNESCO, 2024). These findings indicated that the participatory and learner–teacher interactive framework of GICTA was effective in supporting inclusive development of attitudes.
The behavioral domain presented one of the strongest instances of effectiveness of GICTA. As revealed in Table 7 and Table 8, the experimental group (Table 7) showed significant pre-post changes in behavioral adaptation with t-values that were very high and p-values were highly significant. These advantages can be explained by the focus of GICTA on the active involvement of students in practical exercises and problem-solving activities, as well as actions that involve the environment, which, in turn, helped to transform cognitive knowledge and positive attitudes into a noticeable behavioral change (Świątkowski et al., 2024). Conversely, the low behavioral improvements noticed in the control group (Table 7) underlined the challenge of introducing behavioral change when there is no structured experiential learning, resistance to change due to habitual behavior, and understanding of the technical and practical advantages of environmental interventions (Hoffmann et al., 2024; Ogiemwonyi, 2024). Moreover, the great significance of the post-test differences between the experimental and control groups (Table 8) indicated the success of GICTA in the translation of learning into long-lasting pro-environmental action (He et al., 2026; Wang et al., 2019).
The gender-wise comparison of the behavioral outcomes provided in Table 9 showed that there was no significant gender difference in the experimental group, but there was a significant difference in the control group. Lack of gender-based differences in the experimental group could be explained by the fact that GICTA was designed as an inclusive and activity-based intervention that provided equal access to hands-on activities, decision-making processes, and environmental actions (Gnambs, 2021). Trying to focus on collaborative learning, shared responsibility, and practical involvement instead of gender roles, GICTA could minimize the behavioral differences traditionally and encourage similar pro-environmental behavior in both genders (Qazi et al., 2022). Conversely, the control group, relying on traditional methods of instruction, failed to sufficiently deal with the prevailing social norms and habitual dynamics, thus permitting gender-related inequality in environmental practices to occur (Fakhrudin et al., 2018; Wu et al., 2024). This result indicated that GICTA was an effective way to encourage gender-equitable behavioral involvement because it influenced collective responsibility and participation (Naini et al., 2024).
Table 10 and Table 11 revealed the interrelationship of perception, attitude, and behavior, that validated the holistic influence of GICTA (Dezdar, 2017; Qin et al., 2025). Significant correlations between these domains (Table 10) and significant outcomes (Table 11) established GICTA as a synergistic activity operating at the perceptual, attitudinal, and behavioral levels, which were consistent with the existing theoretical models, including the knowledge, attitude and behavior framework (Dezdar, 2017; Ruiu et al., 2026; Zhuo et al., 2022).
Stream-wise comparisons (Table 12 and Table 13) showed that GICTA worked in all academic streams but there was a difference in the results magnification (Gupta et al., 2024). Curriculum exposure and prior knowledge combined with problem-solving skills acquired through the scientific background (Arshad et al., 2020; Filho et al., 2023) but with non-significant interaction effect (Table 13) showed that Science students had a higher mean score than Arts students across domains, which is why the overall pattern of adaptation, learning processes, institutional infrastructure, teaching methods, or a common institutional culture was constant with streams (Benzehaf et al., 2025; Fawehinmi et al., 2022; Wang et al., 2026).
Finally, dimension-wise analysis of the environmental themes in Table 14 and Table 15 indicated that GICTA generated significant improvements on pollution, energy efficiency, and waste management through the substitution effect and seamless integration with the current systems (Shahzad et al., 2022). Despite the fact that waste management registered a little bit higher post-test mean scores (Table 14), the Table 15 results showed that there was no significant multivariate difference across the dimensions. That could be explained by the small sample size that might have lowered the statistical power of the multivariate test to identify small yet significant differences between dimensions and by a potential ceiling effect in which the participants were close to the maximum levels of performance (Zulkepeli et al., 2024). However, these results support the equal and combined effect of the intervention on all green environmental themes (Alofaysan et al., 2024; Singh & Singh, 2018). Combined, the results of the research indicated that GICTA was a holistic, fair, and effective teaching method that could be used to support the development of holistic environmental adaptation among adolescents (Dalvi-Esfahani et al., 2020; Kollab & Yousef, 2023). Taken together, the findings indicated that GICTA was a holistic educational system that could support the cognitive, affective, and behavioral aspects of environmental learning in a holistic way (Liang et al., 2025; Rashid & Shafie, 2018; Vaishnav, 2023). Its effectiveness ccould be explained by its experiential design, contextual relevance, inclusiveness, and theoretical foundation, which highlighted its relevance in the context of higher secondary education and the way it could enhance sustainable citizenship in the environmental context.
5. Conclusion
The study gives a final conclusion that GICTA is a useful teaching method that can be employed to enhance positive perceptual, attitudinal and behavioural change in adolescents towards environmental sustainability in the teacher to the higher secondary. On the educational front, the findings of the present research prove that there is an urgent need to redefine the current state of environmental teaching and learning that are based on less conventional, less passive, and less content-laden pedagogies and pedagogies of technology such as Green Information and Communication Technology Adoption (GICTA). The results present a clear picture that the most effective way to achieve environmental learning and sustainable behavioral change in adolescents is through active engagement of the learners in form of practical activities, real-life problem solutions, reflective practices, and learning experiences with the help of green ICT tools. This implies that at the secondary school level, educators and curriculum planners must inculcate ICT based environmental educational courses, enquiry-based projects and activities, which are bound with communities such that students are not only taught about environmental problems but also empowered to internalize values and convert learning into responsible action. The study also demonstrates the usefulness of the professional development programs that enable teachers to be equipped with the competencies required to plan, teach and assess dynamically the technology-based environmental learning activities in an inclusive and gender-equitable way.
The implication of the current results takes specific importance with regard to Viksit Bharat, which is a vision of an inclusive, technology based, environmentally friendly, and knowledge-based nation, where the nature of India is considered. The strategic focus of the Government of India on digital transformation of education, environmental sustainability, climate action, and equity are aligned with the main objectives and achieved results of Green Information and Communication Technology Adoption (GICTA). Being a scalable, participatory, and cost-effective instructional model, GICTA has a direct connection to the Viksit Bharat objective of enhancing human capital by quality education and engaging responsible citizenship. Its capacity to increase environmental literacy in a wide range of education settings such as rural, remote and under-serviced areas can be seen in line with the national priority to fair access, digital access and sustainable development. The incorporation of GICTA-type strategies into national and state-level curriculum changes, teacher education courses and school-based sustainability measures would make a significant contribution towards Viksit Bharat goals including digital citizenship, climate-conscious behavior, and youth-led sustainability. GICTA can also take a revolutionary role in closing the long-standing divide between environmental awareness and action by integrating technology-based experiential learning into the formal education system so that a generation of environmentally conscious, socially conscious, and future-conscious citizens can be raised and brought to contribute positively to the path of sustainable development in India.
Research and innovation wise, the research introduces new avenues, which are also consistent with the Viksit Bharat vision of making evidence-based policies and continuously improving education. Longitudinal studies are necessary on how perceptual, attitudinal, and behavioral changes brought by GICTA can be sustainable and transferable over time, especially in the context of their contribution towards sustainable lifestyles and citizenship. The same replication studies in different socio-cultural, regional, and institutional settings would also improve the overall applicability of the findings and inform national-level scaling. Future studies can also centre on the refining and contextualization of GICTA to cater more effectively to the educational requirements of Arts and Commerce students to guarantee the balance in the outcomes of different disciplines and support the inclusive spirit of Viksit Bharat. Furthermore, the discussion of the integration of new technologies, including artificial intelligence, virtual simulation, and data-driven feedback systems into the GICTA system is consistent with the goals to become a global leader in educational innovation and digital progress in India. All these together place GICTA as an active and flexible educational policy by which through the collaboration of educators, researchers, planners and policymakers in environmental education, sustainable citizenship and national development objectives will be met in harmony with the larger vision of a resilient, technologically empowered and environmentally conscious Viksit Bharat.
References
- Abbass, K., Qasim, M. Z., Song, H., Murshed, M., Mahmood, H., & Younis, I. (2022). A review of the global climate change impacts, adaptation, and sustainable mitigation measures. Environmental science and pollution research, 29(28), 42539-42559. [CrossRef]
- Abowardah, E. S., Labib, W., Aboelnagah, H., & Nurunnabi, M. (2024). Students’ perception of sustainable development in higher education in Saudi Arabia. Sustainability, 16(4), 1483. [CrossRef]
- Adhikari, A., Biswas, S., & Dandapat, A. K. (2023). Green ICT: Promoting sustainability in higher secondary schools. Web of Semantic: Universal Journal on Innovative Education, 2(6), 270-276.
- Adnyana, I. M. D. M., Mahendra, K. A., & Raza, S. M. (2023). The importance of green education in Indonesia: An analysis of opportunities and challenges. Education Specialist, 1(2), 61-68. https://DOI:10.59535/es.v1i2.168.
- Aguilar-Gomez, S., Cardenas, J. C., Galindo, C., Rodriguez-Arenas, J., & Vlasak-Gonzalez, D. (2025). Gender gaps in knowledge, attitudes, and practices related to environmental degradation in Colombia. Environmental Research: Climate, 4(2), 025004. [CrossRef]
- Ajina, A. S., Islam, D. M. Z., Zamil, A. M., & Khan, K. (2024). Understanding green IT adoption: TAM and dual-lens of innovation resistance. Cogent Business & Management, 11(1), 2403646. [CrossRef]
- Alhassn, I., Asiamah, N., Opuni, F. F., & Alhassan, A. (2022). The Likert scale: Exploring the unknowns and their potential to mislead the world. UDS International Journal of Development, 9(2), 867-880. https://doi.10.47740/586.UDSIJD6i.
- Alofaysan, H., Radulescu, M., Dembińska, I., & Mohammed, K. S. (2024). The effect of digitalization and green technology innovation on energy efficiency in the European Union. Energy Exploration & Exploitation, 42(5), 1747-1762. https://doi:10.1177/01445987241253621.
- Angelaki, M. E., Karvounidis, T., Kolega, E., & Douligeris, C. (2024, May). Greek ICT school teachers’ perceptions and awareness toward embedding sustainability and green informatics into the ICT curricula. In 2024 IEEE Global Engineering Education Conference (EDUCON) (pp. 1-9). IEEE. https://DOI:10.1109/EDUCON60312.2024.10578772.
- Areepattamannil, S., & Khine, M. S. (2017). Early adolescents’ use of information and communication technologies (ICTs) for social communication in 20 countries: Examining the roles of ICT-related behavioral and motivational characteristics. Computers in Human Behavior, 73, 263-272. [CrossRef]
- Arshad, H. M., Saleem, K., Shafi, S., Ahmad, T., & Kanwal, S. (2020). Environmental awareness, concern, attitude and behavior of university students: A comparison across academic disciplines. Polish journal of environmental studies, 30(1), 561-570. https://DOI:10.15244/pjoes/122617.
- Aulina, C. N., Arianto, F., Salim, A., & Sholihah, F. M. (2025). Fostering environmental awareness and social attitudes in early childhood through green-tech project-based learning and teacher guidance. International Journal of Information and Education Technology, 15(11), 2394-2404. https://doi:10.18178/ijiet.2025.15.11.2435.
- Benzehaf, B., Razkane, H., & Benzehaf, O. (2025). Exploring university students’ perceptions and engagement in environmental awareness and sustainable practices. Discover Environment, 3(1), 247. [CrossRef]
- Bhardwaj, A., & Parveen, H. (2024). Intellectual property in the age of climate change: Balancing innovation and sustainability through green technology. The Academic, 2(12), 672-691.
- Biancolin, M., Rotaris, L., & Pernot, D. (2025). Willingness to pay for sustainable delivery: Evidence from young consumers in Italy and Norway. Transportation Research Part A: Policy and Practice, 199, 104580. [CrossRef]
- Billanes, Y. K. L., & Accad, M. F. (2025). Exploring educators’ practices on the green ICT and the school energy consumption and maintenance. International Journal of Research and Innovation in Social Science, 9(14), 1121-1151. https://dx.doi.org/10.47772/IJRISS.2025.914MG0085.
- Bogerd, N. V. D., Dijkstra, S. C., Koole, S. L., Seidell, J. C., & Maas, J. (2021). Greening the room: A quasi-experimental study on the presence of potted plants in study rooms on mood, cognitive performance, and perceived environmental quality among university students. Journal of Environmental Psychology, 73, 101557. [CrossRef]
- Booth, M. Z., Roberts, A. C., Gerard, J. M., & Gilfillan, B. H. (2022). Young adolescent perceptions of school climate and self-efficacy: The intersectionality of race and gender. RMLE Online, 45(10), 1-16. [CrossRef]
- Borgonovi, F., Pokropek, M., & Pokropek, A. (2023). Relations between academic boredom, academic achievement, ICT use, and teacher enthusiasm among adolescents. Computers & Education, 200, 104807. [CrossRef]
- Carvajal-Morales, J. M., León-Plúas, E. E., Valenzuela-Cobos, J. D., & Guevara-Viejó, F. (2024). Educational design in the adoption of ICT for sustainable digital learning in social and business sciences: A structural equation model. Sustainability, 16(23), 10674. [CrossRef]
- Castelli, T. M., & Longaray, A. A. (2022). Analysis of green technology information from the perspective of individual’s socio-environmental awareness. Ambiente & Sociedade, 25(2), e01632. [CrossRef]
- Chakraborty, S., & Thakur, N. (2024). Reflections of adult learners on binge-watching and its detrimental impact on the environment in West Bengal, India. Cogent Education, 11(1), 2428895. [CrossRef]
- Cheng, W., Li, Q., Wu, Q., Ye, F., & Jiang, Y. (2024). Digital capability and green innovation: The perspective of green supply chain collaboration and top management’s environmental awareness. Heliyon, 10(11). [CrossRef]
- Cubillas-Para, C., Tomaseti-Solano, E., & Madrid-Guijarro, A. (2024). How do the perception of the technological and symbolic dimensions and the social context affect the green consumer adoption process of eco-innovations? Business Strategy and the Environment, 33(3), 2533–2545. [CrossRef]
- Dalvi-Esfahani, M., Alaedini, Z., Nilashi, M., Samad, S., Asadi, S., & Mohammadi, M. (2020). Students’ green information technology behavior: Beliefs and personality traits. Journal of cleaner production, 257, 120406. [CrossRef]
- Dezdar, S. (2017). Green information technology adoption: Influencing factors and extension of theory of planned behavior. Social Responsibility Journal, 13(2), 292-306. [CrossRef]
- Díaz-López, C., Serrano-Jimenez, A., Chacartegui, R., Becerra-Villanueva, J. A., Molina-Huelva, M., & Barrios-Padura, A. (2023). Sensitivity analysis of trends in environmental education in schools and its implications in the built environment. Environmental development, 45, 100795. [CrossRef]
- Doncheva, J., Ivanova, G., & Oblokulov, D. J. (2024). Opportunities and challenges for the education of students with special educational needs in the digital environment: The new normal. Strategies for Policy in Science and Education, 32(5s), 140-151. [CrossRef]
- Dwivedi, Y. K., Hughes, L., Kar, A. K., Baabdullah, A. M., Grover, P., Abbas, R., ... & Wade, M. (2022). Climate change and COP26: Are digital technologies and information management part of the problem or the solution? An editorial reflection and call to action. International Journal of Information Management, 63, 102456. [CrossRef]
- Fakhrudin, I. A., Karyanto, P., & Ramli, M. (2018). Behavioral intention and its relationship with gender: A study of green school students in Surakarta, Indonesia. Journal of Physics: Conference Series,1022(1), 012043. https://DOI10.1088/1742-6596/1022/1/012043.
- Farjam, M., Nikolaychuk, O., & Bravo, G. (2019). Experimental evidence of an environmental attitude-behavior gap in high-cost situations. Ecological Economics, 166, 106434. [CrossRef]
- Fawehinmi, O., Yusliza, M. Y., Ogbeibu, S., Tanveer, M. I., & Chiappetta Jabbour, C. J. (2022). Academic employees’ green behaviour as praxis for bolstering environmental sustainable development: A linear moderated mediation evaluation. Business Strategy and the Environment, 31(7), 3470-3490. [CrossRef]
- Filho, W. L., Ayal, D. Y., Wall, T., Shiel, C., Paco, A., Pace, P., ... & Kovaleva, M. (2023). An assessment of attitudes and perceptions of international university students on climate change. Climate Risk Management, 39, 100486. [CrossRef]
- Fors, P., Kreps, D., O’Brien, A. (2024). Green IT: The evolution of environmental concerns within ICT policy, research and practice. In: Lynn, T., Rosati, P., Kreps, D., Conboy, K. (eds) Digital sustainability. Palgrave Studies in Digital Business & Enabling Technologies (pp. 25–48). Palgrave Macmillan, Cham. [CrossRef]
- Fraccascia, L., Ceccarelli, G., & Dangelico, R. M. (2023). Green products from industrial symbiosis: Are consumers ready for them?. Technological Forecasting and Social Change, 189, 122395. [CrossRef]
- Gnambs, T. (2021). The development of gender differences in information and communication technology (ICT) literacy in middle adolescence. Computers in Human Behavior, 114, 106533. [CrossRef]
- González-Zamar, M. D., Abad-Segura, E., López-Meneses, E., & Gómez-Galán, J. (2020). Managing ICT for sustainable education: Research analysis in the context of higher education. Sustainability, 12(19), 8254. [CrossRef]
- Government of India, Ministry of Education. (2022). India report – quality and innovation 2022. Department of School Education and Literacy. https://www.education.gov.in/sites/upload_files/mhrd/files/document-reports/Quality-and-Innovation-Report.pdf.
- Gupta, S., Kaushik, A., Sharma, M., & Jamwal, A. (2024). Sustainability in technology and green IT. International Journal for Research in Applied Science & Engineering Technology (IJRASET), 12(11), 279-284. [CrossRef]
- Haddock, A., Ward, N., Yu, R., & O’Dea, N. (2022). Positive effects of digital technology use by adolescents: A scoping review of the literature. International Journal of Environmental Research and Public Health, 19(21), 14009. [CrossRef]
- Hansen, J. E., Kharecha, P., Sato, M., Tselioudis, G., Kelly, J., Bauer, S. E., ... & Pokela, A. (2025). Global warming has accelerated: Are the united nations and the public well informed?. Environment: Science and Policy for Sustainable Development, 67(1), 6-44. [CrossRef]
- Hariyani, D., Hariyani, P., & Mishra, S. (2025). Digital technologies for the sustainable development goals. Green Technologies and Sustainability, 3(3), 100202. [CrossRef]
- Hassan, S. T., Danish, Wu, K., & Iqbal, K. (2025). Empowering sustainable development: green growth, digital economy, and gender equality in education to address energy poverty. International Journal of Sustainable Development & World Ecology, 32(8), 1–17. [CrossRef]
- He, W., Cai, Y., & Sun, X. (2026). A study on the impact of gamified online instructional models on green behavior intention in sustainable laboratory safety education. Sustainability, 18(1), 315. [CrossRef]
- Hejri, F. M., Radfar, R., Zohrabi, M., & RabieiPakdeh, Z. (2022). Empirical evaluation of Iranian CIO perspective with adoption of green information technology. Discrete Dynamics in Nature and Society, 2022(1), 3408915. [CrossRef]
- Hlaba, Z., & Shava, H. (2025). Consumer attention, green attitude, and climate change awareness in green purchase behaviour: Insights from an emerging economy. Sustainability, 17(23), 10859. [CrossRef]
- Hoffmann, R., Kanitsar, G., & Seifert, M. (2024). Behavioral barriers impede pro-environmental decision-making: Experimental evidence from incentivized laboratory and vignette studies. Ecological Economics, 225, 108347. [CrossRef]
- Joshi, A., Kale, S., Chandel, S., & Pal, D. K. (2015). Likert scale: Explored and explained. British journal of applied science & technology, 7(4), 396-403. https://doi.10.9734/BJAST/2015/14975.
- Kamarudin, S., Mohd, S. M., Zulkifli, N. N., Rosli, I., Alan, R., & Lepun, P. (2021). The cognizance of green computing concept and practices among secondary school students: A preliminary study. International Journal of Advanced Computer Science and Applications, 12(1), 307-312.
- Kirby, C. K., & Zwickle, A. (2021). Sustainability behaviors, attitudes, and knowledge: Comparing university students and the general public. Journal of Environmental Studies and Sciences, 11(4), 639-647. [CrossRef]
- Kirchner-Krath, J., Morschheuser, B., Sicevic, N., Xi, N., von Korflesch, H. F., & Hamari, J. (2024). Challenges in the adoption of sustainability information systems: A study on green IS in organizations. International Journal of Information Management, 77, 102754. [CrossRef]
- Kollab, W. M., & Yousef, Y. A. (2023). Exploring the relationship between green IT awareness and adoption: A case study of IT students in the Gaza Strip. Jurnal Sistem Informasi, 19(2), 61-78. [CrossRef]
- Kong, Y. (2021). The role of experiential learning on students’ motivation and classroom engagement. Frontiers in psychology, 12, 771272. [CrossRef]
- Kuang, H., Akmal, Z., & Li, F. (2022). Measuring the effects of green technology innovations and renewable energy investment for reducing carbon emissions in China. Renewable Energy, 197, 1-10. [CrossRef]
- Kumar, N. (2024). F-Test and Analysis of Variance (ANOVA) in Economics. Mikailalsys Journal of Mathematics and Statistics, 2(3), 102-113. [CrossRef]
- Kuş, M. (2025). A meta-analysis of the impact of technology related factors on students’ academic performance. Frontiers in Psychology, 16, 1524645. [CrossRef]
- Lamba, J. (2024). Gender disparities in green technology education and skill development. International Journal for Multidisciplinary Research (IJFMR), 6(6), 1-11. [CrossRef]
- Lampropoulos, I., Astara, O. E., Skordoulis, M., Panagiotakopoulou, K., & Papagrigoriou, A. (2024). The contribution of education and ICT knowledge in sustainable development perceptions: The case of higher education students in Greece. Journal of Human Resource and Sustainability Studies, 12(1), 15-31. [CrossRef]
- Lehner, M. (2025). A systematic literature review of time-use effects from increased ICT adoption and its consequences for lifestyle climate implications. Sustainability Science, 1-11. [CrossRef]
- Li, C., Wu, P., Shi, Y., & Liu, S. (2025). Bridging the gap between attitudes and behaviors in energy saving: An AI feedback perspective. Sustainable Futures, 10, 101568. [CrossRef]
- Li, Y., Wang, B., & Saechang, O. (2022). Is female a more pro-environmental gender? Evidence from China. International Journal of Environmental Research and Public Health, 19(13), 8002. [CrossRef]
- Liang, H., Hussain, M., & Iqbal, A. (2025). The dynamic role of green innovation adoption and green technology adoption in the digital economy: The mediating and moderating effects of creative enterprise and financial capability. Sustainability, 17(7), 3176. [CrossRef]
- Mhlongo, S., Mbatha, K., Ramatsetse, B., & Dlamini, R. (2023). Challenges, opportunities, and prospects of adopting and using smart digital technologies in learning environments: An iterative review. Heliyon, 9(6), e16348. https://doi:10.1016/j.heliyon.2023.e16348.
- Mishra, A., & Akman, I. (2014). Green information technology (GIT) and gender diversity. Environmental Engineering & Management Journal (EEMJ), 13(12), 2999-3007. https://DOI:10.30638/eemj.2014.338.
- Mishra, P., Singh, U., Pandey, C. M., Mishra, P., & Pandey, G. (2019). Application of student’s t-test, analysis of variance, and covariance. Annals of cardiac anaesthesia, 22(4), 407-411. https://doi:10.4103/aca.ACA_94_19.
- Mosca, O., Manunza, A., Manca, S., Vivanet, G., & Fornara, F. (2024). Digital technologies for behavioral change in sustainability domains: a systematic mapping review. Frontiers in Psychology, 14, 1234349. [CrossRef]
- Msambwa, M. M., & Daniel, K. (2024). A systematic literature review on the ICT integration in teaching and learning: Lessons for an effective integration in Tanzania. European Journal of Education, 59(4), e12696. [CrossRef]
- Naini, S. R., Mekapothula, R. R., Jain, R., & Manohar, S. (2024). Redefining green consumerism: a diminutive approach to market segmentation for sustainability. Environmental Science and Pollution Research, 31(9), 12916-12932. [CrossRef]
- Nusraningrum, D., Widyanty, W., Indrajaya, S., Soonsan, N., Sangthong, S., & Pattanapokinsakul, K. (2024). Improving e-learning mediating green innovation and green technology for green management practice. Discover Sustainability, 5(1), 263. [CrossRef]
- Ogiemwonyi, O. (2024). Determinants of green behavior (Revisited): A comparative study. Resources, Conservation & Recycling Advances, 22, 200214. [CrossRef]
- Ojo, A. O., Raman, M., & Downe, A. G. (2019). Toward green computing practices: A Malaysian study of green belief and attitude among information technology professionals. Journal of cleaner production, 224, 246-255. [CrossRef]
- Oswald, T. K., Rumbold, A. R., Kedzior, S. G., & Moore, V. M. (2020). Psychological impacts of “screen time” and “green time” for children and adolescents: A systematic scoping review. PloS one, 15(9), e0237725. [CrossRef]
- Peng, X. Y., Fu, Y. H., & Zou, X. Y. (2024). Gender equality and green development: A qualitative survey. Innovation and Green Development, 3(1), 100089. [CrossRef]
- Podder, S. K., & Samanta, D. (2022). Green computing practice in ICT-based methods. International Journal of Web-Based Learning and Teaching Technologies, 17(4). [CrossRef]
- Qazi, A., Hasan, N., Abayomi-Alli, O., Hardaker, G., Scherer, R., Sarker, Y., ... & Maitama, J. Z. (2022). Gender differences in information and communication technology use & skills: A systematic review and meta-analysis. Education and information technologies, 27(3), 4225-4258. [CrossRef]
- Qin, X., Muskat, B., Ambrosini, V., Mair, J., & Chih, Y. Y. (2025). Green innovation implementation: A systematic review and research directions. Journal of Management, 52(1), 255-282. [CrossRef]
- Radu, L. D. (2016). Determinants of green ICT adoption in organizations: a theoretical perspective. Sustainability, 8(8), 731. [CrossRef]
- Rakha, A. H. (2025) Cooperative learning with QR codes technology: enhancing cognitive achievement and attitudes among students. Front. Educ. 10:1655913. [CrossRef]
- Ramli, S. A., Chew, B. C., & Saptari, A. (2021). Factors in adopting green information technology: A qualitative study in Malaysia. Pertanika Journal of Science & Technology, 29(3), 1431 - 1450. [CrossRef]
- Ramli, Y., Permana, D., Soelton, M., Yuliantini, T., Wibowo, A., Kartini, D., & Ali, A. J. (2025). The effects of green technology, energy efficiency and environmental concerns to improve sustainable environment: Moderating role of the organizational awareness. International Journal of Energy Economics and Policy, 15(2), 102–111. [CrossRef]
- Ramstetter, L., & Habersack, F. (2019). Do women make a difference? Analysing environmental attitudes and actions of members of the European Parliament. Environmental Politics, 29(6), 1063–1084. [CrossRef]
- Rashid, R. A. A., & Shafie, M. S. (2018). Green ICT and environmental sustainability: Awareness of Malaysian teachers. International Journal of Engineering & Technology, 7(4.38), 1012-1016. https://DOI:10.14419/ijet.v7i4.38.27628.
- Roy, S. K. (2023). Impact of green factors on undergraduate students’ green behavioral intentions: A hybrid two-stage modeling approach. Heliyon, 9(10), e20630. [CrossRef]
- Ruiu, M. L., Ruiu, G., Ragnedda, M., & Addeo, F. (2026). The intersection of digital practices and environmental orientations: Exploring digital-environmental habitus. Journal of Information, Communication and Ethics in Society, 24(1), 1-30. [CrossRef]
- Salles, A. C., Lunardi, G. L., & Thompson, F. (2022). A framework proposal to assess the maturity of green IT in organizations. Sustainability, 14(19), 12348. [CrossRef]
- Shah, H. (2023). Beyond smart: How ICT is enabling sustainable cities of the future. Sustainability, 15(16), 12381. [CrossRef]
- Shahzad, M., Qu, Y., Rehman, S. U., & Zafar, A. U. (2022). Adoption of green innovation technology to accelerate sustainable development among manufacturing industry. Journal of Innovation & Knowledge, 7(4), 100231. [CrossRef]
- Singh, O. P., & Singh, P. (2018). Green technologies in ICT sector for development: A path to environmental sustainability. International Journal of Technology, 9(1), 35-43.
- Soriano-Sánchez, J. G. (2025). The impact of ICT on primary school students’ natural science learning in support of diversity: Ameta-analysis. Education Sciences, 15(6), 690. [CrossRef]
- Su, J., & Yang, W. (2023). A systematic review of integrating computational thinking in early childhood education. Computers and Education Open, 4, 100122. [CrossRef]
- Suryawanshi, K., & Narkhede, S. (2014). Green ICT at higher education institution: Solution for sustenance of ICT in future. International Journal of Computer Applications, 107(14), 35-38.
- Suryawanshi, K., & Narkhede, S. (2015). Green ICT for sustainable development: A higher education perspective. Procedia computer science, 70, 701-707. [CrossRef]
- Świątkowski, W., Surret, F. L., Henry, J., Buchs, C., Visintin, E. P., & Butera, F. (2024). Interventions promoting pro-environmental behaviors in children: A meta-analysis and a research agenda. Journal of Environmental Psychology, 96, 102295. [CrossRef]
- Tanujaya, B., Prahmana, R. C. I., & Mumu, J. (2022). Likert scale in social sciences research: Problems and difficulties. FWU Journal of Social Sciences, 16(4), 89-101. https://doi.10.51709/19951272/Winter2022/7.
- Tariq, M. S., & Khalid, A. (2023). Placing green IT awareness and practices among universities’ librarians: A NAT perspective. The Journal of Academic Librarianship, 49(5), 102770. [CrossRef]
- Thabit, T. H., Ahmed, H. A. S., & Jasim, Y. A. (2021). The impact of green ICT adoption in organizations of developing countries. Al-riyada for Business Economics Journal, 7(1), 9-18.
- Tobishima, S. (2020). Gender and socioeconomic differences in adolescents’ perceived information and communication technology (ICT) competencies. Journal of Socio-Informatics, 13(1), 1-13. [CrossRef]
- Tudu, P. N., & Mishra, V. (2025). Toward smart and green: A sustainable IT-HRM framework. Technological Forecasting and Social Change, 218, 124201. [CrossRef]
- UNESCO Global education monitoring report team. (2023). Global education monitoring report, 2023: technology in education: A tool on whose terms? UNESCO. [CrossRef]
- UNESCO. (2024). Global education monitoring report 2024: Gender report—Technology on her terms. UNESCO. [CrossRef]
- United Nations Educational, Scientific and Cultural Organization. (2023). Key data on girls’ and women’s right to education. UNESCO. https://www.unesco.org/en/articles/key-data-girls-and-womens-right-education.
- United Nations. (2024). Digital economy report 2024: Shaping an environmentally sustainable and inclusive digital future. United Nations. https://unctad.org/system/files/official-document/der2024_en.pdf.
- Vaishnav, P. (2023). Implications of green technologies for environmental justice. Annual Review of Environment and Resources, 48(1), 505-530. [CrossRef]
- Wadkar, S. K., Singh, K., Chakravarty, R., & Argade, S. D. (2016). Assessing the reliability of attitude scale by Cronbach’s alpha. Journal of Global Communication, 9(2), 113-117. https://doi:10.5958/0976-2442.2016.00019.7.
- Wang, H. Y., Lin, V., Hwang, G. J., & Liu, G. Z. (2019). Context-aware language-learning application in the green technology building: Which group can benefit the most?. Journal of Computer Assisted Learning, 35(3), 359-377. [CrossRef]
- Wang, J., Sun, X., Zhang, W., Gao, L., Lu, J., & Guo, Z. (2026). The effect of homophonic puns on green purchase intention: The mediating role of affiliative humor and the moderation of visual salience. Journal of Theoretical and Applied Electronic Commerce Research, 21(1), 17. [CrossRef]
- Wei, J., & Zhang, X. (2023). The role of big data in promoting green development: based on the quasi-natural experiment of the big data experimental zone. International Journal of Environmental Research and Public Health, 20(5), 4097. [CrossRef]
- Wu, J., Ahmad, S. F., Ali, Y. A., Al-Razgan, M., Awwad, E. M., & Ayassrah, A. Y. B. A. (2024). Investigating the role of green behavior and perceived benefits in shaping green car buying behavior with environmental awareness as a moderator. Heliyon, 10(9). [CrossRef]
- Xiao, Y., Liu, Y., & Hu, J. (2019). Regression analysis of ICT impact factors on early adolescents’ reading proficiency in five high-performing countries. Frontiers in psychology, 10, 1646. [CrossRef]
- Yoshinov, R., Trifonov, R., Pavlova, G., & Borissova, D. (2023). Effects of ICT on the environment and indicators for their measurement. International Journal of Environmental Engineering and Development, 1, 119-126. https://DOI:10.37394/232033.2023.1.14.
- Yu, R., Wang, M., & Hu, J. (2023). The relationship between ICT perceived competence and adolescents’ digital reading performance: A multilevel mediation study. Journal of Educational Computing Research, 61(4), 817-846. [CrossRef]
- Yudatama, U., Setiawan, A., & Sukmasetya, P. (2025). Analysis of success factors for green information technology implementation in the higher education sector in Indonesia. High Tech and Innovation Journal, 6(2), 501-523. [CrossRef]
- Zhao, Z., Gong, Y., Li, Y., Zhang, L., & Sun, Y. (2021). Gender-related beliefs, norms, and the link with green consumption. Frontiers in Psychology, 12, 710239. [CrossRef]
- Zhuo, Z., Ren, Z., & Zhu, Z. (2022). Attitude-behavior gap in green consumption behavior: a review. Journal of Economics, Management and Trade, 28(12), 12-28. [CrossRef]
- Zulkepeli, L., Fauzi, M. A., Suki N. M., Ahmad, M. H., Wider, W., & Rahamaddulla, S. R. (2024). Pro-environmental behavior and the theory of planned behavior: A state of the art science mapping. Management of Environmental Quality: An International Journal, 35(6), 1415–1433. [CrossRef]
Figure 2.
Effect of GICTA on adolescents’ perceptual adaptations.
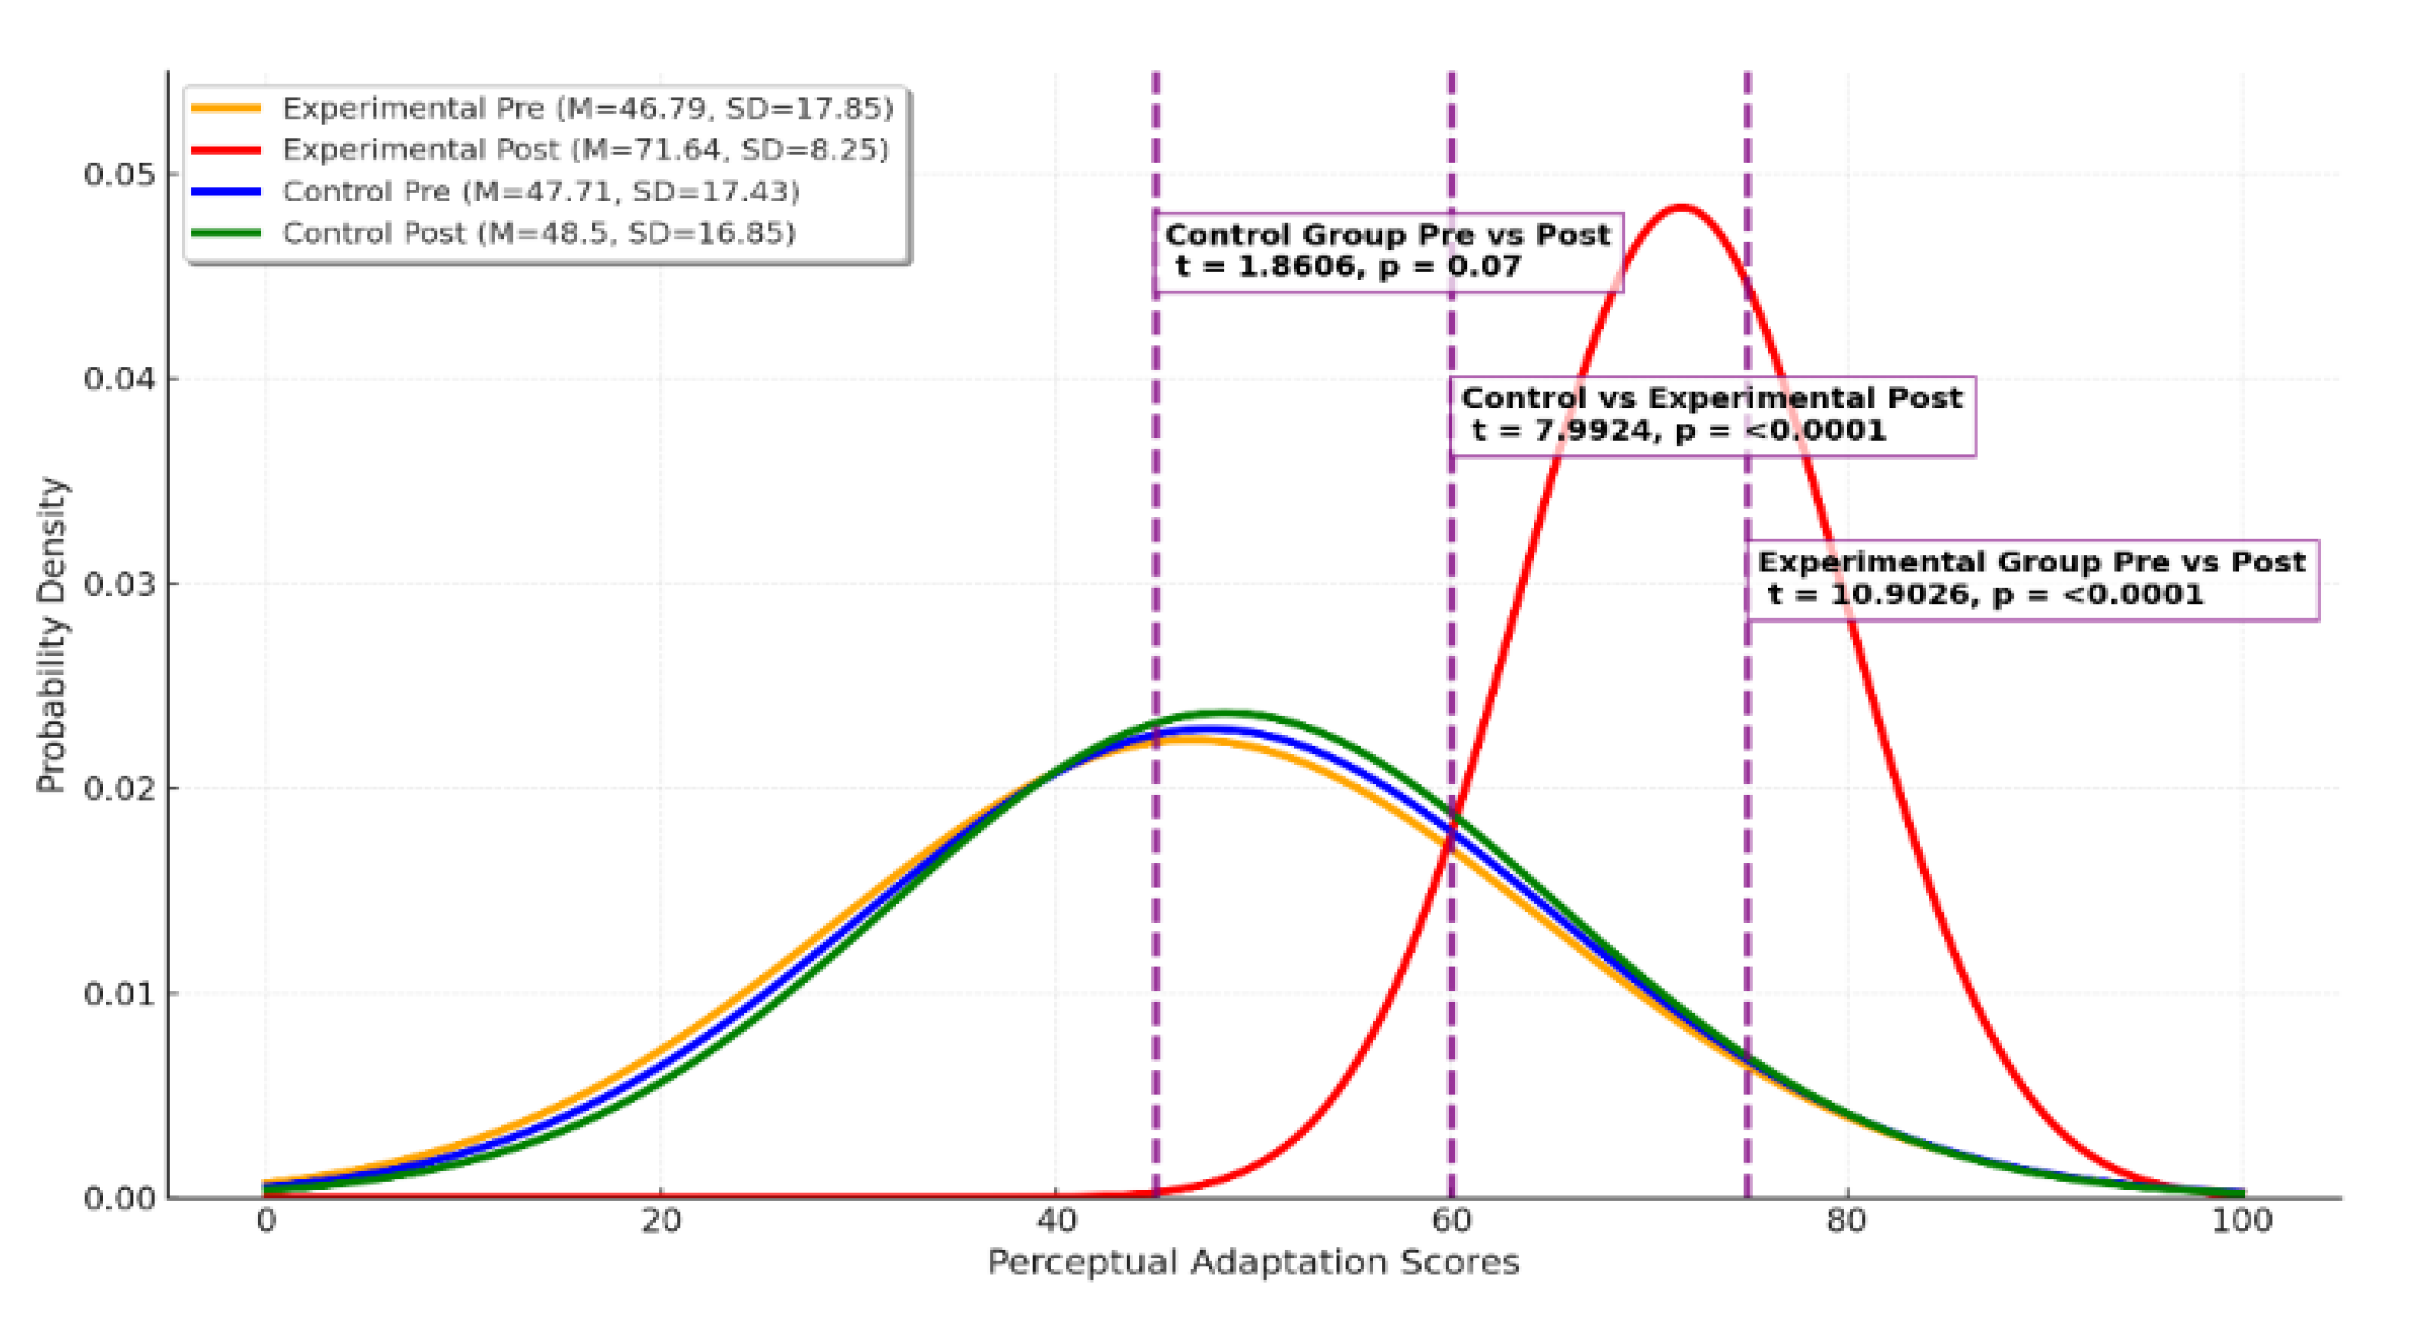
Figure 3.
Effect of GICTA on adolescents boys’ and girls’ perceptual adaptations across post-test experimental and control groups.
Figure 3.
Effect of GICTA on adolescents boys’ and girls’ perceptual adaptations across post-test experimental and control groups.
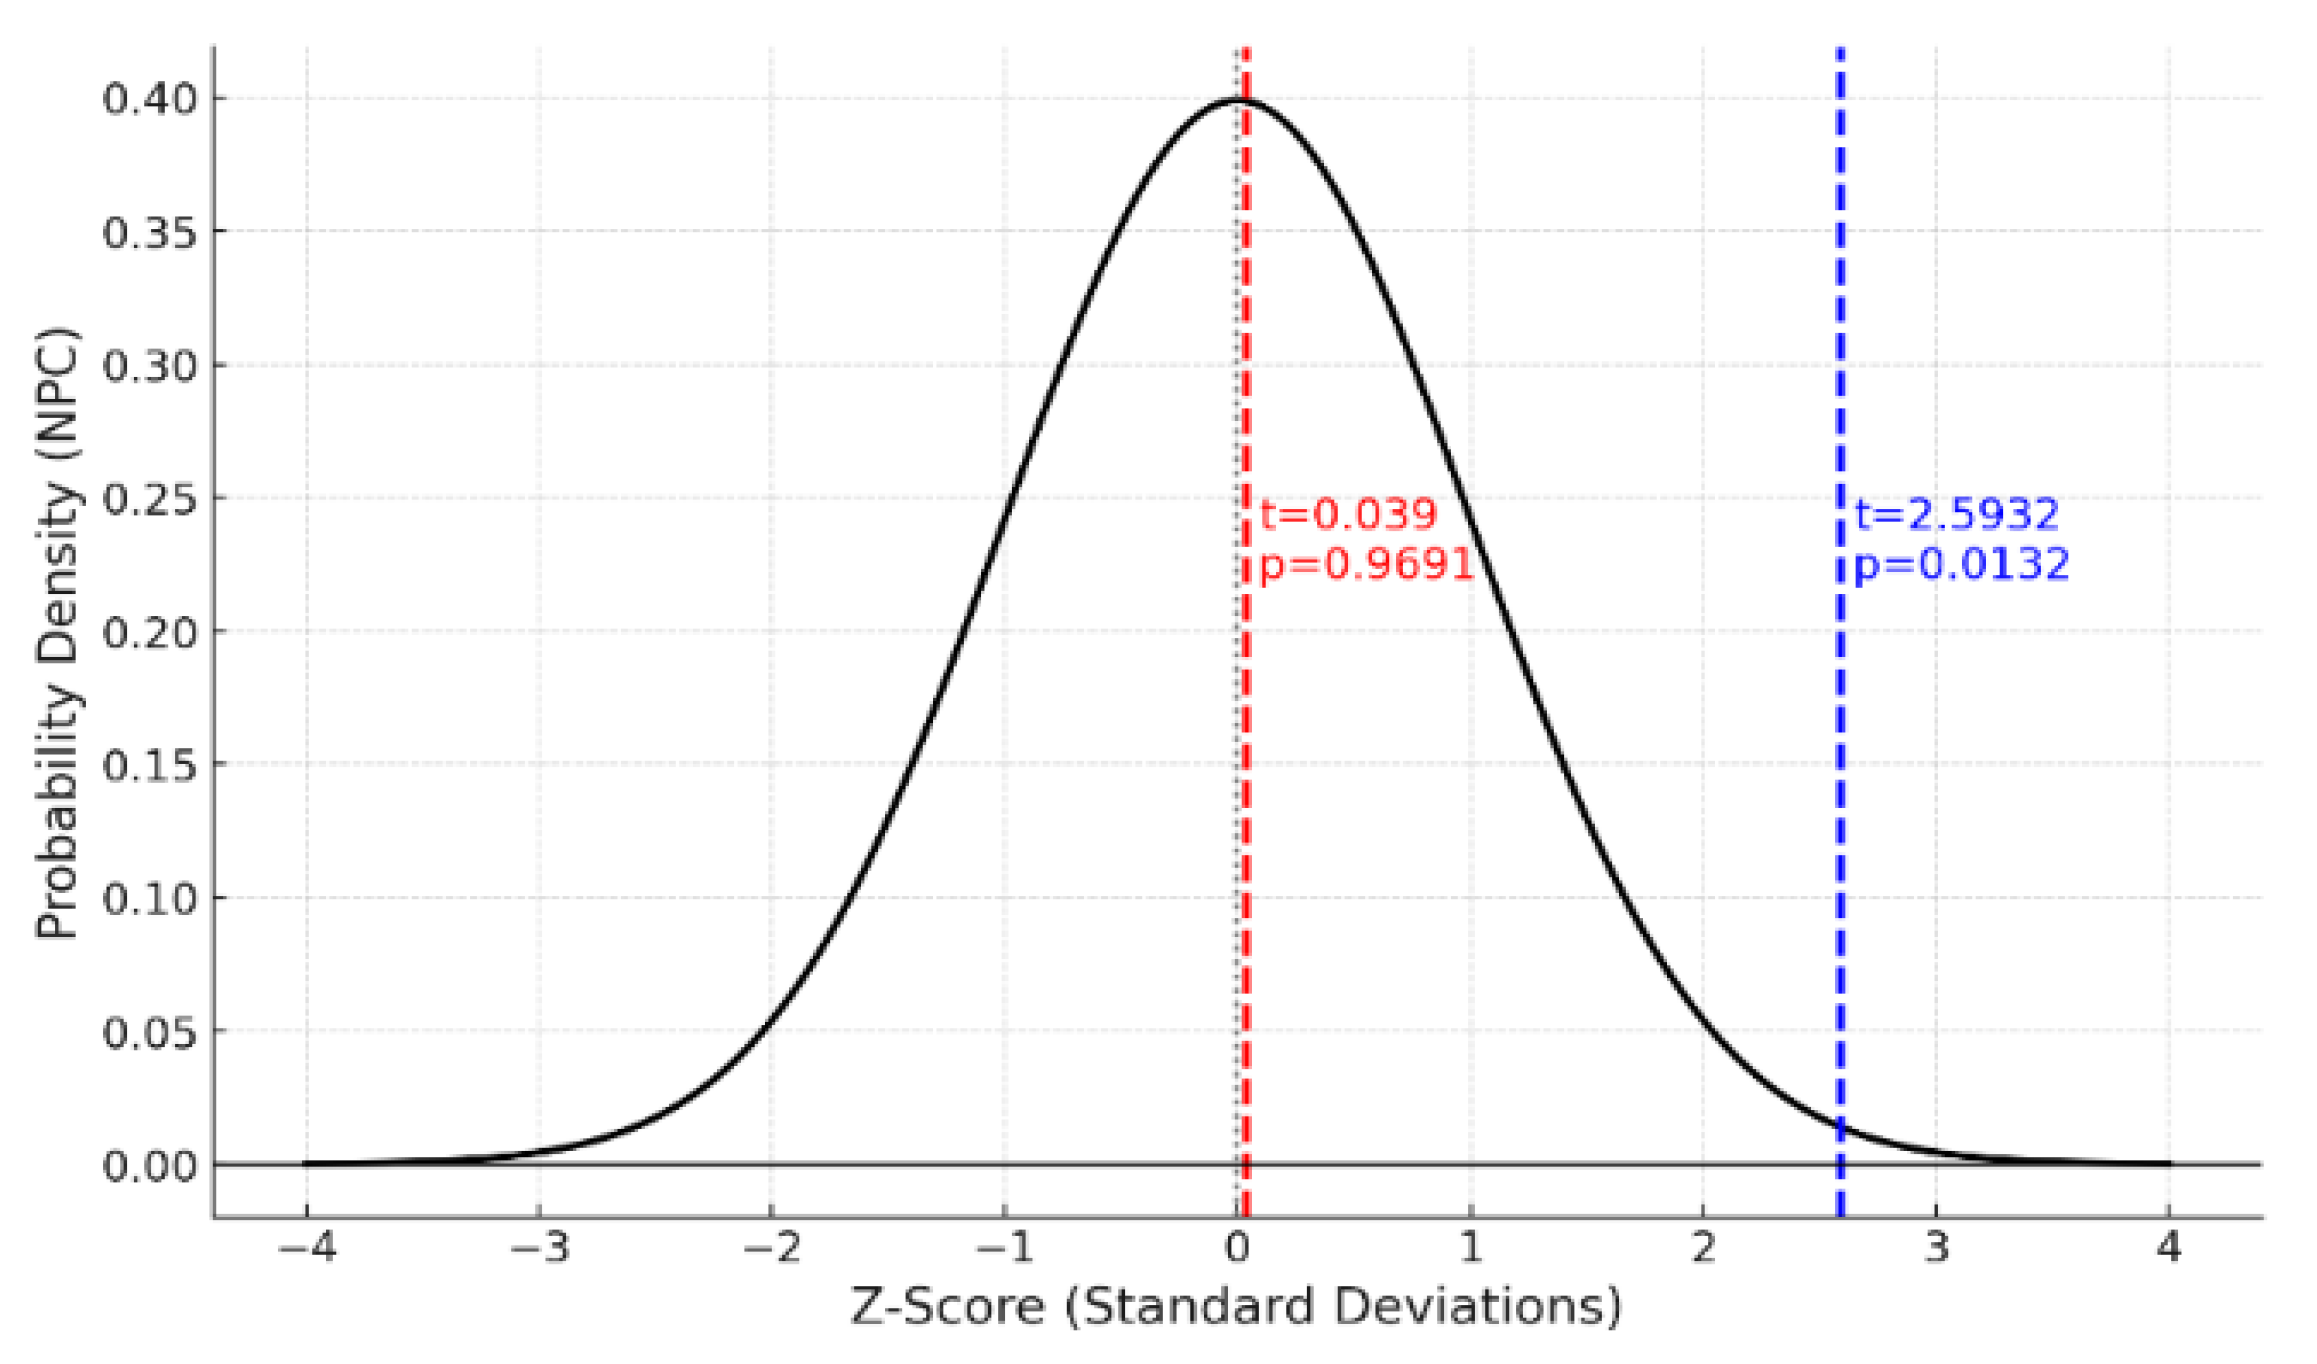
Figure 4.
Effect of GICTA on adolescents’ attitudinal adaptations.
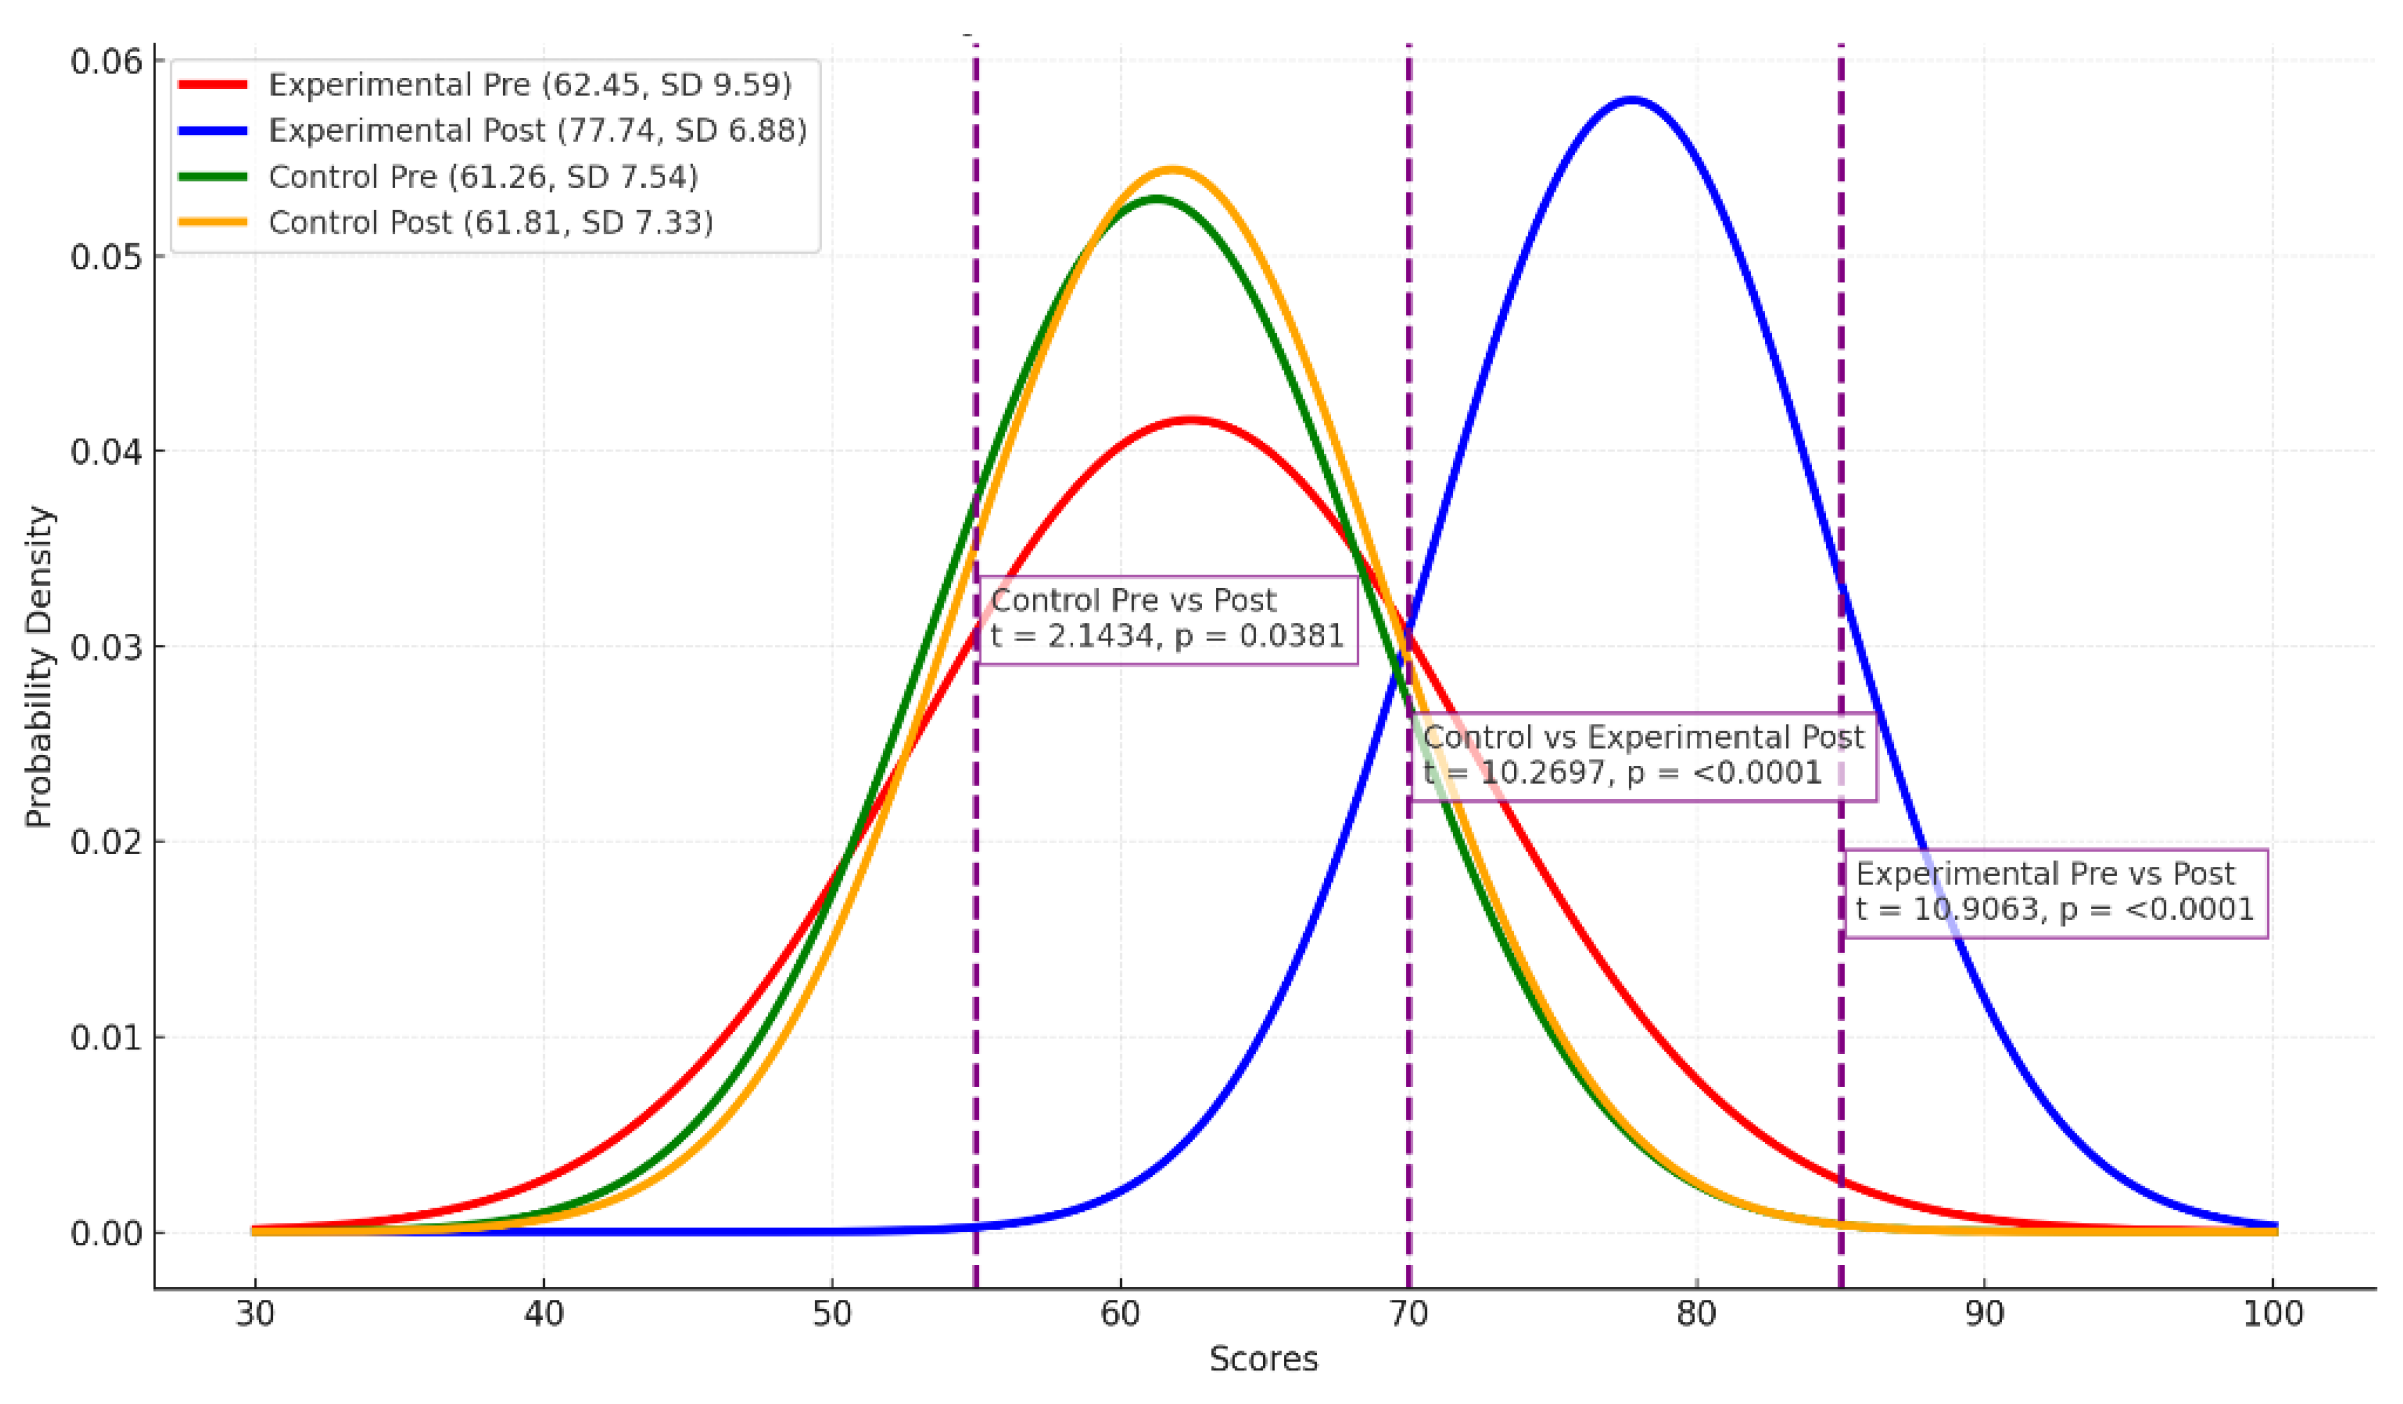
Figure 5.
Post-test effect of GICTA on boys’ and girls’ attitudinal adaptations across experimental and control groups.
Figure 5.
Post-test effect of GICTA on boys’ and girls’ attitudinal adaptations across experimental and control groups.
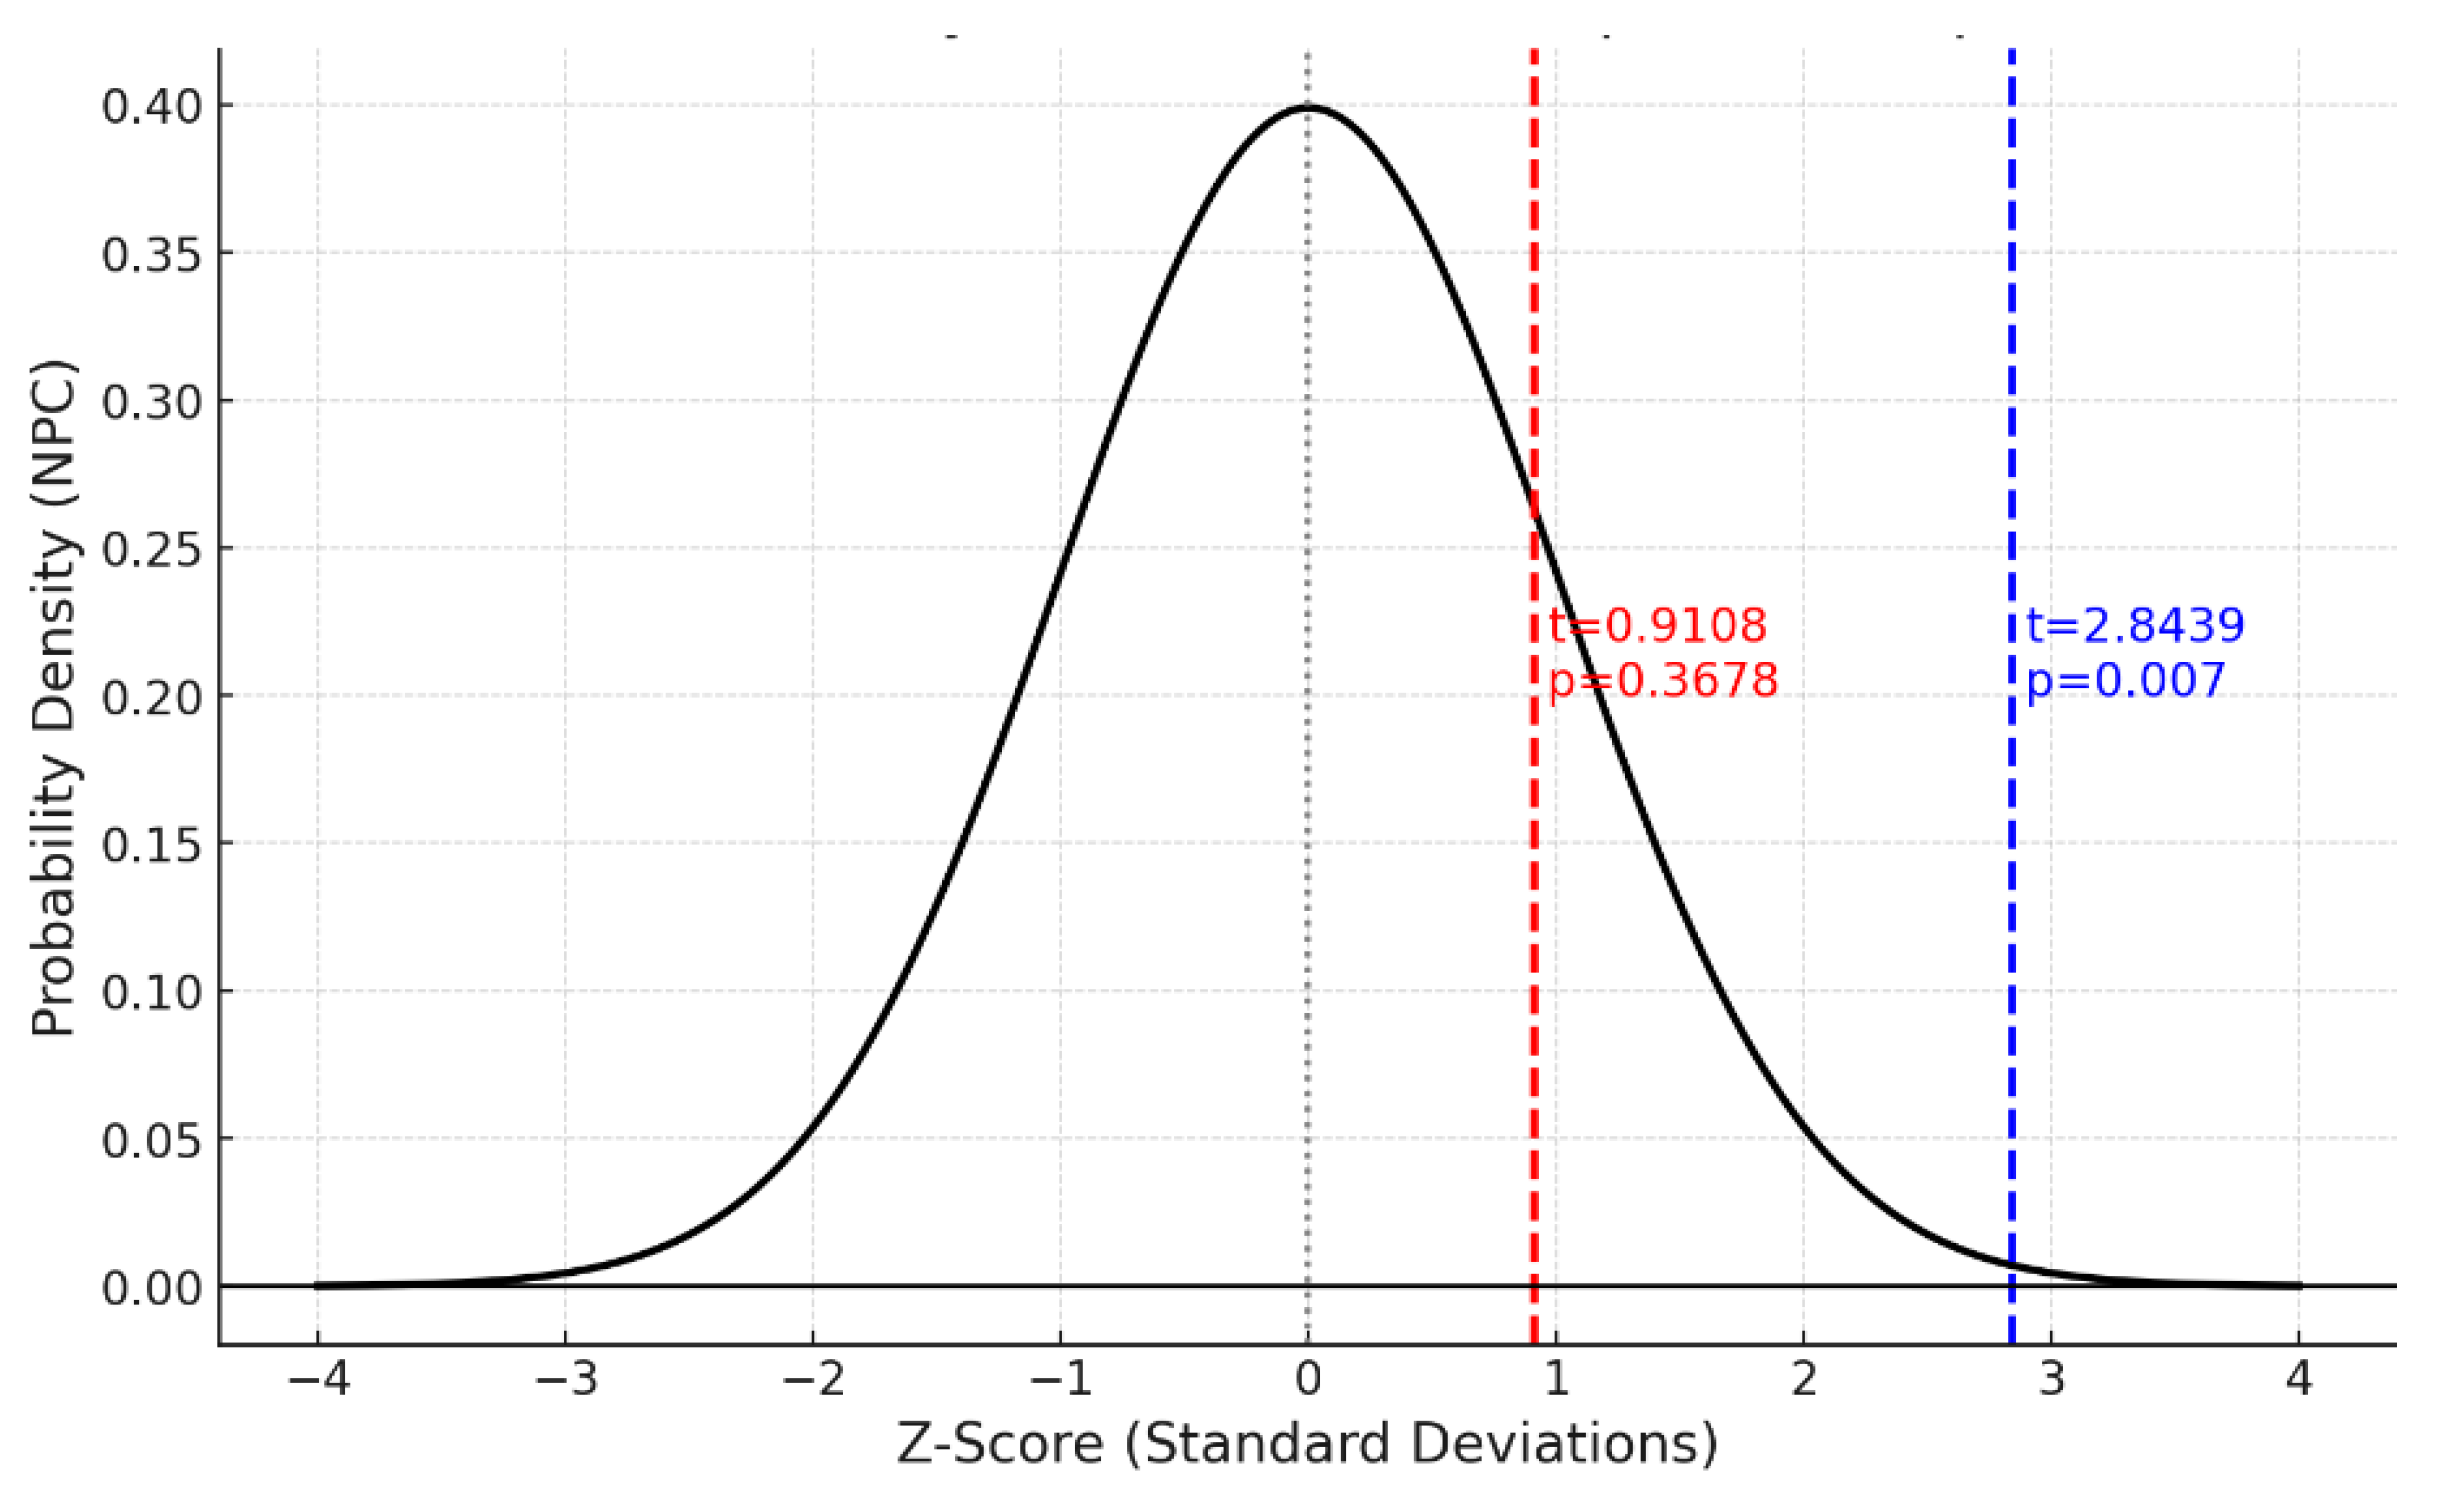
Figure 6.
Effect of GICTA on adolescents’ attitudinal adaptations.
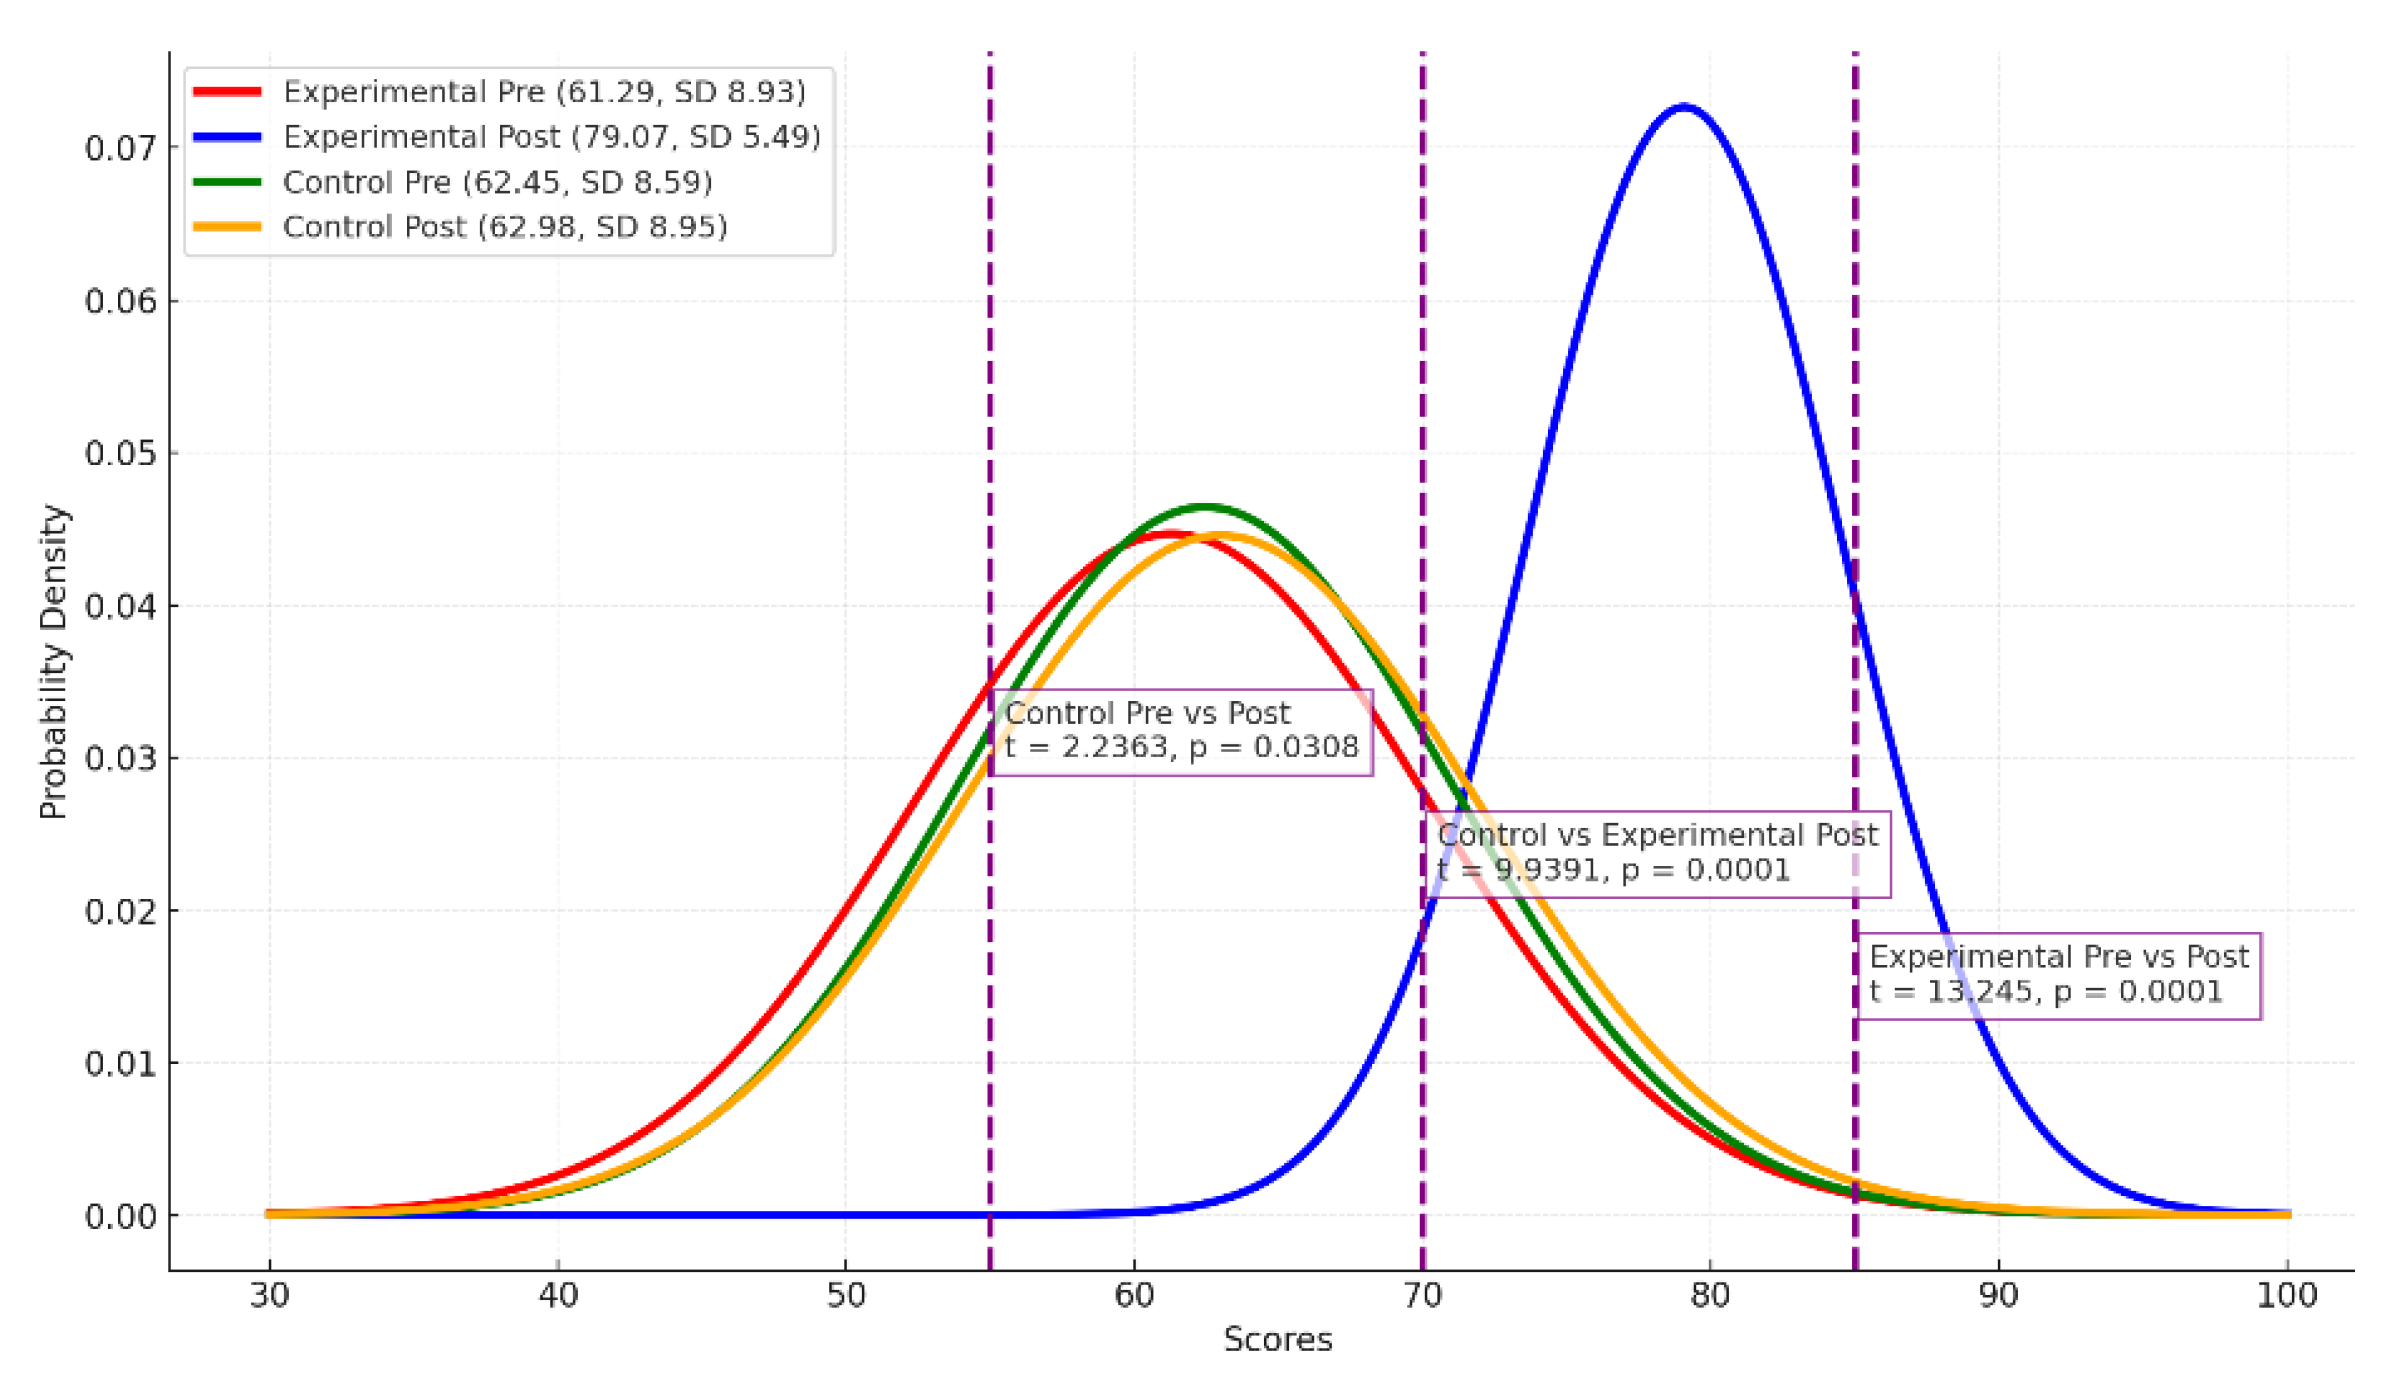
Figure 7.
Post-test effect of GICTA on boys’ and girls’ behavioural adaptations across experimental and control groups.
Figure 7.
Post-test effect of GICTA on boys’ and girls’ behavioural adaptations across experimental and control groups.
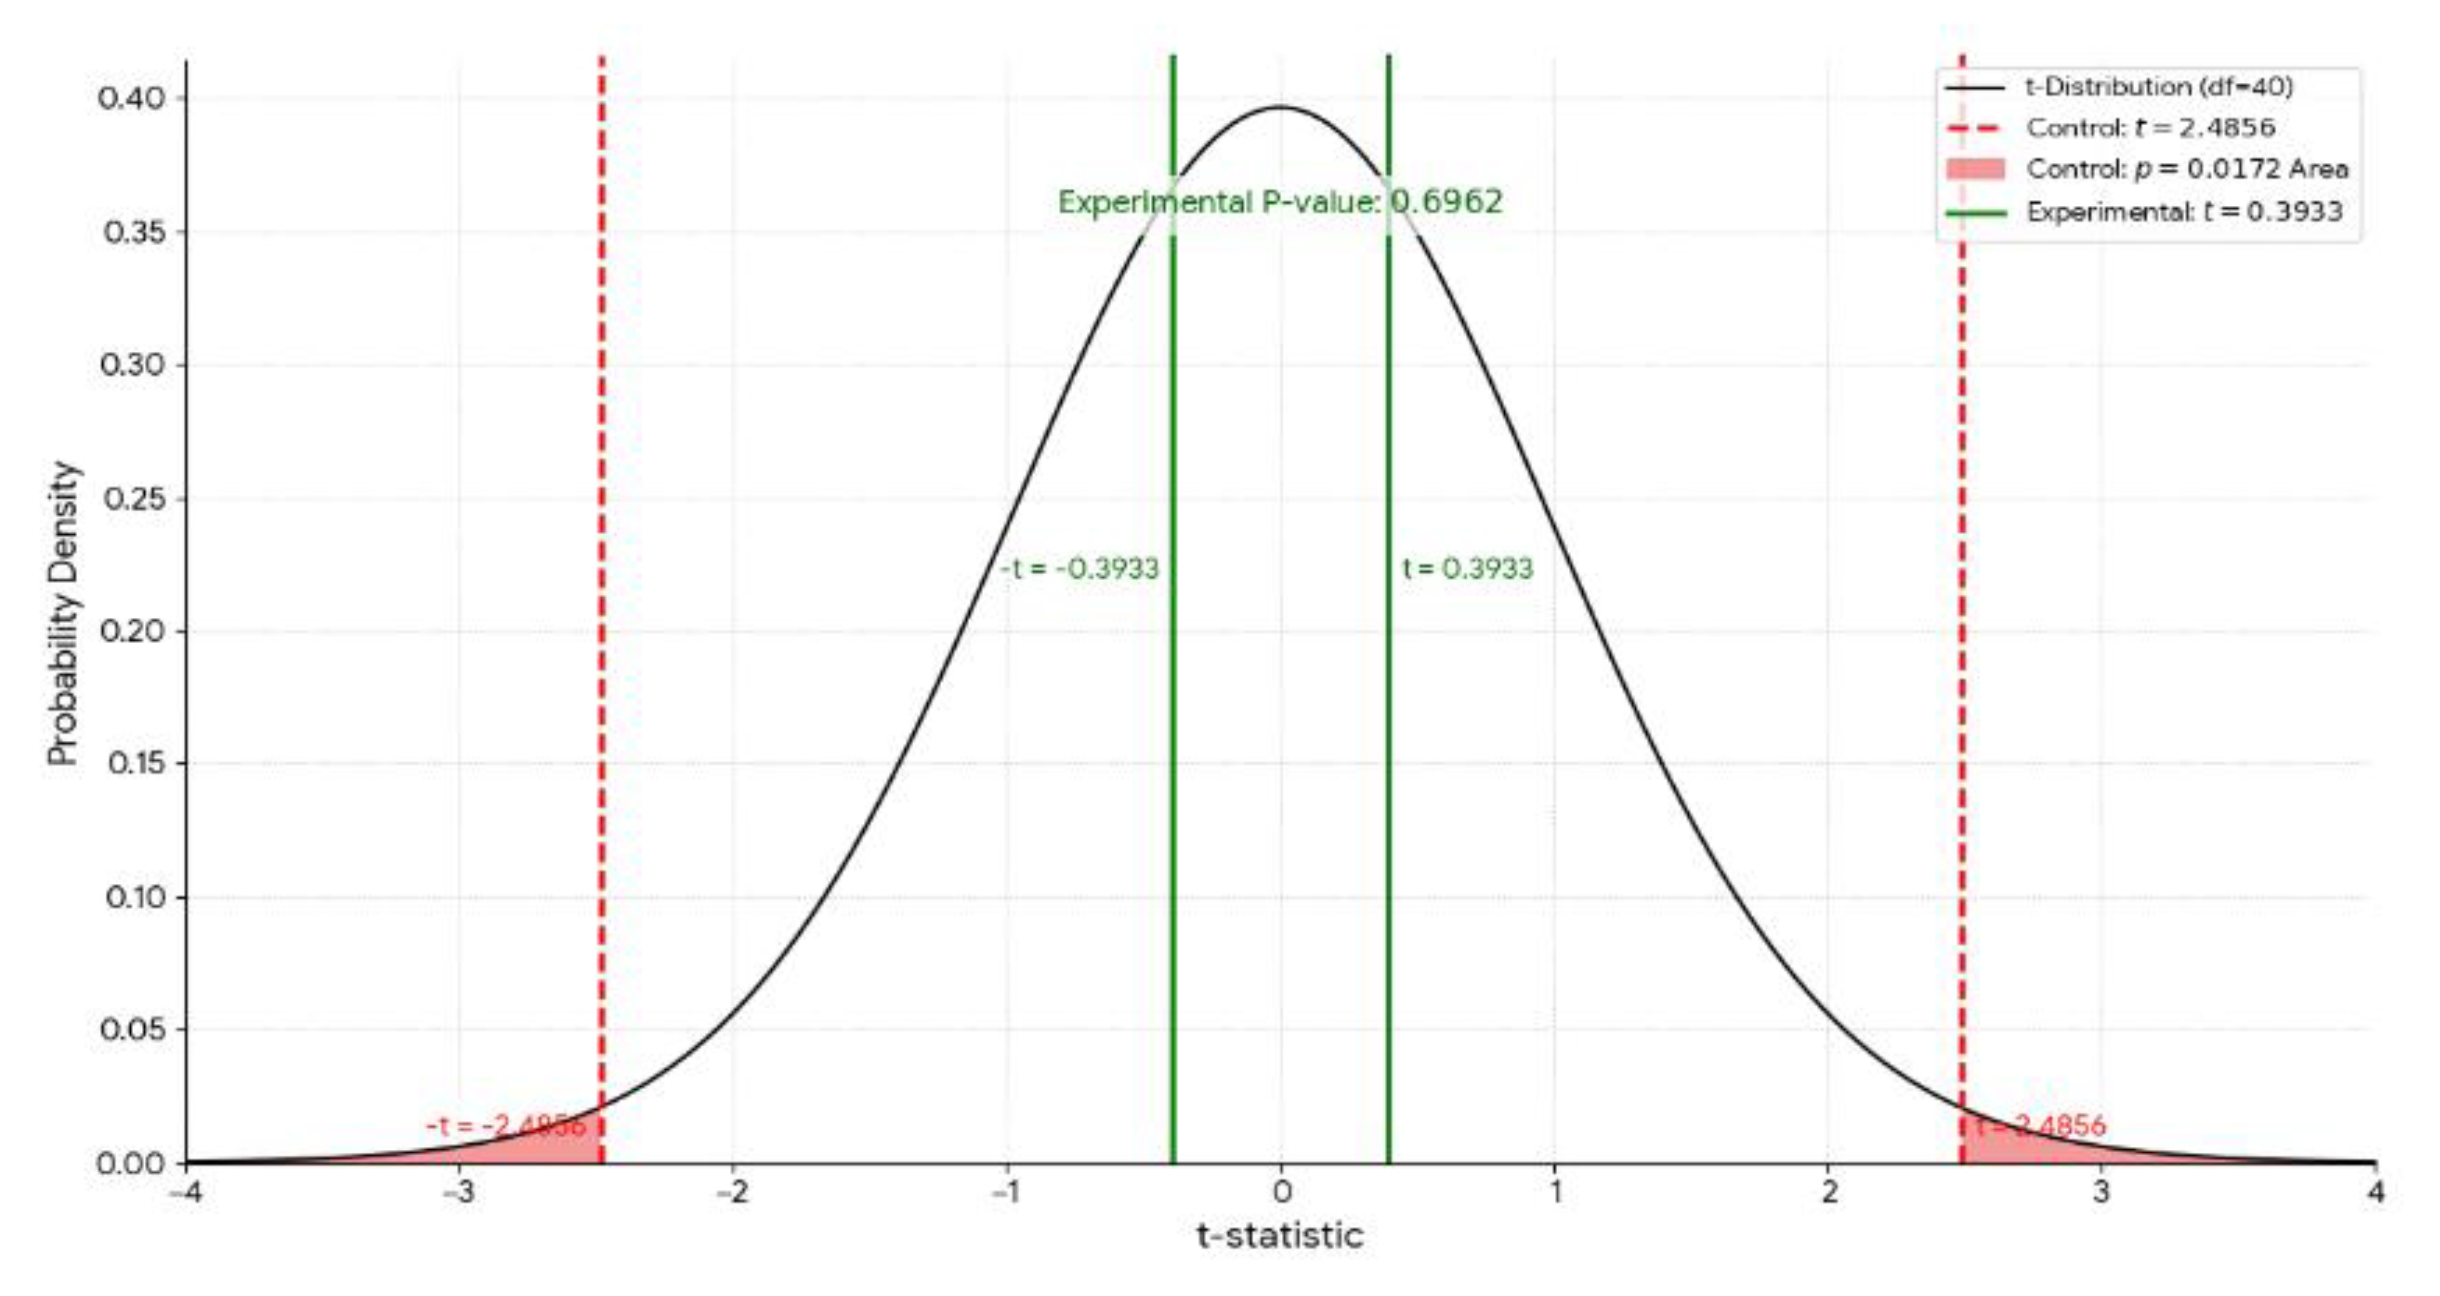
Figure 8.
GICTA’s effect on the relationships among adolescents’ perceptions, attitudes, and behavioral adaptations.
Figure 8.
GICTA’s effect on the relationships among adolescents’ perceptions, attitudes, and behavioral adaptations.
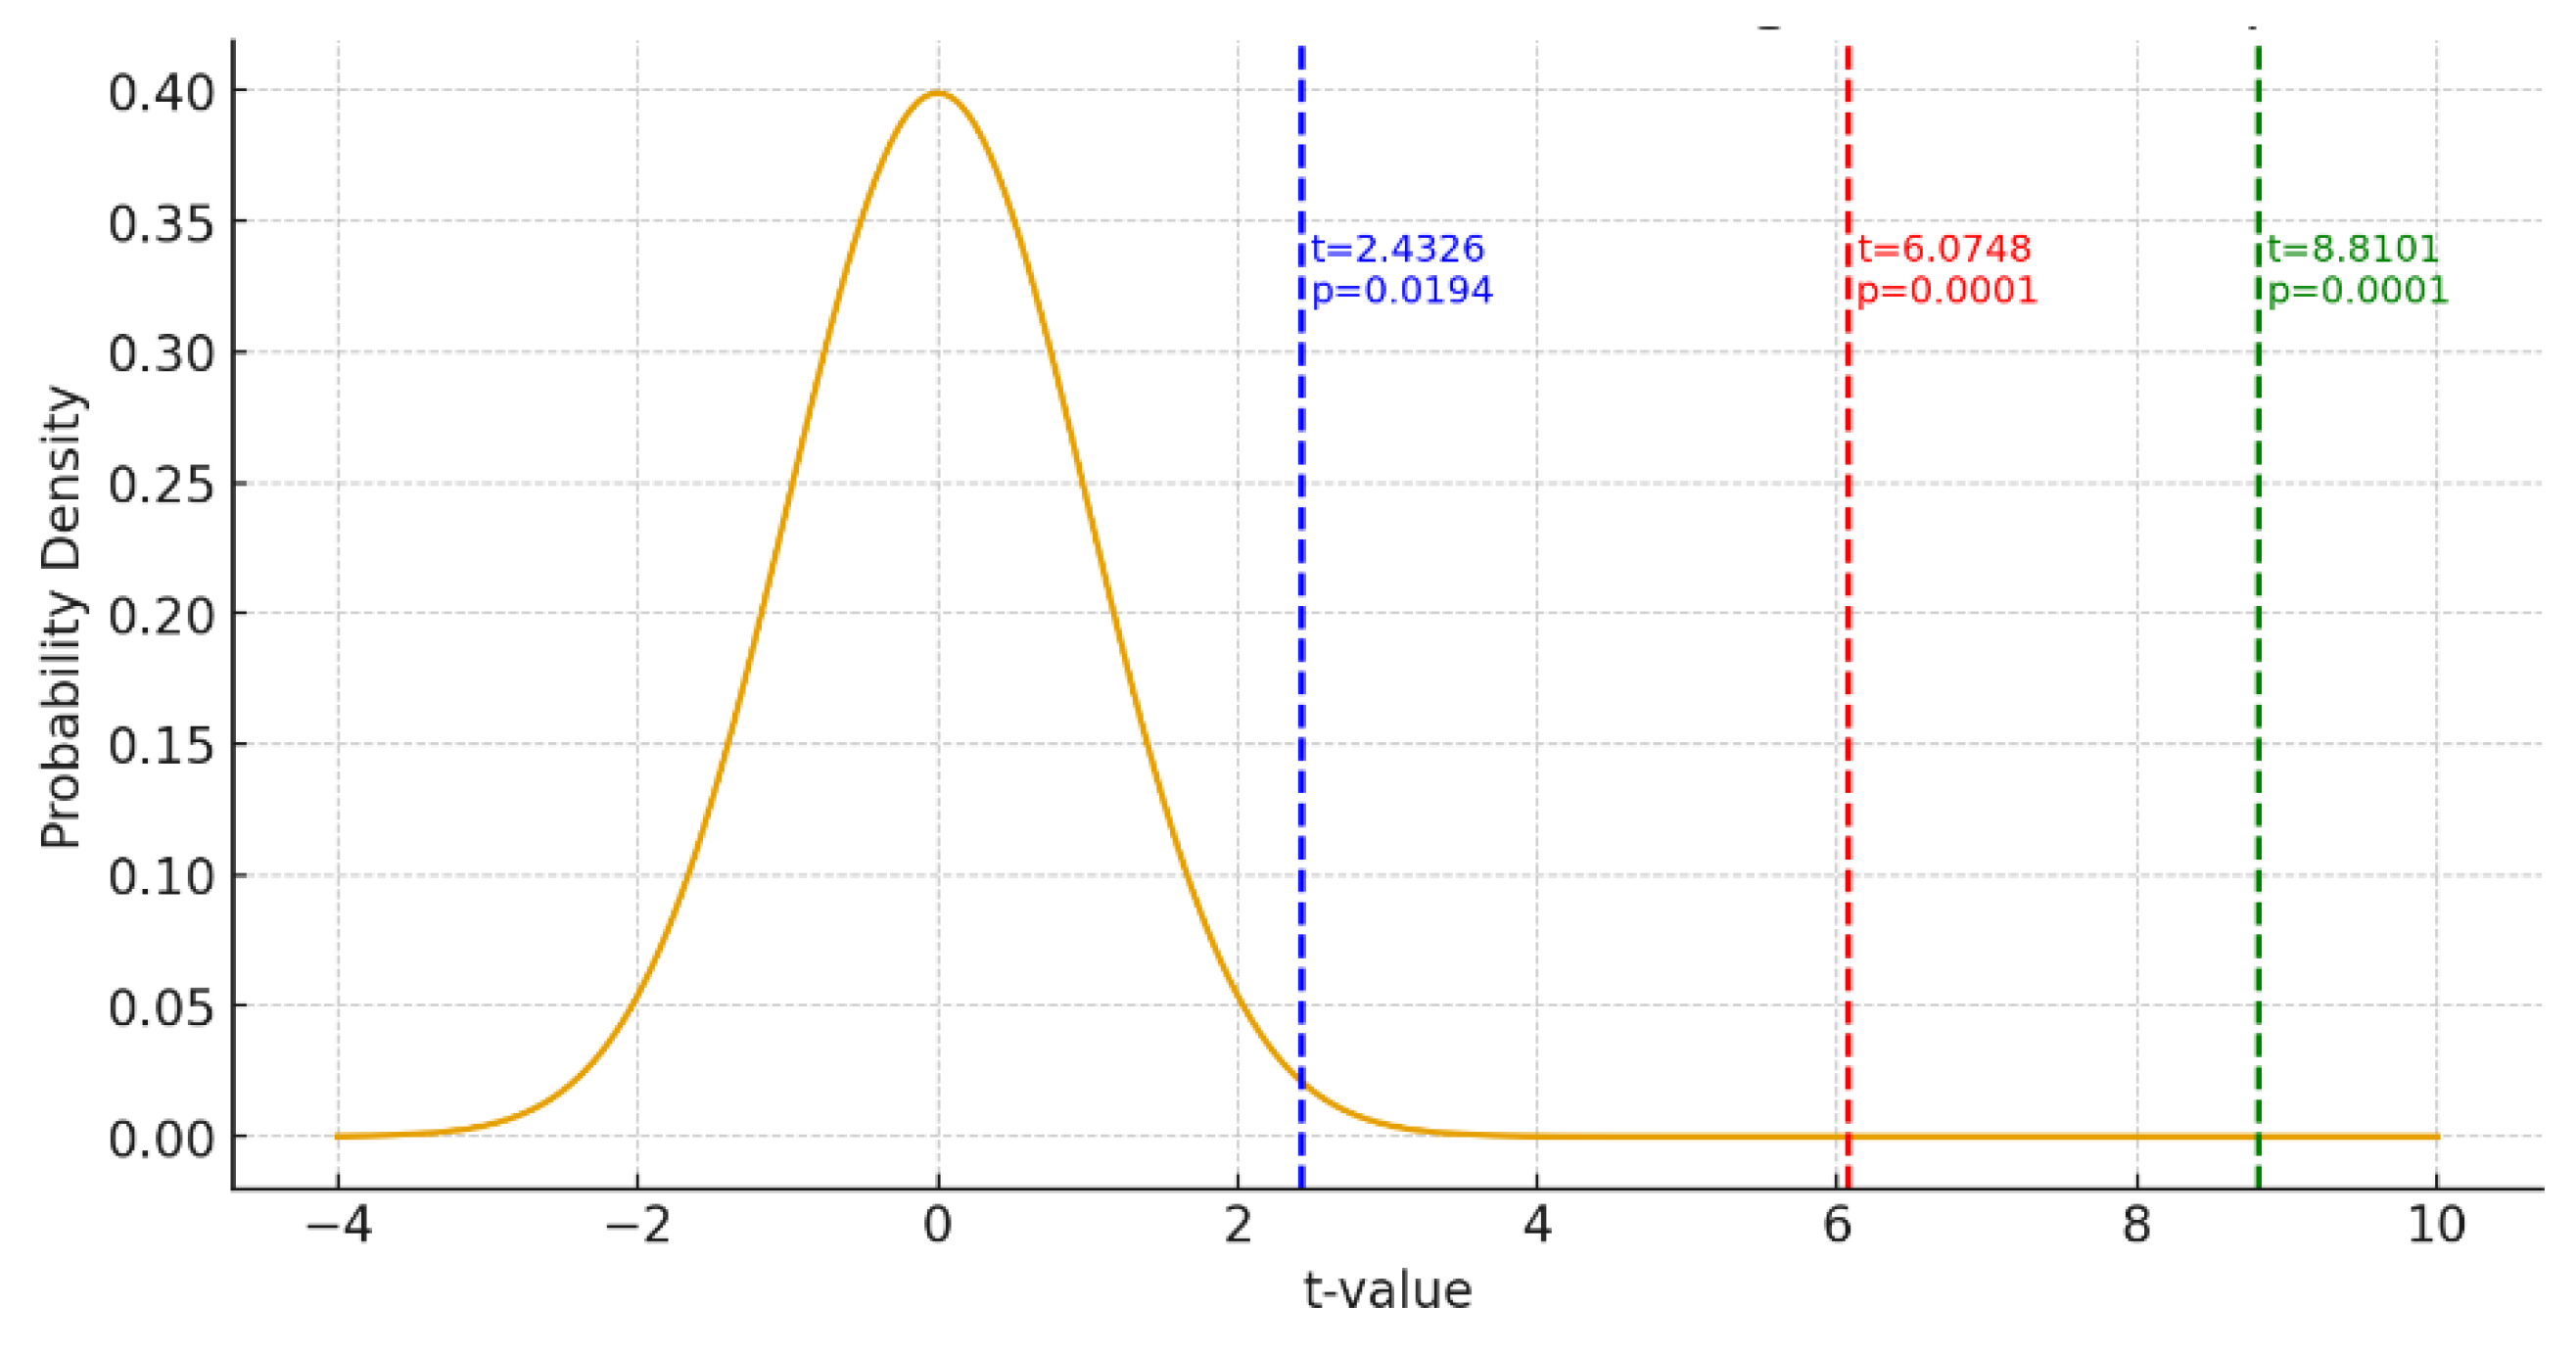
Figure 9.
A Reflective Examination of GICTA’s Effect on Students’ Perceptions, Attitudes, and Behavioral Adaptations.
Figure 9.
A Reflective Examination of GICTA’s Effect on Students’ Perceptions, Attitudes, and Behavioral Adaptations.
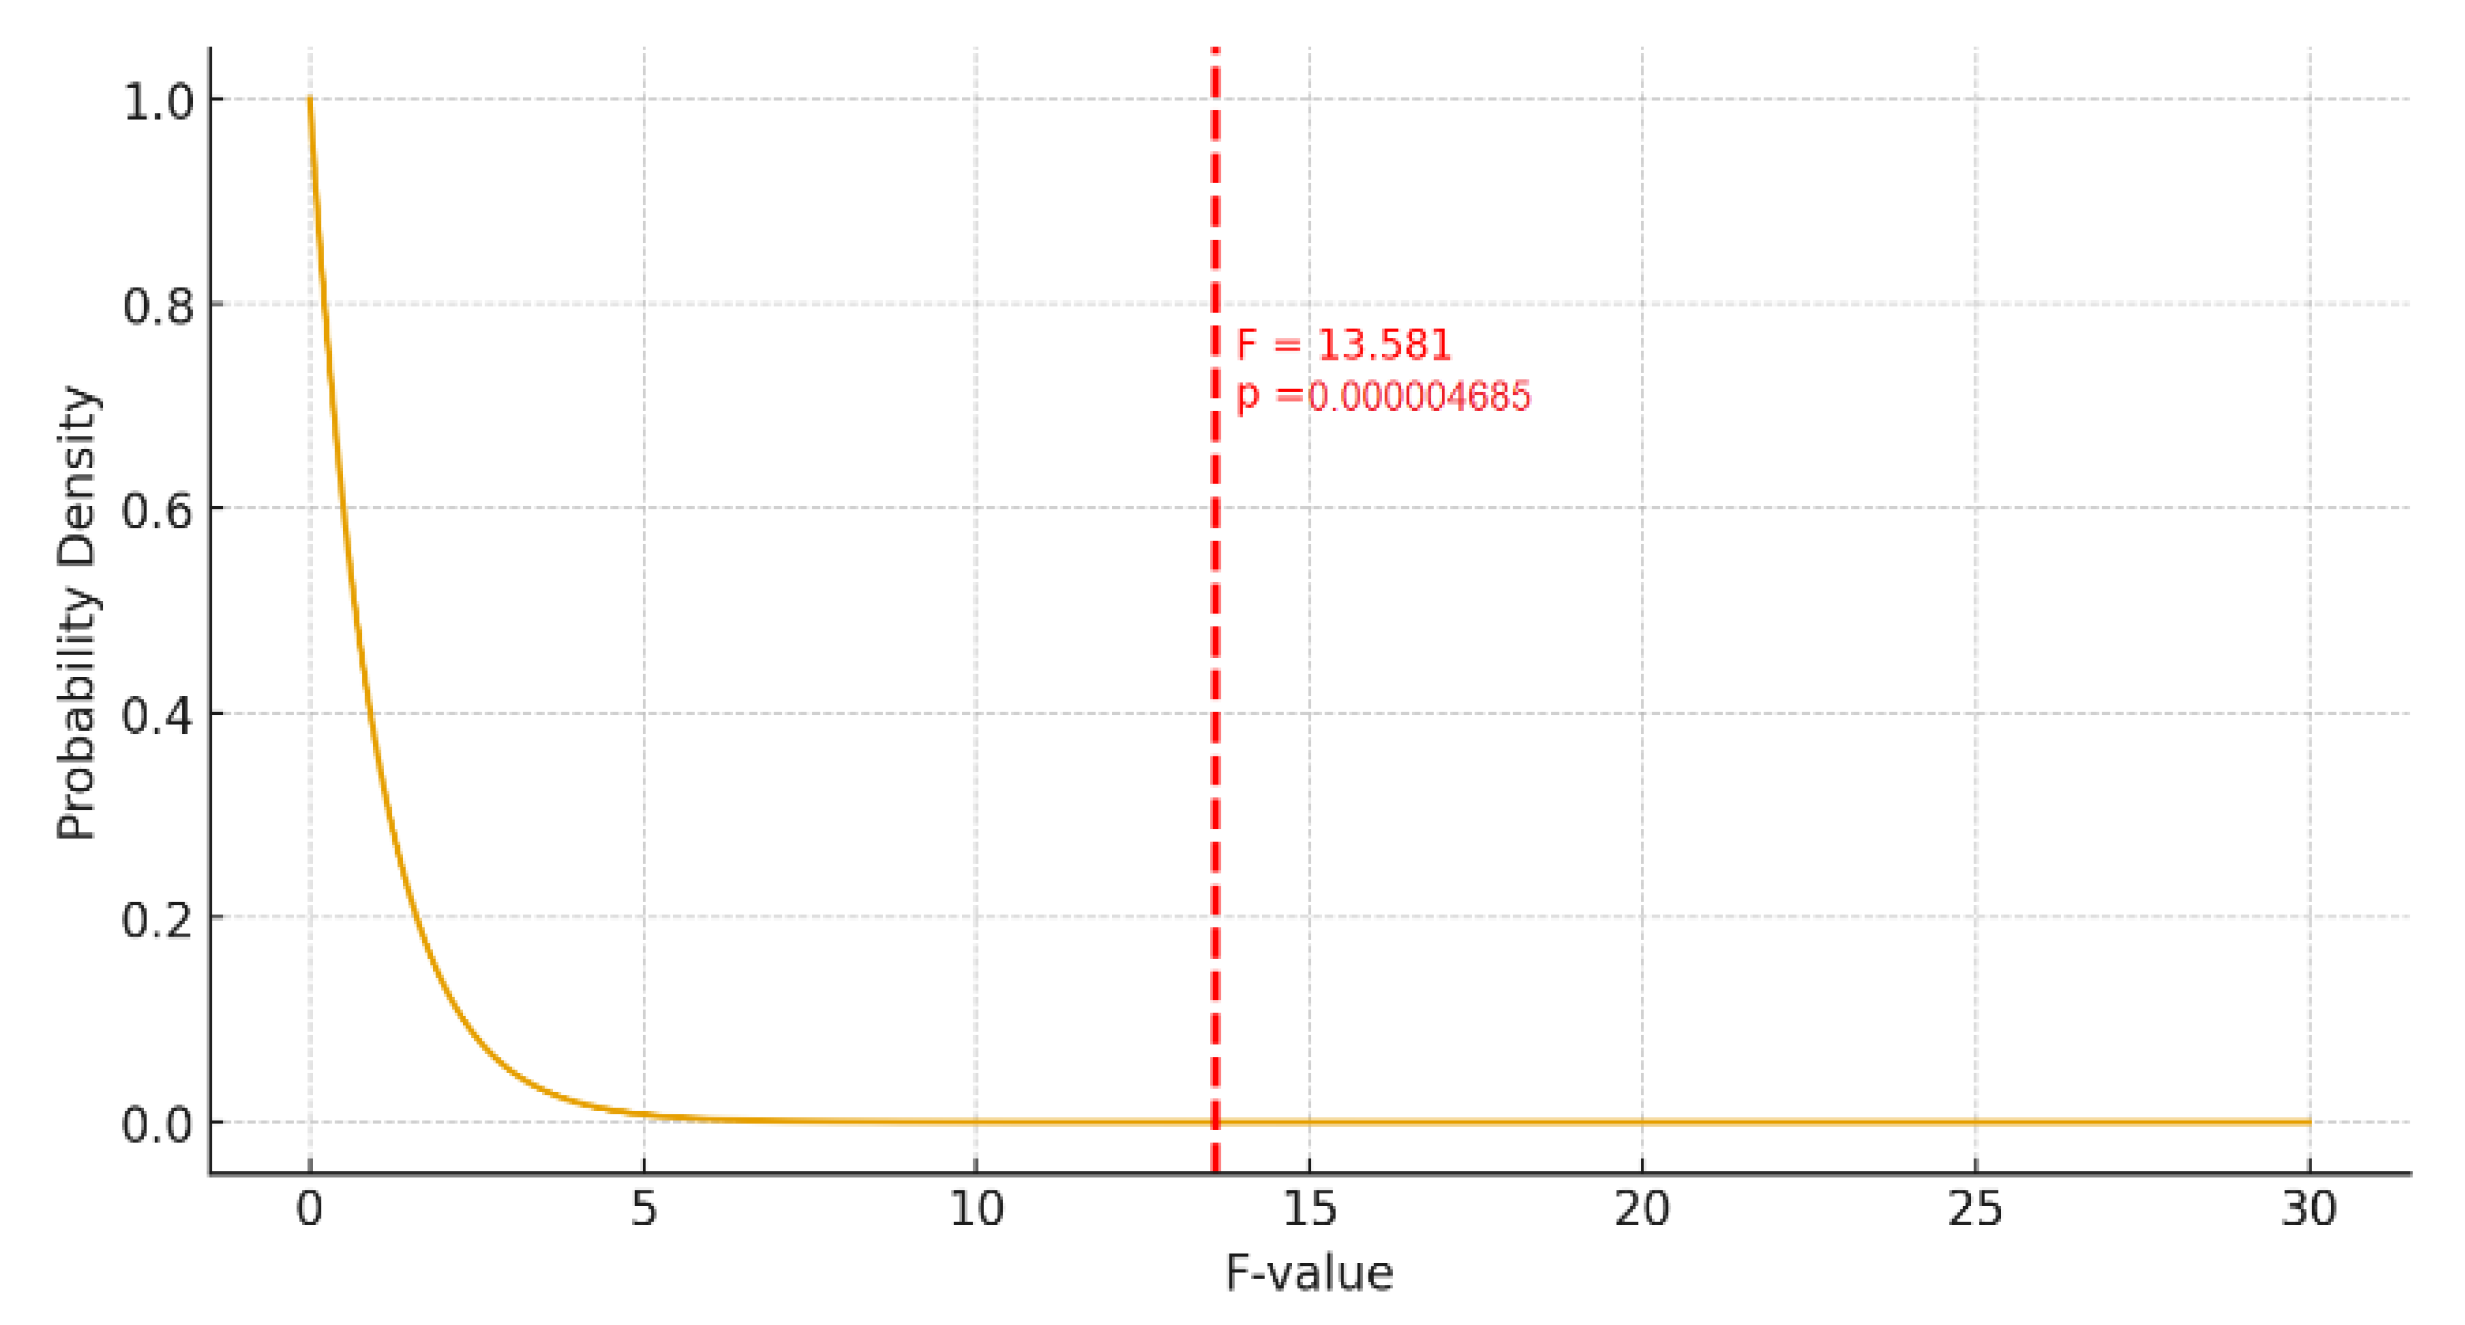
Figure 10.
Stream-wise effect of GICTA on adolescents’ perceptual, attitudinal, and behavioral adaptations in higher secondary education.
Figure 10.
Stream-wise effect of GICTA on adolescents’ perceptual, attitudinal, and behavioral adaptations in higher secondary education.
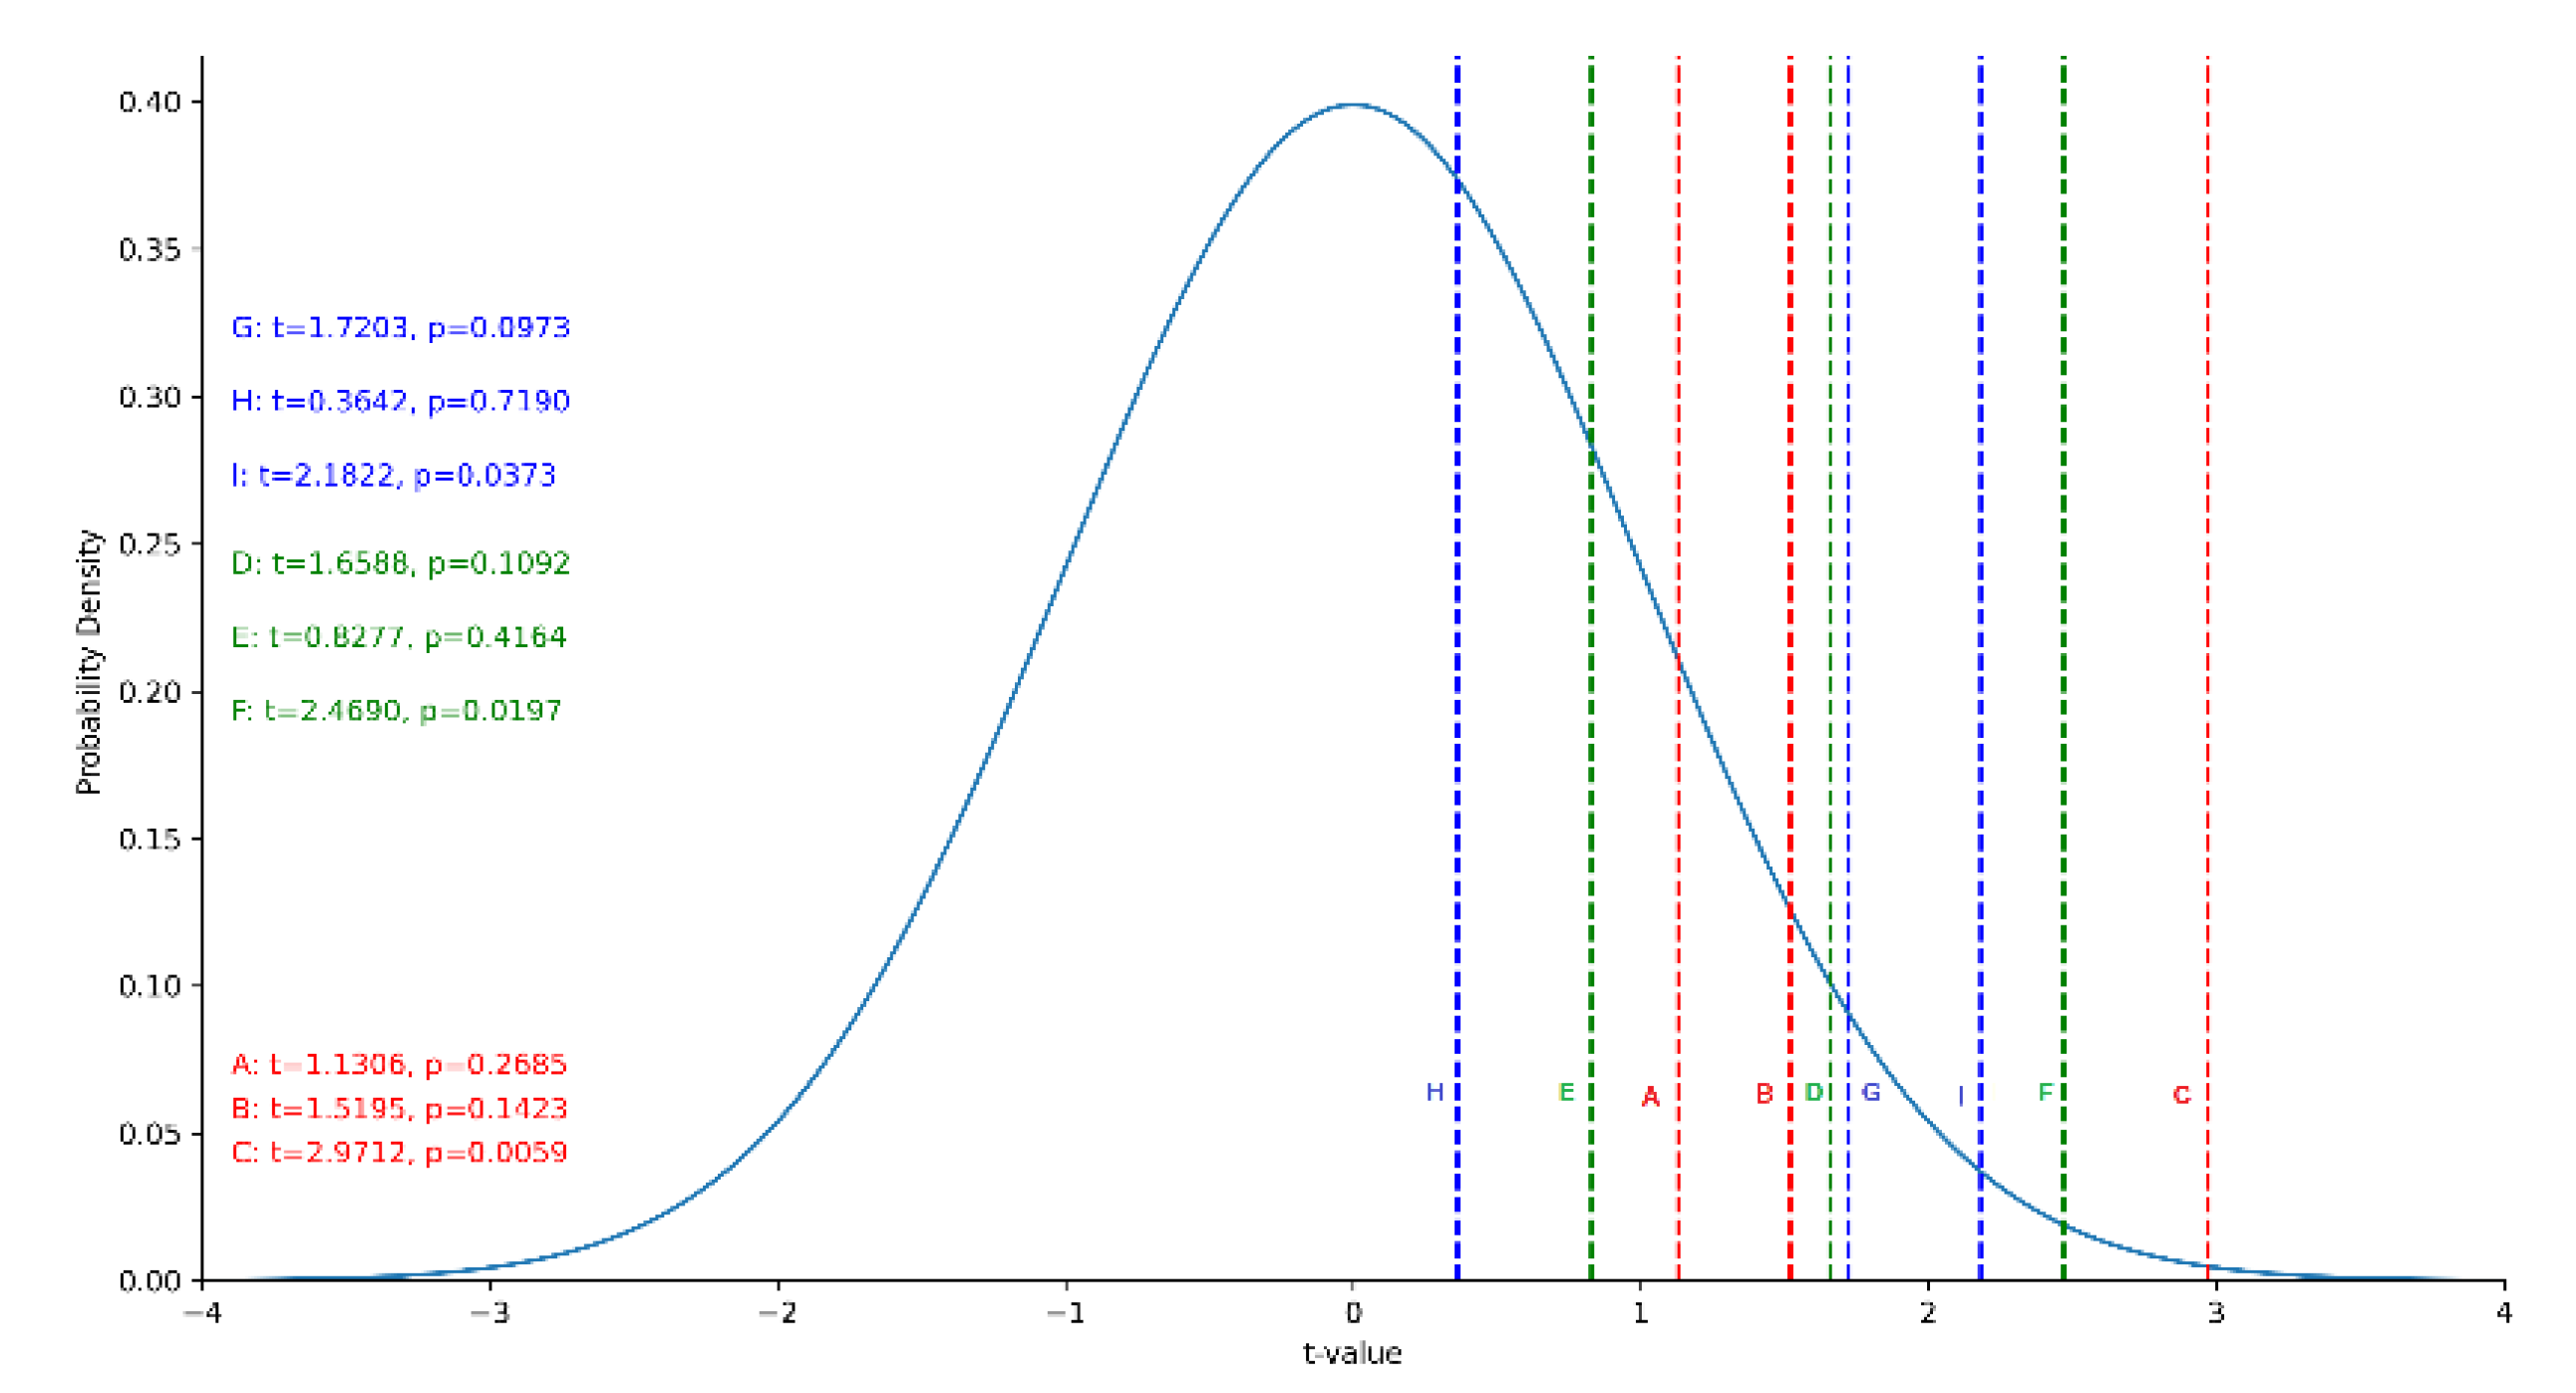
Figure 11.
Stream wise effect of GICTA on perceptions, attitudes and behavioral change among adolescents and their relationship in Higher Secondary Education.
Figure 11.
Stream wise effect of GICTA on perceptions, attitudes and behavioral change among adolescents and their relationship in Higher Secondary Education.
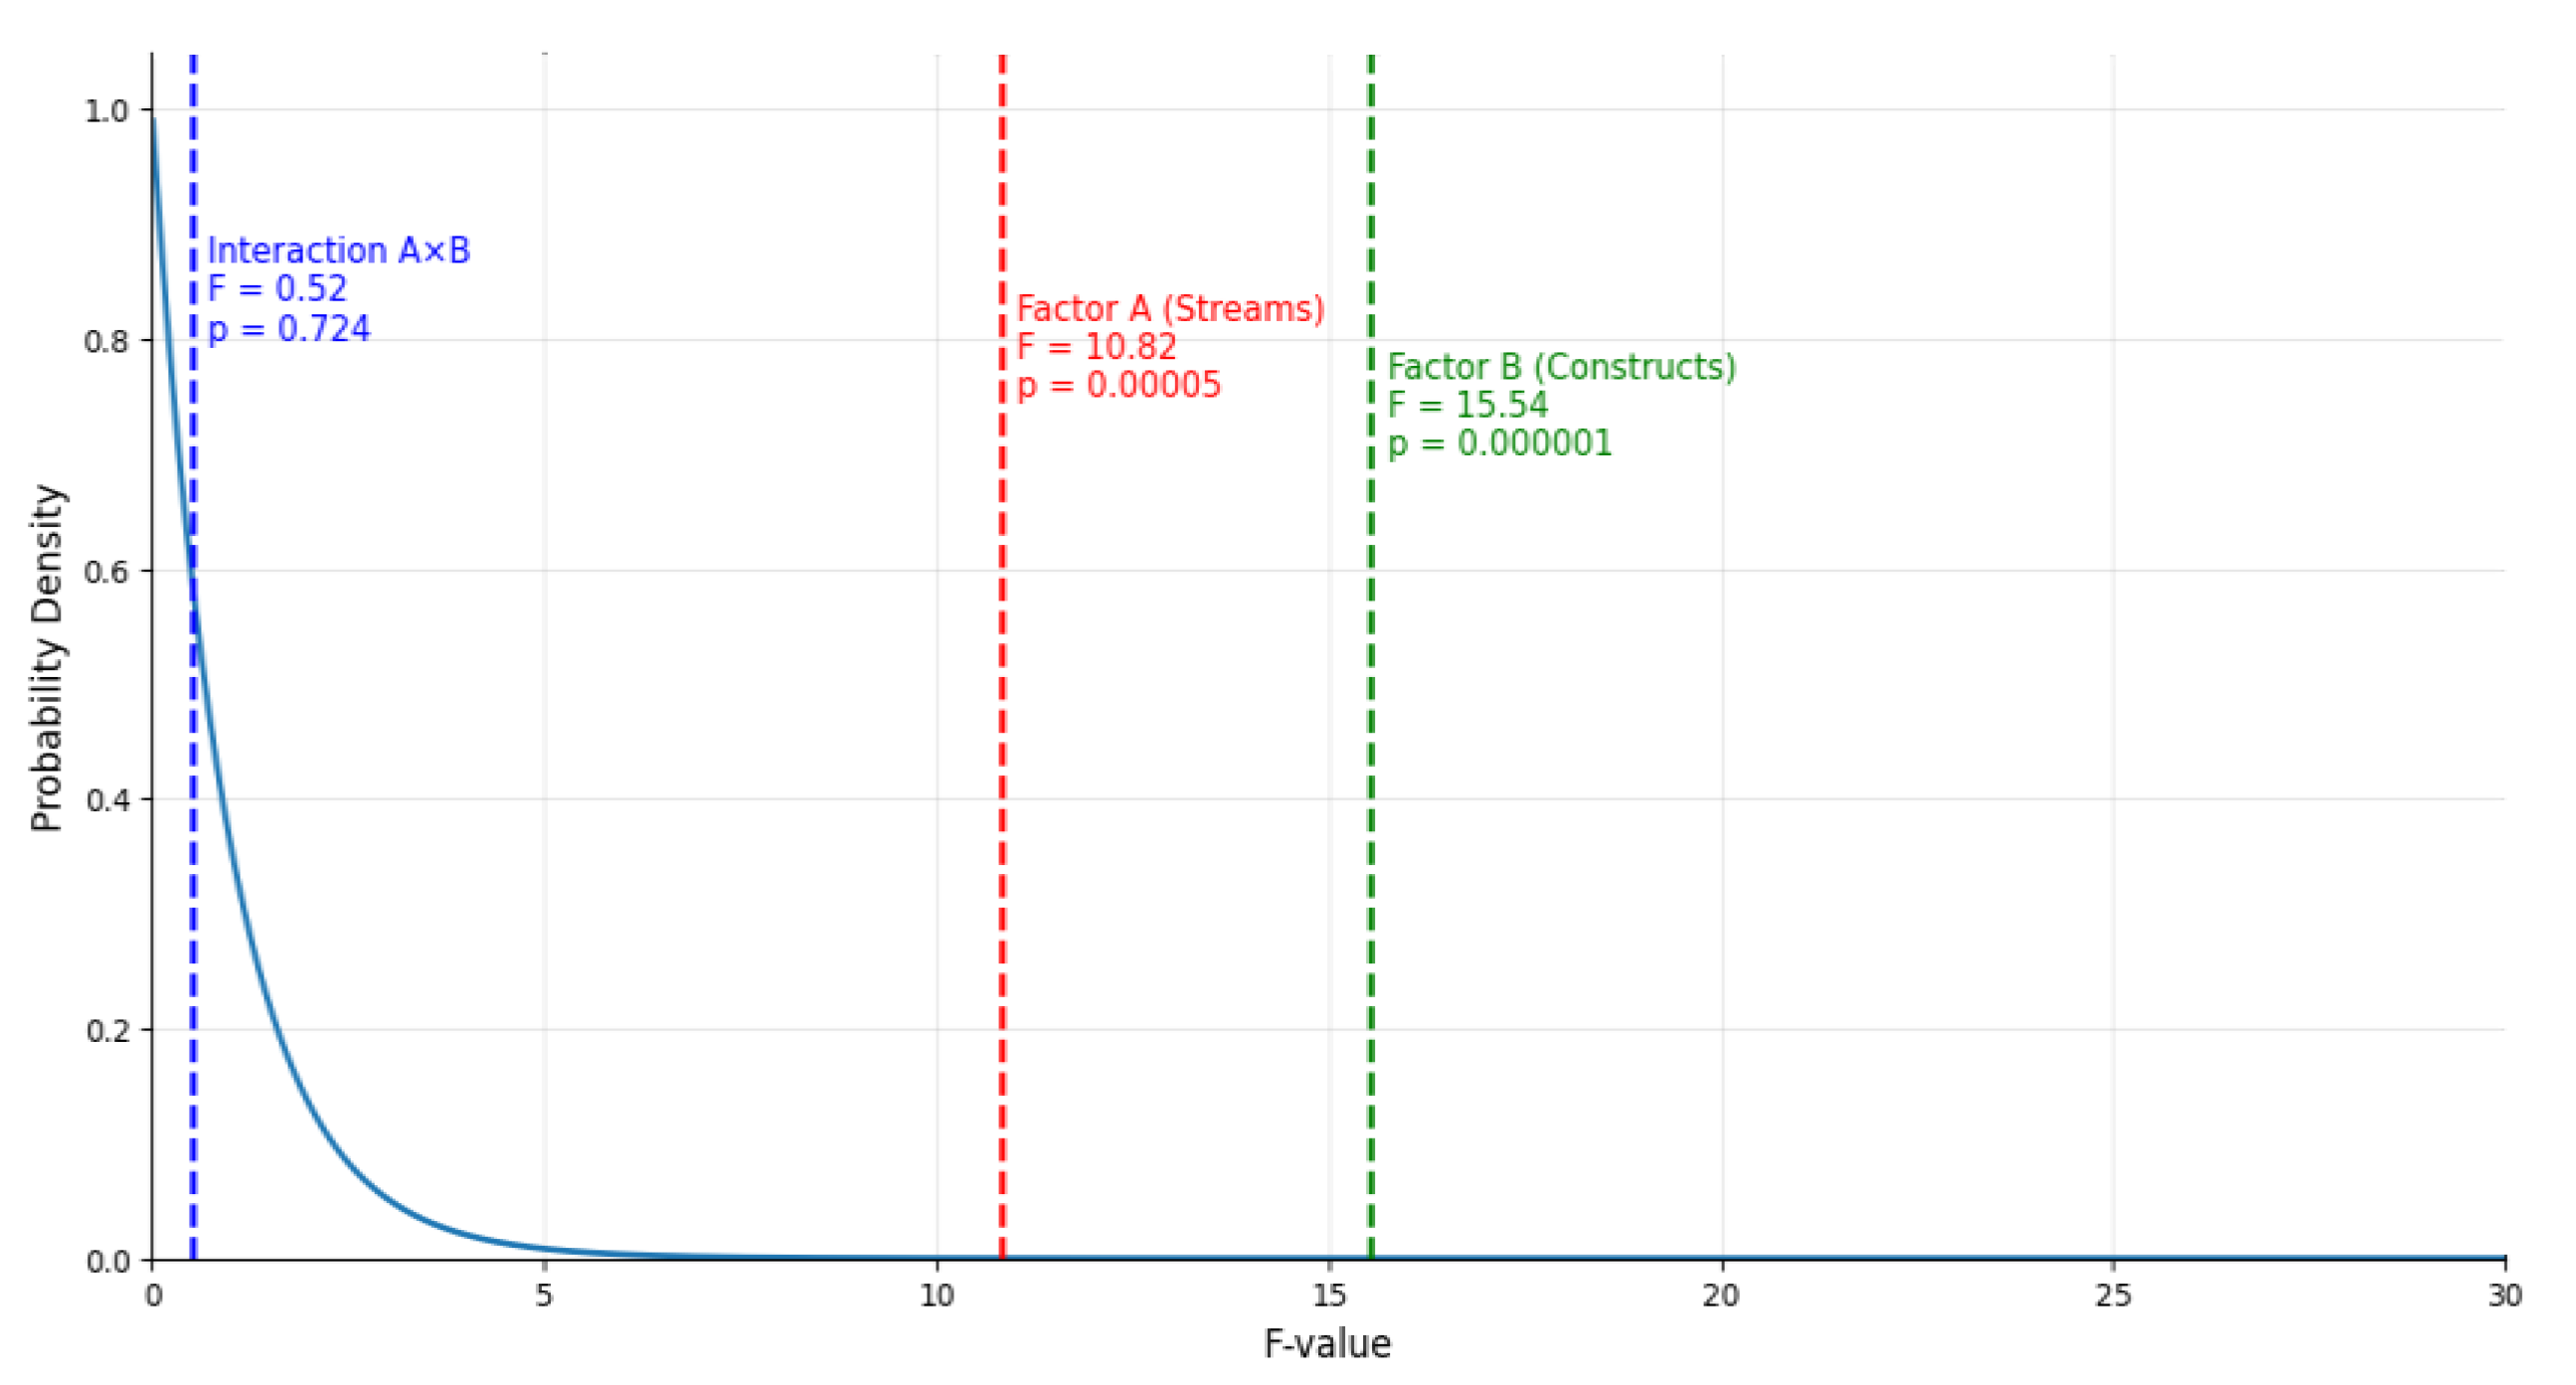
Figure 12.
Dimension-wise effect of GICTA on the perceptions, attitudes, and behavioral changes of adolescents and their association in Higher Secondary Education.
Figure 12.
Dimension-wise effect of GICTA on the perceptions, attitudes, and behavioral changes of adolescents and their association in Higher Secondary Education.
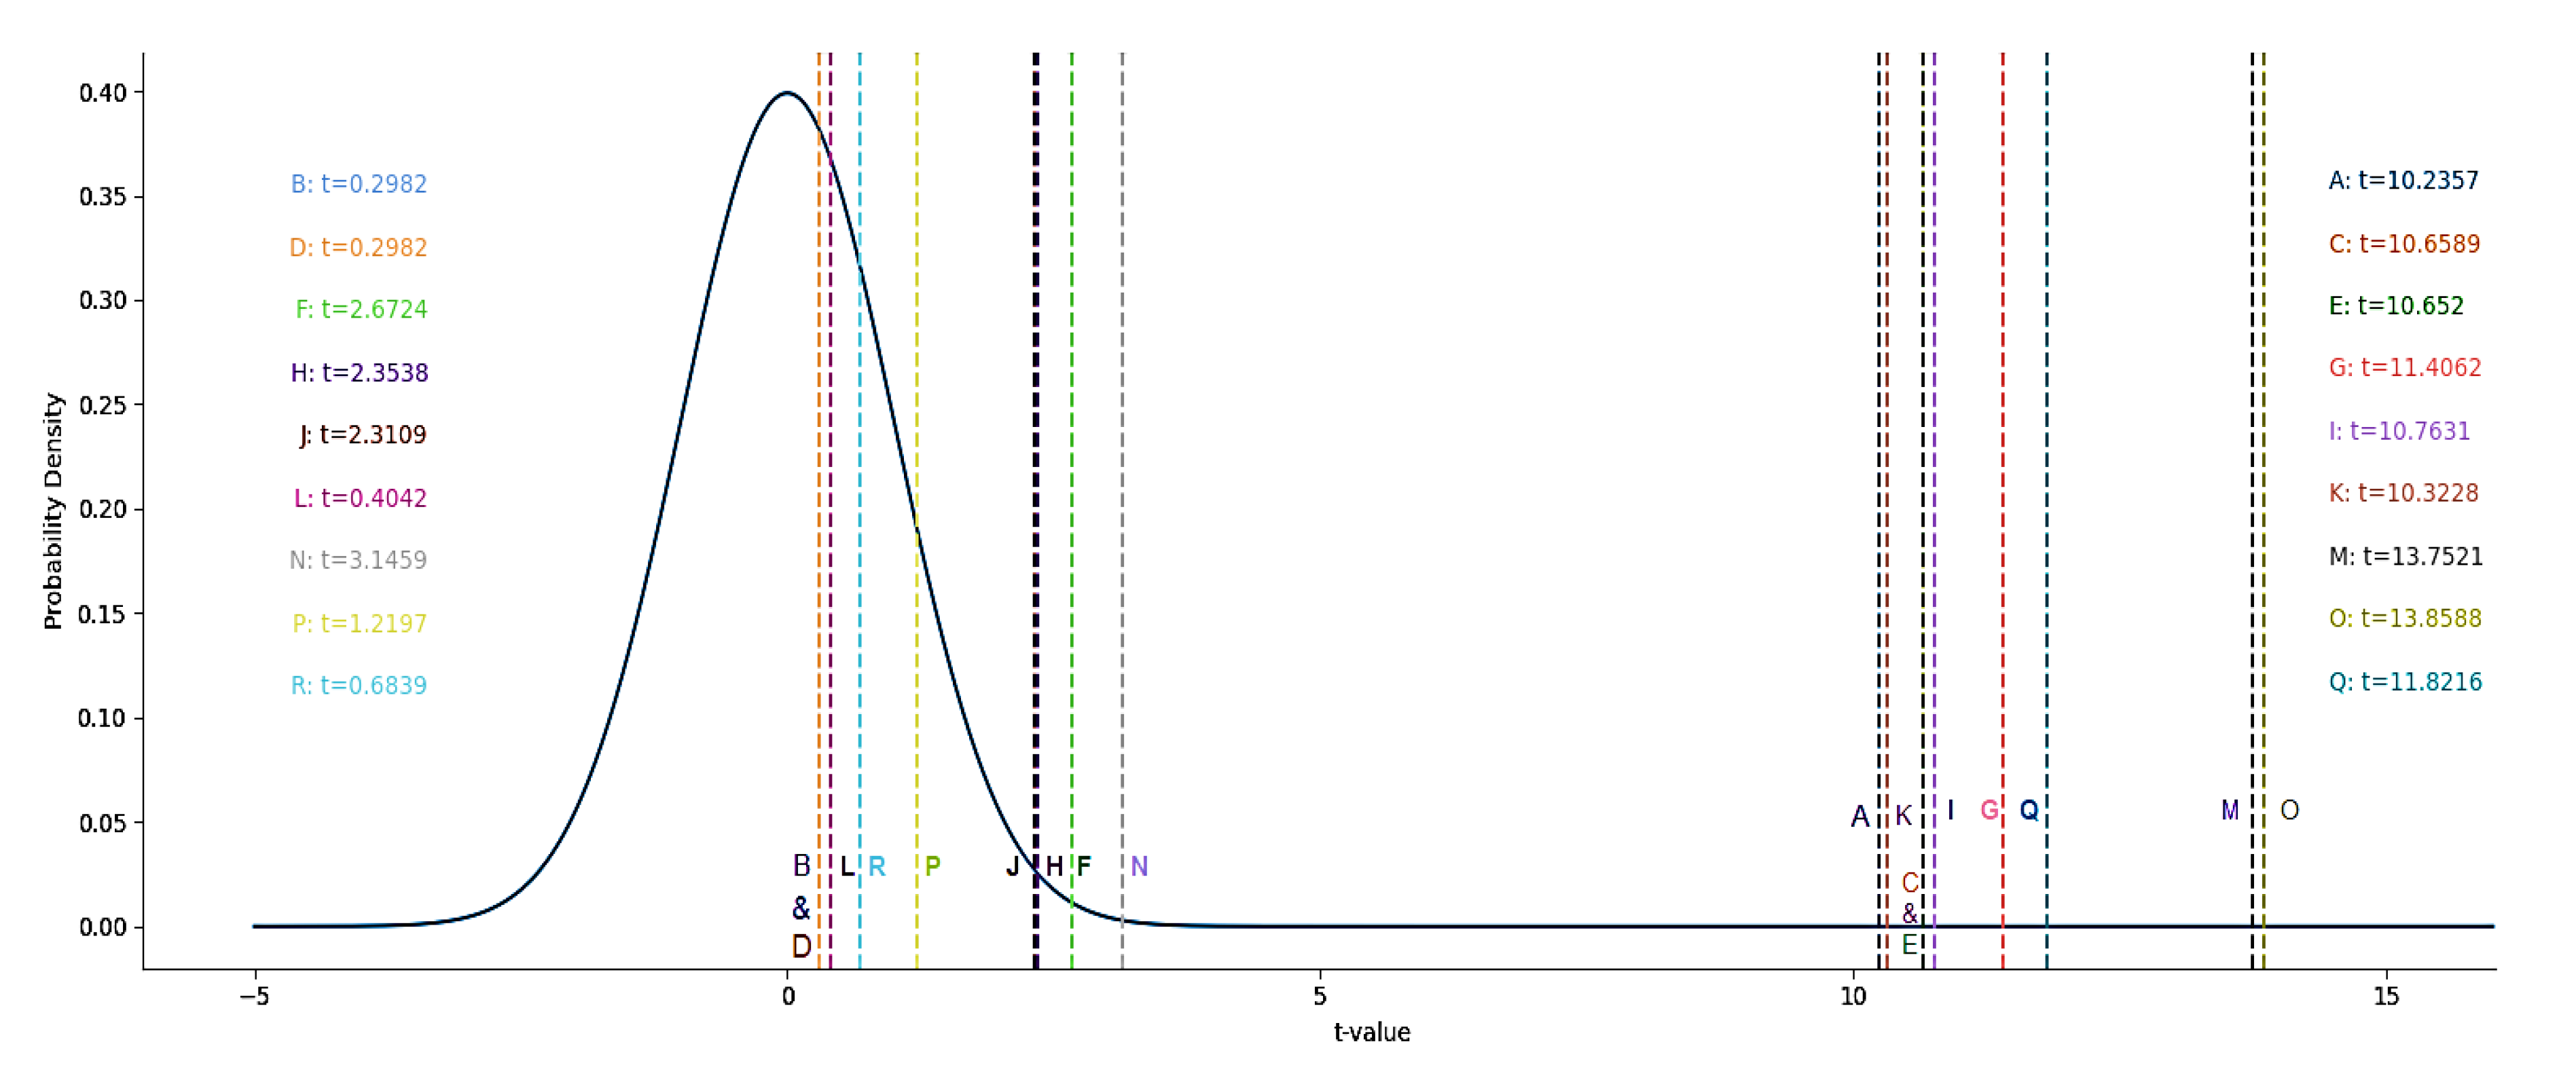

Table 1.
Effect of GICTA on adolescents’ perceptual adaptations through pretest-post-test experimental and control groups.
Table 1.
Effect of GICTA on adolescents’ perceptual adaptations through pretest-post-test experimental and control groups.
| Pre Test | Post Test | N | (df) | SED | t- value | p- value | |||||
| M1 | SD1 | SEM1 | M2 | SD2 | SEM2 | ||||||
| Experimental Group | 46.79 | 17.85 | 2.75 | 71.64 | 8.25 | 1.27 | 42 | 41 | 2.280 | 10.9026 | 0.0001 |
| Control Group | 47.71 | 17.43 | 2.69 | 48.50 | 16.85 | 2.60 | 42 | 41 | 0.422 | 1.8606 | 0.0700 |
Table 2.
Effect of GICTA on adolescents’ perceptual adaptations through post-test experimental and control groups.
Table 2.
Effect of GICTA on adolescents’ perceptual adaptations through post-test experimental and control groups.
| Control Group (Post Test) |
Experimental Group (Post Test) |
(df) | SED | t- value | p- value | ||||||
| M1 | N1 | SD1 | SEM1 | M2 | N2 | SD2 | SEM2 | ||||
| 48.50 | 42 | 16.85 | 2.60 | 71.64 | 42 | 8.25 | 1.27 | 82 | 2.896 | 7.9924 | 0.0001 |
Table 3.
Effect of GICTA on adolescents boys’ and girls’ perceptual adaptations across post-test experimental and control groups.
Table 3.
Effect of GICTA on adolescents boys’ and girls’ perceptual adaptations across post-test experimental and control groups.
| Girls (Post Test) |
Boys (Post Test) |
N | (df) | SED | t- value | p- value | |||||||
| M1 | SD1 | SEM1 | N1 | M2 | SD2 | SEM2 | N2 | ||||||
| Experimental Group | 71.73 | 9.14 | 2.76 | 11 | 71.61 | 8.08 | 1.45 | 31 | 42 | 40 | 2.933 | 0.0390 | 0.9691 |
| Control Group | 37.20 | 12.02 | 3.80 | 10 | 52.03 | 16.72 | 2.96 | 32 | 42 | 40 | 5.719 | 2.5932 | 0.0132 |
Table 4.
Effect of GICTA on adolescents’ attitudinal adaptations through pretest-post-test experimental and control groups.
Table 4.
Effect of GICTA on adolescents’ attitudinal adaptations through pretest-post-test experimental and control groups.
| Pre Test | Post Test | N | (df) | SED | t- value | p- value | |||||
| M1 | SD1 | SEM1 | M2 | SD2 | SEM2 | ||||||
| Experimental Group | 62.45 | 9.59 | 1.48 | 77.74 | 6.88 | 1.06 | 42 | 41 | 1.402 | 10.9063 | 0.0001 |
| Control Group | 61.26 | 7.54 | 1.16 | 61.81 | 7.33 | 1.13 | 42 | 41 | 0.255 | 2.1434 | 0.0381 |
Table 5.
Effect of GICTA on adolescents’ attitudinal adaptations through post-test experimental and control groups.
Table 5.
Effect of GICTA on adolescents’ attitudinal adaptations through post-test experimental and control groups.
| Control Group (Post Test) |
Experimental Group (Post Test) |
(df) | SED | t- value | p- value | ||||||
| M1 | N1 | SD1 | SEM1 | M2 | N2 | SD2 | SEM2 | ||||
| 61.81 | 42 | 7.33 | 1.13 | 77.74 | 42 | 6.88 | 1.06 | 82 | 1.551 | 10.2697 | 0.0001 |
Table 6.
Effect of GICTA on adolescents boys’ and girls’ attitudinal adaptations across post-test experimental and control groups.
Table 6.
Effect of GICTA on adolescents boys’ and girls’ attitudinal adaptations across post-test experimental and control groups.
| Girls (Post Test) |
Boys (Post Test) |
N | (df) | SED | t- value | p- value | |||||||
| M1 | SD1 | SEM1 | N1 | M2 | SD2 | SEM2 | N2 | ||||||
| Experimental Group | 79.36 | 5.32 | 1.60 | 11 | 77.16 | 7.34 | 1.32 | 31 | 42 | 40 | 2.418 | 0.9108 | 0.3678 |
| Control Group | 55.80 | 4.52 | 1.43 | 10 | 62.97 | 7.52 | 1.33 | 32 | 42 | 40 | 2.521 | 2.8439 | 0.0070 |
Table 7.
Effect of GICTA on adolescents’ behavioral adaptations through pretest-post-test experimental and control groups.
Table 7.
Effect of GICTA on adolescents’ behavioral adaptations through pretest-post-test experimental and control groups.
| Pre Test | Post Test | N | (df) | SED | t- value | p- value | |||||
| M1 | SD1 | SEM1 | M2 | SD2 | SEM2 | ||||||
| Experimental Group | 61.29 | 8.93 | 1.38 | 79.07 | 5.49 | 0.85 | 42 | 41 | 1.343 | 13.2450 | 0.0001 |
| Control Group | 62.45 | 8.59 | 1.33 | 62.98 | 8.95 | 1.38 | 42 | 41 | 0.234 | 2.2363 | 0.0308 |
Table 8.
Effect of GICTA on adolescents’ behavioral adaptations through post-test experimental and control groups.
Table 8.
Effect of GICTA on adolescents’ behavioral adaptations through post-test experimental and control groups.
| Control Group (Post Test) |
Experimental Group (Post Test) |
(df) | SED | t- value | p- value | ||||||
| M1 | N1 | SD1 | SEM1 | M2 | N2 | SD2 | SEM2 | ||||
| 62.98 | 42 | 8.95 | 1.38 | 79.07 | 42 | 5.49 | 0.85 | 82 | 1.619 | 9.9391 | 0.0001 |
Table 9.
Effect of GICTA on adolescents boys’ and girls’ behavioural adaptations across post-test experimental and control groups.
Table 9.
Effect of GICTA on adolescents boys’ and girls’ behavioural adaptations across post-test experimental and control groups.
| Girls (Post Test) |
Boys (Post Test) |
N | (df) | SED | t- value | p- value | |||||||
| M1 | SD1 | SEM1 | N1 | M2 | SD2 | SEM2 | N2 | ||||||
| Experimental Group | 79.64 | 4.39 | 1.32 | 11 | 78.87 | 5.88 | 1.06 | 31 | 42 | 40 | 1.946 | 0.3933 | 0.6962 |
| Control Group | 56.90 | 6.30 | 1.99 | 10 | 64.19 | 8.54 | 1.51 | 32 | 42 | 40 | 2.932 | 2.4856 | 0.0172 |
Table 10.
The effect of GICTA on the relationships among adolescents’ perceptions, attitudes, and behavioral adaptations.
Table 10.
The effect of GICTA on the relationships among adolescents’ perceptions, attitudes, and behavioral adaptations.
| Variables | Mean | SEM | N | SD | SED | df | t-value | p-value | ||||
| Perceptual Adaptation | M1 | 71.64 | SEM1 | 1.27 | N1 | 42 | SD1 | 8.25 | 1.003 | 41 | 6.0748 | 0.0001 p<0.05 |
| Attitudinal Adaptation | M2 | 77.74 | SEM2 | 1.06 | N2 | 42 | SD2 | 6.88 | ||||
| Perceptual Adaptation | M1 | 71.64 | SEM1 | 1.27 | N1 | 42 | SD1 | 8.25 | 0.843 | 41 | 8.8101 | 0.0001 p<0.05 |
| Behavioral Adaptation | M2 | 79.07 | SEM2 | 0.85 | N2 | 42 | SD2 | 5.49 | ||||
| Attitudinal Adaptation | M1 | 77.74 | SEM1 | 1.06 | N1 | 42 | SD1 | 6.88 | 0.548 |
41 | 2.4326 | 0.0194 P<0.05 |
| Behavioral Adaptation | M2 | 79.07 | SEM2 | 0.85 | N2 | 42 | SD2 | 5.49 | ||||
Table 12.
Stream wise effect of GICTA on adolescents’ perceptions, attitudes, and behavioral adaptations and their relationship in Higher Secondary Education.
Table 12.
Stream wise effect of GICTA on adolescents’ perceptions, attitudes, and behavioral adaptations and their relationship in Higher Secondary Education.
| Variables | Mean | SEM | N | SD | SED | df | t-value | p-value | |||||
| Perceptual Adaptation | Arts | M1 | 68.12 | SEM1 | 1.58 | N1 | 17 | SD1 | 6.52 | 2.710 | 26 | 1.1306 | 0.2685 p>0.05 |
| Commerce | M2 | 71.18 | SEM2 | 2.33 | N2 | 11 | SD2 | 7.72 | |||||
| Science | M1 | 76.29 | SEM1 | 2.35 | N1 | 14 | SD1 | 8.78 | 3.359 | 23 | 1.5195 | 0.1423 p>0.05 |
|
| Commerce | M2 | 71.18 | SEM2 | 2.33 | N2 | 11 | SD2 | 7.72 | |||||
| Arts | M1 | 68.12 | SEM1 | 1.58 | N1 | 17 | SD1 | 6.52 | 2.749 | 29 | 2.9712 | 0.0059 P<0.05 |
|
| Science | M2 | 76.29 | SEM2 | 2.35 | N2 | 14 | SD2 | 8.78 | |||||
| Attitudinal Adaptation | Arts | M1 | 74.47 | SEM1 | 2.03 | N1 | 17 | SD1 | 8.37 | 2.785 | 26 | 1.6588 | 0.1092 p>0.05 |
| Commerce | M2 | 79.09 | SEM2 | 1.44 | N2 | 11 | SD2 | 4.76 | |||||
| Science | M1 | 80.64 | SEM1 | 1.22 | N1 | 14 | SD1 | 4.57 | 1.875 | 23 | 0.8277 | 0.4164 p>0.05 |
|
| Commerce | M2 | 79.09 | SEM2 | 1.44 | N2 | 11 | SD2 | 4.76 | |||||
| Arts | M1 | 74.47 | SEM1 | 2.03 | N1 | 17 | SD1 | 8.37 | 2.500 | 29 | 2.4690 | 0.0197 p<0.05 |
|
| Science | M2 | 80.64 | SEM2 | 1.22 | N2 | 14 | SD2 | 4.57 | |||||
| Behavioural Adaptation | Arts | M1 | 76.65 | SEM1 | 1.52 | N1 | 17 | SD1 | 6.28 | 2.160 | 26 | 1.7203 | 0.0973 p>0.05 |
| Commerce | M2 | 80.36 | SEM2 | 1.27 | N2 | 11 | SD2 | 4.23 | |||||
| Science | M1 | 81.00 | SEM1 | 1.18 | N1 | 14 | SD1 | 4.42 | 1.747 | 23 | 0.3642 | 0.7190 p>0.05 |
|
| Commerce | M2 | 80.36 | SEM2 | 1.27 | N2 | 11 | SD2 | 4.23 | |||||
| Arts | M1 | 76.65 | SEM1 | 1.52 | N1 | 17 | SD1 | 6.28 | 1.995 | 29 | 2.1822 | 0.0373 p <0.05 |
|
| Science | M2 | 81.00 | SEM2 | 1.18 | N2 | 14 | SD2 | 4.42 | |||||
Table 13.
Stream-wise effect of GICTA on adolescents’ perceptual, attitudinal, behavioral adaptations and their interrelationships in higher secondary education.
Table 13.
Stream-wise effect of GICTA on adolescents’ perceptual, attitudinal, behavioral adaptations and their interrelationships in higher secondary education.
| Domain | Source of Variation | df | Sum of Square | Mean Square | F-value (df1, df2) | P-value |
| GICTAS’ Stream-wise effect on adolescents’ perceptions, attitudes, and behavioral adaptations | Factor A – Rows (A) | 2 | 917.9573 | 458.9787 | 10.8244 (2,177) | 0.00004861 |
| Factor B – Columns (B) | 2 | 1317.5873 | 658.7937 | 15.5368 (2,117) | 0.000001037 | |
| Interaction AB | 4 | 87.5456 | 21.8864 | 0.5162 (4,117) | 0.724 | |
| Error | 117 | 4961.0447 | 42.4021 | |||
| Total | 125 | 7284.1349 | 58.2731 |
Table 14.
Dimension wise effect of GICTA on adolescents’ perceptions, attitudes, and behavioral adaptations and their relationship in Higher Secondary Education.
Table 14.
Dimension wise effect of GICTA on adolescents’ perceptions, attitudes, and behavioral adaptations and their relationship in Higher Secondary Education.
| Variables | Group | Pre Test | Post Test | N | df | SED | t- value | p- value | |||||
| Domain | Dimension | M1 | SD1 | SEM1 | M2 | SD2 | SEM2 | ||||||
| Perceptual Adaptation | pollution | Experimental | 14.71 | 5.88 | 0.91 | 22.79 | 2.82 | 0.43 | 42 | 41 | 0.789 | 10.2357 | <0.0001 |
| Control | 15.07 | 5.87 | 0.91 | 15.14 | 5.81 | 0.90 | 42 | 41 | 0.240 | 0.2982 | 0.7670 | ||
| Energy Efficiency | Experimental | 15.50 | 5.81 | 0.90 | 23.79 | 3.14 | 0.48 | 42 | 41 | 0.777 | 10.6589 | <0.0001 | |
| Control | 15.93 | 5.87 | 0.91 | 16.00 | 5.65 | 0.87 | 42 | 41 | 0.240 | 0.2982 | 0.7670 | ||
| Waste Management | Experimental | 16.57 | 6.33 | 0.98 | 25.07 | 2.64 | 0.41 | 42 | 41 | 0.798 | 10.6520 | <0.0001 | |
| Control | 16.71 | 5.86 | 0.90 | 17.36 | 5.56 | 0.86 | 42 | 41 | 0.241 | 2.6724 | 0.0108 | ||
| Attitudinal Adaptation | pollution | Experimental | 20.12 | 2.99 | 0.46 | 25.21 | 2.37 | 0.37 | 42 | 41 | 0.447 | 11.4062 | <0.0001 |
| Control | 19.81 | 2.42 | 0.37 | 20.05 | 2.53 | 0.39 | 42 | 41 | 0.101 | 2.3538 | 0.0235 | ||
| Energy Efficiency | Experimental | 20.95 | 3.31 | 0.51 | 26.14 | 2.34 | 0.36 | 42 | 41 | 0.482 | 10.7631 | <0.0001 | |
| Control | 20.38 | 2.55 | 0.39 | 20.64 | 2.48 | 0.38 | 42 | 41 | 0.113 | 2.3109 | 0.0259 | ||
| Waste Management | Experimental | 21.38 | 3.34 | 0.52 | 26.38 | 2.21 | 0.34 | 42 | 41 | 0.484 | 10.3228 | <0.0001 | |
| Control | 21.07 | 2.62 | 0.40 | 21.12 | 2.39 | 0.37 | 42 | 41 | 0.118 | 0.4042 | 0.6882 | ||
| Behavioural Adaptation | pollution | Experimental | 19.95 | 2.90 | 0.45 | 25.79 | 1.94 | 0.30 | 42 | 41 | 0.424 | 13.7521 | <0.0001 |
| Control | 20.38 | 2.75 | 0.42 | 20.71 | 3.00 | 0.46 | 42 | 41 | 0.106 | 3.1459 | 0.0031 | ||
| Energy Efficiency | Experimental | 20.48 | 3.01 | 0.46 | 26.52 | 1.81 | 0.28 | 42 | 41 | 0.436 | 13.8588 | <0.0001 | |
| Control | 20.81 | 2.83 | 0.44 | 20.93 | 3.05 | 0.47 | 42 | 41 | 0.098 | 1.2197 | 0.2295 | ||
| Waste Management | Experimental | 20.86 | 3.07 | 0.47 | 26.76 | 1.85 | 0.28 | 42 | 41 | 0.499 | 11.8216 | <0.0001 | |
| Control | 21.26 | 3.04 | 0.47 | 21.33 | 2.94 | 0.45 | 42 | 41 | 0.104 | 0.6839 | 0.4979 | ||
Table 15.
GICTA’s effect on adaptation domains across environmental dimensions.
| Environmental Dimension | N | Perceptual Adaptation (M ± SD) |
Attitudinal Adaptation (M ± SD) |
Behavioural Adaptation (M ± SD) |
Pillai’s Trace | F (df₁, df₂) | p-value | Partial η² |
| Pollution | 42 | 22.79 ± 2.82 | 25.21 ± 2.37 | 25.79 ± 1.94 | ||||
| Energy Efficiency | 42 | 23.79 ± 3.14 | 26.14 ± 2.34 | 26.52 ± 1.81 | ||||
| Waste Management | 42 | 25.07 ± 2.64 | 26.38 ± 2.21 | 26.76 ± 1.85 | ||||
| Overall MANOVA | 0.1143 | 1.2175 (12, 369) | 0.2687 | 0.0381 |
Table 11.
The effect of GICTA on the relationships among adolescents’ perceptions, attitudes, and behavioral adaptations in Higher Secondary Education.
Table 11.
The effect of GICTA on the relationships among adolescents’ perceptions, attitudes, and behavioral adaptations in Higher Secondary Education.
| Domain | Source of Variation | Sum of Square | df | Mean Square | F value | p value |
| GICTAS’ effect on adolescents’ perceptions, attitudes, and behavioral adaptations | Between Groups | 1317.5874 | 2 | 658.7937 | 13.581 | 0.000004685 < 0.001 |
| Within Groups | 5966.5476 | 123 | 48.5085 | |||
| Corrected Total | 7284.135 | 125 | 58.2731 |
Disclaimer/Publisher’s Note: The statements, opinions and data contained in all publications are solely those of the individual author(s) and contributor(s) and not of MDPI and/or the editor(s). MDPI and/or the editor(s) disclaim responsibility for any injury to people or property resulting from any ideas, methods, instructions or products referred to in the content. |
© 2026 by the authors. Licensee MDPI, Basel, Switzerland. This article is an open access article distributed under the terms and conditions of the Creative Commons Attribution (CC BY) license (http://creativecommons.org/licenses/by/4.0/).
Copyright: This open access article is published under a Creative Commons CC BY 4.0 license, which permit the free download, distribution, and reuse, provided that the author and preprint are cited in any reuse.


