
Submitted:
17 January 2026
Posted:
19 January 2026
You are already at the latest version
Abstract
Feline infectious peritonitis (FIP) is responsive to treatment with the adenosine analogue GS-441524 (GS-44) and its prodrug, remdesivir (REM), both now available on veterinary prescription in many countries. Therapeutic drug monitoring (TDM) of GS-44 has the potential to support dose selection for individual cats however, TDM assays are currently only offered by one, UK based, laboratory. This study describes a simple, cost-effective, and environmentally conscious high performance liquid chromatography (HPLC) method for the quantification of GS-44 in feline plasma or serum. The method was validated in accordance with the International Council for Harmonisation M10 guidelines for bioanalytical methods. Calibration standards demonstrated linearity across a range of 15 to 5100 ng/mL, R² = 0.9978, with a lower limit of quantification 8.0 ng/mL and upper limit of quantification 5048 ng/mL; equivalent to an assay range of 0.33 to 208 µM. Precision, accuracy and spike recovery were within ±5% for most standard concentrations (±10% at the lower two). Carry-over, dilution integrity, and analyte stability under common storage conditions all met the guideline criteria. This is a simple, robust and accurate eco-friendly method suitable for being adopted by diagnostic laboratories, enabling routine TDM for cats undergoing treatment for FIP with GS-44 and/or REM.
Keywords:
GS-441524
; remdesivir
; feline infectious peritonitis
; treatment
; therapeutic drug monitoring
; dosage
; plasma concentration
; cat
; HPLC
1. Introduction
Remdesivir (REM) and GS-441524 (GS-44) are anti-viral agents that are safe and effective when used to treat cats suffering from the various forms of feline infectious peritonitis (FIP) [1,2]. Both drugs are now legally available for prescription by veterinary surgeons in many countries from licensed veterinary pharmaceutical compounding companies.
The pharmacokinetics (PK) and pharmacodynamics (PD) of these drugs are well described elsewhere [3,4,5] so do not require reiteration.
The treatment regimens being used for these drugs are based on PK data derived from studies involving in vitro cell cultures and healthy cats [3,4,6,7,8,9,10] as well as retrospective reports of results from cats treated with legally sourced GS-44 and/or REM [3,4,10,11,12,13,14,15,16,17,18,19,20,21,22] or unverifiable compounds sourced illegally [23,24,25,26,27]. To date, published PK data for these drugs being administered under veterinary supervision to cats with clinical FIP are sparse (n=6 [PK data] n=22 [single sample data]) [4] and there is a need for robust investigation into dosages appropriate for each FIP phenotype and clinical presentation [4]. Given the limited predictive PK/PD data available for clinical cases, accurate quantification of GS-44 concentrations is an essential alternative to inform evidence-based dosing and therapeutic monitoring.
Therapeutic Drug Monitoring (TDM) is used to monitor the plasma concentration of target drugs to optimise treatment [28], primarily to prevent under- or over-dosage, but also to support investigations into causes of failure to respond to medication, side effects or relapses from remission.
TDM of GS-44 requires a laboratory method readily available to clinicians which can report results both rapidly and cost-effectively. At present, high performance liquid chromatography combined with mass spectroscopy (HPLC-MS or HPLC-MS/MS [29,30,31,32]) is the method most used by researchers; however, this utilises expensive and complicated equipment, that needs to be run by specialist technicians, using significant amounts of environmentally sensitive reagents. At present (October 2025), no commercial laboratory offers GS-44 plasma assays based on this technology for clinical TDM.
The aim of this paper is to describe the validation of a simple, low cost, effective HPLC method not using MS, using sparing amounts of environmentally sensitive reagents and which may therefore find a place in commercial diagnostic laboratories and provide clinicians access to this important resource.
We also present the GS-44 assay results of 728 samples originating from 263 cats undergoing treatment for the various phenotypes of FIP.
2. Materials and Methods
Sample Origin and Handling
Feline serum and plasma samples (ethylenediaminetetraacetic acid [EDTA] and/or heparin anticoagulated) were obtained as remnant diagnostic material from routine clinical submissions to the Easter Bush Pathology Laboratory, Royal (Dick) School of Veterinary Studies, University of Edinburgh. Samples originated from cats receiving legally prescribed REM or GS-44 for the management of FIP. The use of remnant clinical samples for assay development and validation was approved by the Veterinary Ethical Review Committee (VERC) of the University of Edinburgh, UK (VERC 63.22; approved 4 December 2022). Following diagnostic testing, residual material was transferred to The Microsampling Laboratory for method development and validation.
Chemicals, Reagents & Expendables
All solvents (including deionized water) and chemicals were of HPLC grade (filtered at 0.22 µm) and purchased from LaserChrom HPLC Laboratories, Rochester, London. UK, except for GS-44 (CAS: 1191237-69-0, purity >99 %), which was purchased from MedChemTronica AB, Stockholm, Sweden.
Preparation of Stock and Standard Solutions
A stock solution of GS-44 dissolved in 100% methanol to give a standardized solution of 36,600 ng/mL was prepared and stored at -20°C. Standard solutions, ranging from 5048.28 to 16.00 ng/mL GS-44 (Table 1), were prepared from the stock solution using the HPLC mobile phase (MP) as diluent. Methanol was not used as a diluent for the standards, as it caused excessive perturbation of the HPLC baseline and GS-44 peak shouldering when using the chosen column. Standard solutions were prepared in 2 mL HPLC sample vials and stored at −20°C in between assays, being brought to and maintained at 20°C (in the autosampler) after being briefly vortexed. Standard solutions were assayed together with study samples and discarded if their calculated concentration deviated more than 15% (more than 20% for the two lowest standard concentrations) from the expected reference values.
Extraction and Sample Preparation
For this paper, the term “sample” refers to plasma, collected in EDTA or heparin, or serum.
The GS-44 blood-plasma partitioning ratio for cats is believed to be 1.2 (5 other species returned the same value [33]), thus, for completely haemolysed samples, assay values were likely to be up to 20% higher than that obtained if haemolysis were not present. For this study, if red blood cells could not be separated from haemolysed samples by centrifugation, i.e. complete haemolysis had occurred, these samples were excluded.
Molecules causing icterus and lipaemia in samples would not cause interference with the method [34,35], so these artefacts were not considered to be interfering factors.
Each sample was prepared at 2 dilutions by mixing 220 µL methanol (to remove proteins by coagulation) with a) 20 µL of sample (1 in 12 dilution) and b) 40 µL of sample (1 in 6.5 dilution). After vortexing twice for 10 seconds with a 30 second interval, the mixture was centrifuged at 10,500 g for 6 minutes (min) and 210 µL of the resulting supernatant was transferred to a fresh 1.5 mL vial. Using a vacuum centrifuge the methanol was removed by evaporation (circa 60 min at 55°C), and the residue made up to 210 µL with MP. After vortexing and centrifuging as above, this was filtered through a 4 mm 0.22 µm nylon syringe filter into a 0.3 mL HPLC vial for analysis.
Instrumentation and Chromatographic Condition
A Perkin Elmer Series 200 HPLC system, consisting of four channel MP vacuum degasser, auto-sampler, quaternary pump, column oven and UV diode array detector (DAD) with instrument control, data collection and data analysis performed by TotalChrom software (Perkin Elmer USA) was used. The sample injection volume was 40 µL.
The GS-44 molecule is highly polar (XlogP3-AA = – 1.4 [36]) so it requires a high aqueous content MP to increase its retention time on C18 solid phase columns sufficiently long enough to ensure adequate peak separation from other sample components (this was determined by experimentation during method development at MSL). The Waters XSelect HSS T3 100Å, 2.5 µm, 4.6 mm x 150 mm column was selected as its solid phase was designed to be used with MP containing up to 100% water and this, during method development, allowed good separation of the GS-44 peak from other sample components which also absorbed UV wavelengths at 230 to 250 nm. The column was held at 35°C with an isocratic MP flowrate of 1.2 mL/min, run-time was 17 min.
The MP was made up freshly each day and consisted of a water: acetonitrile (ACN): formic acid mixture, nominally 96:4:0.1 v/v, made by mixing, in a 500 mL volumetric flask, circa 300 mL water with 20 mL ACN and 500 µL 98% formic acid, then making the volume up to 500 mL with water. Ambient temperature was 21°C. +/- 5°C.
Detection of GS-44 was by measuring light absorption at 240 +/- 10 nm and the area under the GS-44 peak (AUP) in absorption units (AU) calculated by the software.
The sample and standard GS-44 concentrations were calculated from the AUP using the external standard linear regression formula of best fit [3].
Method Validation
The method was validated using cat samples and MP; it was assessed for selectivity, specificity, matrix effect, calibration curve, range (lower limit of detection [LLOD], lower limit of quantification [LLOQ] to upper limit of quantification [ULOQ]), precision and accuracy, carry-over and stability in accordance with the biological method validation guidelines prepared by the International Council for Harmonisation of Technical Requirements for Pharmaceuticals for Human Use, Bioanalytical method full validation and study sample analysis, M10 adopted 24 May 2022 (ICH M10) [37].
Due to the availability of only a small volume of blank cat plasma for use as matrix for the calibration and QC samples, it was not possible to use this matrix for standard and QC samples during the entirety of the study assays; instead, after validation, the standard samples were substituted. This decision was supported by the equivalent performance of the standard solutions as used during method validation when compared with the blank plasma standard and QC results.
Selectivity, Specificity and Matrix Effect
During method validation, selectivity and specificity were assessed using normal cat samples with and without being spiked with GS-44 (see Precision and accuracy); these were cats not suffering from FIP and therefore not treated with GS-44. The retention time of GS-44 with normal cat samples spiked with GS-44 was compared with that obtained for study samples.
The method development determined the HPLC conditions required to ensure that the GS-44 peak occurred at a point in the sample chromatogram where peaks resulting from other components present in the samples would not coincide.
Performing a visual inspection of each chromatogram as it was generated enabled the operator to be certain that other sample components were not perturbing the GS-44 peak (as would be indicated by the presence of the artefacts abnormal fronting, tailing, splitting, shouldering or base broadening of the peak).
For each sample, the two dilutions were assayed sequentially. If the AUP values differed by more than 10% then the dilution with the lower AUP was re-assayed at least three runs later. If the repeat assay could not correct the variation (by identifying and excluding the outlier value) then a fresh dilution pair was made up for that sample and assayed.
The two dilutions acted as self-check for any errors in sample preparation or assay process (including injection reproducibility). If the results of the two dilutions fell within 10% of each other, the sample assay results were reported as the average of the two results +/- 1 x standard deviation (SD).
Calibration Curve, Range of Values, Lower Limit of Detection (LLOD), Upper Limit of Detection (ULOD) and Lower Limit of Quantification (LLOQ)
The calibration curve was determined by assaying the standard solutions and plotting the AUP in AU against expected GS-44 concentration in ng/mL. Each of the 14 standards in all the standard batches prepared were assayed at least six times (range 6 – 10).
The calibration curve and correlation coefficient were determined by a simple linear regression model. The standard solutions produced a linear, first order response to the expected concentration values. Standard deviation (SD) values were prepared for the standard batch in use and a linear regression analysis performed on the SD v expected standard GS-44 concentration values. The regression equation was used to calculate an appropriate SD for the sample result reported [39].
Samples and standard solutions were prepared so that the range of assay GS-44 concentrations (Table 1) fell within the range 15 to 5100 ng/mL.
For the range of values, the ULOQ was set at 5048 ng/mL, equivalent to a plasma concentration of 208 µM at a 1 in 12 dilution, a value greater than sample values from clinical cases (with a maximum assay value of 36.4 µM) and greater than the GS-44 concentration which did not cause cytotoxic effects in vitro (≥ 100 µM [6,9]); a value not anticipated to be achieved in clinical cases, but without being excluded as possible.
The lower limit for the range of values was circa twice the LLOQ.
The LLOQ and LLOD were calculated using the root mean square baseline noise (BN) (µV), (as determined internally by the TotalChrom software, for +1 to - 1 min of the elution time of GS-44) over 20 runs of the standard series in use. The LLOQ was calculated using a peak AUP equivalent to 10 x the minimum BN value. The LLOD was calculated using a peak AUP equivalent to three x the maximum BN value.
Precision and Accuracy
Precision and accuracy were determined by replicate analysis of the standard solutions during each analytical run set (typically >four standards were run during a day sample run series; the sequence being repeats of “standard a, sample, sample, sample, standard b” runs). Intra-day precision and accuracy were calculated and monitored from these runs each day, whilst inter-day precision and accuracy were calculated and monitored over at least five different, non-sequential days. Linear regression equations were checked for drift and standard samples made up fresh if > 15% (> 20% for the two lowest dilutions) difference between expected and assayed GS-44 concentration occurred.
Assay accuracy was estimated from a spike recovery experiment and from the precision experiment. For the spike recovery experiment, normal cat samples (N=11) were spiked with solutions prepared to produce final concentrations of 2.86, 5.71 and 11.42 µM when 4 µL of each were added to a 40 µL sample. Percentage recovery was calculated between the observed and expected concentration of the assays. Percentage bias was estimated as the absolute difference between the observed average recovery and the expected concentration. Similarly, the bias in the precision experiment was also calculated to consolidate the estimate over a larger cohort of samples.
Carry-Over
Carry-over occurs where either i) a sample component had a retention time greater than the run time thus producing a peak in the subsequent run, or ii) where GS-44 was not completely eluted from the solid phase during a run, so it was released in the subsequent run and appeared as an unidentified peak. These were assessed by observing sequential runs, using either study samples or the highest concentration standard GS-44, followed by MP, with increasing run times (ranging from 7 to 17 min).
Dilution Integrity
Standard solution dilution integrity was assessed by comparing standard solution assay results with expected values for different batches of standard solutions.
Stability
The stability of the standard solutions was assessed by monitoring the standard results on each day. If the AUP of any standard differed by >15% (>20% for the 2 lowest standards) of that recorded for the freshly prepared standard, that standard was discarded. If >25% of the standards from that set were excluded for this reason, then the remainder were discarded and a new set prepared.
Stock solution stability was monitored by comparing the AUPs of each new set of standards with the initial results for each previous standard set.
Sample stability was assessed by repeating sample assays after samples had been held at room temperature for 4 days, fridge temperature for 4 days or frozen for 4 days.
Statistical Analysis
Statistical analysis was carried out using Excel (Microsoft, USA) and GraphPad Prism v10.6.1 (892) (GraphPad Software, Boston, Massachusetts USA), P-values < 0.05 were considered statistically significant.
3. Results
3.1. Validations
. Selectivity & Specificity
Chromatograms of sample, standard GS-44 solutions and GS-44 spiked blank cat samples produced GS-44 peaks at elution times of 7.2 +/- 0.2 min (standard) and 7.1 +/- 0.2 min (sample and spiked blank).
For blank cat samples, the baseline was near to or at 0.0 µV, stable for the baseline time between 1.5 to 17 min, exhibited a BN of < 35 µV and with no peaks evident at the expected GS-44 elution time of 7.1 min +/- 1 min. For spiked samples, the GS-44 peak area under the peak (AUP) corresponded to < +/- 20% of the expected value and no endogenous peaks were seen to interfere with the GS-44 peak. Minimum interference was set at < 20% of the upper limit.
Chromatograms of blank cat plasma, sample and spiked sample are shown in Figure 1, Figure 2 and Figure 3. No interfering peaks occurred between 6.0 and 12.0 min in blank samples. Spiking GS-44 into a sample containing endogenous GS-44 did not change the elution time (7.28 m) and did not produce peak fronting, tailing, splitting, shouldering, base broadening or retention time variation. Similar results were observed in the spike recovery experiments performed on another 11 study samples. This shows that the assay is selective and specific.
Matrix Effect
The GS-44 peaks were not overtly affected by other compounds present in the samples, as demonstrated by the absence of changes in peak shape and elution times across the study sample chromatograms.
Calibration Curve, Range of Assay Values, LLOQ and LLOD
The calibration data best fitted to a simple linear regression model (y = B0 + B1*x) with B0 = 1070 (95% CI, B0 = -262.5 to 1877) and B1 = 181.0 (95% CI B1 = 179.6 to 182.5); R2 = 0.9978.
For at least 2 assays per day BN was recorded and found to vary between 19 µV and 35 µV.
The LLOQ was therefore set as 190 µV. Peaks with a height of 190 µV averaged (n = 5) an AUP of 2,508 AU, equating to a GS-44 concentration of 8 ng/mL and, at 12 x dilution, the LLOQ was 0.33 µM.
The LLOD was set as 105 µV. Peaks with a height of 105 µV averaged (n = 5) an AUP of 1,160 AU, equating to a GS-44 concentration of 5 ng/mL and, at 6.5 x dilution, the LLOQ was 0.1 µM. Peaks between the LLOQ and LLOD were reported as an assay value with a comment that GS-44 was present in the sample, but the value reported was subject to a large uncertainty.
Spike Recovery
The spike recovery study produced an average recovery of 95% ranging from 86 to 110%; the absolute bias was 5%. The recovery calculated from the precision experiment was 99% (range 89-105%) with an estimated absolute bias of 1%. See Supplementary Table s1.
Precision and Accuracy
Trueness (as bias) was <5% for all except the lower two dilutions which were <10% and precision (as coefficient of variation [CV]) was <5% except the lower two dilutions which were <15%. See Supplementary Table s2
Carry-Over
Examination of the chromatograms obtained using blank plasma or MP run immediately after both standard and sample assay runs did not show any peaks at 7.1 +/- 0.2 min indicating that neither GS-44 nor other sample components were retained by the column for more than 17 m; therefore, carry-over did not occur with this run time and GS-44 dilution range.
Stability
Stock solution stability was acceptable, with a reduction of GS-44 content being < 2% over a 16-month period.
Standard solutions were also very stable, the average time between batches being replaced with fresh was 43 days. The commonest reason for standard sets being discarded was because their volume was depleted from use. During that time, a slight increase in concentration was noted (typically 1 – 3%) believed to be due to evaporation or sublimation during storage and use.
Sample stability was also acceptable, with variation between stored and fresh assay sample results <5%. (data not shown)
Clinical Application
728 samples originating from 263 individual cats were assayed. The results as sample GS-44 concentration (µM) were assigned into 24 one hour bins, representing sample time after dose administration for sequential one hour periods (e.g. bin 1 = 0 – 59 min, bin 2 = 60 – 119 min etc.) and plotted as bar and whisker plots with individual results shown as stars (Figure 4). The green bar extremities indicate the 25% and 75% percentiles with the solid intermediate bar the median value (statistical analysis Supplementary Table s3).
4. Discussion
This study successfully developed and validated an HPLC method using ultraviolet detection for the quantification of GS-44 in blood samples from cats being treated with the compound for FIP and satisfied the standards set out by the International Council for Harmonisation in the document M10, Technical Requirements for Pharmaceuticals for Human Use, Bioanalytical method full validation and study sample analysis [37].
A small difference between the retention times for GS-44 dissolved in MP and in samples indicated a small matrix effect which did not affect the assay results, as the peaks were sufficiently separated from other sample components by the column and no peak artefacts were observed.
Both endogenous (sample) GS-44 and spike GS-44 were eluted from spiked samples already containing GS-44 with the same retention time, indicating that the assay is both selective and specific.
The run time was chosen as 17 min because an unidentified compound found in both study and blank cat samples eluted at 14 min (see Figure 2 and Figure 3). This restricted the run time to >15 min (to prevent the compound from eluting into the subsequent run) and 17 min was chosen to prevent such occurrences.
Due to the complexity of FIP’s clinical presentation and systemic effects it would be expected for some of the 728 samples to contain exogenous compounds such as steroids, antibiotics, appetite stimulants, sedatives or other antiviral compounds [3]; however, it would be singularly coincidental if any such compounds both eluted with exactly the same retention time as GS-44 (as found with this method) and absorbed light between 230 and 250 nm. Observing each chromatogram as it developed allowed the operator to ensure that no compounds with elution times +/- 0.25 min of the GS-44 value produced overlapping peaks and subsequent GS-44 peak artefacts. None were observed.
There was very good separation of GS-44 from other components of cat plasma noted for all the study samples and the method produced consistently reproducible results using a simple sample preparation technique and straight-forward isocratic MP elution.
The HPLC method described here also satisfies the requirements of a, comparatively, eco-friendly method [40]; ACN is a toxic substance (also designated methyl cyanide) that requires either professional recycling using fractional distillation (an expensive and energy intensive method) or (as used in this study) chemical neutralisation using sodium hydroxide [41], so it was desirable to have the smallest possible concentration of ACN in the MP as possible. The study method, by incorporating low ACN volumes and an isocratic (v gradient) elution, used approximately 15% of the ACN volume per run cited in one recent non-MS HPLC method [3].
It is anticipated that method development will continue with the use of ultra-high performance liquid chromatography (UHPLC) technology to reduce run times (and thus reduce reagent usage), thus further reducing the environmental impact of the assay. HPLC and UHPLC systems with UV DAD are also much more energy efficient compared with HPLC-MS/MS equipment as they do not require specialized (and expensive) carrier and inert gases and use less electrical energy.
Other nucleoside analogue antiviral drugs such as molnupiravir (EIDD-2801) have been used for treating FIP [7,8] and the method described in this paper may be modified and used to support TDM for this compound by assaying its parent drug N4-hydroxycytidine (EIDD-1931), which is also used therapeutically.
The requirement of observing the development of each chromatograph does restrict the commercial use slightly, as the method is not of a “walk-away” nature, so trained operators would be required to observe throughout the sample run each day. This time-consuming process will be reduced as the method is transferred to an UHPLC platform with attendant run-time reductions.
The clinical application of the technique, to support clinical TDM data collection, appears to be justified as the sample results collected for this paper (the study continues as of October 2025) show a wide range of values for each one-hour time bin after drug administration (Figure 4, Table s 3). This wide variation suggests a similarly wide range of metabolic processes being carried out in FIP affected cats and the consequent variability with which GS-44 is absorbed and/or eliminated after administration. This is not unexpected as FIP has at least four phenotypes (including cats expressing more than one) as well as affecting a disparate population of age, sex, breed, husbandry and immunological competence. Such variations may be translated into how efficiently GS-44 is presented to its intended site of action (monocytes and macrophages) and the inherent potential for sub- and supra-optimal antiviral effects. As a clinical tool, TDM is well suited to investigate and quantify these variations (as discussed in a paper in preparation).
Conclusion
The study describes an assay method for plasma and serum GS-44 which satisfies the practical requirements of both diagnostic and research laboratories in respect of cost effectiveness, usage of readily accessible technology, simple and eco-friendly method and ease of implementation. We anticipate this will encourage a more widespread use of TDM for monitoring the tissue concentrations of GS-44 (and perhaps similar drugs) during the treatment of FIP. This, in turn, will make it possible to populate sufficiently large data sets representing all the variables inherent in the clinical expression of FIP and construct meaningful population PK models, further refining the treatment of this disease.
Supplementary Materials
The following supporting information can be downloaded at the website of this paper posted on Preprints.org.
Author Contributions
Conceptualization, S.C. and R.H.; methodology, S.C.; validation, S.C.; formal analysis, S.C.; investigation, S.C.; resources, S.C.; data curation, S.C.; writing—original draft preparation, S.C.; writing—review and editing, D.G-M, R.H.; visualization, S.C.; supervision, S.C.; project administration, S.C.; funding acquisition, S.C. All authors have read and agreed to the published version of the manuscript.
Funding
This research received no external funding.
Institutional Review Board Statement
The animal study protocol was approved by Veterinary Ethical Review Committee (VERC) of the University of Edinburgh, UK; VERC 63.22; dated 4/12/22.
Data Availability Statement
Data will be made available on request to SWC@microsampling-laboratory.co.uk.
Acknowledgments
This research was funded in full by The Microsampling Laboratory Ltd. Thank you to everyone in the clinics who provided samples from the cats.
Conflicts of Interest
Author Stephen W. Cooke was employed by the company The Microsampling Laboratory Ltd. The remaining authors declare that the research was conducted in the absence of any commercial or financial relationships that could be construed as a potential conflict of interest.
References
- Tasker, S; Addie, DD; Egberink, H; Hofmann-Lehmann, R; Hosie, MJ; Truyen, U; et al. Feline Infectious Peritonitis: European Advisory Board on Cat Diseases Guidelines. Viruses 2023, 15, 1847. [Google Scholar] [CrossRef]
- Feline infectious peritonitis (FIP). n.d. Available online: https://icatcare.org/articles/feline-infectious-peritonitis-fip (accessed on 1 September 2025).
- Kimble, B; Coggins, SJ; Norris, JM; Thompson, MF; Govendir, M. Quantification of GS-441524 concentration in feline plasma using high performance liquid chromatography with fluorescence detection. Vet Q 2023, 43, 1–9. [Google Scholar] [CrossRef]
- Coggins, SJ; Govendir, M; Norris, JM; Malik, R; Hall, EJ; Thompson, MF; et al. Pharmacokinetics of GS -441524 following intravenous remdesivir in six cats and results of therapeutic drug monitoring during treatment of feline infectious peritonitis: 22 cases (2021–2024). J Small Anim Pract 2025, 66, 495–506. [Google Scholar] [CrossRef]
- Vatandaslar, H. A Systematic Study on the Optimal Nucleotide Analogue Concentration and Rate Limiting Nucleotide of the SARS-CoV-2 RNA-Dependent RNA Polymerase. Int J Mol Sci 2022, 23, 8302. [Google Scholar] [CrossRef]
- Murphy, BG; Perron, M; Murakami, E; Bauer, K; Park, Y; Eckstrand, C; et al. The nucleoside analog GS-441524 strongly inhibits feline infectious peritonitis (FIP) virus in tissue culture and experimental cat infection studies. Vet Microbiol 2018, 219, 226–33. [Google Scholar] [CrossRef]
- Cook, S; Wittenburg, L; Yan, VC; Theil, JH; Castillo, D; Reagan, KL; et al. An Optimized Bioassay for Screening Combined Anticoronaviral Compounds for Efficacy against Feline Infectious Peritonitis Virus with Pharmacokinetic Analyses of GS-441524, Remdesivir, and Molnupiravir in Cats. Viruses 2022, 14, 2429. [Google Scholar] [CrossRef]
- Cook, S; Wittenburg, L; Yan, VC; Theil, JH; Castillo, D; Reagan, KL; et al. Correction: Cook et al. An Optimized Bioassay for Screening Combined Anticoronaviral Compounds for Efficacy against Feline Infectious Peritonitis Virus with Pharmacokinetic Analyses of GS-441524, Remdesivir, and Molnupiravir in Cats. Viruses 2022, 14, 2429. Viruses 2024, 16, 397. [Google Scholar] [CrossRef]
- Yan, Y; Li, J; Jiao, Z; Yang, M; Li, L; Wang, G; et al. Better therapeutic effect of oral administration of GS441524 compared with GC376. Vet Microbiol 2023, 283, 109781. [Google Scholar] [CrossRef]
- Coggins, SJ; Norris, JM; Malik, R; Govendir, M; Hall, EJ; Kimble, B; et al. Outcomes of treatment of cats with feline infectious peritonitis using parenterally administered remdesivir, with or without transition to orally administered GS -441524. J Vet Intern Med 2023, 37, 1772–83. [Google Scholar] [CrossRef] [PubMed]
- Taylor, SS; Coggins, S; Barker, EN; Gunn-Moore, D; Jeevaratnam, K; Norris, JM; et al. Retrospective study and outcome of 307 cats with feline infectious peritonitis treated with legally sourced veterinary compounded preparations of remdesivir and GS-441524 (2020–2022). J Feline Med Surg 2023, 25, 1098612X231194460. [Google Scholar] [CrossRef] [PubMed]
- Pedersen, NC; Perron, M; Bannasch, M; Montgomery, E; Murakami, E; Liepnieks, M; et al. Efficacy and safety of the nucleoside analog GS-441524 for treatment of cats with naturally occurring feline infectious peritonitis. J Feline Med Surg 2019, 21, 271–81. [Google Scholar] [CrossRef]
- Dickinson, PJ; Bannasch, M; Thomasy, SM; Murthy, VD; Vernau, KM; Liepnieks, M; et al. Antiviral treatment using the adenosine nucleoside analogue GS -441524 in cats with clinically diagnosed neurological feline infectious peritonitis. J Vet Intern Med 2020, 34, 1587–93. [Google Scholar] [CrossRef]
- Green, J; Syme, H; Tayler, S. Thirty-two cats with effusive or non-effusive feline infectious peritonitis treated with a combination of remdesivir and GS-441524. J Vet Intern Med 2023, 37, 1784–93. [Google Scholar] [CrossRef] [PubMed]
- Zwicklbauer, K; Krentz, D; Bergmann, M; Felten, S; Dorsch, R; Fischer, A; et al. Long-term follow-up of cats in complete remission after treatment of feline infectious peritonitis with oral GS-441524. J Feline Med Surg 2023, 25, 1098612X231183250. [Google Scholar] [CrossRef] [PubMed]
- Renner, KA; Cattin, R; Kimble, B; Munday, J; White, A; Coggins, S. Efficacy of oral remdesivir in treating feline infectious peritonitis: a prospective observational study of 29 cats. J Feline Med Surg 2025, 27, 1098612X251335189. [Google Scholar] [CrossRef] [PubMed]
- Kamiyoshi, T; Kamiyoshi, N; Jintake, C. High-dose induction therapy and treatment termination criteria for feline infectious peritonitis with remdesivir, GS-441524 and adjunctive mefloquine: 46 cases (2023). J Small Anim Pract 2025, 66, 617–26. [Google Scholar] [CrossRef]
- Goto, S; Kamiyoshi, T; Iwasaki, R. Predictive factors associated with short-term mortality in cats with feline infectious peritonitis treated with remdesivir or GS-441524 or both. J Vet Intern Med 2024, 39, e17249. [Google Scholar] [CrossRef]
- Zuzzi-Krebitz, A-M; Buchta, K; Bergmann, M; Krentz, D; Zwicklbauer, K; Dorsch, R; et al. Short Treatment of 42 Days with Oral GS-441524 Results in Equal Efficacy as the Recommended 84-Day Treatment in Cats Suffering from Feline Infectious Peritonitis with Effusion—A Prospective Randomized Controlled Study. Viruses 2024, 16, 1144. [Google Scholar] [CrossRef]
- Curtius, CC; de, W; Rodary, M; Hofmann-Lehmann, R; Spiri, AM; Meli, ML; Bouzon, AC; et al. Navigating Neurological Re-emergence in Feline Infectious Peritonitis: Challenges and Insights from GS-441524 and Remdesivir Treatment. 2025, 2025.04.04.646959. [Google Scholar] [CrossRef]
- Cosaro, E; Pires, J; Castillo, D; Murphy, BG; Reagan, KL. Efficacy of Oral Remdesivir Compared to GS-441524 for Treatment of Cats with Naturally Occurring Effusive Feline Infectious Peritonitis: A Blinded, Non-Inferiority Study. Viruses 2023, 15, 1680. [Google Scholar] [CrossRef]
- Anwer, AZ; Abdulkader, MS; Abdel Massieh, ES. Outcomes of Treatment of Cats with Effusive Feline Infectious Peritonitis Using Parenterally Administered Remdesivir with Two Different Maintenance Dose Concentrations. Kafkas Univ Vet Fak Derg 2025. [Google Scholar] [CrossRef]
- Jones, S; Novicoff, W; Nadeau, J; Evans, S. Unlicensed GS-441524-Like Antiviral Therapy Can Be Effective for at-Home Treatment of Feline Infectious Peritonitis. Animals 2021, 11, 2257. [Google Scholar] [CrossRef]
- Negash, R; Li, E; Jacque, N; Novicoff, W; Evans, SJM. Owner experience and veterinary involvement with unlicensed GS-441524 treatment of feline infectious peritonitis: a prospective cohort study. Front Vet Sci 2024, 11, 1377207. [Google Scholar] [CrossRef]
- Larson, K; Hart, E; Negash, R; Novicoff, W; Jacque, N; Evans, S. Prospective Analysis of Clinicopathologic Correlates of At-Home Feline Infectious Peritonitis Treatment Using GS-441524. Pathog Basel Switz 2025, 14, 507. [Google Scholar] [CrossRef]
- Kent, AM; Guan, S; Jacque, N; Novicoff, W; Evans, SJM. Unlicensed antiviral products used for the at-home treatment of feline infectious peritonitis contain GS-441524 at significantly different amounts than advertised. J Am Vet Med Assoc 2024, 262, 489–97. [Google Scholar] [CrossRef] [PubMed]
- Mulligan, AJ; Browning, ME. Quality assessment and characterization of unregulated antiviral drugs for feline infectious peritonitis: implications for treatment, safety, and efficacy. Am J Vet Res 2024, 1–9. [Google Scholar] [CrossRef]
- Individualized Drug Therapy for Patients; Elsevier, 2017. [CrossRef]
- Avataneo, V; De Nicolò, A; Cusato, J; Antonucci, M; Manca, A; Palermiti, A; et al. Development and validation of a UHPLC-MS/MS method for quantification of the prodrug remdesivir and its metabolite GS-441524: a tool for clinical pharmacokinetics of SARS-CoV-2/COVID-19 and Ebola virus disease. J Antimicrob Chemother 2020, 75, 1772–7. [Google Scholar] [CrossRef]
- Alvarez, J-C; Moine, P; Etting, I; Annane, D; Larabi, IA. Quantification of plasma remdesivir and its metabolite GS-441524 using liquid chromatography coupled to tandem mass spectrometry. Application to a Covid-19 treated patient. Clin Chem Lab Med CCLM 2020, 58, 1461–8. [Google Scholar] [CrossRef] [PubMed]
- Du, P; Wang, G; Yang, S; Li, P; Liu, L. Quantitative HPLC-MS/MS determination of Nuc, the active metabolite of remdesivir, and its pharmacokinetics in rat. Anal Bioanal Chem 2021, 413, 5811–20. [Google Scholar] [CrossRef]
- Habler, K; Brügel, M; Teupser, D; Liebchen, U; Scharf, C; Schönermarck, U; et al. Simultaneous quantification of seven repurposed COVID-19 drugs remdesivir (plus metabolite GS-441524), chloroquine, hydroxychloroquine, lopinavir, ritonavir, favipiravir and azithromycin by a two-dimensional isotope dilution LC–MS/MS method in human serum. J Pharm Biomed Anal 2021, 196, 113935. [Google Scholar] [CrossRef] [PubMed]
- Wang, AQ; Hagen, NR; Padilha, EC; Yang, M; Shah, P; Chen, CZ; et al. Preclinical Pharmacokinetics and In Vitro Properties of GS-441524, a Potential Oral Drug Candidate for COVID-19 Treatment. Front Pharmacol 2022, 13, 918083. [Google Scholar] [CrossRef] [PubMed]
- Lee, KS; Gartner, LM. Spectrophotometric characteristics of bilirubin. Pediatr Res 1976, 10, 782–8. [Google Scholar] [CrossRef]
- Janjua, HU; Batool, Z; Nazir, A; Akhtar, U; Gilanie, G; Rehman, J; et al. Proteins and Triglycerides measurement in Blood under UV/VIS spectroscopy (190-1100 nm). Lasers Eng 2023, 55, 157–67. [Google Scholar]
- GS-441524 n.d. https://go.drugbank.com/drugs/DB15686 (accessed October 21, 2025).
- M10_Guideline_Step4_2022_0524.pdf n.d.
- When Should an Internal Standard be Used? n.d. Available online: https://www.chromatographyonline.com/view/when-should-internal-standard-be-used-0 (accessed on 29 November 2024).
- Jelliffe, R; Neely, M. Individualized Drug Therapy for Patients: Basic Foundations, Relevant Software and Clinical Applications. 2016. [Google Scholar]
- Nakov, N; Acevska, J; Brezovska, K; Kavrakovski, Z; Dimitrovska, A. Green Strategies toward Eco-Friendly HPLC Methods in Pharma Analysis. In High Perform. Liq. Chromatogr. - Recent Adv. Appl.; Núñez, O, Sentellas, S, Granados, M, Saurina, J, Eds.; IntechOpen, 2023. [Google Scholar] [CrossRef]
- Gilomen, K; Stauffer, HP; Meyer, VR. Detoxification of acetonitrile-water wastes from liquid chromatography. Chromatographia 1995, 41, 488–91. [Google Scholar] [CrossRef]
Figure 1.
Chromatogram of blank plasma (from a cat known to have not received either remdesivir (REM) or GS-441524 (GS-44) or be suffering from FIP. Scaled y axis -0.5 to + 0.5 µV to exaggerate the absence of a peak at and around (+/- 1.0 min) the expected elution time of GS-44 (7.2 min +/- 0.2 min).
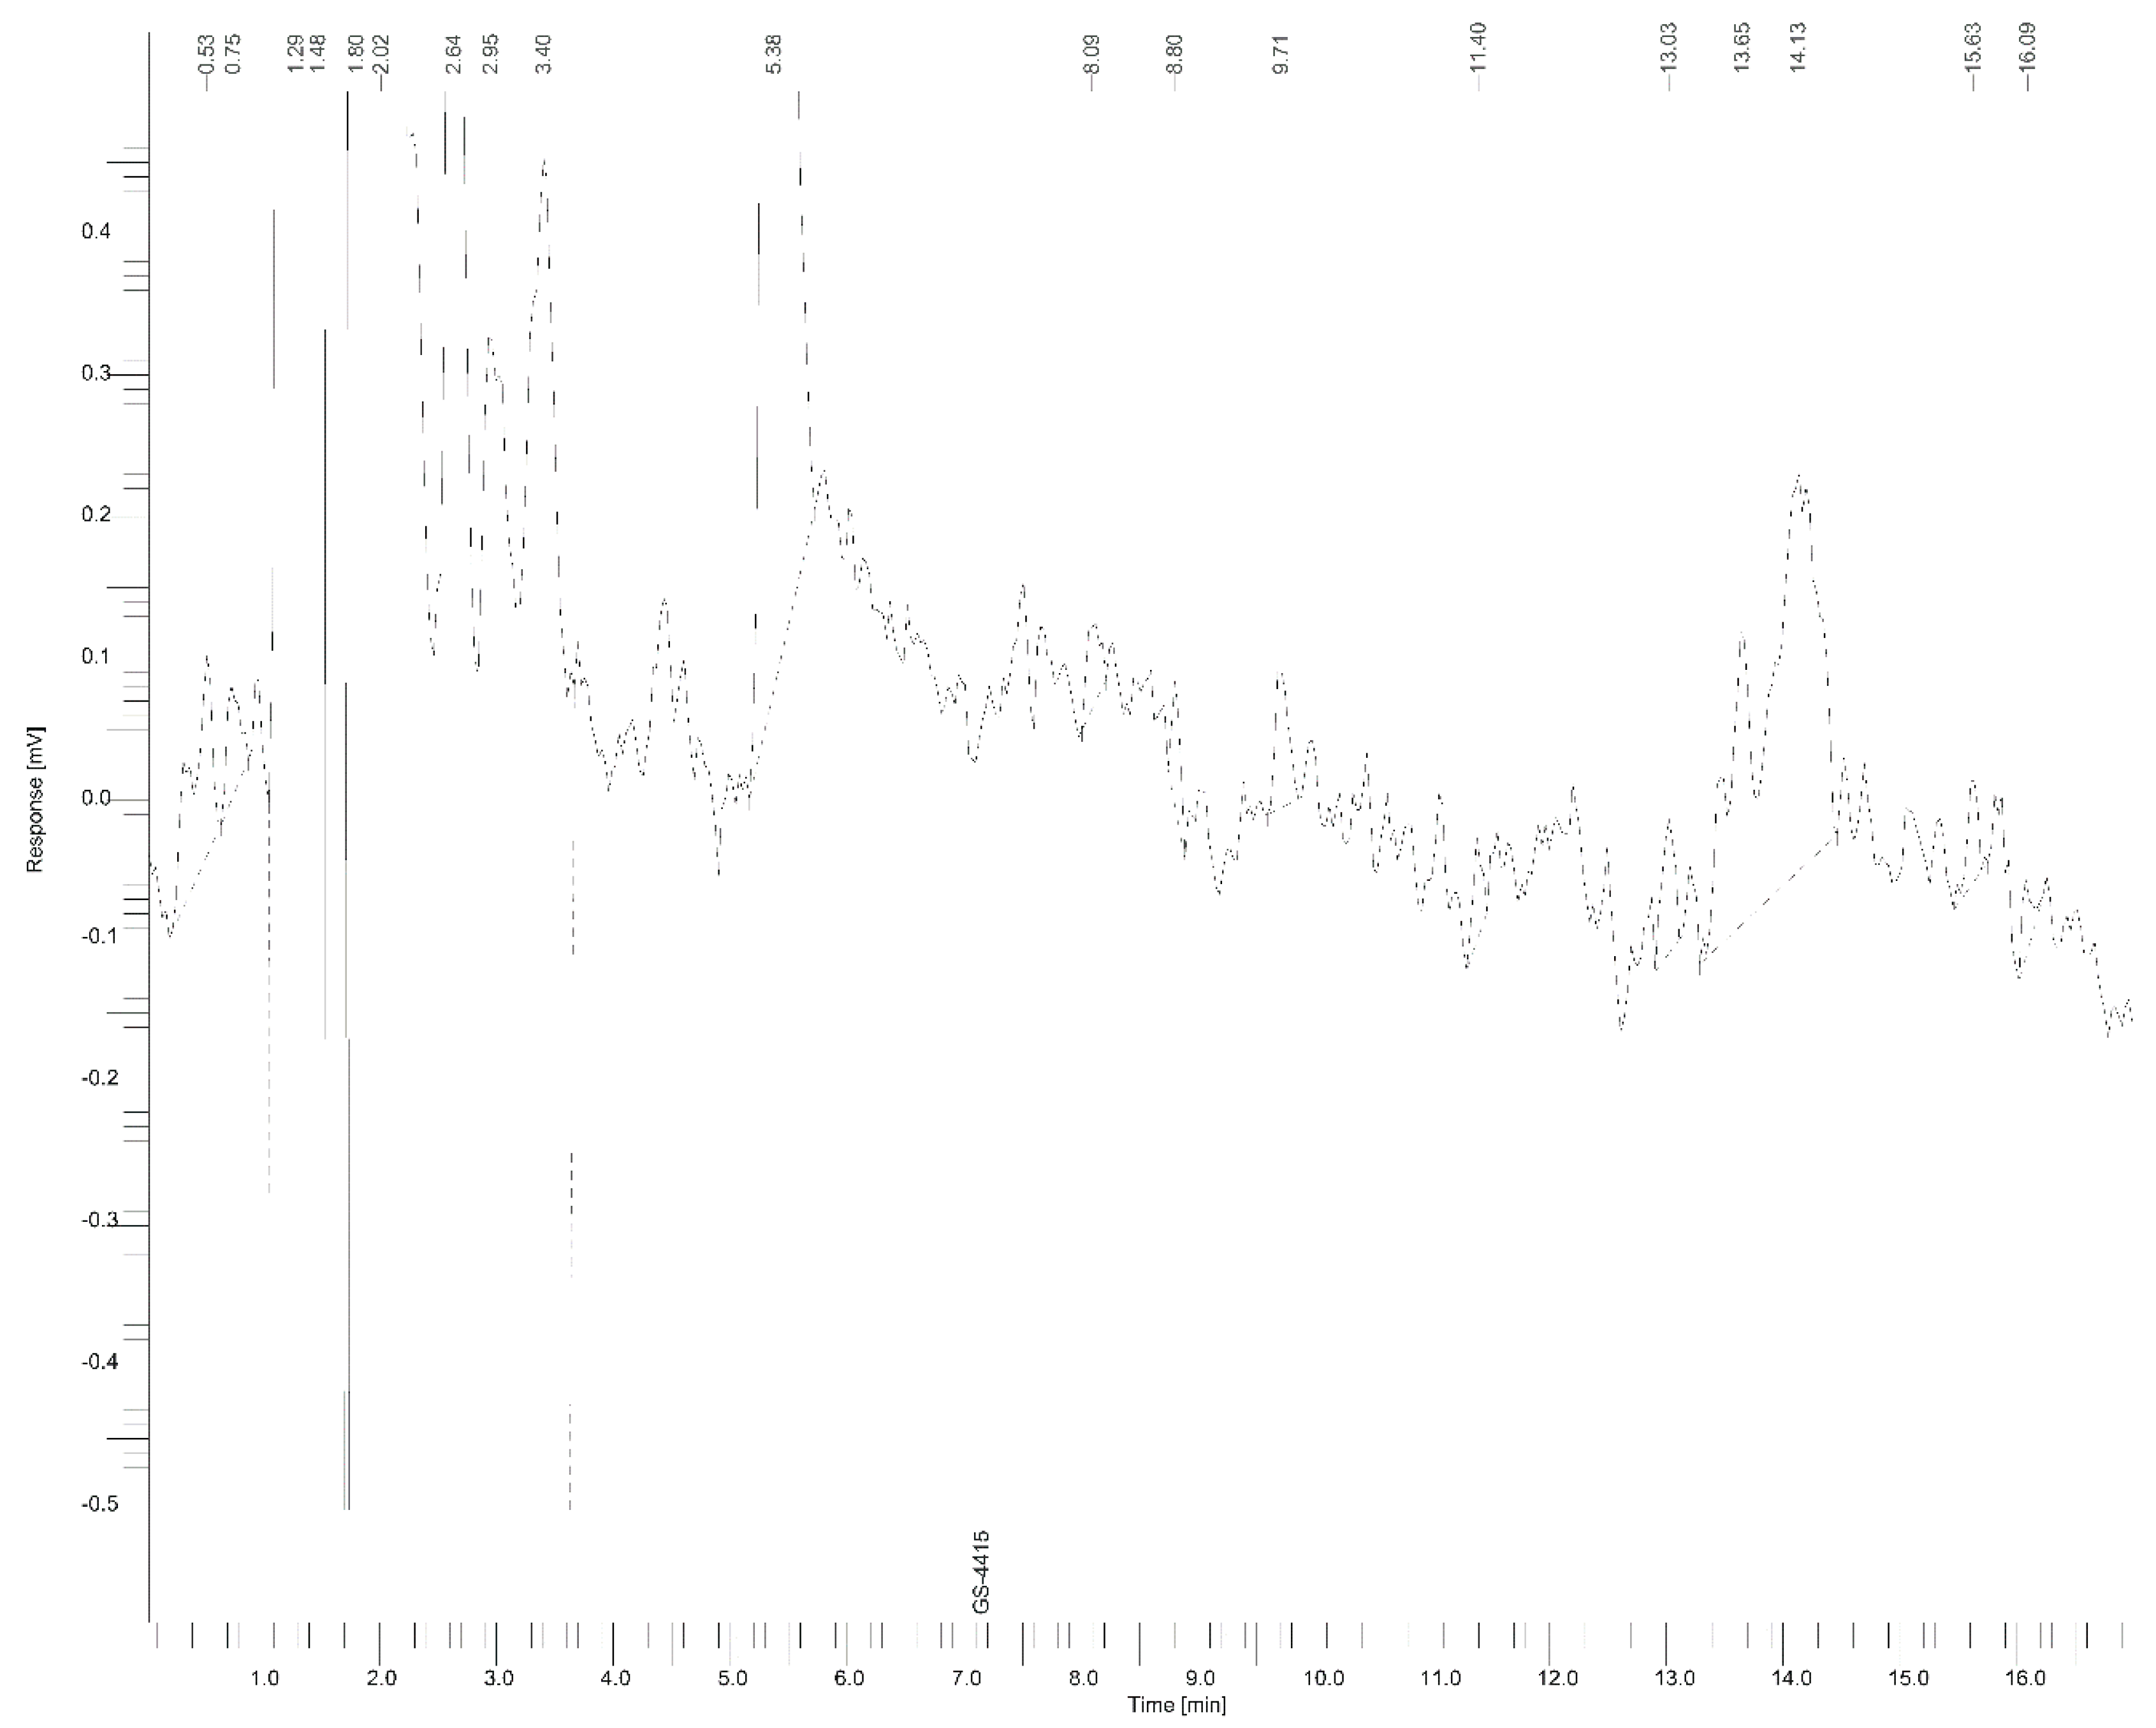
Figure 2.
Chromatogram of a study sample; from a cat known to have been administered GS-441524 (GS-44) clinically for the treatment of feline infectious peritonitis (FIP). GS-44 is shown as the peak at 7.28 m. Also see Figure 2. Note: y axis scale - 0.2 to + 3.7 µV.
Figure 2.
Chromatogram of a study sample; from a cat known to have been administered GS-441524 (GS-44) clinically for the treatment of feline infectious peritonitis (FIP). GS-44 is shown as the peak at 7.28 m. Also see Figure 2. Note: y axis scale - 0.2 to + 3.7 µV.
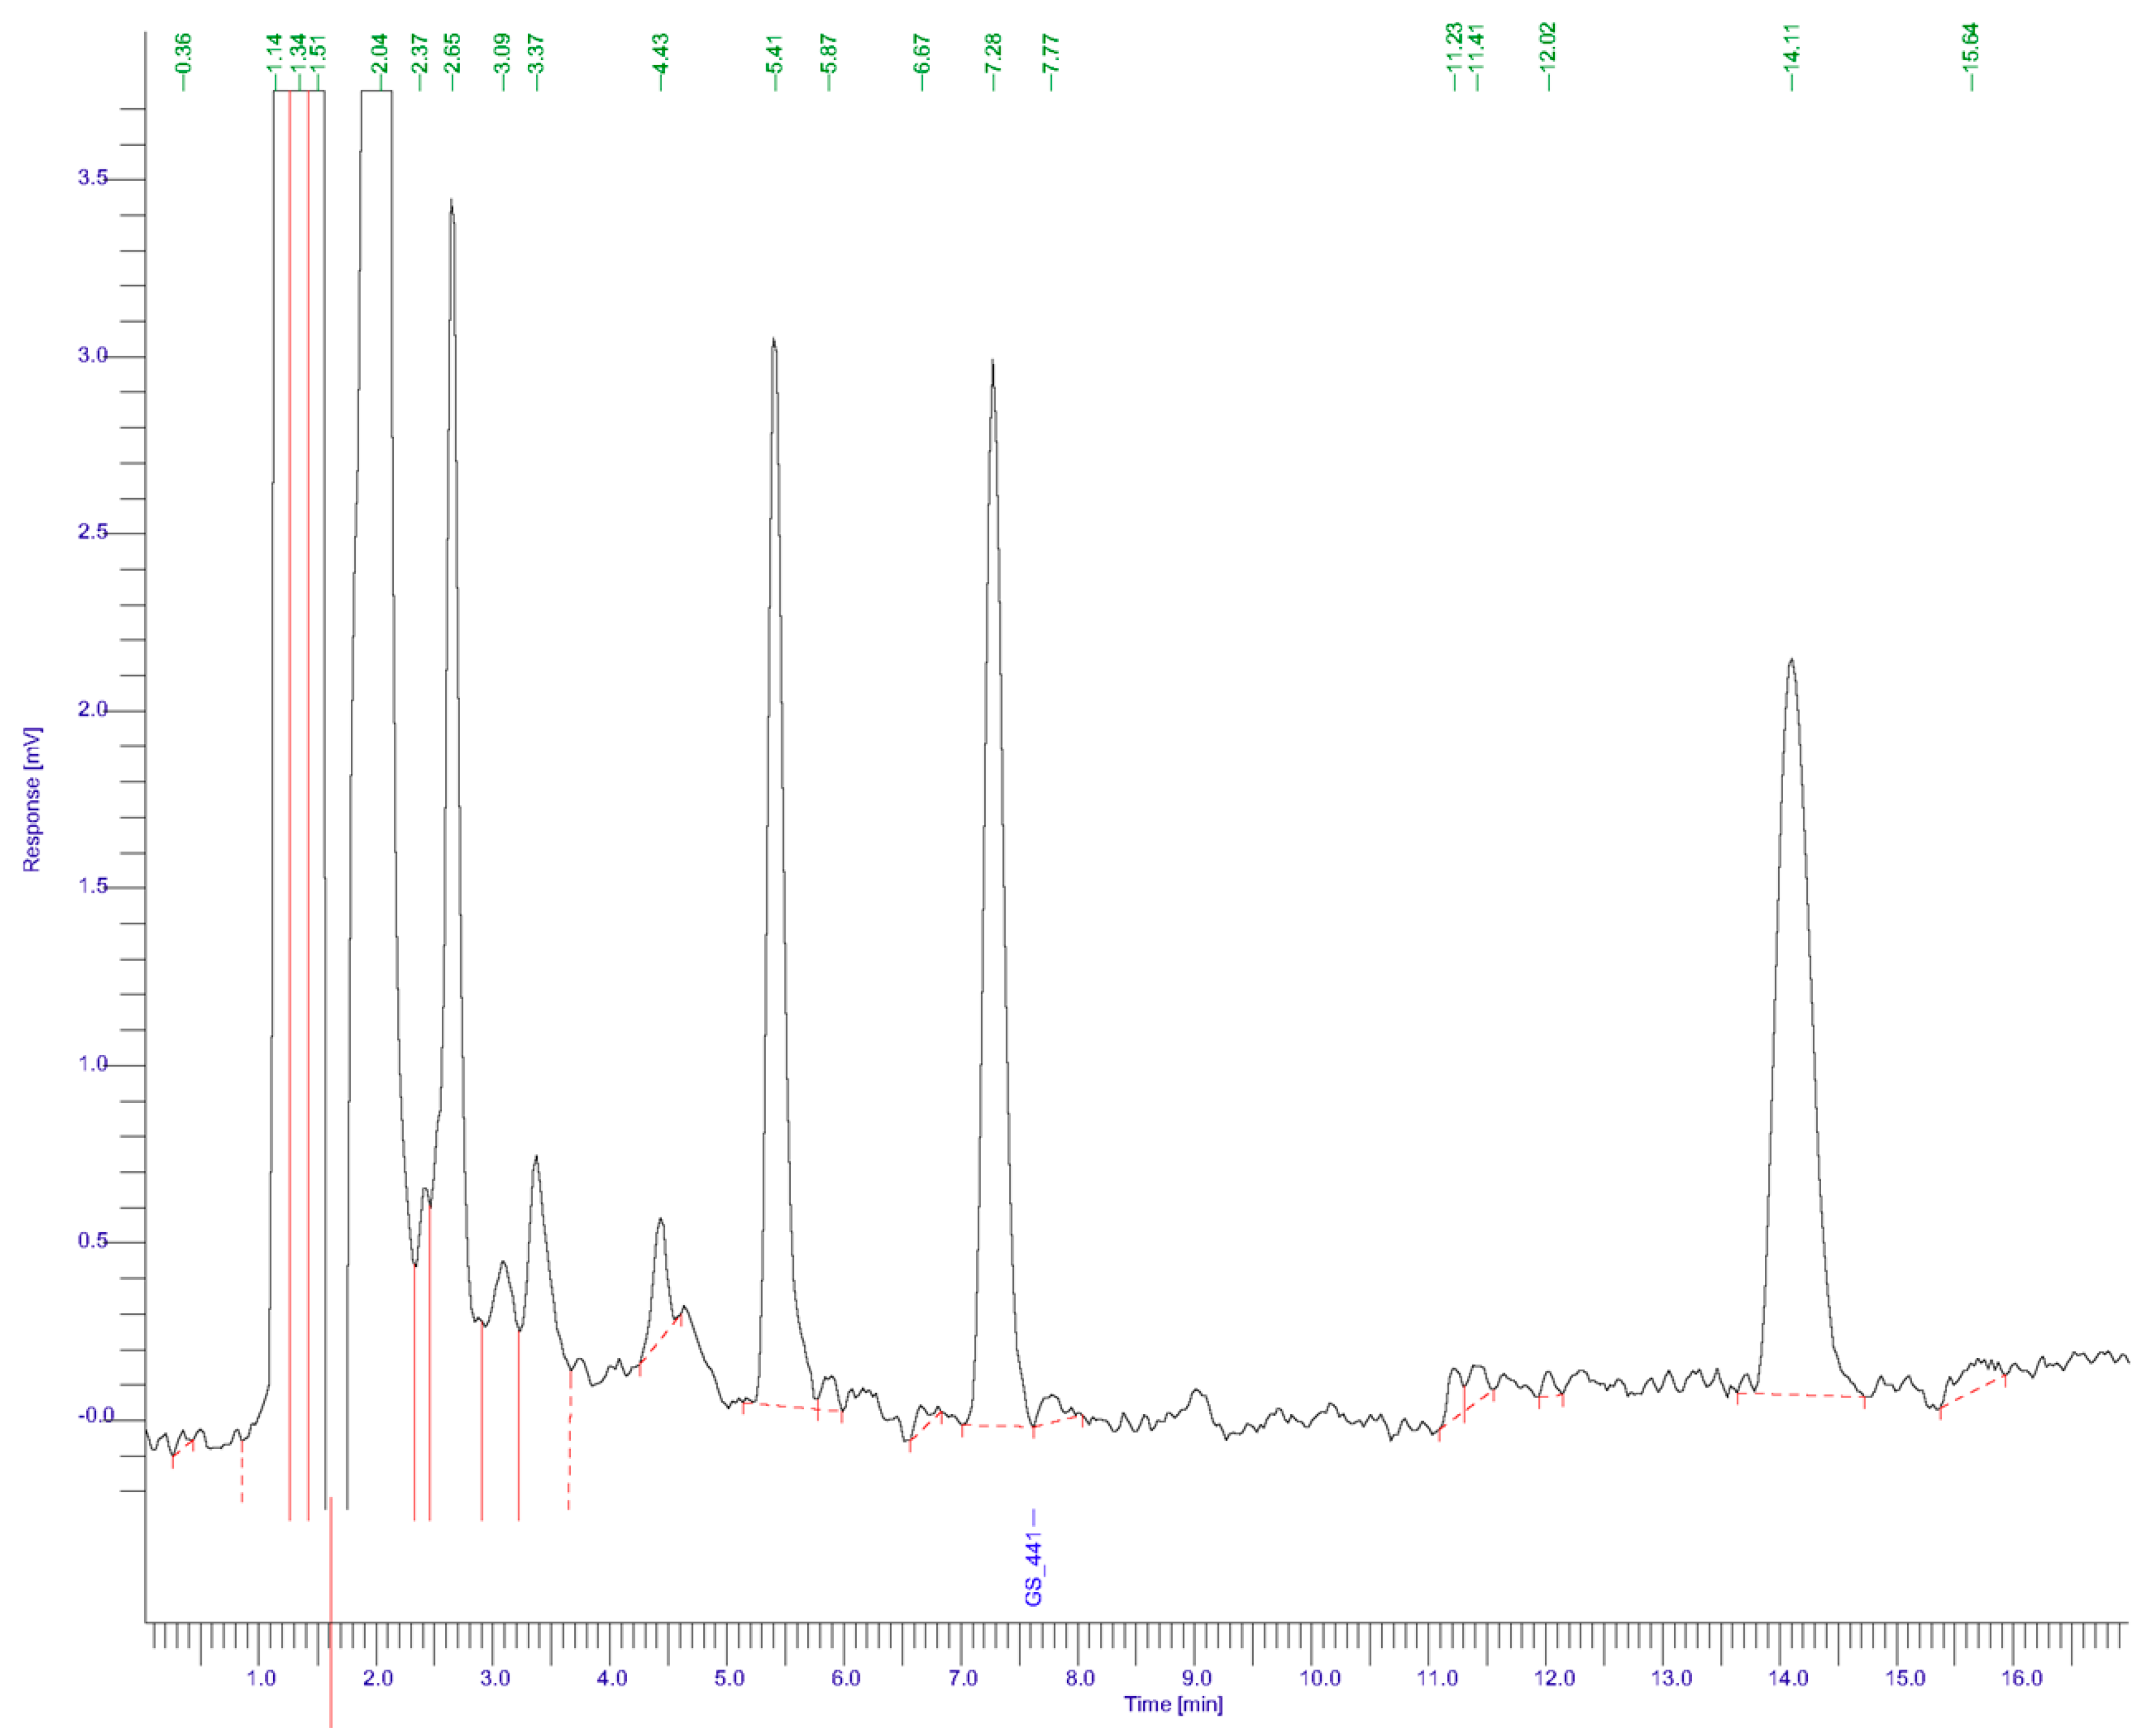
Figure 3.
Chromatogram of the same sample shown in Figure 2 after spiking (i.e. the addition of exogenous GS-441524) showing increase in GS-441524 (GS-44) peak height at 7.28 min, compared with Figure 2. The spike GS-44 added increased the peak area in proportion to the total amount of GS-44 (endogenous + spike amounts). Note: y axis scale 0.2 to + 8.7 µV, cf 0.2 to + 3.7 µV for Figure 2.
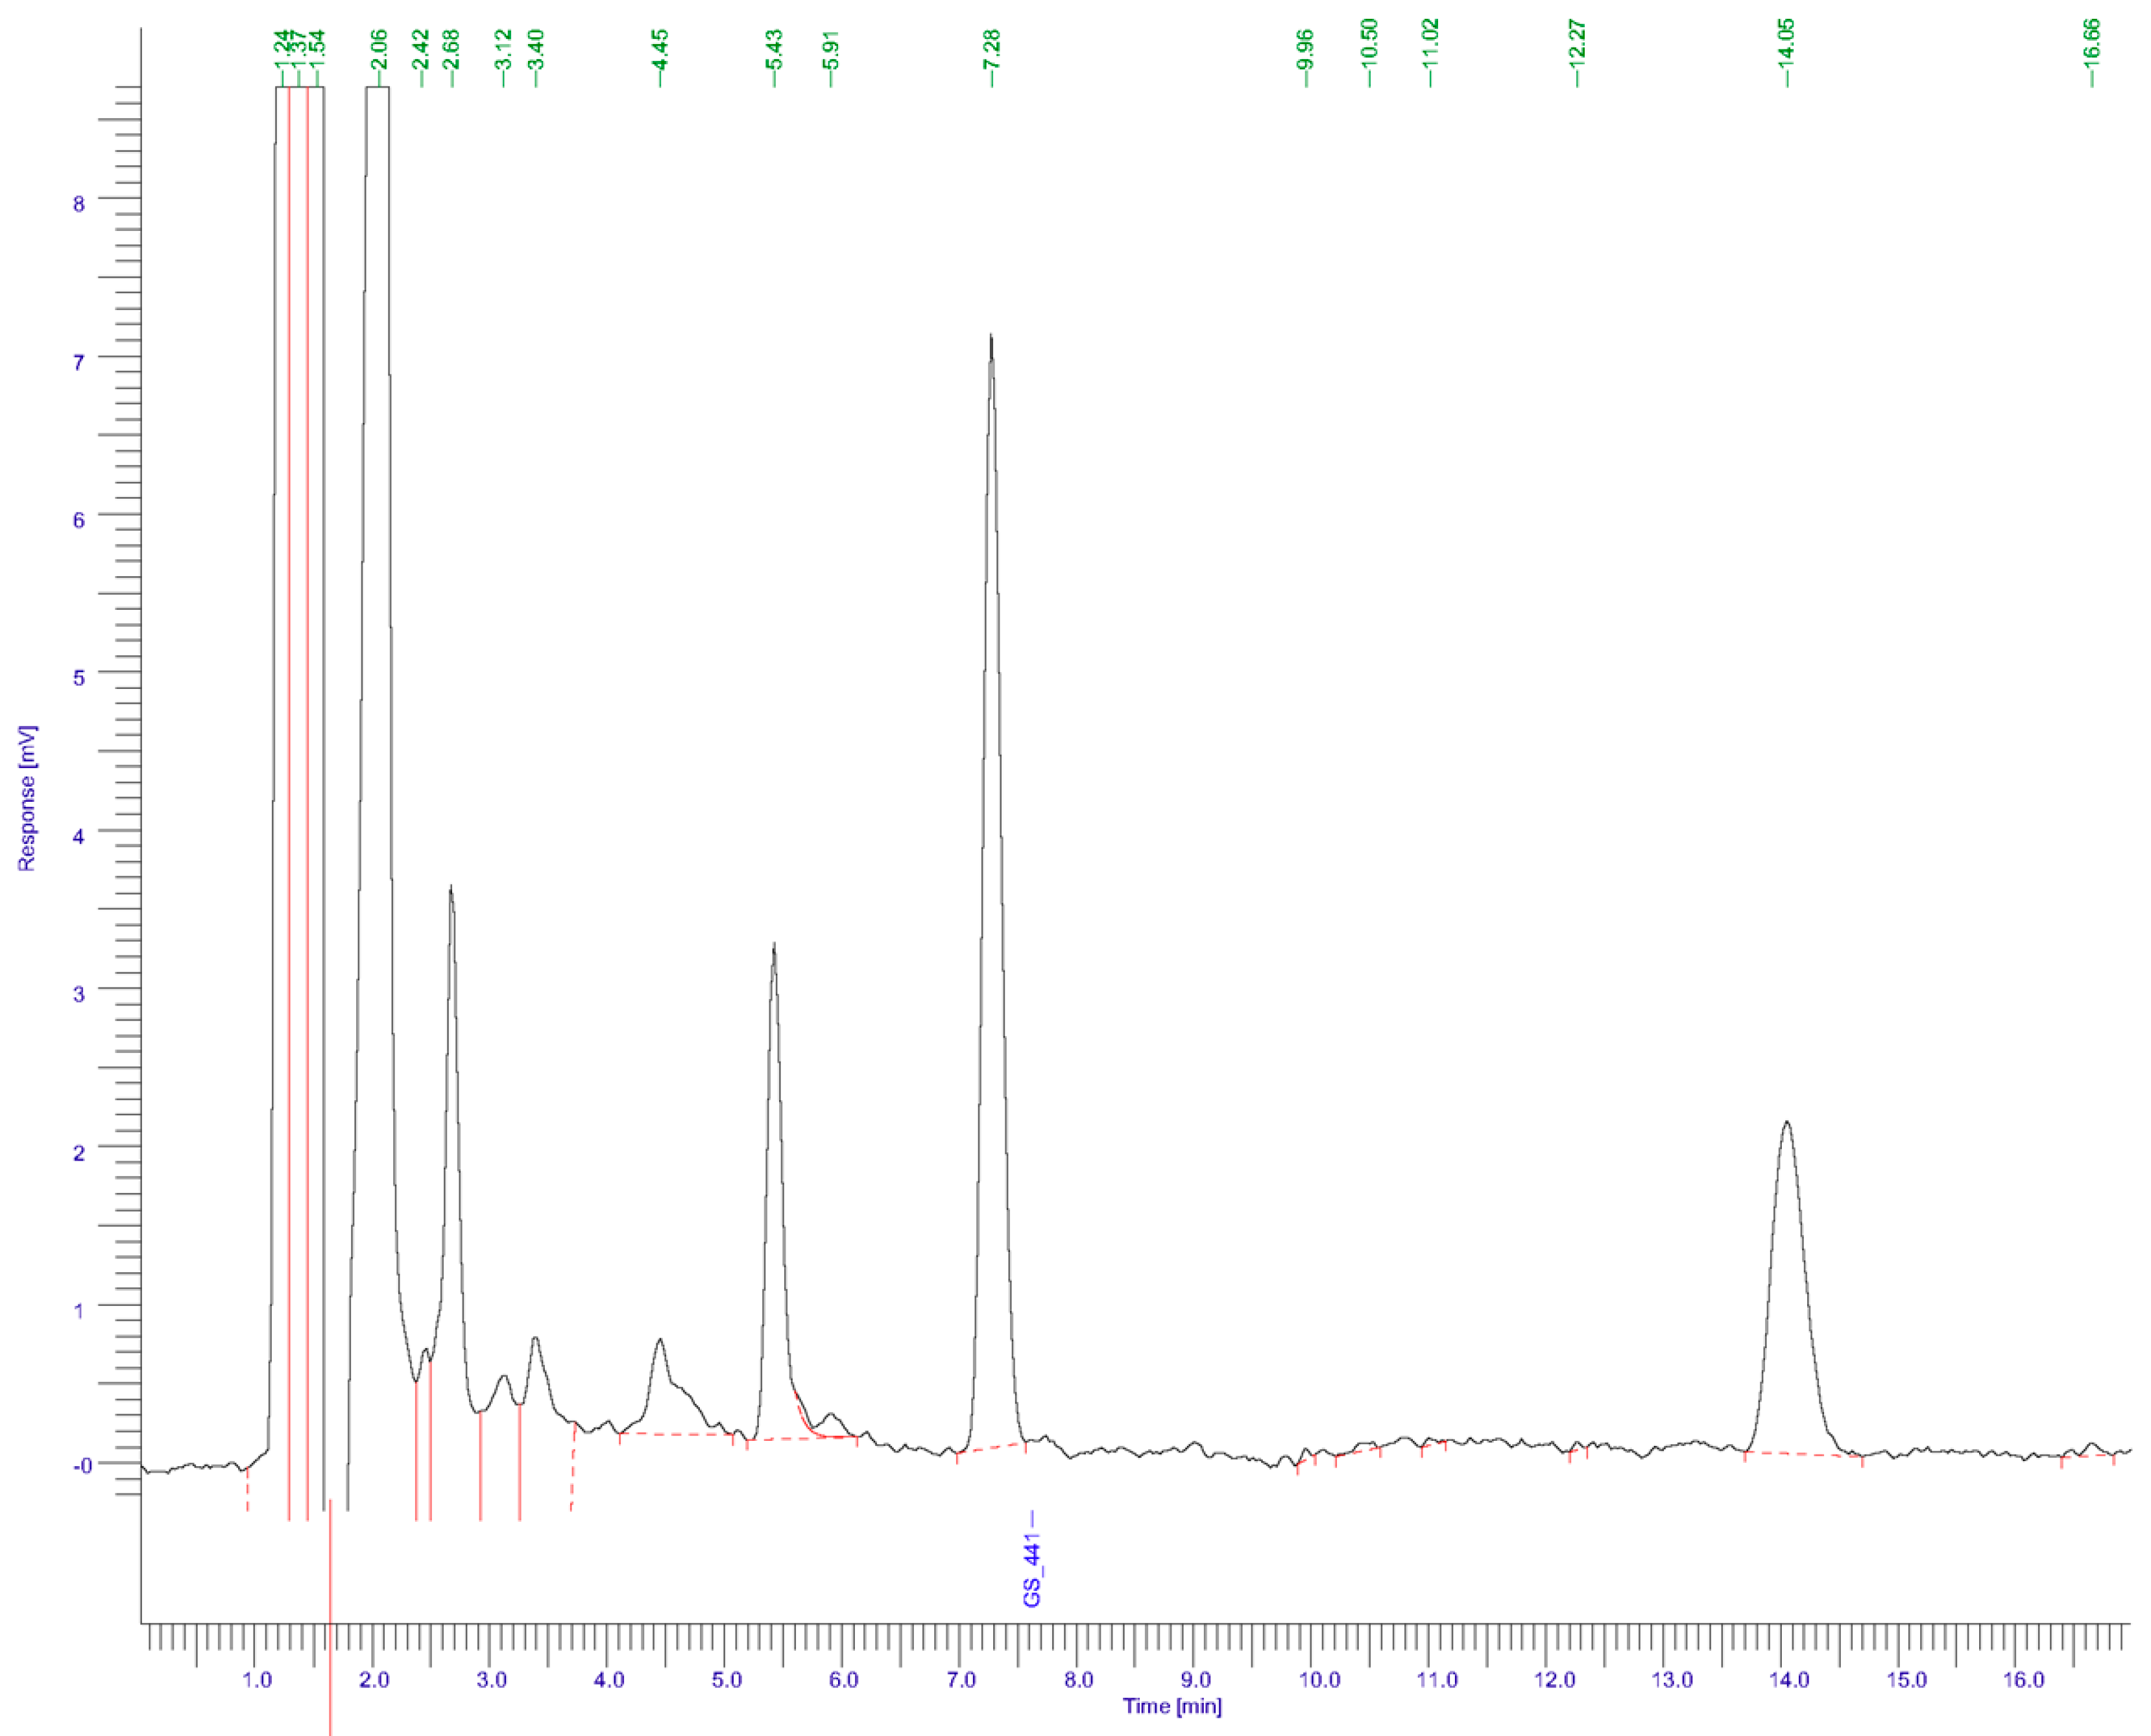
Figure 4.
Plasma GS-44 concentration (microM) for one hour bins of time after drug administration. Bar and whisker plot, whiskers showing range of values, stars indicating individual results and bar representing 25% and 75% confidence interval with median value as the intermediate solid line.
Figure 4.
Plasma GS-44 concentration (microM) for one hour bins of time after drug administration. Bar and whisker plot, whiskers showing range of values, stars indicating individual results and bar representing 25% and 75% confidence interval with median value as the intermediate solid line.
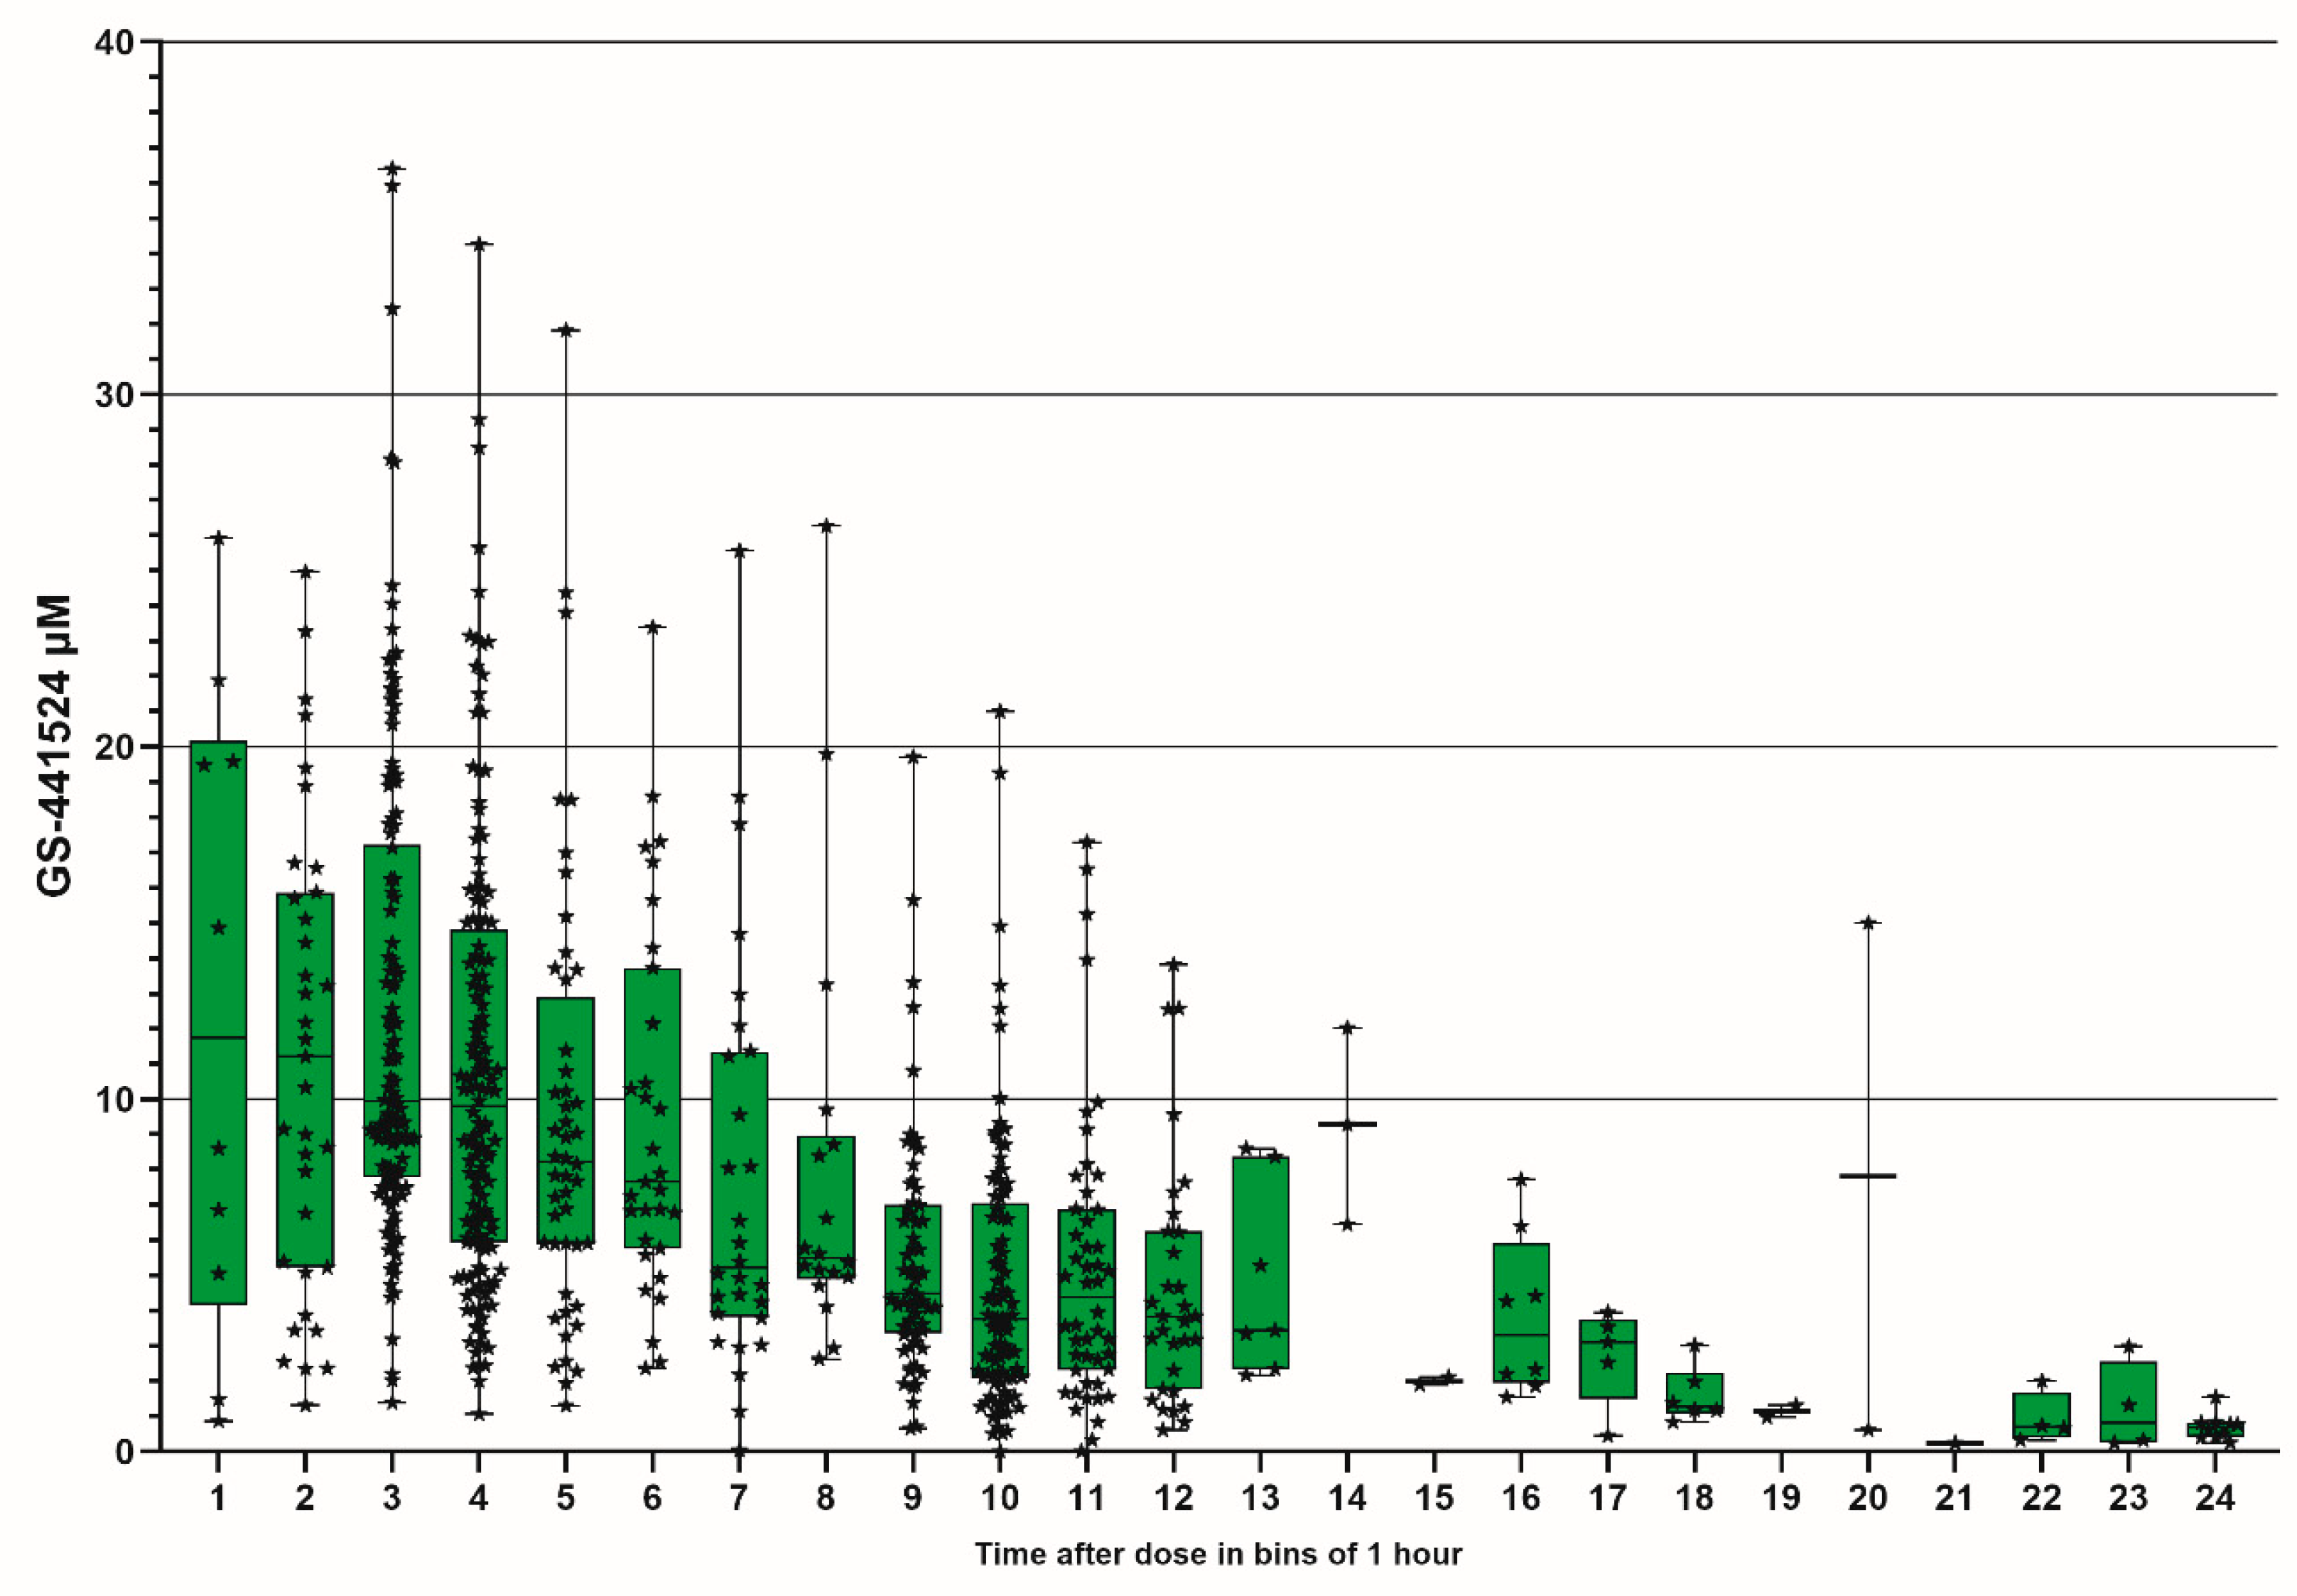

Table 1.
Standard solutions of GS-441524 (GS-44) in HPLC mobile phase, ng/mL.
| GS-44 concentration ng/mL | 5048.28 | 3527.71 | 1853.16 | 950.65 | 834.35 | 717.65 | 600.00 | 481.58 | 362.38 | 242.38 | 121.19 | 60.40 | 32.11 | 16.00 |
Disclaimer/Publisher’s Note: The statements, opinions and data contained in all publications are solely those of the individual author(s) and contributor(s) and not of MDPI and/or the editor(s). MDPI and/or the editor(s) disclaim responsibility for any injury to people or property resulting from any ideas, methods, instructions or products referred to in the content. |
© 2026 by the authors. Licensee MDPI, Basel, Switzerland. This article is an open access article distributed under the terms and conditions of the Creative Commons Attribution (CC BY) license (http://creativecommons.org/licenses/by/4.0/).
Copyright: This open access article is published under a Creative Commons CC BY 4.0 license, which permit the free download, distribution, and reuse, provided that the author and preprint are cited in any reuse.


