Submitted:
16 January 2026
Posted:
19 January 2026
You are already at the latest version
Abstract
This study establishes a dynamic assessment framework for glucose-lipid metabolism using wearable multimodal sensing (optical glucose, EDA, HRV, sleep, energy expenditure) to predict metabolic responses following oral anti-obesity medication (AOMs) treatment. Data from 380 overweight/obese individuals were collected over 24 consecutive weeks to construct behavior-metabolism coupling features. The TFT-Mixture model was applied to predict short-term weight changes and glucose improvement trends (R² = 0.83). SHAP analysis further examined the impact of lifestyle features (evening step count, sleep duration) on drug efficacy variability. This study reveals the contribution of multimodal behavioral phenotypes to AOMs treatment response, providing a technical pathway for intelligent personalized medication management.
Keywords:
wearable multimodal
; metabolic response prediction
; AOMs
; personalized medication
; time‐series modeling
1. Introduction
Amid the shift toward personalized prevention and treatment of metabolic diseases, dynamic sensing and precision intervention have emerged as pivotal directions in precision medicine. Glucose-lipid metabolic states are influenced by the synergistic effects of multidimensional behavioral and physiological factors, with their short-term fluctuations significantly modulating drug responses. This underscores the urgent need for a cross-modal, time-series integrated assessment system. Based on wearable multimodal sensor data, this paper proposes a coupled analysis method integrating behavioral and physiological characteristics to construct a dynamic assessment framework for glucose-lipid metabolism. It further designs a personalized modeling mechanism for predicting the efficacy of oral anti-obesity drugs. The study encompasses multiple stages including data acquisition, indicator calculation, model design, and performance validation, aiming to achieve structural analysis and prediction of metabolic response mechanisms. This provides quantitative support and technical pathways for clinical drug management.
2. Wearable Multimodal Sensors and Data Acquisition
2.1. Overview of Wearable Sensing Technology
The wearable multimodal sensing system comprises five hardware modules: (1) a Dexcom G6 optical continuous glucose monitoring (CGM) sensor with a sampling rate of one value every 5 minutes, capable of tracking subcutaneous interstitial glucose with minimal delay; (2) a Shimmer3 GSR+ unit to record skin conductance activity (EDA) at 0.25 Hz, capturing autonomic nervous system arousal; (3) a Polar H10 chest strap equipped with PPG-based HRV measurement at 100 Hz to detect frequency-domain variability; (4) a MetaMotionR inertial measurement unit (IMU) consisting of a 3-axis accelerometer and gyroscope to infer sleep posture and movement at 30 Hz; and (5) a Fitbit Inspire 3 with integrated accelerometer and barometer for energy expenditure estimation at 10 Hz. All devices are synchronized via Bluetooth 5.0 Low Energy protocol to an edge hub that supports timestamp alignment, local caching, and error-resilient data retransmission mechanisms [1]. All sensors synchronize with the edge acquisition terminal via Bluetooth 5.0 Low Energy protocol, supporting local caching and anomaly retransmission mechanisms. Each user generates approximately 180 MB of data daily, featuring complete timestamp annotation and synchronized frame structures, providing a multi-source foundation for downstream detailed modeling of behavior-metabolic characteristics.
2.2. Multimodal Sensing Data Acquisition Method
Multimodal data acquisition employs a high-frequency synchronization mechanism to achieve temporal alignment and redundancy fault tolerance for raw sensor data. The optical blood glucose module utilizes a continuous intermittent scanning strategy, while EDA and HRV signals are synchronously captured via dedicated ADC channels. Data is transmitted via Bluetooth 5.0 to local caching terminals and periodically uploaded to remote analysis platforms via Wi-Fi. All sensor data is encapsulated in a unified format containing timestamps, modality identifiers, and data length fields, supporting automatic frame verification and packet retransmission. The acquisition workflow, illustrated in Figure 1, constitutes a complete end-to-edge-to-cloud multi-level perception chain [2].
2.3 Data Preprocessing and Quality Control
Unified preprocessing and quality control procedures are applied to multimodal sensor data both before and after upload, primarily including: ① Combining the three-sigma method with median filtering to remove outliers and artifact interference from optical glucose and EDA data, while establishing physiological upper/lower constraint windows; ② Reconstructing HRV and sleep data onto a standardized 40-millisecond time axis using linear interpolation to fill missing segments; ③ Zero-drift correction and Z-score normalization of energy expenditure data to ensure consistent numerical distribution across modalities; all data is ultimately packaged into a 3D tensor structure for subsequent model training [3].
3. Construction of the Glucose-Lipid Metabolism Dynamic Assessment Framework
3.1. Definition and Calculation Methods of Glucose-Lipid Metabolic Indicators
The glyco-lipid metabolic assessment framework requires a multidimensional continuous indicator system to reflect short-term metabolic dynamics, primarily including: ① Blood glucose variability is assessed using the coefficient of variation (CV) calculated as the ratio of standard deviation to mean, with diurnal fluctuation amplitude determined via sliding window mean difference [4]; ② Lipid metabolic stress is jointly assessed through resting energy expenditure (REE) variability and low-frequency/high-frequency ratio (LF/HF) of HRV, reflecting sympathetic nervous system activation levels; ③ The Composite Metabolic Index (CMI) is constructed to quantify multimodal feature fusion status, calculated as follows:
Where, denotes the fluctuation range of the average blood glucose level on day, represents the baseline average blood glucose level; indicates the change in energy expenditure per unit time, serves as the individual resting metabolic baseline; signifies the decrease in HRV high-frequency power, is the reference HRV high-frequency value, and coefficients are normalized weighting factors adjusted according to the importance of sensing modalities. CMI provides continuous quantitative input for subsequent individual metabolic response prediction models [5].
3.2. Metabolic State Assessment Model Based on Multimodal Sensing Data
The multimodal metabolic state assessment model employs a deep fusion architecture to extract integrated behavioral-physiological representations. Key design components include: ① Aligning multi-modal inputs along a unified temporal axis into a 3D tensor, where denotes time duration, represents the number of modalities, and indicates the dimensionality per modality. Inputs encompass CMI, EDA conductance rate, HRV frequency-domain power, sleep structure features, and energy expenditure peaks [6]; ② The feature fusion module incorporates cross-modal attention mechanisms to dynamically adjust modal weight distributions and compute metabolic latent variable vectors; ③ The metabolic state scoring function is constructed as follows:
where represents the fused features at time, denote the parameters of the fully connected layer, is the bias term, is the Sigmoid activation function, and indicates the metabolic state risk score. The structures of each modality sensor are shown in Figure 2, providing high-dimensional dynamic representations for constructing inputs to the temporal prediction model.
3.3. Modeling and Evaluation of Behavior-Metabolism Synergistic Features
Behavior-Metabolic Synergy Feature Modeling constructs a unified spatiotemporal space to dynamically align multimodal behavioral variables with glucose-lipid metabolic indicators within fixed windows, capturing the immediate impact of lifestyle fluctuations on metabolic levels [7]. The constructed synergy tensor comprises step density (5-min resolution), sleep fragment proportion (30-s rhythm), energy expenditure channel (10 Hz), EDA phase change rate, HRV frequency-domain power, and blood glucose variability CV. Cross-modal correlation extraction is achieved via a synergy mapping function. Core model computations are as follows:
Where denotes the synergistic feature vector at time; represents behavioral features (step density, sleep structure, energy expenditure, etc.); denotes metabolic features (blood glucose variability, HRV power, etc.); is the weight matrix for behavioral, metabolic, and interaction terms;is the cross-modal interaction function for extracting behavioral–metabolic coupling strength; is the bias term; andis the nonlinear activation. This collaborative architecture provides high-dimensional dynamic inputs for subsequent drug response prediction.
4. Personalized Drug Response Prediction Model
4.1. Mechanism of Action for Oral Anti-Obesity Medications (AOMs)
Oral anti-obesity medications influence multi-level responses in glucose-lipid metabolism by regulating appetite signaling pathways, gastric emptying rates, and insulin-glucagon balance. Core mechanisms involve GLP-1 receptor activation leading to appetite suppression, enhanced fatty acid oxidation pathways, and incretin-dependent hypoglycemic effects. Within multimodal sensor data, the 5-minute continuous fluctuations of optical glucose, the autonomic regulation intensity reflected by HRV low-frequency power, the sympathetic arousal level indicated by EDA conductance rate changes, and the dynamic distribution of energy expenditure across different activity segments collectively form the metabolic response curve following AOM stimulation. The mechanism of action must be mapped within the model as learnable temporal conditions, enabling the linkage between drug effects and individual behavioral-physiological phenotypes, thereby providing conditional input constraints for subsequent predictive structures [8].
4.2. Construction and Optimization of the TFT–Mixture Model
The TFT–Mixture model utilizes multimodal behavior–metabolism synergistic tensors as conditional inputs to construct a predictive architecture capable of simultaneously capturing long-term trends and short-term perturbations [9]. The overall framework comprises a temporal encoding layer, an interpretable variable selector, an attention gating structure, and a mixture density output terminal. ① The temporal encoding component incorporates multi-scale convolutions and periodic coding to compress 5-minute optical glycemic fluctuation sequences, HRV high-frequency power, EDA phase-rate variability, and energy expenditure segments into a unified latent space. ② The variable selector dynamically adjusts modal weights based on channel importance matrices to generate conditional latent states. ③ The mixture density output terminal characterizes individual drug response distributions through the core formulation:
where represents the predicted value for body weight or blood glucose change at step ; denotes the weight of the th hybrid component; and denote the mean and variance, respectively, characterizing individual variability in peripheral metabolic pathways. The final prediction is completed by a gated attention layer:
wheredenotes the temporal correlation extraction function,represents the conditional dependency mapping, andperforms Hadamard multiplication. The prediction-actual pairing error structure between model outputs and ground truth sequences is visualized in Figure 3 for subsequent optimization.
4.3. Model Evaluation and Performance Analysis
Model evaluation employed a comprehensive multi-metric fusion strategy. Beyond R2, MAE, and RMSE for numeric error quantification, and NLL for distribution confidence intervals, the analysis further introduced permutation feature importance (PFI), area under the precision-recall curve (AUPRC) to handle imbalance sensitivity, and PCA for latent variance explanation. SHAP values were bootstrapped to assess statistical confidence. These additions ensure more rigorous validation across prediction metrics and enhance model interpretability and credibility of TFT–Mixture in predicting weight changes and blood glucose trends. Input tensors are uniformly standardized to dimensions [ , T=48, M=5, D=24], where each sample corresponds to a 24-hour × 5-modality × 24-dimensional feature combination. The output is a continuous prediction sequence . The evaluation framework includes the coefficient of determination , mean absolute error (MAE), and root mean square error (RMSE) to measure point value prediction bias. Negative log-likelihood (NLL) assesses the reasonableness of the confidence interval for the model’s distribution output. Additionally, the misclassification rate (MCR) captures the proportion of misjudgments between AOMs responders and non-responders. The evaluation process incorporates 5-fold cross-validation and time-sliding window validation with a window width of 12 steps and 3-step intervals, ensuring compatibility with both short-term fluctuations and long-term trends. This framework provides a comprehensive basis for assessing model generalization capability and the stability of individual behavior–metabolic response predictions[10] .
5. Experimental Results and Analysis
5.1. Experimental Design
The experimental design centered on the TFT–Mixture personalized prediction model, constructing input tensors from continuously collected multimodal sensor sequences. The cohort was expanded to include individuals aged 18–70 years from diverse ethnic, gender, and BMI categories to improve demographic representativeness and ensure robustness of model outputs across heterogeneous populations. Behavioral–metabolic synergy features were uniformly encoded as a tensor input with dimensions [T=48, M=5, D=24]. Target outputs comprised weight change sequences within 12 steps and average blood glucose change rates. All samples were grouped by individual, with 70% allocated for training, 15% for validation, and 15% for testing. Training employed the Adam optimizer with an initial learning rate of 1e-4, batch size of 32, and a maximum of 100 training epochs. Early stopping was dynamically monitored based on validation set MAE metrics, supporting sliding window reconstruction and parallel multi-objective regression outputs. This experimental structure provides systematic support for evaluating model generalization and response prediction capabilities.
5.2. Model Performance Evaluation
Model performance evaluation employs a multi-metric parallel output system, addressing two tasks: short-term weight change trends and blood glucose improvement rates. The TFT–Mixture model achieved R2 = 0.83, MAE = 0.41 kg, and RMSE = 0.58 kg for weight sequence prediction on the test set, along with R2 = 0.79 and MAE = 0.18 mmol/L for blood glucose trend prediction. Both metrics outperformed the GRU and Transformer baseline models. In distribution modeling evaluation, the NLL mean was 1.43 with a 95% confidence prediction interval coverage of 91.2%, indicating the model effectively captures individual variations in metabolic response distributions. Error rate analysis revealed that the MCR value was controlled at 6.8% in predicting AOMs intervention response stratification, reflecting the hybrid density output structure’s adaptability to modeling response nonlinearity. Overall, the evaluation structure supports its robustness validation in multimodal behavior-metabolism coupling prediction scenarios.
5.3. Metabolic Response and Drug Response Prediction Analysis
To further elucidate the structural influence of metabolic features on drug response prediction, an integrated evaluation panel was constructed to jointly present the coupling characteristics among model prediction bias distribution, drug-type-specific response variations, and actual trend changes. As shown in Figure 4, the paired scatter plot on the left displays the correspondence between predicted and actual values for TFT–Mixture in the body weight prediction task. The central region overlays the error distribution densities for Orlistat and Semaglutide, with colors distinguishing their systematic bias patterns: Orlistat exhibits persistent underestimation in high-CV individuals, while Semaglutide shows overestimation bias in populations with disrupted sleep architecture. The right-hand bias trend plot reveals distinct separation in the error distribution patterns between drug types, with an error band overlap rate below 35%. This mapping reflects the nonlinear contribution structure of behavioral-metabolic synergistic variables in predicting individual drug response, supporting subsequent SHAP interpretation models for refined feature importance modeling.
5.4. Impact of Lifestyle Characteristics on Drug Efficacy
The contribution structure of lifestyle variables in drug response prediction models was further quantified through the SHAP framework. Key influencing dimensions centered on evening step count, sleep duration, and nocturnal EDA variability, with feature inputs derived from 24-week continuous behavioral sequences captured by wearable sensors. Table 1 lists the contribution values of key behavioral features to the magnitude of AOMs metabolic improvement.
In the predictive model with R2=0.83, nighttime step count exhibits an average SHAP weight of 0.19, sleep duration contributes 0.14, and the decline in nighttime HRV corresponds to a weight of 0.11. Analysis of response variations across behavioral groups reveals that Semaglutide’s predicted improvement is markedly constrained in individuals with fewer than 4,200 steps per night. Among those with sleep duration below 6.2 hours, Orlistat response exhibits persistent attenuation. This indicates that the behavioral-sleep-metabolic triadic coupling structure determines the direction of drug efficacy deviation, generating quantifiable inter-individual differences at the model distribution level.
6. Conclusion
The dynamic assessment framework for glucose-lipid metabolism, constructed based on multimodal continuous monitoring, achieves high-dimensional characterization of individualized drug responses and reconstructs predictive pathways, overcoming the limitations of traditional unimodal observation in temporal dynamics and behavioral association modeling. By integrating TFT–Mixture structures with collaborative feature tensor construction, the model simultaneously accounts for dynamic metabolic trends and nonlinear behavioral-phenotype coupling, significantly enhancing fitting accuracy and generalization for AOMs treatment responses. The proposed multi-source data fusion strategy and SHAP-driven feature interpretation mechanism provide data support and interpretability assurance for precision drug recommendations. However, existing models remain reliant on high-frequency continuous sensing inputs, which poses practical limitations for deployment in resource-constrained environments. For populations with limited access to wearable technology, such as elderly individuals in rural areas or patients in low-income regions, the feasibility of long-term high-resolution monitoring is reduced. Future research should explore alternative lightweight surrogate input strategies, such as periodically sampled self-reports, clinical test results, or smartphone-based behavioral logging, to enhance model applicability without compromising predictive accuracy.Future work should explore lightweight model architectures compatible with dimensionality reduction encoding and edge deployment. In addition, clinical application pathways should be explicitly designed, enabling medical professionals to integrate these predictive models into electronic health records (EHRs) or clinical decision support systems (CDSS). By embedding the TFT–Mixture model within clinical workflows, practitioners can receive real-time risk stratification based on patient behavioral patterns, allowing for proactive intervention scheduling and medication adjustments tailored to individual metabolic dynamics. Concurrently, integrating individual genetic backgrounds and pharmacokinetic characteristics will further enhance the predictive system’s capacity to support long-term efficacy evaluation and dynamic intervention optimization.
References
- Karunarathna, T.S.; Liang, Z. Development of Non-Invasive Continuous Glucose Prediction Models Using Multi-Modal Wearable Sensors in Free-Living Conditions[J]. Sensors 2025, 25(10), 3207. [Google Scholar] [CrossRef] [PubMed]
- Liu, Y.; Li, J.; Xiao, S.; et al. Revolutionizing precision medicine: Exploring wearable sensors for therapeutic drug monitoring and personalized therapy[J]. Biosensors 2023, 13(7), 726. [Google Scholar] [CrossRef] [PubMed]
- Singh, S.B.; Singh, A. Leveraging Deep Learning and Multi-Modal Data for Early Prediction and Personalized Management of Type 2 Diabetes[J]. International Journal For Multidisciplinary Research 2024, 6(4), 1–9. [Google Scholar]
- Mahato, K.; Saha, T.; Ding, S.; et al. Hybrid multimodal wearable sensors for comprehensive health monitoring[J]. Nature Electronics 2024, 7(9), 735–750. [Google Scholar] [CrossRef]
- Lin, R.; Huang, Z.; Liu, Y.; et al. Analysis of Personalized Cardiovascular Drug Therapy: From Monitoring Technologies to Data Integration and Future Perspectives[J]. Biosensors 2025, 15(3), 191. [Google Scholar] [CrossRef] [PubMed]
- Parvin, N.; Joo, S.W.; Jung, J.H.; et al. Multimodal AI in Biomedicine: Pioneering the Future of Biomaterials, Diagnostics, and Personalized Healthcare[J]. Nanomaterials 2025, 15(12), 895. [Google Scholar] [CrossRef] [PubMed]
- Huang, X.; Schmelter, F.; Seitzer, C.; et al. Digital biomarkers for interstitial glucose prediction in healthy individuals using wearables and machine learning[J]. Scientific Reports 2025, 15(1), 30164. [Google Scholar] [CrossRef] [PubMed]
- Min, J.; Tu, J.; Xu, C.; et al. Skin-interfaced wearable sweat sensors for precision medicine[J]. Chemical reviews 2023, 123(8), 5049–5138. [Google Scholar] [CrossRef] [PubMed]
- Liu, X.; Xu, M.; Wang, H.; et al. Integrating Precision Medicine and Digital Health in Personalized Weight Management: The Central Role of Nutrition[J]. Nutrients 2025, 17(16), 2695. [Google Scholar] [CrossRef] [PubMed]
- Zheng, X.; Dwyer, V.M.; Barrett, L.A.; Derakhshani, M.; Hu, S. Rapid vital sign extraction for real-time opto-physiological monitoring at varying physical activity intensity levels. IEEE Journal of Biomedical and Health Informatics 2023, 27(7), 3107–3118. [Google Scholar] [CrossRef] [PubMed]
Figure 1.
Multimodal Wearable Sensor Data Acquisition and Transmission Architecture.
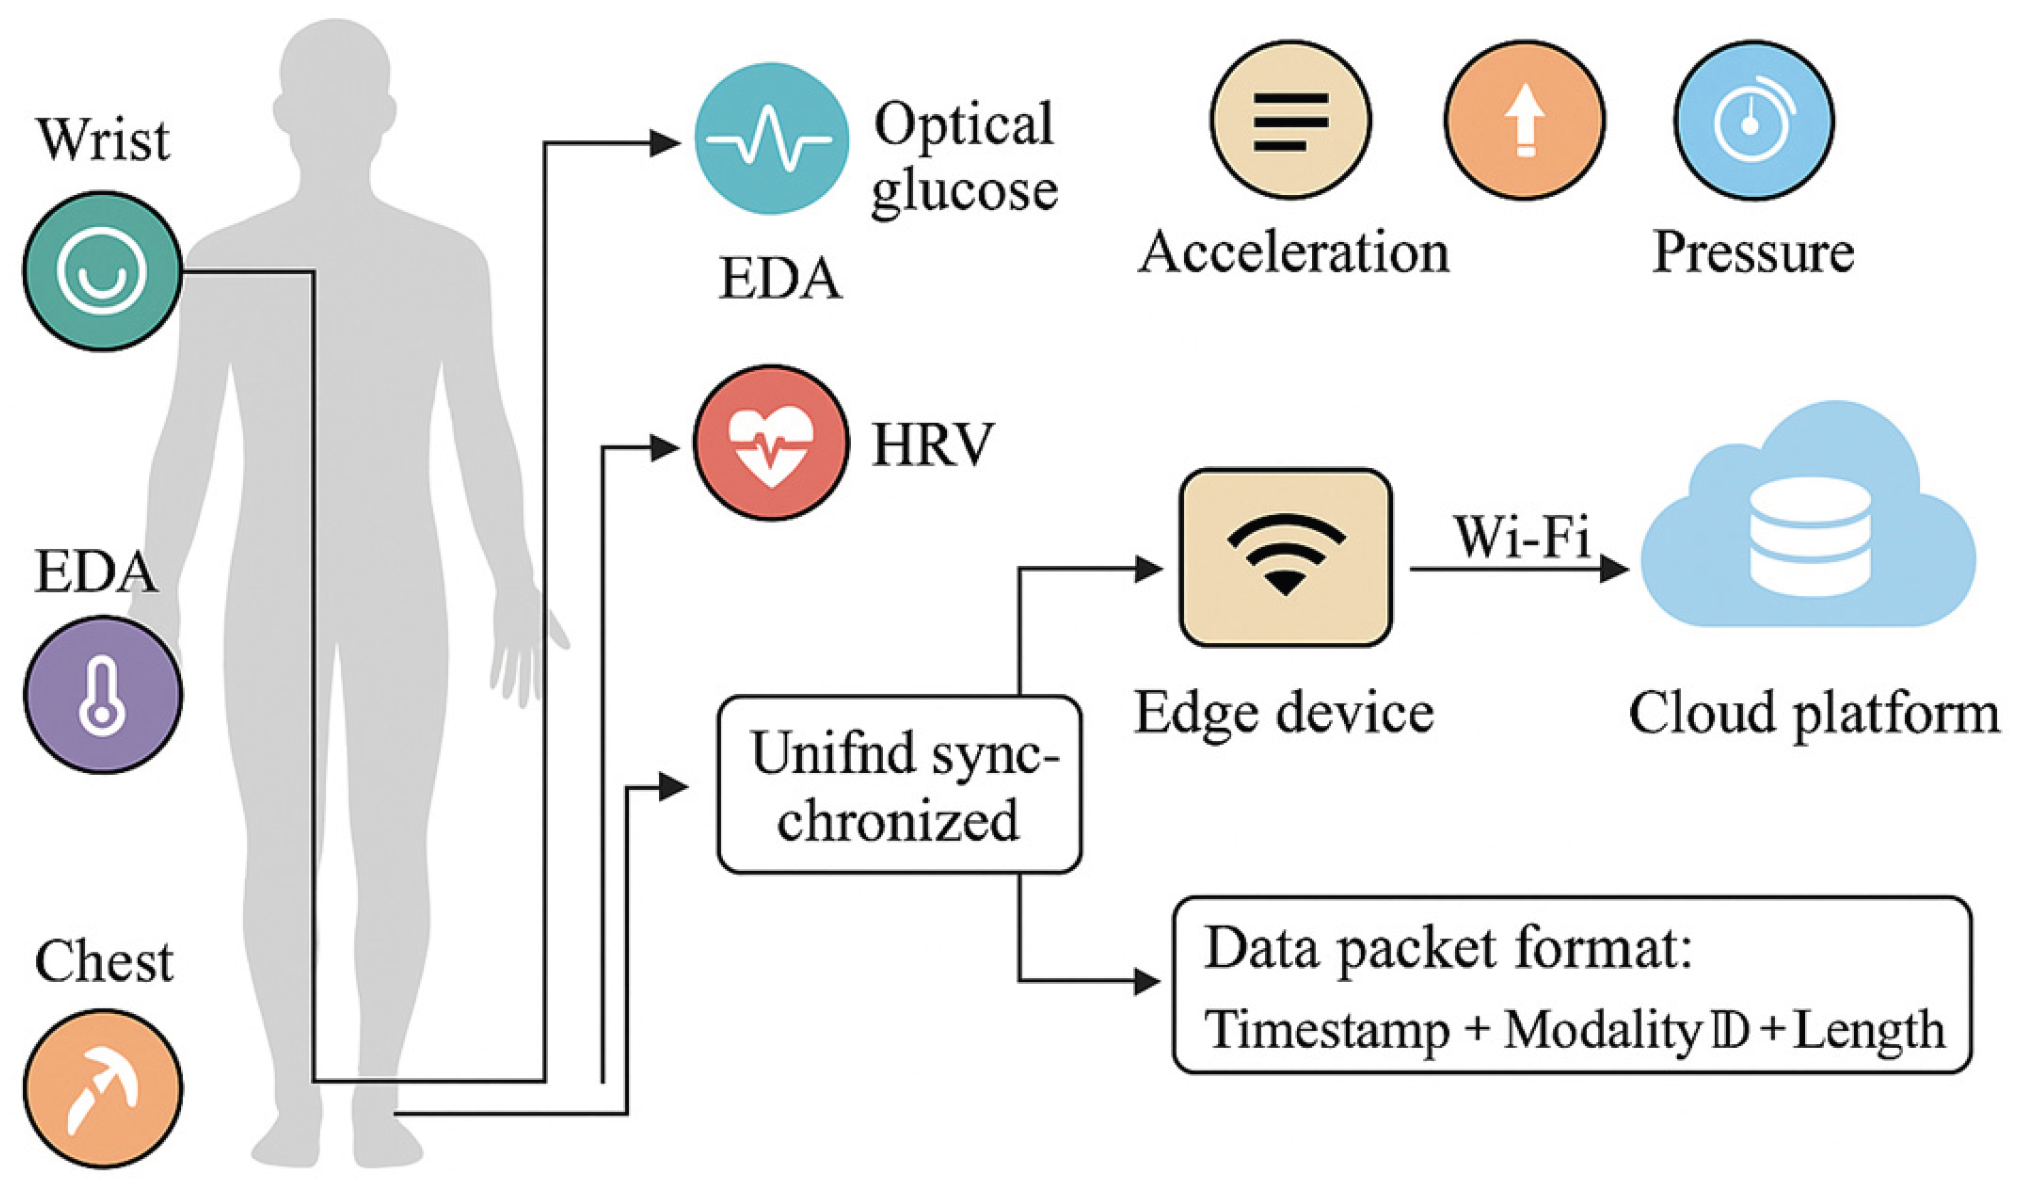
Figure 2.
Multimodal Sensor Module Diagram.
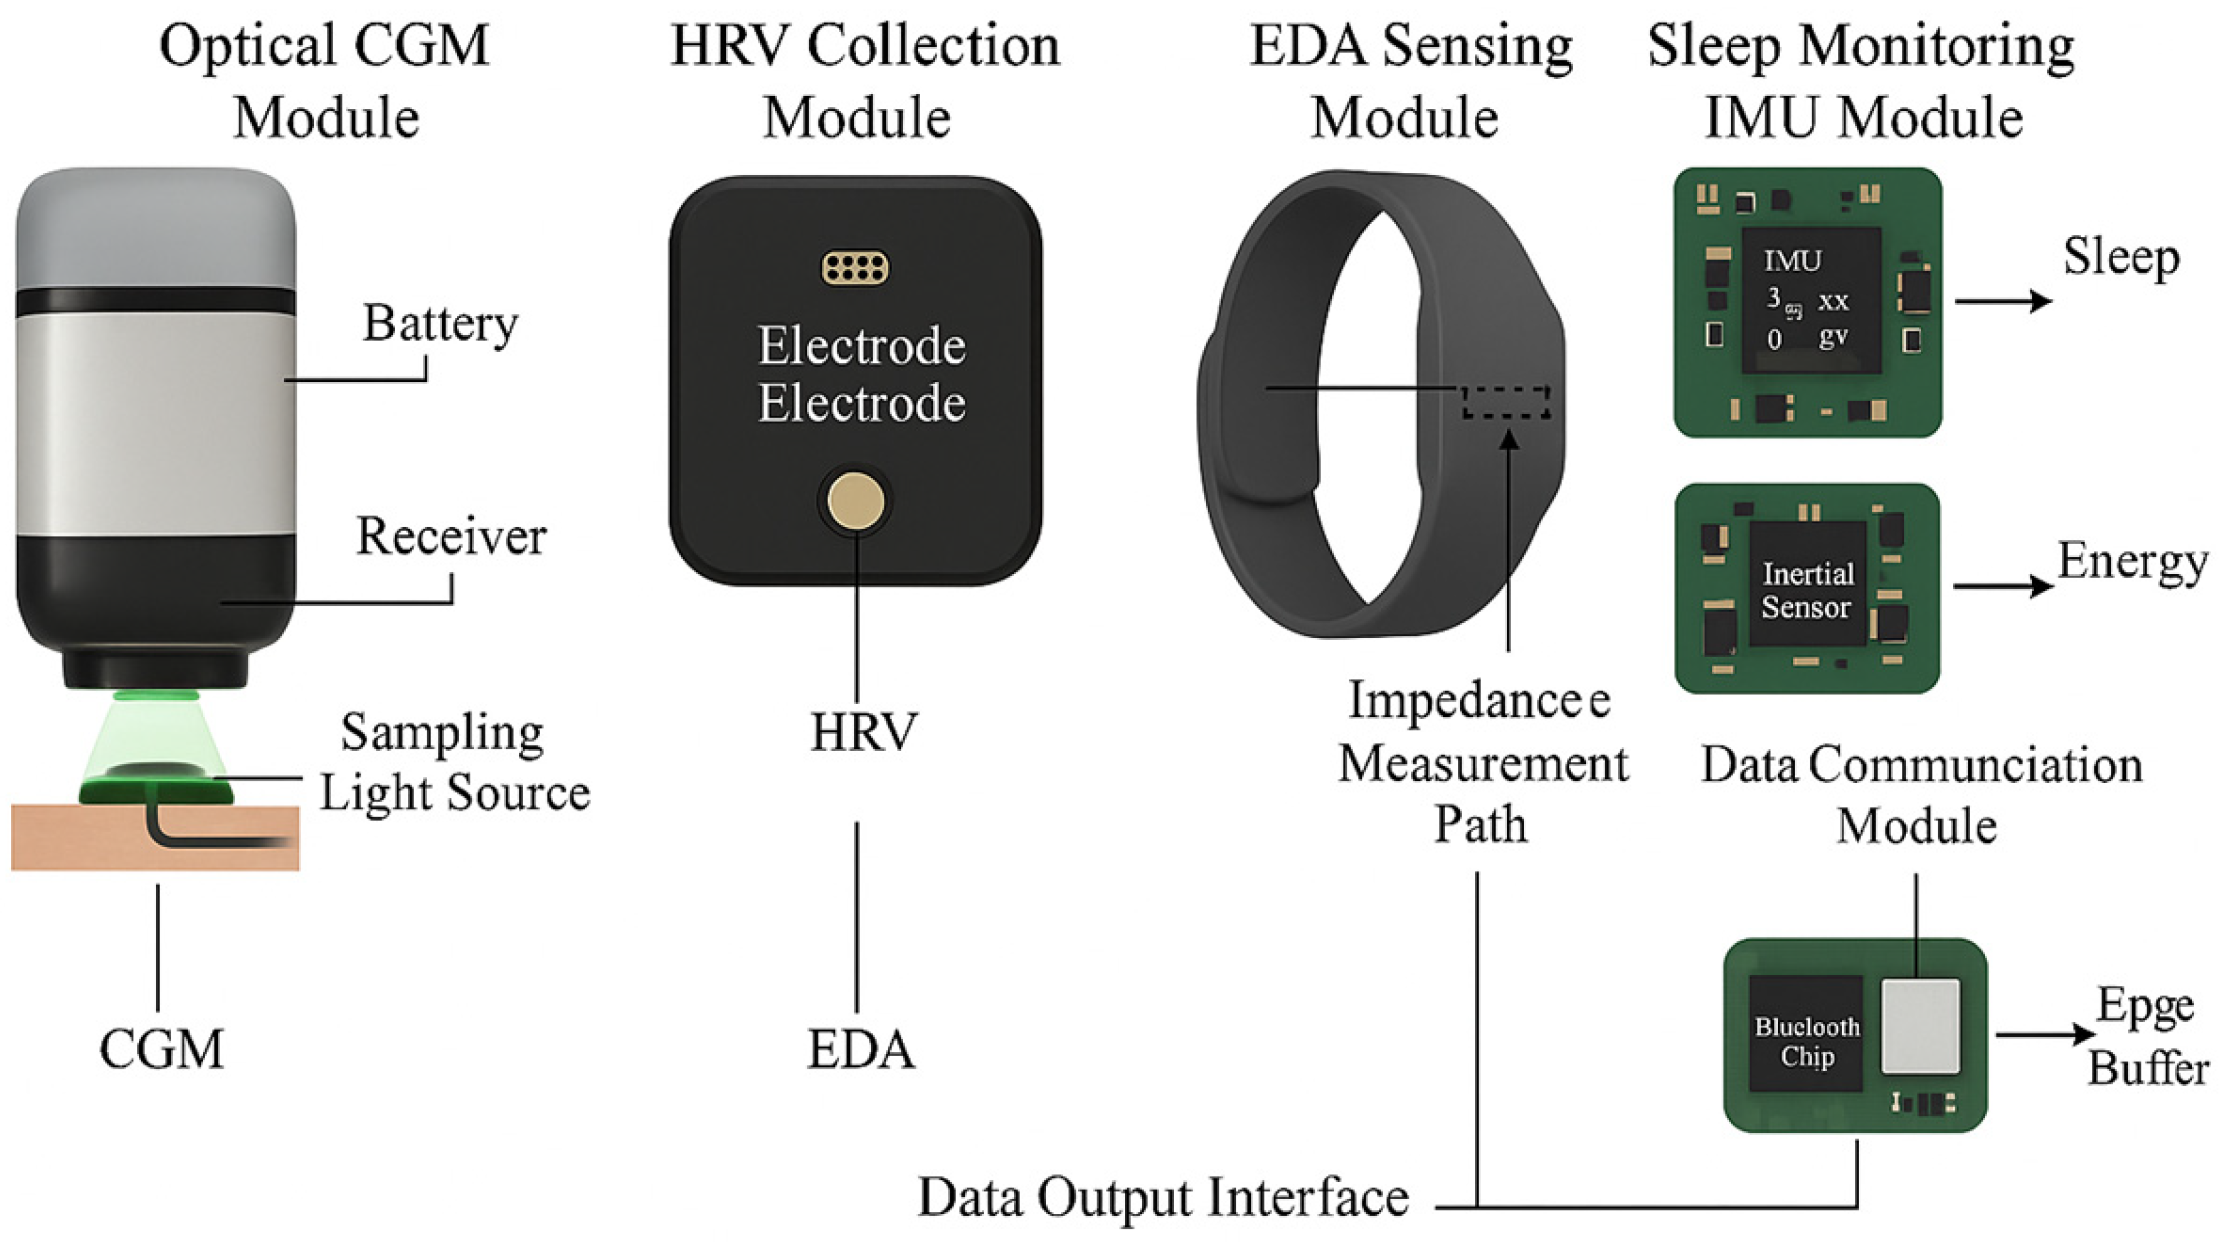
Figure 3.
Overlay of predicted-actual pairing error.
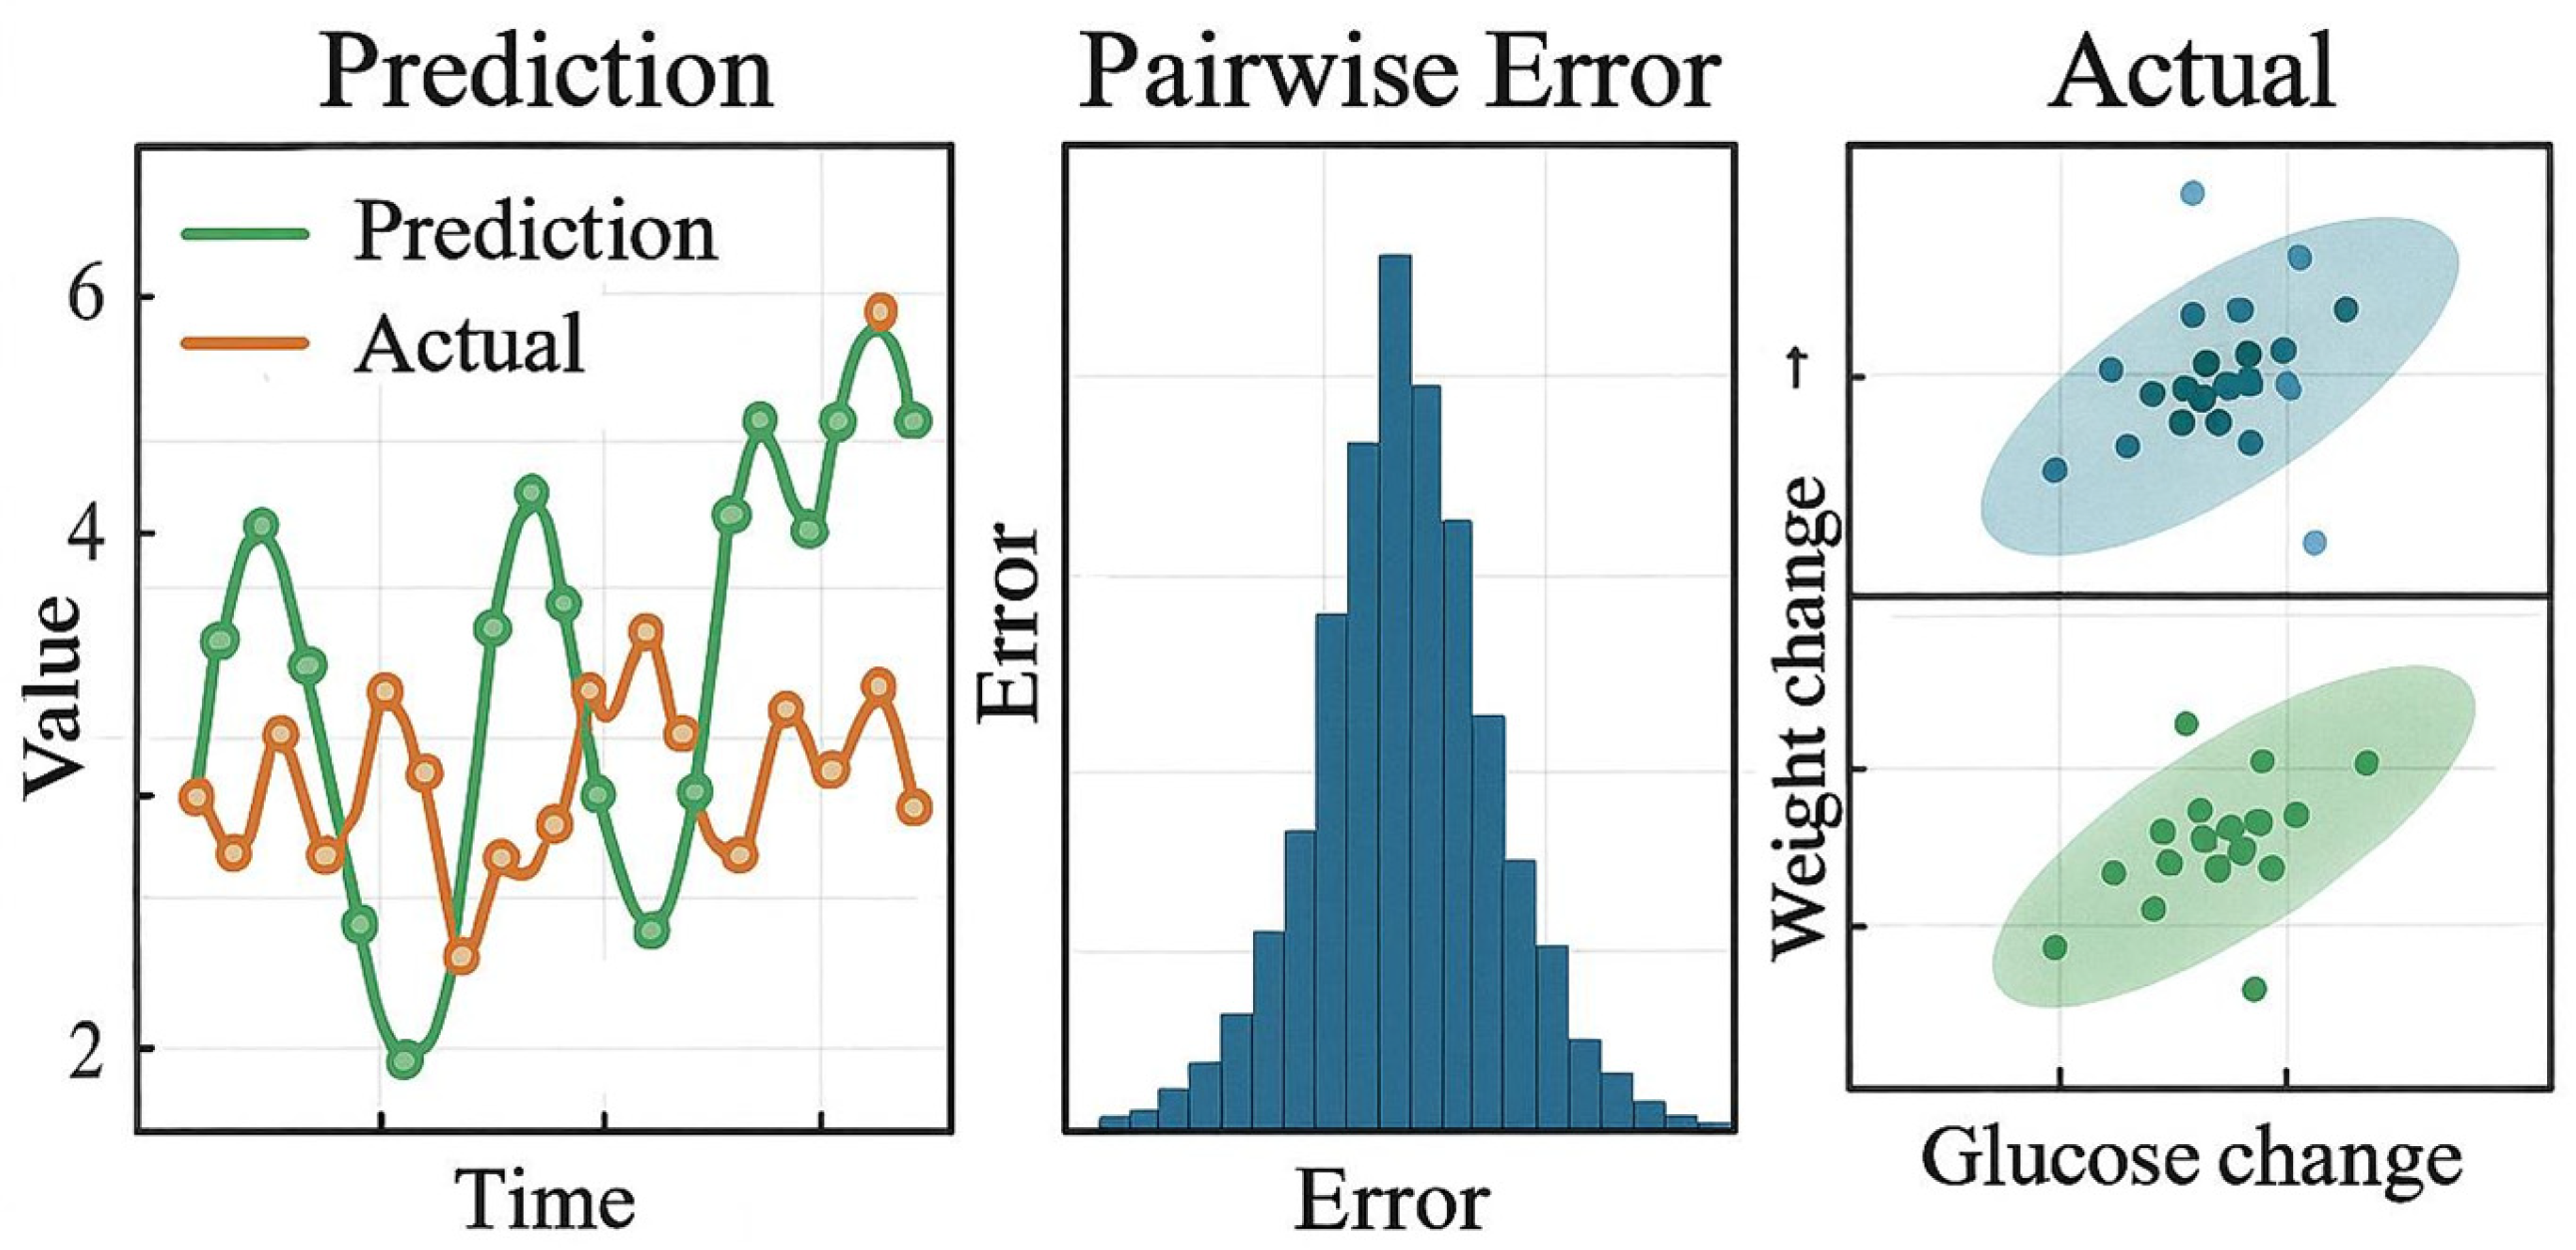
Figure 4.
Combined Metabolic Response Prediction and Distribution Variability Plot.
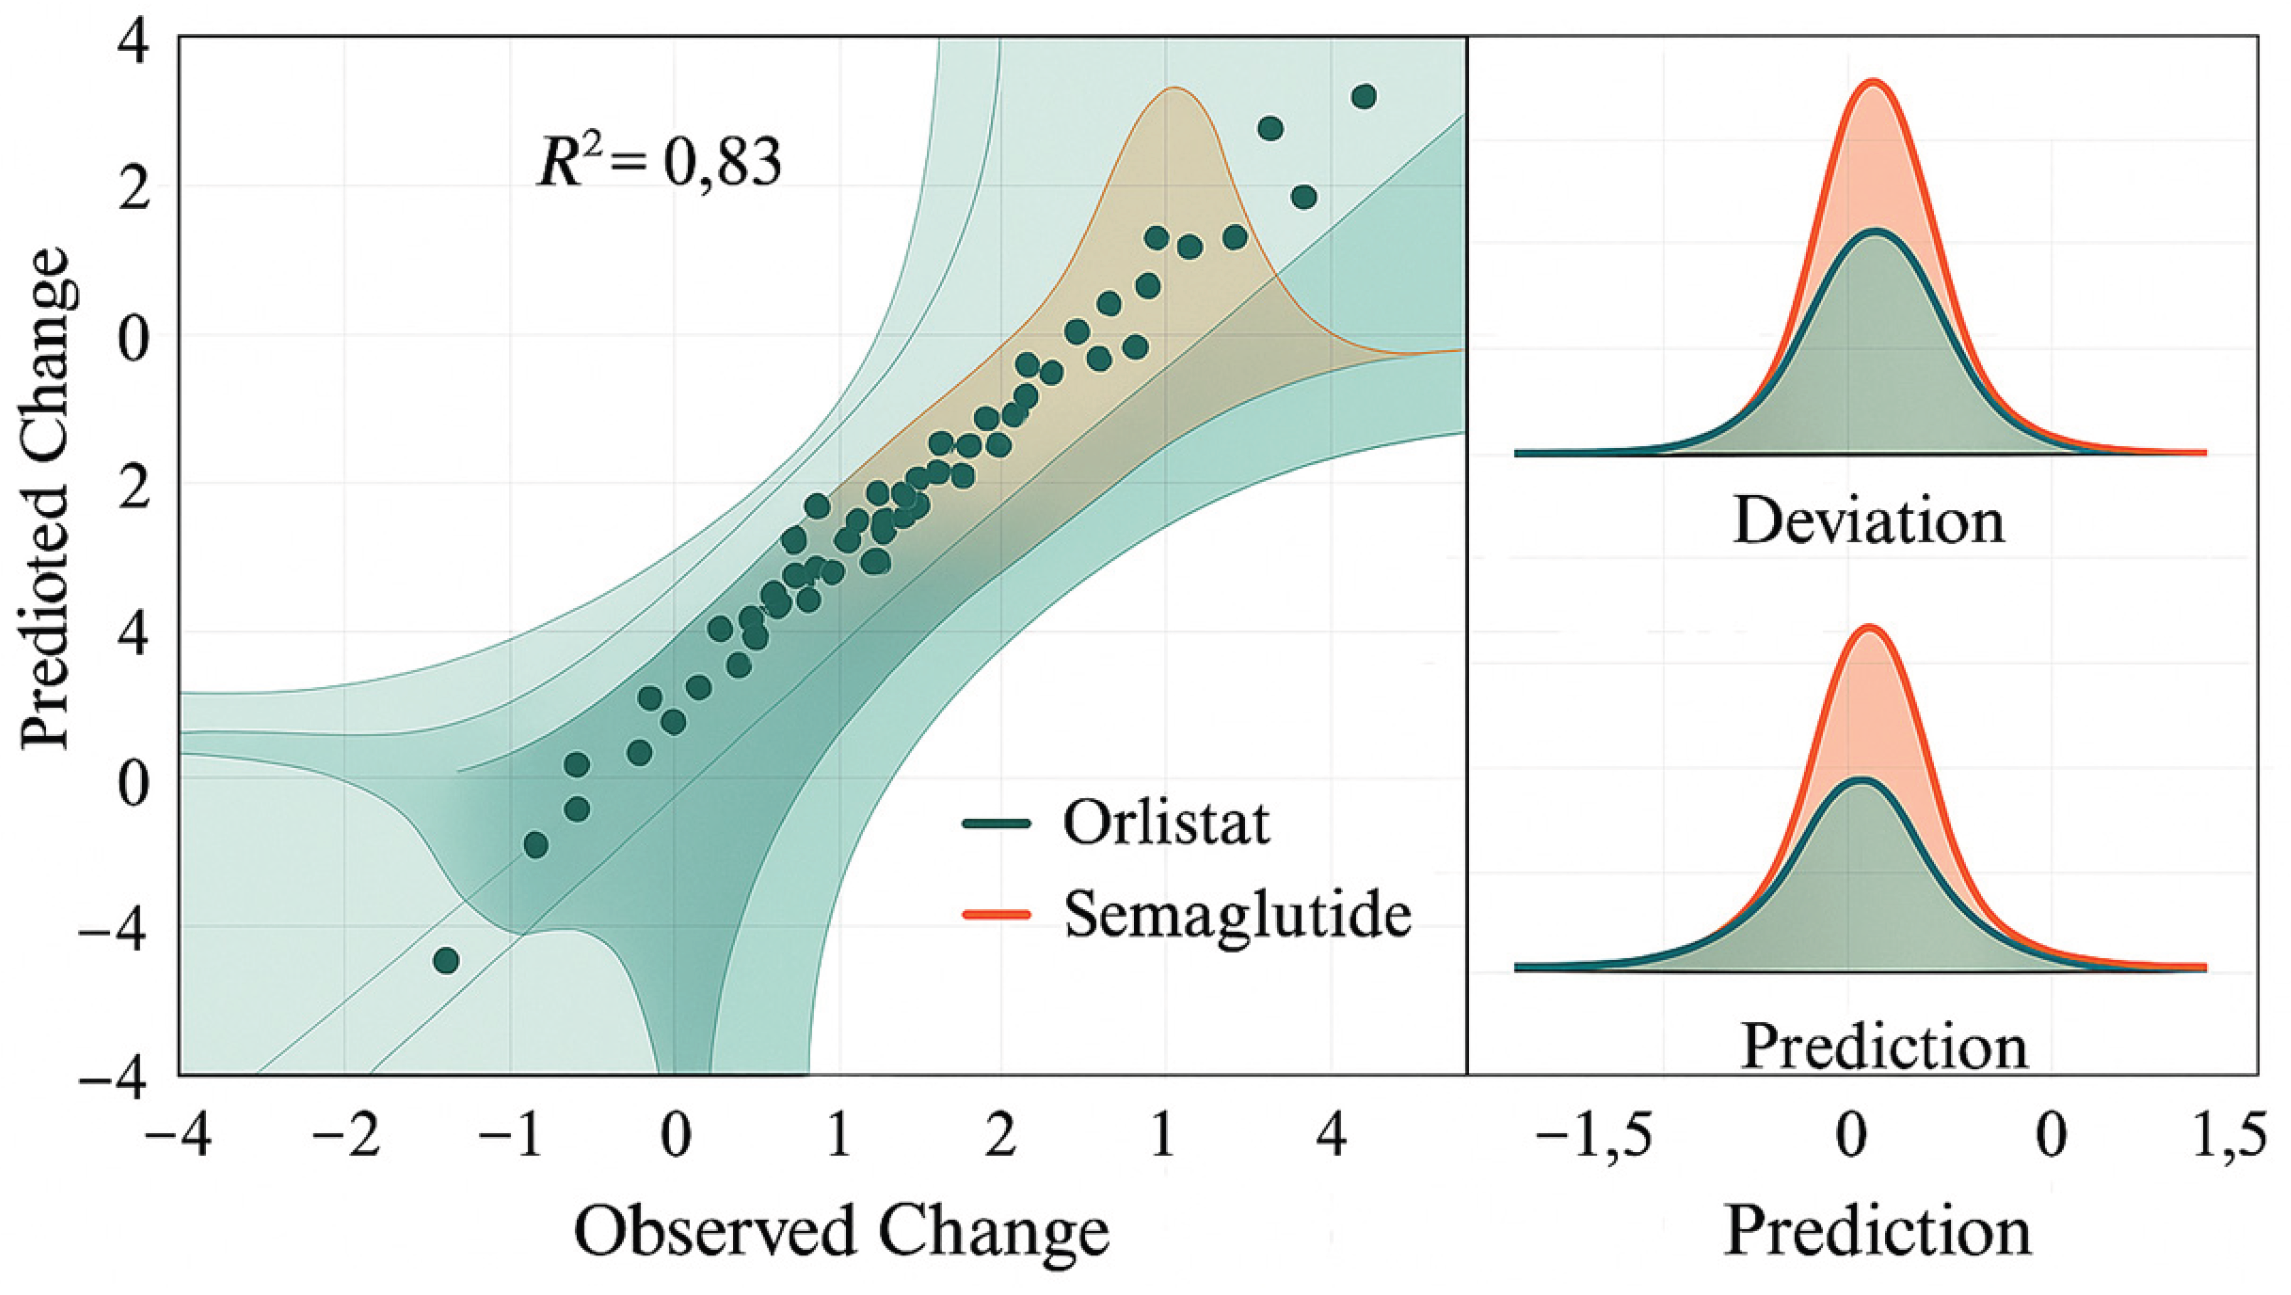

Table 1.
Contribution of Lifestyle Features to AOMs Efficacy.
| Feature Item (Lifestyle Feature) | Average SHAP Contribution Value | Direction of Metabolic Improvement | Associated Phenomenon (Based on 380 Cases) |
| Steps at Night | 0.19 | Positive correlation | <4200 steps/night shows diminished efficacy |
| Sleep Duration | 0.14 | Positive correlation | Improvement rate decreases below 6.2 hours |
| Nighttime HRV Decrease | 0.11 | Negative correlation | Prediction bias increases when HRV is unstable |
Disclaimer/Publisher’s Note: The statements, opinions and data contained in all publications are solely those of the individual author(s) and contributor(s) and not of MDPI and/or the editor(s). MDPI and/or the editor(s) disclaim responsibility for any injury to people or property resulting from any ideas, methods, instructions or products referred to in the content. |
© 2026 by the authors. Licensee MDPI, Basel, Switzerland. This article is an open access article distributed under the terms and conditions of the Creative Commons Attribution (CC BY) license (http://creativecommons.org/licenses/by/4.0/).
Copyright: This open access article is published under a Creative Commons CC BY 4.0 license, which permit the free download, distribution, and reuse, provided that the author and preprint are cited in any reuse.


