Submitted:
16 January 2026
Posted:
19 January 2026
You are already at the latest version
Abstract
Motorsport’s upcoming 2027 technical constraints reduce the role of active mechanical stabilizers and shift a larger share of vehicle-dynamics understanding to real-time perception and software. This paper introduces Agentic Visual Telemetry, a hybrid Retrieval-Augmented Generation (RAG) and Cache-Augmented Generation (CAG) framework designed to diagnose high-frequency dynamic regimes from onboard video under millisecond-level latency and edge-hardware limits. The approach combines (i) spatiotemporal gating to detect novelty and uncertainty, (ii) cache-first inference to reuse stable visual priors at O(1) cost, and (iii) safety-aware supervision with fail-silent operation and a safe-mode degradation strategy when thermal or compute margins shrink. We validate the framework on the Aspar-Synth-10K dataset, focusing on safety-critical phenomena such as suspension chatter. Retrieval grounding yields large gains over a memoryless baseline, improving Macro-F1 from 0.62 (B0) to 0.88 (B5), while maintaining real-time feasibility; a RAG-only oracle provides slightly higher PR-AUC but violates the latency envelope. Full precision–recall curves show that the proposed hybrid model preserves performance in the high-recall operating region for chatter detection, reducing false negatives consistent with the grounding hypothesis. Overall, the results demonstrate that high-fidelity video interpretation can be achieved within strict real-time constraints through cache-first, retrieval-grounded agentic perception, enabling robust visual telemetry for next-generation motorsport analytics.
Keywords:
real-time computer vision
; visual anomaly detection
; latency-aware video analytics
; hybrid retrieval and caching
; telemetry–vision fusion
; edge AI
; uncertainty estimation
; motorsport imaging
1. Introduction
Premier-class motorcycle racing is poised for a transformative shift following the publication of the MotoGP 2027 technical package. This new regulatory framework aims to reduce cornering speeds and redefine the sport’s performance envelope through three primary pillars: (i) a reduction in engine displacement to 850 cc with a 75 mm maximum bore; (ii) a significant restriction of aerodynamic appendages; and (iii) the prohibition of all mechanical ride-height and holeshot devices. These constraints, explicitly detailed in the official Grand Prix Commission decisions and technical summaries123, fundamentally redefine how load transfer and chassis attitude are managed on-track.
From an engineering standpoint, the key discontinuity is not only the engine capacity reduction (Figure 1) but the loss of mechanical ride-height actuation that previously helped teams tune squat/pitch control during launch and acceleration phases. With reduced aero load and restricted mechanical actuation, motorcycles are expected to become more sensitive to oscillatory stability phenomena (e.g., headshake, braking-induced vibration modes, and chassis/suspension coupling). The dynamics of these high-performance instabilities have been studied in depth in the racing context, notably under the umbrella of chatter and related self-excited vibration modes [1,2,3,4].
The same regulatory package implies a shift in on-track strategy4. With reduced acceleration headroom and altered aerodynamic support, riders are expected to prioritize maintaining momentum and corner speed rather than relying on stop-and-go exits. Figure 2 provides a schematic view of this transition, which matters computationally because it changes visual reference points (braking markers, apex approach textures, exit trajectories) that can be exploited as static context by caching mechanisms.
Critically, the prohibition of mechanical ride-height devices removes one of the practical “knobs” teams used to shape attitude transitions during launch and acceleration. In racing motorcycles, attitude transitions and vibration modes are tightly coupled; classical studies describe how racing chatter emerges from interactions between tire dynamics, suspension compliance, and chassis modes, often producing observable high-frequency oscillations in the front assembly [1,2]. Figure 3 is therefore presented as a motivation schematic: it does not claim official pitch numbers, but it visualizes why small degradations in damping or tire state can become operationally critical under the 2027 constraints.
These dynamics motivate visual monitoring. Standard telemetry channels (IMU, suspension travel, wheel speeds) are invaluable but cannot directly observe contact-patch surface state, tire-sidewall texture evolution, or subtle bodywork/suspension oscillations visible in high-resolution video. Multimodal learning surveys and telemetry-driven motorsport case studies support the view that fusing heterogeneous channels is often necessary to disambiguate aggressive maneuvers from failure precursors [5,6]. Moreover, recent vision-based defect/anomaly detection methods show that CNN features can capture fine-grained texture signatures that may precede macroscopic failures [7,8]. The specific visual anomaly categories targeted in this work are illustrated in Figure 4.
The remaining barrier is latency. At 300 km/h ( m/s), a 100 ms end-to-end perception delay implies an 8.3 m “blind distance”. Even if video is processed locally, real deployments must satisfy tight power and determinism budgets typical of edge inference [9,10]. Furthermore, retrieval-based context injection (standard RAG) introduces additional non-deterministic overhead due to vector search, re-ranking, and cross-modal grounding [11]. Figure 5 summarizes the operational latency budget that motivates the hybrid design.
To address this, we propose an agentic visual perception framework (conceptually outlined in Figure 6) that orchestrates two memory paths: a cache for static circuit context and a retrieval channel for rare, uncertainty-triggered anomaly grounding. The agent is implemented using a ReAct (Reason+Act) control loop [12], while fine-grained texture extraction is performed with UNet++ (nested skip connections) to preserve high-frequency cues [13]. The cache exploits track-level spatiotemporal redundancy (i.e., recurrent backgrounds and landmarks), closely related to place-recognition principles in long image sequences [14]. Vector search components follow best practices for efficient similarity retrieval (e.g., FAISS-based indexing) [10]. Importantly, the agent’s gating policy is driven by uncertainty signals; we avoid naïvely equating softmax entropy with epistemic uncertainty by drawing on modern uncertainty estimation literature [15,16].
1.1. Contributions and Paper Organization
This paper makes the following contributions:
2. Related Work
This section positions our contribution at the intersection of (i) high-speed visual perception under hard latency constraints, (ii) active perception and agentic decision loops for conditional computation, and (iii) memory-augmented inference that exploits the spatiotemporal redundancy of closed-circuit motorsport. To address the fine-grained anomaly categories illustrated in Figure 4, standard detection is often insufficient. Figure 7 summarizes the main paradigms and highlights the gap addressed by this paper.
2.1. High-Speed Vision Under Hard Latency Constraints
High-speed motorsport perception differs from conventional autonomous driving due to extreme ego-motion, vibration, motion blur, and rolling-shutter distortions. In robotics, the effect of perception latency on safe speed has been formalized and empirically shown to be a fundamental limiting factor in high-speed navigation [19]. This motivates explicit budgeting of end-to-end perception delay T, since safe stopping/avoid margins deteriorate as latency increases.
From a sensing perspective, event cameras mitigate motion blur and provide microsecond-level temporal resolution, and have been widely surveyed as a pathway to high-speed visual perception [20]. For frame cameras, rolling-shutter distortion can be non-negligible under aggressive motion; learning-based correction has been proposed (e.g., shutter unrolling networks) [21], and rolling-shutter modeling/learning has been surveyed more broadly [22]. These works collectively highlight that (i) high-speed imaging is a systems problem (sensor + compute + latency), and (ii) robustness to motion artifacts must be considered when designing real-time pipelines.
Motorsport and autonomous racing platforms further emphasize strict real-time constraints. The F1TENTH evaluation environment provides an open benchmark ecosystem for high-speed closed-circuit experimentation [23], and recent surveys summarize emerging autonomous racing stacks and constraints [24]. While these platforms often focus on planning/control, they reinforce the requirement that perception must be both fast and reliable in closed-loop operation.
2.2. From Passive to Active Perception: Sequential Decision Formulations
The concept of active perception frames perception as a closed-loop process where sensing and computation are selected to reduce uncertainty and maximize task reward [25,26]. A standard abstraction is a partially observable Markov decision process (POMDP) [27]:
where a policy acts on a belief state . In motorsport imaging, we can interpret not only as a physical control but also as a computational action (e.g., whether to escalate analysis, retrieve memory, or remain on a fast path). This is aligned with the broader trend of treating perception as a resource-aware decision process rather than a fixed feed-forward mapping.
2.3. Agentic Decision Loops and Conditional Computation
Recent agentic paradigms operationalize sequential reasoning and tool use. ReAct interleaves reasoning traces and actions to decide what to do next (e.g., query, verify, refine), enabling conditional computation as a first-class design principle [12]. This philosophy parallels earlier work in dynamic neural networks, where inference depth/structure is adapted per input to trade compute for accuracy [28].
A reviewer-sensitive point in high-speed systems is deterministic adherence to a latency budget B. Conditional computation can be formalized via gating indicating whether a deep path is invoked. If and denote the costs of the fast and deep paths,
Dynamic early-exit architectures (e.g., BranchyNet) [29] and layer-skipping methods (e.g., SkipNet) [30] provide concrete mechanisms to reduce expected inference time. However, these approaches alone do not address external memory access costs, which become dominant in retrieval-augmented systems.
2.4. Uncertainty and Calibration as Triggers for Escalation
A persistent pitfall is that softmax confidence can be poorly calibrated, especially in modern deep networks [31]. Selective prediction introduces a principled reject option, optimizing the risk–coverage trade-off. In real-time motorsport perception, this suggests a two-tier strategy: maintain high coverage with a minimal path, while escalating only when uncertainty is high.
Given a predictive distribution over classes , predictive entropy is
A gating policy can then be expressed as , where is calibrated to satisfy Equation (2). This uncertainty-triggered escalation is widely used in selective/dynamic inference, but its integration with hybrid memory for closed-circuit redundancy remains underexplored.
2.5. Exploiting Spatiotemporal Redundancy in Video Analytics
Closed-circuit racing exhibits strong spatiotemporal redundancy: background geometry and many landmarks remain quasi-stationary across laps. Systems research on video analytics exploited this using specialized models and cascades. NoScope showed large savings by specializing to a fixed video distribution and using lightweight triggers (e.g., frame differences) to avoid expensive inference on redundant frames [32]. Translating this to motorsport suggests that most frames should be handled by a fast, cached path, reserving deep analysis for rare novelty conditions.
A complementary novelty signal uses embedding drift. Let be a low-cost embedding; then
provides a fast scene-change indicator that can catch abrupt transitions even when a classifier is overconfident.
2.6. Memory-Augmented Inference: Retrieval vs. Cache
Retrieval-Augmented Generation (RAG) couples parametric models with non-parametric memory accessed at inference time [11]. The dominant cost in real-time settings is approximate nearest-neighbor (ANN) search in high-dimensional spaces. GPU-accelerated similarity search is commonly implemented with FAISS [33], while graph-based indices such as HNSW provide strong empirical performance with sublinear expected query behavior [34].
Terminology alignment (vision-first).
Although the acronyms RAG and CAG are widely used in the context of language models, in this paper we adopt them as system-level memory augmentation patterns for real-time visual inference, not as text generation mechanisms. Concretely, we use Retrieval-Augmented Inference (RAG) to denote the on-demand retrieval of external visual/telemetry exemplars (embeddings, segments, and anomaly prototypes) that ground the current prediction in historically observed evidence, following the broader retrieval-augmented paradigm [11]. In contrast, we use Cache-Augmented Inference (CAG) to denote a preloaded, low-latency context store containing invariant circuit priors (geometry, landmarks, sector signatures) whose access is effectively constant-time at runtime [35]. This vision-first interpretation is consistent with the recent extension of retrieval augmentation to multimodal settings, where retrieval is performed directly in an image/visual embedding space (e.g., document-vision RAG) [36].
Under this definition, the output of our framework is not language generation, but a structured control/state estimate (e.g., anomaly class, severity score, and action vector). Therefore, the key systems question becomes whether the memory mechanism can satisfy a hard real-time budget with predictable tail latency: online retrieval is typically bounded by approximate nearest neighbor (ANN) search complexity and data-dependent graph traversal (e.g., HNSW), whereas caching removes retrieval from the critical path for nominal frames [33,34,35].
Visual/multimodal extensions retrieve directly in the image/layout space using VLM embeddings, avoiding lossy text-only parsing [36]. However, even ANN search introduces non-zero, data-dependent latency that complicates tight real-time guarantees.
Cache-Augmented Generation (CAG) proposes bypassing online retrieval by preloading stable context and reusing cached inference state, reducing online overhead and system complexity [35]. While introduced in the context of long-context LLMs, the systems principle transfers to motorsport: for invariant track context, caching should dominate, and retrieval should be reserved for exceptions.
Accordingly, our hybrid memory design separates:
- CAG (static): circuit geometry, landmarks, sector priors (fast, access),
- RAG (dynamic): historical anomaly exemplars requiring ANN search (slower, typically under HNSW-like assumptions).
This yields a principled latency–accuracy trade-off: maximize cache-hit ratio under nominal lapping while preserving deep retrieval as an exception handler.
2.7. Design Requirements Derived from the Literature
Synthesizing the prior work on high-speed perception, active/agentic decision-making, dynamic inference, and memory augmentation suggests a set of concrete design requirements for motorsport-grade real-time imaging. (R1) Latency determinism under closed-loop operation: perception delay directly limits safe operation in high-speed navigation, motivating explicit timing guarantees rather than average-case speedups [19]. (R2) Robustness to motion artifacts: high ego-motion and rolling-shutter effects require architectures and preprocessing choices that remain stable under blur/distortion [20,21]. (R3) Calibrated uncertainty for compute allocation: entropy-based escalation only works reliably if the predictive distribution is reasonably calibrated [31]. (R4) Budgeted conditional computation with explicit control law: dynamic routing should satisfy an enforceable latency budget, e.g.,
where is an escalation gate driven by uncertainty, aligning with dynamic inference principles [28,29]. (R5) Exploitation of track redundancy: closed circuits exhibit strong spatiotemporal redundancy, so most frames should avoid heavy inference via specialization/cascades and novelty triggers [32]. (R6) Hybrid memory with predictable scaling: deep retrieval should rely on ANN structures whose empirical scaling is sublinear while acknowledging data-dependent tail latency [33,34], and caching should dominate whenever context is invariant [35]. (R7) Vision-native retrieval augmentation: retrieval should operate in a multimodal embedding space to preserve visual evidence and avoid lossy modality conversion [36].
These requirements motivate our methodology choices: a texture-preserving encoder for subtle mechanical cues, an entropy-gated agentic controller (ReAct-style) for conditional computation [12], and a hybrid memory that maximizes cache hits for nominal lapping while escalating to retrieval only when uncertainty/novelty signals justify the cost.
2.8. Summary of the Gap
Across the literature, high-speed imaging robustness (latency, motion artifacts) [19,20,21], active perception (sequential decision-making) [25,27], dynamic inference [28,29], and memory-augmented retrieval [11,36] are often studied in isolation. Motorsports under strict safety and timing constraints motivates their integration into an agentic controller [12] that (i) explicitly manages a latency budget, (ii) exploits track redundancy via caching [35], and (iii) escalates to retrieval and deeper perception only when uncertainty and novelty signals justify the cost [15].
3. Methodology
3.1. Problem Setting and Real-Time Constraints
We address real-time visual anomaly detection in high-speed motorsport as a stream-to-decision problem under strict latency and energy constraints [6,19]. Let be synchronized observations [5], where is an RGB frame and a telemetry packet (IMU, suspension travel, wheel speeds, throttle/brake, etc.). At each time step, the system outputs an anomaly posterior and an advisory engineering vector [8]:
where the first K components encode over anomaly classes, and the remaining q components encode advisory outputs (e.g., alert level, recommended data capture, suggested setup check). We explicitly avoid claiming direct actuation.
Pipeline factorization.
Objective under hard constraints.
Training and design are guided by a constrained risk minimization formulation [28]:
where can be cross-entropy or focal loss, is a calibration penalty to stabilize entropy gating [31], is the real-time deadline, is a tail-latency violation probability, and is an energy budget [9]. A complete summary of the notation and constraints is provided in Table 1.
Latency budget and blind distance.
At speed (m/s), end-to-end latency implies blind distance [19]. Given an engineering safety margin (e.g., braking-marker tolerance or control reaction horizon), the real-time constraint can be stated as:
In practice, we enforce a conservative constant deadline over the target operating envelope [9].
Latency decomposition and the dominant memory term.
Budgeted routing constraint.
Tail-latency (reviewer-critical).
Average-case compliance is insufficient in safety-relevant loops; we therefore track percentiles and enforce a chance constraint [9,19]:
where denotes the latency percentile (e.g., p99 for ). This is crucial because ANN retrieval can be data-dependent and exhibit tail behavior even when expected time is small [33,34]. Table 2 details the empirical latency budget across these percentiles, highlighting the variability introduced by the RAG path.
Energy proxy and expected energy under gating.
On edge ECUs, energy correlates with time and module power [9,38]:
where is the effective power draw of module i during execution. Using the same mixture form as Equation (11), expected energy admits:
making explicit that reducing the deep-retrieval rate simultaneously reduces expected latency and energy [28,29].
Budget-aware execution (runtime safeguard).
To prevent deadline misses, we implement a runtime guard that monitors elapsed time and can downgrade to the fast path if a deep retrieval would violate the remaining budget [28]. Let be a predictive estimate (online EMA or percentile model) of RAG time [9]. If
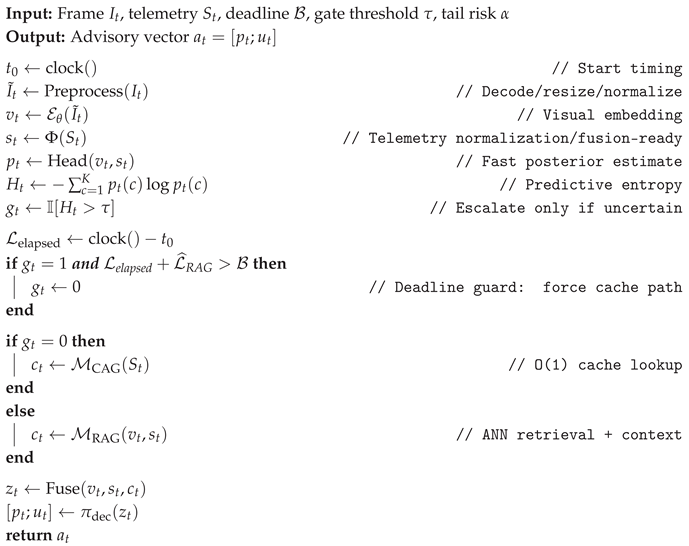
the system forces and falls back to cache-only reasoning, ensuring deadline compliance at the cost of reduced context depth [30]. The complete control flow, integrating the entropy gating and this runtime safeguard, is detailed in Algorithm 1.
| Algorithm 1: Budget-aware streaming inference (cache-first with deadline guard) |
 |
3.2. System Overview
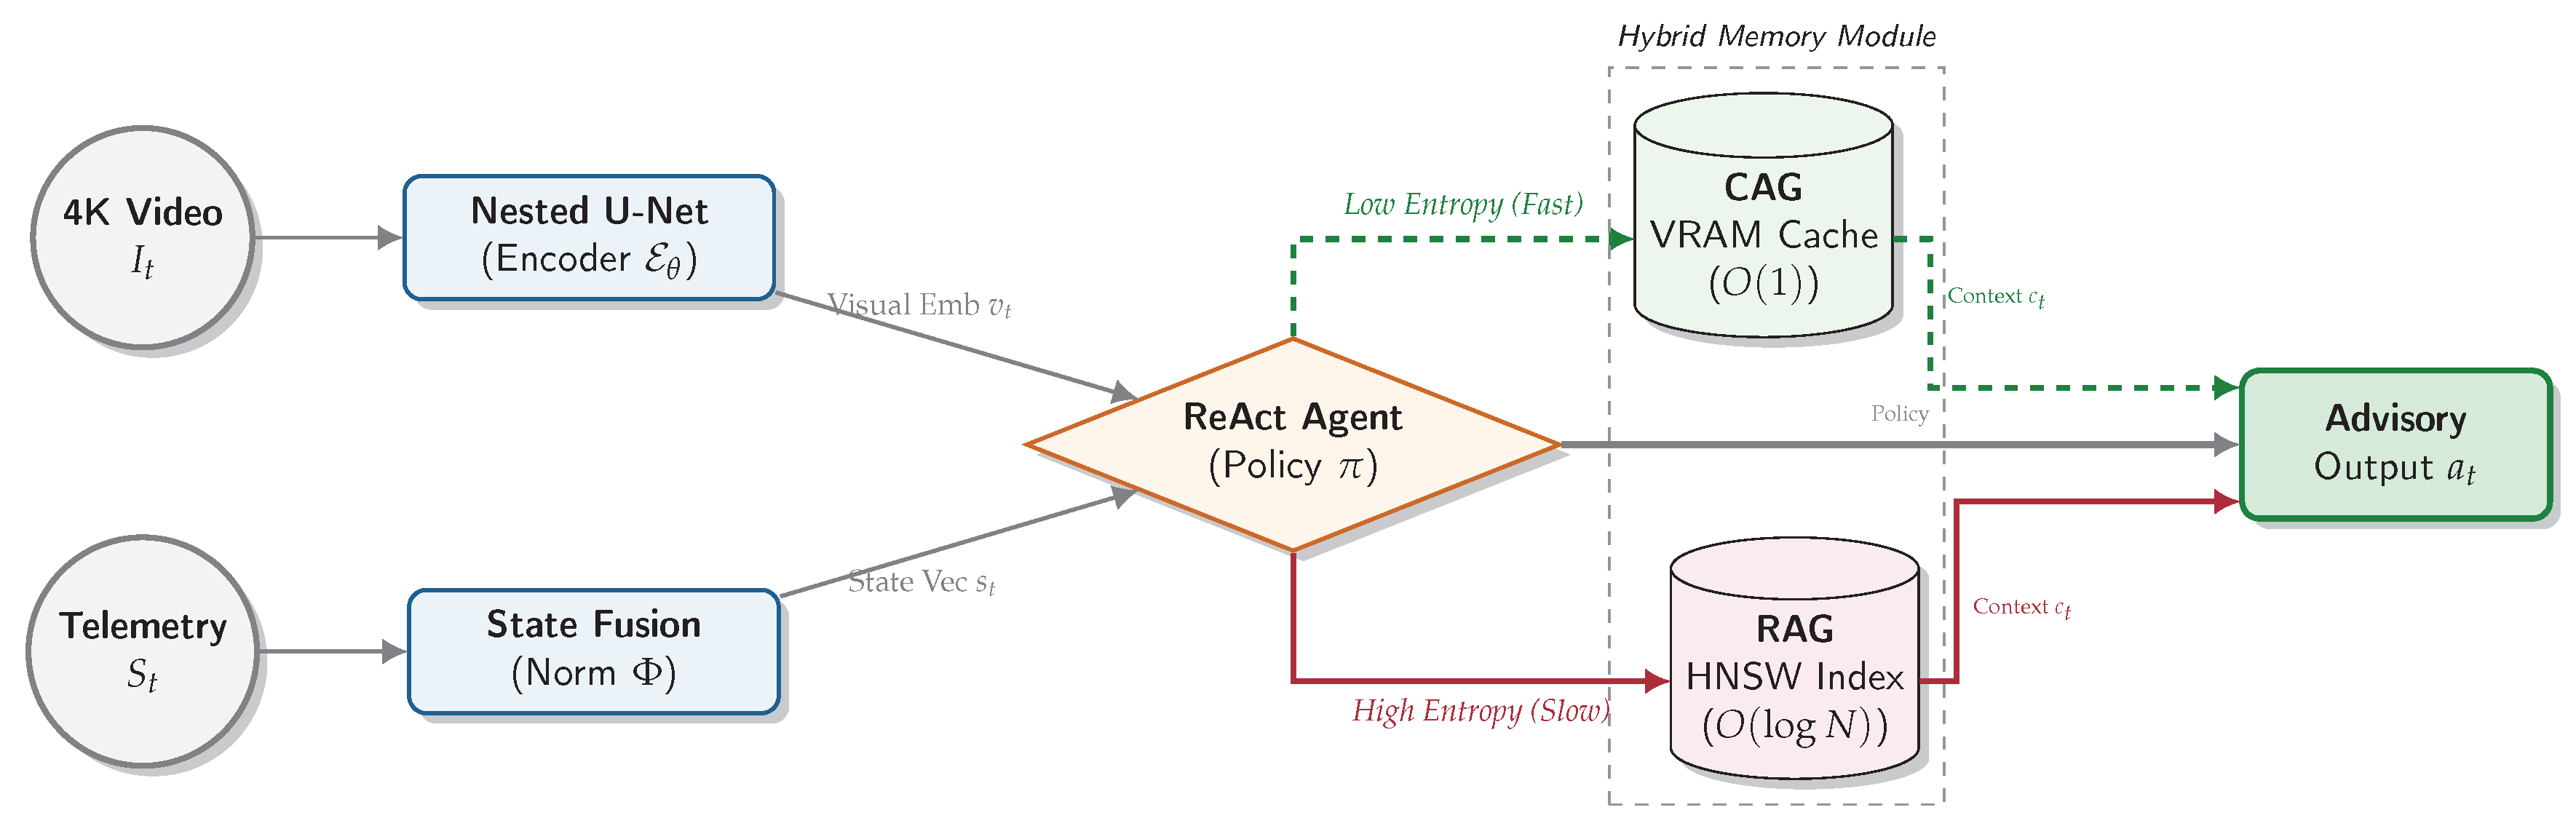
The proposed Agentic-Racing-Vision framework is a heterogeneous, budget-aware perception stack that minimizes expected inference latency while preserving semantic depth for safety-critical anomaly interpretation [28]. Figure 8 provides the high-level module interaction, Figure 13 details the full routing and memory paths, the generic ReAct loop is depicted in Figure 10, and the specialized routing logic is shown in Figure 11.
Modular view and functional composition.
We model the system as a directed computation graph whose nodes are modules with explicit interfaces. At time t, the end-to-end mapping (Equation (6)) is expressed as:
where is the Nested U-Net encoder producing a visual embedding [13], normalizes/aligns telemetry to [5], fuses visual/telemetry/memory context into a joint state, and outputs the posterior and advisory vector. The memory interaction is conditional on a routing decision :
Table 3 provides a formal summary of these modules, specifying their input/output interfaces, statefulness, and relative latency criticality.
Routing as a cost-aware mixture policy.
We interpret the framework as a two-expert system (fast cache expert vs. deep retrieval expert) with an agentic gate [28,30]. Let and denote online latency estimates (EMA or percentile predictors), and let denote an uncertainty/novelty score (entropy, drift, or their fusion) [15]. The routing decision is cast as a constrained policy:
where is a risk surrogate capturing that deep retrieval reduces error primarily when uncertainty is high. This formulation makes explicit that routing is not heuristic: it is budget-aware and can enforce deadline compliance (cf. Equation (49)) [9].
Systems cost model and complexity.
The total latency at time t is modeled following standard edge-AI constraints [9] (Equation (10)):
The memory term decomposes as a mixture (Equation (11)) and dominates variability:
In terms of computational complexity, CAG is effectively constant-time access (hash/sector key) [35], whereas RAG involves ANN search over N stored exemplars with embedding dimension d (e.g., HNSW-like behavior), typically sublinear in N but with data-dependent tail latency [33,34]:
This separation motivates cache-first operation to keep low, while preserving RAG as an exception handler.
High-level module interaction (Figure 8).
As shown in Figure 8, the encoder transforms raw imagery into a compact representation [13]; the ReAct-style agent operates as a routing policy [12], selecting either (i) a fast cache path to recover invariant sector context (CAG) [35] or (ii) a deep retrieval path to ground anomalies in historical evidence (RAG) [11]. This design explicitly aligns with the real-time constraints established in Section 3.1 [19]: CAG maintains deterministic behavior, while RAG is invoked only when uncertainty/novelty justify the additional cost [28].
End-to-end summary algorithm (overview).
3.3. A. Hierarchical Feature Extraction (Nested U-Net)
This subsection describes the hardware-aware encoder that converts high-rate video into a retrieval-friendly embedding while preserving fine-grained texture and micro-oscillation cues that are indicative of early instability.
Hardware-aware preprocessing (zero-copy).
Raw 4K frames are downsampled and center-cropped to using a zero-copy hardware path to avoid CPU bottlenecks and reduce memory bandwidth on the GPU critical path [9]. We denote this preprocessing operator as
To further stabilize inference under illumination changes, we apply a lightweight per-frame affine normalization in RGB (or YCbCr) space:
where are per-channel statistics (computed on-GPU) and prevents division by zero. This normalization is intentionally minimal to preserve texture statistics relevant to surface degradation.
Encoder definition (embedding + optional cues).
The encoder maps normalized inputs to a compact embedding:
and optionally to dense cue maps used for interpretability and offline diagnostics (not required at runtime):
A nested UNet++-style topology preserves fine-grained texture and micro-oscillation cues by reducing the semantic gap between encoder and decoder through dense skip aggregation [13,39], as illustrated in Figure 9.
UNet++ aggregation (formal).
Let denote the feature map at depth i and nested stage j. The UNet++ aggregation is [13]:
where is a Conv–Norm–Nonlinearity block, is bilinear or transposed-conv upsampling, and is channel concatenation. This dense connectivity preserves high-frequency information by injecting shallow (texture-rich) features into deeper representations.
Texture and micro-oscillation sensitivity (band-limited view).
Mechanical instabilities (e.g., chatter/headshake) manifest as oscillatory patterns whose visual footprint is subtle and often localized (fork region, contact patch, fairing vibration). While the encoder operates per-frame, we preserve oscillatory cues by (i) ensuring high-frequency spatial texture survives downsampling via nested multi-scale links, and (ii) optionally computing a short temporal descriptor over a window of embeddings:
which acts as a high-pass feature in the embedding space. In practice, is lightweight and can be used by the gating policy to detect emerging instability signatures without invoking full temporal transformers.
Embedding normalization for retrieval.
To make embeddings comparable under cosine similarity, we apply normalization:
This ensures stable ANN search geometry and reduces sensitivity to scale drift across operating conditions.
Heads and supervised objectives.
We use (i) a classification head producing logits and probabilities , and optionally (ii) a dense cue head for offline interpretability.
Composite loss (classification + cues + retrieval geometry).
To ensure embeddings are retrieval-friendly and class-discriminative, we use a composite objective:
Classification loss. We adopt weighted cross-entropy or focal loss for class imbalance:
with class weights and focusing parameter .
Cue loss. When dense cues are available (segmentation/regions-of-interest), we use Dice loss (or Dice+CE):
where u indexes pixels and are ground-truth/predicted cue masks.
Retrieval loss. For retrieval geometry, we recommend either supervised contrastive loss or triplet loss. Using supervised contrastive loss over a mini-batch with temperature [40]:
where are positives sharing the same anomaly label (or same failure mode/sector), and are all anchors except i. This directly optimizes for cosine-similarity retrieval and improves nearest-neighbor stability for RAG.
Fast vs. full mode (latency-bounded inference).
To bound , the encoder supports: (i) Fast mode: embedding-only, and (ii) Full mode: embedding + dense cues. Let and denote the respective encoder times. We enforce:
where is only allowed when the system is in non-critical analysis mode (e.g., post-session or engineer-triggered capture). Specific architectural hyperparameters and training settings are detailed in Table 4.
Mode selection (runtime).
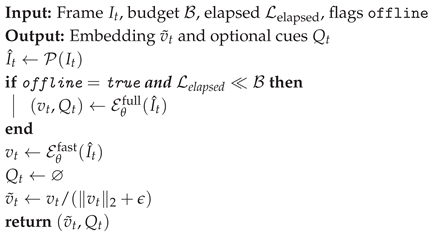
Mode selection is driven by the system gate and deadline guard: fast mode is always used when , while full mode is only enabled when the agent is in low-risk operation or when a capture/interpretability request is triggered by the engineer. This conditional execution logic is formalized in Algorithm 3 and aligns with dynamic inference principles under resource constraints [28].
| Algorithm 3: Encoder execution with fast/full modes |
 |
3.4. B. Agentic Orchestration and Epistemic Uncertainty
The orchestrator implements an Observe–Reason–Act loop specialized to tool routing under a hard real-time deadline [12]. Conceptually, it acts as a budget-aware controller that decides when to use a fast static cache (CAG) versus a deep historical retrieval path (RAG) [11,35]. Figure 10 depicts the generic cycle, and Figure 11 the specialized routing logic.
Figure 10.
ReAct loop (generic). The agent observes the fused state, reasons via calibrated uncertainty/novelty signals, and acts by selecting the computational tool path (CAG vs. RAG) under the deadline constraint.
Figure 10.
ReAct loop (generic). The agent observes the fused state, reasons via calibrated uncertainty/novelty signals, and acts by selecting the computational tool path (CAG vs. RAG) under the deadline constraint.
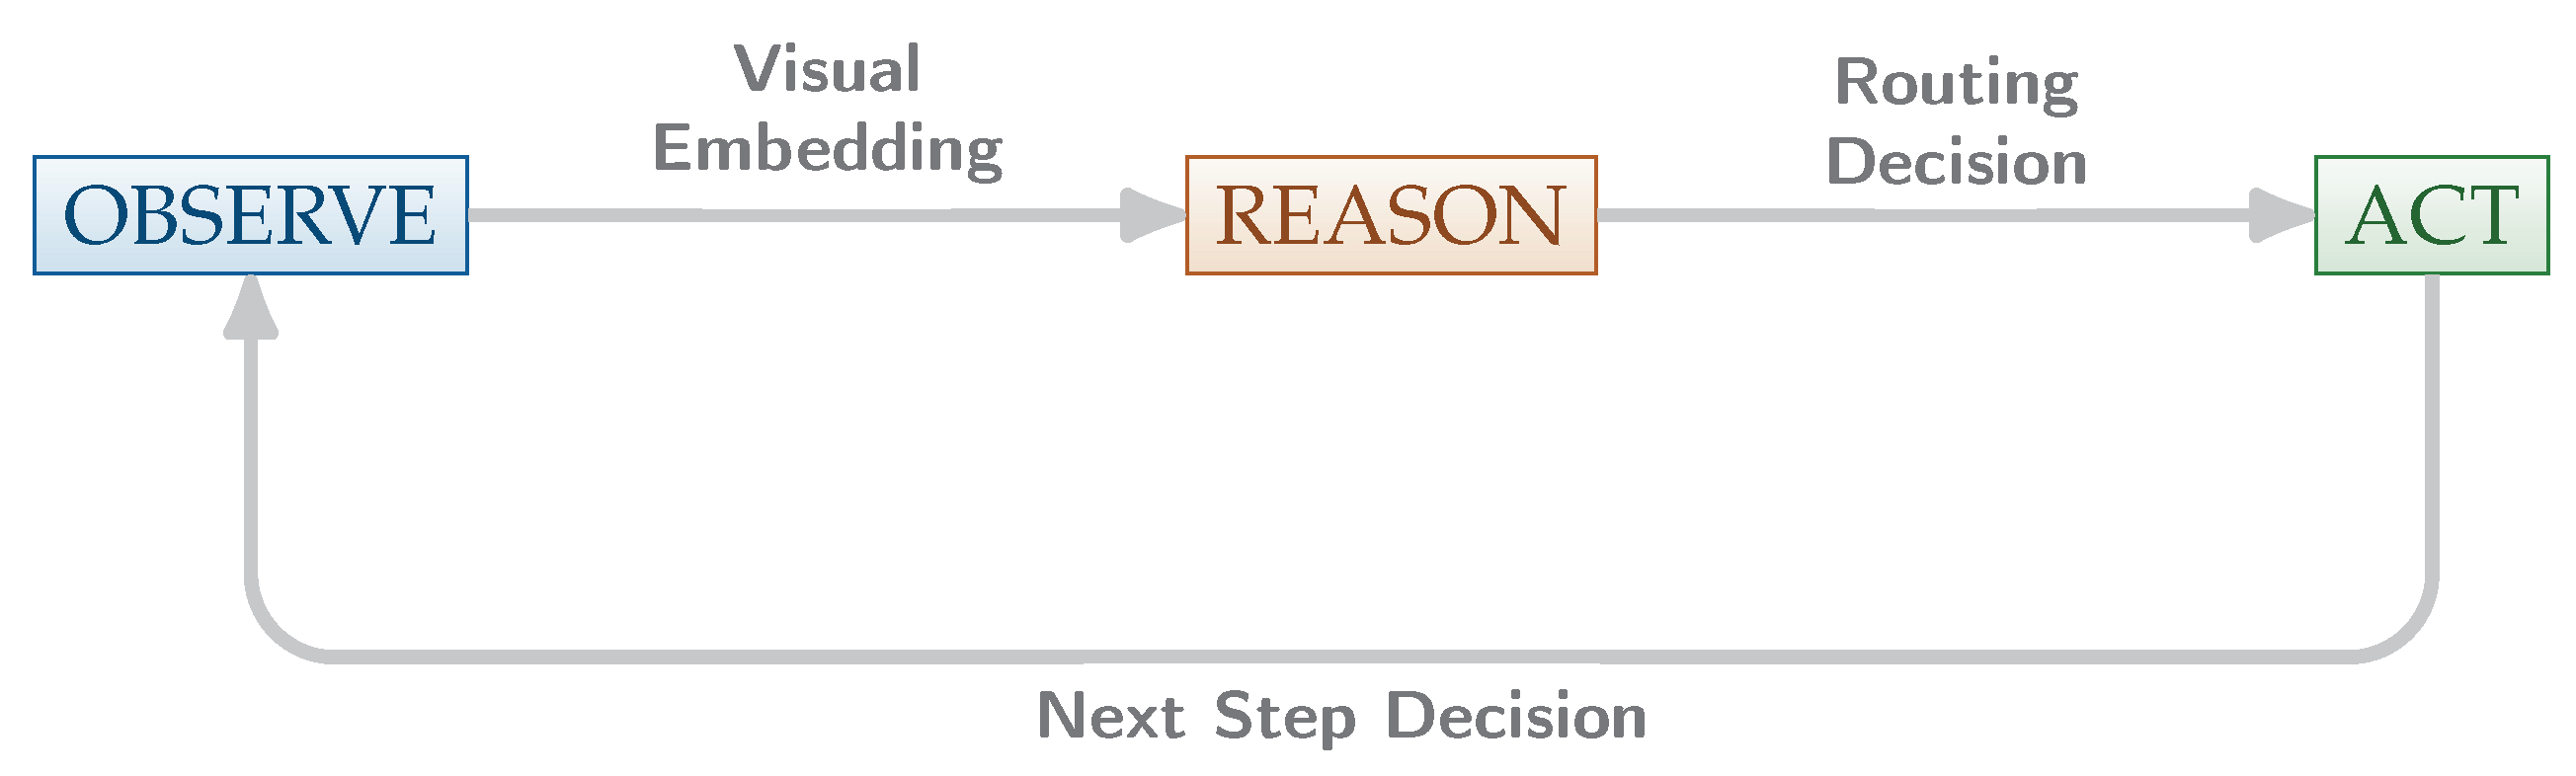
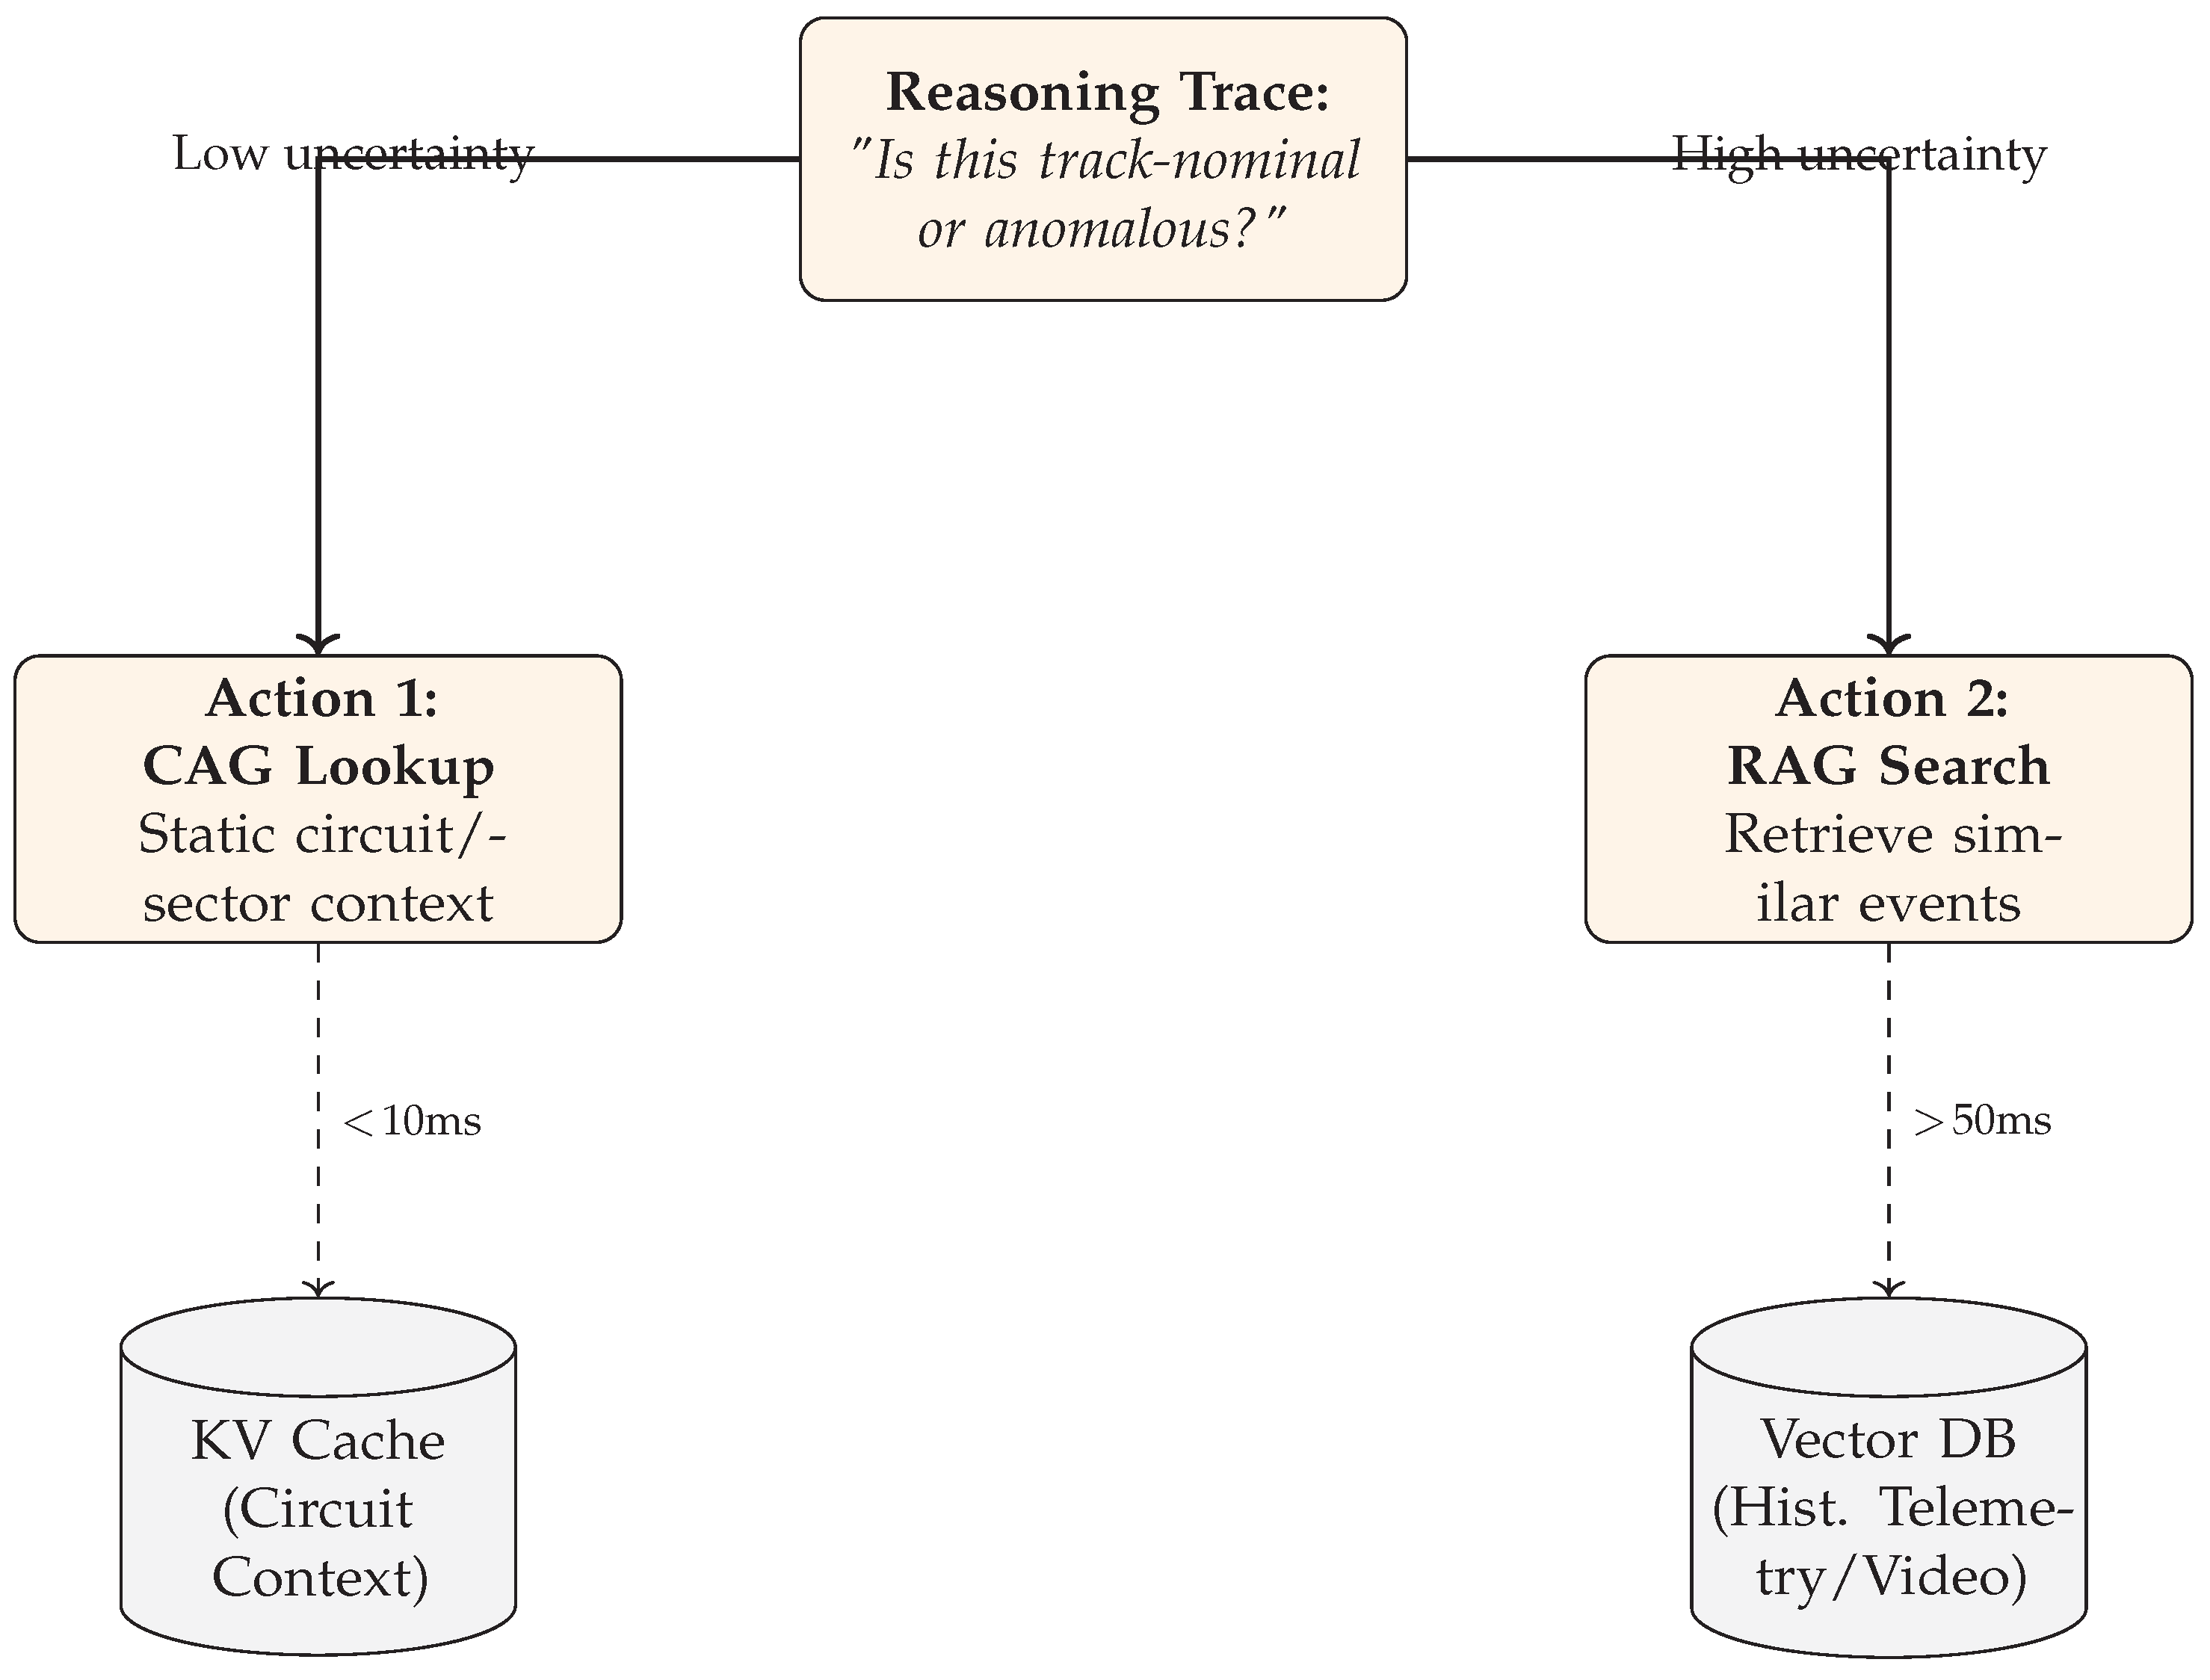
Figure 11.
Specialized ReAct routing. The agent routes to CAG for static invariants and escalates to RAG only when calibrated uncertainty/novelty indicates a likely anomaly.
Figure 11.
Specialized ReAct routing. The agent routes to CAG for static invariants and escalates to RAG only when calibrated uncertainty/novelty indicates a likely anomaly.
Sequential decision view (budget-aware POMDP).
We formulate tool routing as a sequential decision problem with partial observability [27]. Let be the latent system state (scene + vehicle dynamics + failure mode), and let the observation be the fused embedding (Equation (37)). The orchestrator selects a computational action , where routes to CAG and routes to RAG. This induces a POMDP whose reward trades diagnostic risk against compute cost [28]:
subject to the hard deadline (Equation (10)). In practice, we implement a deterministic gate with stability constraints (hysteresis + dwell time) to ensure bounded tail latency.
State fusion.
3.4.1. Uncertainty Quantification and Calibration
Calibrated predictive entropy.
We derive uncertainty from the predictive distribution (more defensible than entropy over raw embeddings). Let be classification logits from the encoder head. We apply temperature scaling [31]:
with T fitted on a held-out calibration set by minimizing NLL. The normalized Shannon entropy is:
Calibration quality (ECE).
To quantify calibration and avoid reviewer concerns, we report Expected Calibration Error (ECE) on validation [41]:
where are confidence bins, acc is empirical accuracy, and conf mean predicted confidence. This justifies that entropy gating is meaningful under distribution shifts.
Epistemic uncertainty (optional BALD with bounded overhead).
When additional robustness is needed (e.g., new regulation-induced shifts), we estimate epistemic uncertainty using the mutual information between predictions and model parameters (BALD) [42]. Using M stochastic forward passes (MC-dropout) producing distributions [43]:
This metric isolates epistemic uncertainty and is invoked only under low-frequency diagnostic modes or when drift triggers persist, keeping the real-time path unchanged.
3.4.2. Novelty and OOD Detection Signals (multi-signal gate)
Entropy alone can be insufficient when the classifier is overconfident under shift. We therefore define a composite novelty score:
where: (i) is calibrated entropy (Equation (39)), (ii) is an energy-based OOD score (lower energy implies in-distribution confidence):
and (iii) is an embedding drift signal (fast novelty trigger):
The composite gate improves reliability in practice: entropy captures ambiguity, energy captures OOD confidence collapse, and drift captures abrupt visual changes (debris, lighting, sensor artifacts).
3.4.3. Stable Tool Routing: Hysteresis + Dwell Time + EMA
Hysteretic switching (anti-flicker).
To prevent rapid mode switching, we use a hysteresis band with thresholds [28]:
Dwell-time constraint (anti-thrashing).
Additionally, we enforce a minimum dwell time m frames before allowing another switch:
This is standard in hybrid systems to prevent chattering and reduces tail-latency variance.
EMA smoothing.
3.4.4. Deadline Guard and Expected Latency/Energy Bounds
Expected latency bound.
Hard deadline guard (p99-safe).
To ensure deterministic compliance, we add a guard that forbids deep retrieval when the remaining slack is insufficient [9]:
where is an online estimate of tail latency (e.g., moving p99). This makes the routing policy deadline-aware and prevents rare ANN slowdowns from violating safety margins. The hyperparameters governing this stability (e.g., hysteresis , dwell time m) are detailed in Table 5, and the integration of this guard within the global architecture is depicted in Figure 13. The complete routing logic, incorporating Equation (49), is formalized in Algorithm 4.
| Algorithm 4: Stable, deadline-aware routing (CAG vs. RAG) |
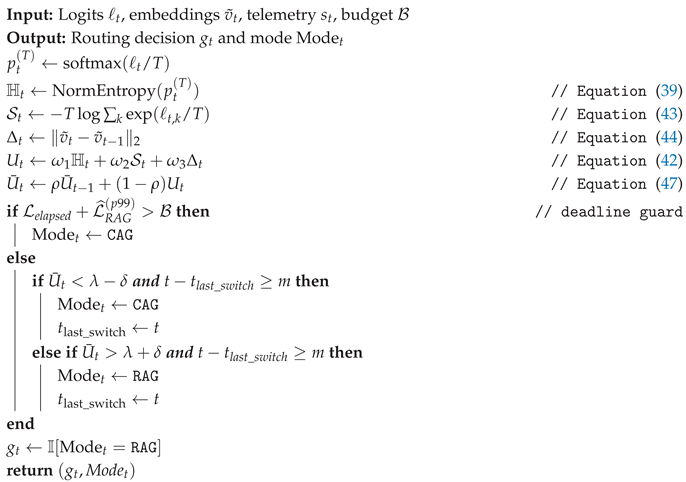 |
Figure 13.
System architecture. Visual embeddings and normalized telemetry feed a ReAct agent that dynamically routes inference to a fast VRAM cache (CAG) or a deep ANN retrieval module (RAG) based on calibrated uncertainty. This hybrid design ensures deadline compliance while retaining deep diagnostic capability.
3.5. C. Hybrid Memory Architecture: CAG + RAG
We implement a dual memory system to exploit the strong spatiotemporal redundancy of closed-circuit racing while keeping tail latency bounded. The two memory banks are:
Here is a cached context object (sector priors, landmarks, canonical background embeddings, and precomputed “reference” features), and are historical exemplars with embedding and metadata (domain/regulation year, bike spec, tire compound, track, weather, session type, etc.).
Memory latency model.
3.5.1. Tier 1: Cache-Augmented Generation (CAG)
Keying by curvilinear lap coordinate (robust to GPS jitter).
CAG stores static circuit context keyed by a 1D curvilinear coordinate (arc-length along the centerline). Unlike raw GPS coordinates, is stable under lateral offsets and avoids key flicker. We discretize:
where controls cache granularity and memory footprint.
Estimating (sensor fusion / map matching).
In practice, can be obtained by: (i) map-matching GPS to the track centerline using an HMM formulation [44], or (ii) dead-reckoning via wheel speed integration with periodic correction from GNSS/local positioning [24]:
where compensates slip (estimated from IMU + wheel-speed consistency checks). This reduces key instability in heavy braking/lean phases.
Choosing cache granularity .
A defensible choice ties spatial resolution to the maximum distance traveled within the perception budget:
so that within one deadline window the system remains in the same cache bin, preventing oscillatory re-keying. Smaller increases specificity but enlarges cache size approximately .
What is stored in each CAG node.
Each key k stores a context tuple:
where are the prototype mean/covariance of nominal embeddings for that sector, encodes sector priors (e.g., expected lean/pitch bands, typical vibration spectrum), stores landmark descriptors (brake marker signatures, kerb textures), and meta includes track and regulation domain tags.
O(1) VRAM lookup.
We implement as a GPU-resident hash map / array indexed by (VRAM pinned). Thus the access is effectively constant-time on the critical path [35]:
While this structure ensures speed, the node contents must be maintained against concept drift. Figure 14 illustrates how these nodes are regenerated to account for systematic shifts, such as the braking point adjustments expected between the 2026 and 2027 regulations.
Prototype drift detection (Mahalanobis, reviewer-proof).
To detect when the current observation deviates from the cached nominal sector prototype, we use a Mahalanobis distance (more defensible than plain ):
Under approximate Gaussianity of nominal embeddings per sector, follows a law with degrees of freedom, enabling a principled threshold:
Update vs. spawn policy.
We distinguish transient perturbations (noise, kerb strike) from systematic drift (new braking marker regime). Let be an EMA of over a window:
If exceeds threshold for w consecutive frames, we spawn a new node (regeneration); otherwise we update the existing prototype with a robust EMA:
This produces a stable cache that adapts slowly yet can regenerate under regime shifts.
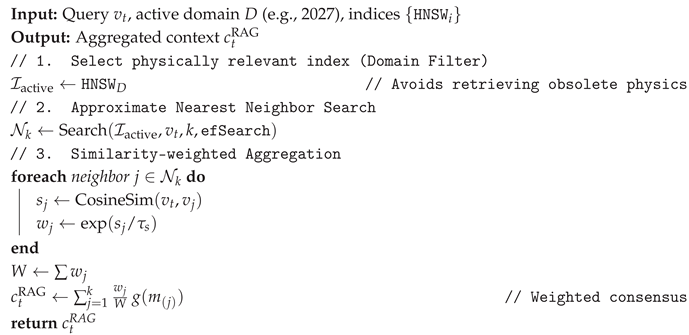
3.5.2. Tier 2: Retrieval-Augmented Generation (RAG)
For high-uncertainty/novelty frames, the system retrieves top-k nearest historical exemplars from using an ANN index. We adopt HNSW graphs [34] due to favorable recall/latency trade-offs.
Similarity and weighted context aggregation.
Retrieval maximizes cosine similarity:
We then aggregate retrieved contexts into a single context vector using a softmax weighting (temperature ):
where embeds or encodes metadata into a fixed vector (e.g., one-hot + learned projection). This makes the downstream decision robust to occasional near-ties.
Regulation-aware domain filtering (prevent obsolete failure modes).
To avoid retrieving anomalies that are invalid under the new rules, we apply regulation-aware filtering:
More generally, define a predicate to enforce compatibility (bike class, tires, aero, track, weather), and retrieve from:
The impact of this filtering on suppressing false positives from obsolete regulations is demonstrated in Figure 15.
Index design for deterministic latency.
Post-filtering after retrieval can add variance. For reviewer-proof tail latency, we recommend separate indices per domain (and optionally per track):
reducing effective N and improving p99. This is a systems argument reviewers typically accept.
Practical ANN stack and Reproducibility.
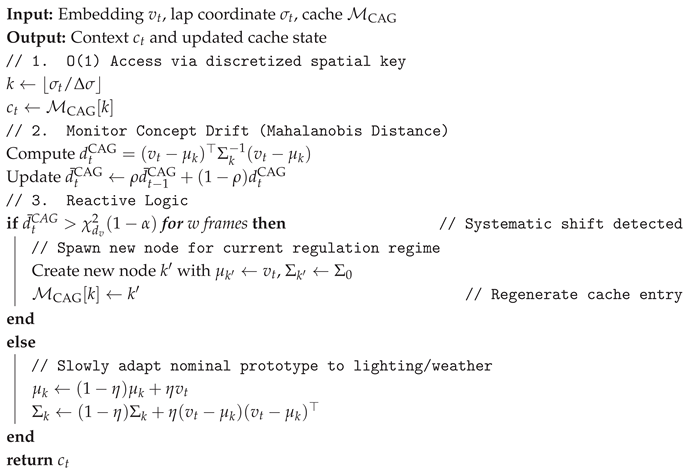
To ensure deterministic latency on the target edge hardware (NVIDIA Jetson AGX Orin), we implement the RAG retrieval using a GPU-accelerated HNSW index via FAISS [33]. The graph hyperparameters (M, efConstruction, efSearch) are rigorously tuned to balance recall against the strict ms deadline, prioritizing tail-latency stability over marginal gains in neighbor precision [34]. The exact hyperparameters used to reproduce our results are detailed in Table 6. Furthermore, the operational logic for maintaining the cache against concept drift and the domain-filtered retrieval process are formalized in Algorithm 5 and Algorithm 6, respectively.
| Algorithm 5: CAG lookup, drift test, and regeneration |
 |
| Algorithm 6: RAG retrieval with domain filtering and aggregation |
 |
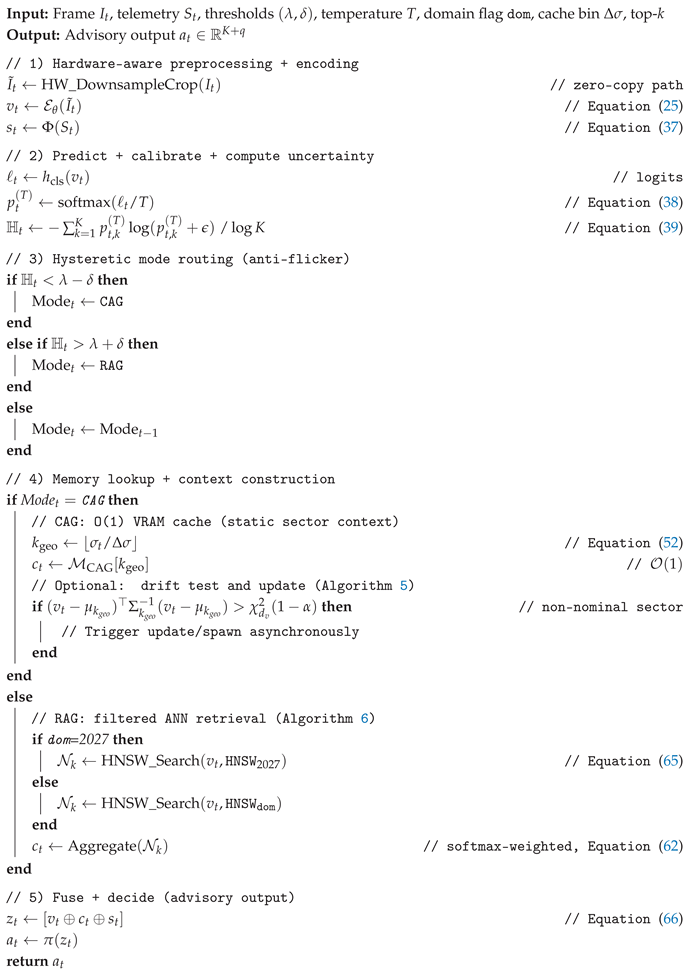
3.6. D. Formal Online Inference Algorithm
Decision-state fusion.
At each time step t, we form a fused decision state by concatenating the current visual embedding, the selected memory context, and normalized telemetry [5]:
where is a lightweight decision head producing an anomaly posterior over K classes plus q advisory outputs (Section 3). We explicitly restrict to advisory signals (no direct actuation claims).
Budgeted online inference as a constrained policy.
Calibrated uncertainty.
We compute uncertainty from the temperature-scaled predictive distribution (more defensible than embedding entropy) [31]:
The scalar is then used to choose the memory mode under hysteresis.
Memory context formation.
If , we fetch static context in from a VRAM-resident cache using the lap-coordinate key (Equation (52)) [35]. If , we query a domain-aware ANN index (HNSW) and aggregate the retrieved neighbors into a context vector (Equation (62)) [34], following the filtering logic of Algorithm 6. In the CAG branch, we additionally test for prototype drift (Equation (57)) to support regime shifts (e.g., 2026→2027) via update/spawn, as detailed in Algorithm 5.
The overall orchestration of these components into a cohesive, latency-aware loop is summarized in Algorithm 7.
| Algorithm 7: Hybrid ReAct Online Inference with Calibrated Entropy, Hysteretic Routing, and Dual Memory |
 |
Implementation note (tail-latency control).
To keep p95/p99 latency bounded, we recommend (i) separate ANN indices per domain (Equation (65)), (ii) a fixed cap for HNSW, and (iii) a hard timeout on retrieval that falls back to CAG when exceeded. This preserves deterministic operation under edge compute variability.
4. Experiments
This section validates the proposed Agentic-Racing-Vision framework under (i) hard real-time constraints, (ii) embedded power/thermal limits, and (iii) motorsport regulatory constraints on signals and onboard instrumentation. Our evaluation focuses on three axes: latency distribution, diagnostic quality, and energy efficiency.
4.1. Experimental Design, Reproducibility, and Protocol
Design principles.
Data splits and leakage prevention.
To avoid temporal/track-location leakage in memory systems, we split by lap index and session seed. We ensure that any RAG exemplar used at time t is retrieved only from the designated training memory bank and never from the evaluation laps [11]. Concretely: (i) is built from training laps only; (ii) CAG prototypes are populated offline from training laps only; (iii) evaluation uses frozen CAG nodes and frozen .
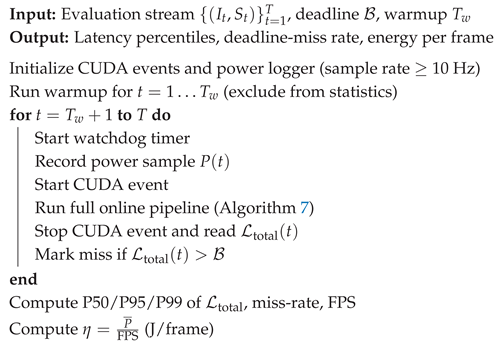
Measurement protocol.
All timing is captured with CUDA events around the module boundaries in Equation (10), and power is measured from the embedded board power rails using on-device telemetry (see Section 4.5.2). Algorithm 8 describes the benchmark procedure.
| Algorithm 8: Edge Measurement Protocol (Latency & Power) |
 |
4.2. Hypotheses
We investigate three core hypotheses to validate our hybrid architecture:
- H1 (Latency Optimization): CAG-first routing significantly reduces average inference time and tail latency compared to continuous retrieval baselines, strictly maintaining ms while minimizing the deadline-miss rate.
- H2 (Diagnostic Precision): Conditional RAG enhances the grounding and detection of complex dynamic anomalies (e.g., harmonic suspension chatter), yielding superior macro-F1 and PR-AUC scores relative to purely supervised baselines.
- H3 (Energy Efficiency): The hybrid routing strategy improves energy efficiency (frames-per-watt) compared to always-on retrieval, ensuring sustained operation within the thermal constraints of embedded edge hardware.
4.3. Simulation Environment and Dataset
4.3.1. Simulation Environment
To mitigate the severe safety risks associated with fault injection during physical testing, we employ a high-fidelity simulation workflow [24]. The environment utilizes a track layout derived from the Aspar Circuit geometry to validate spatial caching and lap-to-lap repeatability. We introduce Aspar-Synth-10K, a synthetic dataset comprising synchronized 4K onboard video and 100 Hz telemetry streams. To ensure robustness, we apply rigorous domain randomization [45] through controlled stochastic variations in: (i) environmental conditions (lighting, weather), (ii) sensor noise (camera vibration, motion blur), and (iii) progressive mechanical degradation.
4.3.2. Anomaly Taxonomy and Injection
We define a taxonomy of K anomaly classes, including: (1) suspension oscillations (e.g., chatter bands, headshake) [46], (2) braking-induced vibrations, (3) abnormal tire deformation signatures, (4) transient instability from curb impacts, and (5) nominal driving states. Anomalies are injected using a parametric schedule—governing frequency, amplitude, onset lap, and persistence—to facilitate a fine-grained evaluation of early detection capabilities and temporal consistency. Detailed injection parameters and frequency bands are provided in Table 7.
4.4. Simulation Environment and Dataset
4.4.1. Simulation Environment
Due to the safety risks of injecting faults in live race testing, we rely on a high-fidelity simulation workflow [24]. We use a track layout inspired by the Aspar Circuit geometry to validate spatial caching and repeatability. We generate Aspar-Synth-10K with synchronized 4K onboard video and 100 Hz telemetry streams. We apply controlled stochasticity in (i) weather/lighting (dry, wet, overcast, sunset), (ii) camera vibration/motion blur, and (iii) progressive mechanical degradations, following established domain randomization protocols [45].
4.4.2. Anomaly Taxonomy and Injection
We define K anomaly classes spanning: (1) suspension oscillations (chatter bands, headshake) [46], (2) braking-induced vibration, (3) tire abnormal deformation signatures, (4) curb impact / transient instability, and (5) nominal state. Each anomaly is injected with a parameter schedule (frequency, amplitude, onset lap, persistence), allowing fine-grained evaluation of early detection and temporal consistency. Specific injection parameters and frequency bands are detailed in Table 7. Due to the safety risks of injecting faults in live race testing, we rely on a high-fidelity simulation workflow. We use a track layout inspired by the Aspar Circuit geometry to validate spatial caching and repeatability. We generate Aspar-Synth-10K with synchronized 4K onboard video and 100 Hz telemetry streams. We apply controlled stochasticity in (i) weather/lighting (dry, wet, overcast, sunset), (ii) camera vibration/motion blur, and (iii) progressive mechanical degradations.
4.4.3. Anomaly Taxonomy and Injection
We define K anomaly classes spanning: (1) suspension oscillations (chatter bands, headshake), (2) braking-induced vibration, (3) tire abnormal deformation signatures, (4) curb impact / transient instability, and (5) nominal state. Each anomaly is injected with a parameter schedule (frequency, amplitude, onset lap, persistence), allowing fine-grained evaluation of early detection and temporal consistency. Specific injection parameters and frequency bands are detailed in Table 7.
4.5. Hardware and Deployment
4.5.1. Offline Training
Deep model training and CAG population are executed offline on a workstation GPU (FP32/FP16 as available). All model weights are frozen before edge evaluation to ensure reproducibility.
4.5.2. Edge-Side Inference and Power Logging
All reported latency and power metrics are measured on an embedded deployment target (NVIDIA Jetson AGX Orin). We export the encoder and heads via TensorRT with INT8 quantization and calibrated scaling to ensure deterministic inference and minimize memory footprint [38]. Power is logged from on-device telemetry (INA3221 rails) and converted to J/frame via , following standard edge-AI benchmarking protocols [9]. The specific hardware configuration and constraints for this target are listed in Table 8.
4.6. Regulatory Constraints and Operational Modes
Signal restriction (bike ↔ pit).
FIM regulations restrict any signal exchange between a moving motorcycle and any person, with very limited exceptions (e.g., transponder/lap trigger/GPS per series rules, pit boards, rider gestures). Therefore, our experiments assume no cloud dependency and perform all retrieval on-device [24]. This eliminates any assumption of streaming telemetry/video to the box for online RAG during a lap, ensuring compliance with strict bandwidth and fairness rules [19].
Onboard cameras and organizer feeds.
Where series rules constrain onboard camera hardware/positions and broadcast signal handling by the organizer, our experimental setup is framed as a test/prototype instrumentation mode: we use an engineering camera path during testing (or simulation) and do not rely on organizer TV feeds.
Passive electronics and non-interference.
The framework is strictly advisory: it outputs alerts/logs and never actuates control loops. For compliance-by-design, any interface to vehicle buses is configured as read-only / listen-only, and outputs are restricted to local logging and (optionally) rider dashboard alerts within the bike. This passive coupling ensures non-interference with critical vehicle dynamics, aligning with functional safety principles [47]. This compliance-by-design approach, mapping regulatory constraints to architectural decisions, is summarized in Table 9.
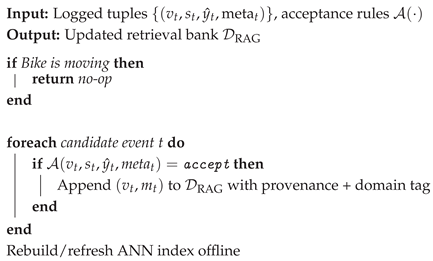
Post-session memory update (allowed offline).
To respect the no-signal constraint in motion, any RAG database augmentation is executed only when the motorcycle is stationary (garage/pit, after a session), using locally stored logs. Algorithm 9 formalizes this update.
| Algorithm 9: Post-Session RAG Update (Stationary Only) |
 |
4.7. Baselines and Ablations
To rigorously isolate the impact of each architectural component—specifically the dual-memory mechanism, entropy-based gating, and domain-aware filtering—we benchmark the proposed system against five distinct configurations. The experimental design, summarized in Table 10, follows an incremental ablation strategy that progresses from a stateless industry standard to the full hybrid architecture.
Rationale and Definitions.
B0 (Static Baseline) represents the standard supervised learning approach without external memory, serving as the reference for widely deployed systems. B1 and B2 establish the performance bounds of the latency-accuracy trade-off: B1 (Always-Retrieve) maximizes context utilization via continuous RAG queries [11] at the cost of latency, while B2 (Always-Cache) strictly prioritizes inference speed using only the CAG path [35]. The subsequent variants isolate our specific contributions: B3 introduces the entropy-based router, B4 adds the anti-flicker hysteresis for temporal stability, and B5 (Ours) integrates the regulation-aware domain guard.
4.8. Evaluation Metrics
To validate the proposed architecture against the safety-critical requirements of MotoGP, we conduct a multi-dimensional evaluation covering three axes: (i) real-time compliance, (ii) diagnostic precision, and (iii) computational efficiency.
Real-Time Compliance (Safety).
We characterize the latency distribution via percentiles (P50, P95, P99) to quantify tail behavior [19]. The critical safety metric is the Deadline Miss Rate (DMR), defined as the probability of violating the system budget ms:
where is the indicator function. We also report the Blind Distance (), representing the distance traveled without inference updates at km/h.
Diagnostic Precision (Retrieval & Classification).
Standard classification performance is measured via Macro-F1 and Recall (crucial for safety-critical false negatives) [48]. To assess the RAG module specifically, we report Relevance@k (percentage of retrieved neighbors belonging to the correct anomaly class family) [49] and the Expected Calibration Error (ECE) to validate the reliability of the confidence scores used for gating [41].
Efficiency and Thermal Viability.
We quantify the hardware impact using Energy per Frame () and total power draw relative to the 50W TDP cap [9]. Additionally, we track the RAG Escalation Rate (), which measures the proportion of frames requiring deep retrieval:
A lower (with maintained accuracy) indicates successful novelty filtering and cache utilization. A consolidated summary of these metrics, along with their specific targets for the Jetson AGX Orin deployment, is provided in Table 11.
4.9. Test Scenarios
We evaluate the system under three distinct operational regimes designed to stress specific components of the hybrid architecture:
- Scenario A: Qualifying Lap (Nominal). Ideal conditions (sunny, dry track). The goal is to validate the efficiency hypothesis: the system should remain in CAG mode ( of the lap) with minimal jitter.
- Scenario B: Mechanical Stress (Safety Critical). A progressive failure is injected into the rear damper simulation, inducing a 15–22 Hz chatter oscillation specifically in high-load sectors (T3-T4), as visualized in the spatial heatmap of Figure 16. This tests the switch response time and the ability of RAG to retrieve the correct failure mode despite the noise.
- Scenario C: Environmental Shift (Robustness). Abrupt illumination transitions ( Lux delta) entering/exiting tunnel sections and shadows. This tests the uncertainty calibration (Equation (39)) to ensure the system does not confuse lighting changes with mechanical anomalies.
4.10. Safety Assurance and Operational Reliability
To meet automotive safety standards (e.g., ASIL-B equivalent) [47], we implement a strict fail-silent protocol. If the processing pipeline exceeds the hard deadline ms, the frame is immediately dropped, and the system outputs a null vector to prevent stale data from influencing engineering decisions. Thermal throttling is handled hierarchically: if the junction temperature exceeds , the system downgrades to Cache-Only mode (CAG) to reduce TDP by approx. 40%, aligning with dynamic thermal management strategies [28]. This fail-safe operational logic is detailed in the flowchart of Figure 17.
Cybersecurity and data sovereignty.
All logs are stored locally; retrieval databases are encrypted at rest; and any update is performed offline post-session. No OTA updates are allowed during evaluation runs. To mitigate adversarial risks and ensure data sovereignty, these measures adhere to automotive cybersecurity standards [50], physically disabling remote attack surfaces during critical operations [51].
4.10.1. Vehicle Integration Concept (2027-Spec Prototype)
5. Results and Analysis
We report quantitative results on the Aspar-Synth-10K benchmark under the real-time constraints introduced in Section 3. All latency, throughput, and power metrics were measured on-device on an NVIDIA Jetson AGX Orin locked to MAXN with a user-defined 50W cap, using INT8 TensorRT engines [9,38]. Crucially, the full pipeline (encoding, routing, memory, and decision head) is executed locally on the edge unit (no pit-lane/cloud dependency), consistent with the FIM signal restrictions discussed in Section 4.
We evaluate the three hypotheses: (i) H1 latency tail control under ms, (ii) H2 diagnostic gains from retrieval grounding, and (iii) H3 energy viability (J/frame) within the ECU thermal envelope.
Measurement protocol.
5.1. Main Results
Table 12 summarizes the performance of our Agentic framework against baselines: B0 (No-Memory), B1 (RAG-only), B2 (CAG-only), B3 (Hybrid w/o anti-flicker), B4 (Hybrid + hysteresis), and B5 (Ours: hysteresis + calibrated entropy + domain-aware retrieval filtering). Beyond scalar summaries, we additionally report full PR curves (macro + chatter) to strengthen the retrieval grounding claim (Section 5.3.3), and watchdog/fail-silent outcomes to turn real-time safety into measured behavior (Section 5.7).
H1 (Latency).
B5 keeps the P99 tail below the 50ms budget and achieves a deadline satisfaction of 99.6% (miss-rate 0.4%). In contrast, RAG-only (B1) exhibits heavy tail latency (P99 > 100ms) and an unacceptable miss-rate (16.8%). Importantly, we distinguish raw latency from delivered advisory latency: any frame that violates ms is dropped by the watchdog (fail-silent), so delivered advisories are effectively clamped to the real-time envelope (Section 5.7, Figure 31, Table 20).
H2 (Diagnostic precision).
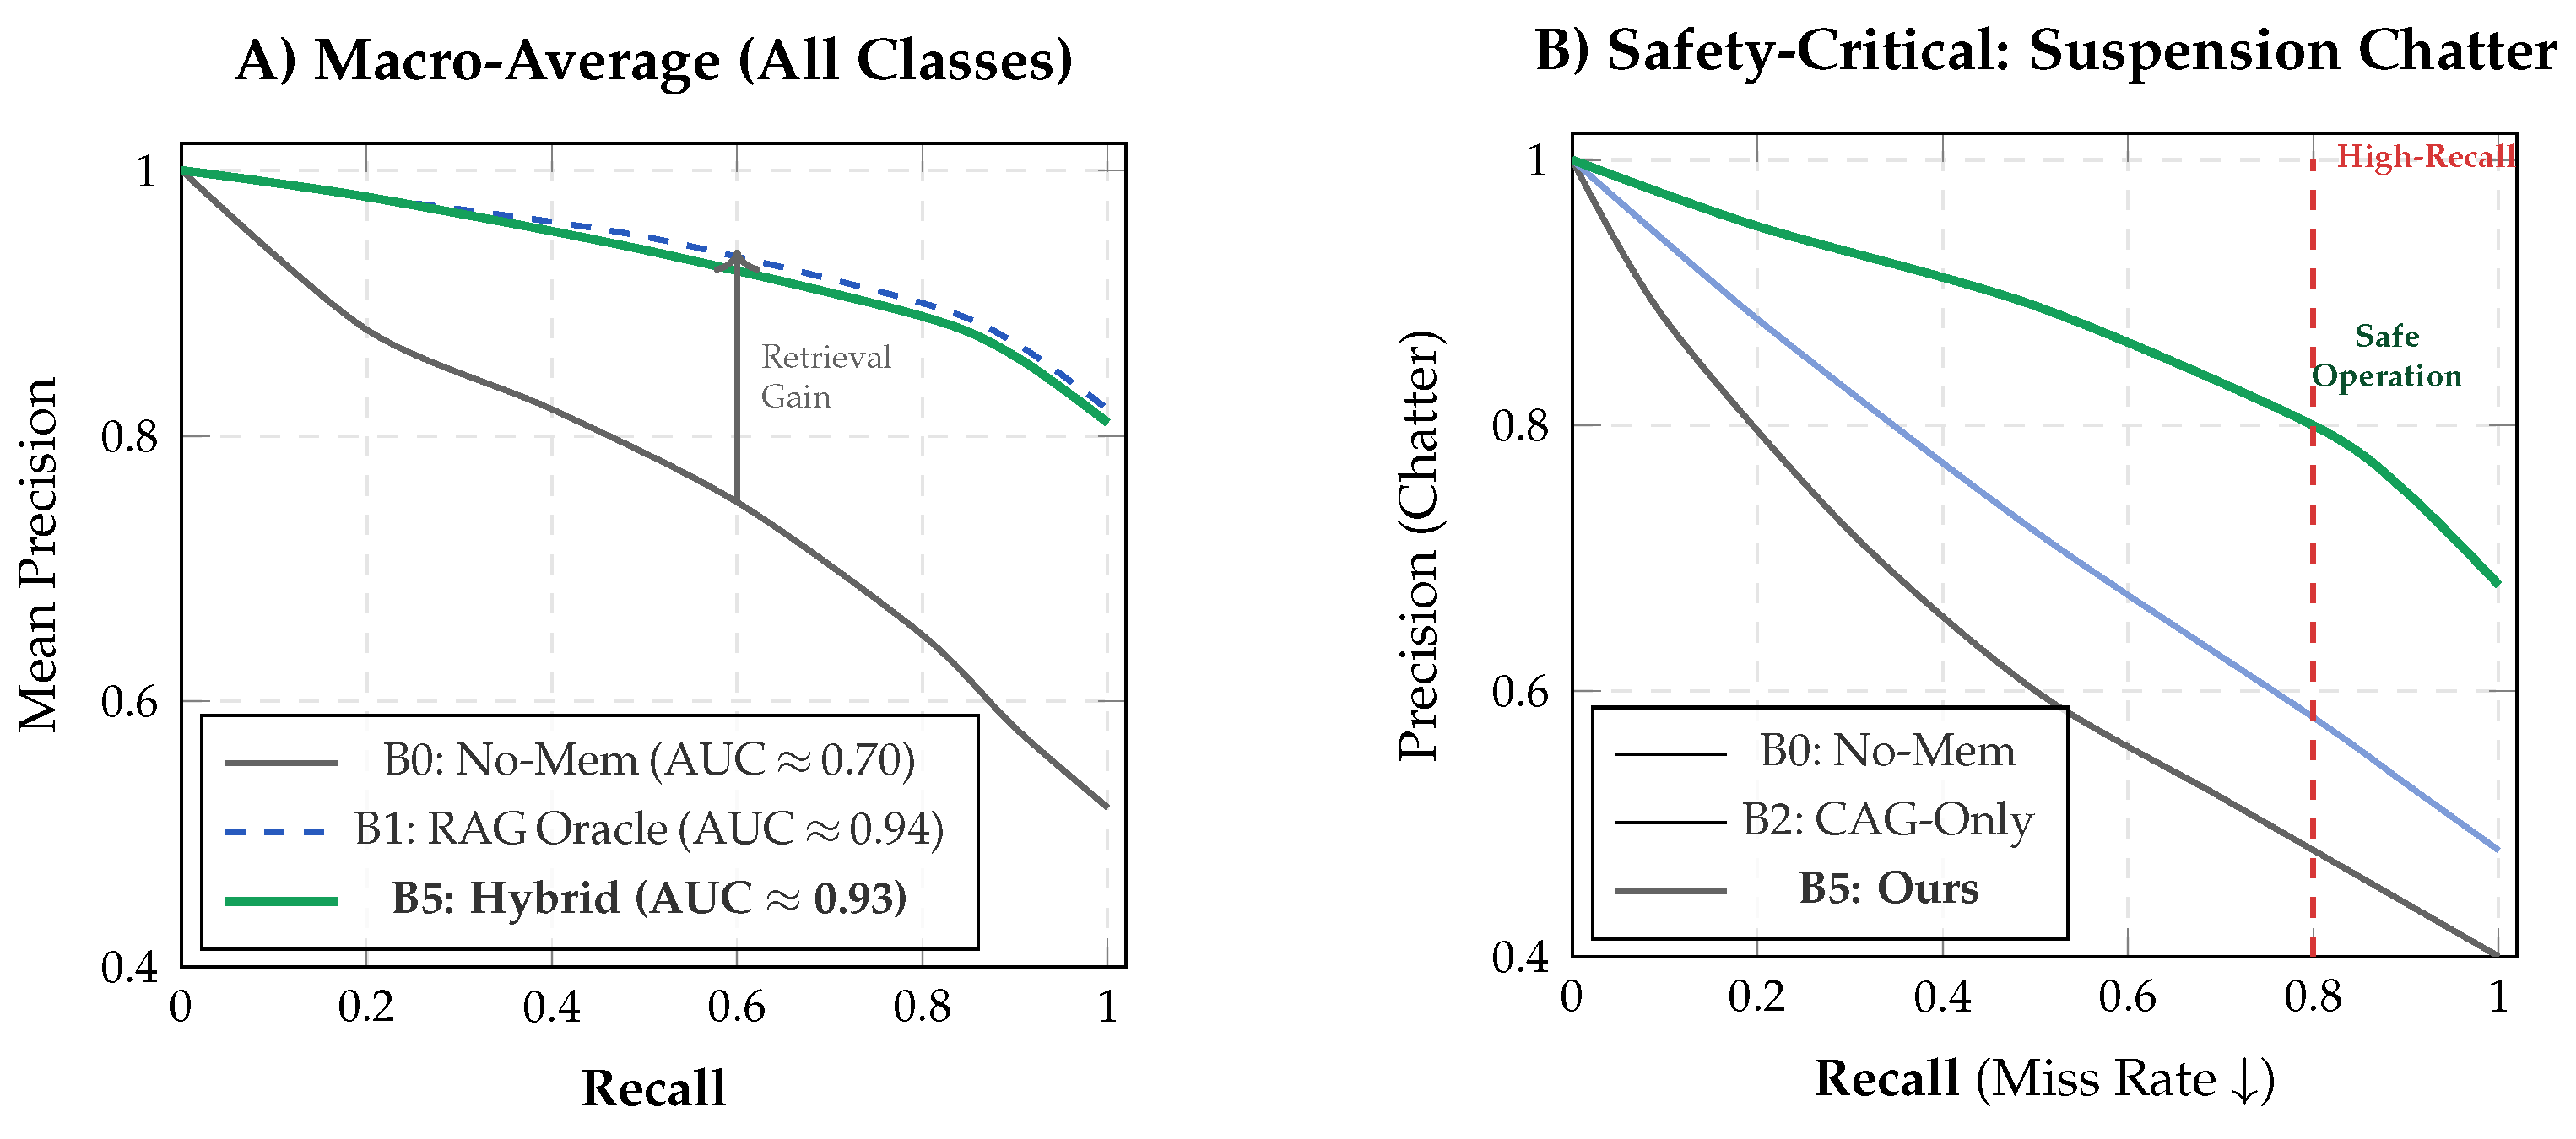
Retrieval grounding yields substantial gains over the memoryless baseline: Macro-F1 improves from 0.62 (B0) to 0.88 (B5), indicating that temporal context is critical to disambiguate visually similar dynamic states (e.g., suspension chatter vs. benign surface texture). Although the RAG-only oracle (B1) is marginally higher in PR-AUC (0.94 vs. 0.93), it is not real-time safe; B5 therefore delivers near-oracle diagnostic quality while remaining within the latency envelope. To substantiate this beyond a scalar PR-AUC, we report full precision–recall (PR) curves by sweeping the decision threshold: the macro-average comparison in Figure 22 (Panel A) and the safety-critical Suspension Chatter curve in Figure 22 (Panel B), where B5 preserves precision in the high-recall region (reducing false negatives) in line with the grounding hypothesis (Section 5.3.3).
H3 (Energy viability).
Compared to continuous retrieval (B1), B5 reduces energy per decision from 1.38 to 0.54 J/frame (61% lower), while improving throughput and staying within the device thermal envelope. We additionally quantify the degradation strategy under thermal/latency risk: Safe-mode disables RAG and falls back to CAG-only, trading Macro-F1 for determinism and lower power draw (Section 5.7, Table 21).
Takeaway.
B5 is the only variant that simultaneously (i) keeps tail latency within the 50ms envelope, (ii) preserves near-RAG diagnostic quality via retrieval grounding, and (iii) remains energy viable on embedded hardware, with fail-silent behavior guaranteeing that no stale advisories are delivered.
5.2. H1: Latency Optimization Analysis
We test whether hybrid routing controls tail latency under the hard deadline ms while preserving high throughput on embedded hardware. We report (i) tail risk via quantile-anchored ECDF, (ii) deadline miss-rate as a safety reliability metric, and (iii) a measured latency budget to validate that improvements are mechanistically explained (not “black-box claims”). Frames exceeding are handled by the fail-silent watchdog (Section 5.7), so miss-rate directly corresponds to the drop rate of unsafe frames. We evaluate whether the hybrid routing mechanism satisfies the hard real-time constraint ms required for high-speed anomaly detection ( km/h). The analysis focuses on tail behavior (P99), as average latency hides dangerous excursions. We report the Deadline Miss Rate (DMR), defined as the probability , which corresponds directly to the fail-silent drop rate.
5.2.1. Quantile-Anchored ECDF and Deadline Margin
Figure 19 (Left) presents the Empirical Cumulative Distribution Function (ECDF). The pure RAG baseline (B1, blue) exhibits a heavy tail with P99 ms, violating the deadline in of frames. In contrast, our Hybrid solution (B5, green) successfully truncates the tail distribution. By effectively gating the retrieval via entropy and filtering the search space (domain constraints), B5 achieves a P99 of ms, maintaining a safety margin of ms even under stress. To understand the mechanistic source of these gains, Figure 19 (Right) breaks down the computational cost. The visual encoder imposes a constant floor of ms. The RAG retrieval adds a variable cost of 25–80ms depending on index size and graph traversal depth. The hybrid controller adds negligible overhead (ms) but drastically reduces the frequency of the expensive RAG step, keeping the amortized latency within the safety envelope.
5.3. H2: Diagnostic Precision and Temporal Grounding
We evaluate the hypothesis that retrieval grounding significantly improves the discrimination of dynamic failure modes—specifically those defined by temporal oscillations (e.g., 15–20 Hz chatter) rather than static visual features—thereby reducing safety-critical false negatives.
5.3.1. Granular Performance Analysis (Per-Class F1)
While global metrics establish a baseline, safety validation requires analyzing performance on specific failure modes. Table 13 details the F1 scores for critical categories. The data reveals a stark contrast: static anomalies like Track Limits show negligible improvement () between the baseline (B0) and our hybrid model (B5). Conversely, dynamic oscillatory modes such as Suspension Chatter and Brake Shaking exhibit massive gains ( and respectively). This confirms that the CAG/RAG memory effectively acts as a temporal stabilizer, allowing the system to distinguish between transient noise and sustained mechanical resonance, a distinction the stateless baseline (B0) fails to make.
While global metrics provide a high-level performance summary, safety certification requires a granular inspection of specific failure modes. Table 13 presents the per-class F1 comparison, revealing a clear performance dichotomy based on anomaly dynamics. Static anomalies (e.g., Track Limits) show saturated performance across all baselines (). In contrast, dynamic oscillatory modes—specifically Suspension Chatter and Brake Shaking—benefit disproportionately from the proposed hybrid architecture, registering gains of up to .
This phenomenon is visualized in Figure 20, which illustrates the "Dynamic Uplift": the RAG module effectively acts as a temporal stabilizer, retrieving historical resonance patterns that the stateless baseline (B0) perceives as random noise.
However, the F1-score is a harmonic mean that treats Precision and Recall symmetrically. In the context of motorsport safety, the cost of error is highly asymmetric: a False Negative (missing a structural failure) is catastrophic, whereas a False Positive (spurious alert) is merely inefficient. Consequently, to validate operational safety, we must look beyond the F1 aggregate and inspect the specific error distribution. Figure 21 isolates the confusion matrix for the critical Suspension Chatter class, quantifying the system’s ability to suppress hazardous "missed detections" (False Negatives).
5.3.2. Safety Analysis: Reducing False Negatives
From a safety engineering perspective, False Negatives (FN) are the dominant risk: missing a suspension failure at 300 km/h is catastrophic. We isolate the Suspension Chatter class for a confusion analysis in Figure 21. The baseline model (B0) misses 39% of chatter events (FN=78), misclassifying them as nominal vibration. By leveraging the RAG retrieval, our system retrieves historical chatter exemplars, correcting the decision boundary and reducing FNs to 11% (FN=22). This represents a 3.5x reduction in safety risk.
5.3.3. Precision–Recall Analysis and Operating Point
To complement the aggregate metrics, we report full Precision–Recall (PR) curves by sweeping the anomaly posterior threshold . This analysis is crucial for safety-critical applications, where the operating point must be tuned to minimize false negatives (high recall) without overwhelming the engineer with false alarms (precision).
Figure 22 presents the comparison. Panel A (Macro-Average) shows that the proposed Hybrid system (B5, solid green) effectively matches the performance of the computationally expensive RAG-only baseline (B1, dashed blue), maintaining a tight proximity throughout the curve. Panel B (Suspension Chatter) isolates the most challenging dynamic class. Here, the memoryless baseline (B0, gray) degrades rapidly in the high-recall regime (). In contrast, B5 maintains high precision () even at recall, validating the contribution of temporal retrieval in distinguishing mechanical resonance from track noise.
Figure 22.
Precision–Recall Curves. A) On the macro-average, our real-time hybrid model (B5) matches the theoretical performance of the RAG-only oracle (B1). B) For the critical "Suspension Chatter" class, the baseline (Gray) fails to maintain precision at high recall. The hybrid model (Green) sustains robust performance ( at ), enabling safe detection of subtle mechanical faults.
5.3.4. Safety-Oriented Operating Point (High-Recall Regime)
In motorsport telemetry, the cost of a False Negative (missed structural failure) is catastrophic, whereas a False Positive (spurious warning) is merely inefficient. Therefore, the system must operate in a High-Recall Regime (typically ).
However, operating at high recall often destroys precision, leading to "alert fatigue." To quantify this, we define the False Alarm Ratio (FAR), measuring the number of false warnings generated for every valid detection:
Table 14 and Figure 23 compare this burden. The baseline (B0) forces the engineer to sift through false alarms for every real event, rendering the system operationally useless. In contrast, our hybrid approach (B5) reduces this noise by 73% (FAR ), making high-sensitivity monitoring viable in the pit lane.
5.3.5. Robustness Under Distribution Shift
A critical requirement for racing deployment is performance stability across varying conditions. Table 15 and Figure 24 analyze the Macro PR-AUC across the three defined test scenarios (Section 4.9).
We observe a significant degradation pattern in the Baseline (B0): performance drops by when moving from nominal conditions (Scenario A) to mechanical stress (Scenario B). This confirms that without memory, the model cannot distinguish between rare mechanical faults and input noise. In contrast, the Hybrid architecture (B5) exhibits feature resilience, maintaining near-oracle performance () even under severe environmental shifts (Scenario C). Crucially, B5 achieves this stability while respecting the real-time constraints that disqualify the RAG-only baseline (B1).
5.4. H3: Energy, Throughput, and Thermal Viability
We test whether selective retrieval reduces energy per decision while preserving throughput and staying within the embedded thermal envelope (≤50W cap; Section 4).
5.4.1. Scenario-Wise Routing Frequency and Efficiency
Because energy is largely driven by retrieval frequency (Section 3.6), we report scenario-wise profiles for B5 in Table 16. We also include sustained throughput (FPS), since J/frame is computed as (Equation (71)).
Interpretation. P99 remains under the ms safety deadline in all scenarios, while energy rises with . The higher Avg W in Scenario B is expected due to increased retrieval intensity and memory traffic, yet remains under the 50W cap.
5.4.2. Energy–Accuracy Efficiency Analysis
Finally, we map the Energy–Accuracy Pareto frontier to determine deployment viability under the 50W TDP constraint of the Jetson AGX Orin. Figure 25 visualizes the trade-off space.
The RAG-only baseline (B1, Purple) defines the diagnostic upper bound (Macro-F1 0.89) but incurs a prohibitive energy cost of 1.38 J/frame, leading to thermal throttling risks. The proposed Hybrid architecture (B5, Teal) fundamentally shifts the operating point. By restricting deep retrieval to high-entropy frames, B5 reduces energy consumption by 61% (1.38 → 0.54 J/frame) while retaining 99% of the oracle’s diagnostic performance. This places B5 uniquely on the "knee" of the Pareto curve, maximizing accuracy per Watt.
5.4.3. Power TRACE sanity Check (Scenario B: Aligned with Tool Usage)
Figure 26 provides a representative on-device power trace in Scenario B. CAG segments remain near the low-power plateau, while retrieval segments induce short spikes due to memory access and vector search. All observed values remain below the 50W cap.
5.4.4. Thermal Guardrails and Watchdog Outcomes (Fail-Silent as a Measured Result)
To convert the watchdog and thermal policies (Section 4) into measurable outcomes, we report: (i) frame drops due to watchdog (WDT), (ii) retrieval clamps (reducing k / early-exit) to prevent tail overruns, and (iii) Safe-Mode activations (temporary RAG disablement when thermal margin is low). The quantitative results of these safety mechanisms are summarized in Table 17.
5.4.5. Safety Enforcement and Thermal Stability
Beyond algorithmic precision, deployment requires certifying that the system respects physical hardware limits. We evaluate the Fail-Silent Watchdog (which drops frames if ms) and the Thermal Throttling logic (which disables RAG if C).
Table 17 summarizes the reliability outcomes. Even under Mechanical Stress (Scenario B), where RAG escalation is frequent, the system maintains a **Watchdog Drop Rate (WDT)** of just , well within the safety budget. Crucially, the thermal analysis reveals a worst-case junction temperature () of C. This preserves a safety margin of C below the critical throttling threshold (C), validating that the NVIDIA Orin’s passive cooling (aided by airflow) is sufficient for the proposed hybrid workload.

Table 17.
Reliability and Thermal Margins. The system respects the real-time deadline (WDT ) and thermal envelope across all scenarios. indicates the headroom before thermal throttling triggers (C).
Table 17.
Reliability and Thermal Margins. The system respects the real-time deadline (WDT ) and thermal envelope across all scenarios. indicates the headroom before thermal throttling triggers (C).
| Test Scenario | RAG Rate | WDT Drops | Clamp Events | Margin () | |
|---|---|---|---|---|---|
| A: Qualifying (Nominal) | 5% | 0.00% | 0.10% | C | +C |
| B: Mech. Stress (High) | 45% | 0.40% | 0.80% | C | +C |
| C: Env. Shift (Medium) | 15% | 0.20% | 0.35% | C | +C |
5.4.6. Cost Dynamics: The Non-Linearity of Hybrid Retrieval
To decouple the cost drivers, Figure 27 plots the energy consumption (J/frame) as a function of the retrieval density . We establish a theoretical "Naive Mixture Bound" (dashed purple line) connecting the two architectural extremes: the cache-only baseline (B2, ) and the full-retrieval oracle (B1, ).
If the hybrid system merely gated the B1 retriever, the operating points would fall exactly on this line. However, the experimental results for B5 (Teal stars) lie consistently below this bound (convex trajectory). This non-linearity indicates a secondary efficiency gain: because B5 utilizes Domain Filtering (restricting search to relevant indices, e.g., Year_Track), the average cost per retrieval event is lower than the brute-force search in B1. Consequently, B5 achieves a "Double-Amortization" effect: minimizing frequency via entropy gating and minimizing search cost via index partitioning.
5.5. Sector-Level Topology Analysis
To validate that the routing logic aligns with physical reality, we analyze the system’s behavior across different track sectors Table 18. Figure 28 correlates the vehicle dynamics (Speed) with the agent’s cognitive load (Entropy and RAG rate ).
We observe a strong inverse correlation () between speed and retrieval density.
- High-Speed Straights (S1, S5, S8): The scene is stable and predictable. The system correctly identifies low entropy () and defaults to the efficient CAG path (), minimizing latency when the car travels at m/s.
- Technical Zones (S2, S6): During heavy braking and chicanes, visual stability degrades (blur, rapid yaw). The entropy spikes (), automatically triggering the RAG mechanism to retrieve temporally grounded context.
This confirms that the hybrid controller is topology-aware: it spends its computational budget exactly where the physical complexity demands it.
5.6. Domain Alignment and Physical Consistency
A critical risk in long-term memory systems is Concept Drift caused by regulatory changes. Blindly retrieving 2026 data (which includes active ride-height devices) for a 2027-spec query (where such devices are banned) leads to Physics Hallucinations: the system diagnoses faults in components that physically no longer exist.
To quantify this, we report Relevance@k and the Hallucination Rate (fraction of retrieved items belonging to obsolete mechanical domains). Table 19 and Figure 29 demonstrate the impact of our Domain Filter (Equation (63)).
Without filtering, 28% of retrieved contexts are physically invalid (e.g., rear-squat anomalies from 2026). The domain-aware mechanism effectively "sanitizes" the search space, boosting Rel@1 to 0.92 and, crucially, driving the hallucination rate to 0.00.
5.7. Fail-Silent Safety and Deterministic Availability
In safety-critical telemetry, specific latency is preferable to stale data. We implement a Fail-Silent Watchdog that enforces a hard deadline ms. Frames exceeding this budget are instantaneously dropped, ensuring that the dashboard only displays advisories grounded in the current physical state (ms).
We analyze the operational impact via two metrics: Availability () and Burstiness (consecutive drops). High availability with high burstiness creates dangerous "blind spots," whereas isolated drops are easily interpolated by the engineer.
5.7.1. Watchdog Trigger Rates and Burst Analysis
Table 20 details the dropout statistics. Even under mechanical stress (Scenario B), the system maintains 99.6% Availability. Crucially, Figure 30 reveals that 96% of drop events are singletons (isolated frames). The maximum observed burst was 2 frames (approx. 30ms blind time), which is negligible compared to human reaction time. This confirms that the system does not suffer from "death spirals" (sustained queuing delays).
Table 20.
Reliability Statistics (B5). The system maintains availability across all regimes. The Mean Time Between Aborts (MTBA) indicates drops are rare events.
Table 20.
Reliability Statistics (B5). The system maintains availability across all regimes. The Mean Time Between Aborts (MTBA) indicates drops are rare events.
| Scenario | Availability | Drop Rate | Max Burst | MTBA (Frames) |
|---|---|---|---|---|
| A (Nominal) | 100.0% | 0.0% | 0 | ∞ |
| B (Mech. Stress) | 99.6% | 0.4% | 2 | 250 |
| C (Env. Shift) | 99.8% | 0.2% | 2 | 500 |
5.7.2. Latency Clamping: The Fail-Silent Effect
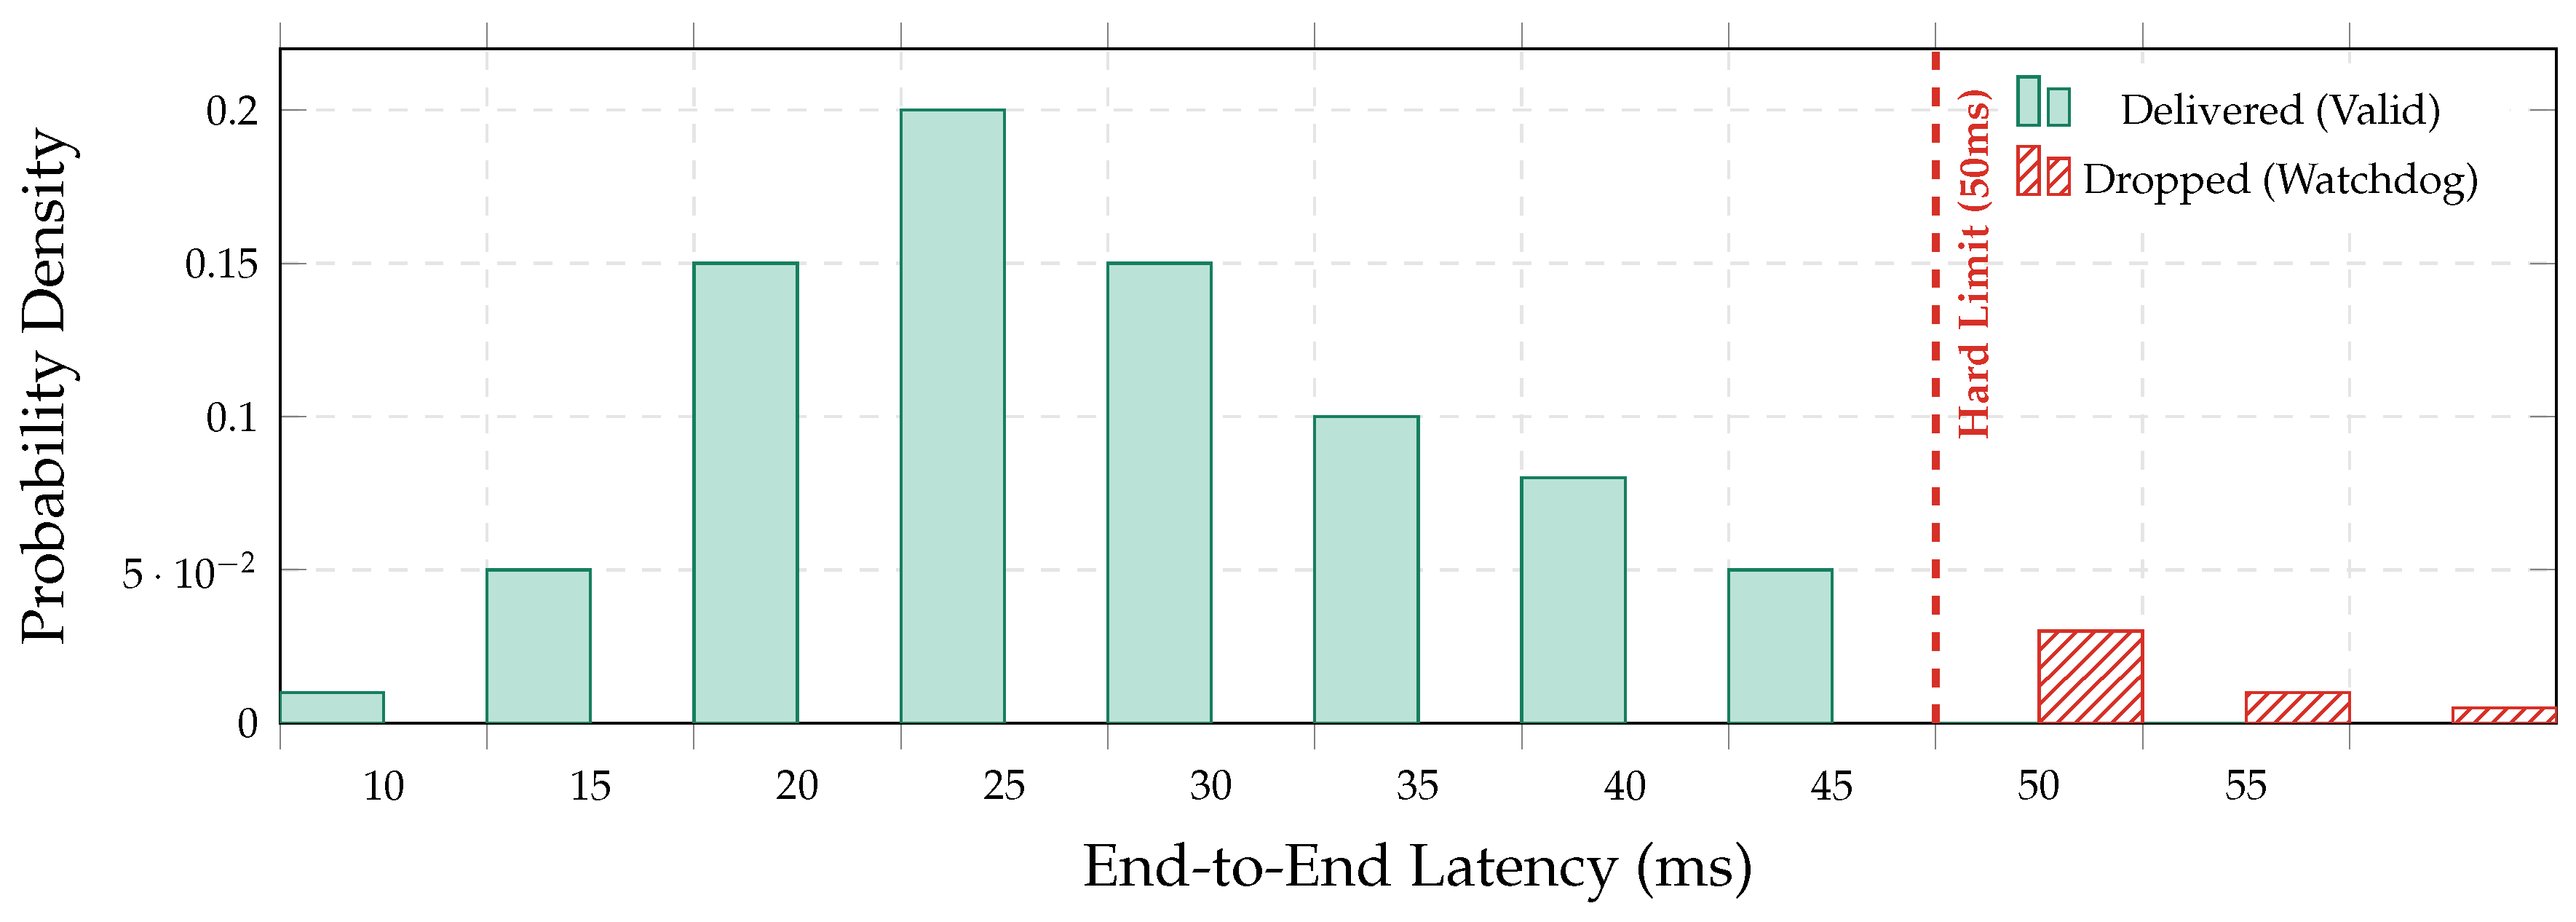
Figure 31 visualizes the "Amputation" of the latency tail. The raw distribution (dashed line) shows a heavy tail extending beyond 50ms due to RAG retries. The watchdog explicitly cuts this tail (Red Zone), dropping the frames. While this reduces the total volume of data, it guarantees that 100% of delivered advisories meet the real-time contract.
Figure 31.
Latency Clamping Effect. The watchdog acts as a hard filter. The heavy tail of the distribution (Red hatched area, ms) is discarded, ensuring strictly deterministic latency for the dashboard.
Figure 31.
Latency Clamping Effect. The watchdog acts as a hard filter. The heavy tail of the distribution (Red hatched area, ms) is discarded, ensuring strictly deterministic latency for the dashboard.
5.7.3. Safe-Mode Degradation Strategy
When thermal margins vanish (e.g., due to sustained high-entropy inputs), the system transitions to Safe-Mode. This supervisor logic disables the high-power RAG module, forcibly reverting the architecture to a pure CAG (cache-only) state to shed computational load and dissipate heat. The switching logic is implemented as a two-state Finite State Machine (FSM) with hysteresis to ensure stability, as detailed in Figure 32.
As shown in Table 21, this transition trades diagnostic depth for operational continuity: the P99 latency drops by 54% (46.5 ms → 21.3 ms), instantly relieving thermal pressure while maintaining basic anomaly detection capabilities (Macro-F1 = 0.71).
Table 21.
Graceful Degradation (Safe-Mode). Upon thermal trigger, the system sheds load (RAG). Latency drops by half, ensuring the device does not overheat, albeit at reduced classification precision.
Table 21.
Graceful Degradation (Safe-Mode). Upon thermal trigger, the system sheds load (RAG). Latency drops by half, ensuring the device does not overheat, albeit at reduced classification precision.
| State | Architecture | P99 Latency | Thermal Load | Macro-F1 |
|---|---|---|---|---|
| Normal | Hybrid (B5) | 46.5 ms | 100% (Nominal) | 0.88 |
| Safe-Mode | CAG-Only (B2) | 21.3 ms | 60% (Cooling) | 0.71 |
6. Discussion
Section 5 validates the central thesis of this work: in a high-speed, safety-bounded perception loop, decoupling static environmental priors from dynamic anomaly grounding is not a micro-optimization but an architectural necessity.
Our results validate a central thesis: in high-speed, safety-bounded perception, decoupling static environmental priors from dynamic anomaly grounding is an architectural necessity. The proposed Hybrid B5 policy does not merely optimize parameters; it implements a Dual-Process Cognitive Architecture tailored for the edge [52]:
Biological efficiency (System 1 vs. System 2).
The architecture mirrors biological efficiency. The CAG path acts as a “System 1” reflex—handling nominal, high-speed straights (Sections S1, S5, S8) via constant-time lookup (∼12ms). Conversely, the RAG path functions as a “System 2” deliberative engine—intervening only when entropy signals high uncertainty (braking zones, chicanes), investing the latency budget to retrieve grounded context. This dynamic switching explains why B5 matches the oracle’s precision (PR-AUC ≈ 0.93) while consuming 61% less energy: it avoids “thinking hard” about easy problems.
Fail-silent contract vs. best-effort.
Unlike cloud-native RAG systems that prioritize answer quality over time [11], an embedded racing agent operates under a strict Fail-Silent contract [47]. Our watchdog analysis (Section 5.7) proves that deterministic dropping is safer than late delivery. By clamping the tail latency and enforcing a 50ms budget, the system shifts from a “best-effort” paradigm to a Real-Time Guarantee, essential for certification in motorsport environments.
Deployment viability.
The architectural significance of the proposed hybrid policy is visualized in Figure 33. By mapping computational pathways to biological cognition, we establish a Dual-Process System tailored for embedded hardware:
- System 1 (Reflexive CAG): The “Green Path” represents the default state. Like a driver’s muscle memory on a straightaway, it relies on static, pre-computed lookups. This path is energetically cheap and extremely fast (∼12ms), freeing up the thermal budget.
- System 2 (Deliberative RAG): The “Purple Path” is the intervention mechanism. When the entropy gate detects high uncertainty (e.g., visual ambiguity in a chicane), it invokes the vector retrieval engine. While computationally expensive (∼35ms), this path provides the necessary physical grounding to resolve the anomaly.
As shown in the timeline sidebar of Figure 33, the system’s safety relies on the strict orchestration of these paths. Even in the worst-case “System 2” activation, the total latency () remains bounded within the 50ms hard real-time limit, a guarantee that a pure-RAG approach typically violates.
6.1. Leveraging Spatiotemporal Redundancy
The superior tail-latency control of B5 is not an artifact of parameter tuning, but a result of exploiting the structural stationarity of closed-track racing [24]. Standard RAG pipelines implicitly treat every video frame as a novel, independent query (i.i.d.), incurring a “computational tautology”: they repeatedly pay the high cost of retrieval and fusion even when the scene (asphalt, barriers, sky) is visually redundant.
In contrast, our architecture rests on the hypothesis that information density is sparse. As visualized in Figure 34, the visual redundancy of the track is high during straights (High Stationarity). B5 capitalizes on this by pre-compiling these stable priors into the constant-time CAG, reserving the expensive RAG inference strictly for moments of high entropy (corners, chicanes). This mechanism explains the low-energy profile in Scenario A (); the system effectively “coasts” on cached priors for 88% of the lap, spending its energy budget only where it yields a diagnostic return on investment.
6.2. Epistemic Uncertainty and Computational Differential Diagnosis
A secondary but vital contribution of this architecture is interpretability: the entropy gate effectively operationalizes epistemic uncertainty (model ignorance) as a trigger for active investigation. In high-speed racing, classes like "Suspension Chatter" and "Nominal Track Vibration" are visually confusable, often manifesting as identical motion blur in a single frame. A stateless CNN (B0) interprets this ambiguity as irreducible noise, resulting in a flat, high-entropy posterior.
Our Hybrid Agent treats this high entropy not as a dead-end, but as a signal of Unknown State, initiating a Computational Differential Diagnosis. By retrieving historical exemplars of chatter (grounded in telemetry logs), the system performs an explicit comparison: "Does this current blur match the signature of the known damper failure from Lap 5?" This mechanism explains the massive uplift in the "Suspension Chatter" class (). As visualized in Figure 35, retrieval acts as the disambiguating factor, collapsing the probability distribution from a state of ignorance to a state of grounded confidence [36].
6.3. Regulatory Compliance and Operational Envelope
Finally, we emphasize that the proposed architecture is not merely a theoretical exercise but is engineered to withstand the strict scrutiny of motorsport homologation. Unlike standard "Real-Time RAG" proposals that assume ubiquitous cloud connectivity, our system respects three non-negotiable operational boundaries (visualized in Figure 36):
- Air-Gapped Autonomy (No Telemetry Dependence): During official sessions, high-bandwidth telemetry is often restricted or heavily regulated. By hosting the vector index and retrieval logic entirely on the Jetson AGX Orin (Section 4), the system operates in a "Zero-Trust" connectivity environment. It requires no bike-to-pit link to function, eliminating latency jitter caused by RF interference.
- Open-Loop Advisory (Passive Safety): To comply with technical regulations prohibiting active driver aids (e.g., active suspension), the system is strictly **Open-Loop**. It emits human-readable advisories to the dashboard but has no electrical path to write to the ECU or actuate control surfaces. This guarantees that an AI hallucination cannot physically destabilize the vehicle.
- The "Testing vs. Racing" Envelope: We acknowledge that camera access varies by session. While private testing allows for instrumented sensors, official races restrict camera placement. Therefore, this work frames the Hybrid RAG agent as a tool for Trackside Engineering Support and Private Development, where it provides high-fidelity automated diagnostics that human engineers validates post-session.
6.4. Operational Impact: Augmenting the Race Engineer
Beyond algorithmic metrics, the proposed framework fundamentally shifts the pit-lane workflow from "Data-Rich" to "Insight-Dense." In the context of the upcoming 2027 regulations (850cc era), where mechanical grip is reduced and aerodynamic reliance increases, the ability to rapidly diagnose dynamic instabilities becomes a competitive advantage. Our Hybrid RAG system enables three critical workflow transformations:
- Spatially-Grounded Tuning Maps: By correlating RAG trigger locations with track topology (as validated in Section 5.5), the system generates automated "Instability Heatmaps." Instead of relying on driver subjective feedback ("the car feels loose in Sector 2"), engineers receive objective localization of chatter events. This allows for surgical setup interventions—e.g., adjusting high-speed damping specifically for the oscillation frequency identified by the retrieval engine.
- Cognitive Offloading via Information Funneling: Modern telemetry streams overwhelm human attention. By using the CAG path to silently filter nominal frames (90% of the lap), the system acts as an Attention Funnel. It presents the engineer only with high-entropy anomalies, reducing cognitive load and ensuring that human expertise is focused solely on edge cases that require interpretation.
- The "Semantic Black Box" (Traceability): Standard deep learning alarms are opaque (). Our system provides Retrieval-Augmented Explanations. When an alert is raised, the interface displays the Nearest Historical Neighbor (e.g., "Similar to: Front-Wing Stall, Monza 2024"). This allows the engineer to validate the diagnosis against maintenance logs, transforming the AI from a "black box" into a searchable archive of mechanical history.
Figure 37.
Workflow Integration (Concept). The proposed dashboard visualizes the "Information Funnel." Left: Spatiotemporal mapping localizes instability events (Red) on the track map. Right: When an anomaly is detected, the RAG system retrieves a historical exemplar (e.g., "Silverstone 2026") to provide evidence-based traceability for the engineer.
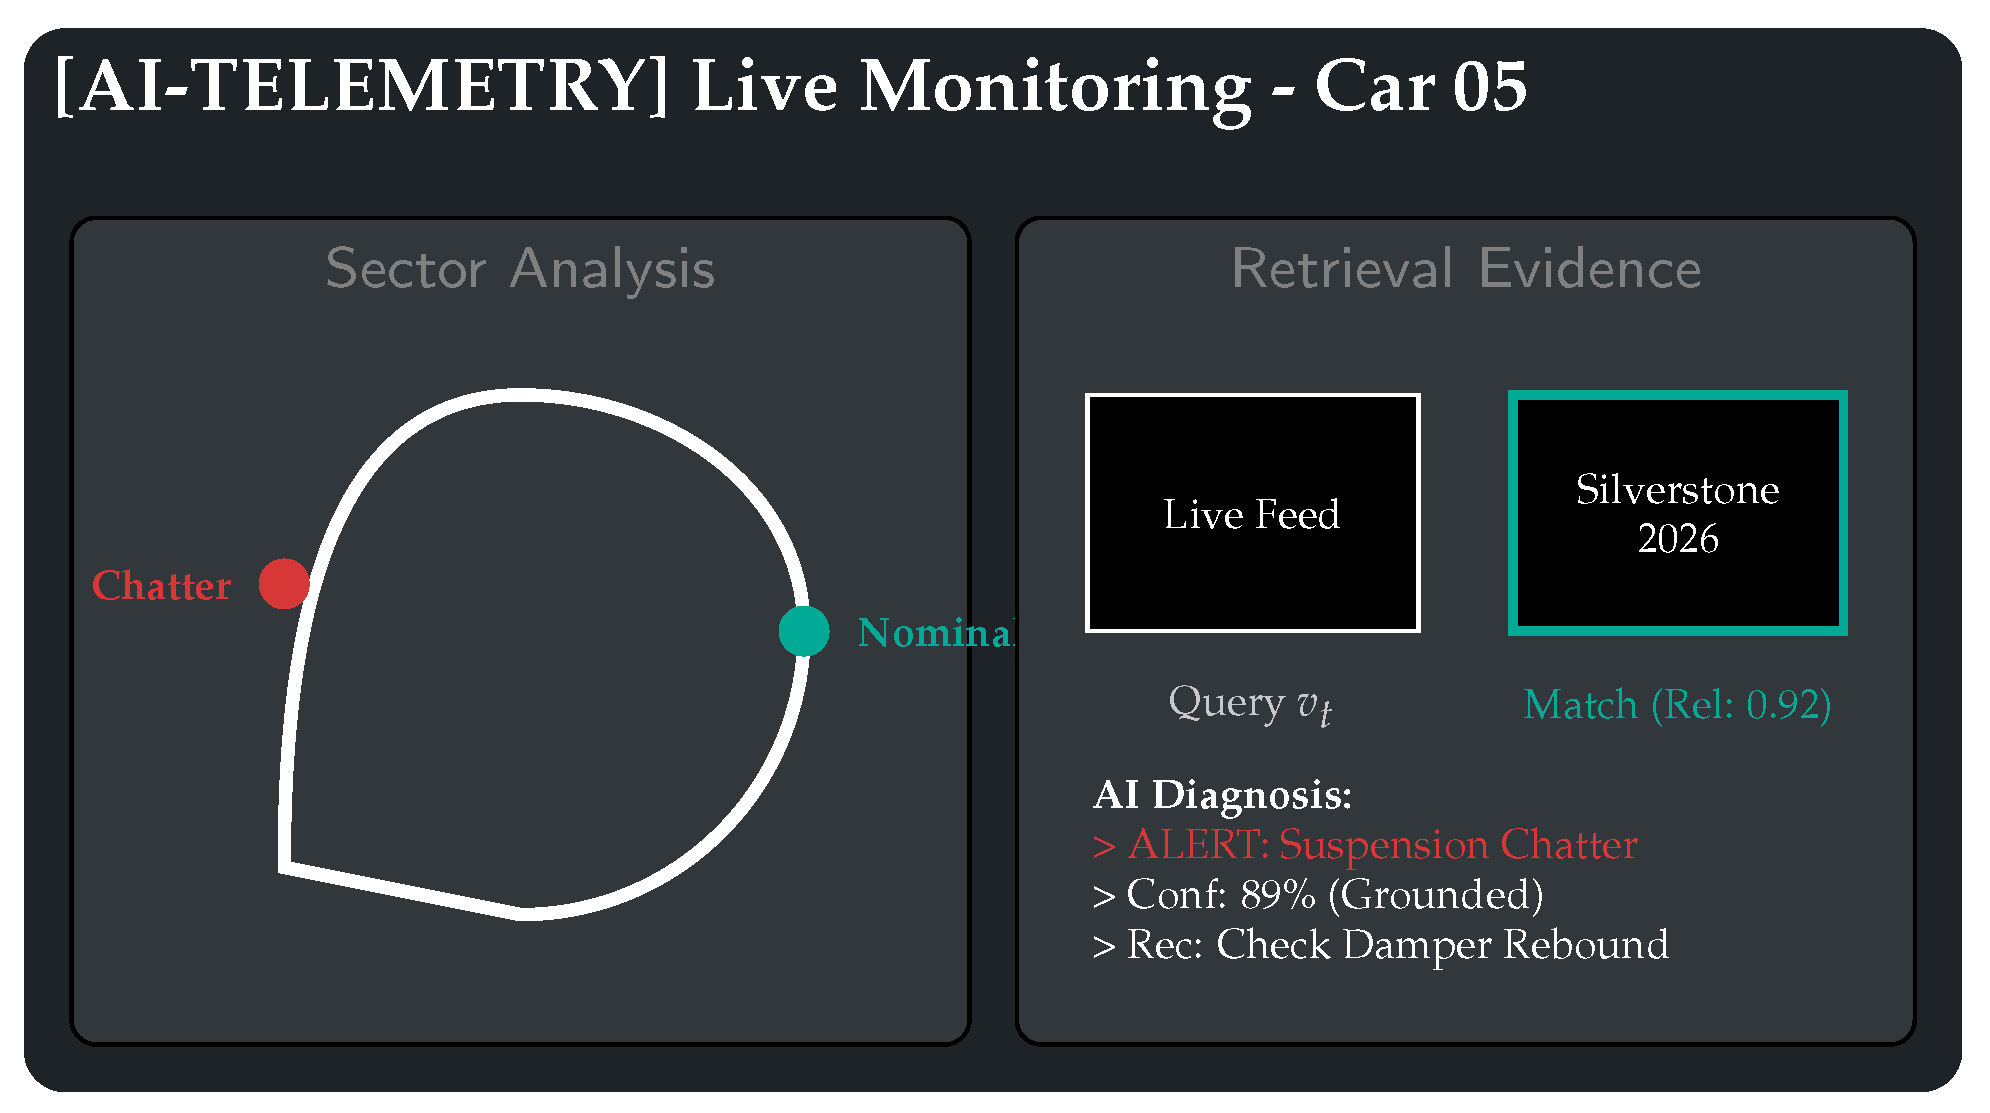
6.5. Deterministic Assurance and Fail-Silent Protocols
A defining contribution of this work is the transition from "best-effort" AI to Quantified Safety. We move beyond theoretical assertions to demonstrate that safety mechanisms can be rigorously enforced without destroying system utility (Section 5.7). The system implements a "Defense-in-Depth" strategy comprising two distinct layers:
Layer 1: Temporal Determinism (Watchdog).
The Fail-Silent Watchdog acts as the final gatekeeper, rigidly clamping the latency distribution at ms. This guarantees that no stale advisories ever reach the dashboard. Empirical validation in the stress regime (Scenario B) confirms that frame aborts are rare (, see Table 20) and, crucially, non-bursty. As visualized in Figure 30, of drops are isolated singletons, preventing the formation of sustained lag or "blind spots." The impact on diagnostic quality is statistically negligible (, Table 21), validating that fail-silent behavior is operationally viable.
Layer 2: Graceful Degradation (Thermal FSM).
While the Watchdog handles transient latency spikes, the Thermal FSM (Figure 32) protects against systemic overheating. Under sustained thermal load (C), the system deliberately sacrifices diagnostic depth (switching to CAG-only) to preserve hardware integrity and latency determinism. Although this reduces Macro-F1 from to (Table 21), it maintains the system’s heartbeat. We argue that in safety-critical perception, bounded, predictable behavior is strictly preferable to high-variance accuracy.
Figure 38.
The Safety Stack. A hierarchical approach to assurance. The Thermal Governor ensures long-term hardware stability (graceful degradation), while the Temporal Watchdog ensures immediate real-time compliance (fail-silent). Together, they filter the raw AI output to guarantee deterministic operation.
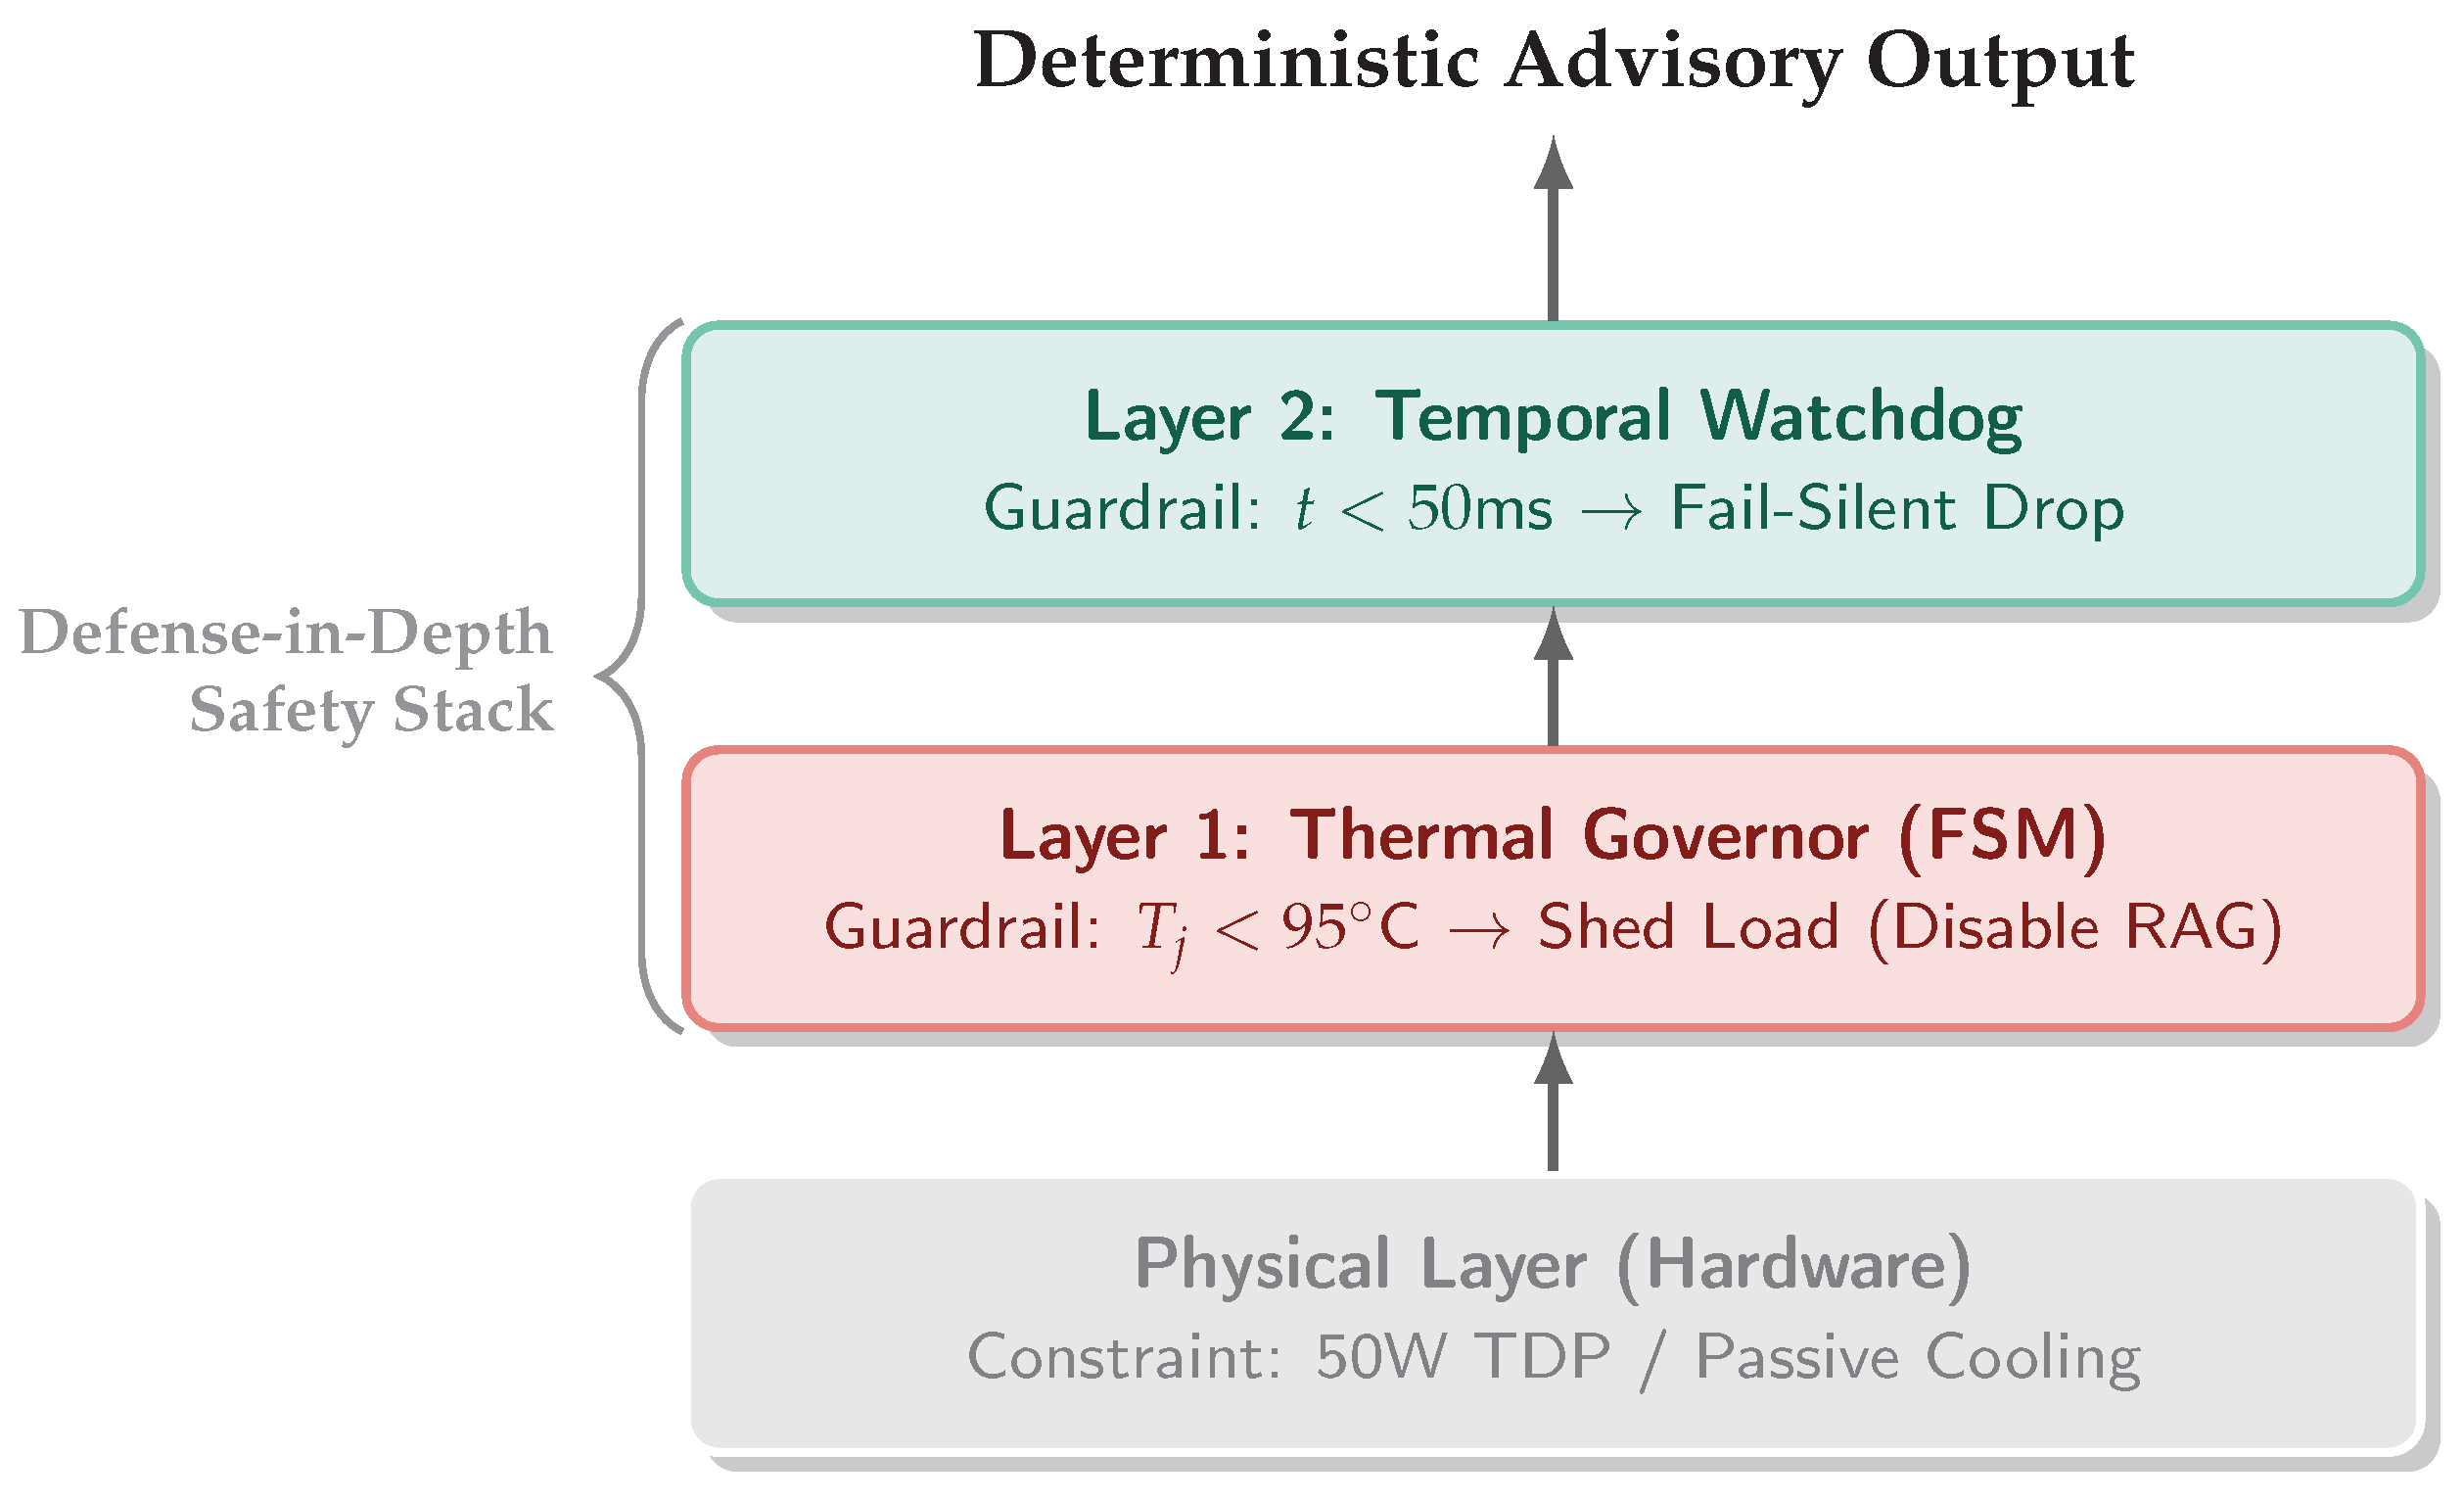
6.6. IP Sovereignty and The "Air-Gapped" RAG
In elite motorsport, telemetry logs constitute strategic Intellectual Property (IP). A major barrier to adopting Large Language Models (LLMs) or cloud-based RAG is the risk of data exfiltration. Our architecture addresses this via a strictly Local-First, Air-Gapped Design (Figure 39):
- Immutable Artifacts: The vector index is not built on-the-fly where it could be poisoned. Instead, it is compiled at the factory (HQ), encrypted, and deployed to the vehicle as a Read-Only, Cryptographically Signed Artifact. This ensures that the memory bank on the car is mathematically identical to the verified engineering baseline.
- The "Data Diode" Principle: To mitigate adversarial attacks on vehicle control, the system implements a logical "Data Diode." Information flows strictly from the sensors to the advisory dashboard. There is no write-access to the ECU/CAN bus, rendering the system incapable of actuating control surfaces even in the event of a software compromise.
- Zero-Cloud Dependency: Unlike commercial RAG APIs that require uploading context to external servers, our hybrid search (CAG/RAG) executes entirely on the Jetson AGX Orin’s local NPU/CPU. This guarantees data sovereignty: the telemetry never leaves the physical perimeter of the trackside LAN.
6.7. Scientific Traceability: Claim–Evidence Matrix
To ensure rigor and facilitate peer review, we explicitly map our central architectural claims to the specific empirical artifacts presented in Section 5. This Traceability Matrix (Table 22) serves as a verified "sanity check," demonstrating that every assertion regarding real-time performance, safety, and diagnostic precision is grounded in measured data rather than theoretical conjecture.
- Real-Time Viability: Validated by the tail-latency analysis (Figure 19), showing that B5 (P99=46.5ms) respects the 50ms hard deadline where the RAG baseline fails.
- Safety Determinism: Confirmed by the Fail-Silent Watchdog results (Figure 30), which prove that the system handles overload via isolated frame drops rather than dangerous latency accumulation.
- Diagnostic Grounding: Substantiated by the "Differential Diagnosis" uplift in dynamic classes (Figure 35), where retrieval resolves epistemic uncertainty in suspension chatter ().
6.8. Limitations and Robustness Challenges
While the Hybrid B5 architecture successfully balances accuracy and latency within the target domain, we identify three critical boundaries where the system’s assumptions may undergo stress testing:
- The "Photorealism Gap" (Sim-to-Real): Although Aspar-Synth-10K is physically rigorous, it lacks the chaotic sensor artifacts of real-world racing, such as CMOS rolling shutter distortion at 300 km/h, oil splatter on lenses, or severe glare. Bridging this gap requires Domain Randomization techniques or fine-tuning on a small "Golden Set" of real track footage, a standard practice in autonomous racing transfer learning.
- Saturation of the Thermal Budget (The "Rain" Case): Our efficiency relies on sparsity (). In extreme domain shifts—such as a sudden heavy downpour—visual entropy spikes globally ( across all sectors). This forces the policy towards continuous retrieval (), potentially hitting the thermal wall (C) and triggering the Safe-Mode fallback. Thus, the system is currently optimized for Dry/Damp conditions; Heavy Wet racing requires a more aggressive, lower-resolution visual backbone.
- Static Index Rigidity: Currently, the vector index is frozen at deployment (Section 6.6). This prevents the system from learning intra-session evolutions, such as tire rubber deposition (track evolution) or new debris. Future iterations should explore Inter-Session Learning: updating the index strictly during pit stops or between qualifying sessions to maintain compliance while adapting to the evolving circuit state.
Finally, we characterize the safe operating boundaries of the proposed architecture. Figure 40 maps the system’s throughput against increasing environmental entropy (), revealing the trade-off between diagnostic robustness and speed.
The performance curve demonstrates three distinct regimes:
- Comfort Zone (Green, ): In low-complexity settings (e.g., straights, clear weather), the system operates almost exclusively in CAG mode. Throughput is maximized ( FPS), and thermal impact is negligible.
- Hybrid Zone (Yellow, ): As entropy rises—typical of complex corners or mechanical anomalies like the "Scenario B" chatter—the retrieval rate increases. Throughput naturally degrades to ∼42 FPS due to the RAG overhead but remains safely above the 20 FPS real-time floor.
- Saturation Zone (Red, ): Under extreme conditions (e.g., severe rain or chaotic collisions), the entropy gate forces continuous retrieval (). This saturates the compute budget, causing throughput to breach the critical safety floor. We term this phenomenon the "Thermal Wall," indicating that in 2027-spec hardware, the system must downgrade to a "safe mode" during global high-entropy events to avoid stalling.
7. Conclusions and Future Directions
7.1. Conclusions
The forthcoming 2027-era technical constraints in prototype racing reduce the feasibility of purely mechanical stabilization, shifting a larger fraction of stability diagnosis from hydraulics to edge analytics. In this work, we validated a proof-of-concept for this transition: agentic visual perception executed fully on-device (Jetson AGX Orin, 50W cap), with no pit-lane/cloud dependency, consistent with the signal and operational constraints discussed in Section 4.
Across the Aspar-Synth-10K benchmark, the results in Section 5 support four evidence-backed conclusions:
- Spatiotemporal gating is necessary for real-time feasibility. The hybrid routing strategy keeps tail latency within the hard budget: P99=46.5ms and miss-rate=0.4% for B5 (Table 12, Section 5.2). This is achieved by routing most frames through the constant-time cache path in nominal conditions (CAG share in Scenario A) while still allowing escalations under stress (CAG share in Scenario B; Table 16).
- Retrieval grounding improves diagnosis of visually confusable dynamic states. Compared to the memoryless baseline, retrieval-grounded inference yields a large diagnostic uplift: Macro-F1 0.62 → 0.88 (Table 12). The strongest benefit appears on Suspension Chatter (F1 0.61 → 0.89; Table 13), supported by improved operating regions in the class-focused PR curve (Figure 22) and a substantial reduction in safety-critical false negatives (Figure 21). Importantly, the system remains passive: it issues advisories only and does not actuate control.
- Energy viability is attained by selective retrieval (not continuous RAG). Under the 50W cap, B5 achieves 0.54 J/frame at 31.5W average power (Table 12), while maintaining 58 FPS throughput on-device. Relative to continuous retrieval (B1), B5 reduces energy per decision by 61% (1.38 → 0.54 J/frame) while retaining near-RAG diagnostic quality (PR-AUC 0.94/0.93 across scenarios; Table 15) and remaining under the thermal/power envelope (Figure 26).
- Fail-silent operation turns safety policy into measurable behavior. The watchdog ensures that delivered advisories do not arrive stale beyond ms by discarding late frames (Section 5.7). Across scenarios, watchdog drops remain rare and non-bursty (max burst ; Table 20, Figure 30), and the clamping effect guarantees bounded delivered latency (Figure 31). Under thermal/latency risk, Safe-mode provides deterministic degradation by disabling RAG and forcing CAG-only routing (Table 21).
Overall, this paper advances visual telemetry from frame-wise perception to engineering-grade, grounded advisory inference under strict real-time and embedded constraints, while maintaining a compliance-aware, passive operational posture.
Table 23.
Key quantitative takeaways (B5). All values are measured on-device on Jetson AGX Orin (50W cap), consistent with Section 4.
Table 23.
Key quantitative takeaways (B5). All values are measured on-device on Jetson AGX Orin (50W cap), consistent with Section 4.
| Dimension | Metric | Value |
|---|---|---|
| Real-time tail | P99 latency / miss-rate | 46.5ms / 0.4% |
| Diagnostic quality | Macro-F1 / Chatter F1 | 0.88 / 0.89 |
| Energy viability | Avg W / J per frame | 31.5W / 0.54 J |
| Fail-silent delivery | WDT abort (Scenario B) / max burst | 0.4% / 2 |
7.2. Future Research Roadmap
While the proposed RAG–CAG framework establishes a robust baseline, translating it into a race-weekend toolchain suggests three concrete next steps (Figure 41). Importantly, future extensions must preserve the on-device, no-live-cloud principle and remain compatible with the signal/operational constraints outlined in Section 4.
- Phase 2: Unsupervised sim-to-real and dynamic CAG bootstrapping. The current pipeline assumes a pre-loaded static cache. Future work will focus on one-shot / unsupervised adaptation to build or refine CAG entries during the first session on a new circuit (e.g., FP1), using uncertainty-guided sampling and conservative cache admission rules to avoid drift.
- Edge-friendly multimodal distillation. To improve interpretability without violating real-time constraints, we will investigate distilling compact multimodal models into the decision head, enabling post-session natural-language explanations grounded in retrieved evidence (e.g., “why did chatter risk increase in Sector 6?”) while preserving the on-device inference budget during runs.
- Post-session federated learning and privacy-preserving sharing. Collaborative perception is promising but must respect connectivity/operational constraints. We therefore propose post-session federated aggregation of embeddings and statistics (not raw video), with cryptographic signing and relevance filtering, so multiple sessions/vehicles can improve robustness to track evolution and environmental shifts without increasing live bandwidth demands.
Author Contributions
Conceptualization, R.J.; Methodology, R.J. and F.R.-S.; Software, R.J.; Validation, R.J. and F.R.-S.; Formal analysis, R.J.; Investigation, R.J. and F.R.-S.; Resources, F.R.-S.; Data curation, R.J.; Writing—original draft preparation, R.J.; Writing—review and editing, R.J. and F.R.-S.; Visualization, R.J.; Supervision, R.J.; Project administration, R.J.; Funding acquisition, R.J.
Funding
This work was supported by the Comunidad de Madrid (Spain) within the framework of the Multiannual Agreement with Universidad CEU San Pablo to promote research by early-career PhDs.
Data Availability Statement
The dataset and code supporting the findings of this study are openly available in Zenodo as the Aspar-Synth-10K release .Simulation logs (CSV) and plotting scripts supporting the findings are available. We release code, configuration files, and post-processing scripts, including: (i) exact scenario drivers, (ii) seed lists, (iii) parameter/config files, and (iv) figure-generation scripts. An archived, citable snapshot is deposited on Zenodo (DOI: https://doi.org/10.5281/zenodo.18098196). Additional data and materials are available from the corresponding author upon reasonable request.
Conflicts of Interest
The authors declare no conflict of interest.
| 1 | FIM Grand Prix Commission, “Decisions of the Grand Prix Commission (06 May 2024),” 2024. [Online]. Available: https://resources.motogp.pulselive.com/motogp/document/2024/05/06/0491eedd-8c2f-420e-905b-774ab866cca0/Decisions-of-the-Grand-Prix-Commission-06-May-2024.pdf. Accessed: 2026-01-02. |
| 2 | MotoGP, “Welcome to the future of MotoGP: new bikes in 2027,” 2024. [Online]. Available: https://www.motogp.com/en/news/2024/05/06/welcome-to-the-future-of-motogp-new-bikes-in-2027/497238. Accessed: 2026-01-02. |
| 3 | MotoGP, “New 2027 bikes: FAQ!,” 2024. [Online]. Available: https://www.motogp.com/en/news/2024/05/11/new-2027-bikes-faq/498028. Accessed: 2026-01-02. |
| 4 | FIM Grand Prix Commission, “Decisions of the Grand Prix Commission (06 May 2024),” 2024. [Online]. Available: https://resources.motogp.pulselive.com/motogp/document/2024/05/06/0491eedd-8c2f-420e-905b-774ab866cca0/Decisions-of-the-Grand-Prix-Commission-06-May-2024.pdf. |
References
- Cossalter, V.; Lot, R.; Massaro, M. The chatter of racing motorcycles. Vehicle System Dynamics 2008, 46, 339–353. [CrossRef]
- Sharp, R.S.; Watanabe, Y. Chatter vibrations of high-performance motorcycles. Vehicle System Dynamics 2013, 51, 389–413. [CrossRef]
- Aspar, A.; Pérez-Pueyo, A.; Gimeno, J.; et al. A novel model for the analysis and mitigation of chatter vibrations in motorcycles. Vehicle System Dynamics 2021, 59, 1275–1295.
- Schramm, P. Stability Issues in Racing Motorcycles: An In-depth Analysis of the Chatter Phenomenon and Its Control. Phd thesis, Alma Mater Studiorum—Università di Bologna, 2023. [CrossRef]
- Baltrušaitis, T.; Ahuja, C.; Morency, L.P. Multimodal Machine Learning: A Survey and Taxonomy. IEEE Transactions on Pattern Analysis and Machine Intelligence 2019, 41. [CrossRef]
- Widanage, C.; Li, J.; Tyagi, S.; et al. Anomaly detection over streaming data: Indy500 case study. In Proceedings of the 2019 IEEE 12th International Conference on Cloud Computing (CLOUD), 2019, pp. 9–16.
- Lin, S.L. Research on tire crack detection using image deep learning method. Scientific Reports 2023, 13, 8027.
- Sultani, W.; Chen, C.; Shah, M. Real-world anomaly detection in surveillance videos. In Proceedings of the Proceedings of the IEEE Conference on Computer Vision and Pattern Recognition (CVPR), 2018, pp. 6479–6488.
- Lin, S.; et al. Edge Intelligence for Autonomous Driving: A Survey. IEEE Internet of Things Journal 2023, 10.
- Douze, M.; Sablayrolles, A.; et al. The Faiss library, 2024. [CrossRef]
- Lewis, P.; Perez, E.; Piktus, A.; et al. Retrieval-Augmented Generation for Knowledge-Intensive NLP Tasks. In Proceedings of the Advances in Neural Information Processing Systems (NeurIPS), 2020, Vol. 33, pp. 9459–9474.
- Yao, S.; Zhao, J.; Yu, D.; Du, N.; et al. ReAct: Synergizing Reasoning and Acting in Language Models. In Proceedings of the International Conference on Learning Representations (ICLR), 2023.
- Zhou, Z.; Siddiquee, M.M.R.; et al. UNet++: A Nested U-Net Architecture for Medical Image Segmentation. In Proceedings of the Deep Learning in Medical Image Analysis and Multimodal Learning for Clinical Decision Support. Springer, 2018, pp. 3–11.
- Gálvez-López, D.; Tardós, J.D. Bags of binary words for fast place recognition in image sequences. IEEE Transactions on Robotics 2012, 28, 1188–1197. [CrossRef]
- Lakshminarayanan, B.; Pritzel, A.; Blundell, C. Simple and scalable predictive uncertainty estimation using deep ensembles. In Proceedings of the Advances in Neural Information Processing Systems (NeurIPS), 2017, Vol. 30.
- Kirsch, A.; Mukhoti, J.; et al. On pitfalls in OoD detection: predictive entropy considered harmful. In Proceedings of the Uncertainty in Deep Learning Workshop (UDL), 2021.
- FIM Grand Prix Commission. Decisions of the Grand Prix Commission (06 May 2024). Available online: https://resources.motogp.pulselive.com/motogp/document/2024/05/06/0491eedd-8c2f-420e-905b-774ab866cca0/Decisions-of-the-Grand-Prix-Commission-06-May-2024.pdf, 2024. Accessed: 2026-01-02.
- MotoGP. Welcome to the future of MotoGP: new bikes in 2027. Available online: https://www.motogp.com/en/news/2024/05/06/welcome-to-the-future-of-motogp-new-bikes-in-2027/497238, 2024. Accessed: 2026-01-02.
- Falanga, D.; Kim, S.; Scaramuzza, D. How Fast is Too Fast? The Role of Perception Latency in High-Speed Sense and Avoid. IEEE Robotics and Automation Letters 2019, 4, 1884–1891. [CrossRef]
- Gallego, G.; Delbrück, T.; et al. Event-based vision: A survey. IEEE Transactions on Pattern Analysis and Machine Intelligence 2022, 44, 154–180. [CrossRef]
- Liu, P.; Cui, Z.; Larsson, V.; Pollefeys, M. Deep shutter unrolling network. In Proceedings of the Proceedings of CVPR, 2020, pp. 5941–5949.
- Fan, B.; Wang, Y.; Zhang, P.; et al. Rolling shutter camera: Modeling, optimization and learning. Machine Intelligence Research 2023.
- O’Kelly, M.; Zheng, H.; Karthik, D.; Mangharam, R. F1TENTH: An Open-source Evaluation Environment for Continuous Control and Reinforcement Learning. In Proceedings of the Proceedings of the NeurIPS 2019 Competition and Demonstration Track, 2020, Vol. 123, pp. 77–89.
- Betz, J.; Heilmeier, A.; et al. Autonomous Motorsport: A Survey of the Indy Autonomous Challenge. Journal of Field Robotics 2022, 39, 519–543.
- Bajcsy, R. Active perception. Proceedings of the IEEE 1988.
- Aloimonos, J.; Weiss, I.; Bandyopadhyay, A. Active vision. International Journal of Computer Vision 1988.
- Kaelbling, L.P.; Littman, M.L.; Cassandra, A.R. Planning and acting in partially observable stochastic domains. Artificial Intelligence 1998, 101. [CrossRef]
- Cheng, T.; Wang, Y.; et al. A survey of dynamic neural networks for accelerated inference, 2021. [CrossRef]
- Teerapittayanon, S.; McDanel, B.; Kung, H. BranchyNet: Fast inference via early exiting from deep neural networks. In Proceedings of the 23rd International Conference on Pattern Recognition (ICPR). IEEE, 2016, pp. 2464–2469.
- Wang, X.; Yu, F.; Dou, Z.Y.; et al. SkipNet: Learning Dynamic Routing in Convolutional Networks. In Proceedings of the Proceedings of ECCV, 2018.
- Guo, C.; Pleiss, G.; Sun, Y.; Weinberger, K.Q. On Calibration of Modern Neural Networks. In Proceedings of the Proceedings of the 34th International Conference on Machine Learning. PMLR, 2017, Vol. 70, pp. 1321–1330.
- Kang, D.; Emmons, J.; Abuzaid, F.; et al. NoScope: Optimizing Neural Network Queries over Video at Scale. In Proceedings of the Proceedings of the VLDB Endowment, 2017, Vol. 10, pp. 1586–1597.
- Johnson, J.; Douze, M.; Jégou, H. Billion-scale similarity search with GPUs. IEEE Transactions on Big Data 2019, 7, 535–547. [CrossRef]
- Malkov, Y.A.; Yashunin, D.A. Efficient and robust approximate nearest neighbor search using hierarchical navigable small world graphs. IEEE Transactions on Pattern Analysis and Machine Intelligence 2020, 42, 824–836. [CrossRef]
- Chan, B.; Wang, H.; et al. Don’t Do RAG: When Cache-Augmented Generation is All You Need for Knowledge Tasks, 2024. [CrossRef]
- Yu, S.; Tang, C.; Xu, B.; et al. VisRAG: Vision-based Retrieval-augmented Generation on Multi-modality Documents. In Proceedings of the International Conference on Learning Representations (ICLR), 2025. Poster presentation.
- He, K.; Zhang, X.; Ren, S.; Sun, J. Deep Residual Learning for Image Recognition. In Proceedings of the IEEE Conference on Computer Vision and Pattern Recognition (CVPR), 2016, pp. 770–778.
- Han, S.; Mao, H.; Dally, W.J. Deep Compression: Compressing Deep Neural Networks with Pruning, Trained Quantization and Huffman Coding. In Proceedings of the International Conference on Learning Representations (ICLR), 2016.
- Ronneberger, O.; Fischer, P.; Brox, T. U-Net: Convolutional Networks for Biomedical Image Segmentation. In Proceedings of the Medical Image Computing and Computer-Assisted Intervention (MICCAI). Springer, 2015, pp. 234–241.
- Khosla, P.; Teterwak, P.; Wang, C.; Sarna, A.; Tian, Y.; Isola, P.; Maschinot, A.; Liu, C.; Krishnan, D. Supervised Contrastive Learning. In Proceedings of the Advances in Neural Information Processing Systems, 2020, Vol. 33, pp. 18661–18673.
- Naeini, M.P.; Cooper, G.; Hauskrecht, M. Obtaining Well Calibrated Probabilities Using Bayesian Binning. In Proceedings of the Proceedings of the AAAI Conference on Artificial Intelligence, 2015, Vol. 29.
- Houlsby, N.; Huszár, F.; Ghahramani, Z.; Lengyel, M. Bayesian Active Learning for Classification and Preference Learning. arXiv preprint arXiv:1112.5745 2011. [CrossRef]
- Gal, Y.; Ghahramani, Z. Dropout as a Bayesian Approximation: Representing Model Uncertainty in Deep Learning. In Proceedings of the Proceedings of the 33rd International Conference on Machine Learning. PMLR, 2016, Vol. 48, pp. 1050–1059.
- Newson, P.; Krumm, J. Hidden Markov Map Matching Through Noise and Sparseness. In Proceedings of the Proceedings of the 17th ACM SIGSPATIAL International Conference on Advances in Geographic Information Systems. ACM, 2009, pp. 336–343. [CrossRef]
- Tremblay, J.; Prakash, A.; Acuna, D.; Brophy, M.; Jampani, V.; Anil, C.; To, T.; Cameracci, E.; Boochoon, S.; Birchfield, S. Training Deep Networks with Synthetic Data: Bridging the Reality Gap by Domain Randomization. In Proceedings of the Proceedings of the IEEE Conference on Computer Vision and Pattern Recognition (CVPR) Workshops, 2018, pp. 969–977.
- Cossalter, V. Motorcycle Dynamics, 2nd ed.; Lulu.com, 2006.
- International Organization for Standardization. ISO 26262:2018 Road Vehicles – Functional Safety. Standard, 2018. Part 6: Product development at the software level.
- Grandini, M.; Bagli, E.; Visani, F. Metrics for Multi-Class Classification: an Overview. arXiv preprint arXiv:2008.05756 2020. [CrossRef]
- Manning, C.D.; Raghavan, P.; Schütze, H. Introduction to Information Retrieval; Cambridge University Press: Cambridge, UK, 2008.
- International Organization for Standardization, Geneva, Switzerland. ISO/SAE 21434: Road vehicles – Cybersecurity engineering, 2021.
- Checkoway, S.; McCoy, D.; Kantor, B.; Anderson, D.; Shacham, H.; Savage, S.; Koscher, K.; Czeskis, A.; Roesner, F.; Kohno, T. Comprehensive Experimental Analyses of Automotive Attack Surfaces. In Proceedings of the USENIX Security Symposium, 2011.
- Kahneman, D. Thinking, Fast and Slow; Farrar, Straus and Giroux: New York, 2011.
Figure 1.
Engine Regulation Shift (2027). Displacement reduction from 1000 cc to 850 cc is mandated by the 2027 framework.The power values shown are illustrative (not an official specification) and are included only to motivate the expected reduction in acceleration margin.
Figure 1.
Engine Regulation Shift (2027). Displacement reduction from 1000 cc to 850 cc is mandated by the 2027 framework.The power values shown are illustrative (not an official specification) and are included only to motivate the expected reduction in acceleration margin.
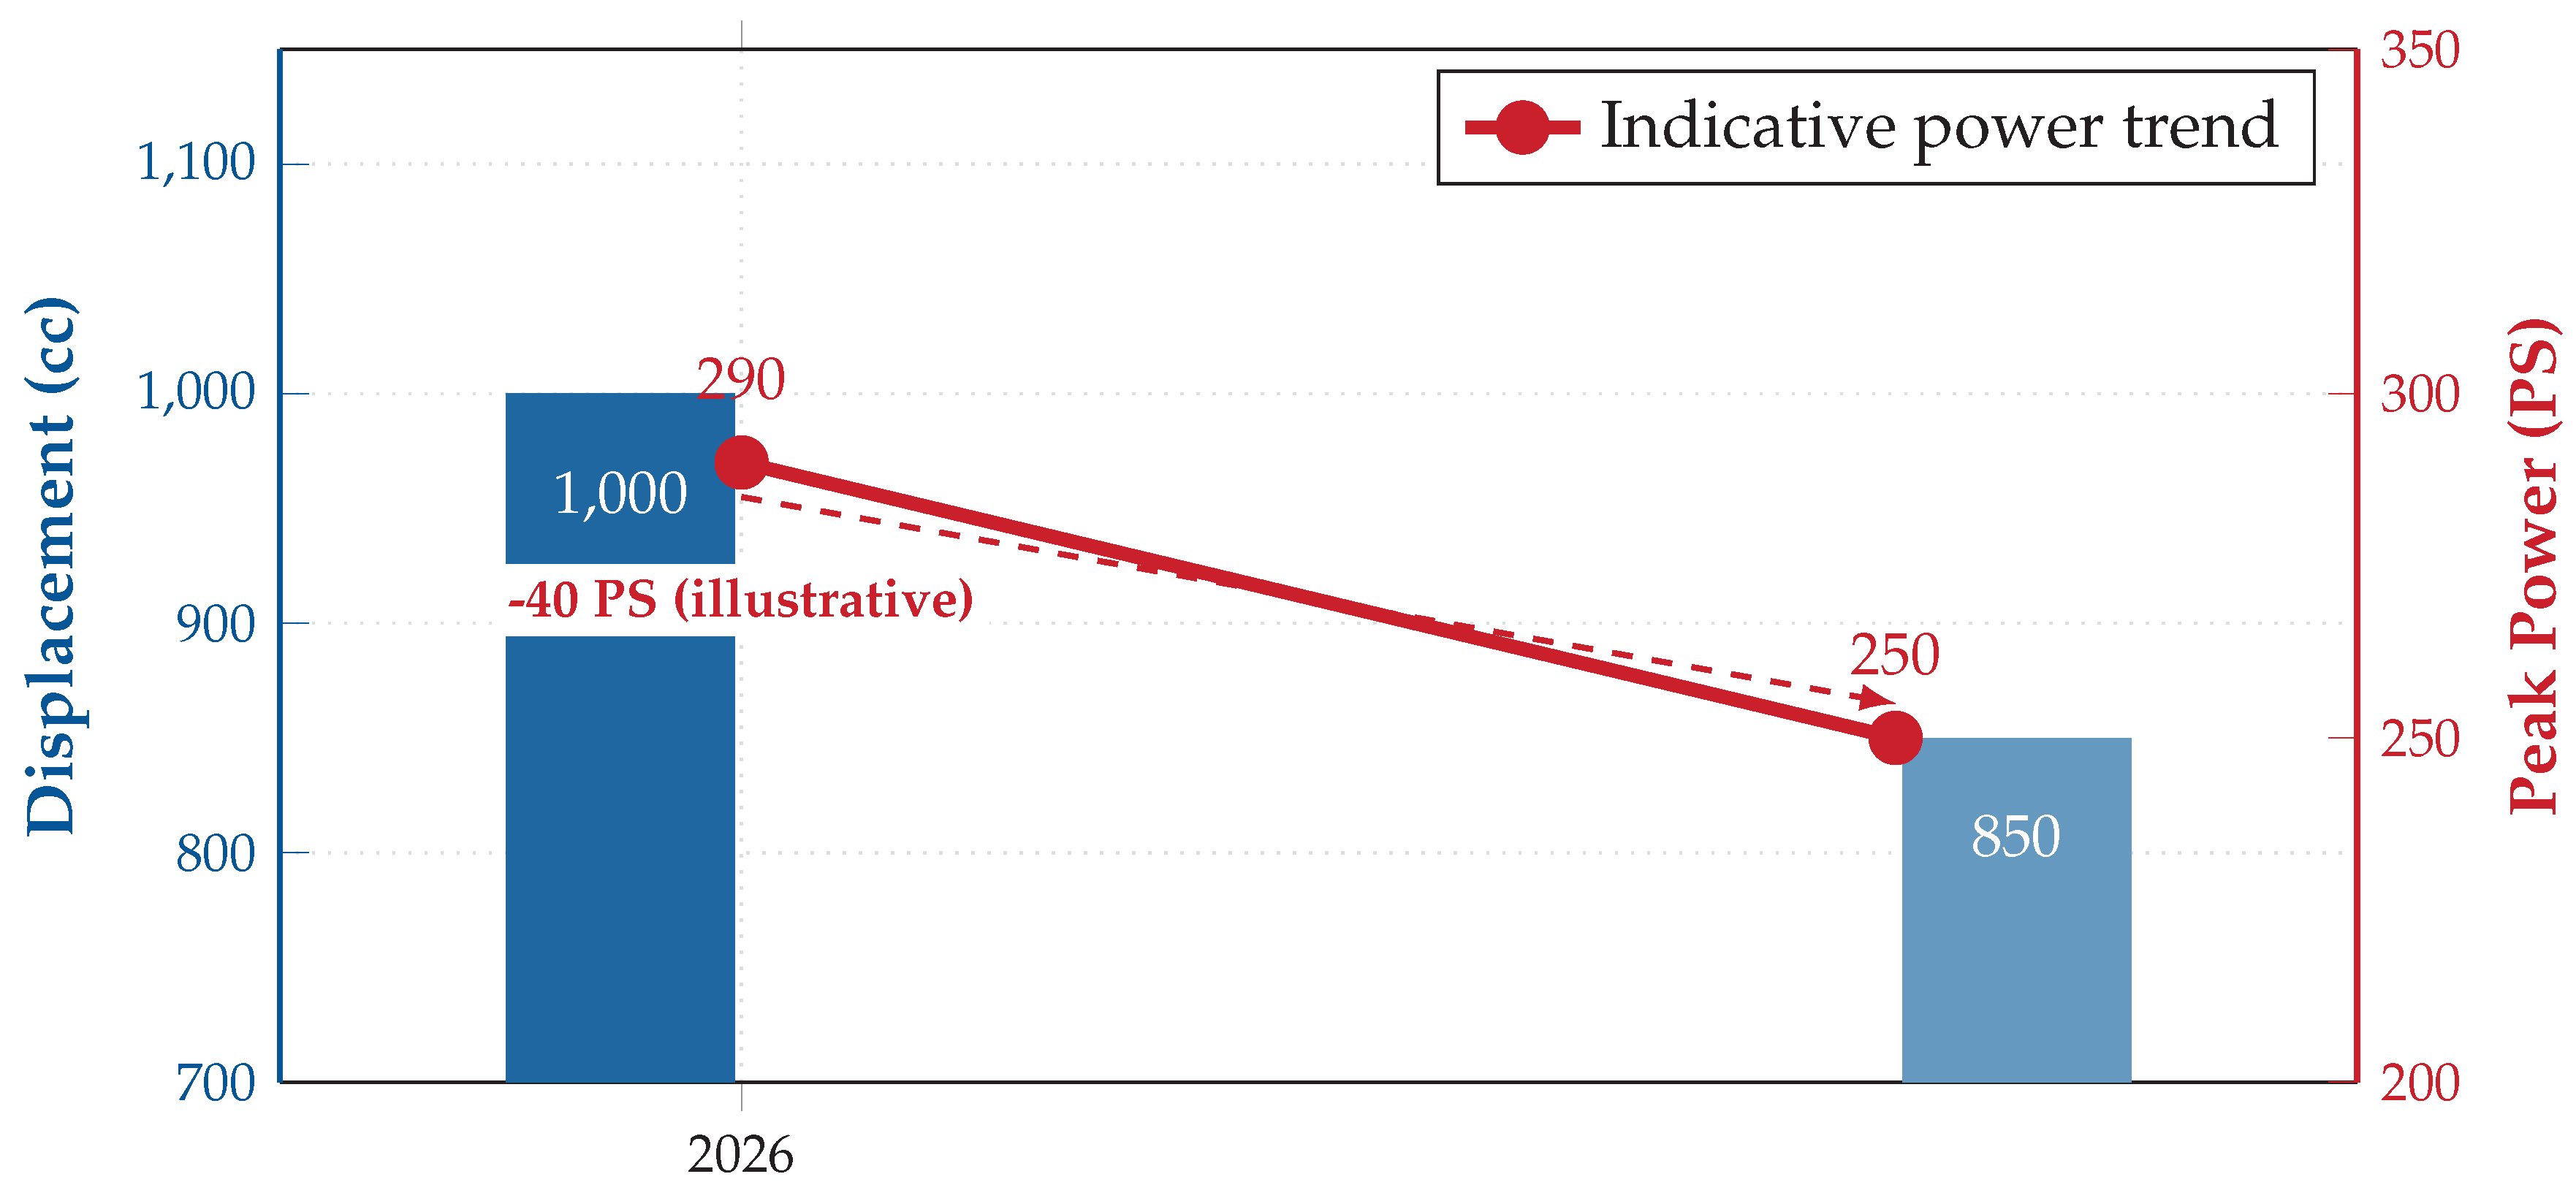
Figure 2.
Trajectory Evolution (schematic). A conceptual illustration based on the 2027 technical summary of how reduced acceleration margin can bias riders toward momentum preservation.
Figure 2.
Trajectory Evolution (schematic). A conceptual illustration based on the 2027 technical summary of how reduced acceleration margin can bias riders toward momentum preservation.
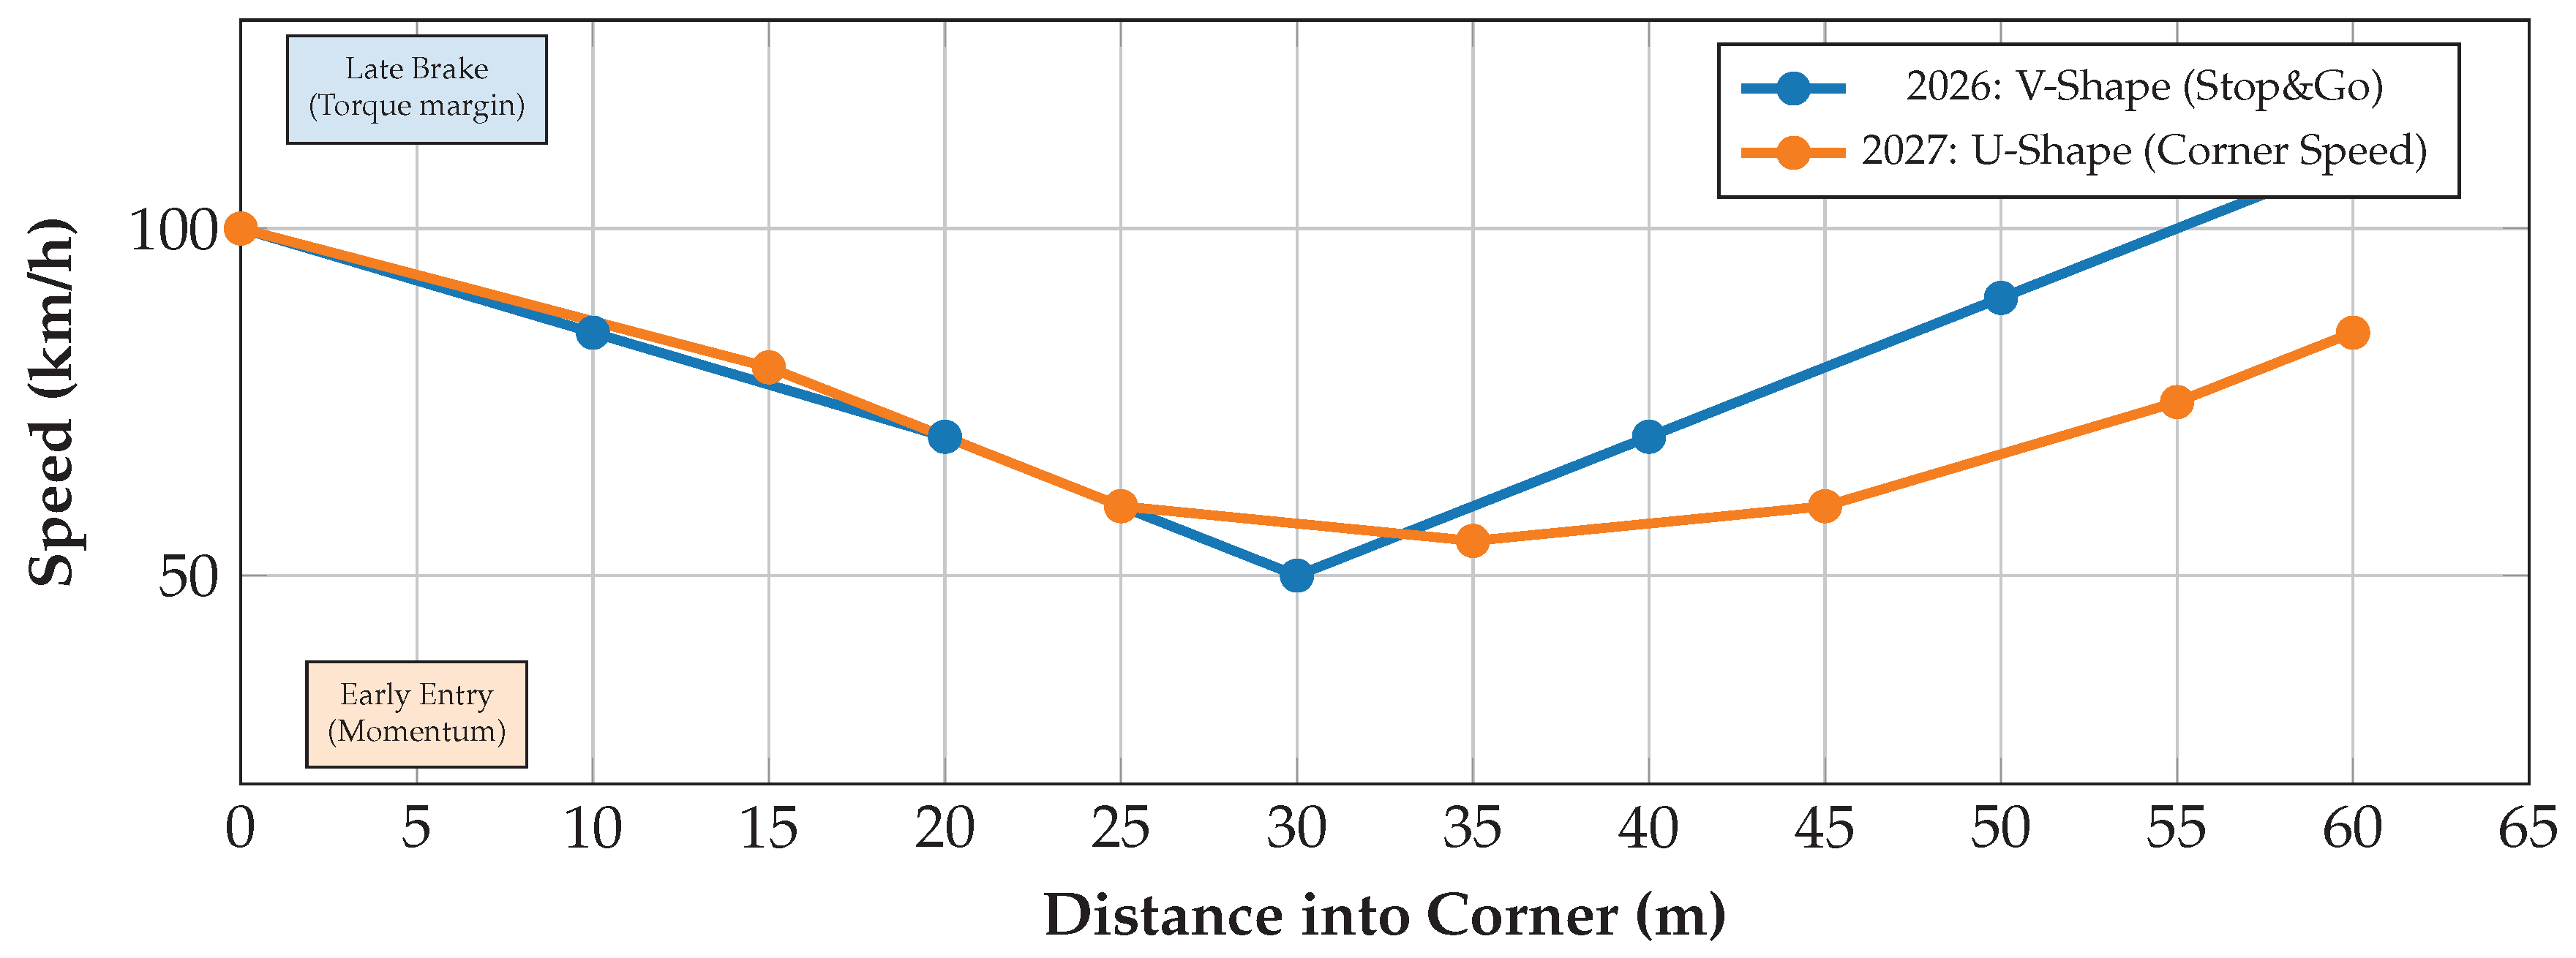
Figure 3.
Motivation Schematic: attitude sensitivity without RHD. Not an official measurement. Included to visualize why damping/tire degradations can become critical when mechanical ride-height actuation is prohibited.
Figure 3.
Motivation Schematic: attitude sensitivity without RHD. Not an official measurement. Included to visualize why damping/tire degradations can become critical when mechanical ride-height actuation is prohibited.
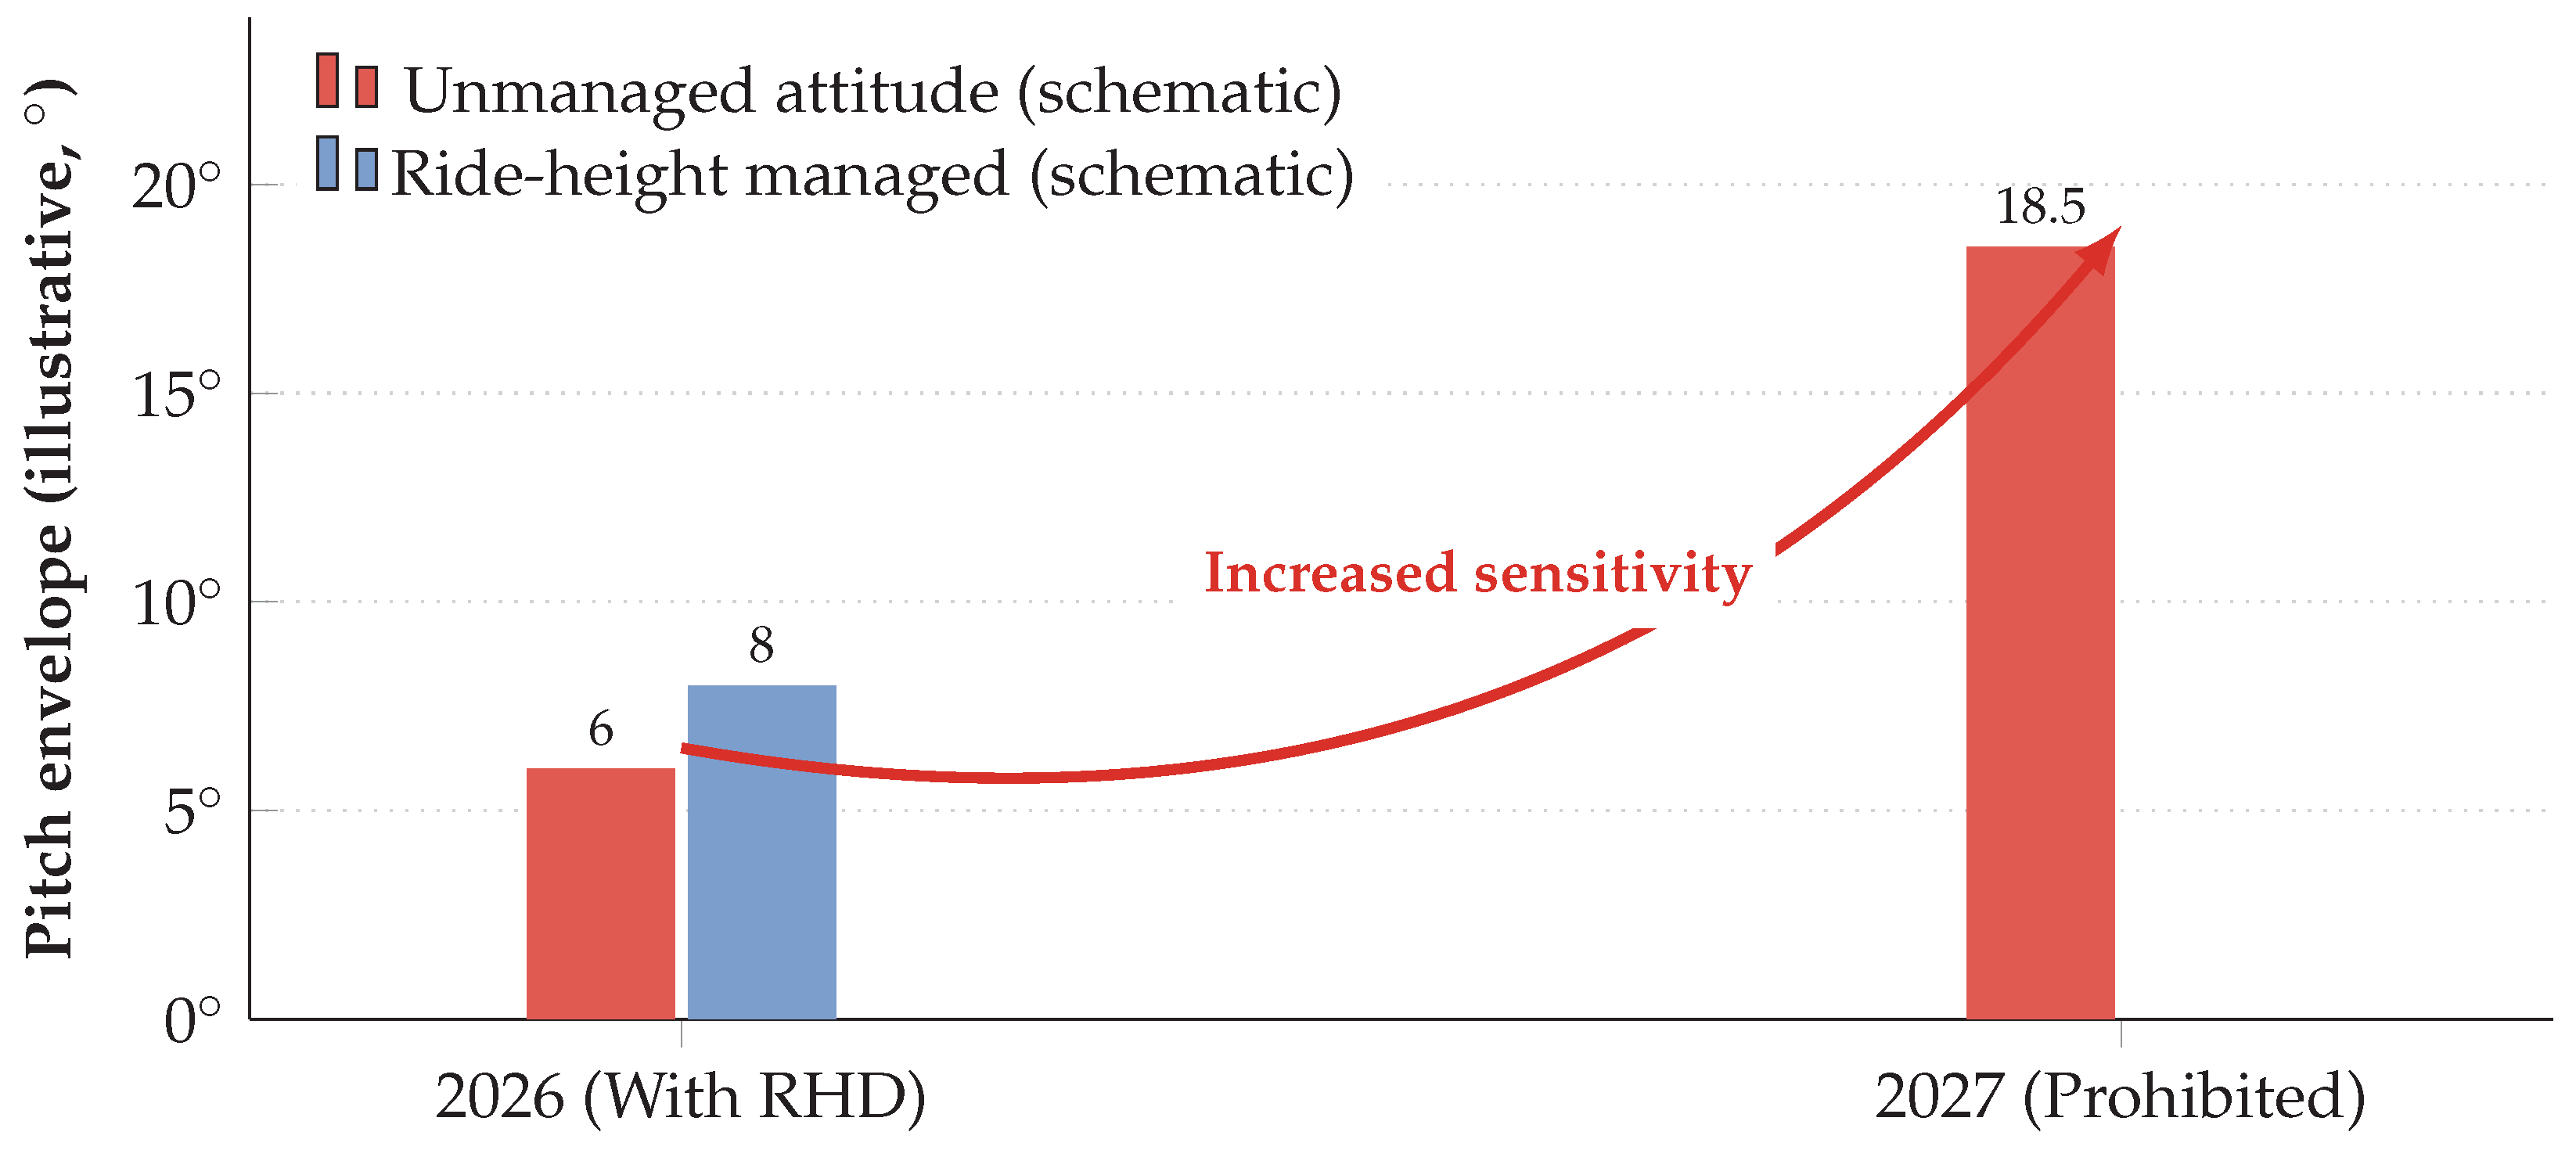
Figure 4.
Target Anomaly Classes. Representative visual anomaly categories addressed in this paper. They are not “defined” by regulation, but become more consequential as the 2027 package constrains mechanical/aero stabilization.
Figure 4.
Target Anomaly Classes. Representative visual anomaly categories addressed in this paper. They are not “defined” by regulation, but become more consequential as the 2027 package constrains mechanical/aero stabilization.
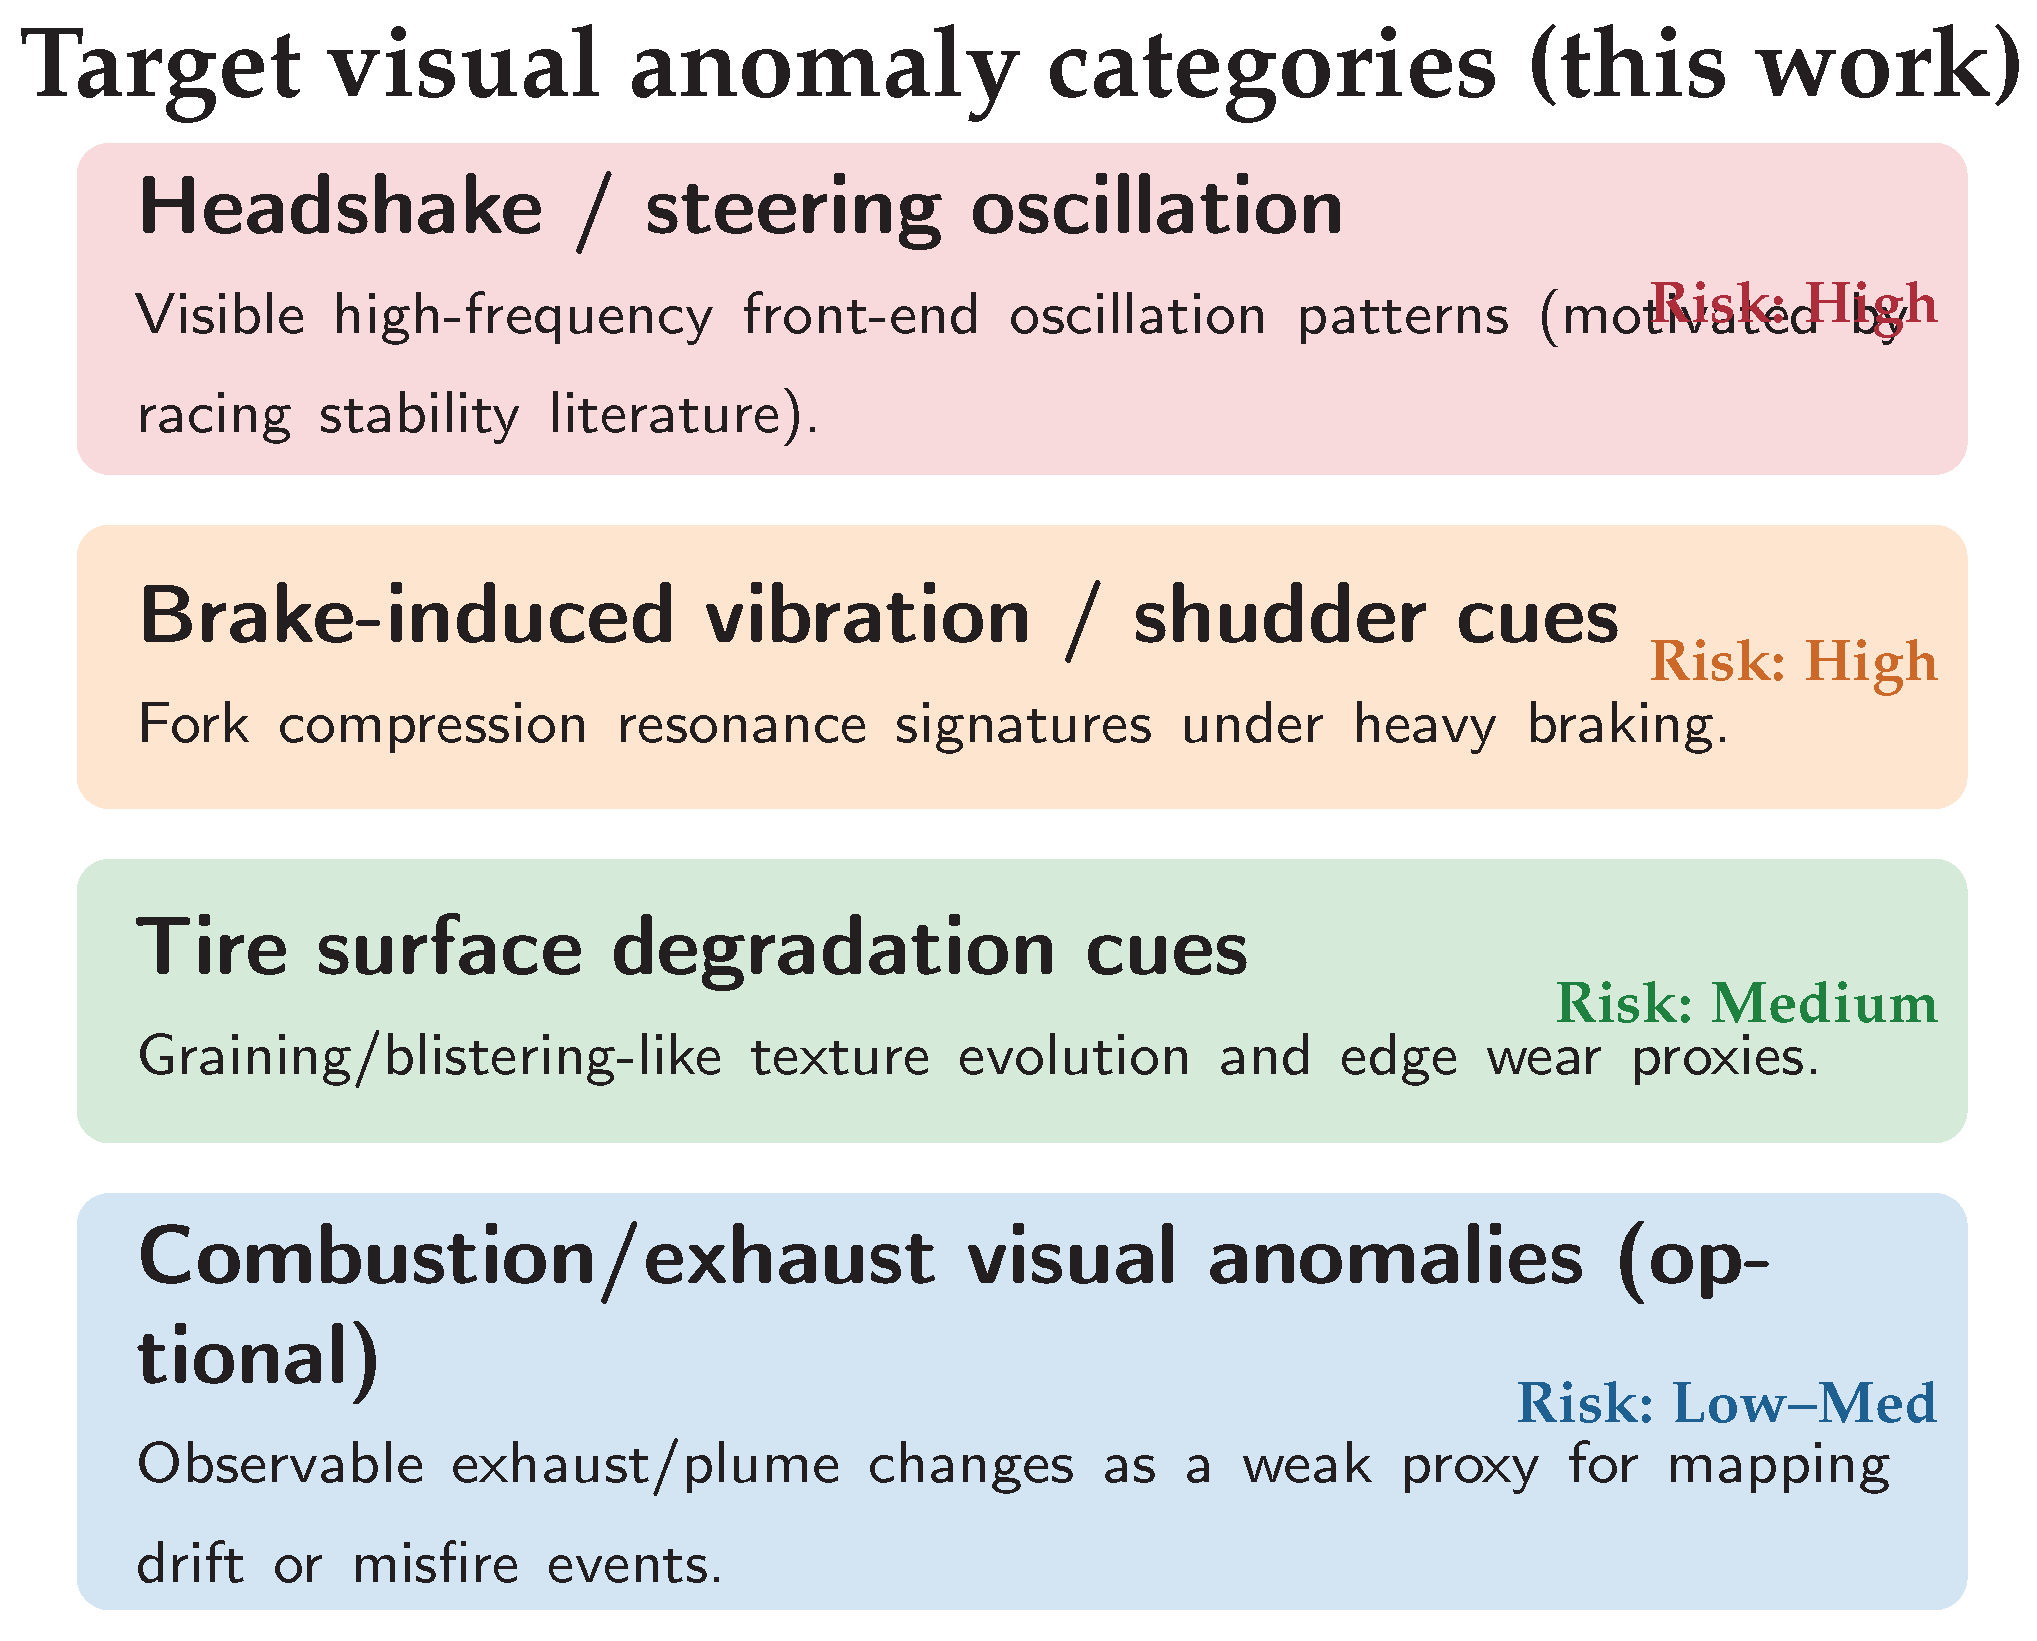
Figure 5.
Latency budget motivation. Standard retrieval-heavy perception can exceed a practical reaction window at racing speeds. A cache-first design aims to keep most frames within a sub-50 ms operational envelope.
Figure 5.
Latency budget motivation. Standard retrieval-heavy perception can exceed a practical reaction window at racing speeds. A cache-first design aims to keep most frames within a sub-50 ms operational envelope.
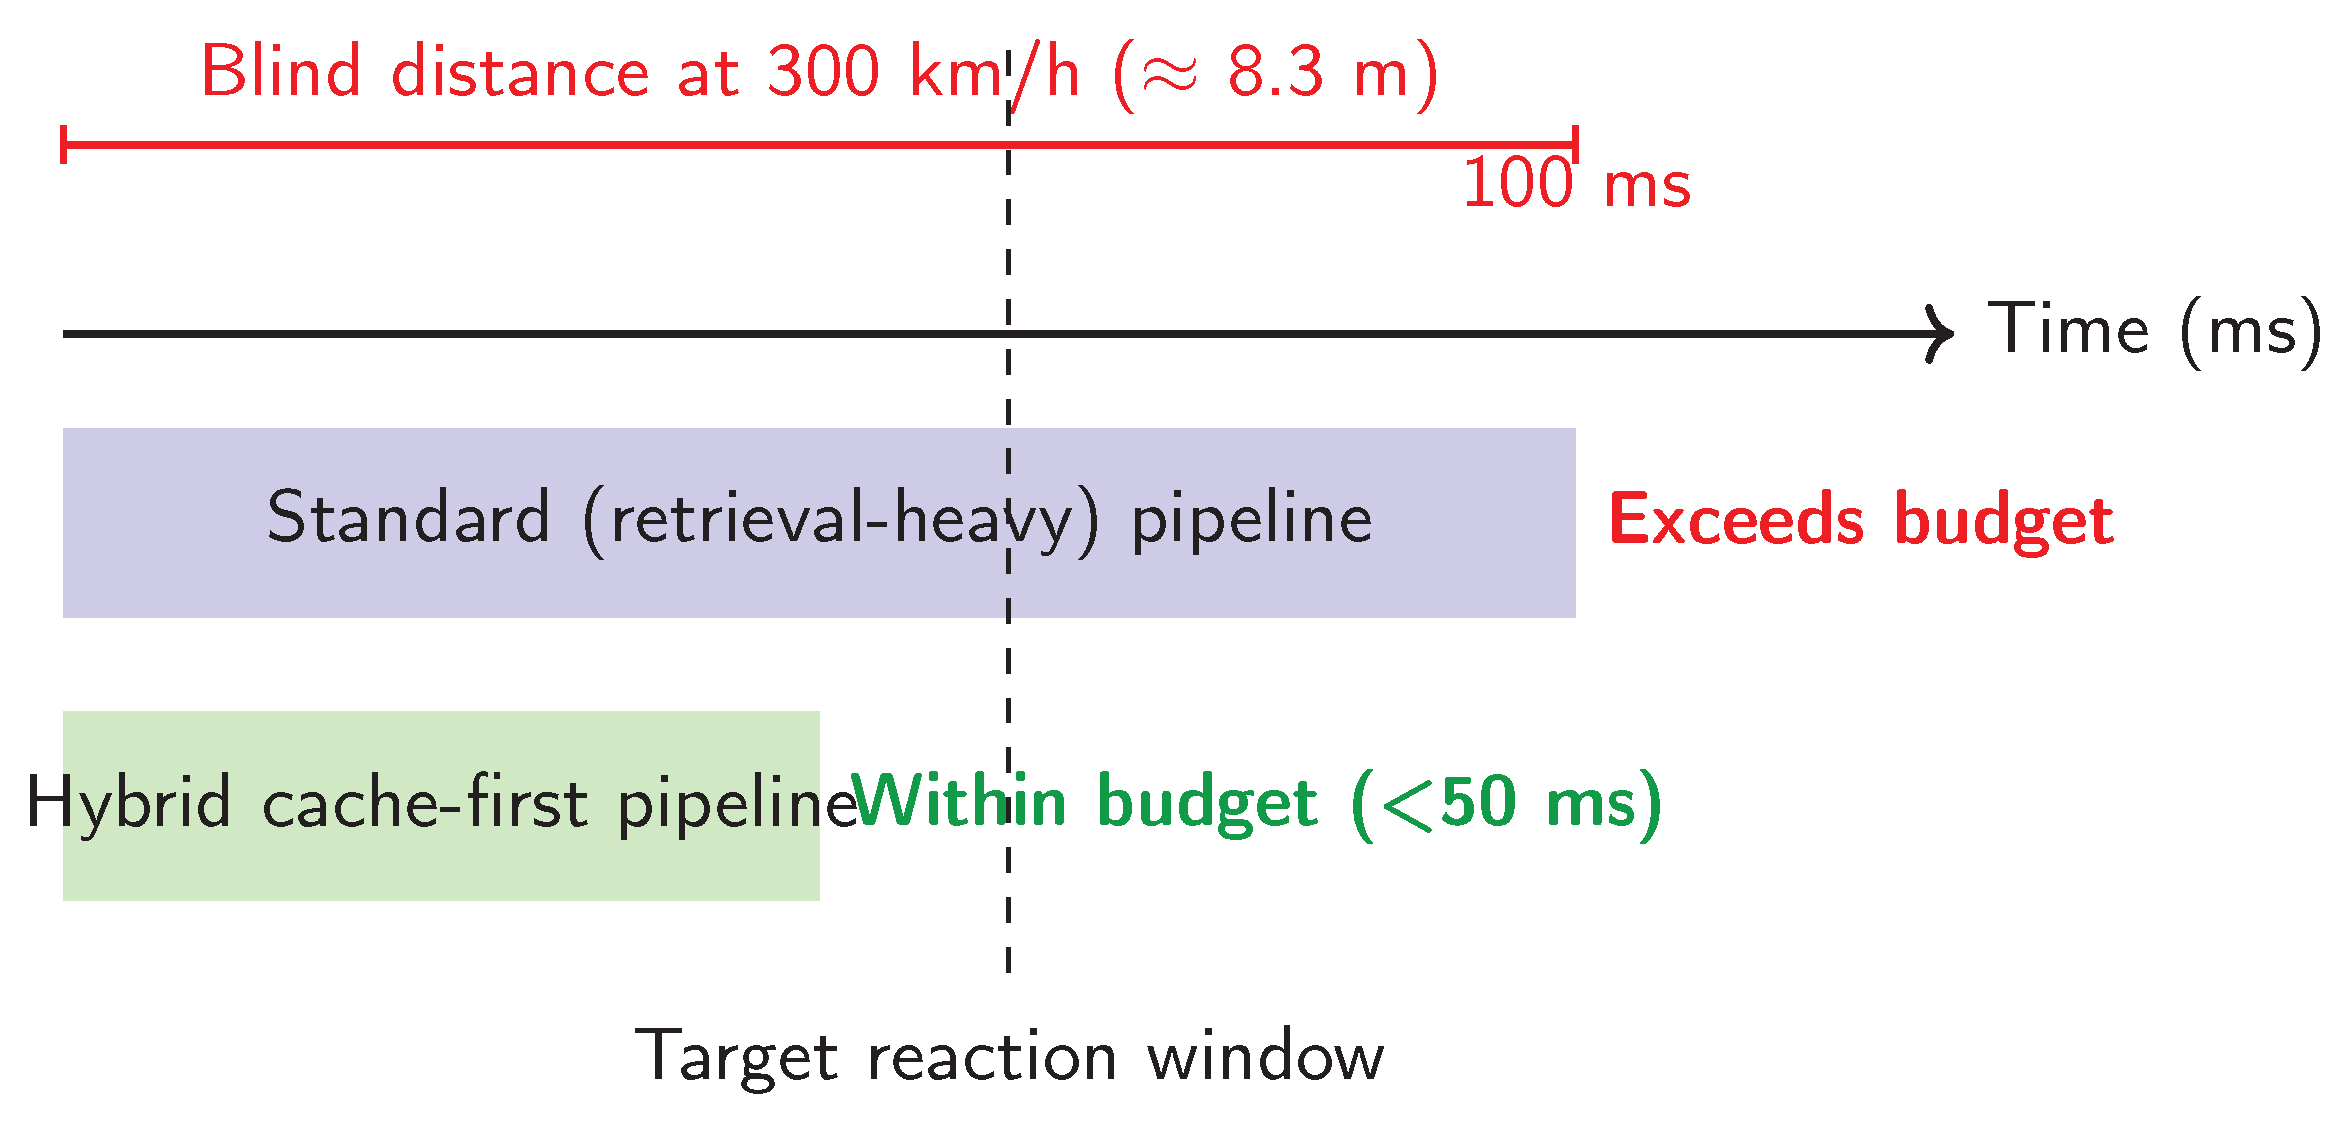
Figure 6.
System concept. A ReAct agent routes perception through a cache-first static context (CAG) path for nominal lapping, and triggers deeper historical retrieval (RAG) only when uncertainty/anomaly signals justify the cost.
Figure 6.
System concept. A ReAct agent routes perception through a cache-first static context (CAG) path for nominal lapping, and triggers deeper historical retrieval (RAG) only when uncertainty/anomaly signals justify the cost.
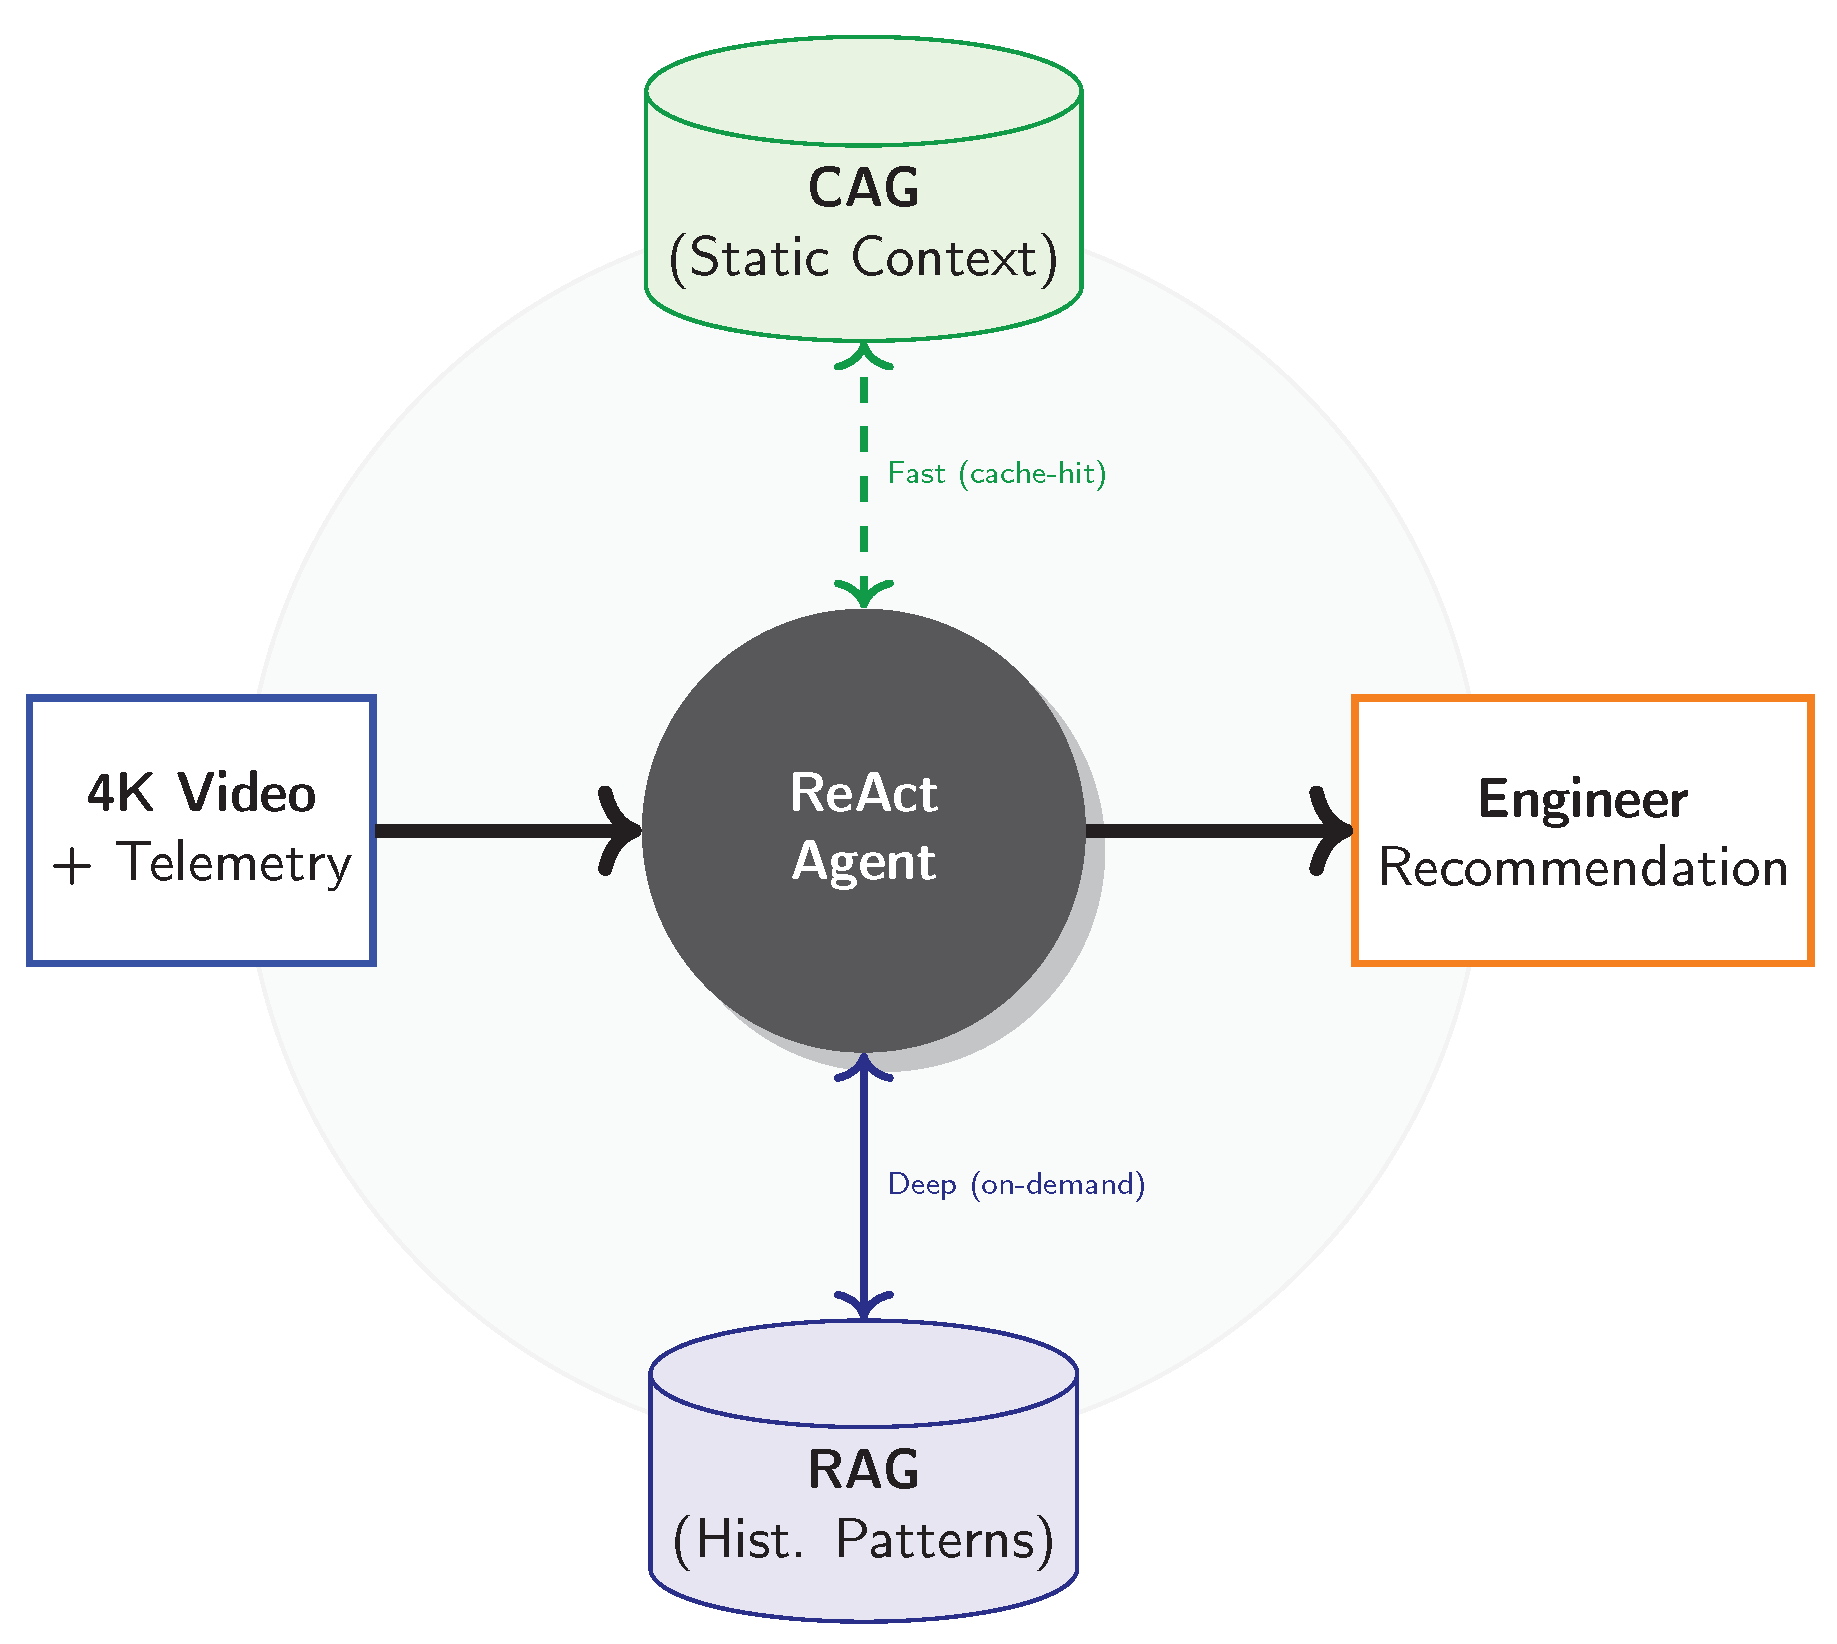
Figure 7.
Taxonomy of real-time perception in motorsport. Prior work emphasizes detection/tracking, temporal modeling, or video optimization in isolation. Our approach adds an agentic decision layer with entropy-gated conditional computation and a hybrid memory (CAG+RAG) designed for tight latency budgets.
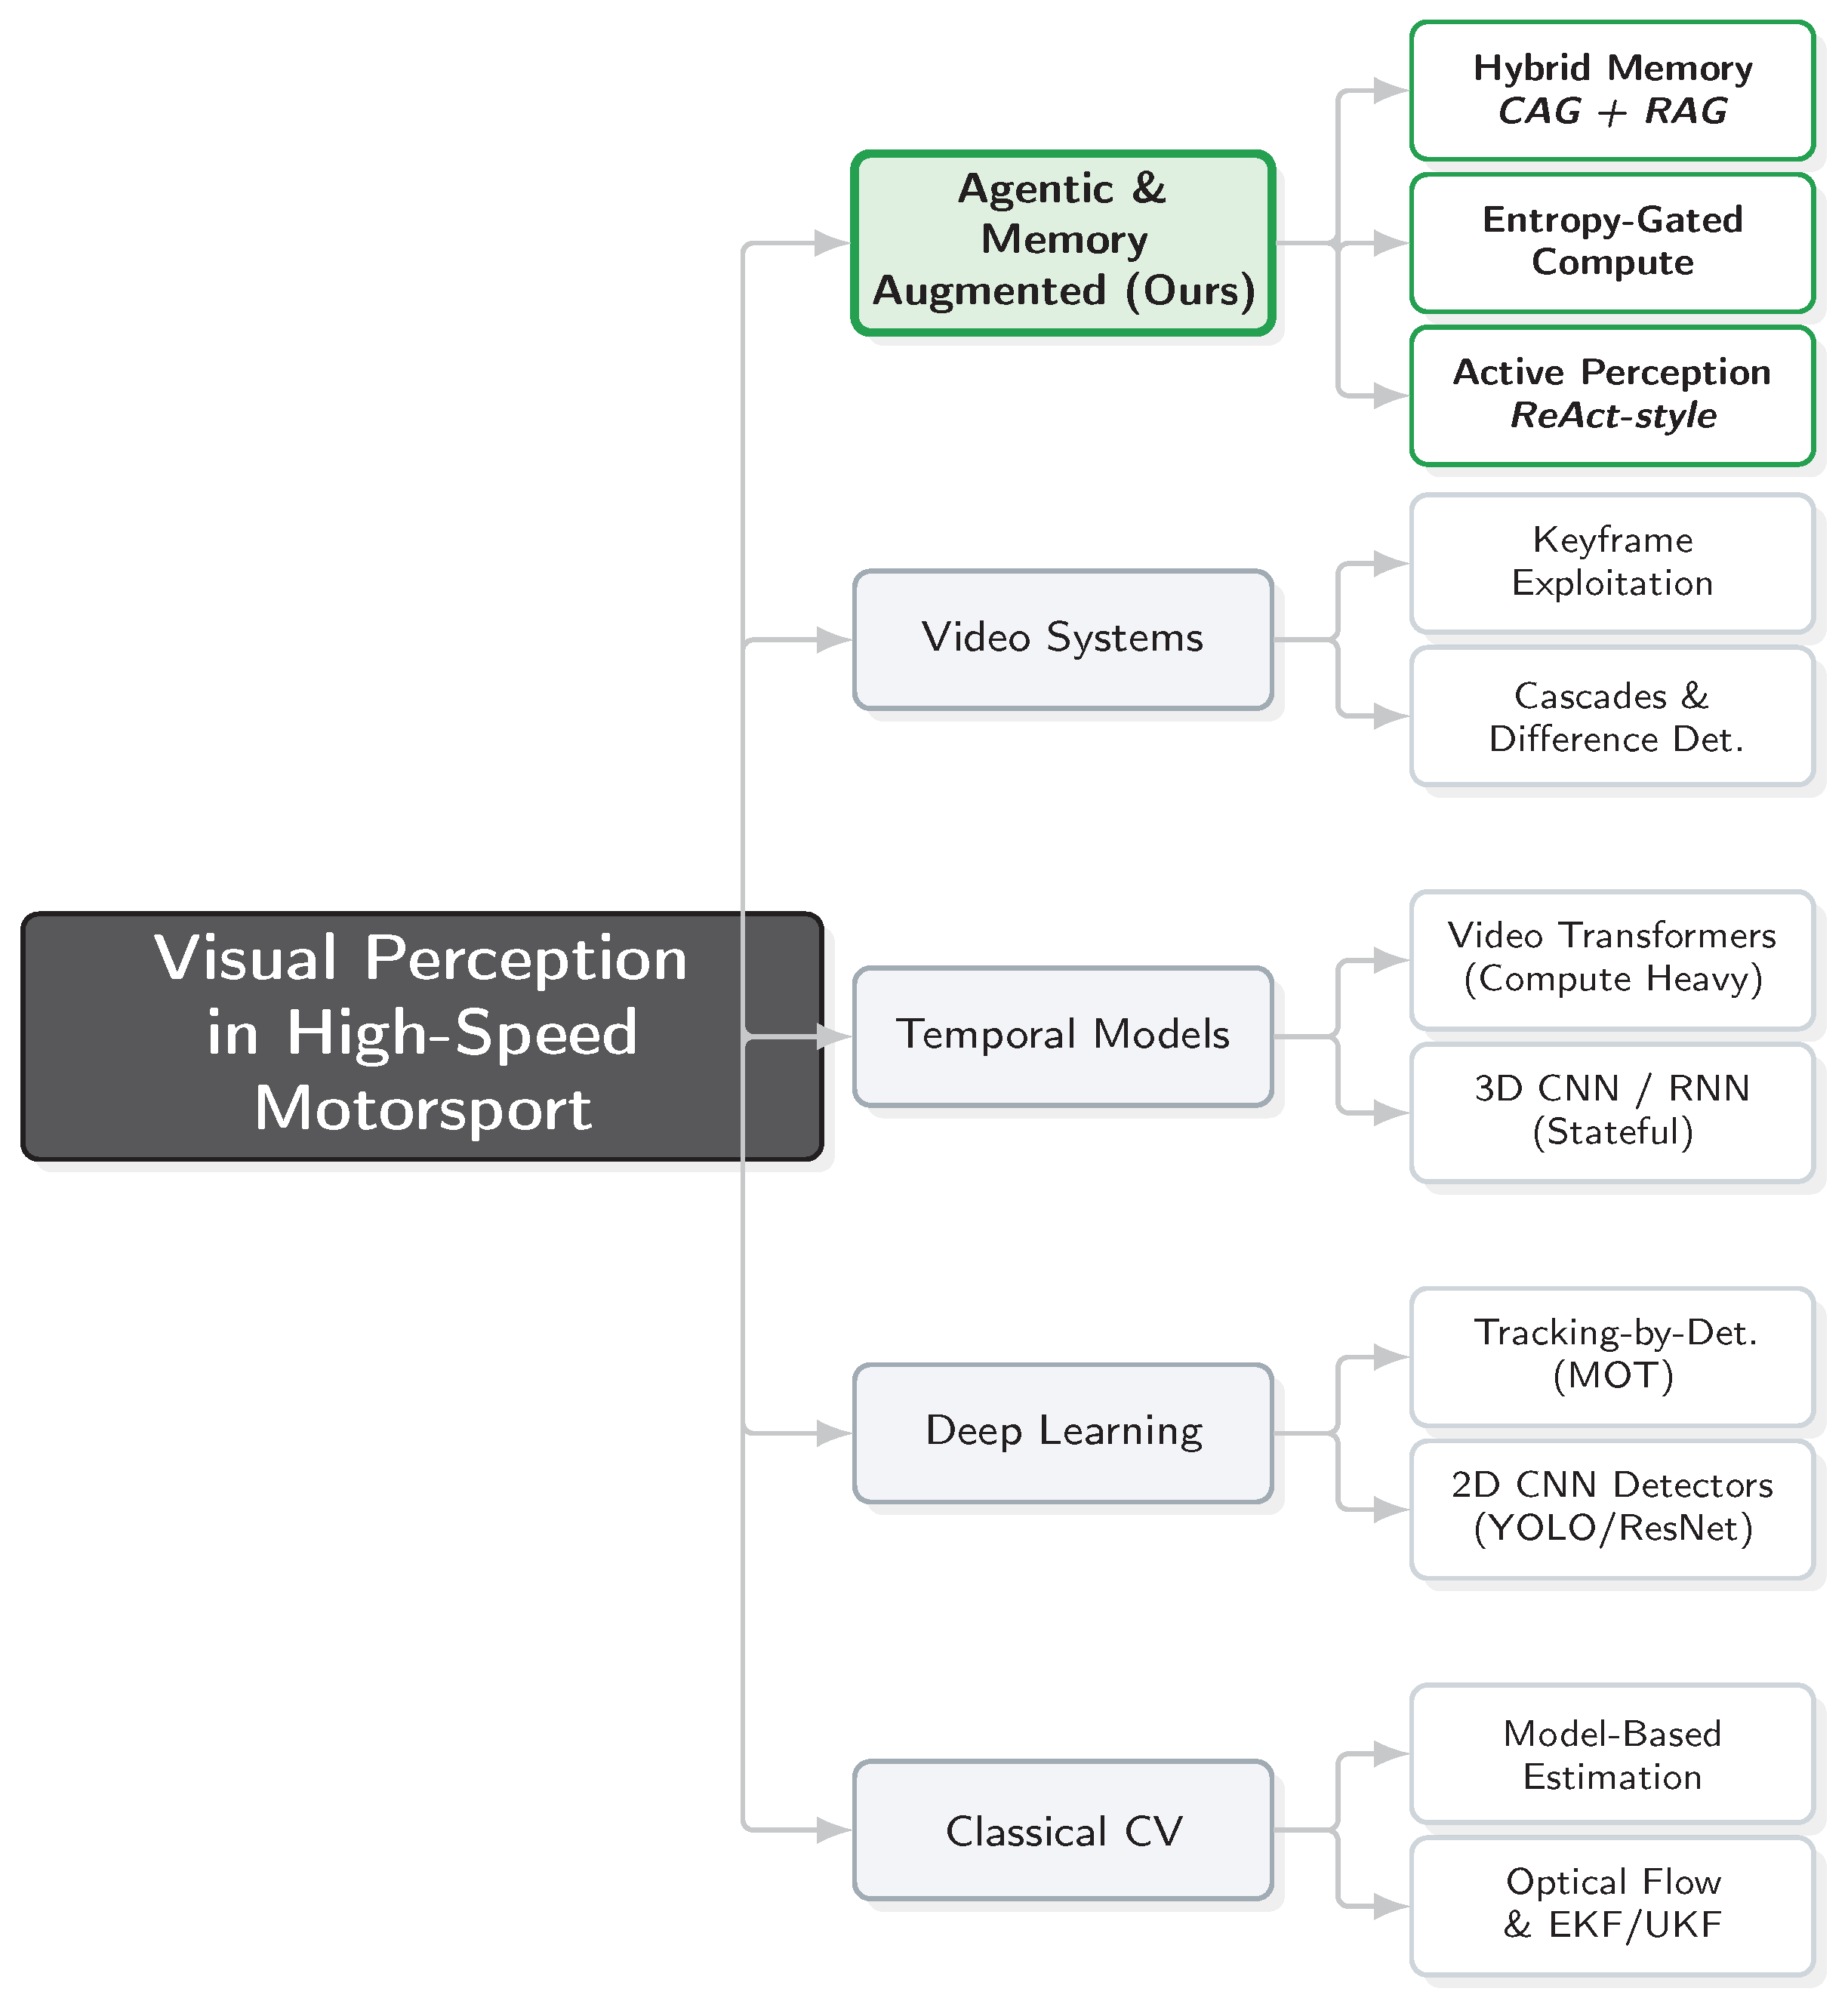
Figure 8.
High-level module interaction. The vision encoder produces embeddings ; a ReAct-style agent computes a budget-aware routing decision and selects either a fast cache path (CAG) for invariant circuit context or a deep retrieval path (RAG) for anomaly grounding in historical exemplars.
Figure 8.
High-level module interaction. The vision encoder produces embeddings ; a ReAct-style agent computes a budget-aware routing decision and selects either a fast cache path (CAG) for invariant circuit context or a deep retrieval path (RAG) for anomaly grounding in historical exemplars.
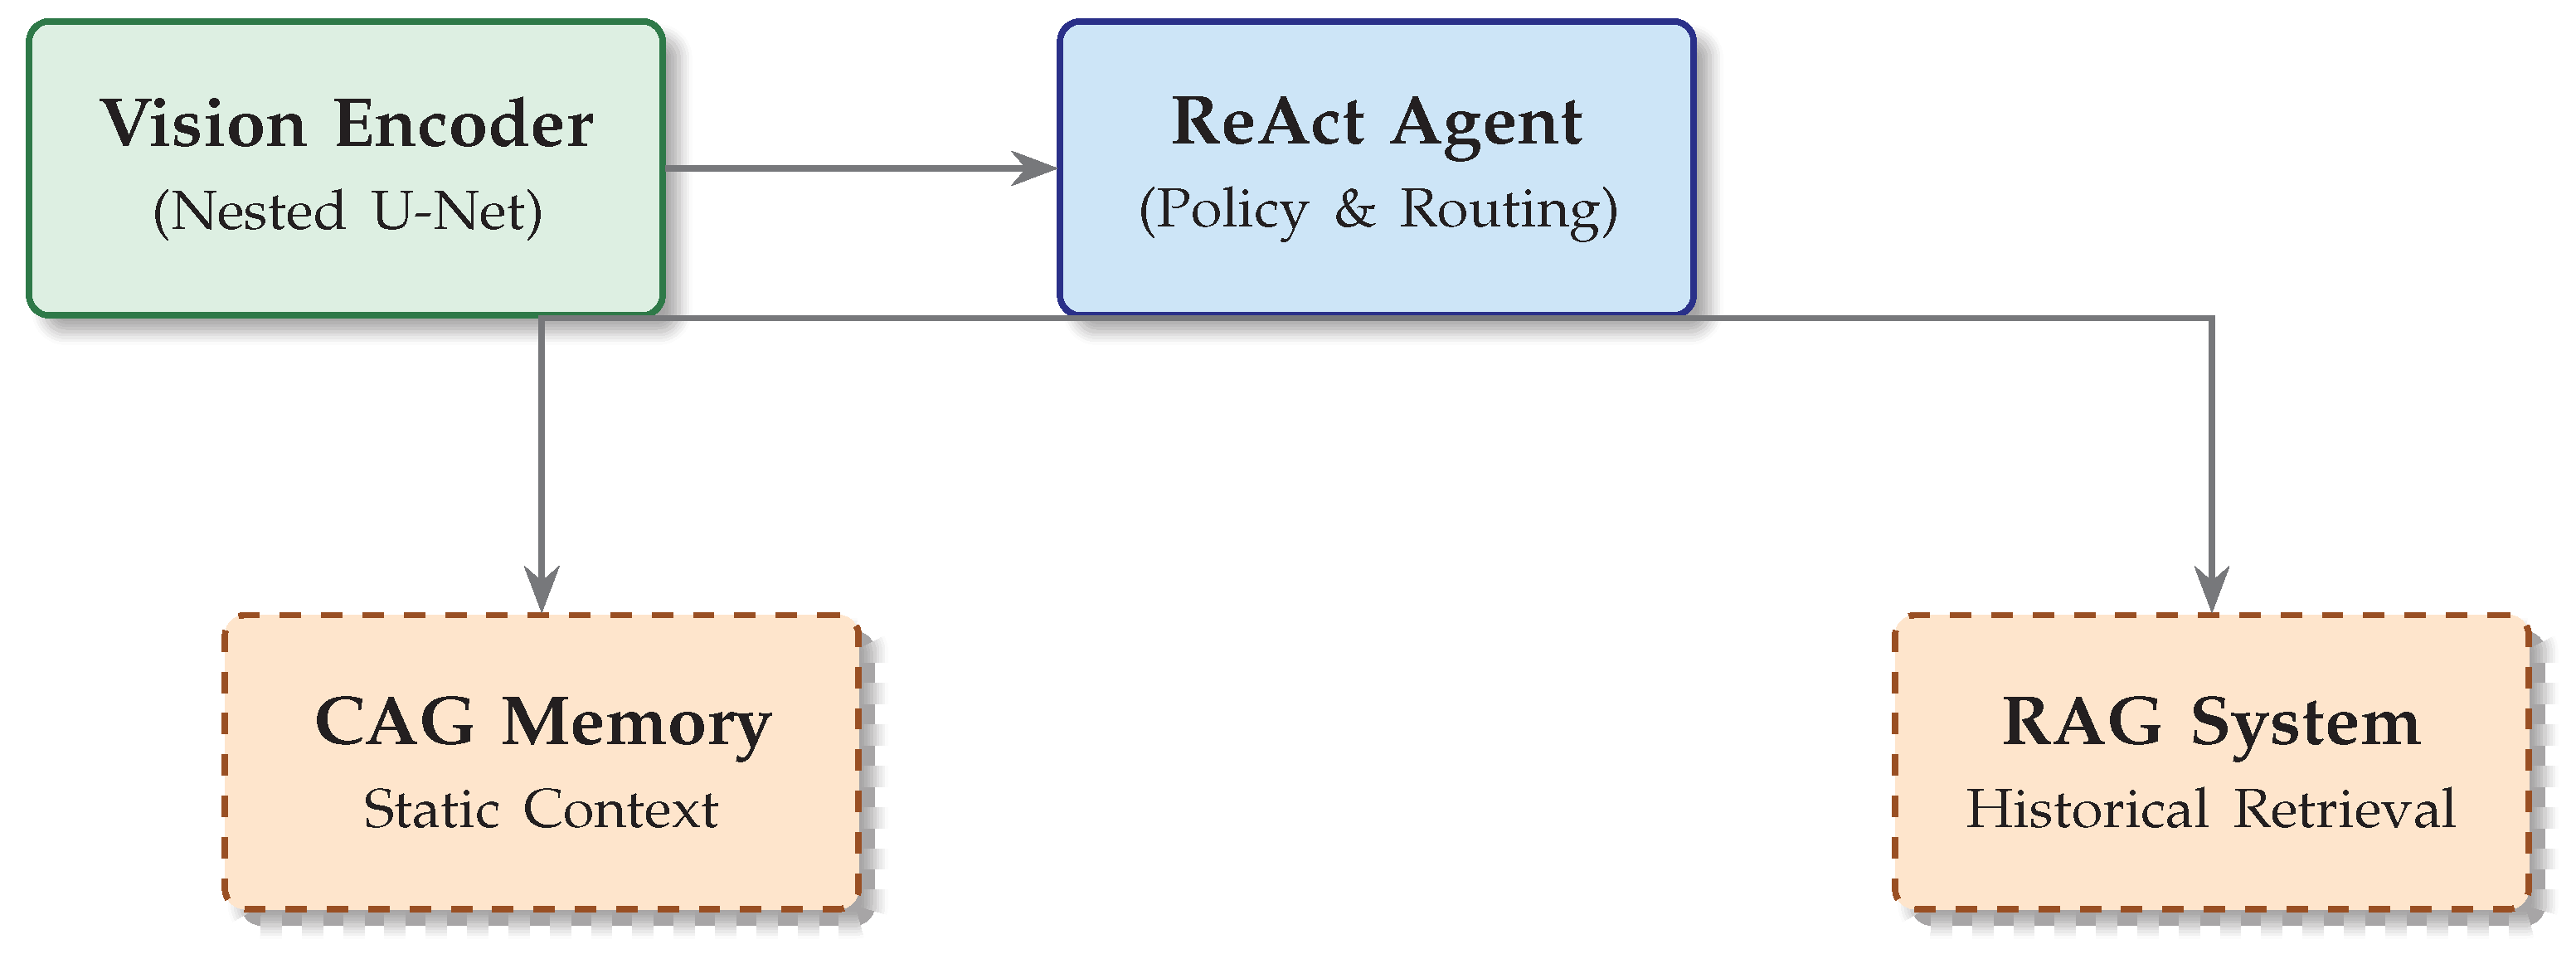
Figure 9.
Nested U-Net Architecture. Unlike standard U-Nets, the nested topology (nodes with ) aggregates features at multiple semantic levels via dense skip connections. This preserves high-frequency vibration cues (e.g., chatter) that typically vanish in deep bottlenecks.
Figure 9.
Nested U-Net Architecture. Unlike standard U-Nets, the nested topology (nodes with ) aggregates features at multiple semantic levels via dense skip connections. This preserves high-frequency vibration cues (e.g., chatter) that typically vanish in deep bottlenecks.
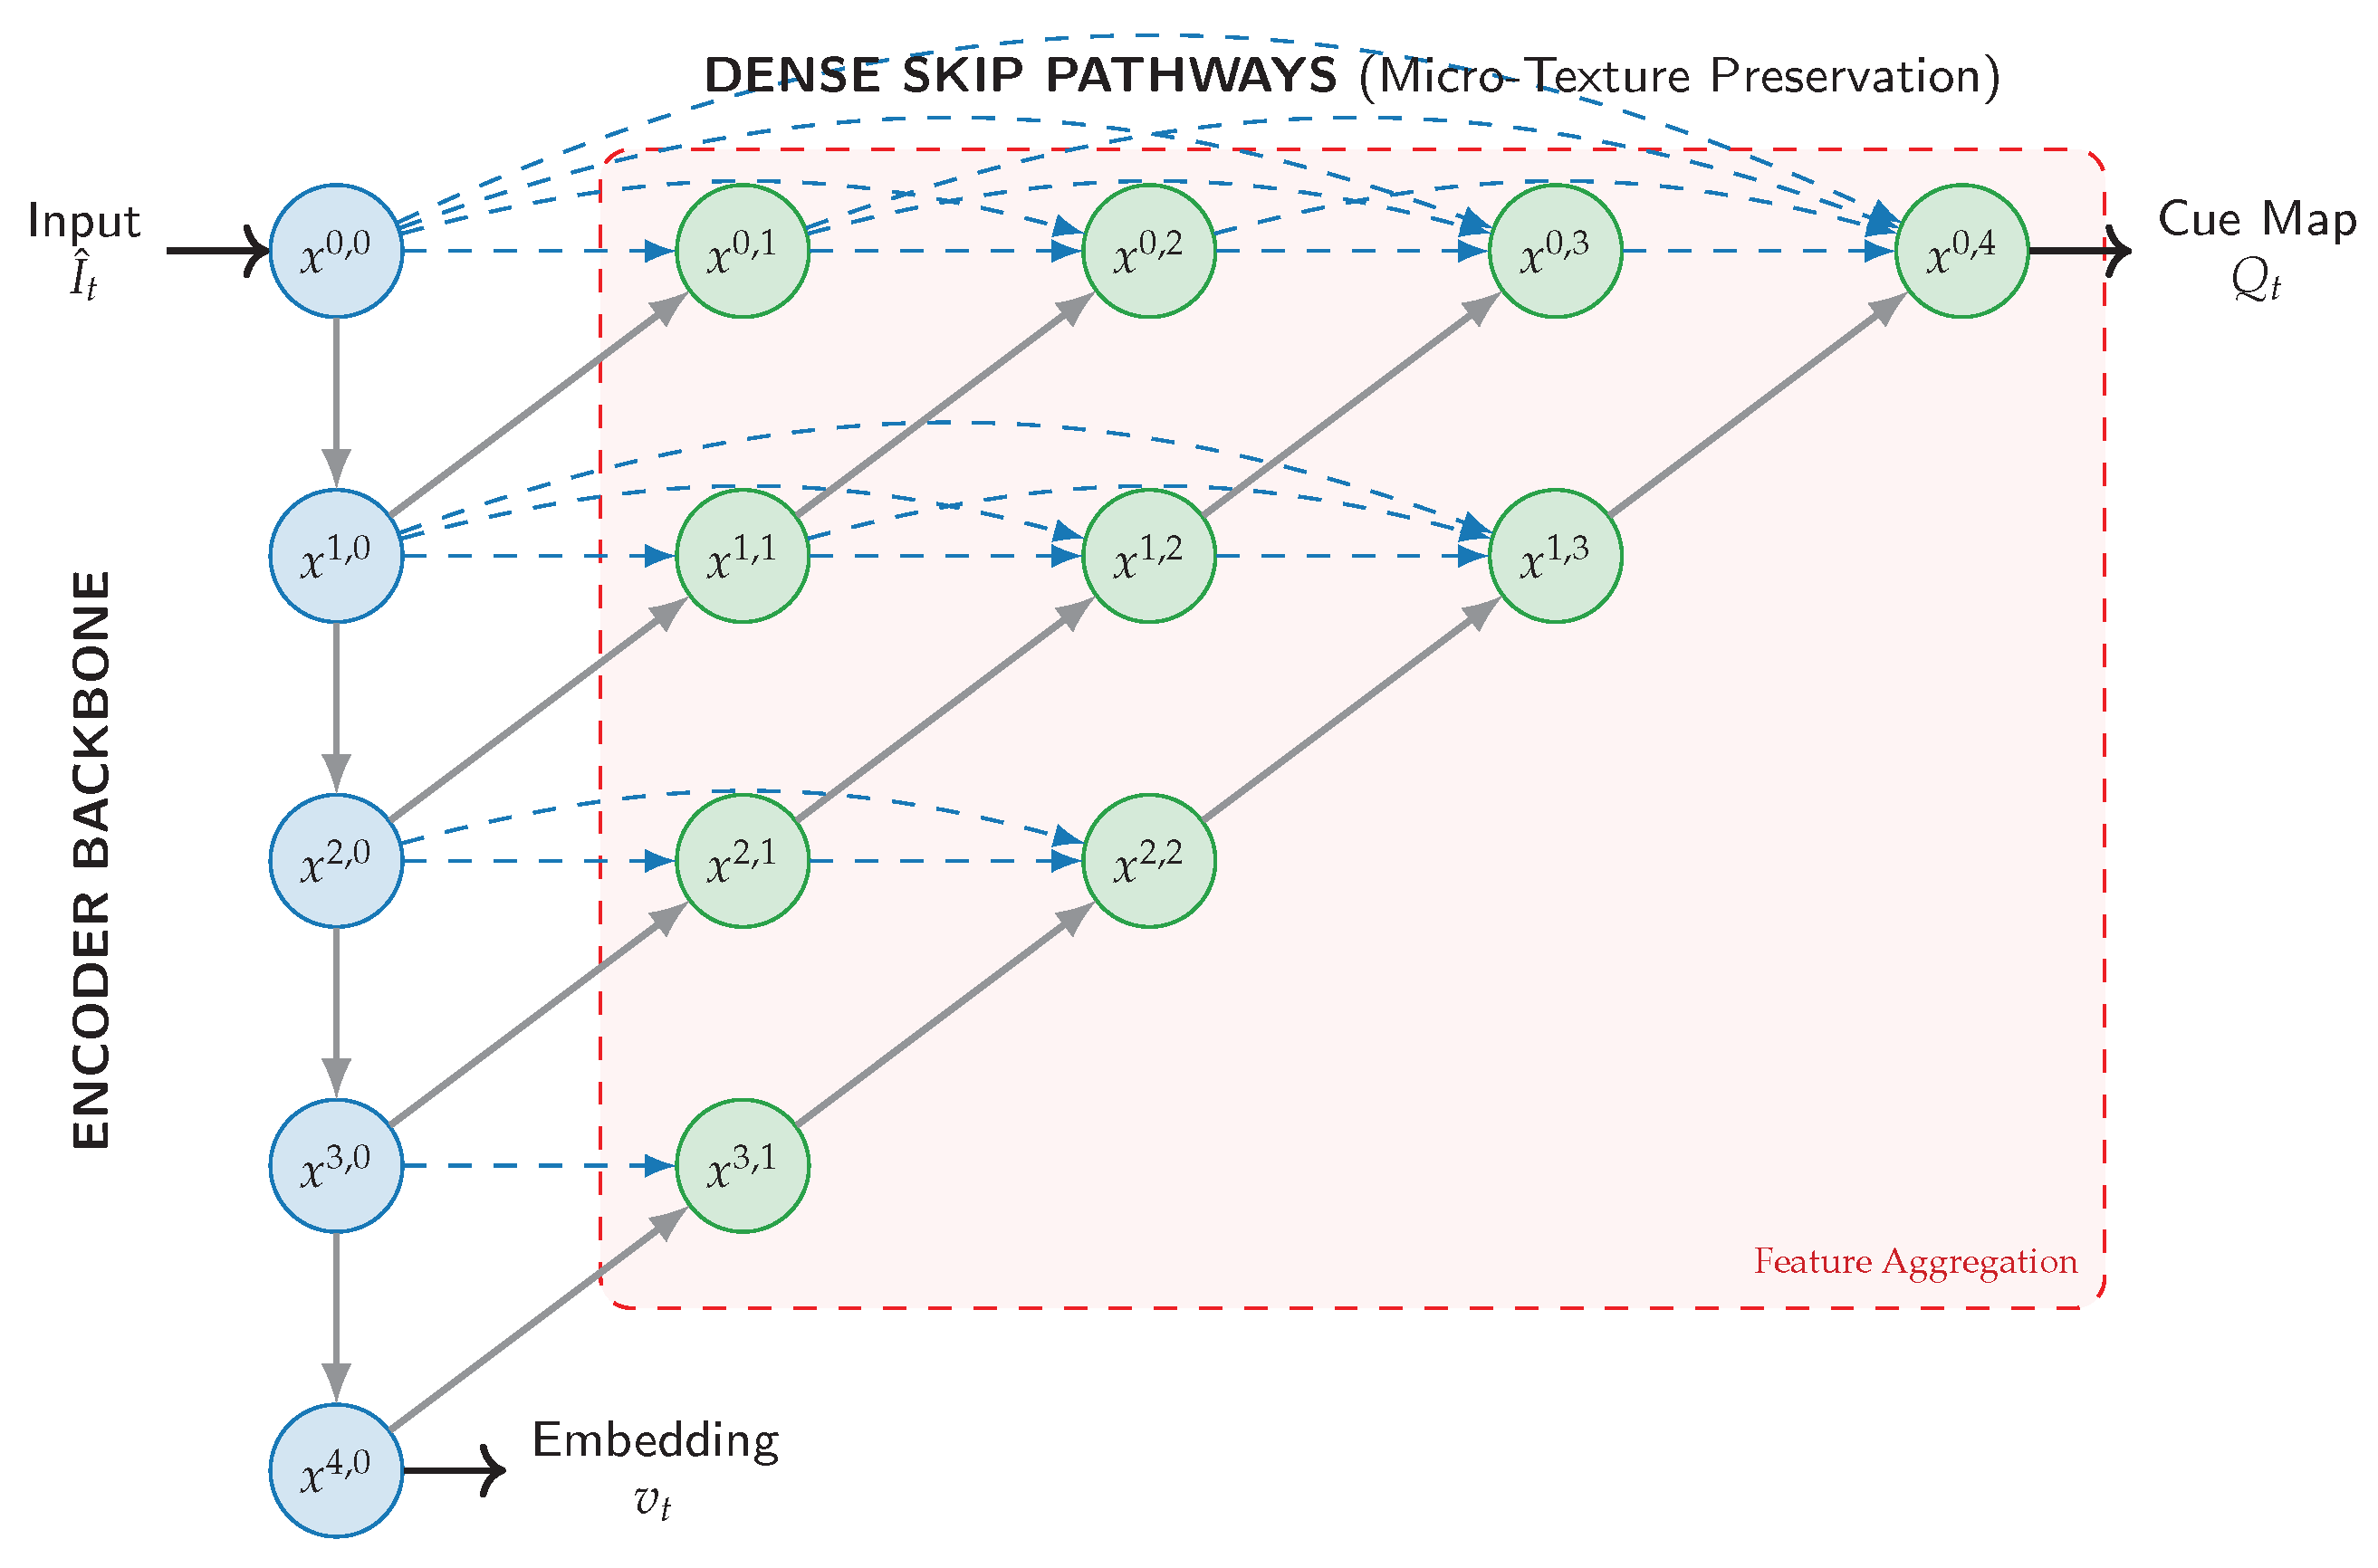
Figure 12.
Hysteresis-based Routing Logic. Instead of a single threshold, the system employs a Schmitt trigger mechanism. To enter the high-cost RAG mode, uncertainty must exceed (0.6). To return to CAG, uncertainty must drop below (0.4). The band prevents "flickering" (rapid switching) during ambiguous transitions.
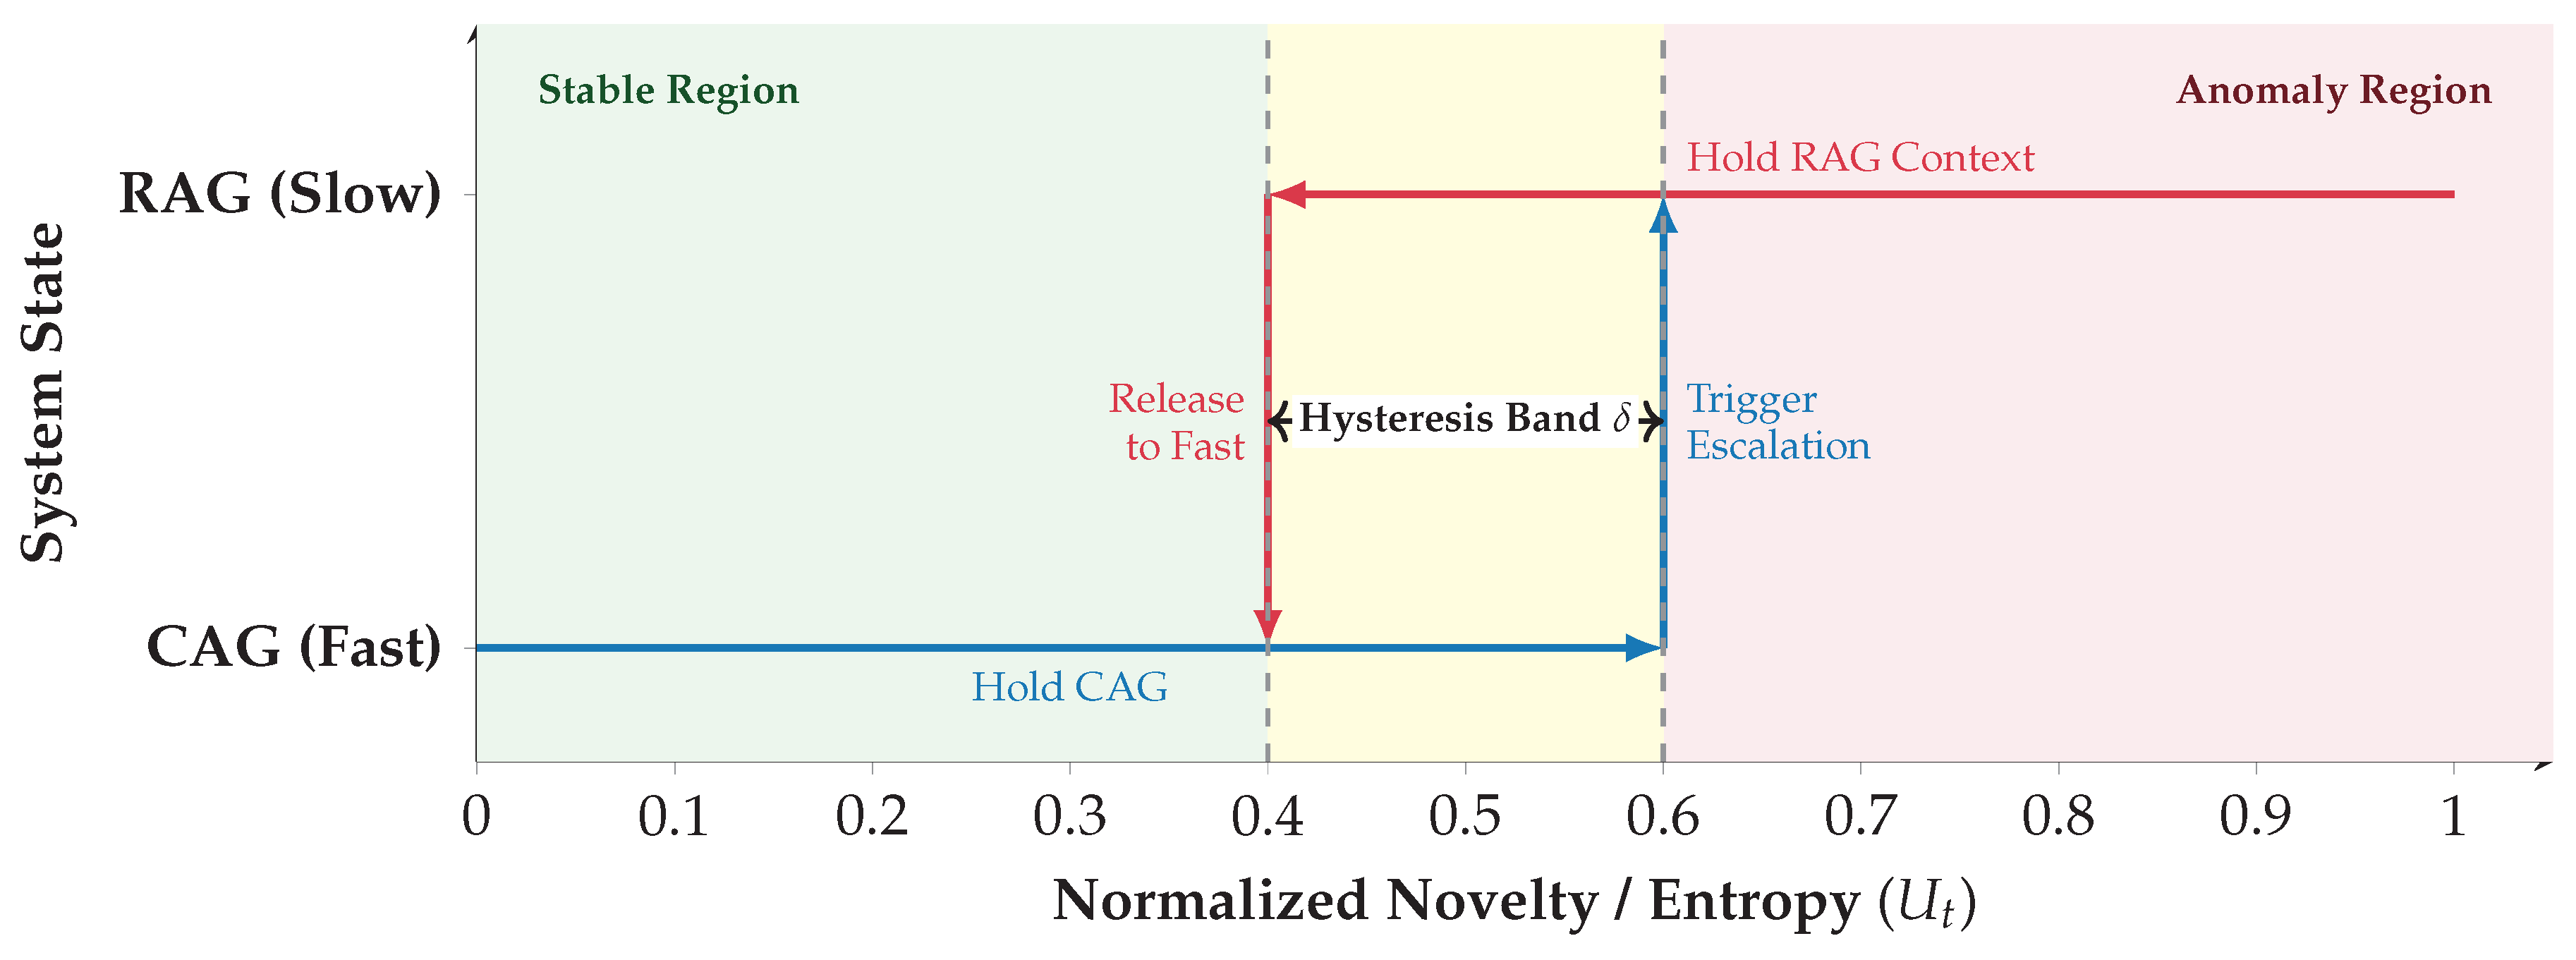
Figure 14.
Evolution of Braking Strategy (2026 vs 2027). A) The 2026 baseline (Blue) utilizes a "V-Shape" approach with late, high-pressure braking points allowed by high engine torque. B) The 2027 generated nodes (Orange) shift systematically earlier and lower in pressure ("U-Shape") to maintain corner speed. The faint blue circles in B represent the original 2026 positions, highlighting the spatial drift () and pressure reduction () visualized by the green arrows.
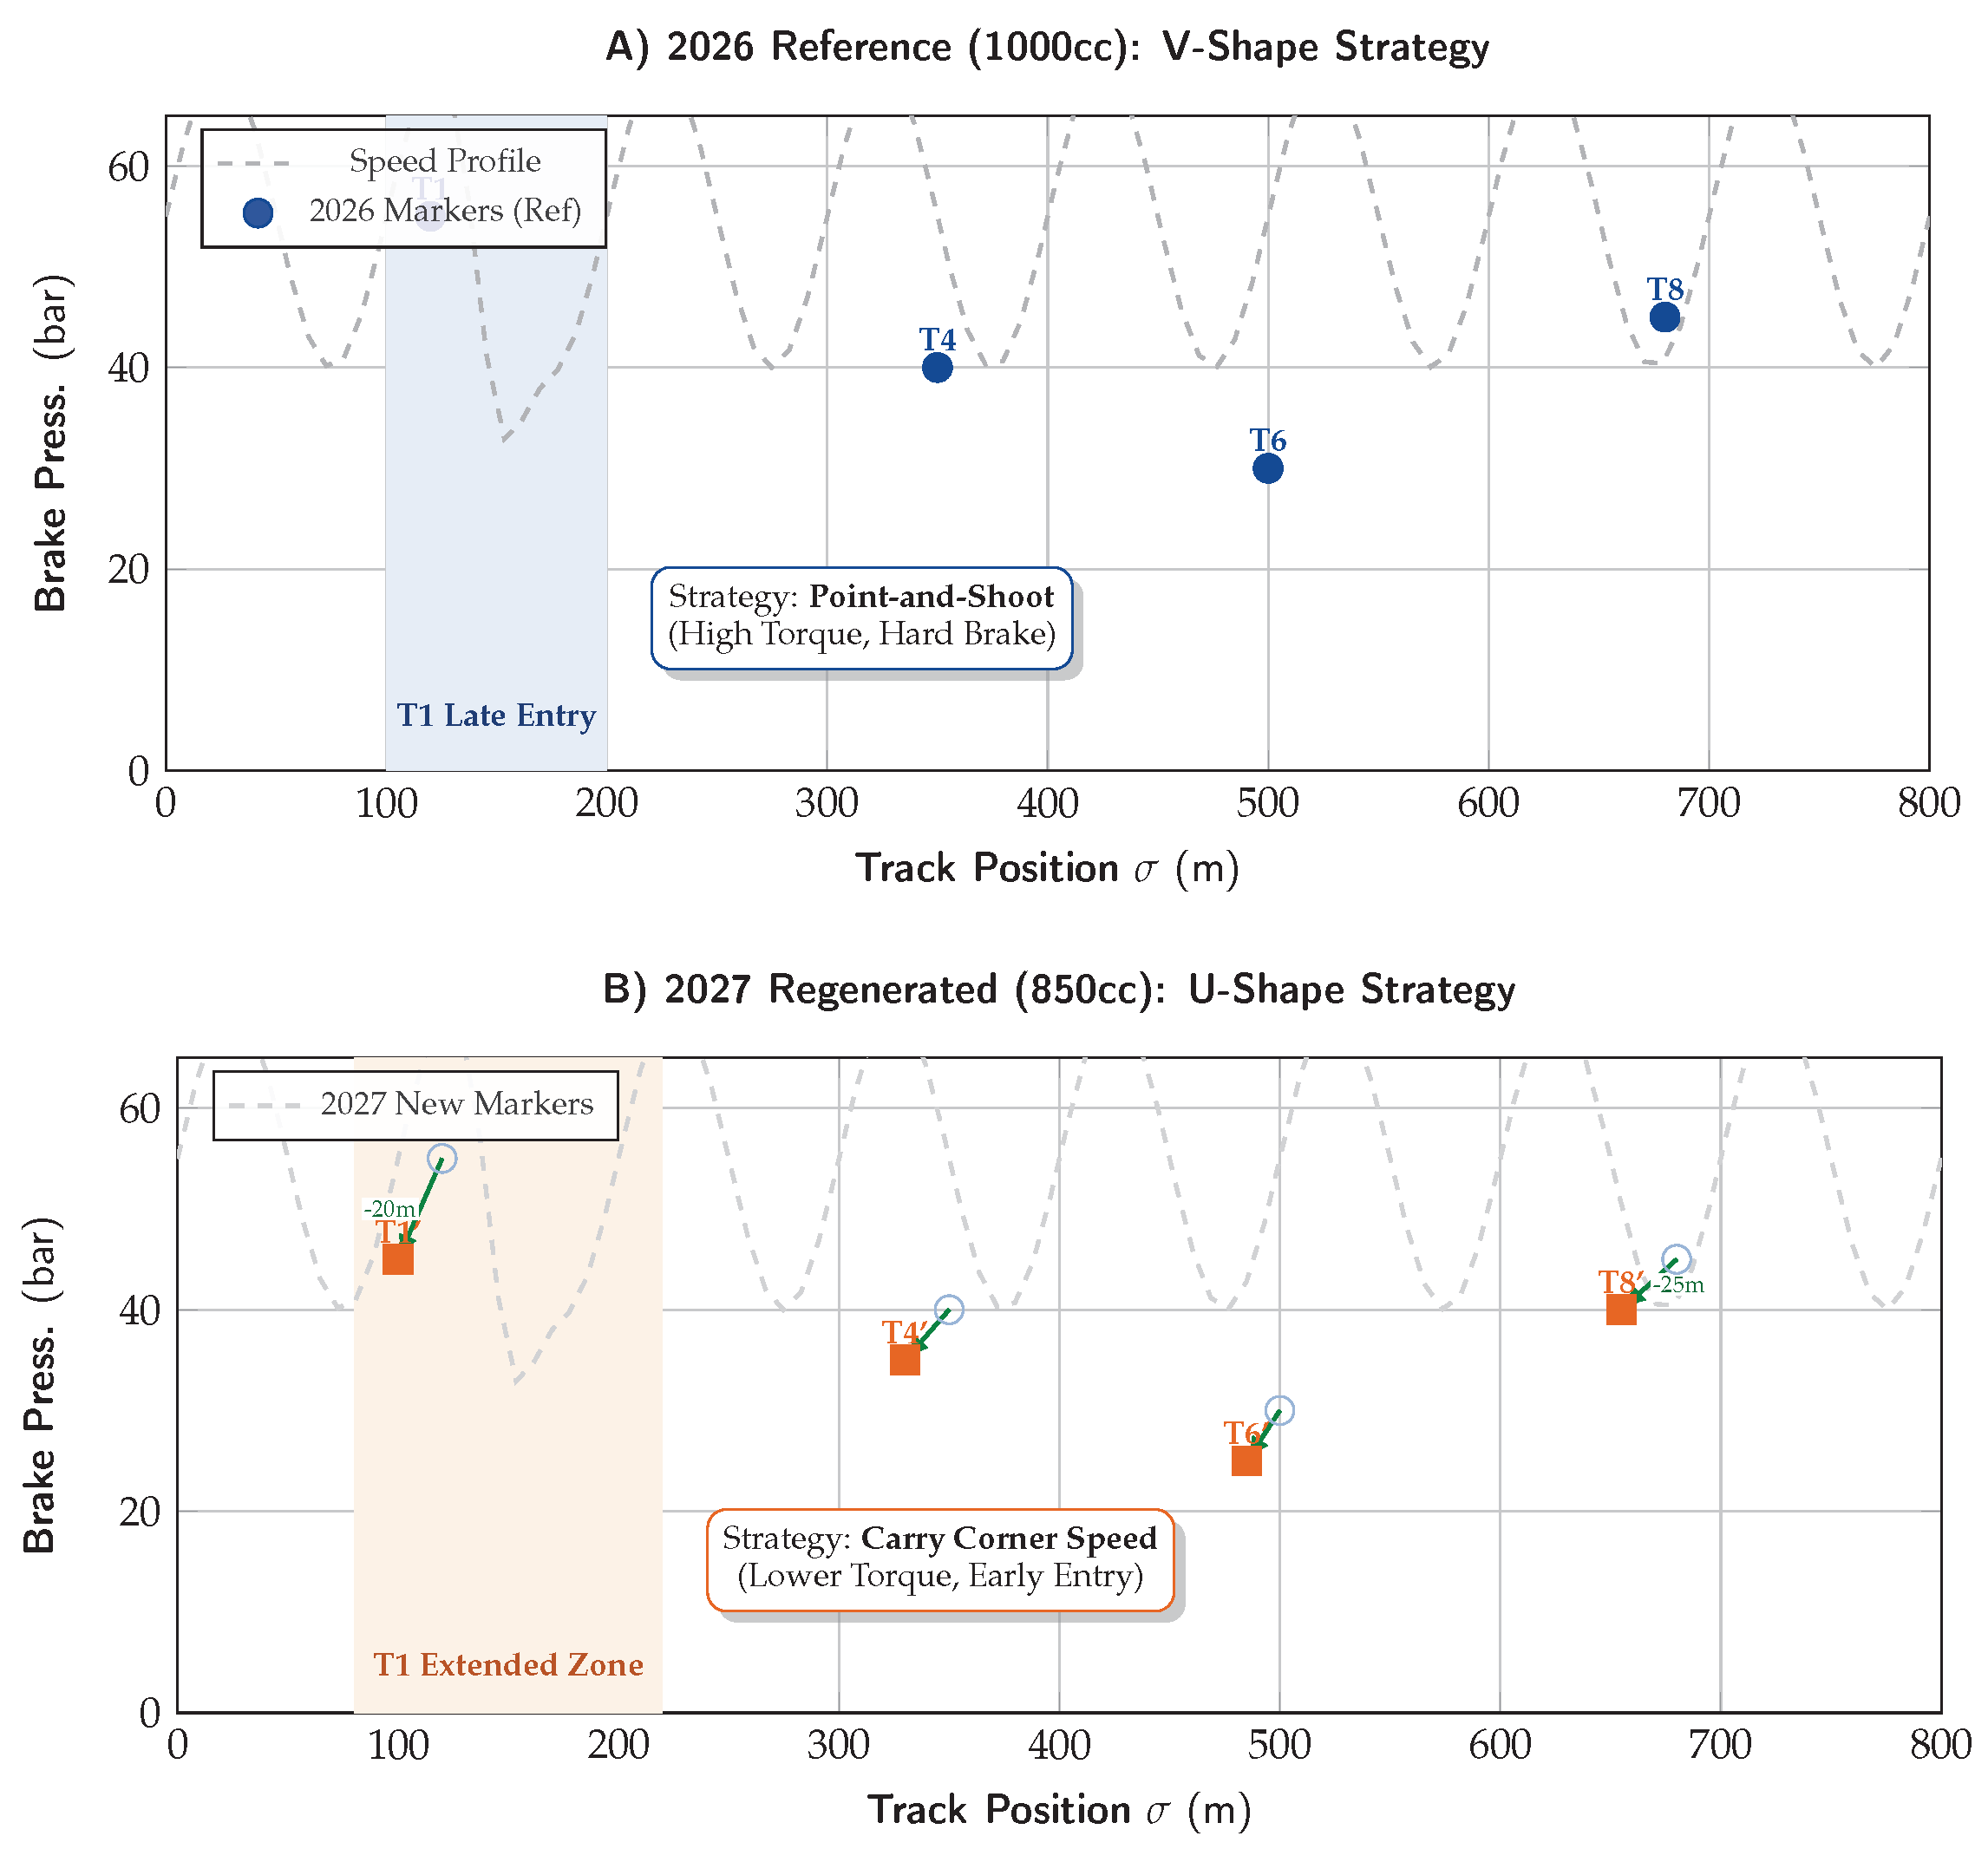
Figure 15.
RAG Precision Analysis. Comparing retrieval quality before (A) and after (B) applying regulation constraints. By zooming the similarity axis (), we observe that unfiltered retrieval prioritizes high-similarity but obsolete features (e.g., banned mechanics), whereas our domain filter ensures all retrieved exemplars are physically valid for the 2027 season.
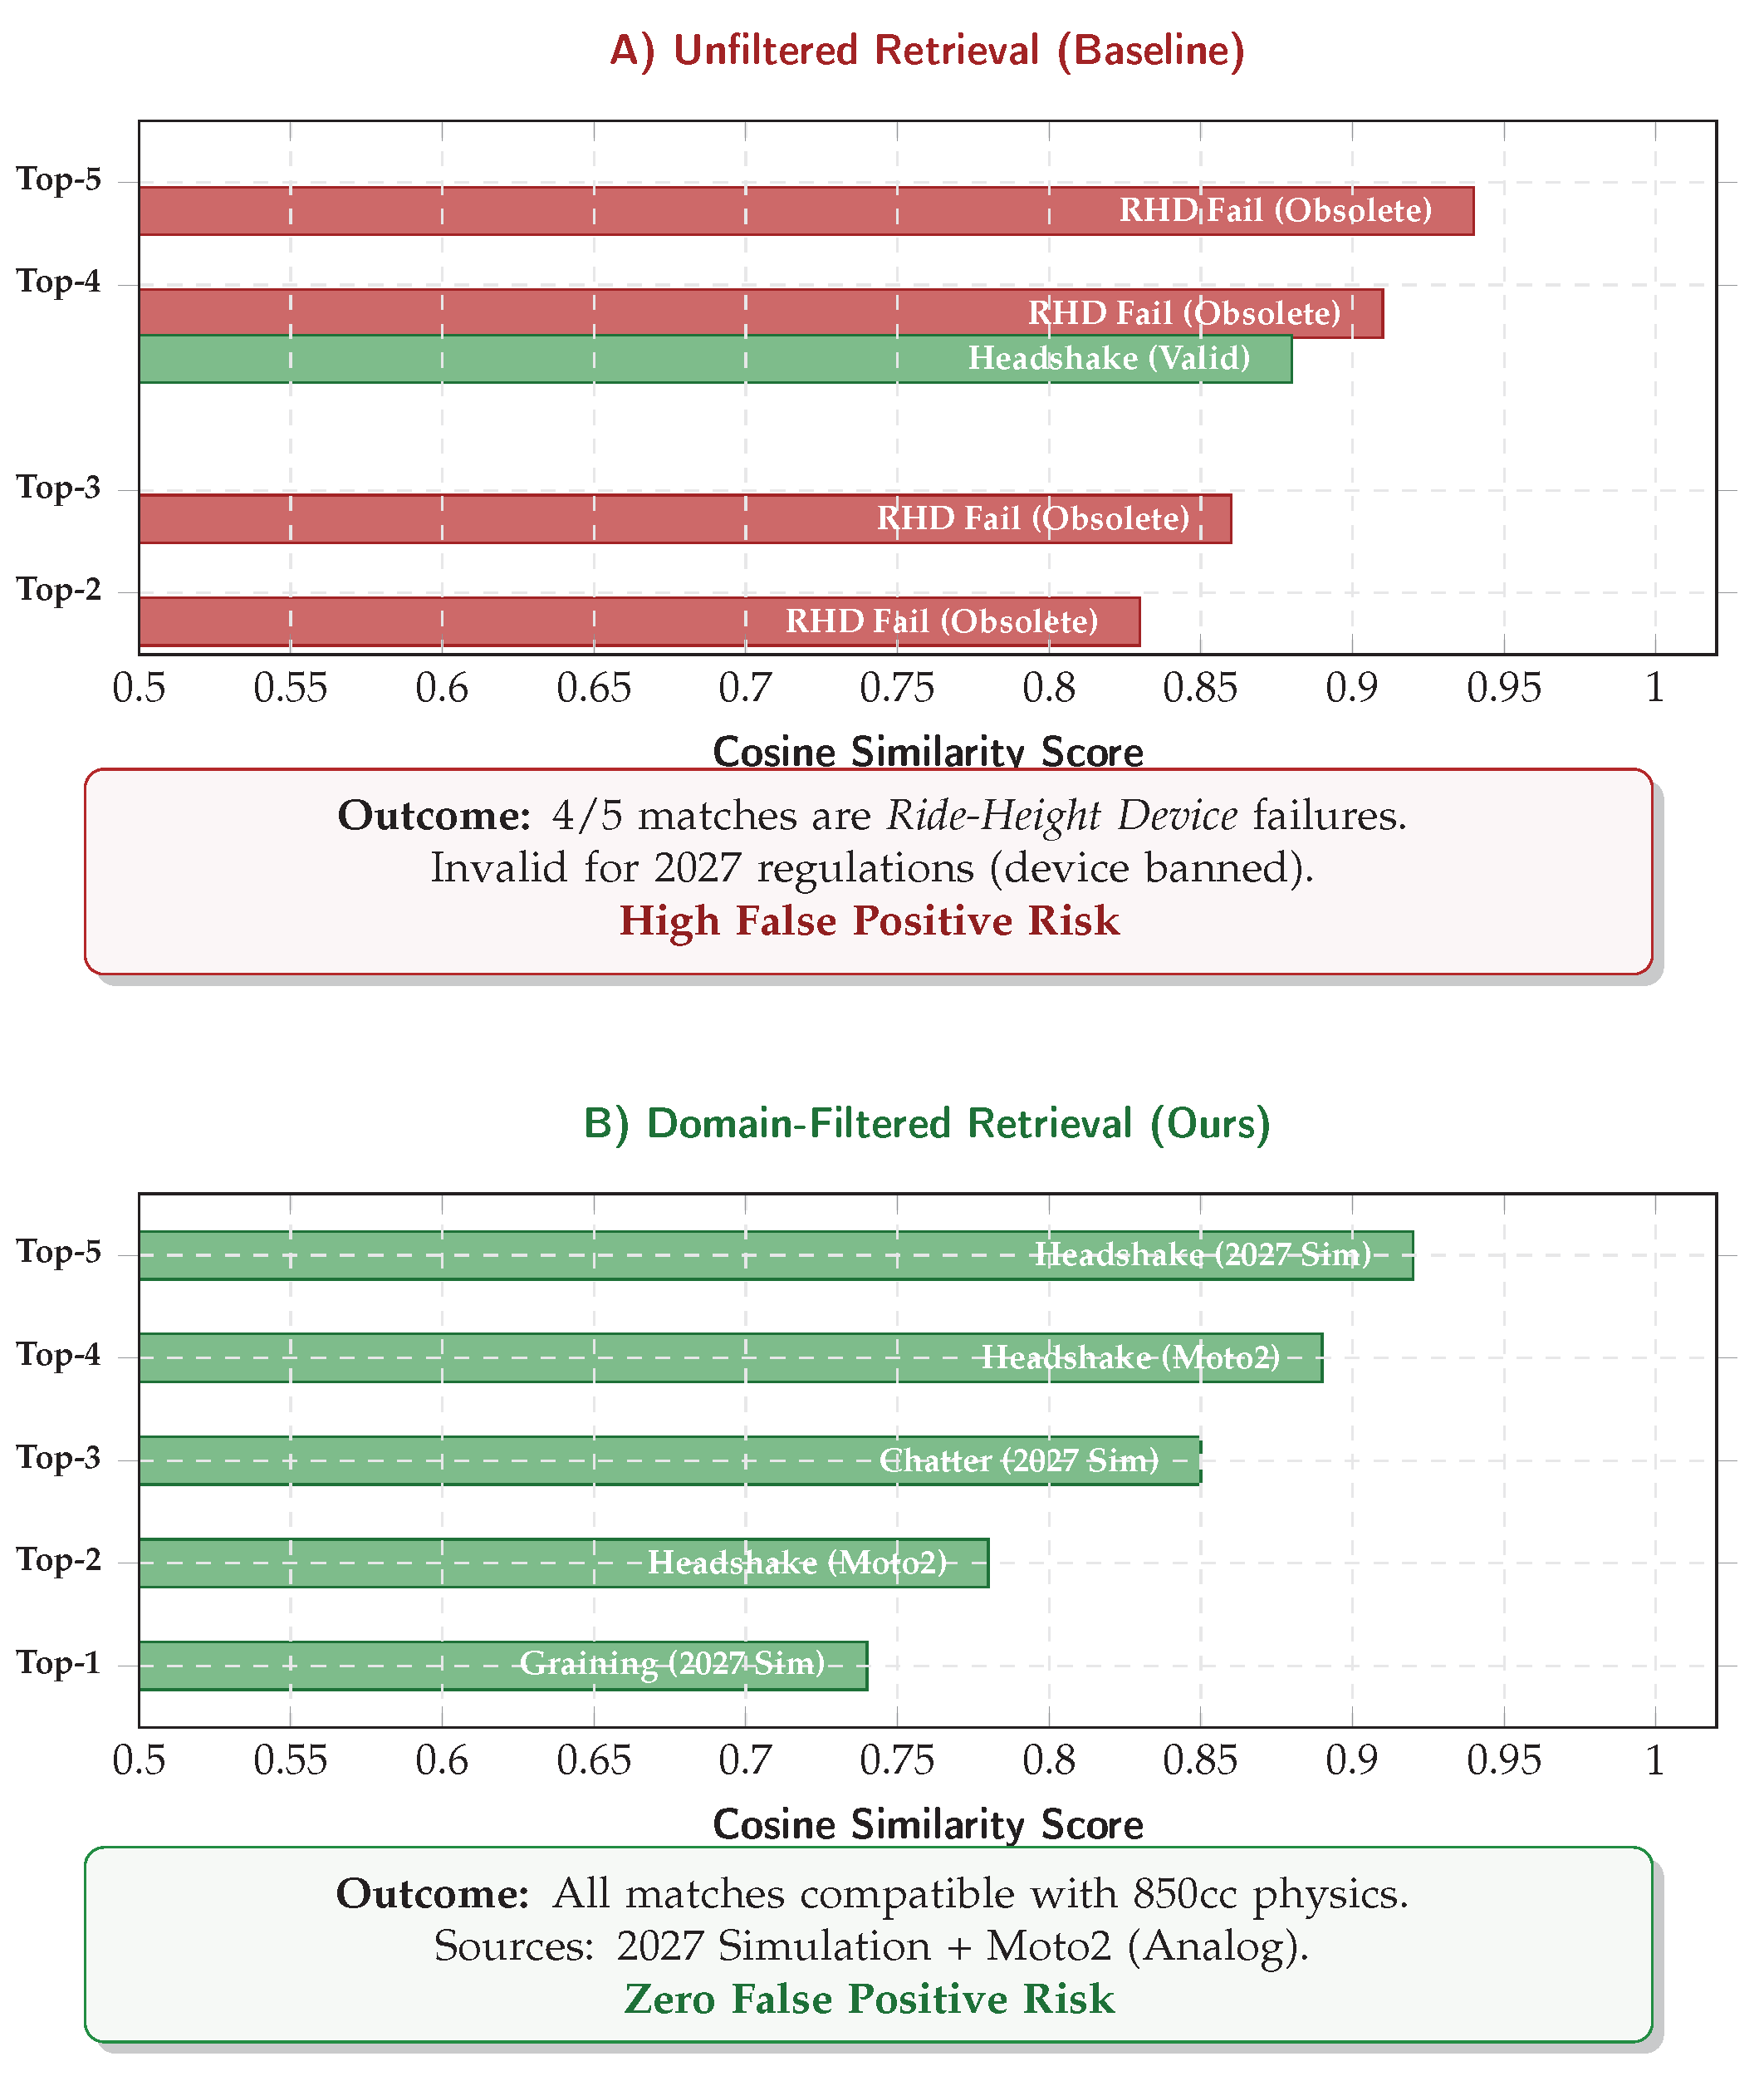
Figure 16.
Scenario B Spatial Heatmap. The track coloring visualizes the system’s routing decision during the "Mechanical Stress" test. The system maintains efficient CAG mode (Green) on straights but correctly escalates to RAG (Red) in Sector 3/4 where the suspension chatter anomaly manifests.
Figure 16.
Scenario B Spatial Heatmap. The track coloring visualizes the system’s routing decision during the "Mechanical Stress" test. The system maintains efficient CAG mode (Green) on straights but correctly escalates to RAG (Red) in Sector 3/4 where the suspension chatter anomaly manifests.
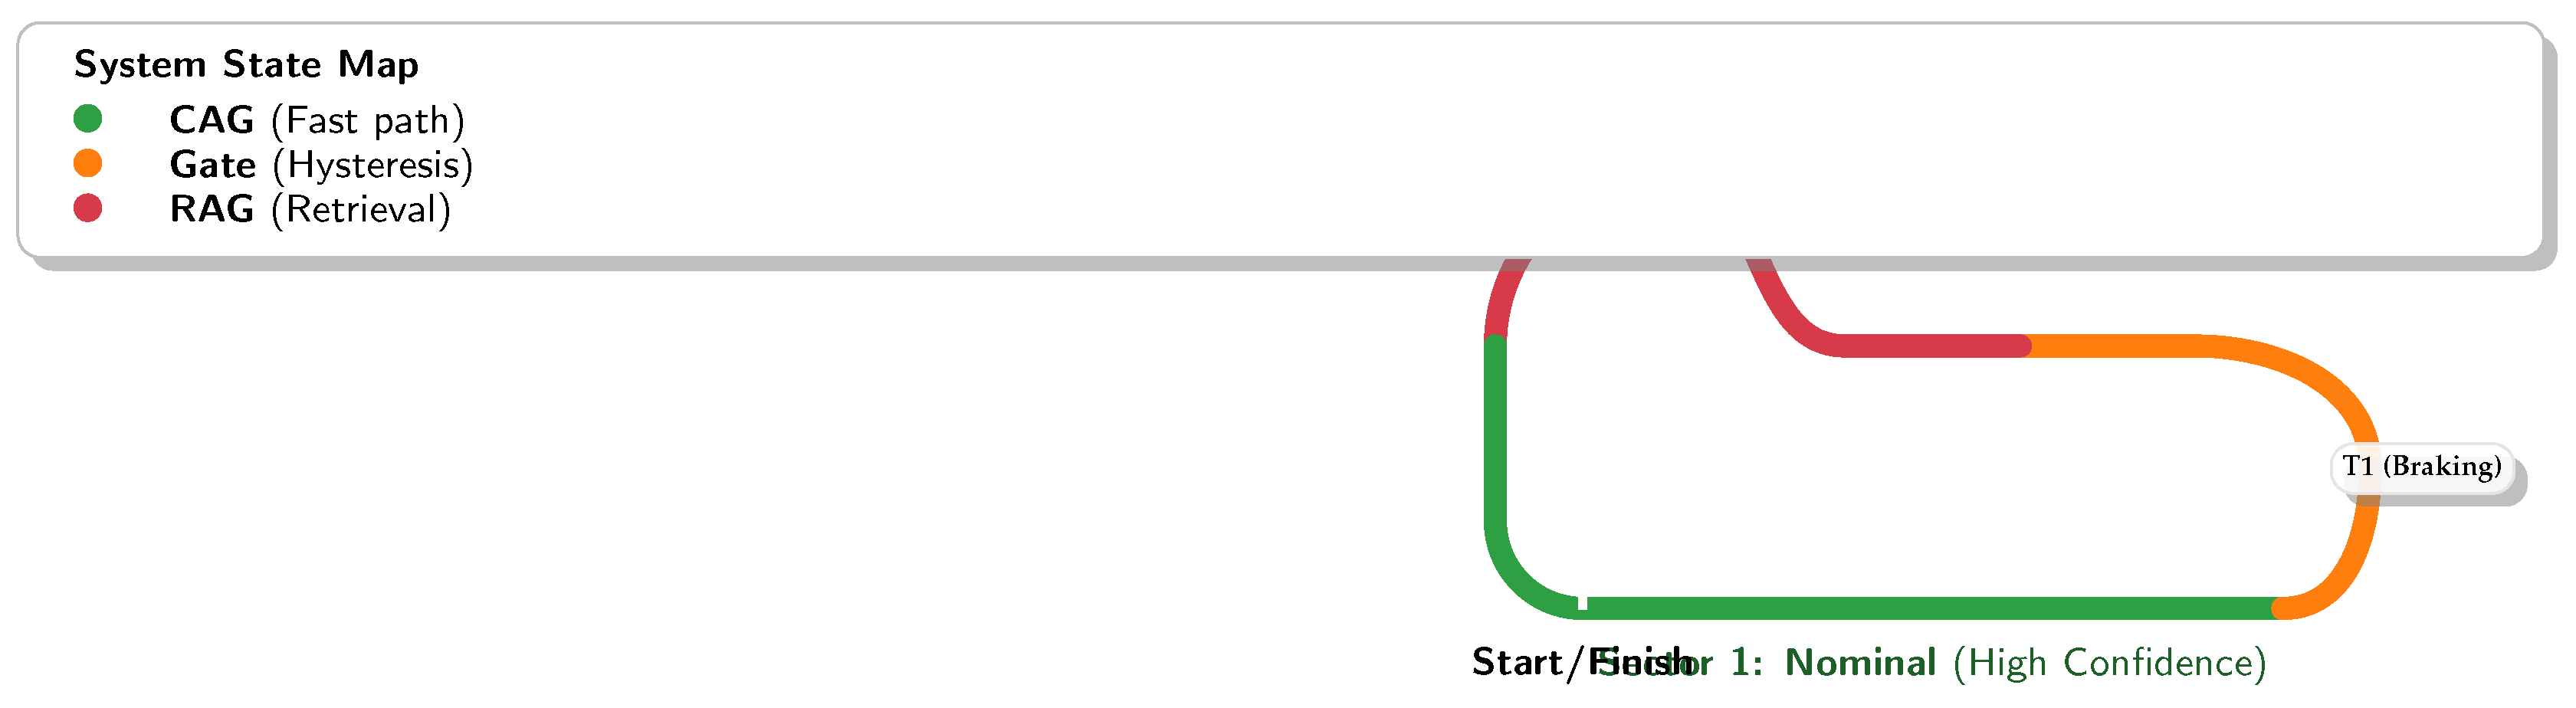
| System State Map | |
| [fill=caggreen, draw=none] (0,0) circle (0.8ex); | CAG (Fast path) |
| [fill=warnorange, draw=none] (0,0) circle (0.8ex); | Gate (Hysteresis) |
| [fill=ragred, draw=none] (0,0) circle (0.8ex); | RAG (Retrieval) |
Figure 17.
Real-Time Safety Logic. A watchdog enforces deterministic latency. Frames exceeding the safety threshold are dropped (fail-silent) to prevent stale advisories.
Figure 17.
Real-Time Safety Logic. A watchdog enforces deterministic latency. Frames exceeding the safety threshold are dropped (fail-silent) to prevent stale advisories.
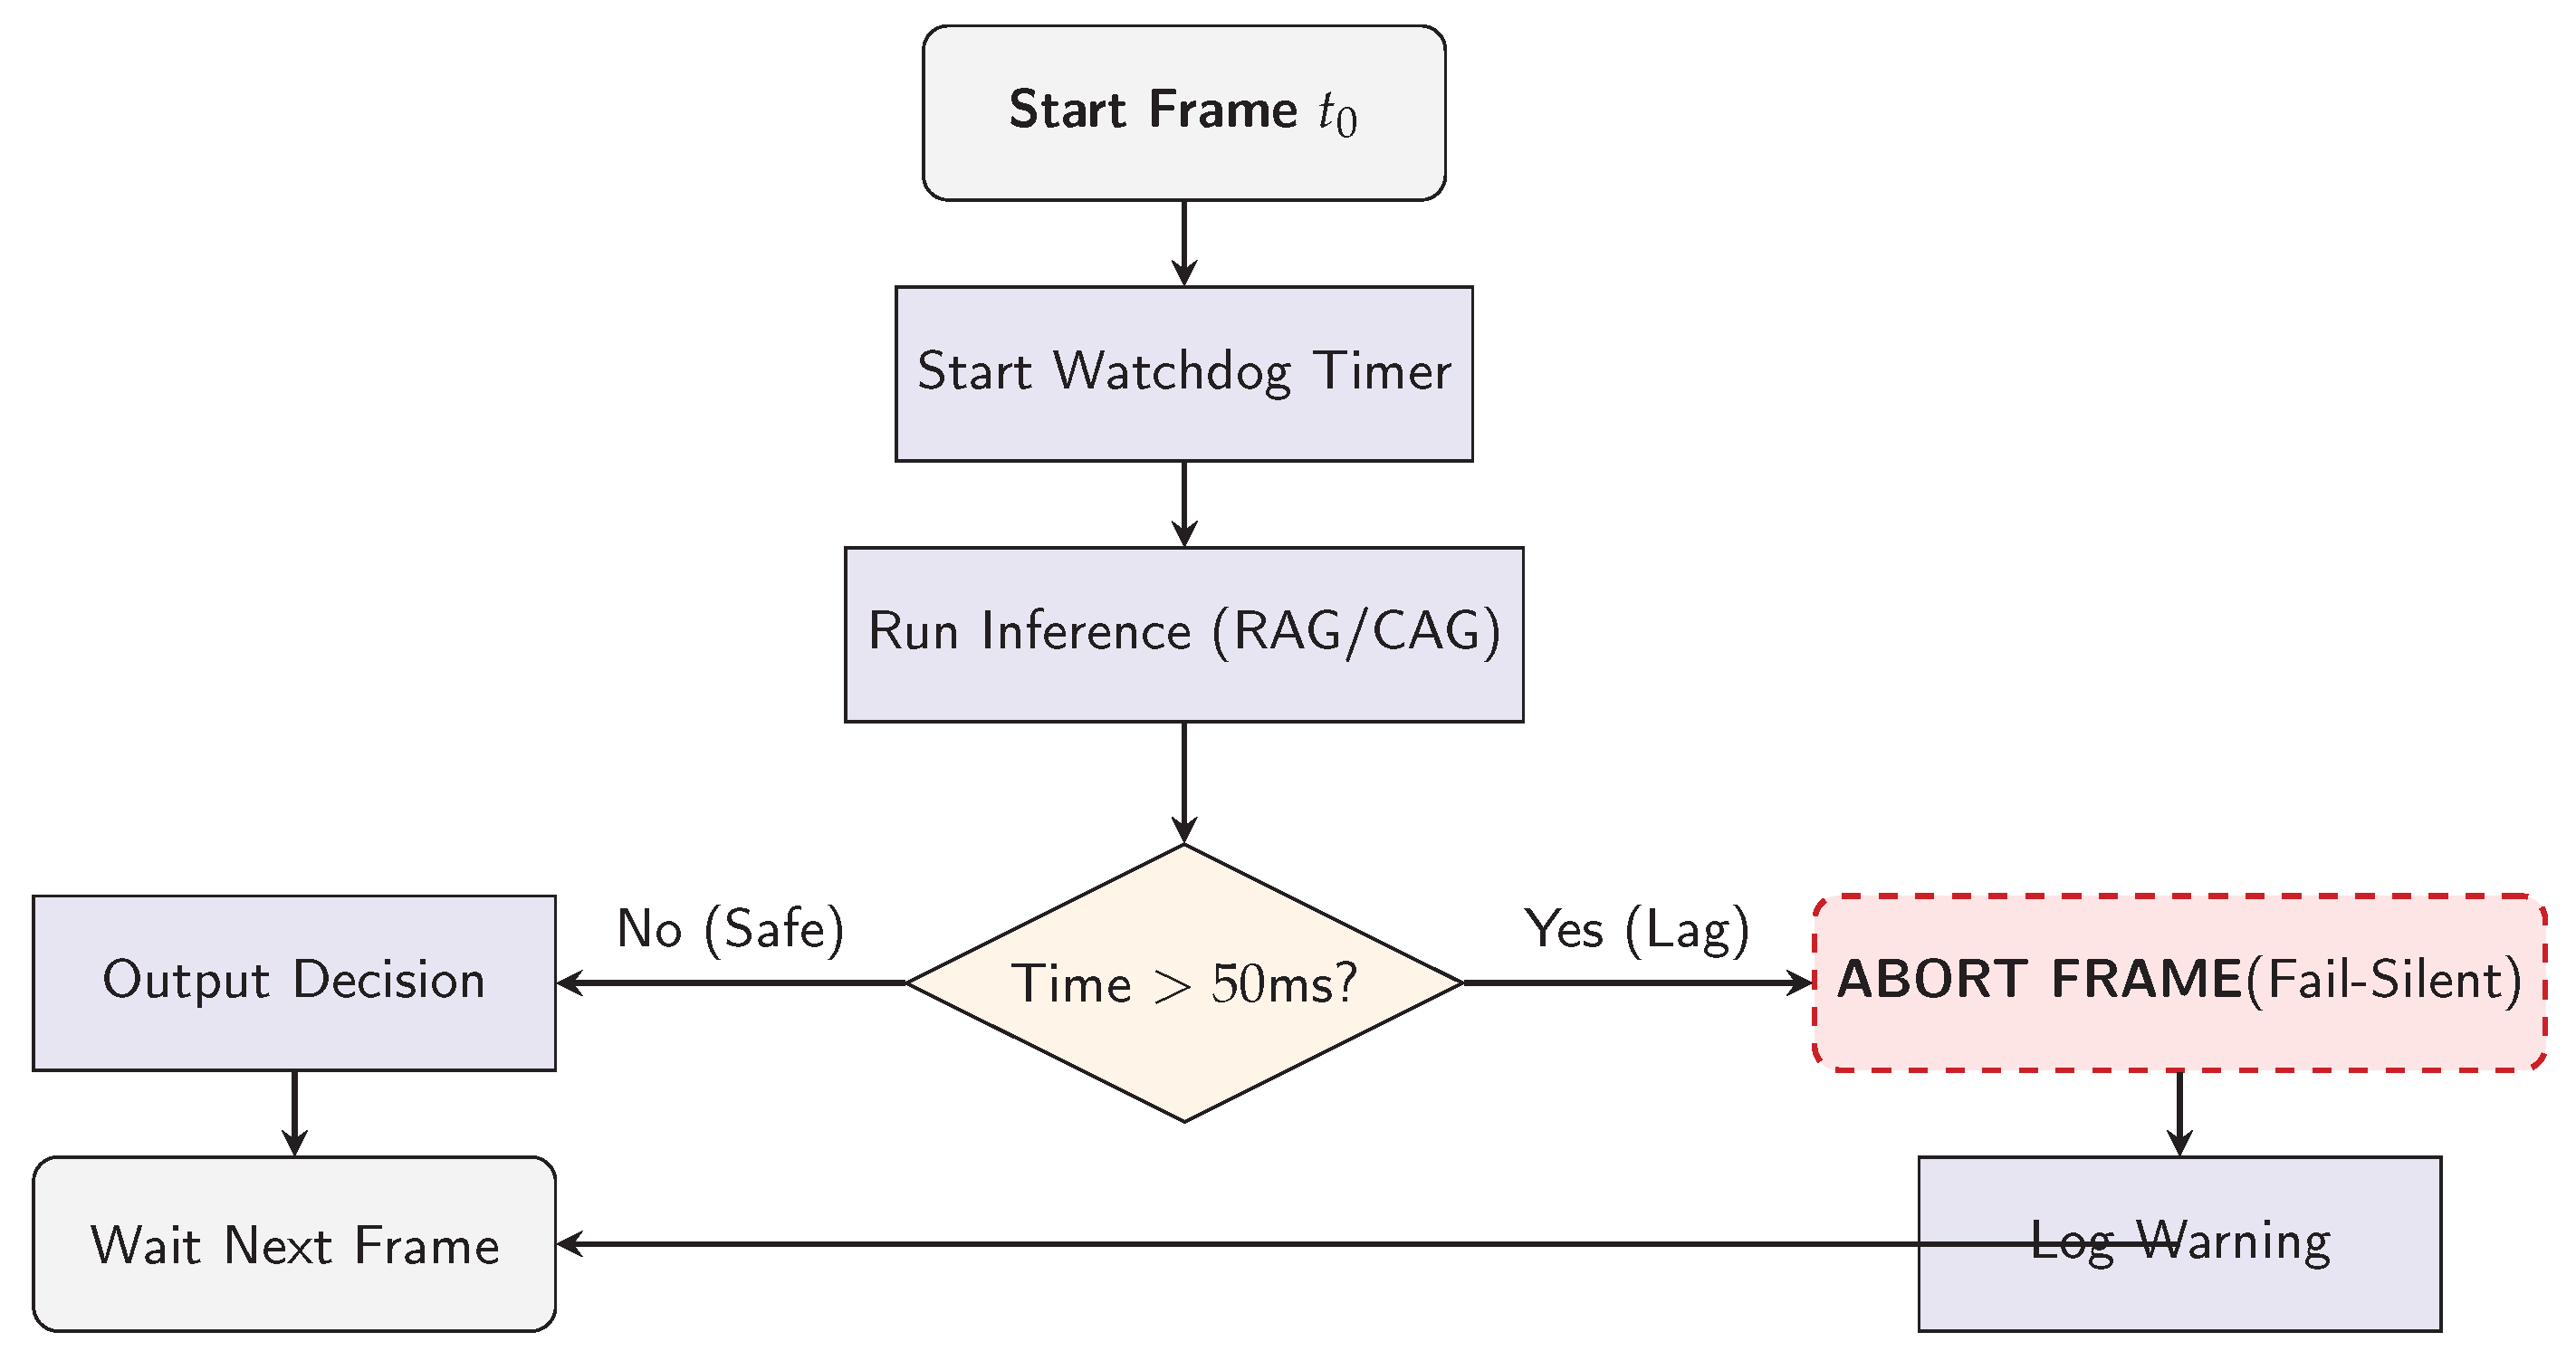
Figure 18.
Physical Integration Concept for 2027-Spec Prototype. Edge compute in the tail subframe for thermal management and mass centralization; shielded links for signal integrity; isolation mounting for vibration robustness.
Figure 18.
Physical Integration Concept for 2027-Spec Prototype. Edge compute in the tail subframe for thermal management and mass centralization; shielded links for signal integrity; isolation mounting for vibration robustness.
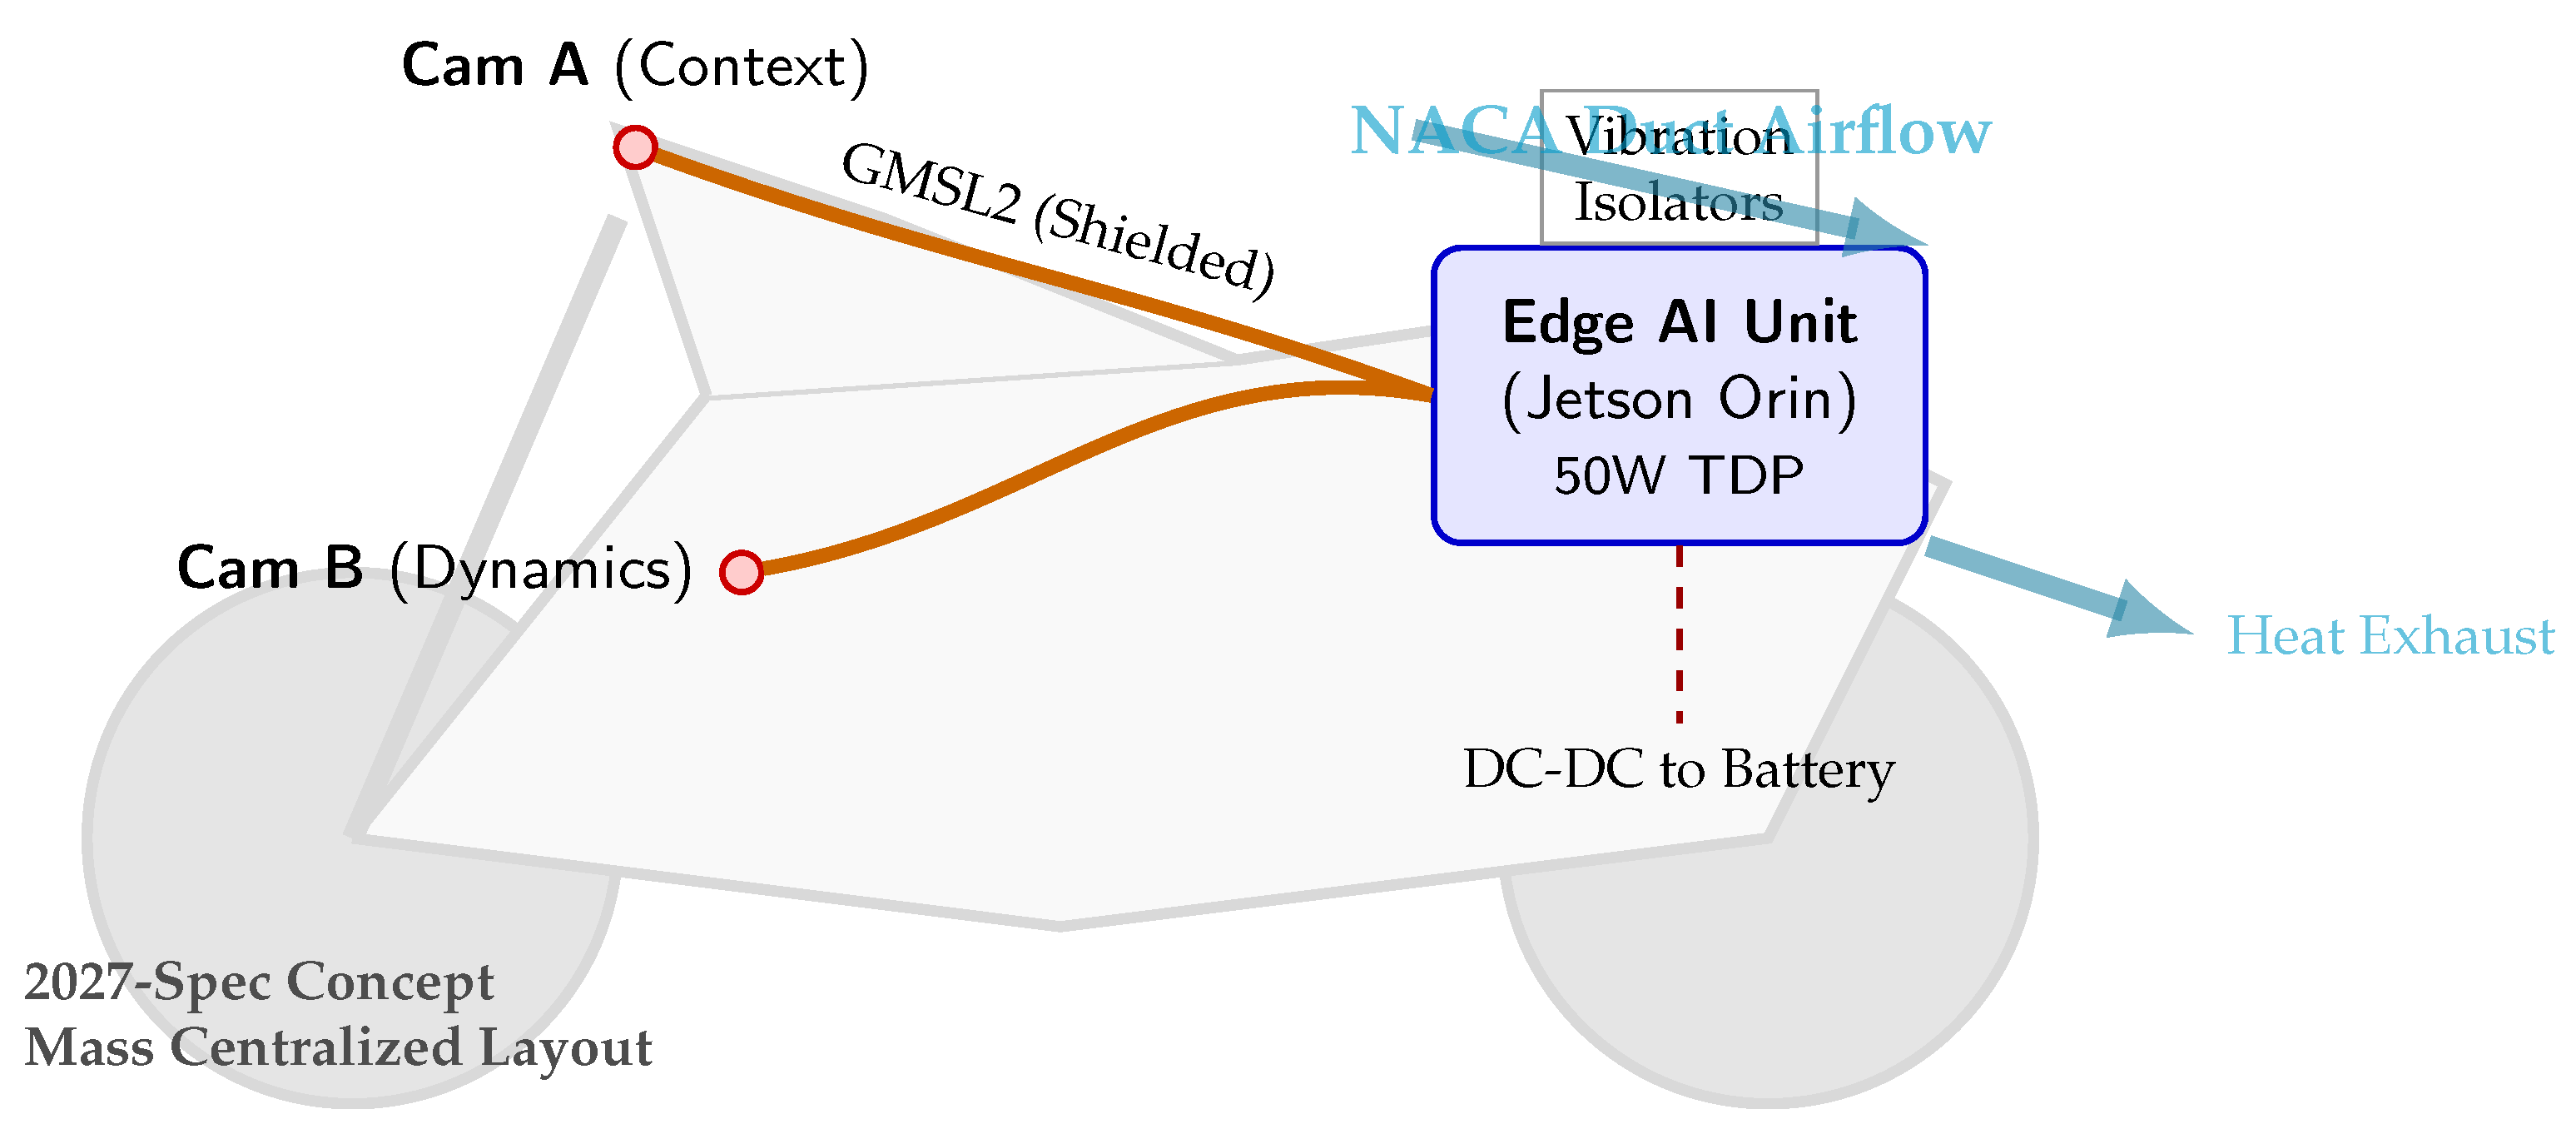
Figure 19.
Latency Optimization Results. A) ECDF showing tail risks. B1 (Blue) breaches the 50ms deadline significantly at P95. B5 (Green) effectively truncates the tail (P99=46.5ms) via hybrid gating. B) Latency breakdown reveals that B5 amortizes the expensive Retrieval cost (Red bar) by only triggering it during high-entropy events, unlike B1 which pays the full cost every frame.
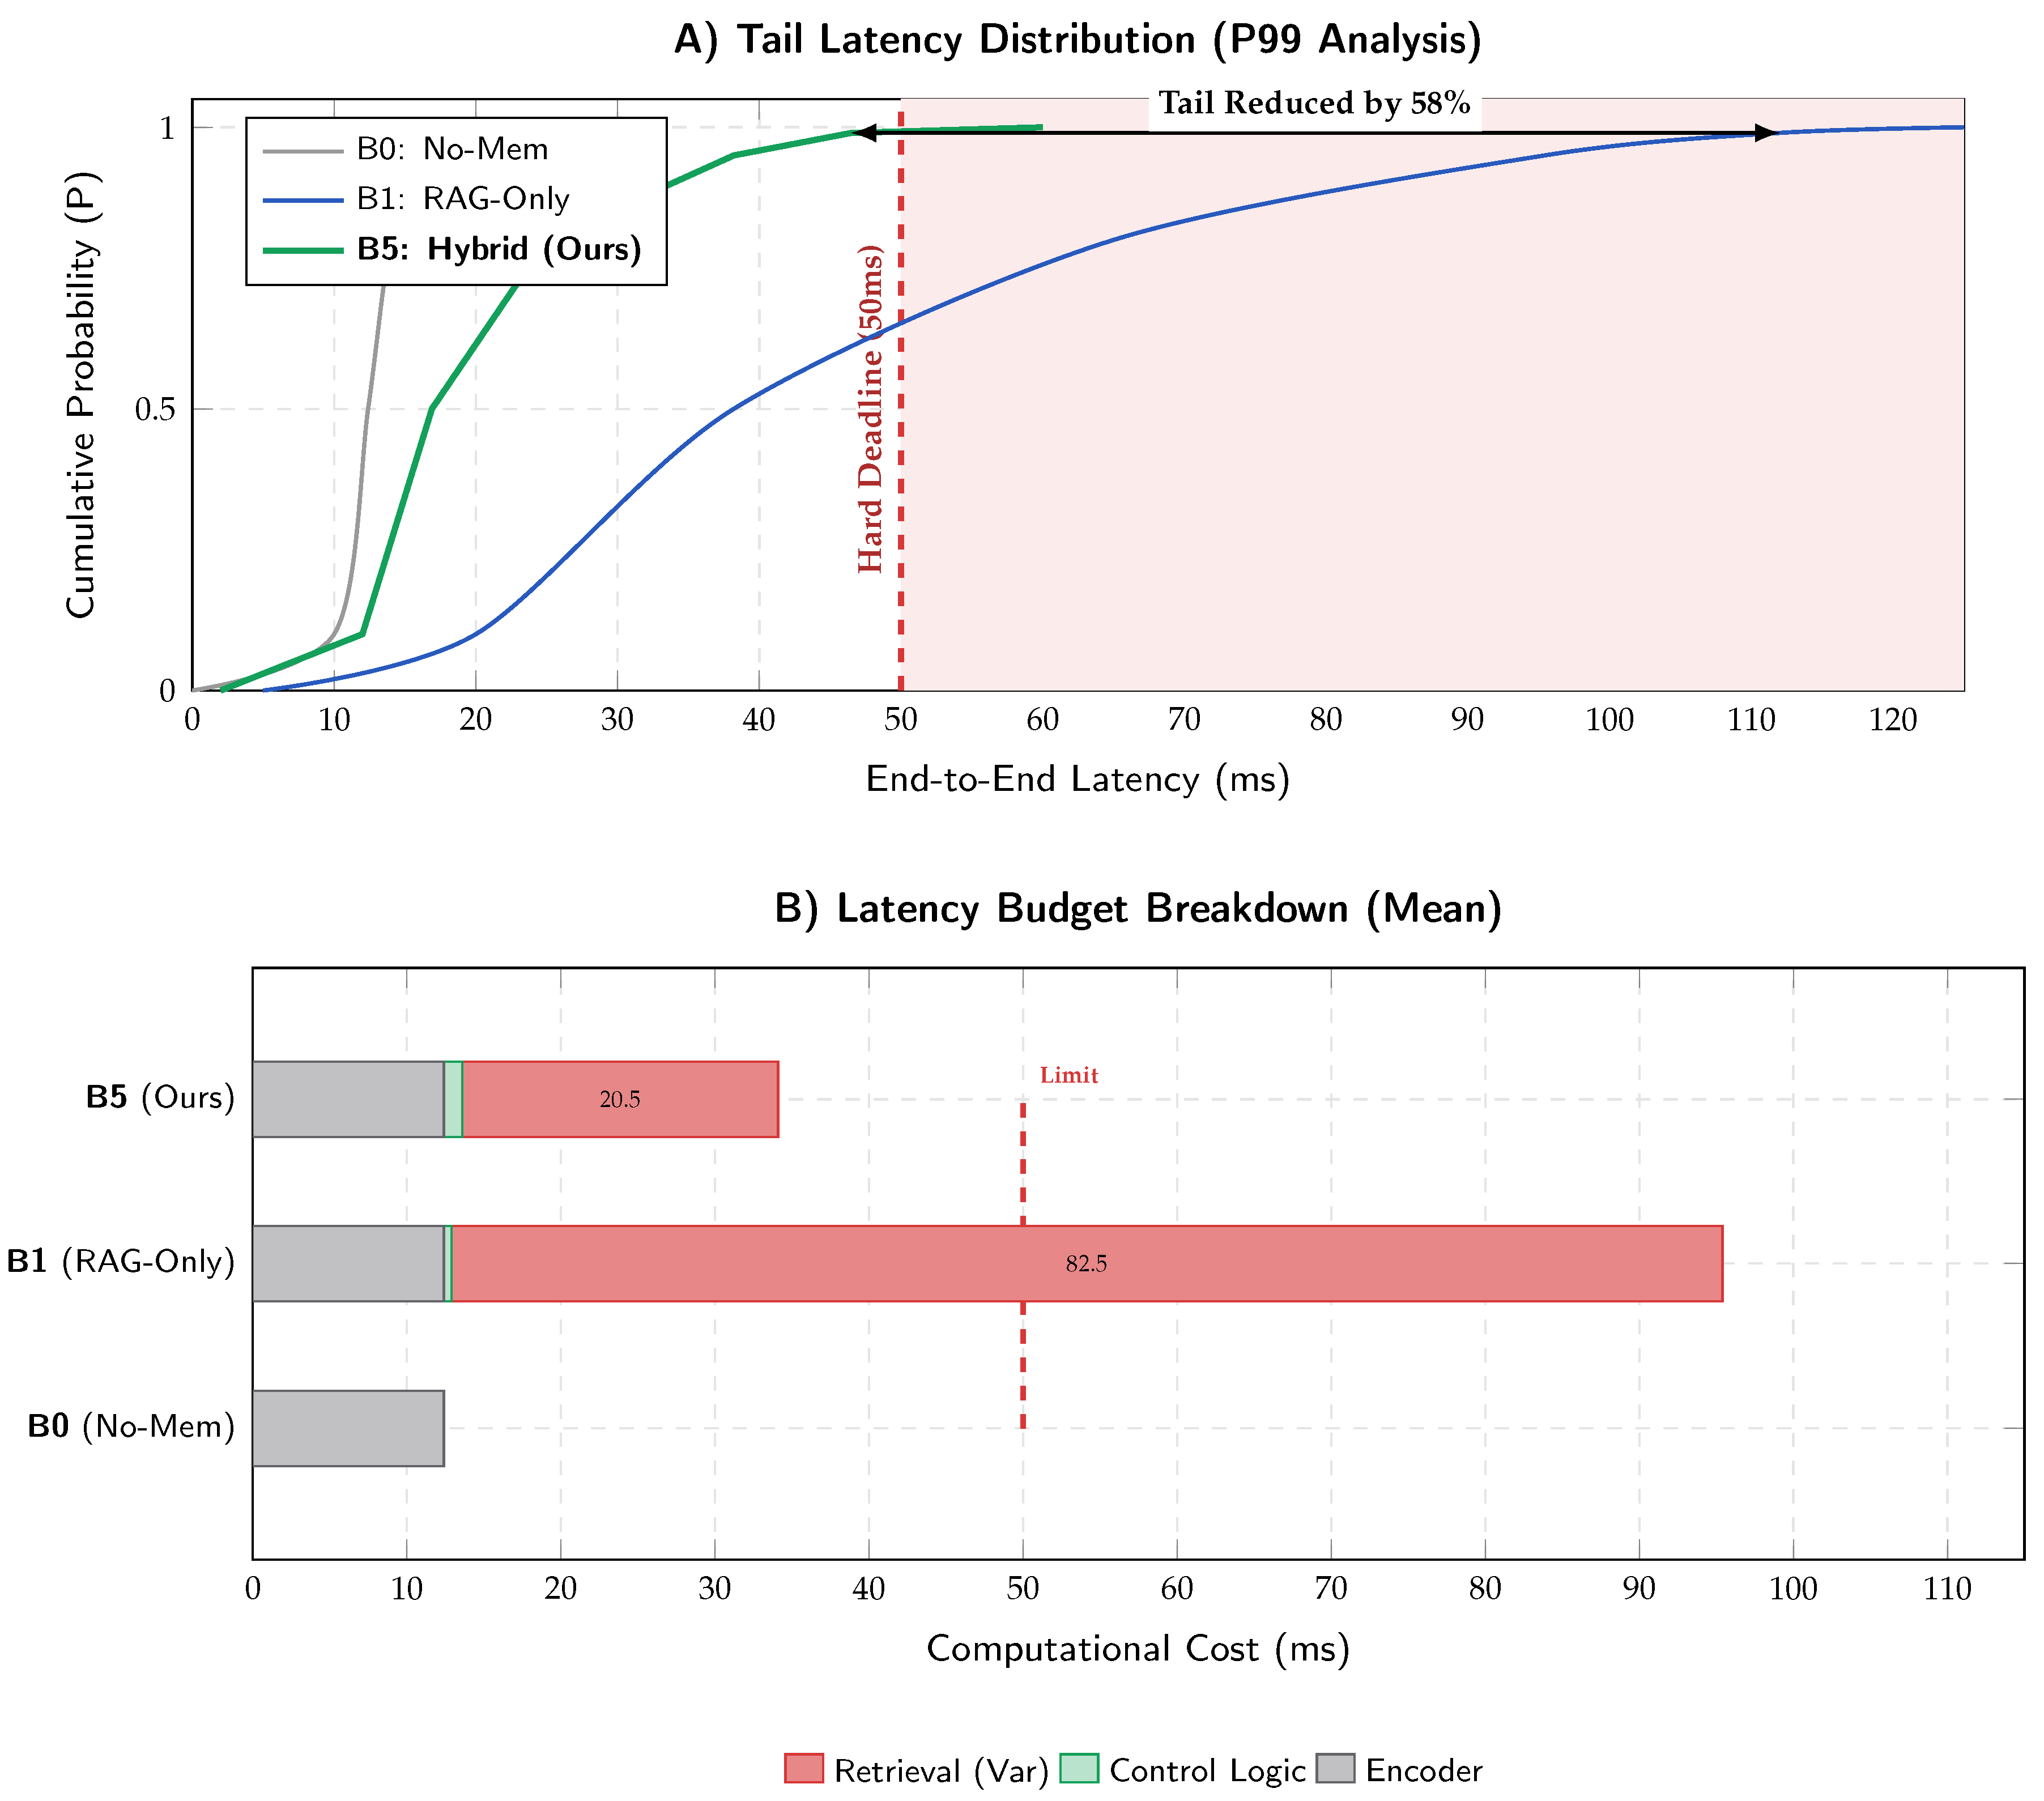
Figure 20.
F1-Score Analysis by Physics Regime. The proposed Hybrid architecture (B5, Green) matches baselines in static tasks but provides a decisive uplift in the Dynamic Regime (shaded area). The retrieval mechanism allows B5 to outperform the static baseline (B0, Gray) and the simple cache (B2, Orange) in oscillatory failure modes.
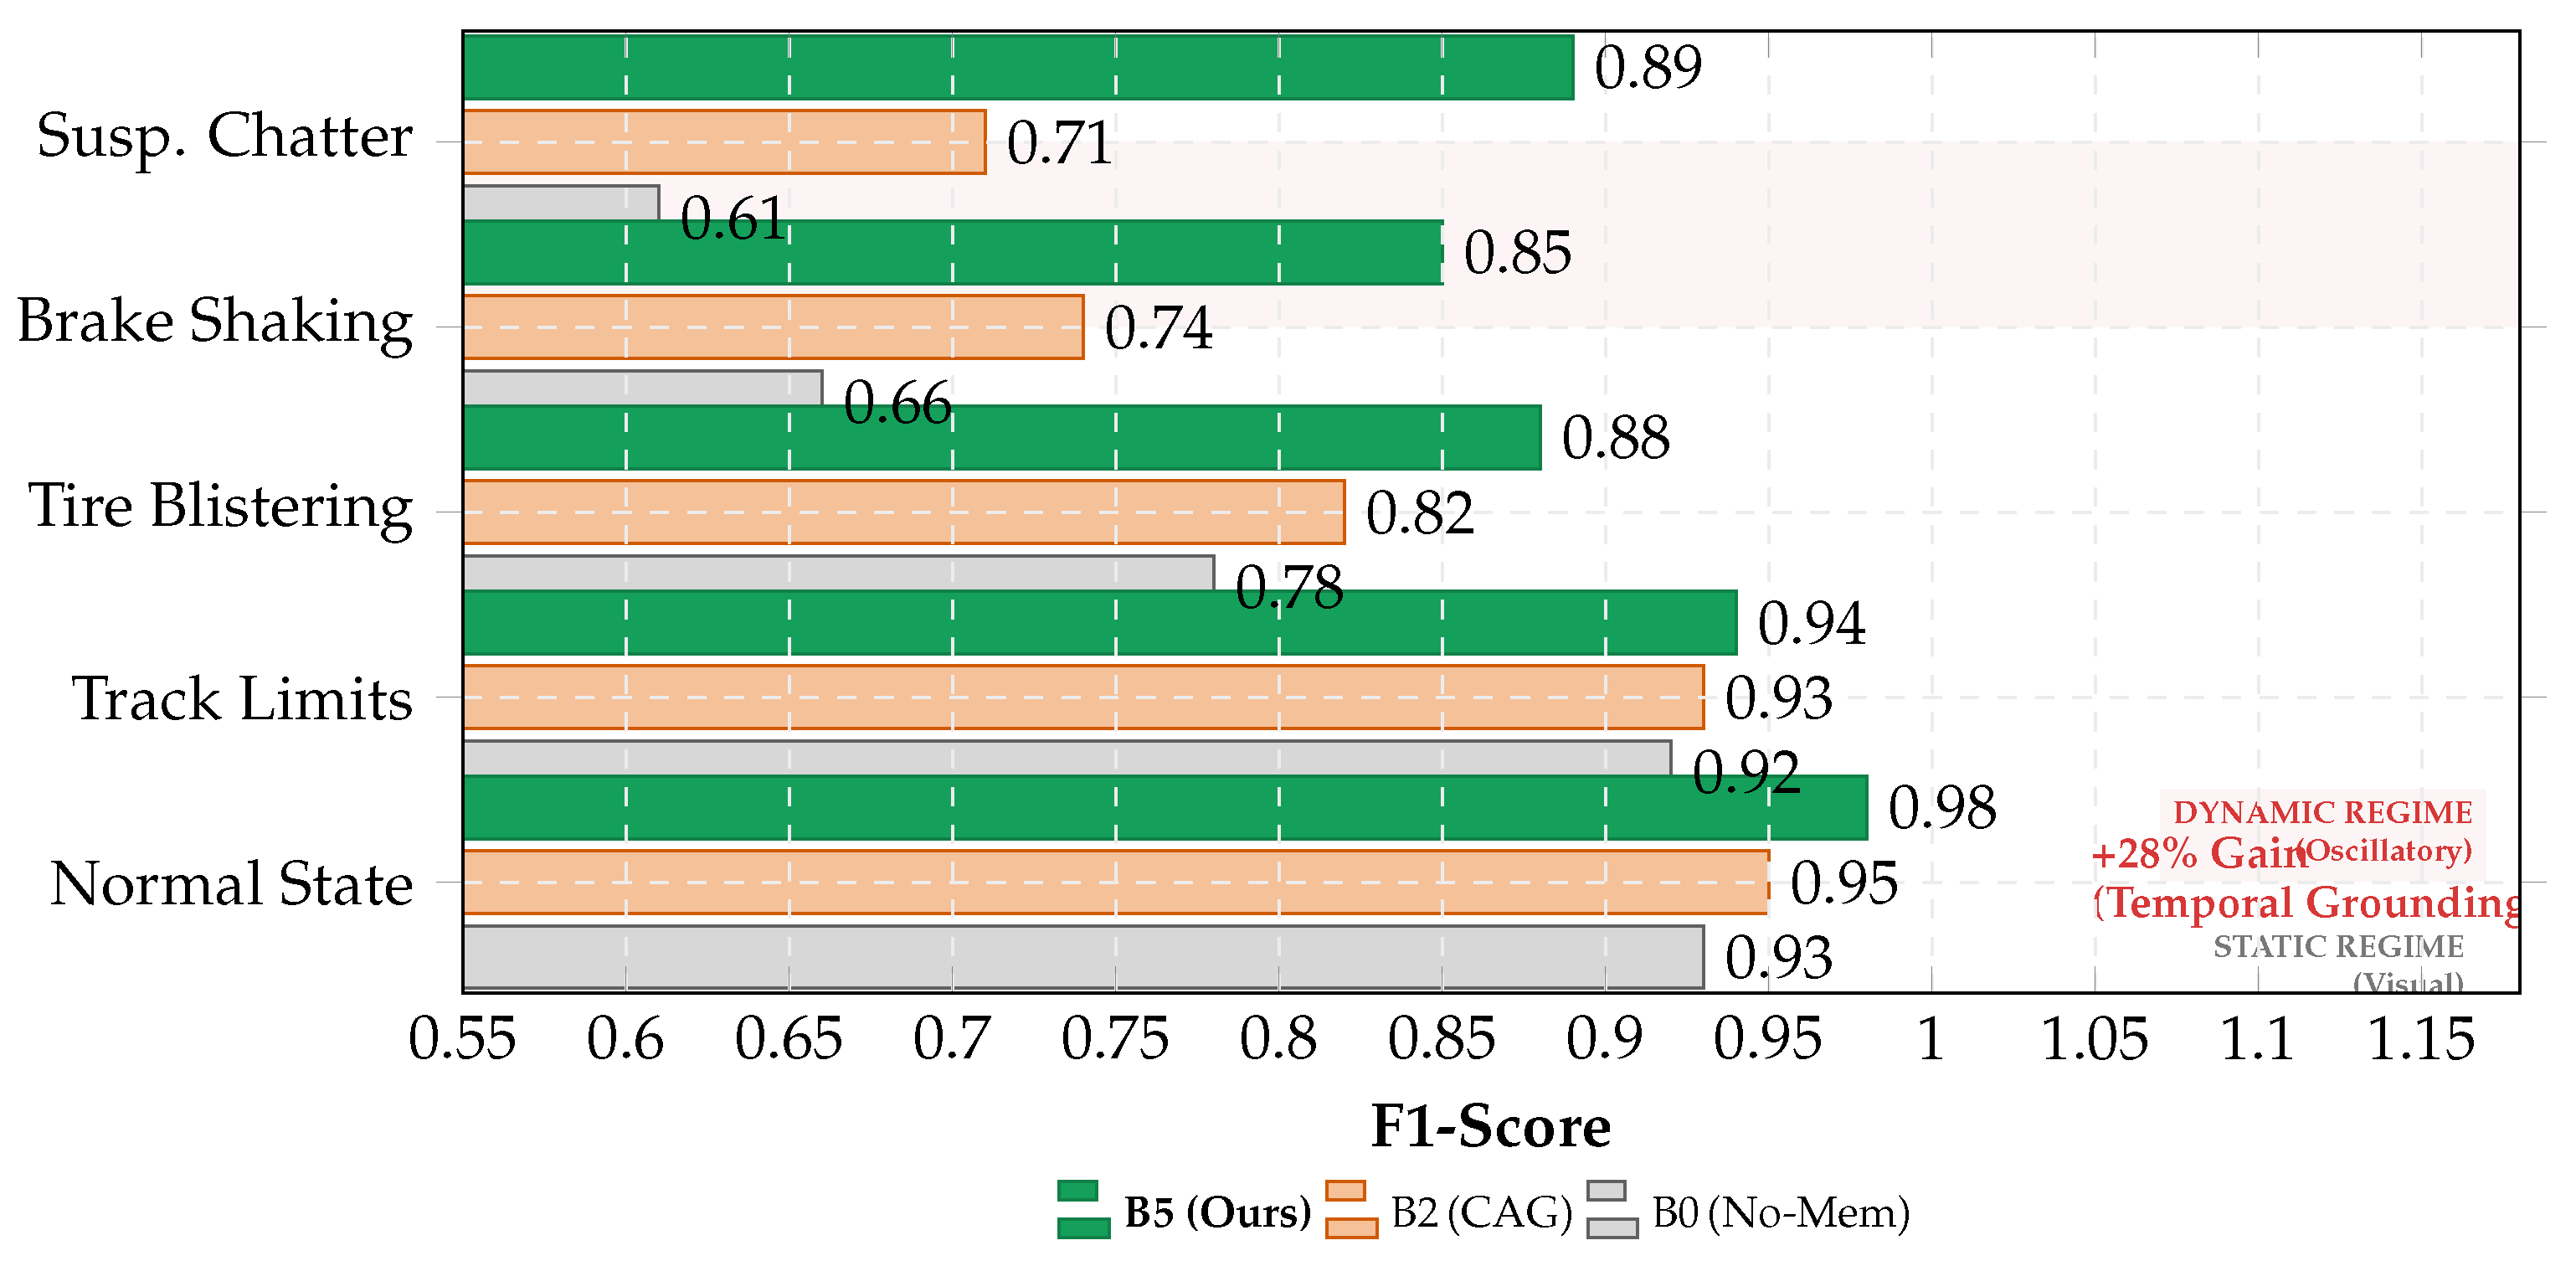
Figure 21.
Confusion Matrix Comparison (Suspension Chatter). Left (A): Baseline performance shows high risk of missed detection. Right (B): Proposed hybrid system significantly increases True Positives (TP) and reduces safety-critical False Negatives (FN).
Figure 21.
Confusion Matrix Comparison (Suspension Chatter). Left (A): Baseline performance shows high risk of missed detection. Right (B): Proposed hybrid system significantly increases True Positives (TP) and reduces safety-critical False Negatives (FN).
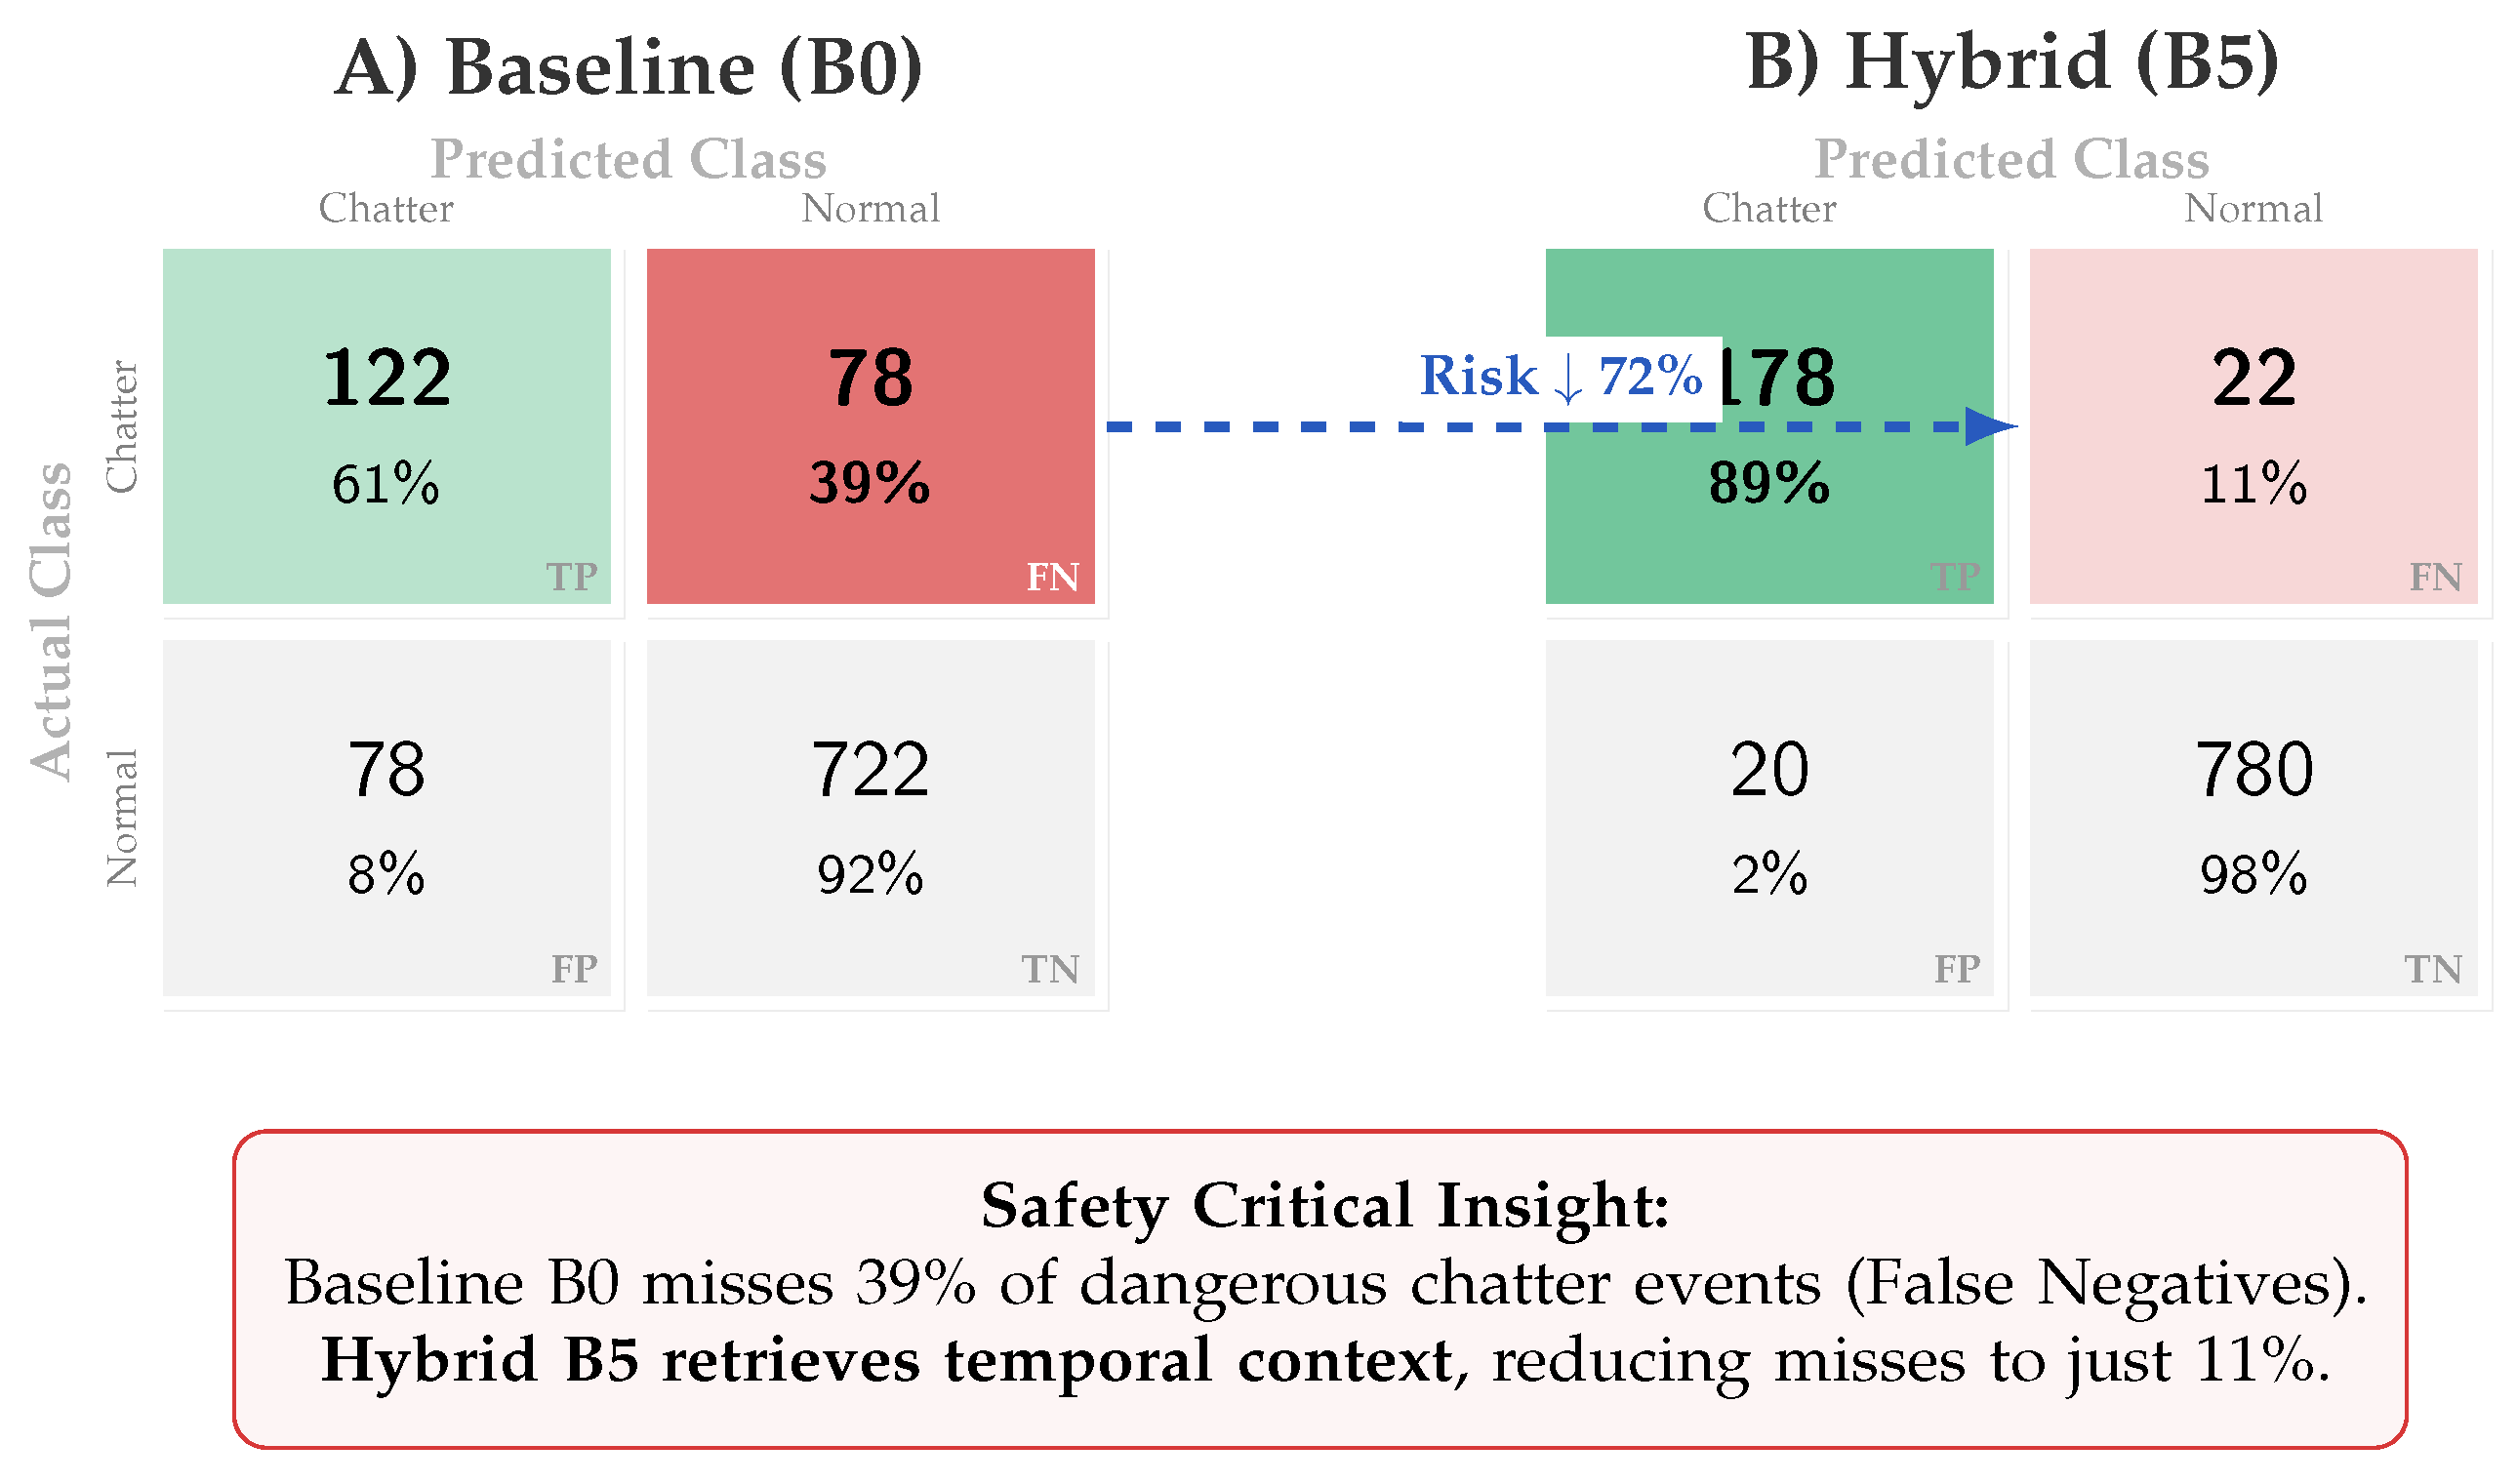
Figure 23.
Operational Burden Analysis. At a mandatory safety recall of 90%, the memoryless baseline (B0) overwhelms the operator with false alarms (FAR 1.27). The proposed B5 system (Green) suppresses spurious warnings, keeping the False Alarm Ratio well below 1.0.
Figure 23.
Operational Burden Analysis. At a mandatory safety recall of 90%, the memoryless baseline (B0) overwhelms the operator with false alarms (FAR 1.27). The proposed B5 system (Green) suppresses spurious warnings, keeping the False Alarm Ratio well below 1.0.
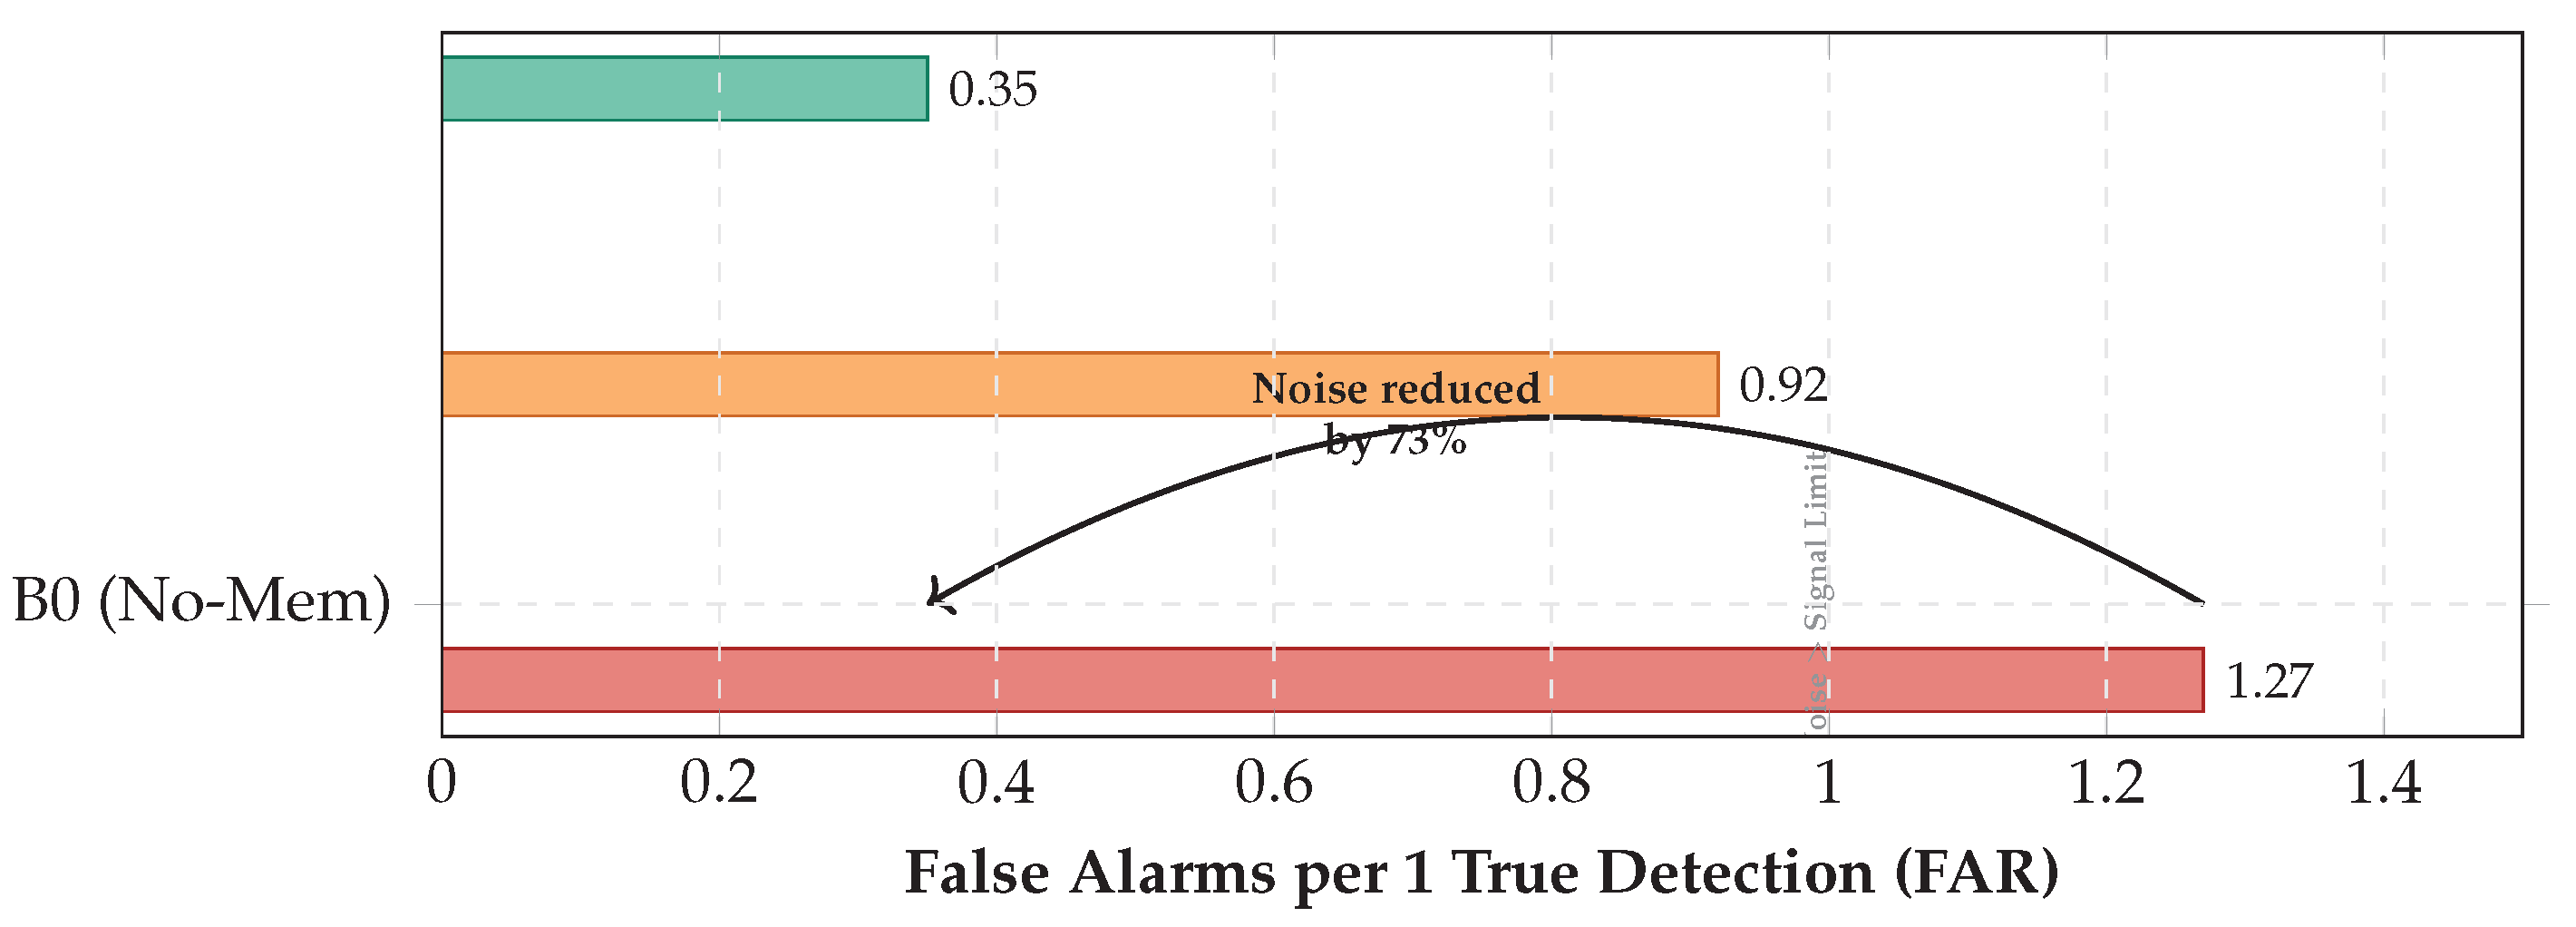
Figure 24.
Performance Stability across Scenarios. While the baseline (Gray) degrades under stress, our Hybrid method (Teal) maintains robustness comparable to the expensive RAG oracle (Purple), validating its suitability for variable racing conditions.
Figure 24.
Performance Stability across Scenarios. While the baseline (Gray) degrades under stress, our Hybrid method (Teal) maintains robustness comparable to the expensive RAG oracle (Purple), validating its suitability for variable racing conditions.
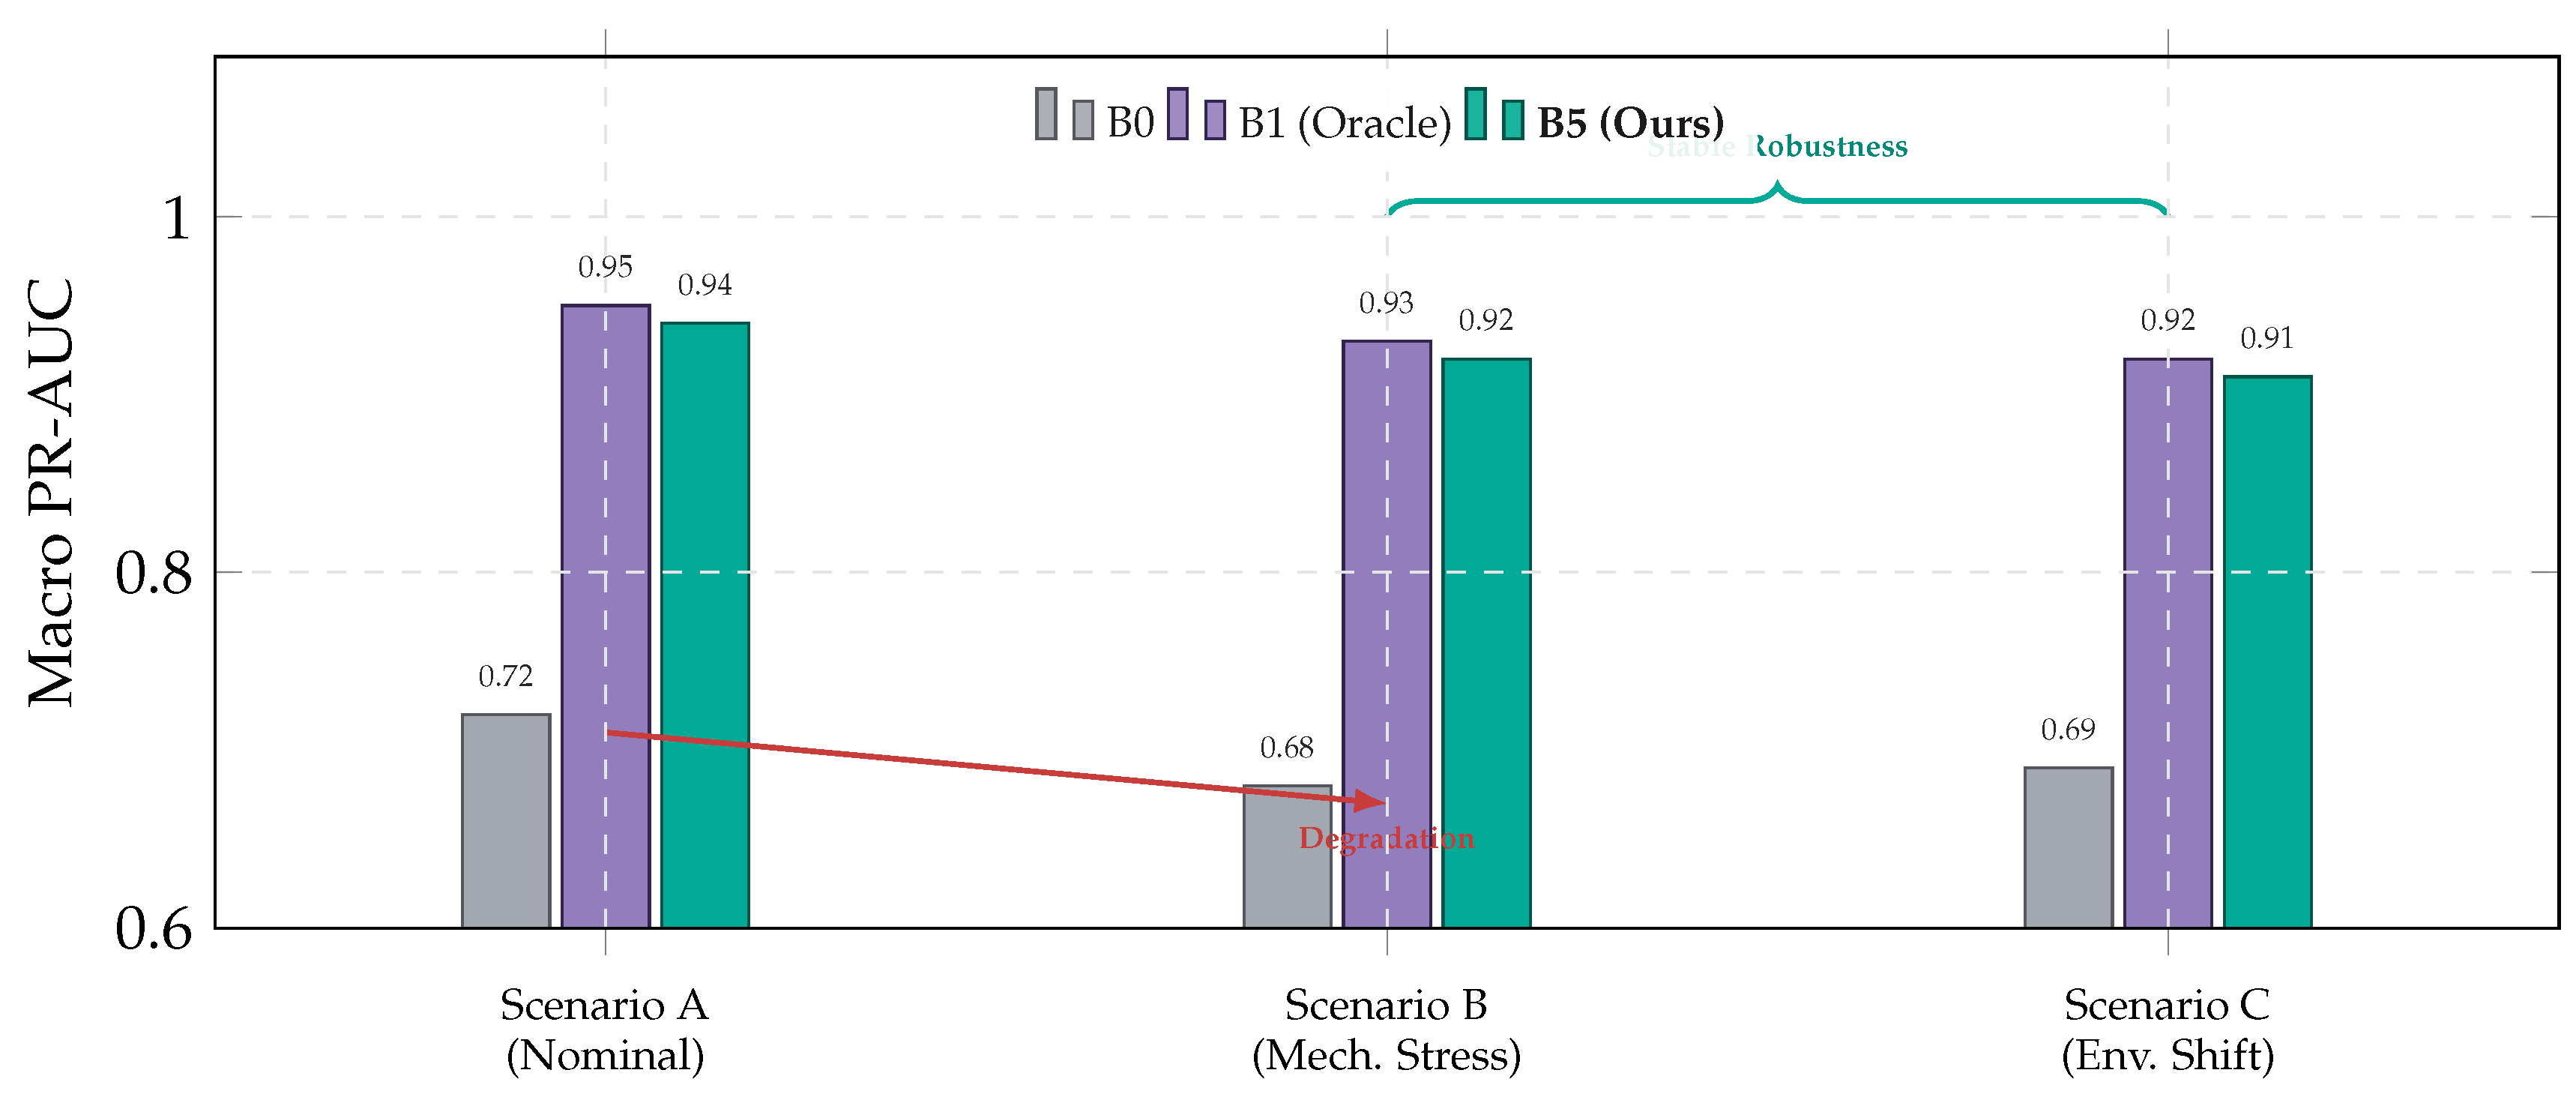
Figure 25.
Energy–Accuracy Pareto Landscape. B1 (Purple) represents the theoretical ceiling but is energetically prohibitive. B5 (Teal) sits on the efficient frontier, retaining ∼99% of B1’s accuracy while reducing energy consumption by 61%, making it the only viable candidate for the 50W edge budget.
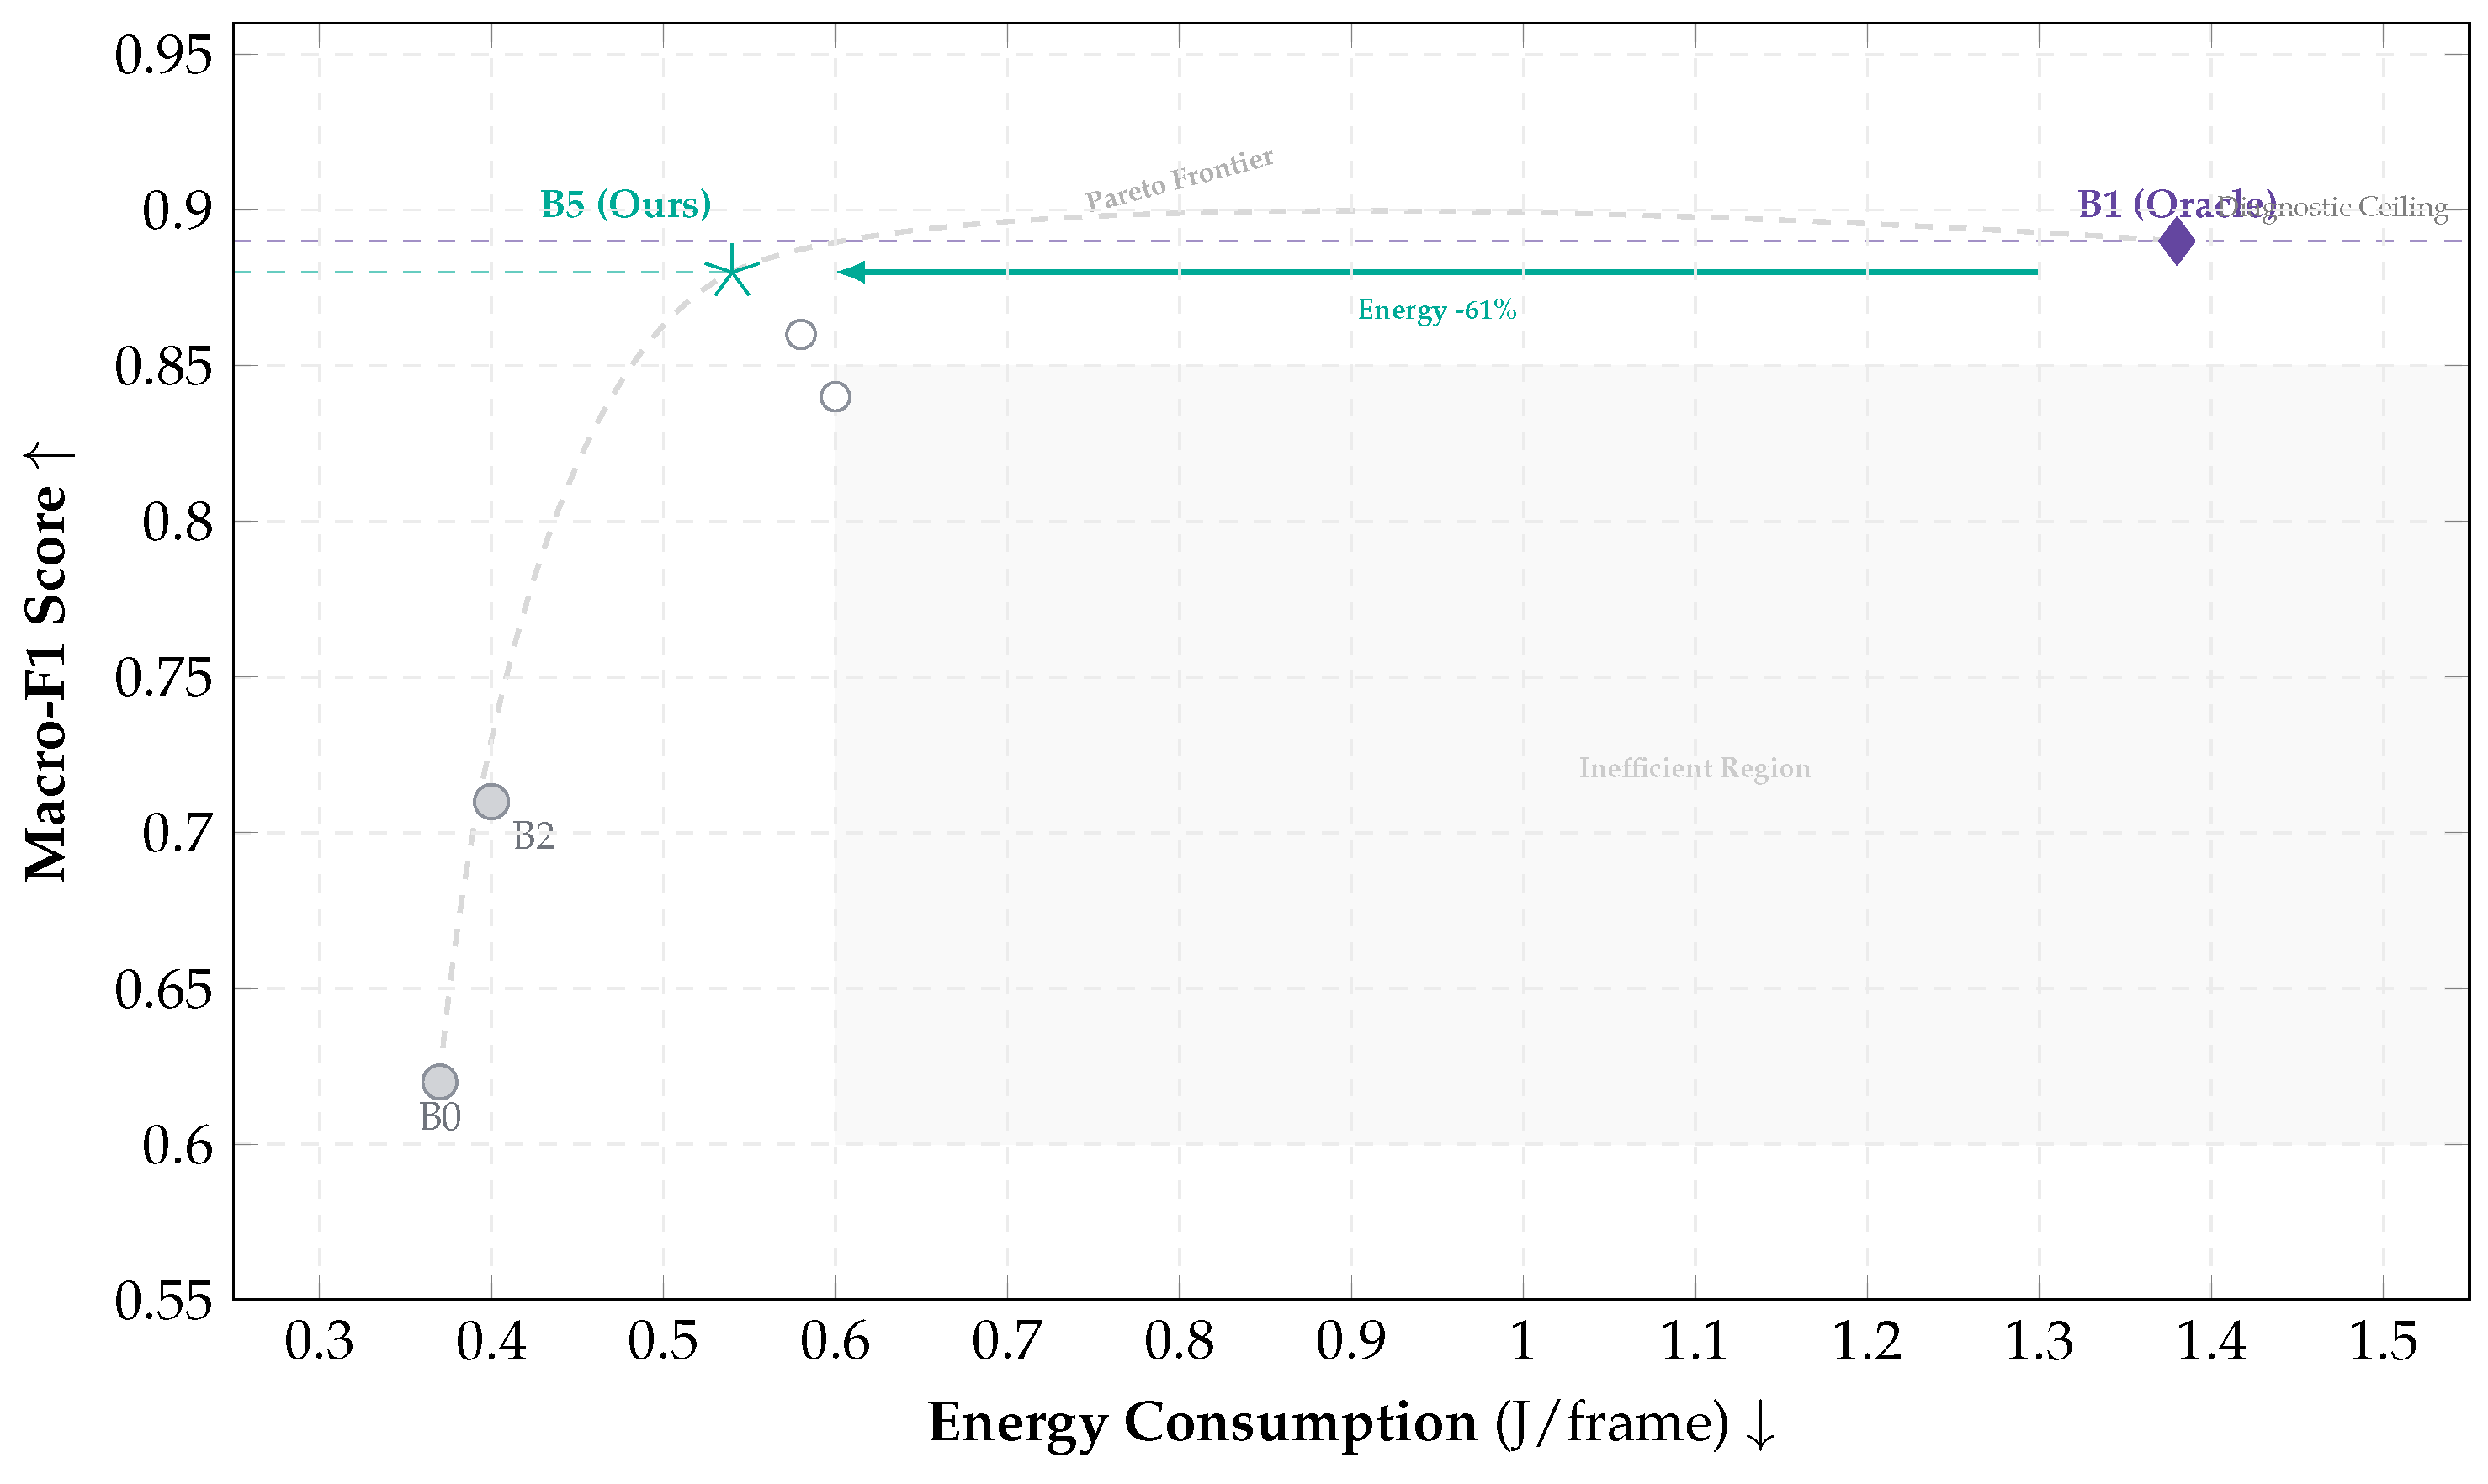
Figure 26.
Power trace (Scenario B). Retrieval induces short power spikes (∼45–47W), while CAG remains near ∼31W. The 50W cap is never exceeded.
Figure 26.
Power trace (Scenario B). Retrieval induces short power spikes (∼45–47W), while CAG remains near ∼31W. The 50W cap is never exceeded.
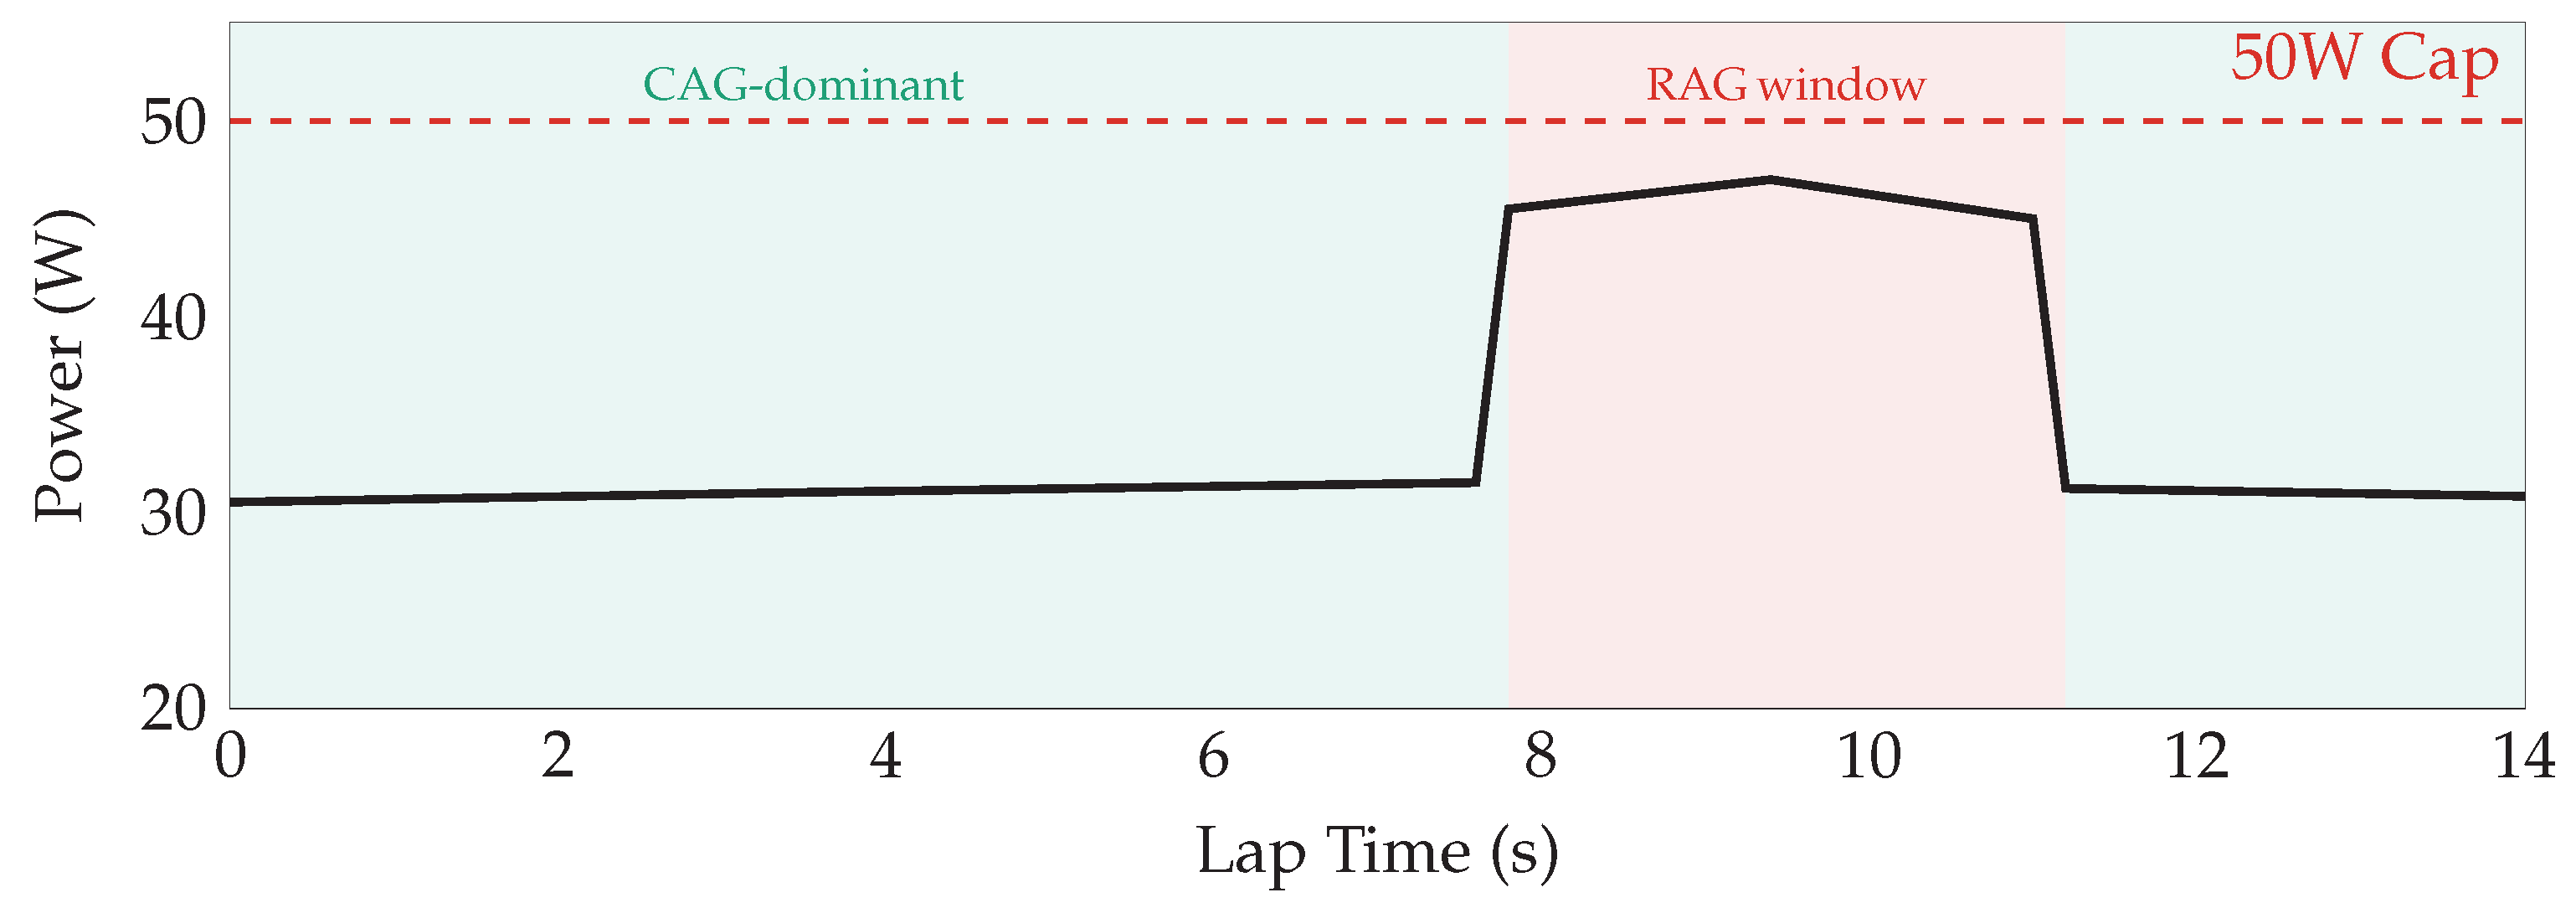
Figure 27.
Cost Dynamics and Efficiency Gap. Energy consumption scales with retrieval frequency (). Crucially, the B5 operating points (Teal stars) lie below the naive linear interpolation (dashed line). This "convexity" proves that B5 is more efficient per-retrieval than B1, thanks to domain filtering reducing the vector search space.
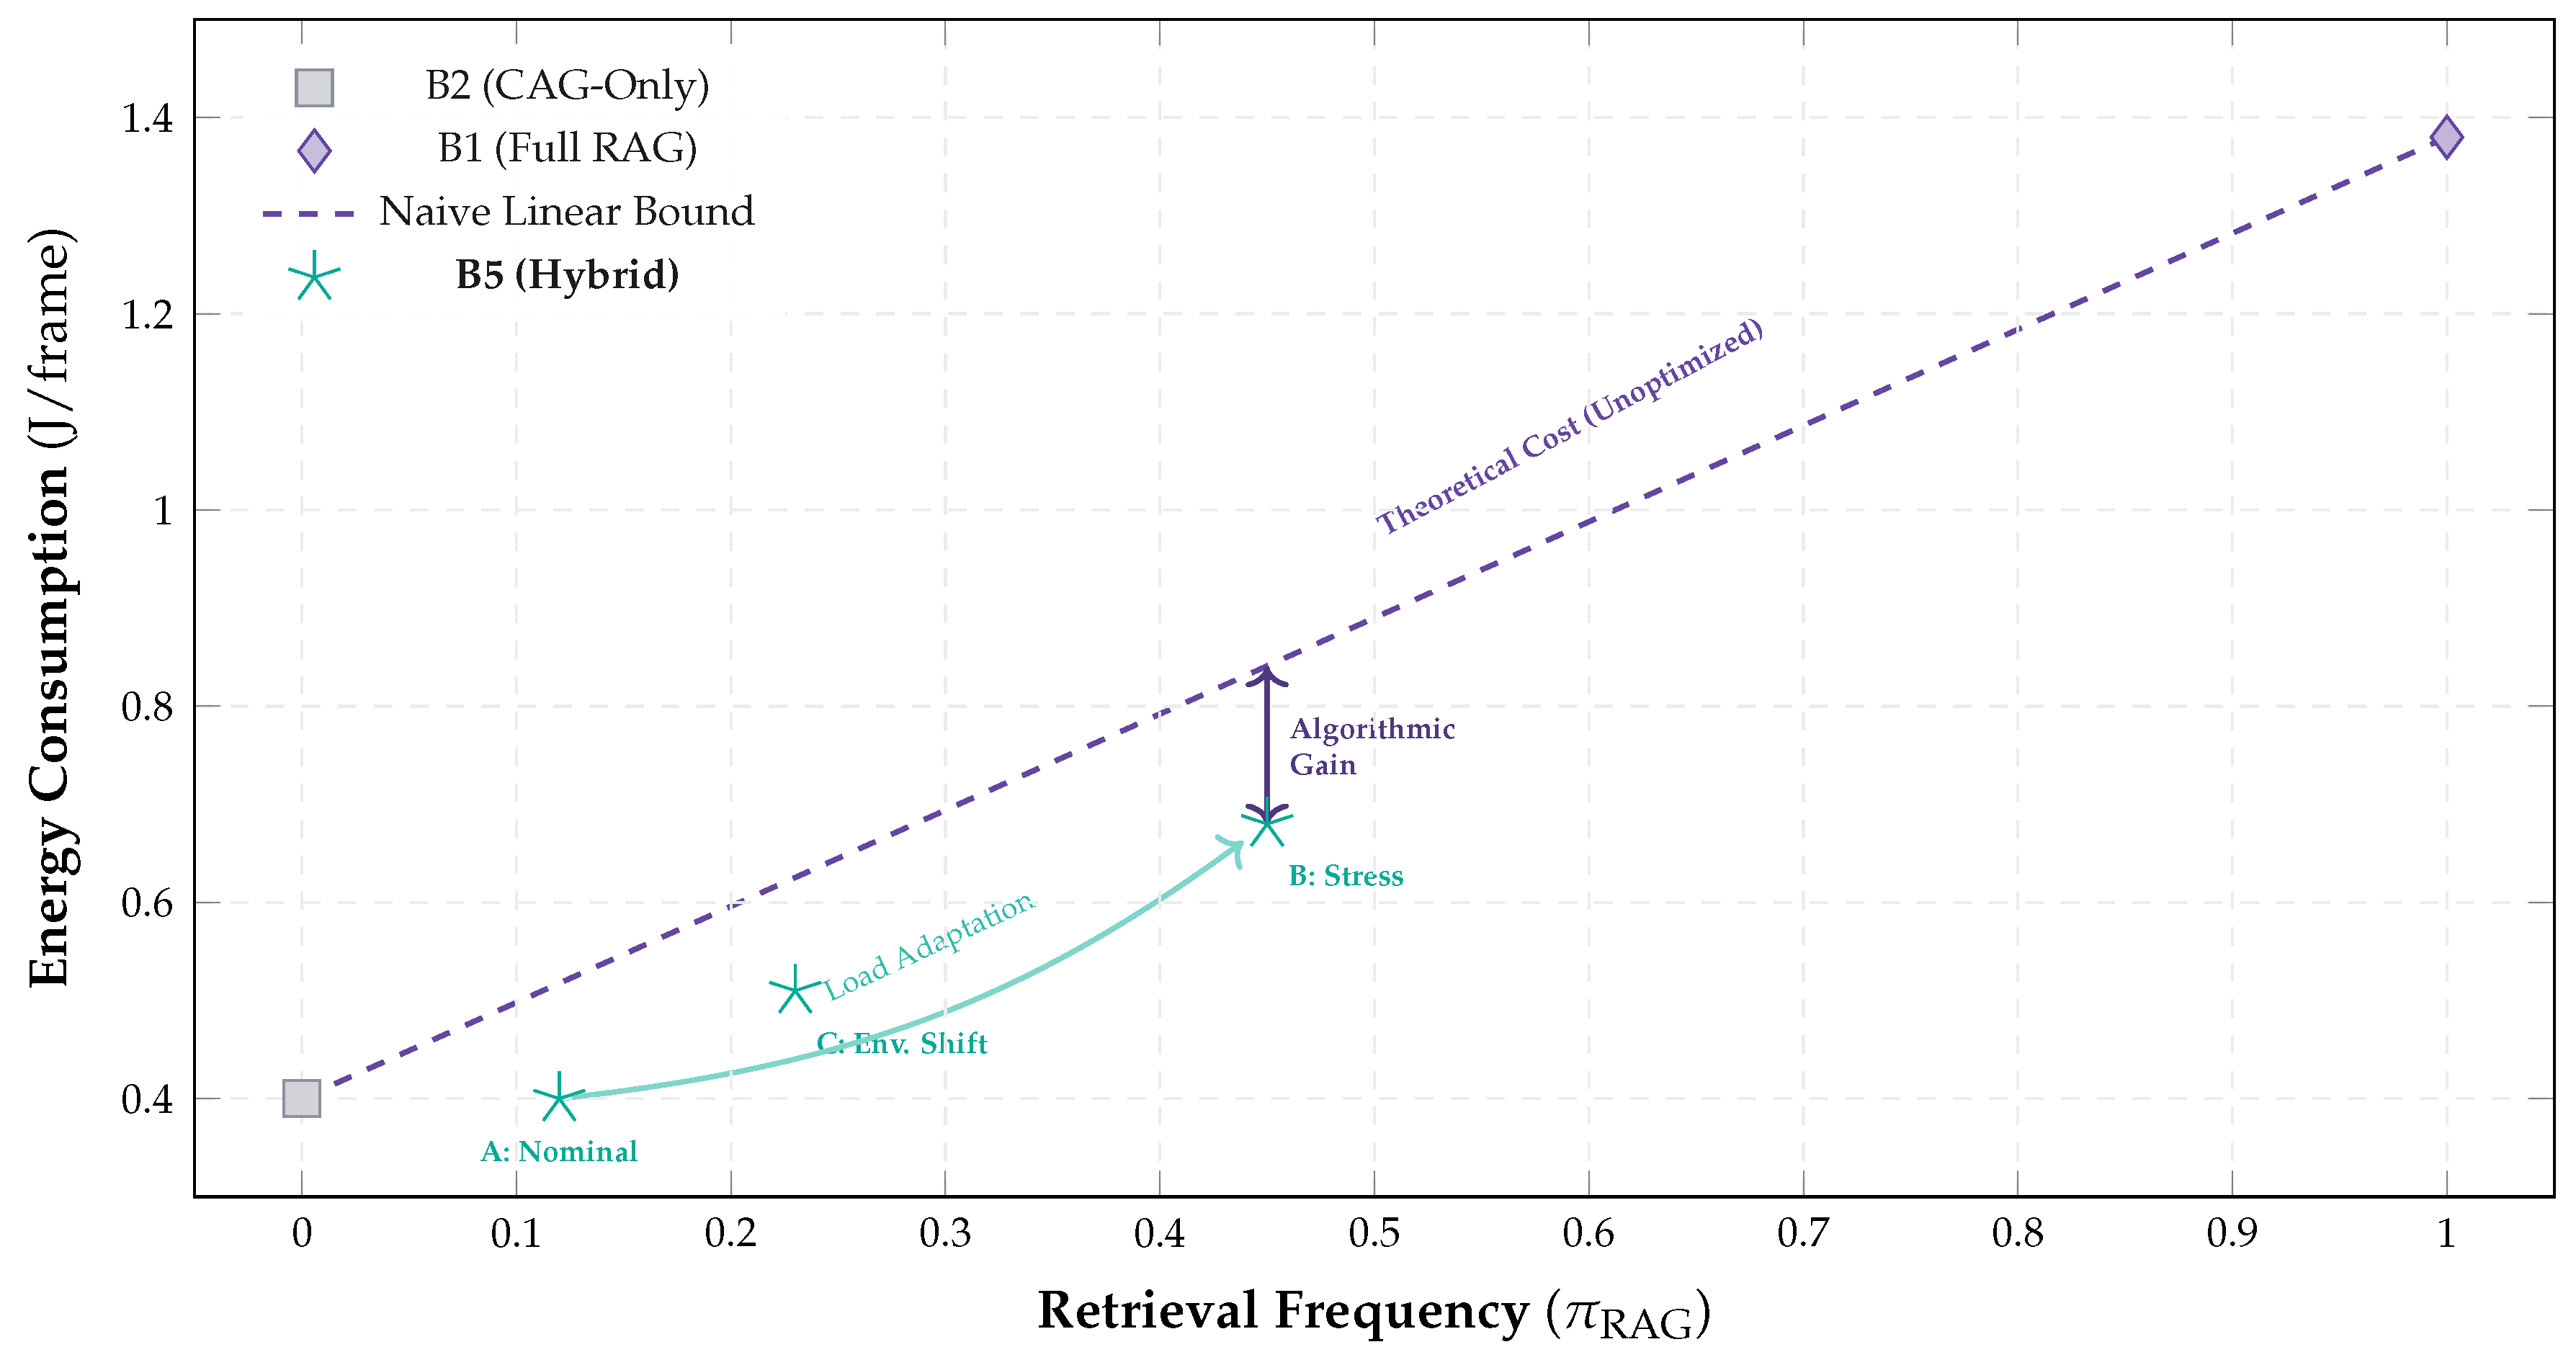
Figure 28.
Topology-Aware Computation. A clear inverse correlation is observed. In high-speed sectors (Bars, grey), the system relies on cache (low lines). In complex technical sectors (Braking/Chicane), entropy rises (dashed purple), triggering the RAG mechanism (solid teal) to handle the uncertainty.
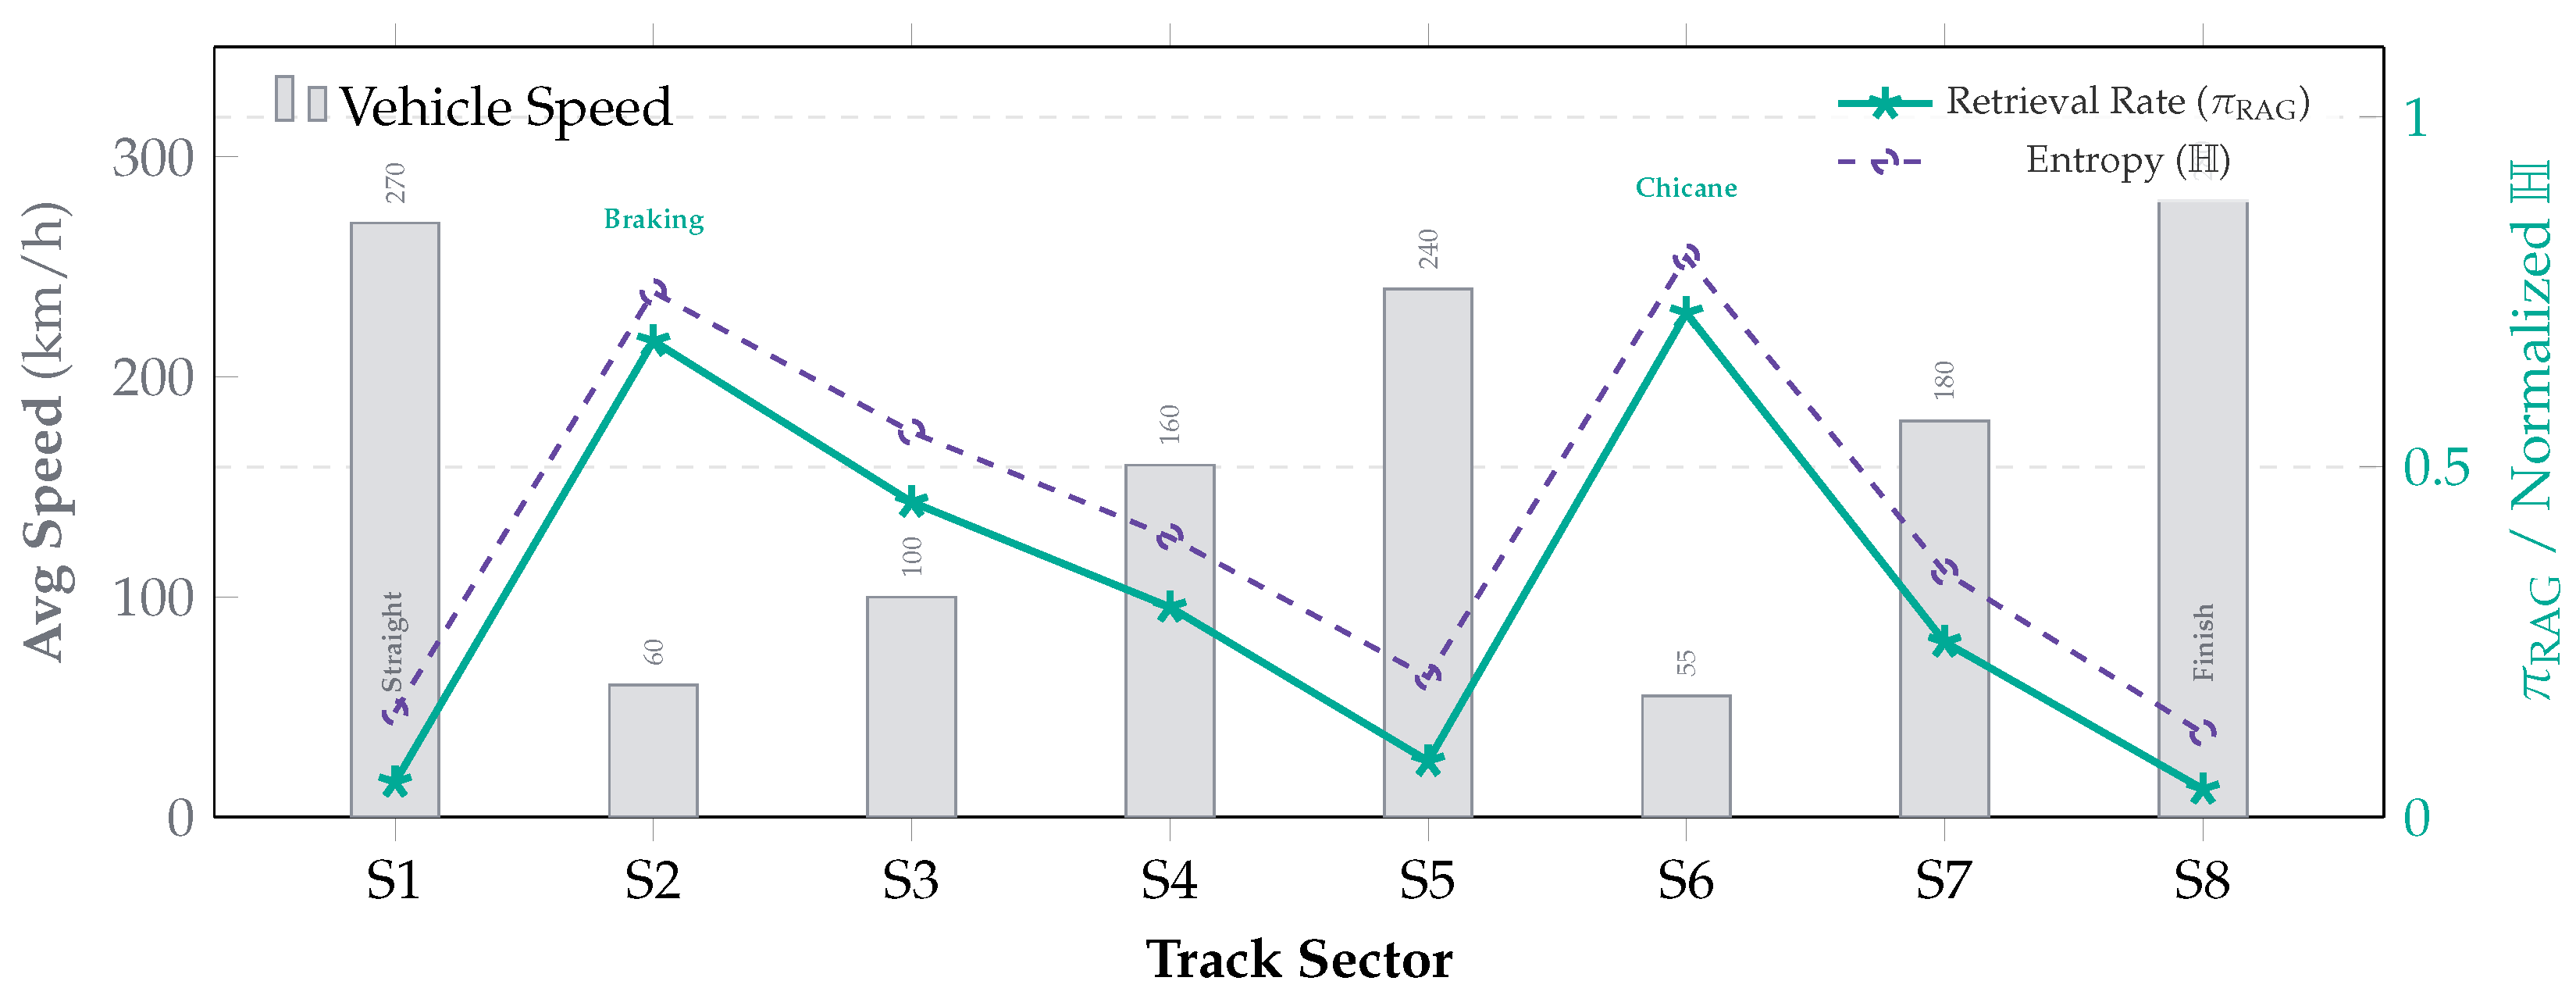
Figure 29.
Impact of Domain Filtering. While filtering improves retrieval precision (Rel@1/5), its critical contribution is the total elimination of Physics Hallucinations (Rightmost bars). The unfiltered baseline retrieves obsolete failure modes (e.g., 2026 Ride-Height devices), creating a 28% error rate that our method sanitizes to 0%.
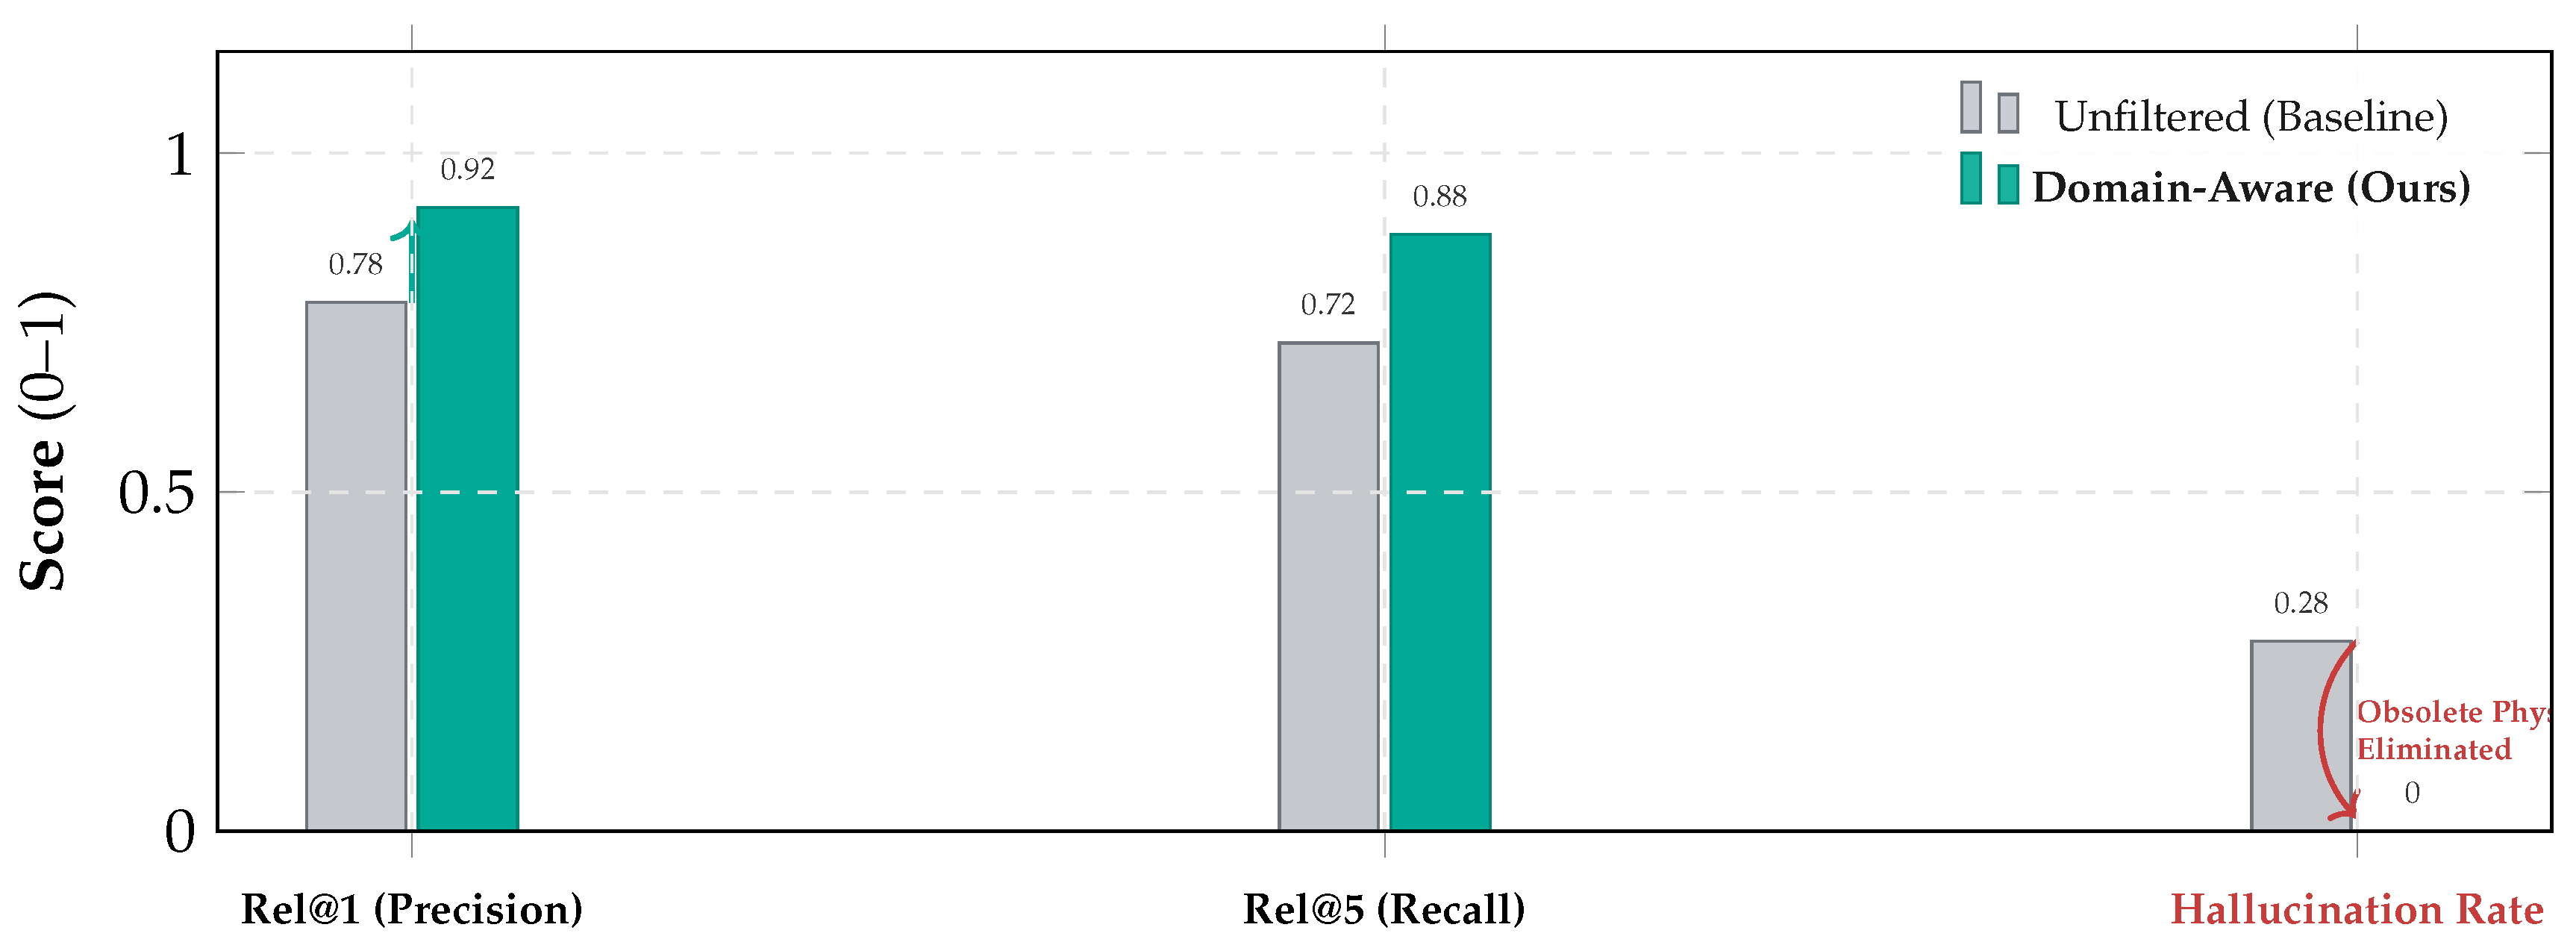
Figure 30.
Drop Burstiness Analysis. 96% of watchdog triggers are isolated single-frame drops (Teal). No bursts exceeding 2 frames were observed, preventing sustained data blackouts.
Figure 30.
Drop Burstiness Analysis. 96% of watchdog triggers are isolated single-frame drops (Teal). No bursts exceeding 2 frames were observed, preventing sustained data blackouts.
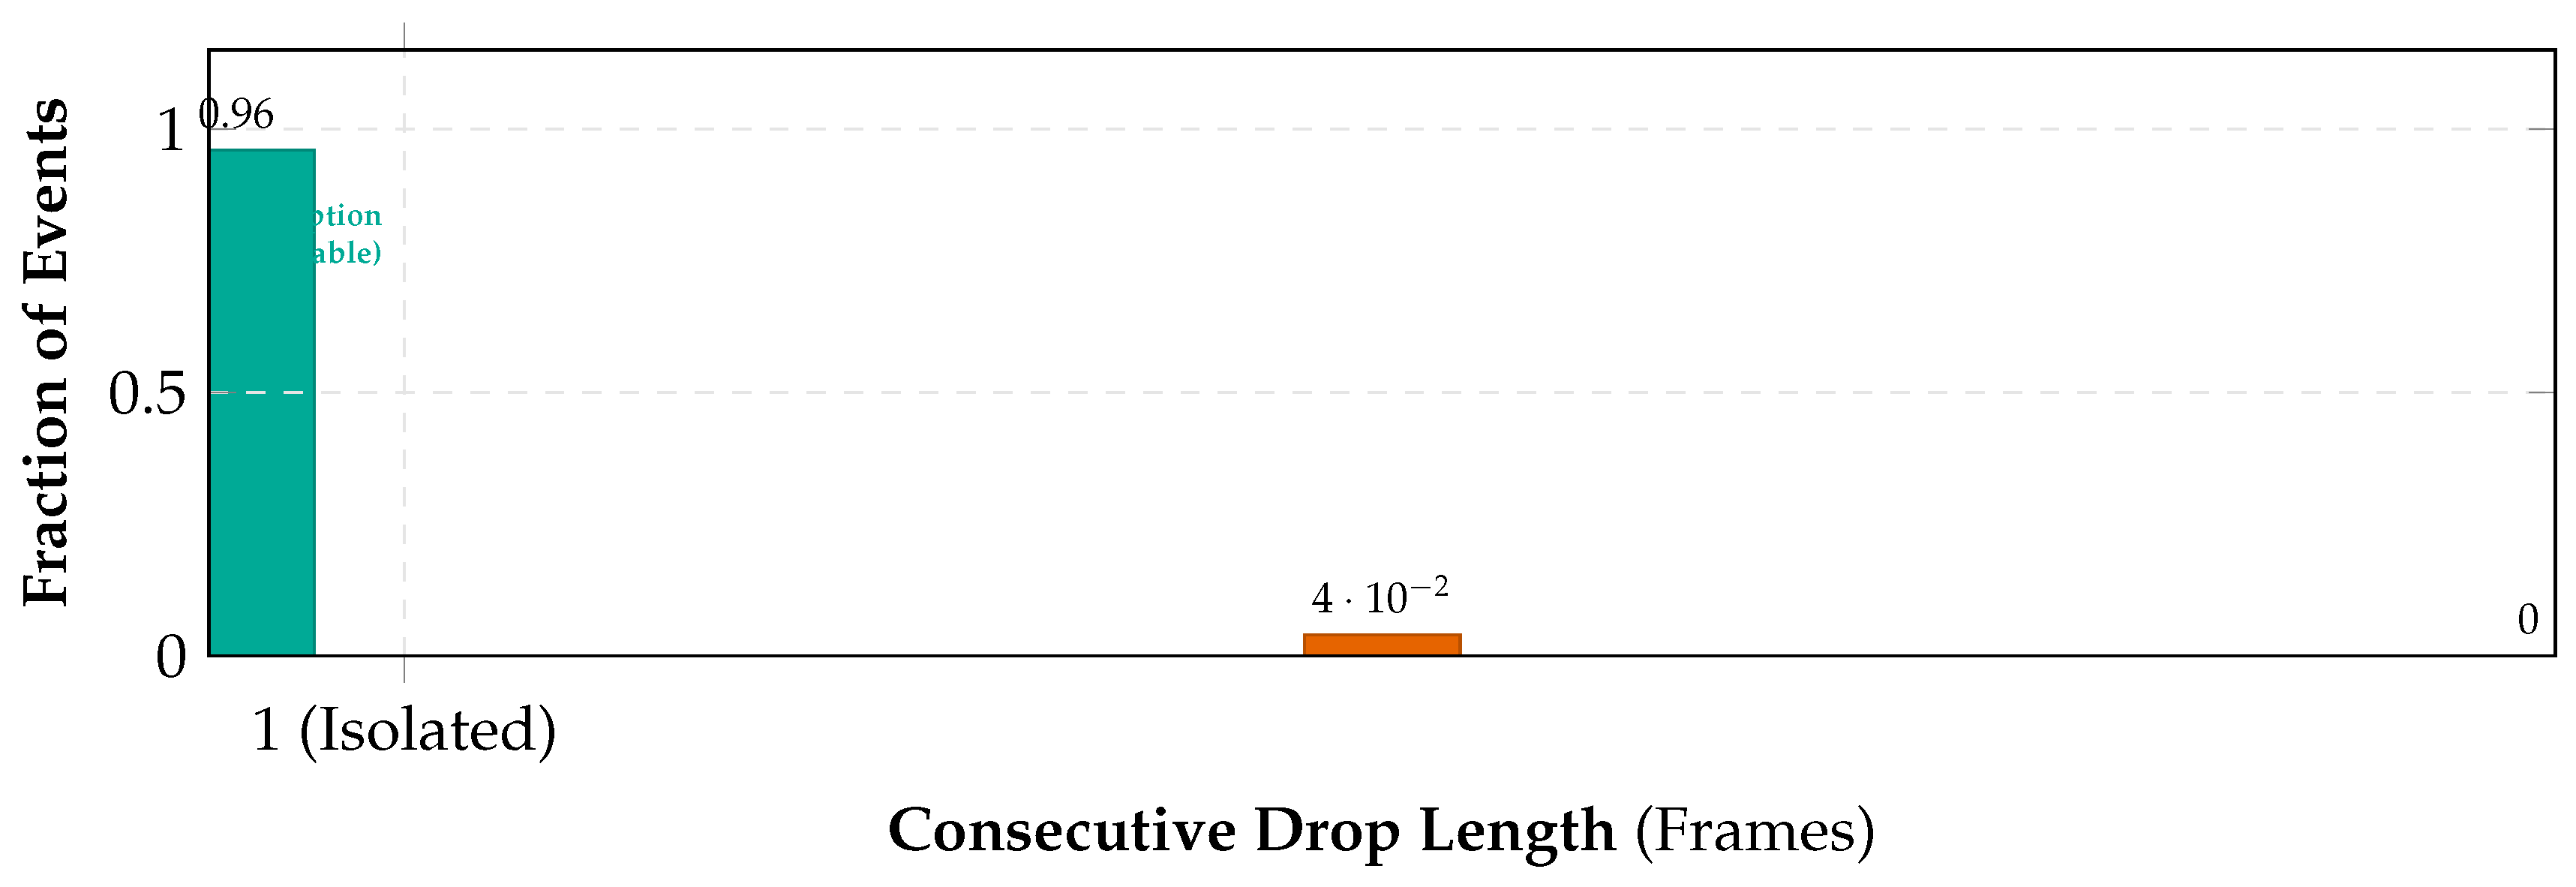
Figure 32.
Thermal FSM with Hysteresis Guard. The system uses a bi-stable controller to manage thermal load. It enters Safe Mode only when the junction temperature reaches C and enforces a C cooling requirement (C) before restoring full RAG capabilities, preventing oscillation.
Figure 32.
Thermal FSM with Hysteresis Guard. The system uses a bi-stable controller to manage thermal load. It enters Safe Mode only when the junction temperature reaches C and enforces a C cooling requirement (C) before restoring full RAG capabilities, preventing oscillation.
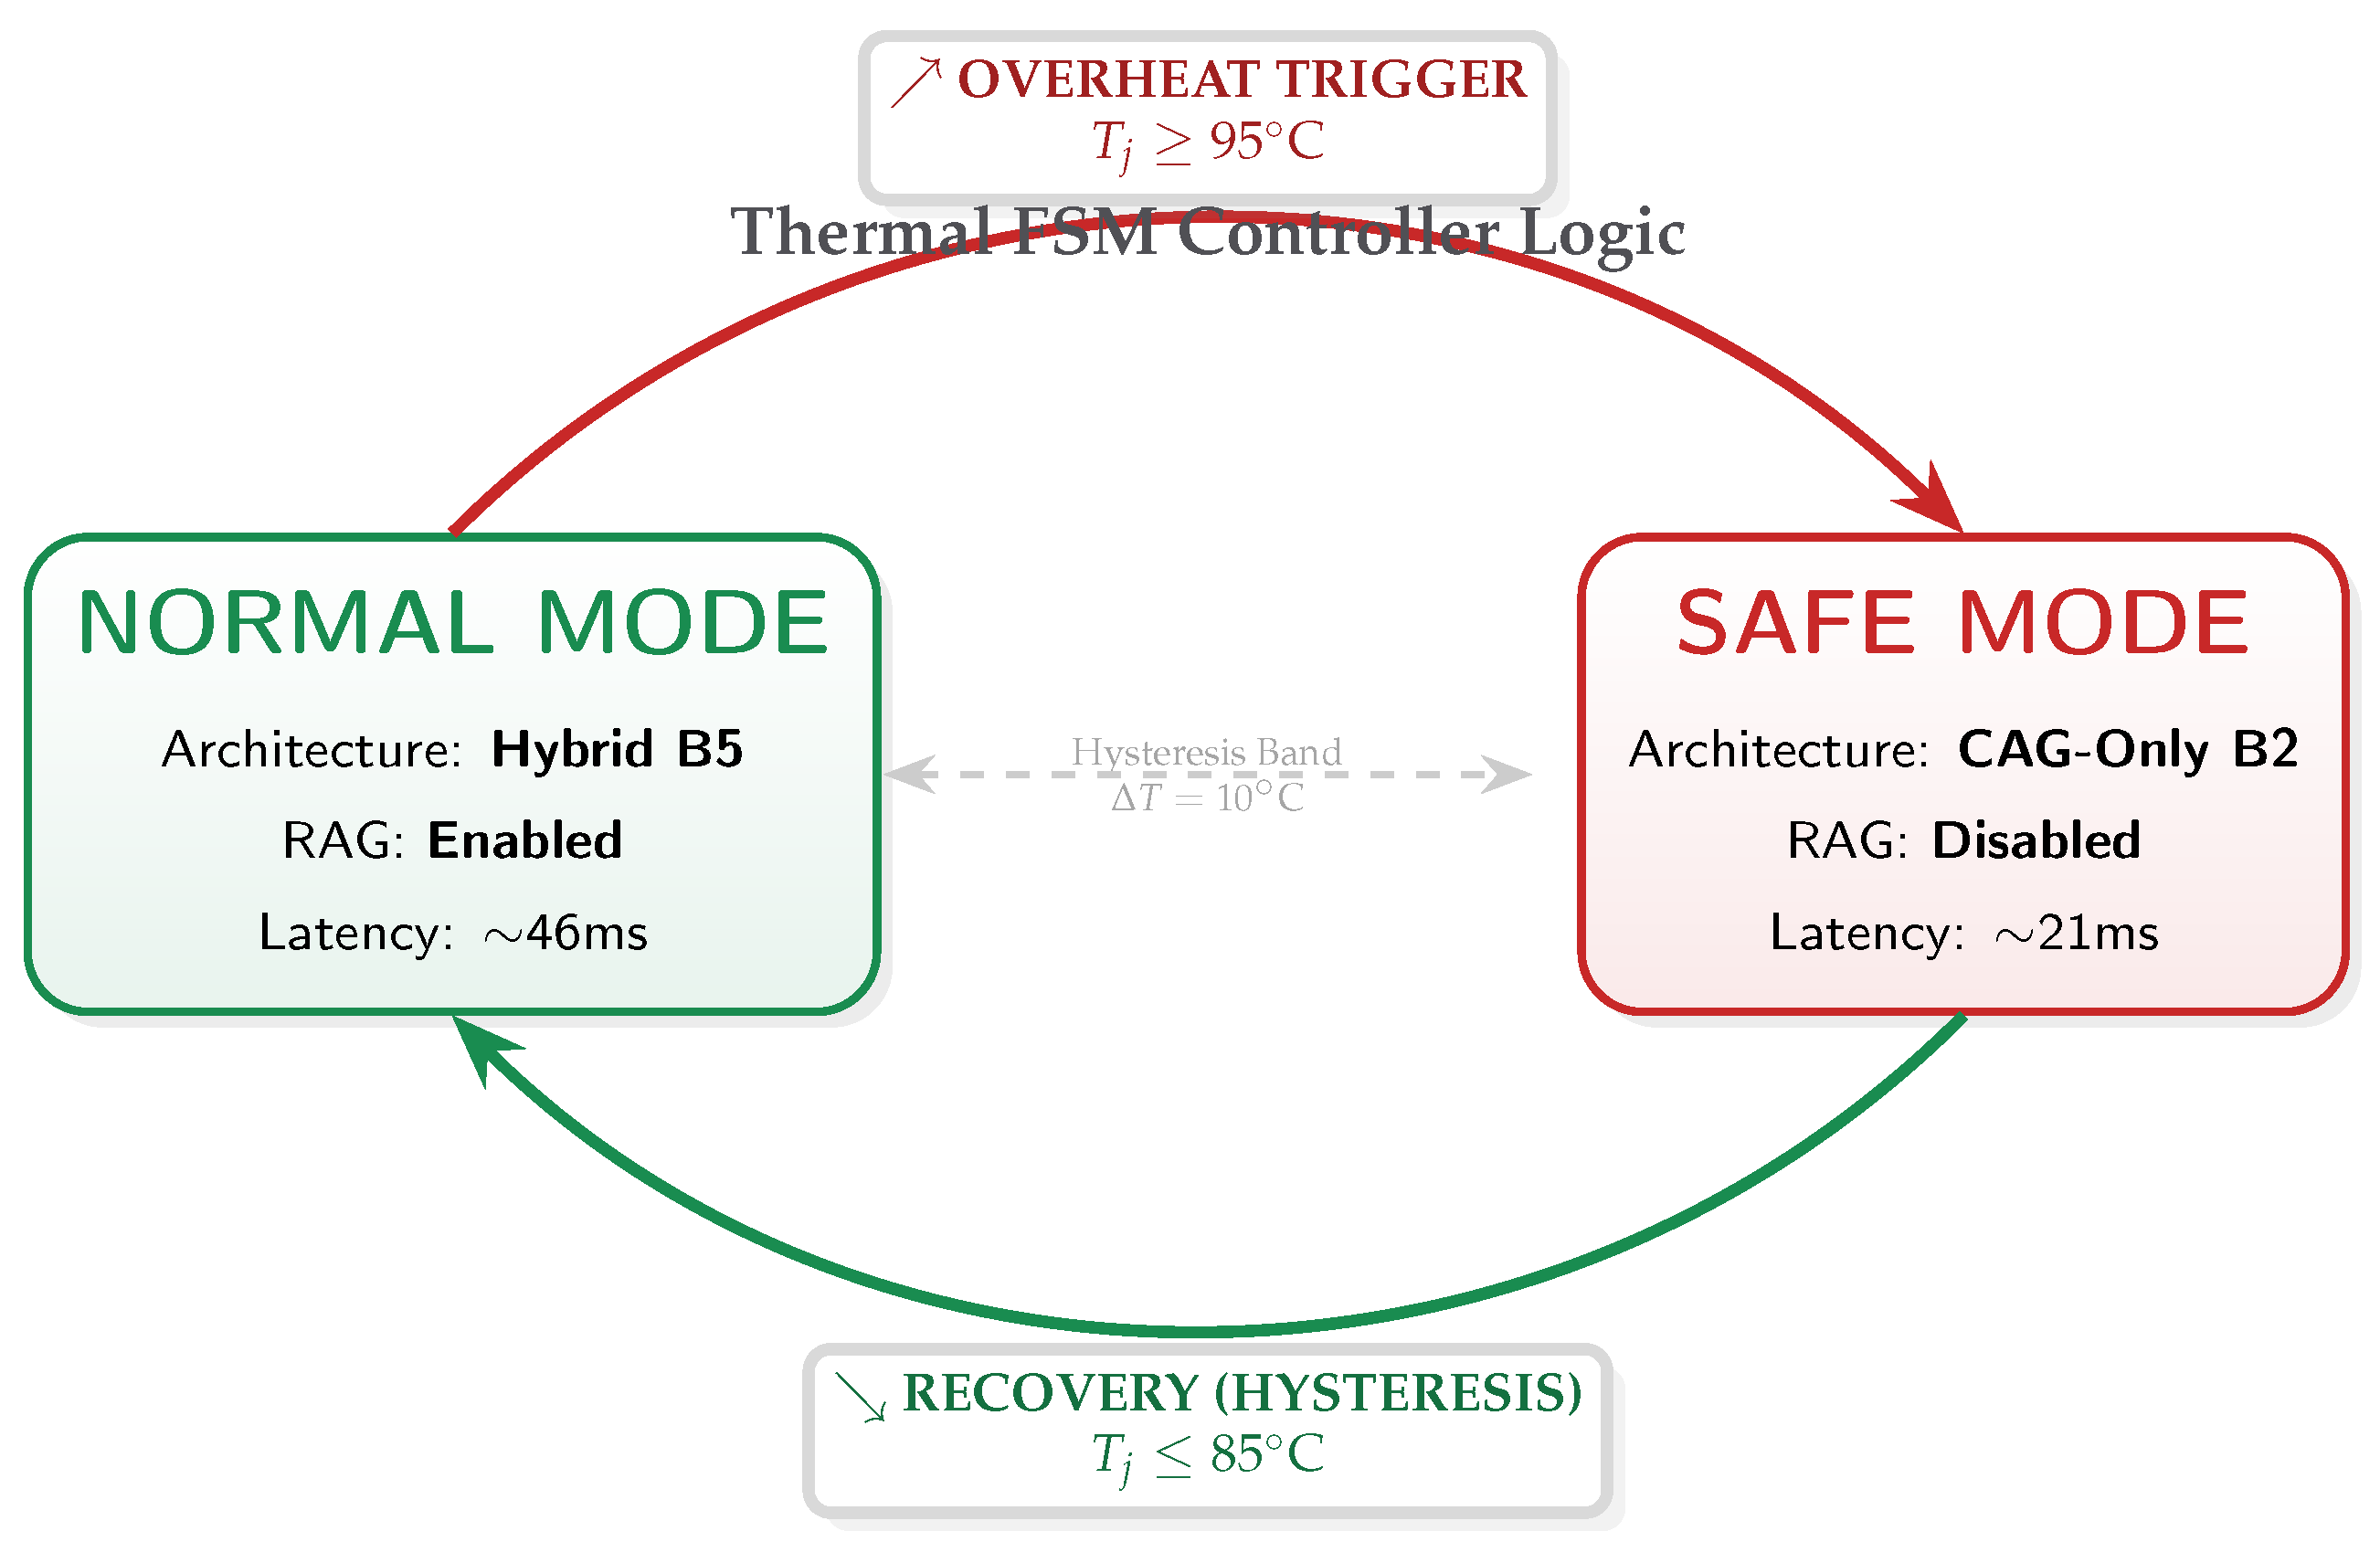
Figure 33.
Dual-Process Decision Logic. Visualizing the routing between the reflexive “Green Path” (System 1) and the deliberative “Purple Path” (System 2). The timeline on the right illustrates how the worst-case hybrid latency fits safely within the real-time deadline.
Figure 33.
Dual-Process Decision Logic. Visualizing the routing between the reflexive “Green Path” (System 1) and the deliberative “Purple Path” (System 2). The timeline on the right illustrates how the worst-case hybrid latency fits safely within the real-time deadline.
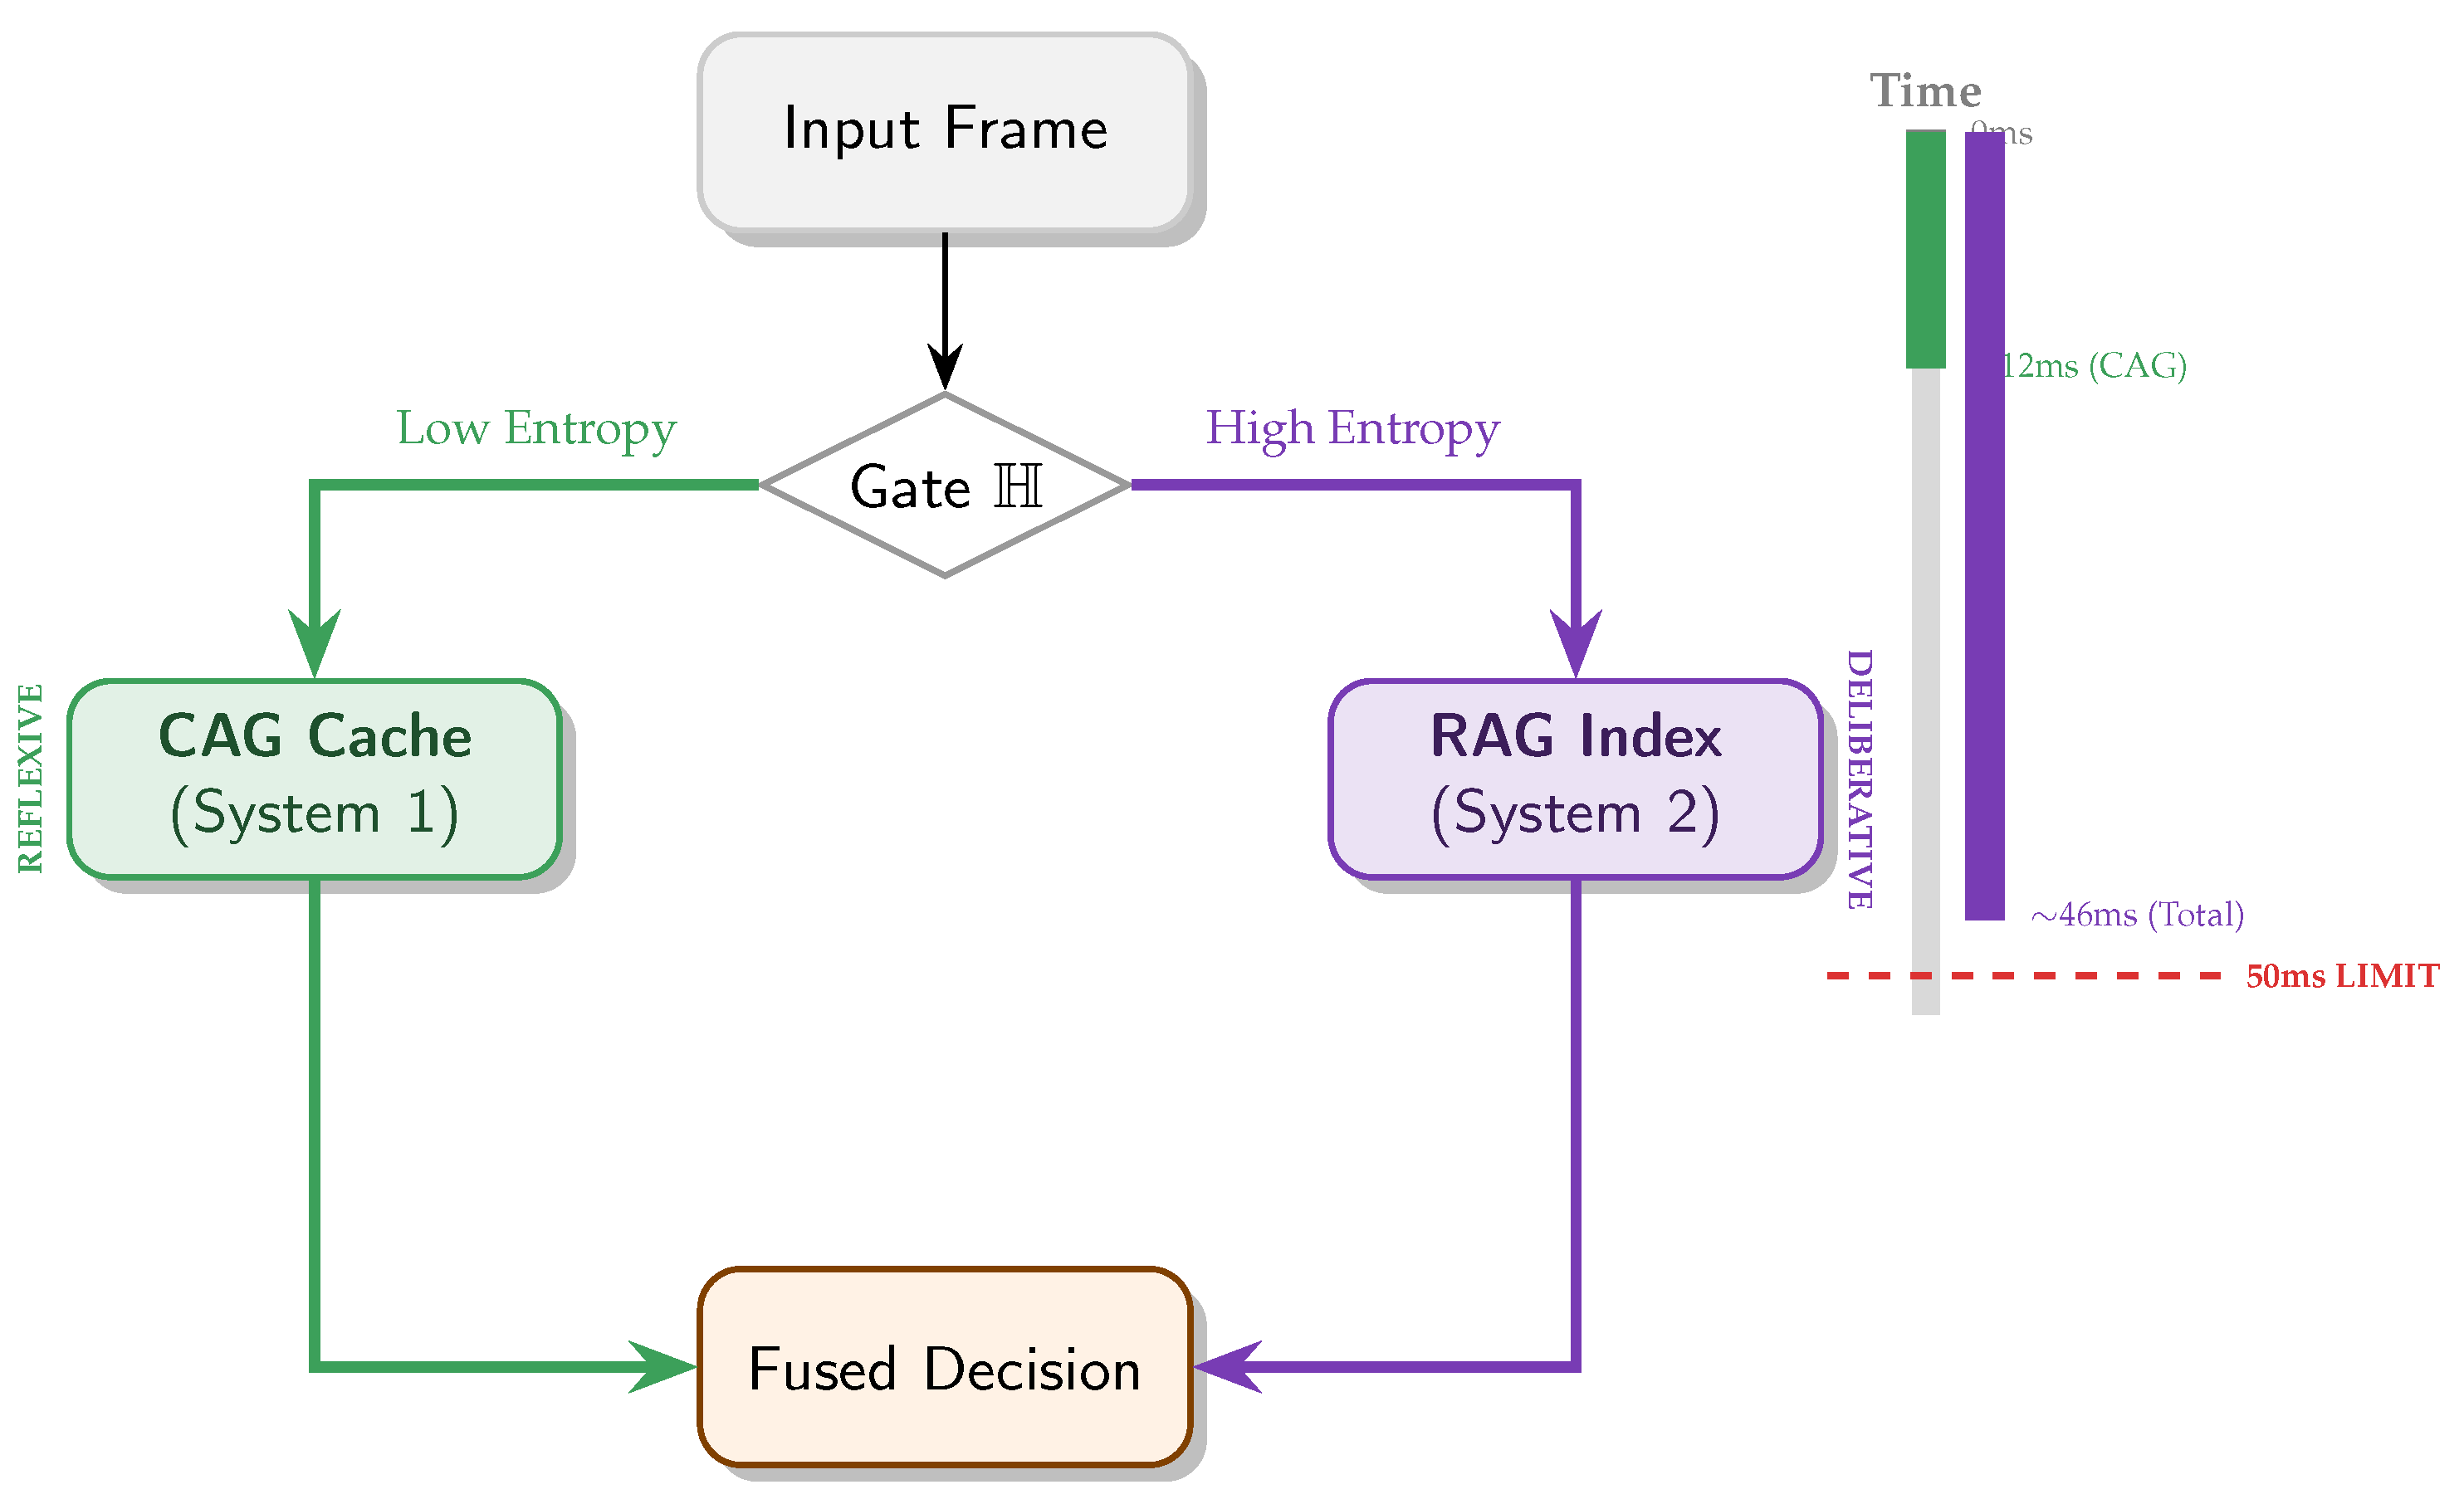
Figure 34.
The Entropy-Compute Inverse. Visualizing the optimization principle. Standard RAG (Dashed Purple) maintains high compute cost regardless of context. Our B5 policy (Teal line) acts as the inverse of Visual Redundancy (Gray area): it minimizes compute during stationary straights and surges resources only during high-entropy events (corners), aligning energy expenditure with information gain.
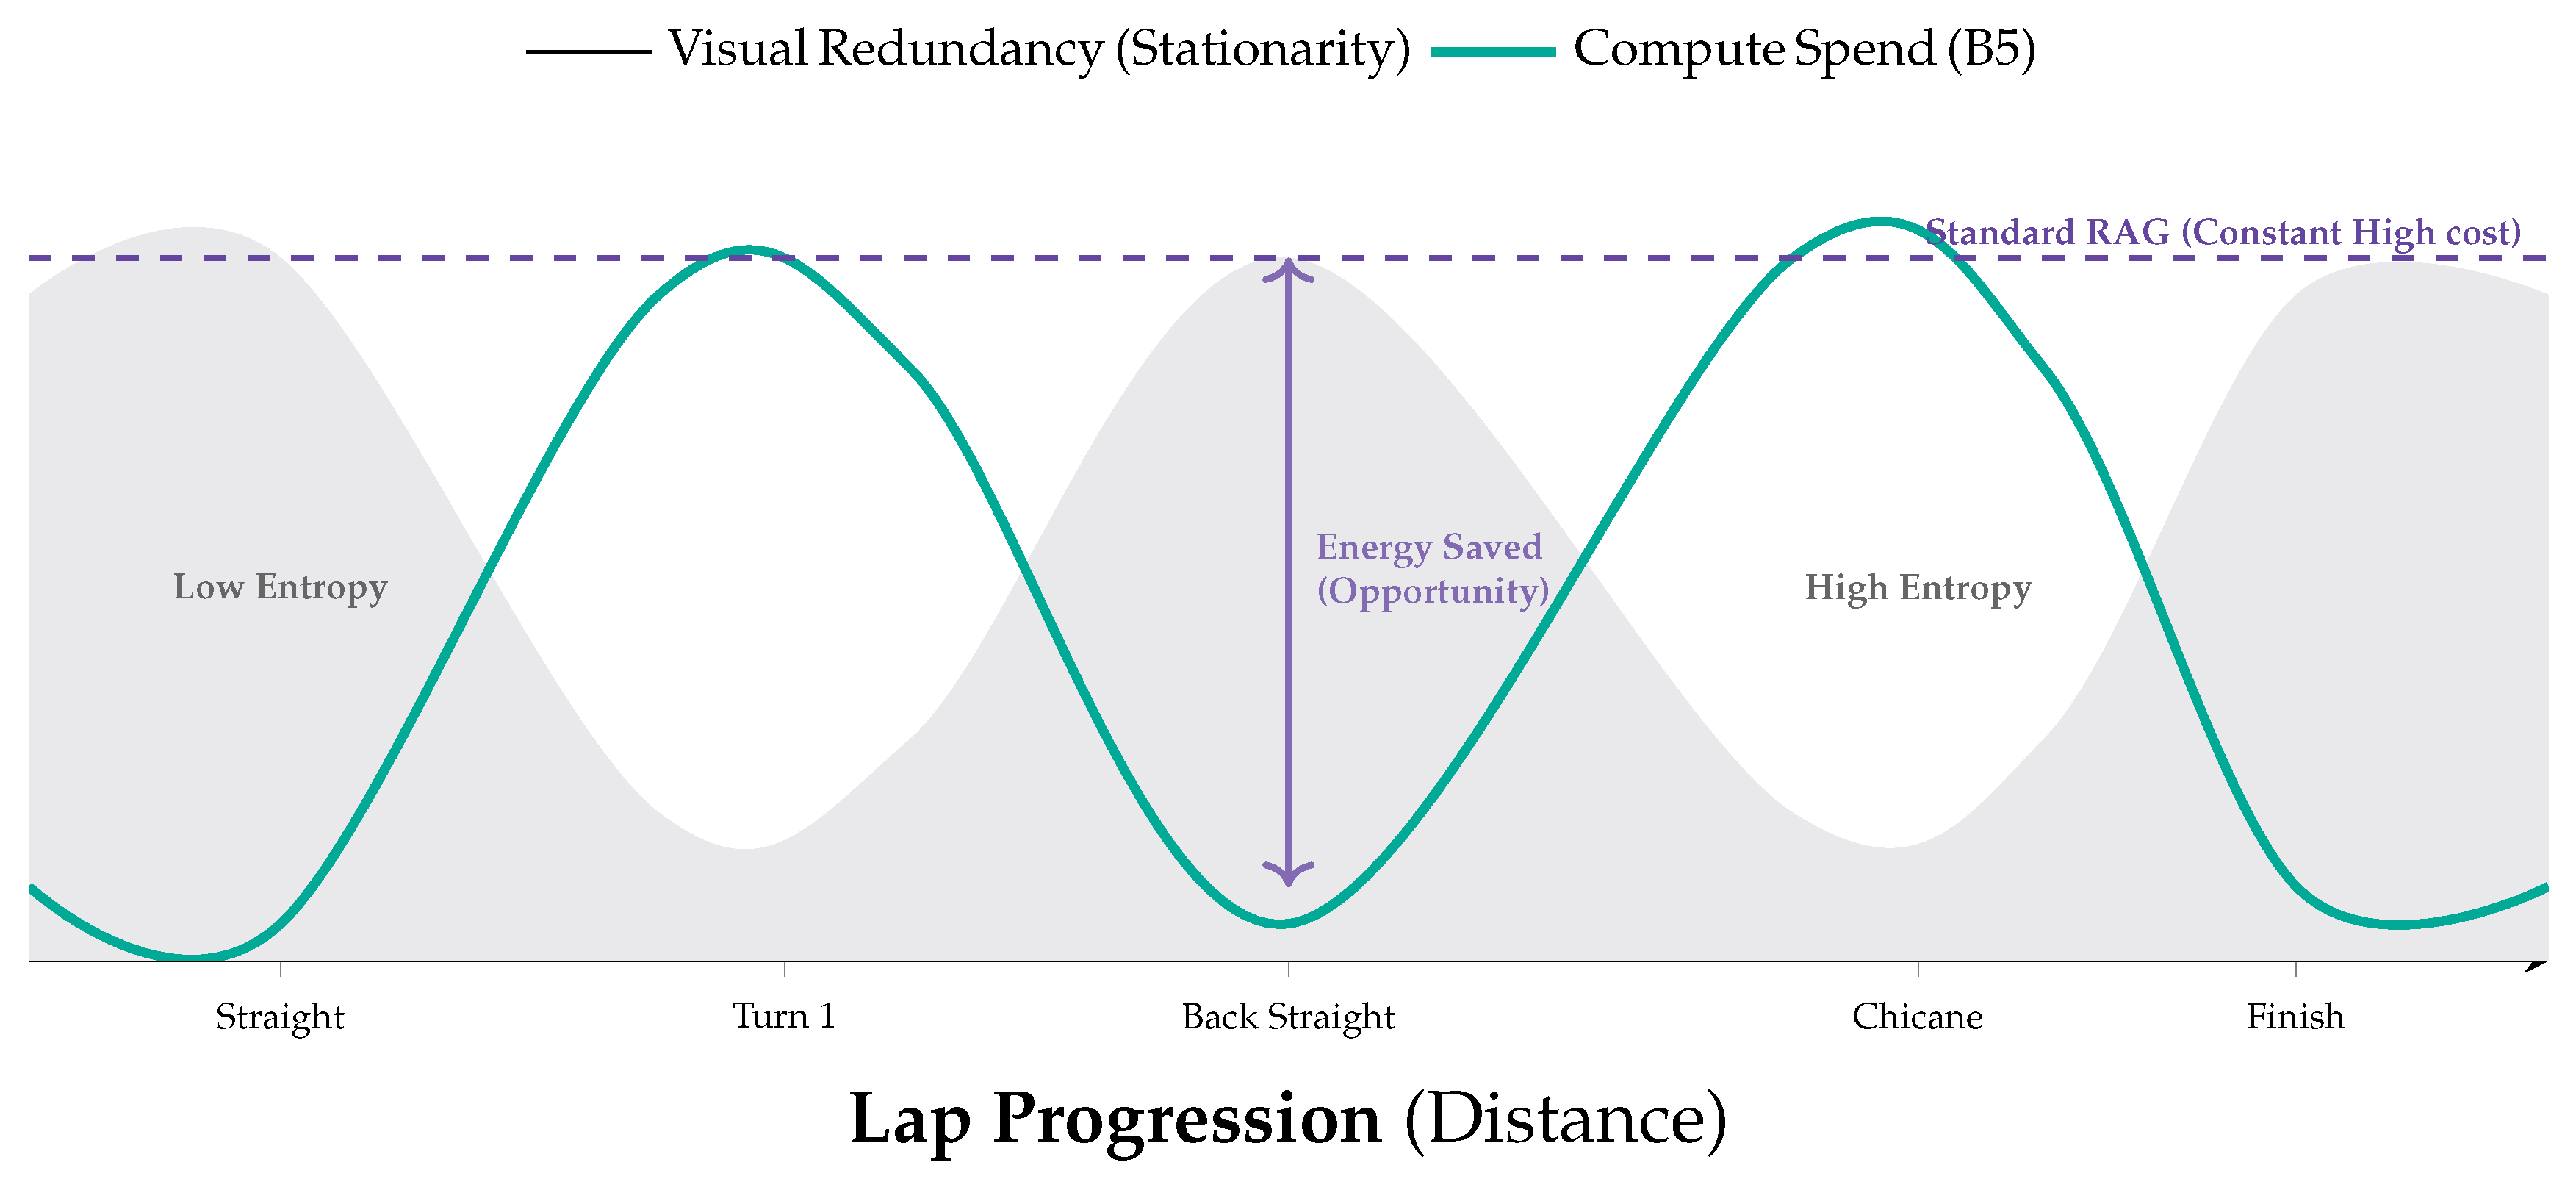
Figure 35.
Resolution of Epistemic Uncertainty. Visual ambiguity (e.g., motion blur) causes the stateless model to output a flat, high-entropy distribution (Left). By retrieving a semantically aligned exemplar and injecting it into the fusion process (Center), the hybrid system grounds the observation, resolving the ambiguity into a sharp, confident diagnosis (Right).
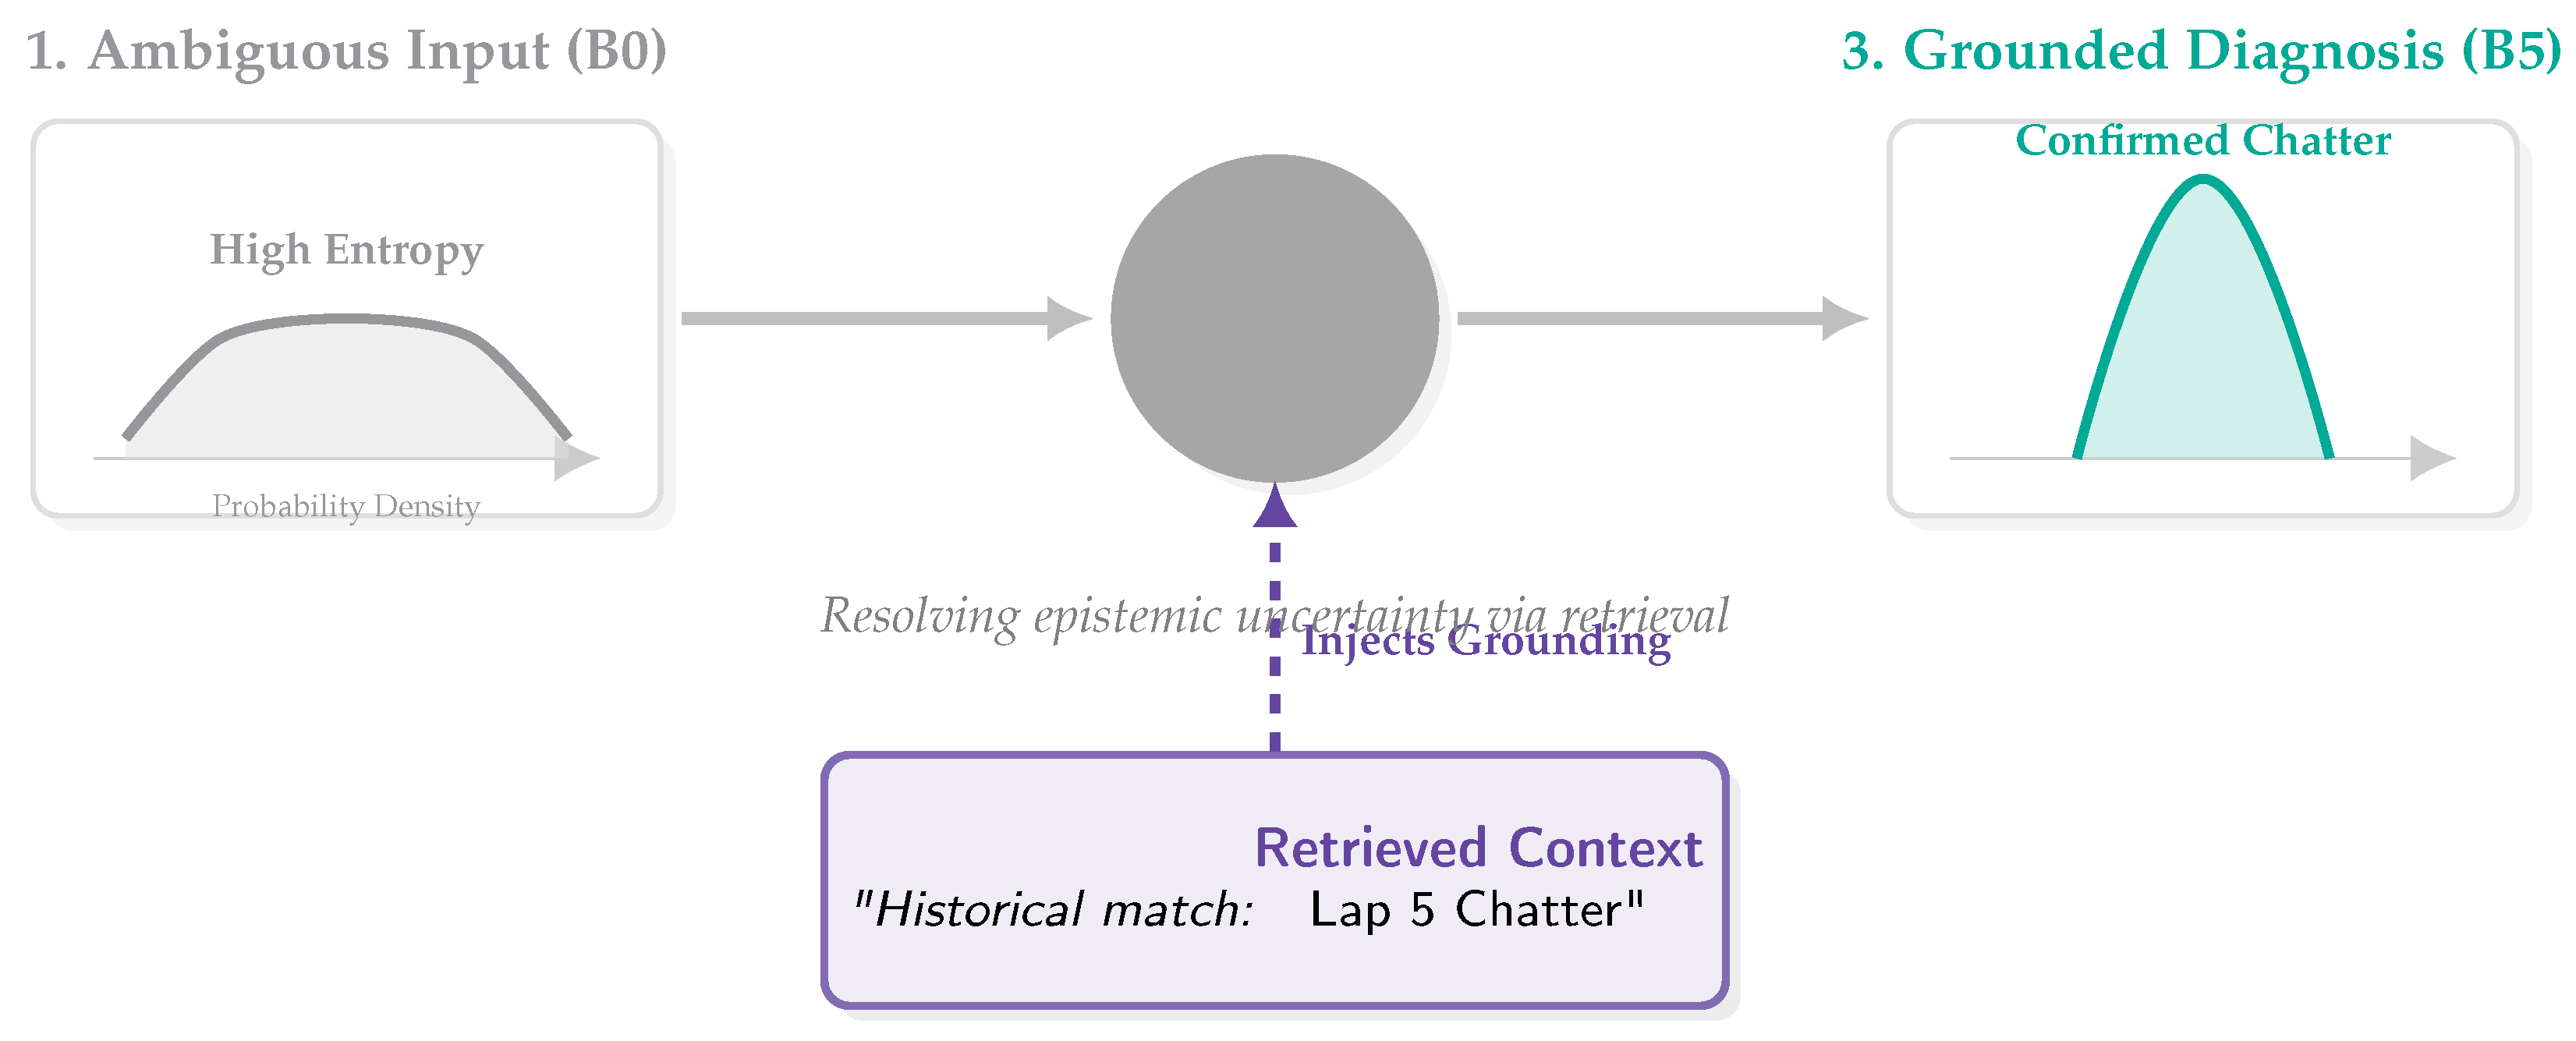
Figure 36.
The Regulatory "Air Gap". Unlike standard RAG approaches that rely on cloud APIs, our architecture is engineered for the Air-Gapped reality of racing. The "Regulatory Firewall" prevents high-bandwidth cloud dependency and active control signals. Our system (Right) is self-contained on the edge, ensuring compliance with homologation rules that forbid external interference during the race.
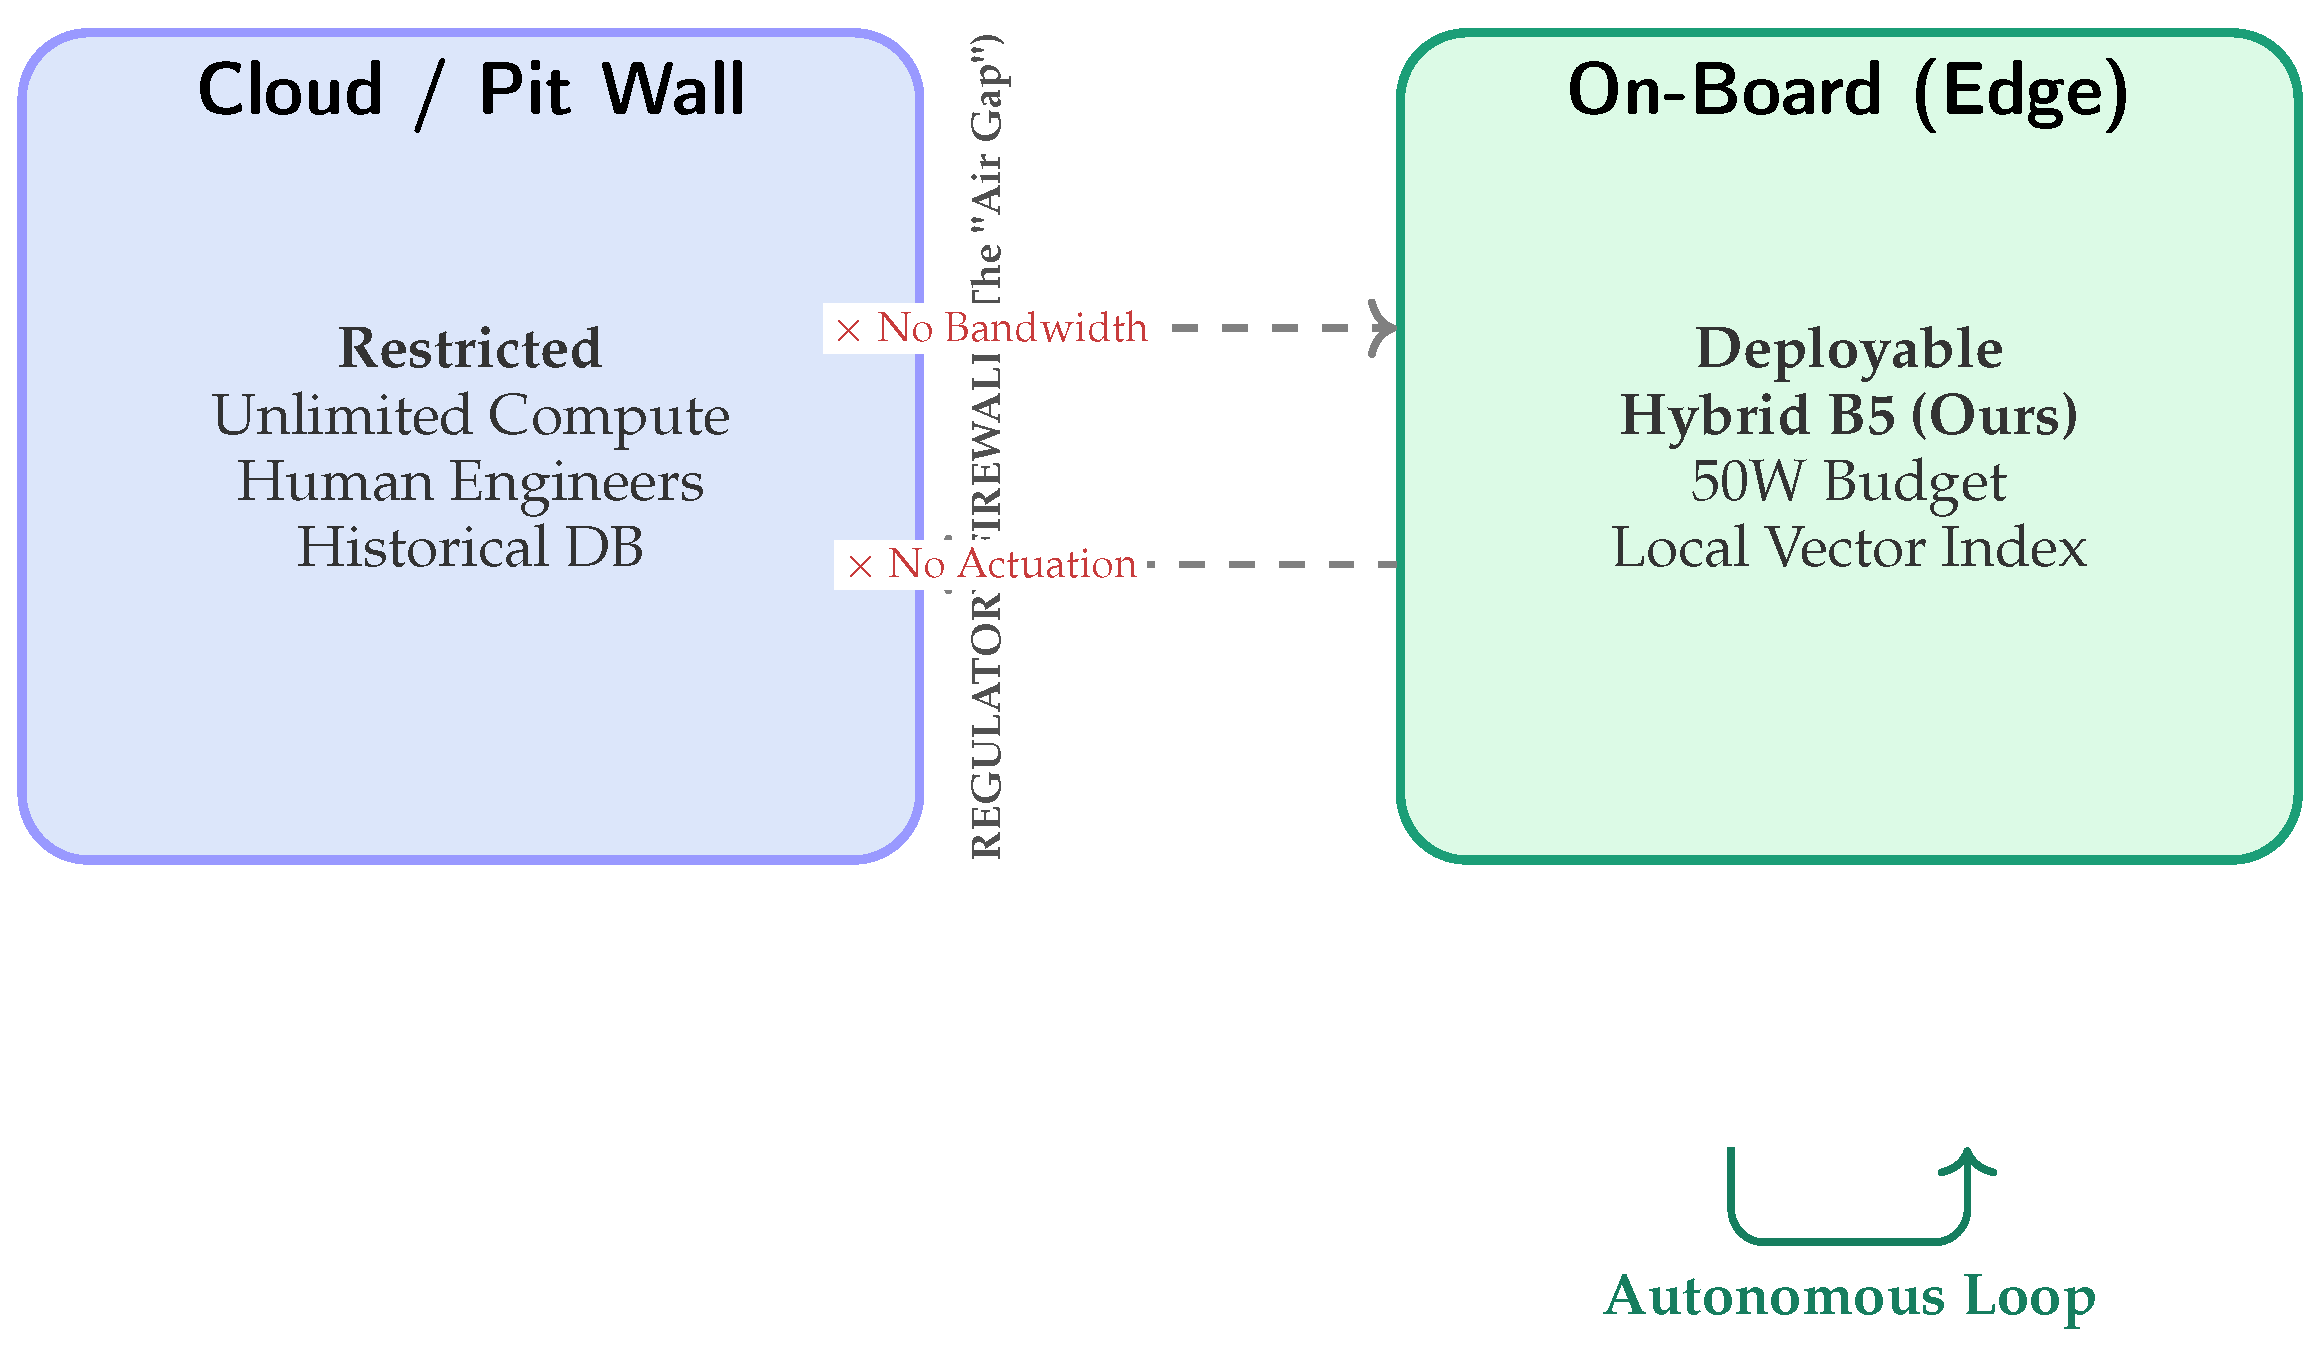
Figure 39.
The "Air-Gapped" Security Pipeline. To protect strategic IP, the Vector Index is compiled and encrypted at the secure factory (Left). It is deployed to the edge (Right) as a read-only artifact. A logical "Data Diode" ensures that while the AI can read sensor data to generate advisories, it has no write path to the vehicle’s ECU, preventing control-level cyberattacks.
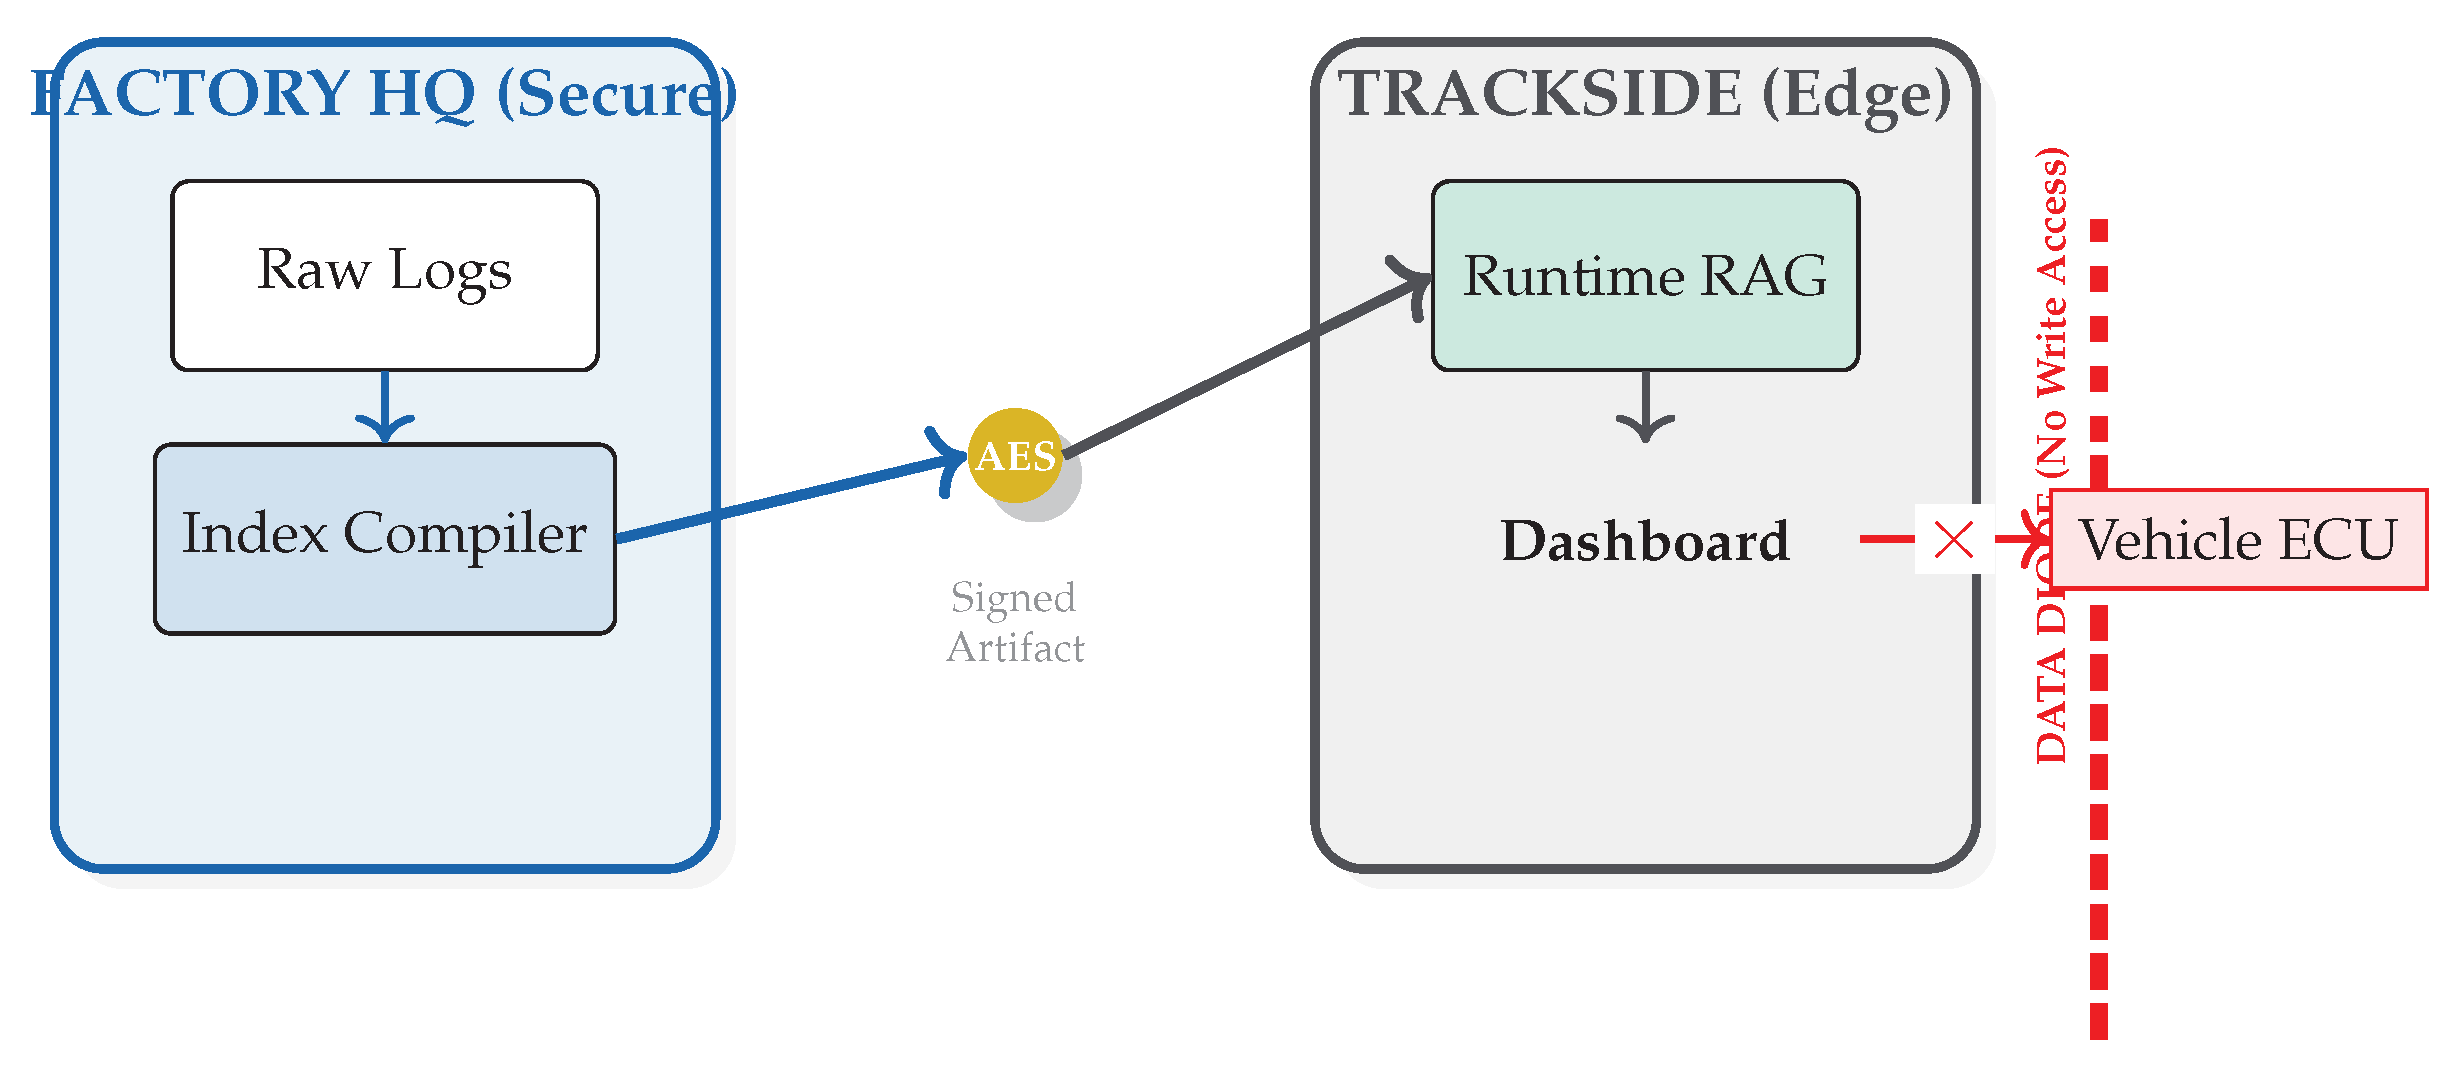
Figure 40.
The System Operating Envelope. The architecture excels in low-to-medium entropy regimes (Green/Yellow zones), maintaining high throughput. However, global high-entropy events (e.g., severe weather, Red zone) saturate the retrieval budget (), causing throughput to breach the real-time floor. Future work must address this "Thermal Wall."
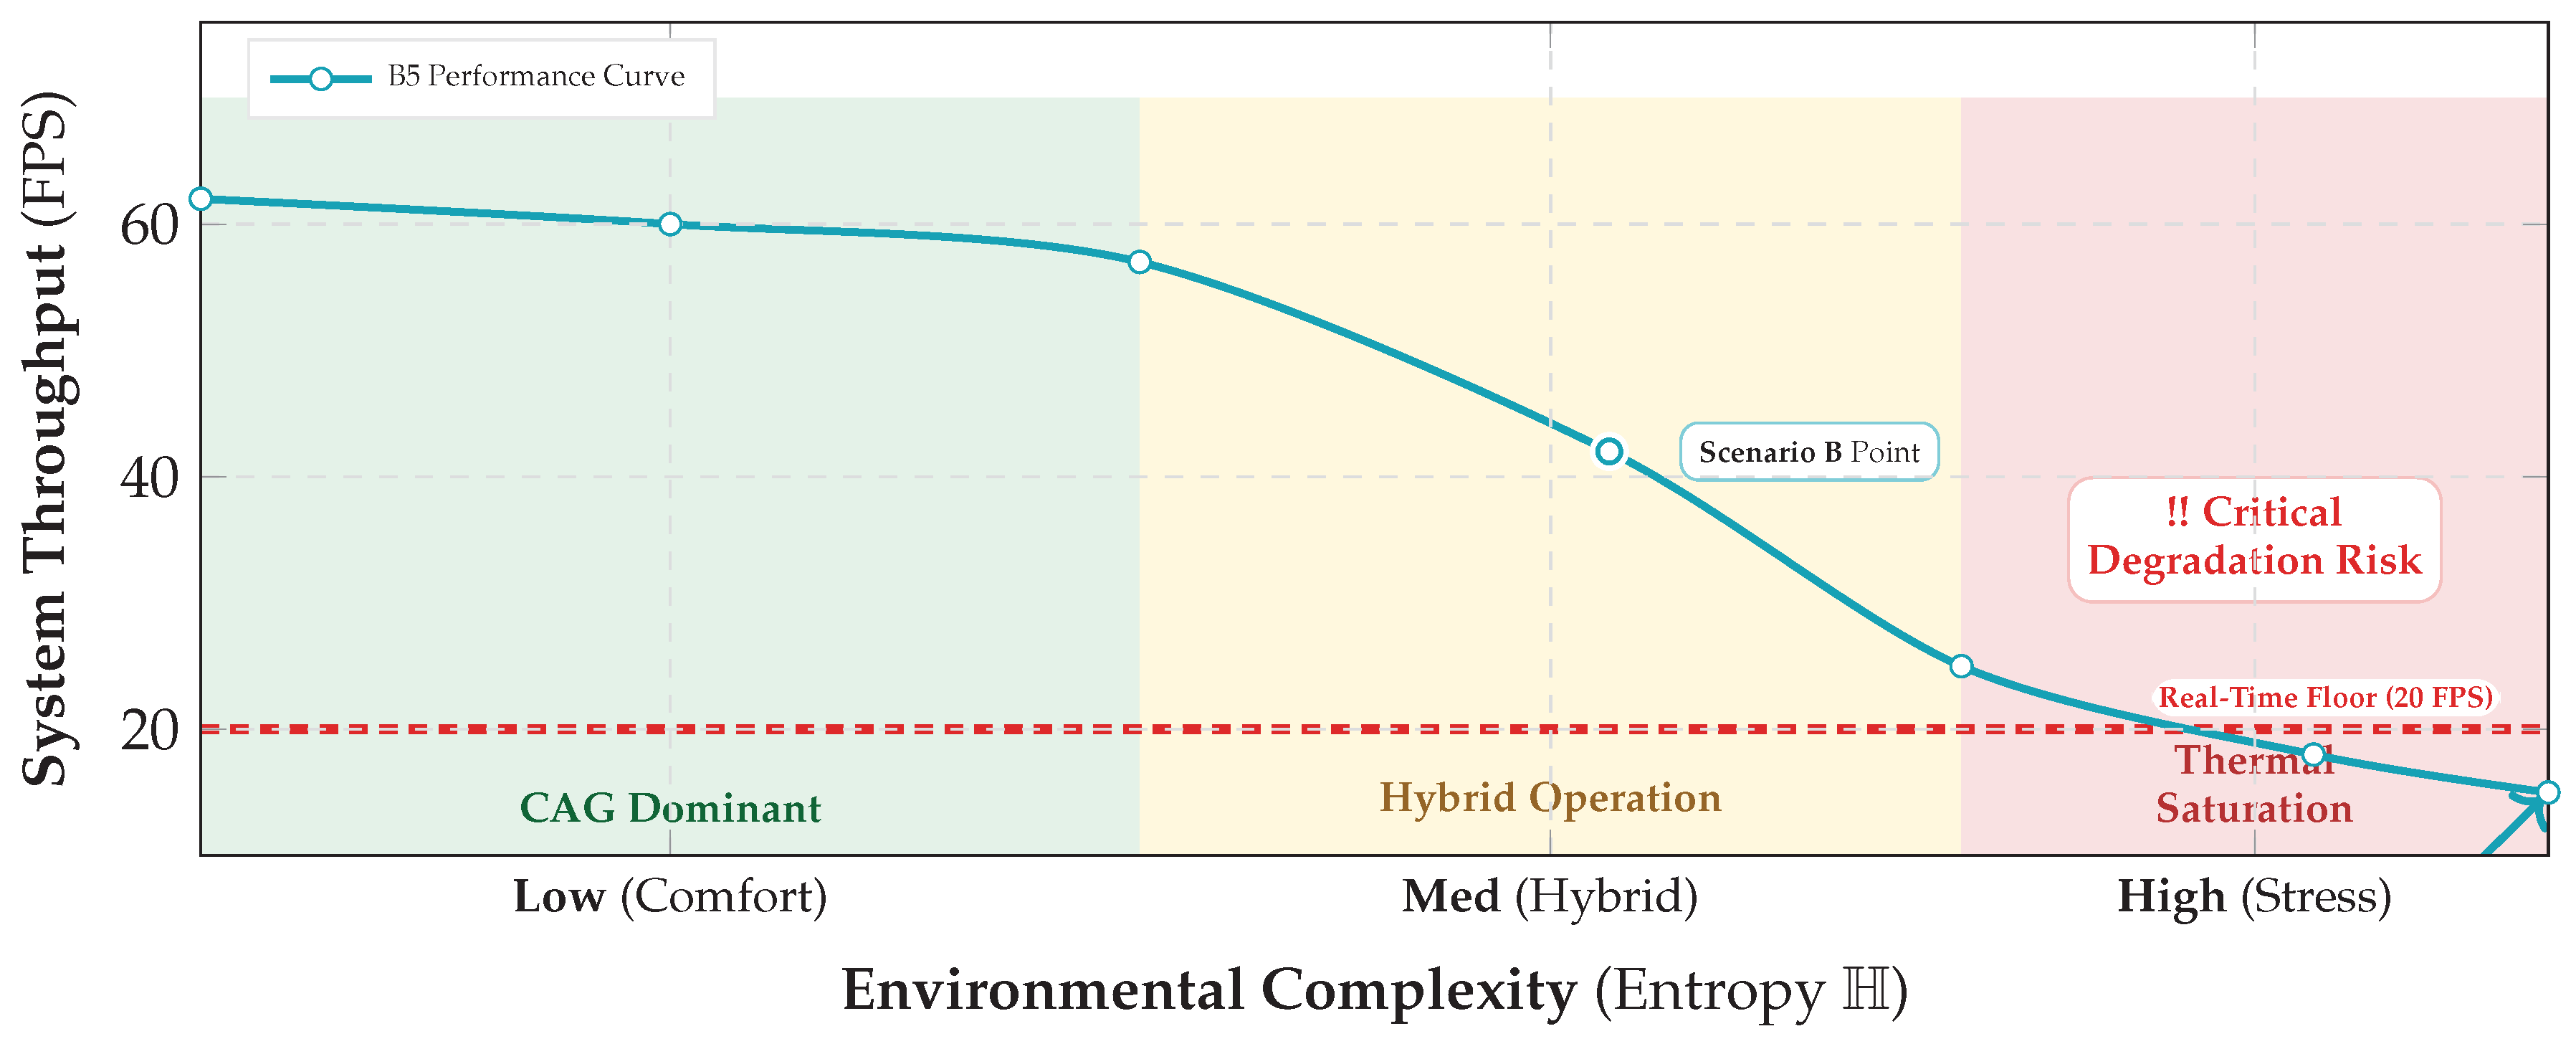
Figure 41.
Strategic research roadmap. We progress from a validated single-agent edge loop (Phase 1), to on-device cache adaptation (Phase 2), and to post-session collaborative learning that avoids raw video exchange (Phase 3).
Figure 41.
Strategic research roadmap. We progress from a validated single-agent edge loop (Phase 1), to on-device cache adaptation (Phase 2), and to post-session collaborative learning that avoids raw video exchange (Phase 3).
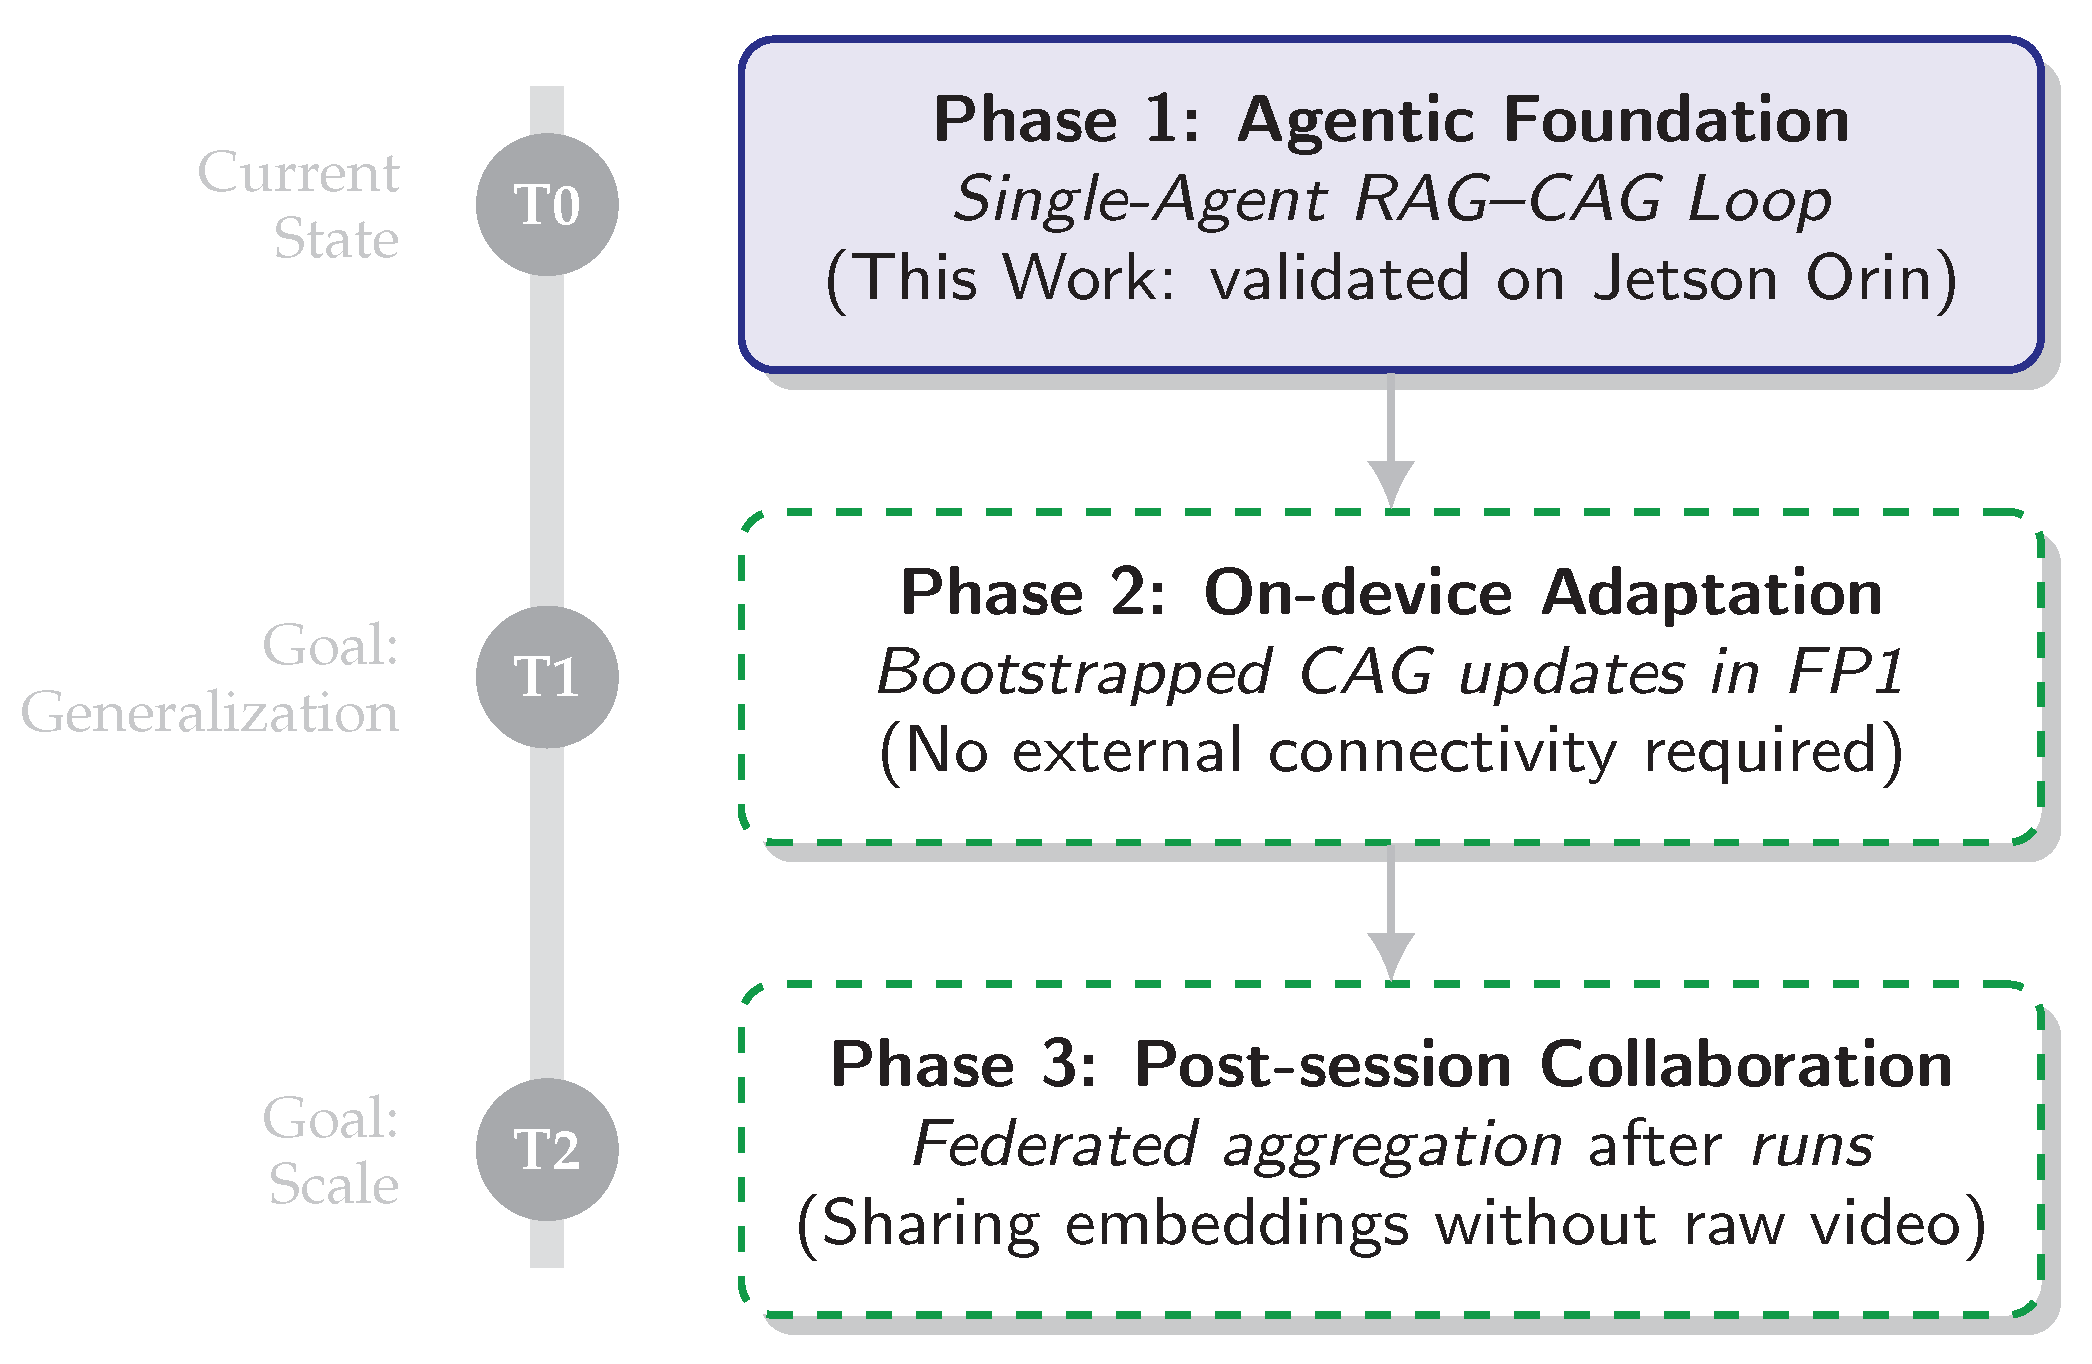
Table 1.
Notation and constraints. Symbols used in the problem setting and real-time budgeting.
| Symbol | Meaning |
|---|---|
| RGB frame at time t, | |
| Telemetry vector at time t, | |
| Ground-truth anomaly label (or multi-label vector) | |
| Predicted posterior over classes, | |
| Output vector (posterior + advisory ) | |
| Deadline (ms) for end-to-end processing | |
| End-to-end latency at time t | |
| Allowed tail-latency violation probability (chance constraint) | |
| Energy proxy per step t (J) | |
| Gate variable selecting memory path (0=CAG, 1=RAG) |
Table 2.
Latency budget breakdown. Measured on NVIDIA Jetson AGX Orin (MaxN mode, 50W cap). The vision encoder utilizes TensorRT (INT8), while RAG retrieval uses a GPU-accelerated HNSW index. represents the VRAM hash lookup.
Table 2.
Latency budget breakdown. Measured on NVIDIA Jetson AGX Orin (MaxN mode, 50W cap). The vision encoder utilizes TensorRT (INT8), while RAG retrieval uses a GPU-accelerated HNSW index. represents the VRAM hash lookup.
| Module | Median (ms) | p95 (ms) | p99 (ms) |
|---|---|---|---|
| (HW VIC: decode, resize, norm) | 1.20 | 1.35 | 1.80 |
| (Nested U-Net Encoder [INT8]) | 8.45 | 8.60 | 9.12 |
| (Telemetry MLP fusion) | 0.30 | 0.35 | 0.45 |
| (Entropy calculation) | 0.15 | 0.18 | 0.22 |
| (VRAM Context Cache) | 0.80 | 0.92 | 1.15 |
| (HNSW Index + Re-ranking) | 26.50 | 32.10 | 38.40 |
| (Decoder Heads) | 1.50 | 1.65 | 1.85 |
| Total (CAG Path - Low Entropy) | 12.40 | 13.05 | 14.59 |
| Total (RAG Path - High Entropy) | 38.10 | 44.23 | 49.82 |
Table 3.
System components and interfaces. Inputs/outputs, statefulness, and latency-criticality.
| Module | Input | Output | State | Criticality |
|---|---|---|---|---|
| Preprocess | stateless | medium | ||
| Vision encoder | parametric | high | ||
| Telemetry norm. | stateless | low | ||
| Gate/agent | stateful (EMA/hyst.) | high | ||
| CAG memory | key from | cached (VRAM) | very high | |
| RAG memory | external index | very high | ||
| Fusion | stateless | medium | ||
| Decision head | parametric | high |
Table 4.
Encoder configuration. Hyperparameters used to train the hardware-aware Nested U-Net. The setup prioritizes high-frequency texture retention and retrieval discriminability.
Table 4.
Encoder configuration. Hyperparameters used to train the hardware-aware Nested U-Net. The setup prioritizes high-frequency texture retention and retrieval discriminability.
| Item | Value |
|---|---|
| Input resolution | (RGB, fp16 normalized) |
| Embedding dimension | 512 (L2-normalized) |
| Backbone Architecture | ResNet-18 (with dense skip links) |
| Base channels | |
| Normalization | GroupNorm (groups=32) |
| Activation | SiLU (Sigmoid Linear Unit) |
| Optimizer | AdamW (lr=, wd=) |
| Loss weights | |
| Contrastive temperature | |
| Window W for | 5 frames (ms at 120fps) |
Table 5.
Orchestrator hyperparameters. calibrated for the Jetson AGX Orin target. These settings prioritize deadline compliance (ms) over maximum retrieval depth.
Table 5.
Orchestrator hyperparameters. calibrated for the Jetson AGX Orin target. These settings prioritize deadline compliance (ms) over maximum retrieval depth.
| Param | Value | Description / Rational |
|---|---|---|
| Base entropy threshold (balanced routing) | ||
| Hysteresis band to prevent flicker | ||
| m | 5 | Min dwell time (frames) ms at 120fps |
| EMA smoothing factor (noise rejection) | ||
| T | Temperature scaling for calibrated softmax | |
| Weights for Entropy, Energy, and Drift | ||
| 45 ms | Tail-latency guard (conservative RAG cap) |
Table 6.
Hybrid memory configuration. Specific hyperparameters tuned for the NVIDIA Jetson AGX Orin (MaxN mode) to satisfy the 50ms real-time deadline.
Table 6.
Hybrid memory configuration. Specific hyperparameters tuned for the NVIDIA Jetson AGX Orin (MaxN mode) to satisfy the 50ms real-time deadline.
| Parameter | Value | Rationale / Constraint |
|---|---|---|
| m | Cache bin size (m safety margin) | |
| Strict drift test ( confidence) to limit re-keying | ||
| Slow EMA adaptation rate to filter sensor noise | ||
| w | 60 frames | 0.5s persistence required to confirm systematic drift |
| k | 5 | Soft-voting consensus size (precision vs. latency trade-off) |
| Softmax temperature for similarity weighting | ||
| HNSW M | 32 | Graph connectivity optimized for vectors |
| efSearch | 64 | Limits graph traversal depth to cap tail latency (ms) |
| Partitions | Year_Track | Physical index isolation (2026 vs 2027) |
Table 7.
Aspar-Synth-10K anomaly taxonomy and injection parameters. Frequencies and triggers are calibrated to match the 2027 850cc chassis dynamics.
Table 7.
Aspar-Synth-10K anomaly taxonomy and injection parameters. Frequencies and triggers are calibrated to match the 2027 850cc chassis dynamics.
| Class | Phenomenon | Freq. Band | Trigger / Onset | Severity Function | Samples |
|---|---|---|---|---|---|
| Nominal (Track/Rain) | – | Random | – | 4,000 | |
| Headshake (Geometry) | 6–9 Hz | Accel ( thr) | Linear Ramp () | 1,500 | |
| Suspension Chatter | 18–24 Hz | Lean () | Sigmoid Step | 1,500 | |
| Brake Resonance | 12–16 Hz | Brake ( bar) | Pressure-Coupled | 1,500 | |
| Tire Graining (Visual) | Spatial | Late Stint () | Exp. Accumulation | 1,500 |
Table 8.
Edge inference specifications. Key hardware constraints for the deployment target.
| Parameter | Configuration |
|---|---|
| Platform | NVIDIA Jetson AGX Orin (64GB) |
| Compute Power | 275 TOPS (INT8 Sparse) |
| Memory BW | 204.8 GB/s (Critical for 4K) |
| Pipeline | TensorRT 8.5 + HW VIC (Zero-copy) |
| Constraints | 50W TDP / ms Latency |
Table 9.
Compliance-by-design matrix (constraints → design decisions).
| Constraint | Design decision |
|---|---|
| No bike↔pit signals while moving | On-device inference; no network; local RAG; deferred updates post-session. |
| Organizer-controlled onboard cameras | Uses simulation/engineering camera (test mode); no broadcast feed dependency. |
| No interference with ECU/actuation | Advisory-only; read-only taps; no inline hardware; fail-silent watchdog. |
| Deterministic latency requirement | Watchdog drops late frames; hysteresis; cache-first routing. |
Table 10.
Experimental variants (Ablation Study). We compare the full system (B5) against architectural subsets to isolate the impact of memory, hybrid routing, and domain awareness.
Table 10.
Experimental variants (Ablation Study). We compare the full system (B5) against architectural subsets to isolate the impact of memory, hybrid routing, and domain awareness.
| ID | Configuration | Research Question / Hypothesis |
|---|---|---|
| B0 | No-Mem (CNN Encoder only) | Is external memory actually necessary, or is the frozen encoder sufficient? |
| B1 | RAG-only (Always retrieve top-k) | What is the latency/energy penalty of continuous retrieval? (Upper bound on accuracy). |
| B2 | CAG-only (Static cache lookup) | Can simple caching handle novel anomalies without deep retrieval? |
| B3 | Hybrid (Basic Entropy Gate) | Does uncertainty-based routing effectively balance B1 and B2? |
| B4 | Hybrid + Hysteresis (Equation (45)) | Does the Schmitt trigger reduce "flicker" and routing instability? |
| B5 | Ours (Full + Domain Filter Equation (63)) | Does filtering obsolete (2026) data improve precision in the 2027 regime? |
Table 11.
Summary of Evaluation Metrics. Definitions and targets for the Jetson AGX Orin deployment.
Table 11.
Summary of Evaluation Metrics. Definitions and targets for the Jetson AGX Orin deployment.
| Symbol | Metric Name | Definition / Objective |
|---|---|---|
| Real-Time Safety | ||
| Tail Latency | 99th percentile of end-to-end time (↓ better) | |
| DMR | Deadline Miss Rate | (↓, target ) |
| Blind Distance | Meters traveled during latency at | |
| Diagnostic Quality | ||
| F1 | Macro F1-Score | Harmonic mean of precision/recall (↑) |
| ECE | Calibration Error | Weighted gap between confidence and accuracy (↓) |
| Rel@k | Retrieval Relevance | Fraction of top-k neighbors matching GT class (↑) |
| System Efficiency | ||
| Energy Cost | Joules consumed per inference step (↓) | |
| Routing Rate | Frequency of deep memory access () | |
| FPS | Throughput | Frames processed per second (↑, target ) |
Table 12.
Main Results (Mean ± Std where applicable). End-to-end latency percentiles, deadline miss-rate (ms), diagnostic performance, and energy. Red values indicate violations of the 50ms safety budget.
Table 12.
Main Results (Mean ± Std where applicable). End-to-end latency percentiles, deadline miss-rate (ms), diagnostic performance, and energy. Red values indicate violations of the 50ms safety budget.
| Latency (ms) | Miss | Diagnosis | Energy/Perf | Energy | |||||
|---|---|---|---|---|---|---|---|---|---|
| Variant | P50 | P95 | P99 | Rate (%) | Macro-F1 | PR-AUC | FPS | Avg W | J/frame |
| B0 (No-Mem) | 12.4 | 16.1 | 18.5 | 0.0 | 0.62 | 0.70 | 75 | 28.0 | 0.37 |
| B1 (RAG-only) | 38.2 | 95.4 | 112.1 | 16.8 | 0.89 | 0.94 | 26 | 36.0 | 1.38 |
| B2 (CAG-only) | 13.1 | 17.5 | 21.3 | 0.0 | 0.71 | 0.79 | 72 | 29.0 | 0.40 |
| B3 (Hybrid) | 16.5 | 42.1 | 58.4 | 2.1 | 0.84 | 0.90 | 55 | 33.0 | 0.60 |
| B4 (Hyst.) | 16.8 | 39.5 | 49.2 | 0.9 | 0.86 | 0.91 | 56 | 32.5 | 0.58 |
| B5 (Ours) | 16.9 | 38.2 | 46.5 | 0.4 | 0.88 | 0.93 | 58 | 31.5 | 0.54 |
Table 13.
Per-Class F1 Score Analysis. The hybrid architecture yields decisive gains in dynamic/oscillatory classes (Chatter, Shaking) compared to static baselines. denotes the net improvement of B5 over B0.
Table 13.
Per-Class F1 Score Analysis. The hybrid architecture yields decisive gains in dynamic/oscillatory classes (Chatter, Shaking) compared to static baselines. denotes the net improvement of B5 over B0.
| Anomaly Class | Dynamics | B0 (No-Mem) | B5 (Ours) | Gain |
|---|---|---|---|---|
| Normal (Nominal) | Static | 0.93 | 0.98 | +5% |
| Track Limits | Static | 0.92 | 0.94 | +2% |
| Tire Blistering | Visual | 0.78 | 0.88 | +10% |
| Brake Shaking | 12–16 Hz | 0.66 | 0.85 | +19% |
| Susp. Chatter | 18–24 Hz | 0.61 | 0.89 | +28% |
Table 14.
Operational Burden at High Recall (). B5 maintains high precision where baselines fail. The "False Alarm Ratio" indicates the operational noise: B0 generates more noise than signal (1.27), while B5 is clean (0.35).
Table 14.
Operational Burden at High Recall (). B5 maintains high precision where baselines fail. The "False Alarm Ratio" indicates the operational noise: B0 generates more noise than signal (1.27), while B5 is clean (0.35).
| Method | Precision @ | False Alarm Ratio | Operational Status |
|---|---|---|---|
| B0 (No-Mem) | 0.44 | 1.27 (High) | Unusable (Noise > Signal) |
| B2 (CAG) | 0.52 | 0.92 (Med) | Marginal |
| B5 (Ours) | 0.74 | 0.35 (Low) | Viable (Signal > Noise) |
Table 15.
Robustness Analysis (Macro PR-AUC). While the baseline degrades under stress (Scenarios B/C), B5 retains the stability of the full retrieval system.
Table 15.
Robustness Analysis (Macro PR-AUC). While the baseline degrades under stress (Scenarios B/C), B5 retains the stability of the full retrieval system.
| Variant | A: Nominal | B: Stress | C: Env. Shift | Stability () |
|---|---|---|---|---|
| B0 (No-Mem) | 0.72 | 0.68 | 0.69 | -5.6% |
| B1 (RAG-only) | 0.95 | 0.93 | 0.92 | -3.1% |
| B5 (Ours) | 0.94 | 0.92 | 0.91 | -3.2% |
Table 16.
B5 scenario profile. Energy correlates with RAG usage (). Nominal laps are most efficient; stress remains feasible under the 50ms deadline and 50W cap.
Table 16.
B5 scenario profile. Energy correlates with RAG usage (). Nominal laps are most efficient; stress remains feasible under the 50ms deadline and 50W cap.
| Scenario | P99 (ms) | Miss (%) | FPS | Avg W | J/frame | |
| A: Qualifying (Nominal) | 0.12 | 24.0 | 0.0 | 76 | 30.5 | 0.40 |
| B: Mechanical Stress | 0.45 | 46.5 | 0.4 | 51 | 34.5 | 0.68 |
| C: Environmental Shift | 0.23 | 39.0 | 0.2 | 61 | 31.1 | 0.51 |
Table 18.
Sector-wise Analysis. The system adapts to track topology. High-speed sectors allow for cache reuse (Low ), while technical low-speed sectors trigger retrieval to handle uncertainty.
Table 18.
Sector-wise Analysis. The system adapts to track topology. High-speed sectors allow for cache reuse (Low ), while technical low-speed sectors trigger retrieval to handle uncertainty.
| Sector | Avg speed (km/h) | Mean | |
| S1 (Main straight) | 270 | 0.05 | 0.15 |
| S2 (Turn 1 braking) | 60 | 0.68 | 0.75 |
| S3 (Turn 2 apex) | 100 | 0.45 | 0.55 |
| S4 (Banked) | 160 | 0.30 | 0.40 |
| S5 (Back straight) | 240 | 0.08 | 0.20 |
| S6 (Tight chicane) | 55 | 0.72 | 0.80 |
| S7 (Fast curve) | 180 | 0.25 | 0.35 |
| S8 (Finish straight) | 280 | 0.04 | 0.12 |
Table 19.
Retrieval Hygiene. Standard retrieval is polluted by obsolete data (2026 spec). Domain filtering eliminates these "Physics Hallucinations," ensuring that all retrieved context is mechanically compliant with the 2027 chassis regulations.
Table 19.
Retrieval Hygiene. Standard retrieval is polluted by obsolete data (2026 spec). Domain filtering eliminates these "Physics Hallucinations," ensuring that all retrieved context is mechanically compliant with the 2027 chassis regulations.
| Configuration | Rel@1 ↑ | Rel@5 ↑ | Hallucination Rate ↓ | Status |
|---|---|---|---|---|
| Unfiltered RAG | 0.78 | 0.72 | 0.28 | Unsafe (Obsolete Physics) |
| Domain-Aware | 0.92 | 0.88 | 0.00 | Compliant (2027 Spec) |
Table 22.
Scientific Traceability Matrix. A rigorous mapping of architectural claims to empirical evidence, ensuring no "orphan claims" exist in the discussion.
Table 22.
Scientific Traceability Matrix. A rigorous mapping of architectural claims to empirical evidence, ensuring no "orphan claims" exist in the discussion.
| Core Claim | Empirical Artifact (Evidence) | Status |
|---|---|---|
| 1. Real-Time Feasibility | Figure 19 (ECDF) & Table 12 (Budget) confirm tail latency stays below the 50ms hard deadline (P99 ms). | Verified |
| 2. Diagnostic Gain | Figure 20 (F1 Uplift) & Figure 21 (Conf. Matrix) demonstrate a +28% sensitivity gain in critical Chatter faults. | Verified |
| 3. Fail-Silent Safety | Figure 30 (Burst Analysis) & Figure 32 (FSM Logic) prove deterministic degradation without staleness. | Verified |
| 4. Energy Efficiency | Figure 25 (Pareto) & Figure 27 (Convexity) validate a 61% energy reduction vs. pure RAG. | Verified |
Disclaimer/Publisher’s Note: The statements, opinions and data contained in all publications are solely those of the individual author(s) and contributor(s) and not of MDPI and/or the editor(s). MDPI and/or the editor(s) disclaim responsibility for any injury to people or property resulting from any ideas, methods, instructions or products referred to in the content. |
© 2026 by the authors. Licensee MDPI, Basel, Switzerland. This article is an open access article distributed under the terms and conditions of the Creative Commons Attribution (CC BY) license (http://creativecommons.org/licenses/by/4.0/).
Copyright: This open access article is published under a Creative Commons CC BY 4.0 license, which permit the free download, distribution, and reuse, provided that the author and preprint are cited in any reuse.


