
Submitted:
18 January 2026
Posted:
19 January 2026
You are already at the latest version
Abstract
Saudi Arabia’s Vision 2030 places industrial upgrading at the center of economic diversification, yet the competitiveness impacts of energy inputs, renewable penetration, and innovation outputs remain insufficiently integrated in a single time-series framework. This study examines the determinants of Saudi industrial competitiveness, proxied by manufacturing value added (% of GDP), using annual data for 1990–2024 from the World Bank’s World Development Indicators. Methodologically, the analysis applies Augmented Dickey–Fuller (ADF) tests and an Autoregressive Distributed Lag (ARDL) bounds-testing approach with an error-correction model (ECM) to distinguish long-run equilibrium linkages from short-run adjustments. The ADF results indicate a mixed order of integration across variables, supporting the ARDL strategy. The bounds test provides evidence of cointegration at conventional significance levels. In the short run, technological innovation (total patent applications) is the only robust driver of competitiveness, while inflation is negative but only marginally significant and energy use, renewable energy consumption, GDP growth, and urbanization are statistically insignificant. The ECM term is negative and significant, implying rapid mean reversion, with about 55.5% of disequilibrium corrected annually. The findings suggest that innovation capability is the most immediate competitiveness lever, while energy-transition gains likely depend on longer-horizon efficiency, electrification readiness, and stable macro conditions.
Keywords:
manufacturing value added
; energy use
; technological innovation
; patent applications
; Saudi Arabia
; ARDL
1. Introduction
Industrial competitiveness has become a central priority for economies pursuing structural transformation, productivity gains, and sustainable growth. For Saudi Arabia, strengthening the industrial base is particularly important within the broader agenda of economic diversification, where manufacturing upgrading, technological capability, and resilient production systems are expected to reduce reliance on oil revenues and expand non-oil value creation. In this context, competitiveness is no longer shaped only by capital and labor accumulation; it increasingly depends on how efficiently economies mobilize energy inputs, accelerate innovation outputs, and maintain a stable macroeconomic environment that supports industrial investment and expansion.
Energy remains a foundational input for industrial activity. In an economy where industrial development has historically been supported by abundant energy resources, the relationship between energy use and industrial competitiveness is complex. On one hand, greater energy use can reflect industrial expansion, higher capacity utilization, and increased production. On the other hand, persistent energy intensity may signal inefficiency and rising vulnerability to changing energy market conditions. At the same time, the global shift toward cleaner production is strengthening the strategic role of renewable energy in industrial performance. Renewable energy adoption can improve competitiveness through cost stability, reduced exposure to fossil-fuel volatility, and better alignment with emerging sustainability standards in international markets and supply chains.
Beyond energy inputs, innovation outputs increasingly determine whether industrial sectors can move up the value chain. Technological innovation, commonly proxied by patent applications, reflects the creation and diffusion of new knowledge that can enhance process efficiency, product quality, and industrial diversification. In the Saudi context, patent activity may capture both domestic inventive capacity and technology-related activity connected to foreign firms and international collaboration when measured as total patent applications (residents and nonresidents). This makes innovation a key channel through which energy availability and energy transition efforts may translate into higher industrial performance rather than merely supporting scale-based production.
Figure 1.
Saudi Manufacturing, value added (% of GDP) development overview (1990-2024). Source: World Bank. https://datatopics.worldbank.org/world-development-indicators/. (Accessed on 12/11/2025).
Figure 1.
Saudi Manufacturing, value added (% of GDP) development overview (1990-2024). Source: World Bank. https://datatopics.worldbank.org/world-development-indicators/. (Accessed on 12/11/2025).
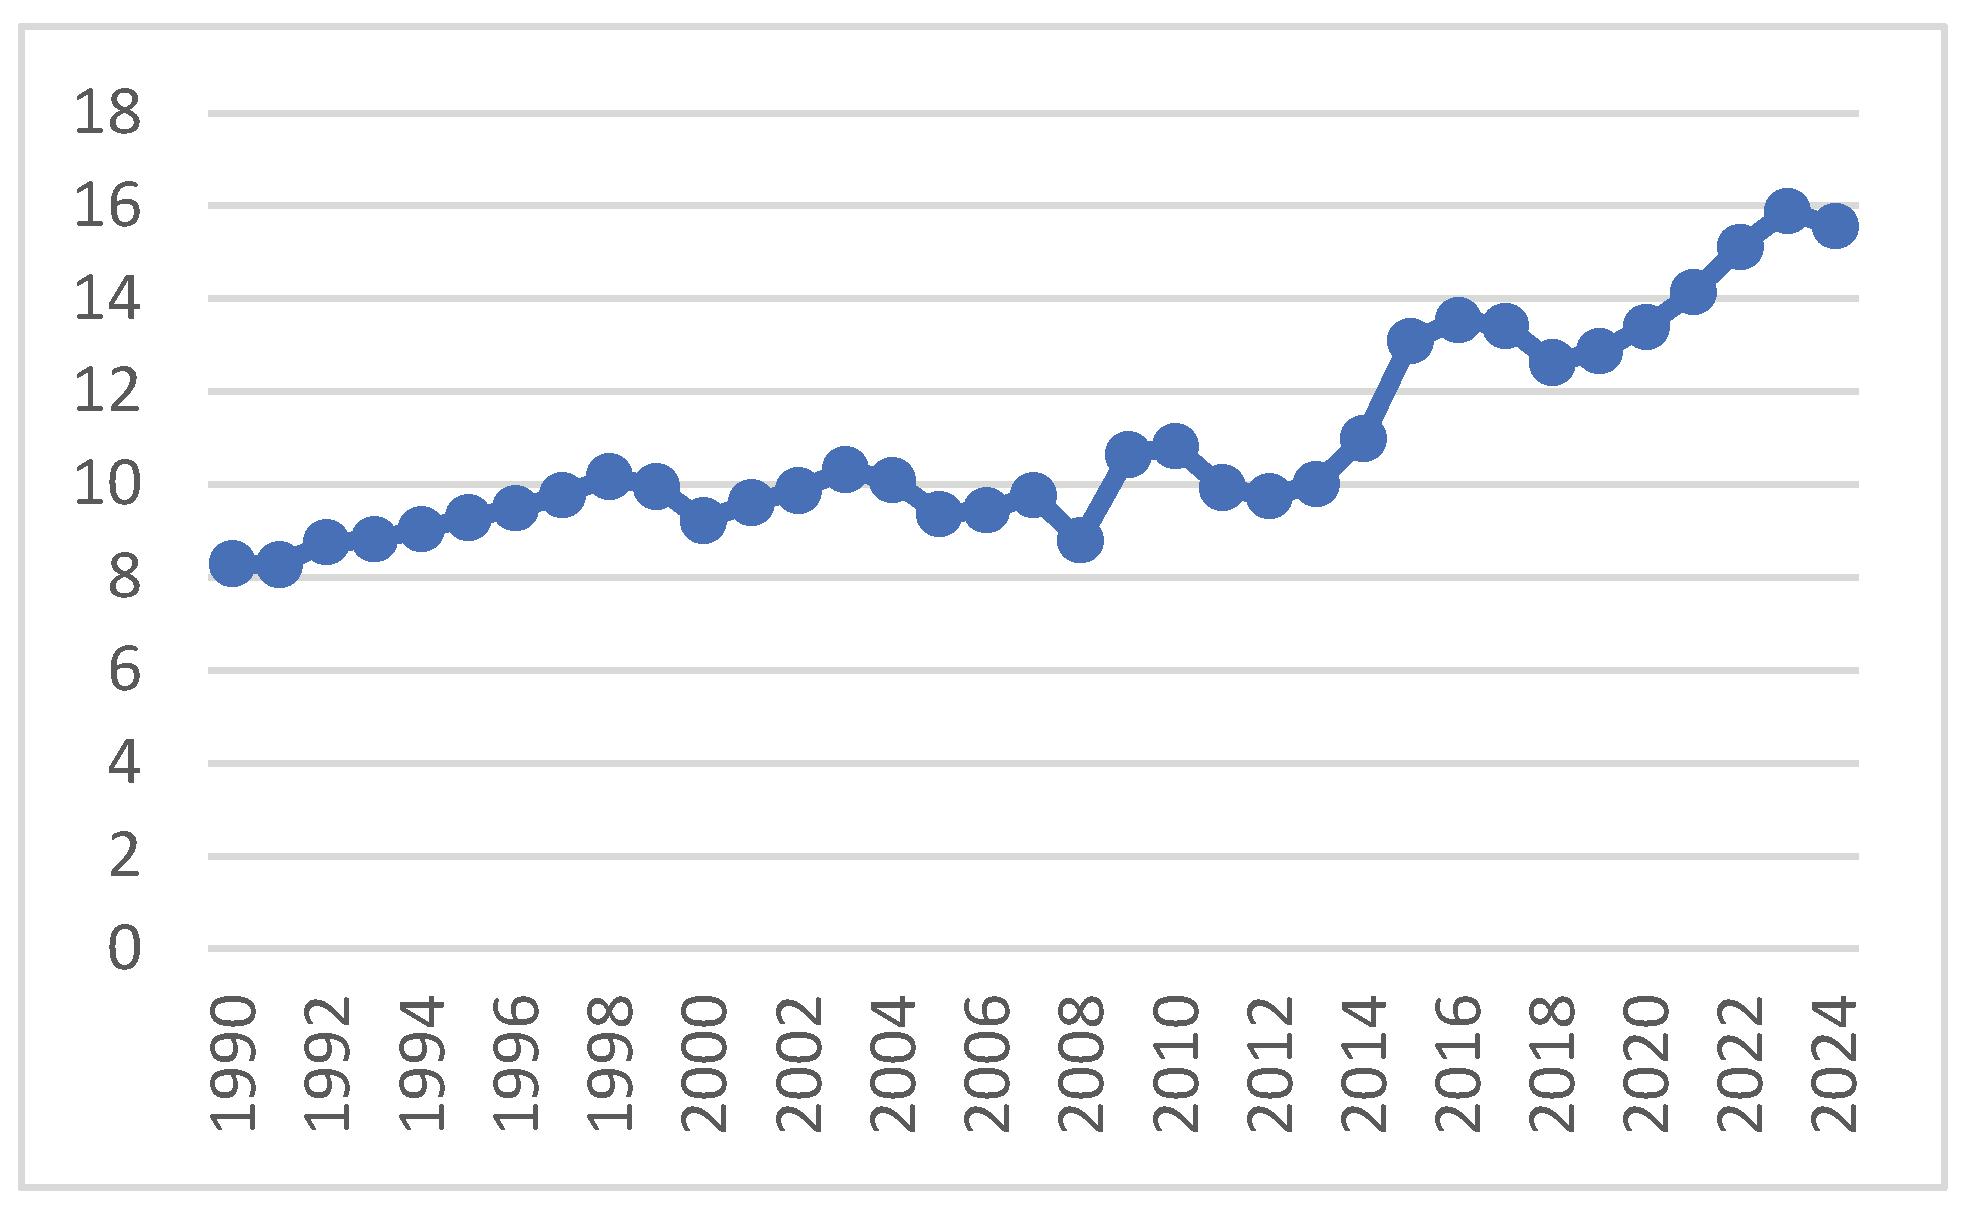
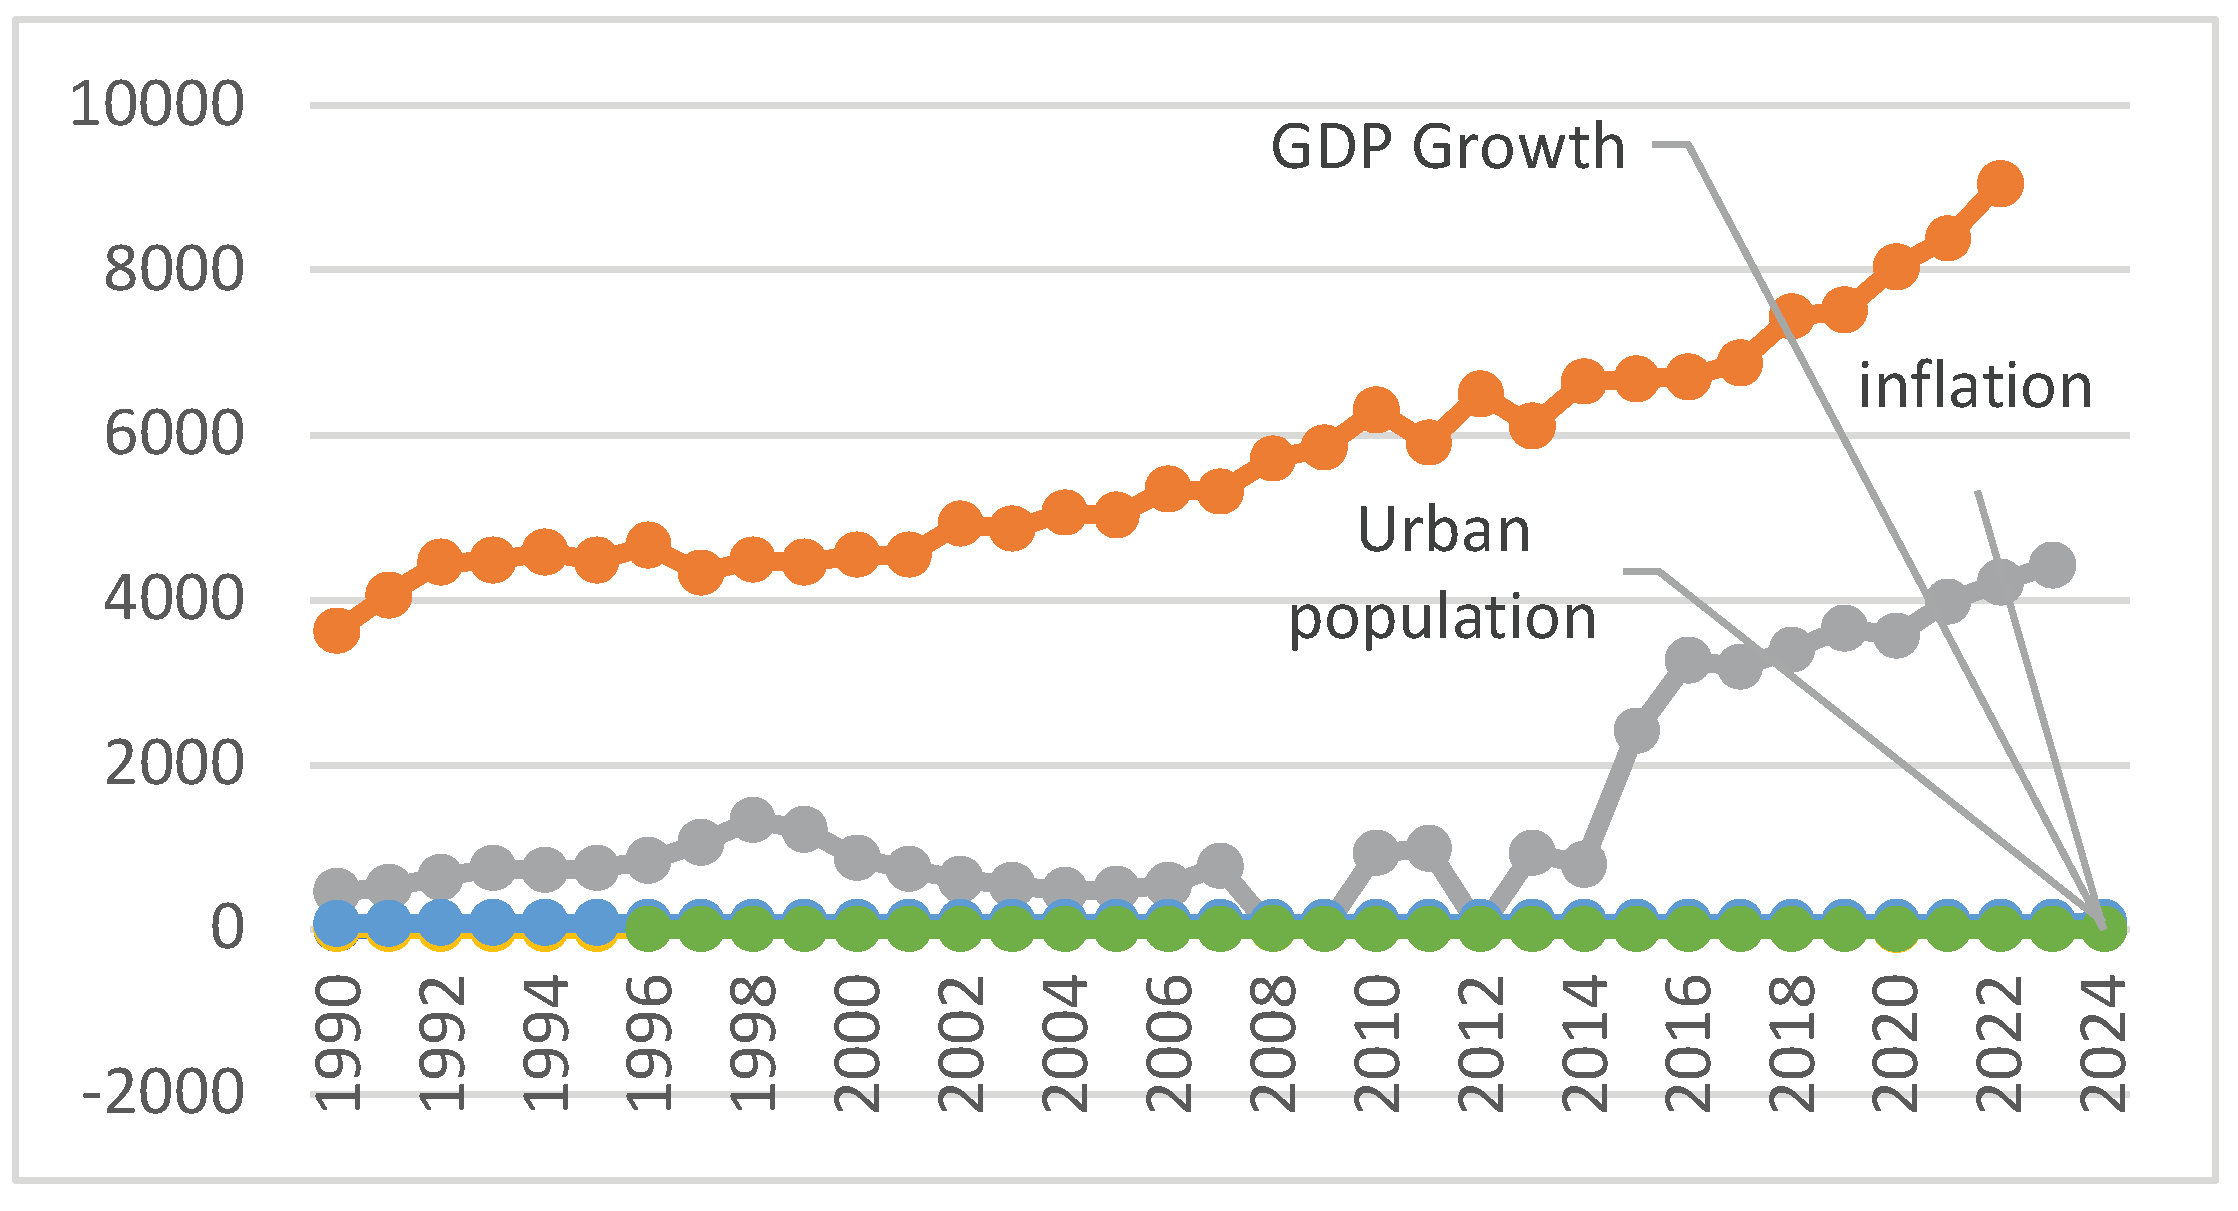
Figure 2.
Saudi Renewable Energy Consumption, GDP, Inflation, and Urban Population overview (1990-2024). Source: World Bank. https://datatopics.worldbank.org/world-development-indicators/. (Accessed on 12/11/2025).
Figure 2.
Saudi Renewable Energy Consumption, GDP, Inflation, and Urban Population overview (1990-2024). Source: World Bank. https://datatopics.worldbank.org/world-development-indicators/. (Accessed on 12/11/2025).
However, industrial competitiveness is also shaped by macroeconomic and structural conditions. Economic growth can strengthen industrial demand and investment prospects, while urbanization may support competitiveness through agglomeration economies, deeper labor markets, infrastructure concentration, and knowledge spillovers. In contrast, inflation can undermine competitiveness by increasing input costs, raising uncertainty, and discouraging long-horizon industrial planning. Despite the relevance of these channels, existing empirical evidence often examines energy, renewables, or innovation in isolation, or focuses on growth and environmental outcomes rather than industrial competitiveness as the primary outcome. This creates a gap in understanding the combined effects of energy inputs, renewable energy penetration, and innovation outputs, alongside key macro controls, within a unified time-series framework for Saudi Arabia.
Accordingly, this study investigates the determinants of Saudi industrial competitiveness by estimating the long-run and short-run effects of renewable energy consumption, energy use, and technological innovation (total patent applications: residents + nonresidents), while controlling for GDP growth, urban population, and inflation. Methodologically, the study applies the ARDL bounds testing approach, which is well-suited for macro time-series settings where variables may be integrated of different orders and where distinguishing between long-run equilibrium relationships and short-run adjustments is essential. The ARDL framework also enables an error correction representation, allowing the study to quantify how quickly deviations from long-run competitiveness dynamics are corrected over time.
This paper contributes to the literature in three main ways. First, it develops an integrated explanation of industrial competitiveness that links energy inputs (energy use and renewable energy penetration) with innovation outputs (patent activity), rather than treating these forces as separate determinants. Second, it provides Saudi-specific evidence on how the energy innovation competitiveness nexus behaves across horizons, clarifying whether renewable energy and innovation effects materialize primarily in the long run while macro factors drive short-run fluctuations. Third, the ARDL bounds testing design offers policy-relevant estimates of both long-run elasticities and short-run dynamics, supporting clearer implications for energy transition planning, innovation policy, and macroeconomic stability as complementary pillars of industrial upgrading.
The remainder of the paper is organized as follows. Section 2 reviews the literature on industrial competitiveness and its key determinants, focusing on the links between competitiveness and energy use, renewable energy consumption, innovation outputs (patent applications), and key macroeconomic controls. Section 3 presents the methodology, including data description, variable measurement, preliminary diagnostics, and the ARDL bounds testing framework for estimating long-run relationships and short-run error-correction dynamics. Section 4 reports the empirical results, covering the bounds cointegration test, long-run estimates, short-run dynamics, and diagnostic and stability checks. Section 5 discusses the findings in light of the Saudi industrial and energy-transition context, highlighting theoretical and policy implications. Section 6 concludes with key findings, limitations, and directions for future research.
2. Literature Review
2.1. Industrial Competitiveness
Industrial competitiveness commonly refers to an economy’s ability to create value in manufacturing activities, upgrade production capabilities, and compete in domestic and international markets through higher productivity, technological deepening, and improved export performance. In the industrial policy and development literature, competitiveness is therefore treated as a multi-dimensional outcome that reflects both production capacity and structural upgrading, rather than a single cost metric. UNIDO’s Industrial Development Report 2024 emphasizes the central role of industry in productivity, innovation, and job creation within modern industrial policy, reinforcing the idea that competitiveness is fundamentally tied to capabilities and upgrading dynamics over time [1].
Empirically, this multidimensional nature is often operationalized using composite indicators. A key example is UNIDO’s Competitive Industrial Performance (CIP) approach, which evaluates countries’ industrial performance based on their capacity to produce and export manufactured goods, progress in technological upgrading, and overall global impact in manufacturing trade [2]. More recent work continues to refine competitiveness measurement, including proposals that redesign CIP-type indicators using improved aggregation and benchmarking logic to better capture cross-country performance differences [3]. In parallel, UNIDO’s Inclusive and Sustainable Competitive Industrial Performance (ISCIP) index extends the traditional competitiveness lens by integrating broader sustainability-related dimensions while retaining a core emphasis on competitive industrial capability [4]. Evidence using ISCIP-type frameworks also shows that competitiveness rankings and performance evolve meaningfully over time when efficiency-based and spatio-temporal methods are applied, underscoring the importance of dynamic analysis rather than static comparisons [5].
While composite indices are valuable, they are not always ideal for long annual time-series econometrics due to data availability, revisions, and shorter historical coverage. For this reason, many time-series studies use a transparent, consistently measured proxy that captures industrial value creation. In this study, industrial competitiveness is proxied by manufacturing value added as a share of GDP (MVA % of GDP) (logged in the empirical model). This proxy aligns with national accounts logic: manufacturing value added measures the sector’s net contribution (output minus intermediate inputs) and, when expressed relative to GDP, captures the weight of competitive value creation in the economy’s overall production structure [6]. This proxy is particularly appropriate for Saudi Arabia because the competitiveness question is closely connected to industrial diversification and upgrading, i.e., whether manufacturing is expanding its contribution to domestic value creation as the economy transitions toward higher productivity and innovation-led industry. Moreover, MVA (% of GDP) is available as a long annual series, making it suitable for ARDL bounds testing and for distinguishing short-run shocks from long-run competitiveness effects driven by energy structure, innovation outputs, and macroeconomic conditions.
2.2. Renewable Energy Consumption and Industrial Competitiveness
Renewable energy consumption can enhance industrial competitiveness through several reinforcing channels. First, renewables increasingly provide a pathway to lower and more predictable generation costs, which can reduce manufacturing input costs and improve cost competitiveness, especially in electricity-intensive production. Evidence from global cost benchmarking indicates that a significant proportion of newly commissioned utility-scale renewables generates electricity at costs lower than those of fossil-fuel alternatives, thereby strengthening the economic case for renewables as a competitiveness input rather than solely an environmental choice [7]. In the Saudi context, policy framing also explicitly links renewables to an “optimal, most efficient, and least costly” electricity mix, with renewables expected to comprise around half of the power mix by 2030, suggesting that industrial cost structures will be increasingly shaped by renewable integration [8].
Second, renewables can reduce exposure to fossil-fuel price volatility; however, the competitiveness effect is not mechanically positive in the short term. Integration challenges, intermittency, balancing costs, and the need for flexibility can introduce transitional volatility or require complementary investments (grid, storage, demand response). Empirical analysis of European electricity markets, for example, links renewable penetration and market shifts to changing volatility patterns, underscoring that system flexibility conditions can shape whether renewables translate into stable industrial power prices over time [9]. This motivates treating renewable energy effects as potentially asymmetric across horizons: short-run adjustment costs may coexist with long-run efficiency and competitiveness gains.
Third, renewables can improve access to “green” markets and supply chains, where buyers, financiers, and regulators increasingly scrutinize embodied emissions and sustainability credentials. Firm-level evidence from Indian manufacturing shows that higher renewable energy intensity is associated with improved export performance in most industries, indicating a competitiveness channel via trade outcomes [10]. Yet the broader macro evidence remains mixed. Cross-country work on renewables and trade highlights heterogeneity depending on policy environments; for instance, prior gravity-model results summarized in recent research find that higher renewable energy consumption may increase imports and reduce exports in some settings, implying a possible short-run trade competitiveness penalty when renewable adoption raises costs or faces constraints [11].
Therefore, the empirical pattern is best described as context-dependent: renewable energy can strengthen competitiveness through lower long-run costs and green-market access, but transitional constraints and sectoral “hard-to-abate” conditions can weaken or delay benefits. This mixed evidence supports an ARDL framework that can separately identify long-run competitiveness effects from short-run adjustments, while allowing the Saudi case to be evaluated using domestic time-series dynamics rather than cross-country averages.
2.3. Energy Use and Industrial Competitiveness
Energy is a fundamental production input in manufacturing, shaping scale, capacity utilization, and industrial output through its role in powering machinery, process heat, logistics, and increasingly digitalized production systems. From a competitiveness perspective, energy is not only a “quantity” input, but also a cost and reliability factor: when energy costs rise or supply becomes uncertain, firms’ margins shrink, investment is delayed, and location decisions may shift, making energy conditions central to long-term industrial competitiveness [12].
At the same time, the relationship between energy use and competitiveness is two-sided. On one hand, higher aggregate energy use can reflect industrial expansion, deeper utilization of installed capacity, and stronger production activity, consistent with a positive association between energy inputs and manufacturing performance. On the other hand, persistently rising energy use may signal high energy intensity (energy per unit of value added), inefficient technologies, or an industrial structure concentrated in energy-intensive segments, which can weaken competitiveness when energy prices rise or when carbon constraints tighten. OECD evidence on energy-intensive industries highlights energy intensity as “energy use per value added” and treats it as a key performance dimension differentiating energy-intensive ecosystems from the rest of manufacturing [13].
This is why many competitiveness-oriented studies emphasize energy efficiency/energy productivity as the critical link: competitiveness improves when firms can produce more value with less energy. The IEA’s recent competitiveness-focused synthesis argues that energy efficiency strengthens competitiveness by reducing costs, improving operations, and increasing product value, and, at the macro level, by reducing the energy required to produce economic output [14]. In line with this, evidence for European countries shows that energy productivity positively affects total factor productivity in both the short and long run, with stronger long-run effects, supporting the view that efficiency gains can translate into durable competitiveness improvements after adjustment costs [15].
Empirically, the energy–industry nexus is widely observed across emerging and industrializing contexts, although magnitudes vary by structure and policy regime. Cross-country evidence for Sub-Saharan Africa reports positive associations between energy consumption and industrial performance, consistent with the “energy as enabling input” channel in capacity-constrained settings [16]. However, firm-level evidence from emerging markets also confirms the vulnerability dimension: electricity price increases can reduce employment in energy-intensive industries when firms have not adopted energy-efficiency measures, indicating that competitiveness depends heavily on whether energy use translates into value creation efficiently [17]. Complementary sectoral work on manufacturing energy intensity in EU “catching-up” economies similarly emphasizes that energy intensity is a core efficiency indicator linking energy use to value added dynamics over time (Norvaiša et al., 2024) [18].
Hence, the literature implies that the expected sign of energy use and industrial competitiveness is theoretically ambiguous and may differ across horizons: energy use can be positive when it captures expansion and higher utilization, but it can be negative when it reflects high energy intensity and weak efficiency. This motivates an ARDL framework that can distinguish short-run adjustments (e.g., energy price/cost pressures) from long-run relationships (efficiency upgrading and structural change).
2.4. Technological Innovation and Industrial Competitiveness
Technological innovation is widely viewed as a core driver of industrial competitiveness because it supports process innovation (lower unit costs, higher energy/material efficiency, fewer defects), product innovation (quality upgrading, differentiation), and structural transformation toward more complex and higher value-added activities. Patent applications are commonly used as an observable innovation output because they record inventions for which applicants seek legally protected exclusive rights. In the World Development Indicators (WDI) metadata, patents are explicitly defined as applications filed (via the PCT procedure or national offices) for exclusive rights over an invention, a product, or a process offering a new technical solution, with protection typically lasting around 20 years [19]. At the macro level, this makes patenting a practical proxy for innovation output that can be linked to competitiveness indicators such as manufacturing value added, especially when long annual time series are required.
Empirical evidence also supports the idea that patenting activity is associated with stronger performance outcomes that are closely related to competitiveness. Using firm evidence, an OECD Science, Technology and Industry Working Paper shows that patenting in Fourth Industrial Revolution technologies is analysed in relation to firm performance measures including labour productivity, multi-factor productivity, value added, and employment, reinforcing the view that patenting is not just a legal activity but is connected to capability and performance metrics that underpin industrial competitiveness [20]. At the trade/technology-upgrading margin, cross-country ARDL evidence indicates that resident and non-resident patent applications are linked to the dynamics of high-tech exports (high value-added technological goods), with results that are positive in some major economies but mixed in others, highlighting both the relevance of patenting for upgrading and the contextual nature of its effects [21].
This study uses total patent applications to capture innovation outputs more comprehensively than resident filings alone. Conceptually, resident applications reflect domestic inventive activity, while nonresident applications represent filings by applicants from abroad. The WDI glossary clarifies this distinction and notes that nonresident filings are from applicants outside the relevant state or region [19]. In an economy like Saudi Arabia, where industrial upgrading can be influenced by both domestic capability building and international technology presence, combining residents and nonresidents can better reflect local innovation effort, and foreign technology activity and knowledge spillovers associated with multinational operations, licensing, and technology-intensive investment. This combined measure is therefore consistent with the paper’s “innovation outputs” framing and with the reality that competitiveness can be strengthened through both indigenous innovation and absorbed/embedded external technologies.
Nevertheless, patents are an imperfect proxy for innovation, and the literature emphasizes important measurement caveats. First, not all innovations are patented (some are protected via secrecy, lead time, or other mechanisms), and patenting propensities differ across sectors and over time. Second, patent counts conflate low-impact and high-impact inventions; recent innovation-capability work explicitly highlights problems of “patent quantity distortion” and “patent quality heterogeneity,” proposing quality-weighted approaches to better capture innovation capability across manufacturing industries [22]. Third, measurement research stresses that some limitations of patents as innovation output indicators may be mitigated by linking patents to products and commercialization outcomes, underscoring that patenting is informative but not a complete measure of realized innovation [23]. For these reasons, macro time-series studies typically treat patent applications as a workable innovation-output indicator, interpret coefficients as reflecting the innovation environment rather than “pure” innovation, and allow for time lags because the competitiveness effects of innovation often materialize gradually.
2.5. GDP Growth and Industrial Competitiveness
GDP growth can strengthen industrial competitiveness through both demand-side and investment-side channels. On the demand side, faster growth typically expands domestic absorption and intermediate demand, raising capacity utilization and enabling firms to exploit scale economies, spread fixed costs, and invest in incremental upgrading—mechanisms that can translate into higher value creation and stronger industrial performance over time [24]. On the investment side, growth improves cash flows, creditworthiness, and business expectations, which can stimulate capital deepening, technology adoption, and productivity improvements, key ingredients of sustained competitiveness [25].
At the same time, the growth–competitiveness link is state- and context-dependent because macro-financial conditions shape whether growth converts into productive industrial upgrading. For example, global episodes of elevated inflation, tighter financial conditions, and higher borrowing costs tend to discourage investment, weakening the pathway from GDP growth to industrial expansion and upgrading [26]. In addition, heightened geopolitical fragmentation can affect trade and investment decisions, potentially reducing efficiency gains from specialization and scale, conditions that matter for industrial performance in open and globally integrated value chains [27]. These considerations support treating GDP growth as a relevant macro control when explaining Saudi industrial competitiveness, particularly during periods of reform, diversification, and shifting global demand conditions [28].
Importantly, feedback effects are plausible: competitiveness improvements can also support growth by expanding industrial output, job creation, and non-oil value added. Evidence for Saudi Arabia suggests that the industrial sector is a major contributor to GDP growth, reinforcing the possibility of bidirectional dynamics [25]. This is precisely why an ARDL framework is useful: it can separate short-run adjustments (e.g., cyclical demand shocks) from a long-run equilibrium relationship between industrial competitiveness and its determinants. Recent econometric contributions clarify how ARDL/equilibrium-correction specifications and associated bounds-testing procedures are operationalized and interpreted in applied macro time-series work [29,30].
2.6. Urbanization and Industrial Competitiveness
Urbanization can enhance industrial competitiveness through agglomeration mechanisms that raise productivity and facilitate upgrading. A larger urban share typically supports deeper labor markets, better matching between skills and jobs, and faster diffusion of know-how, while dense cities and connected urban corridors lower search and coordination costs for firms. Urbanization also strengthens competitiveness through infrastructure and logistics advantages (transport networks, ports/airports, utilities, digital connectivity), which reduce delivery times and transaction costs and make it easier for manufacturers to integrate into supply chains. In this sense, urbanization acts as a platform for industrial clustering, enabling proximity between producers, specialized suppliers, service providers, and customers, conditions associated with learning-by-interaction and knowledge spillovers [31,32].
Recent empirical work reinforces these channels while emphasizing heterogeneity. Evidence on urbanization and industrial upgrading finds that higher urbanization can promote industrial transformation and upgrading, with human capital and transportation scale highlighted as key channels (Wan et al., 2024). At the micro and meso levels, population agglomeration in urban clusters is found to increase enterprise total factor productivity by reducing costs via market and scale effects, consistent with competitiveness gains through agglomeration economies [32]. However, results are not uniform across contexts: cross-economy evidence suggests urban agglomeration can be harmful to performance in the short-run in developing economies but turn beneficial in the long run, implying that adjustment frictions and institutional capacity shape whether agglomeration translates into competitiveness [33].
Urbanization can also generate downsides that weaken competitiveness if density outpaces planning and infrastructure. Congestion, housing pressure, and rising land rents and wages can raise firms’ operating costs and erode cost competitiveness, especially for space-intensive or labour-intensive manufacturing. Recent evidence links rapid urbanization to urbanization diseconomies (notably congestion-related housing deprivation) in fast-growing regions [34], and urban productivity research highlights how urban growth can coincide with traffic congestion and housing shortages as density increases [35]. Even within manufacturing agglomeration research, congestion effects are explicitly documented as a mechanism that can reduce efficiency gains in more developed settings [36]. Taken together, the expected sign of urbanization and industrial competitiveness can be positive where agglomeration economies dominate, but it can become weaker or negative where congestion and cost pressures dominate, making dynamic approaches valuable for distinguishing short-run cost pressures from long-run agglomeration benefits [33].
2.7. Inflation and Industrial Competitiveness
Inflation can weaken industrial competitiveness through cost and uncertainty channels. On the cost side, higher inflation tends to raise nominal input costs (materials, wages, services, and domestically priced logistics), and it often coincides with tighter financing conditions that increase working-capital and investment costs. These pressures can compress margins and reduce firms’ ability to invest in productivity-enhancing upgrades, especially in manufacturing segments where pricing power is limited or competition is intense. At the macro level, persistent price pressures also restrict the scope for policy easing and can dampen demand and investment conditions, thereby affecting manufacturing value creation and competitiveness [19].
On the uncertainty side, inflation increases the dispersion of expectations about future costs and demand, which can worsen planning horizons and encourage firms to delay irreversible investments (“wait-and-see” behavior). Cross-country evidence shows that inflation uncertainty is associated with weaker real activity: it reduces industrial production at the macro level and lowers firms’ real sales and employment at the micro level, channels that directly map into industrial competitiveness outcomes [37]. Consistent with the idea that persistence matters, research on monetary policy under uncertain inflation persistence emphasizes that when inflation may remain elevated for longer than expected, policy responses and financing conditions tend to be more restrictive than under transitory shocks, raising the likelihood of longer-lasting competitiveness headwinds [38].
A key distinction in the literature is between transitory inflation shocks and persistent inflation. In the short run, firms may adjust quickly to inflation news, updating perceptions and near-term pricing expectations within hours or days following inflation releases, suggesting that inflation can generate immediate disturbances in pricing and cost management even before real adjustments occur [39]. At the same time, firms may exhibit adaptive behavior that partially offsets shocks (e.g., passing through costs or substituting inputs). For example, firm-level evidence on the Baltics finds mixed effects of inflation and inflation volatility on productivity, profitability, and net fixed investment that dissipate over time, highlighting the possibility of heterogeneous short-run responses [40]. Over the long run, however, sustained inflation is more likely to undermine competitiveness by increasing macro instability, discouraging capital formation and upgrading, and eroding the predictability required for industrial investment. Supporting this stabilization channel, evidence from developing countries indicates that inflation-targeting frameworks, which are designed to reduce macro instability, are associated with stronger firm performance (sales growth and productivity growth), underscoring the competitiveness value of low and stable inflation environments [41].
2.8. Evidence from Saudi Arabia, Policy Context, and the Research Gap
Saudi Arabia’s industrial transformation agenda under Vision 2030 emphasizes building a globally competitive industrial base by localizing advanced strategic industries, strengthening technology and knowledge capabilities, and accelerating innovation-driven upgrading [42]. In parallel, the energy transition is being institutionalized through national programs that aim to optimize the electricity mix and expand renewables, explicitly targeting renewables to comprise around 50% of the electricity generation mix by 2030, alongside cost-efficiency and reliability objectives [8]. This dual policy direction (energy transition + industrial upgrading) is also reflected in strategy narratives that present industrial development as a route to diversification, investment attraction, and stronger competitiveness within a future high-tech value-added manufacturing phase [43].
Empirically, the Saudi-focused literature has tended to concentrate on macro-outcomes, especially the energy growth and energy environment nexuses. For instance, time-series studies frequently model how renewable and non-renewable energy (often alongside “technology” proxies and other controls) affect GDP growth using ARDL-type frameworks [44]. Similarly, a large stream examines how energy structure variables (including renewable/sustainable power) interact with macro drivers to explain CO2 emissions and related sustainability outcomes, again commonly using ARDL and VECM dynamics [45]. Within this evidence base, sector-specific work is comparatively thinner: recent manufacturing-focused research explicitly notes that most studies examine energy consumption and overall economic growth, while studies focused on manufacturing output remain limited for Saudi Arabia [46].
Research gap and contribution. Building on this context, the under-examined area is industrial competitiveness as the dependent variable, particularly competitiveness proxied by manufacturing value added (MVA, % of GDP), explained jointly by (i) total energy use, (ii) renewable energy consumption, and (iii) innovation outputs (patent applications), while controlling for key macro conditions (GDP growth, urbanization, inflation), within a unified ARDL bounds-testing framework.
This study contributes by shifting the Saudi evidence base away from the dominant emphasis on the energy–growth and energy–emissions nexuses toward a more policy-relevant focus on how energy inputs and innovation outputs jointly shape industrial competitiveness, proxied by manufacturing value added. It further advances the literature by integrating energy use, renewable energy consumption, and technological innovation (patent applications by residents and nonresidents) within a single competitiveness framework that is consistent with Vision 2030’s industrial upgrading logic and the Kingdom’s industrial transformation priorities [42,43]. Finally, by applying ARDL bounds testing and an error-correction specification, the study distinguishes short-run adjustment dynamics, including transition frictions and cyclical fluctuations, from long-run equilibrium relationships, thereby producing evidence that is more actionable for sequencing industrial, energy-transition, and innovation policies [45].
3. Data and Methodology
3.1. Study Area: Saudi Arabia
Saudi Arabia is a high-income, oil-exporting economy in the Middle East that is undergoing a major structural transformation under Vision 2030, which targets reduced oil dependence and stronger non-oil growth. Within this agenda, manufacturing has been designated a key pillar of diversification, with policy efforts focused on expanding higher value-added activities, strengthening export capacity, and deepening technological capabilities. The industrial sector remains energy-intensive and is still largely powered by oil and gas, but the country is gradually increasing the role of renewable energy and energy-efficiency measures. These features, resource abundance, an evolving energy mix, and growing innovation activity, make Saudi Arabia a suitable case for examining how energy use, renewable energy, technological innovation, and macroeconomic conditions jointly influence manufacturing value added.
3.2. Data Sources
This study relies on annual time-series data for Saudi Arabia covering the period 1990–2024. All variables are obtained from the World Bank’s World Development Indicators (WDI) database, including: manufacturing value added (% of GDP), energy use (kg of oil equivalent per capita), renewable energy consumption (% of total final energy consumption), trade (% of GDP), patent applications (residents and non-residents) as a proxy for technological innovation, GDP growth (annual %), urban population (% of total population), and inflation based on consumer prices (annual %).
3.3. Variable Definitions and Measurement
In line with the study’s objective, we specify manufacturing value added as the dependent variable and the remaining indicators as explanatory variables. Where appropriate (levels), variables are transformed into natural logarithms in the empirical analysis; percentage and growth-rate variables are kept in their original form.
- Industrial competitiveness: proxied by manufacturing value added (MVA) (% of GDP): This is the dependent variable. It measures the value added of the manufacturing sector as a percentage of gross domestic product, and serves as a summary indicator of the sector’s relative contribution to the economy and to structural transformation.
- Energy use (kg of oil equivalent per capita) – EU: Total primary energy use divided by population, expressed in kilograms of oil equivalent per person. It captures the overall intensity of energy use in the economy and is expected to be closely related to the scale and energy intensity of manufacturing activity.
- Renewable energy consumption (% of total final energy consumption) – RE: Share of final energy consumption derived from renewable sources. These variable proxies the extent of the energy transition and the potential role of cleaner energy in supporting manufacturing.
- Technological innovation (patent applications, residents and non-residents) – TI: Total number of patent applications filed by residents and non-residents in Saudi Arabia. It is used as a proxy for technological effort and innovation capacity relevant to industrial and manufacturing upgrading.
- GDP growth (annual %) – GDPG: Annual percentage growth rate of real GDP. It captures the overall macroeconomic environment and demand conditions in which manufacturing operates.
- Urban population (% of total population) – URB: Share of the population living in urban areas. It proxies the degree of urbanization and associated agglomeration effects, market size, and labour-pool depth relevant to manufacturing.
- Inflation, consumer prices (annual %) – INF: Annual percentage change in the consumer price index. These variable measures price instability and macroeconomic conditions that may affect manufacturing investment, costs, and planning.
3.5. Econometric Strategy
The econometric analysis proceeds
in three main steps.
- Stationarity of each series is examined using the Augmented Dickey–Fuller (ADF) test in levels and first differences. This allows us to determine the order of integration of manufacturing value added and its determinants and to ensure that no variable is integrated of order two, which would invalidate the chosen cointegration techniques.
- Given that the variables are expected to be a mixture of I(0) and I(1), the study employs an Autoregressive Distributed Lag (ARDL) bounds-testing approach to cointegration as the baseline framework, supplemented where appropriate by a Vector Error Correction Model (VECM) specification when Johansen tests indicate a unique cointegrating relationship. The ARDL model is estimated with optimal lag lengths selected by standard information criteria.
- The corresponding error-correction representations are used to distinguish between long-run and short-run dynamics. Long-run coefficients capture the steady-state impact of energy use, renewable energy, innovation, trade, and macroeconomic variables on manufacturing value added, while the short-run coefficients and the error-correction term describe the speed of adjustment toward the long-run equilibrium following shocks.
3.6. Model Specification
The starting point is a log–linear long-run relationship in which manufacturing value added is explained by energy, innovation, and macroeconomic variables:
Ln MVAt = α0 + α1ln EUt + α2Ret + α3ln TIt + α4GDPGt + α5URBt + α6INFt + εt (1)
where:
- -
- Ln MVAt = natural log of manufacturing value added (% of GDP)
- -
- ln EUt = natural log of energy use (kg of oil equivalent per capita)
- -
- REt = renewable energy consumption (% of total final energy use)
- -
- Ln TIt = natural log of patent applications (residents + non-residents)
- -
- GDPGt = GDP growth (annual %)
- -
- URBt = urban population (% of total population)
- -
- INFt = inflation (consumer prices, annual %)
- -
- εt = error term.
Here, α1,…,α6 measure the long-run elasticities and/or semi-elasticities of manufacturing value added with respect to the explanatory variables.
4.6.1. ARDL Model (Levels Form)
Given a mix of I(0) and I(1) variables, the baseline empirical model uses an ARDL(p, q1,…, q7) specification:

where ut is a white-noise disturbance. Lag orders p, q1,…, q6 are selected using information criteria (AIC).
4.6.2. Error–Correction (ECM) Representation
To distinguish short-run and long-run effects, the ARDL is re-parameterized into an error-correction model:
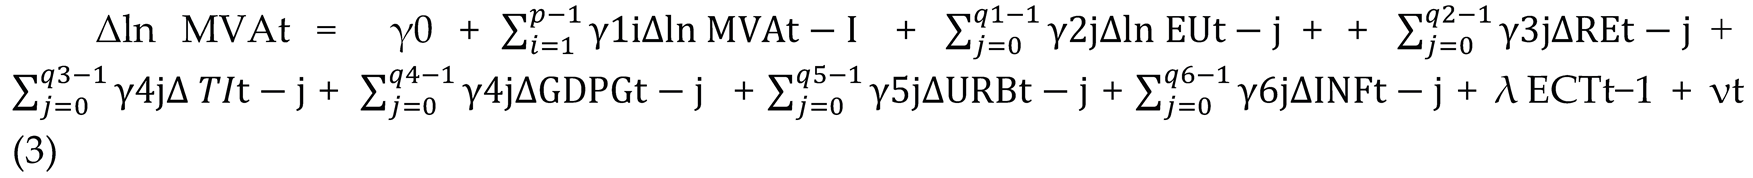
where:
- -
- Δ is the first-difference operator,
- -
- ECTt−1 is the error-correction term derived from the estimated long-run equation,
- -
- λ<0 measures the speed of adjustment back to the long-run equilibrium,
- -
- γ∙ capture short-run dynamics, and
- -
- νt is the new error term.
4. Results
4.1. Descriptive Statistics
Across the 35 observations, the series show mixed stability and distributional behavior: LnMVA and Ln UP are the most stable (very low standard deviations ≈0.186 and 0.029) with moderate and/or low skewness and kurtosis and they do not reject normality (Jarque–Bera p-values 0.1417 and 0.4419), while Ln GDP is more volatile (Std. Dev. ≈1.027) but still relatively well-behaved and approximately normal (p = 0.3540) despite mild negative skewness. In contrast, Ln Inflation is volatile (Std. Dev. ≈0.973) and non-normal (p = 0.0065), indicating heavier tails and asymmetric movements likely driven by inflation episodes. The most problematic distributions are Ln EU and Ln TI, which show very large dispersion (Std. Dev. ≈2.041 and 2.390), extreme negative skewness (−3.738 and −1.986) and high kurtosis (15.19 and 5.78) with strong rejection of normality (p = 0.0000), suggesting extreme low observations and/or outliers or structural breaks (also consistent with the near-zero minima reported). Ln REC is also clearly non-normal (p = 0.000025) with strong positive skewness (1.759) and elevated kurtosis (4.48), implying occasional spikes.

Table 1.
Descriptive statistics for the study variables.
| Statistic | Ln MVA | LN INFLATION | LN GDP | LN EU | LN REC | LN TI | LN_UP |
| Mean | 2.368 | 0.377 | 0.968 | 8.123 | -3.713 | 6.249 | 4.398 |
| Median | 2.297 | 0.186 | 1.172 | 8.530 | -4.605 | 6.668 | 4.400 |
| Maximum | 2.766 | 2.290 | 2.485 | 9.110 | 0.000 | 8.394 | 4.445 |
| Minimum | 2.114 | -2.862 | -1.166 | 0.000 | -4.707 | 0.000 | 4.338 |
| Std. Dev. | 0.186 | 0.973 | 1.027 | 2.041 | 1.598 | 2.390 | 0.029 |
| Skewness | 0.750 | -0.835 | -0.484 | -3.738 | 1.759 | -1.986 | -0.194 |
| Kurtosis | 2.346 | 5.028 | 2.303 | 15.193 | 4.478 | 5.782 | 2.015 |
| Jarque-Bera | 3.908 | 10.062 | 2.077 | 298.307 | 21.228 | 34.290 | 1.633 |
| Probability | 0.142 | 0.007 | 0.354 | 0.000 | 0.000 | 0.000 | 0.442 |
| Sum | 82.872 | 13.182 | 33.866 | 284.305 | -129.951 | 218.723 | 153.939 |
| Sum Sq. Dev. | 1.182 | 32.199 | 35.831 | 141.671 | 86.820 | 194.189 | 0.029 |
| Observations | 35 | 35 | 35 | 35 | 35 | 35 | 35 |
4.2. Unit Root Test Analysis
In the ADF unit-root test, the null hypothesis is that the series has a unit root (non-stationary), so p < 0.05 implies rejection of the null and stationarity. Table 2 reveals a mixed integration structure: three variables (Ln GDP, Ln Inflation, and Ln TI) are stationary at the level [I(0)] with highly significant t-statistics and p-values ranging from 0.000 to 0.035, indicating they are mean-reverting and suitable for direct use in econometric models, while four variables (Ln MVA, Ln EU, Ln REC, and Ln UP) are non-stationary at the level but become stationary after first differencing [I(1)], as evidenced by their weak level test p-values (0.235 to 0.948) but strong first difference test p-values (all 0.000), indicating these variables follow random walk behavior and require differencing before use in regression analysis.
4.3. Long-Run Estimates
4.3.1. ARDL Bound Test
The ARDL bounds test was employed to examine the existence of a long-run (levels) relationship among the variables under the null hypothesis of no cointegration. The results in Table 3 show an F-statistic of 3.3593 (k = 6), which exceeds the upper-bound critical values at the 10% (I(1) = 2.94) and 5% (I(1) = 3.28) significance levels. Accordingly, the null hypothesis is rejected at these conventional levels, providing evidence of a cointegrating (long-run) relationship among the model variables. However, the F-statistic remains below the upper-bound critical values at the 2.5% (I(1) = 3.61) and 1% (I(1) = 3.99) levels, implying that while cointegration is supported at 5–10%, it is not confirmed under more stringent significance thresholds.
4.4. Short-Run Dynamics
The error-correction model (ECM) captures short-run adjustments while explicitly incorporating the error-correction term to measure the speed at which deviations from the long-run equilibrium are corrected. Based on Table 3, in the short run, most regressors are statistically insignificant at the 5% level: ΔLn EU (β = −0.0031, p = 0.659), ΔLn GDP (β = −0.0091, p = 0.276), ΔLn REC (β = 0.0073, p = 0.634), and ΔLn UP (β = 2.2596, p = 0.769) do not show detectable immediate effects on ΔLn MVA in this specification; ΔLn Inflation is negative and only marginally significant at 10% (β = −0.019, p = 0.104), suggesting a weak short-run dampening effect. The only clearly significant short-run driver is ΔLn TI (β = 0.00934, p = 0.015), implying that increases in TI are associated with higher short-run growth in MVA (in log-difference terms, this is a small positive elasticity-type effect). Crucially, the ECT(−1) coefficient is negative and statistically significant (β = −0.5553, p = 0.0065), confirming cointegration and indicating a relatively fast speed of adjustment: about 55.5% of the previous period’s disequilibrium is corrected each year, so the system returns toward its long-run path fairly quickly.
Table 4.
Error correction model results.
| Variable | Coefficient | Std. Error | t-Statistic | Prob. |
| C | 0.011 | 0.026 | 0.417 | 0.680 |
| D(Ln EU) | -0.003 | 0.007 | -0.447 | 0.659 |
| D(Ln GDP) | -0.009 | 0.008 | -1.112 | 0.276 |
| D(Ln Inflation) | -0.018 | 0.011 | -1.684 | 0.104 |
| D(Ln REC) | 0.007 | 0.015 | 0.483 | 0.634 |
| D(Ln TI) | 0.009 | 0.004 | 2.597 | 0.015 |
| D(Ln UP) | 2.260 | 7.597 | 0.297 | 0.769 |
| ECT(-1) | -0.555 | 0.188 | -2.960 | 0.007 |
4.5. Robustness Checks of the Model
4.5.1. Residual Diagnostics
To validate the reliability of the estimated ARDL–ECM model, a set of standard post-estimation diagnostic tests was conducted to assess serial correlation, heteroskedasticity, and residual normality. The diagnostic tests in Table 5 indicate that the estimated model is generally well-behaved. First, the Breusch–Godfrey LM test for serial correlation (up to 2 lags) reports Prob. F = 0.1427 and Prob. Chi-square = 0.0612, so the null of no serial correlation is not rejected at the 5% level (although the Chi-square version is borderline at 10%, suggesting at most weak evidence of autocorrelation). Second, the Breusch–Pagan–Godfrey heteroskedasticity test yields Prob. F = 0.4575, Prob. Chi-square = 0.4034, and Prob. Chi-square (Scaled explained SS) = 0.7112, meaning the null of homoskedasticity is clearly not rejected, so the residual variance appears constant. Third, the residual normality test (Jarque–Bera) shows JB = 3.838 with p = 0.1467, implying the residuals are approximately normally distributed (despite mild right-skewness and slightly high kurtosis), which supports the reliability of standard inference in the model. Overall, the diagnostic checks indicate that the model is statistically adequate, with no evidence of heteroskedasticity or non-normal residuals and only weak and/or borderline signs of serial correlation.
4.5.2. Stability Diagnostics
To evaluate the adequacy of the functional form specification, the study conducted the Ramsey RESET test incorporating higher-order polynomial terms (powers of fitted values from 2 to 3). Based on Table 6, both the F-statistic (0.062, p = 0.9414) and the likelihood ratio test (1.932, p = 0.3806) fail to reject the null hypothesis of correct specification at any conventional significance level, providing strong evidence that the linear specification of the model adequately captures the relationship between industrial competitiveness and its macroeconomic and institutional determinants without requiring additional nonlinear terms. The F-test summary shows that the addition of squared and cubic polynomial terms yields only a marginal improvement in model fit, with the test sum of squared residuals of 0.000271 representing a negligible difference between the restricted and unrestricted models. Similarly, the likelihood ratio test reveals that the restricted and unrestricted log-likelihood values differ by only approximately 0.966, further confirming the absence of significant functional form misspecification. These results provide strong reassurance regarding the validity of the model’s structural assumptions and support the use of the baseline linear specification for econometric inference and policy analysis.
5. Discussion
This study set out to explain industrial competitiveness (proxied by manufacturing value added) dynamics in Saudi Arabia using annual data (1990–2024) and an ARDL–ECM framework, which is appropriate given the mix of I(0) and I(1) regressors and the need to disentangle long-run equilibrium linkages from short-run adjustments.
The ARDL bounds results indicate that Saudi industrial competitiveness (proxied by manufacturing value added) is tied to a long-run equilibrium with the selected energy, innovation, and macro-structural drivers. In the short run, the error-correction term is negative and statistically significant (ECT = −0.555, p = 0.007), implying that deviations from the long-run path are corrected relatively quickly, about 55.5% of the disequilibrium adjusts within one year. This adjustment behavior is consistent with the idea that competitiveness dynamics are “sticky” but mean-reverting, where shocks do not permanently displace industrial performance and policy-relevant equilibrium relationships reassert themselves over time.
A key finding is that technological innovation (patents) is the only short-run driver that is statistically significant (ΔLnTI = 0.009, p = 0.015). This aligns with recent firm-level and productivity evidence suggesting that patenting activity is closely associated with improved performance outcomes and forward-looking investment behavior. For example, first-time patenting is linked to sustained improvements in firm outcomes and R&D trajectories, indicating that patenting often reflects a deeper innovation strategy rather than a one-off signal [47]. Likewise, productivity gains are documented among firms patenting in Fourth Industrial Revolution technologies, reinforcing the view that innovation outputs can translate into measurable performance advantages [20].
By contrast, energy use is not statistically significant in the short run (ΔLnEU not significant). One plausible interpretation is that energy’s role in competitiveness operates more through cost structure and efficiency channels than through immediate output responses. International policy evidence emphasizes that energy efficiency improvements can strengthen competitiveness by lowering costs, reducing risk exposure, and improving productivity, effects that may materialize gradually rather than within a single-period adjustment window [14]. Moreover, competitiveness impacts are often mediated by energy price shocks and pass-through, where the same energy input can have different implications depending on price regimes and industrial structure [48,49]. In this sense, the insignificance of short-run energy-use changes does not negate energy’s importance; rather, it suggests that energy-related competitiveness gains may be realized via longer-run reallocation, efficiency upgrades, and pricing/institutional conditions, not immediate quantity changes.
Similarly, renewable energy consumption (REC) is not significant in the short-run ECM. This finding diverges from Saudi-focused ARDL evidence in the environmental/industrial nexus, where renewables are shown to matter in long-run relationships (even when short-run effects are weaker or context-dependent) [24]. A likely explanation is transition timing, and implementation lags: renewable capacity additions, grid integration, industrial electrification readiness, and complementary flexibility measures may take time before they translate into industrial competitiveness outcomes. This “policy-and-diffusion lag” interpretation is consistent with recent energy policy research showing that diffusion and operational flexibility policies may evolve in parallel and do not always translate immediately into near-term performance shifts [50].
The Saudi policy context also supports a lagged interpretation. National programs indicate an accelerating push to scale renewables, while official statistics report substantial renewable capacity levels by end-2024, signalling rapid progress but also implying a transition still underway [8,51]. During such transition phases, renewables can improve sustainability and risk hedging (longer-run), yet short-run industrial competitiveness may depend more on innovation uptake and on the pace of industrial retrofits, electrification, and system flexibility.
Macroeconomic controls (ΔLnGDP and ΔLnInflation) are also insignificant in the short run, although inflation is negative with borderline significance (ΔLnInflation = −0.018, p = 0.104). This pattern is consistent with the notion that macroeconomic uncertainty harms investment and performance primarily through expectations, financing conditions, and risk premia, channels that may be intermittent and more visible over longer horizons than in short-run differenced terms. Recent evidence highlights that inflation uncertainty can carry meaningful economic costs, even if its short-run effects vary by context and identification approach [52].
Finally, urbanization (UP) is not significant in the short-run. This does not contradict the broader literature: recent meta-analytic evidence finds that agglomeration economies exist but vary substantially by setting and are sensitive to congestion, housing/infrastructure constraints, and the quality of urban management [53]. For developing and transitioning economies, the World Bank also emphasizes that urban productivity gains require complementary infrastructure and institutions to avoid congestion and informality traps [54]. In Saudi Arabia, where planned industrial clusters and infrastructure investment are central, urbanization’s competitiveness effect may be indirect (via logistics, skills, and clustering quality) rather than immediately reflected in short-run changes in the urban share.
these results point to a clear hierarchy in short-run drivers: innovation shocks matter now, while energy and renewables likely matter through slower, system-level channels. This supports an “ecosystem” view of competitiveness policy, where innovation outputs (patents), industrial capabilities, infrastructure, energy efficiency, and transition readiness must be coordinated to translate factor inputs into sustained industrial upgrading [55]. It also aligns with Saudi Arabia’s ongoing industrial transformation agenda that emphasizes technology, localization of advanced industries, and ecosystem build-out to raise global competitiveness [42].
6. Conclusion and Policy Recommendations
6.1. Conclusion
This study examined the determinants of Saudi industrial competitiveness, proxied by manufacturing value added (% of GDP), using annual time-series data for 1990–2024 and an ARDL–ECM framework.
The ARDL bounds test provides evidence of a long-run (cointegrating) relationship among manufacturing value added and its drivers at conventional significance levels (5–10%), although cointegration is not confirmed under more stringent critical values (1–2.5%). In the short run, the ECM results show that most regressors are statistically insignificant, while technological innovation (patent applications) is the only clearly significant short-run driver of industrial competitiveness.
Importantly, the error-correction term is negative and significant (ECT(−1)=−0.555; p≈0.007), indicating a relatively fast adjustment process in which about 55.5% of disequilibrium is corrected each year.
Hence, the evidence implies that innovation capability is the most immediate competitiveness lever, while the effects of energy use and renewable penetration may be indirect, delayed, or mediated by efficiency, pricing, and industrial electrification readiness rather than appearing as short-run quantity effects within this specification.
6.2. Policy Recommendations
The results support a policy logic consistent with Saudi Arabia’s National Industrial Strategy (NIS) and the broader Vision 2030 transformation agenda, where competitiveness gains rely on capability upgrading, technology diffusion, and industrial ecosystem strengthening. Saudi Vision 2030 The following recommendations are prioritized based on what the ARDL–ECM indicates matters most in the short run (innovation) and what likely matters through longer-run channels (energy transition and macro-stability).
- (1)
- Make innovation “manufacturing-relevant”: move from patenting to diffusion and commercialization. Because innovation (patents) is the only significant short-run driver, policy should focus on raising the conversion rate from innovation outputs into factory-level productivity, quality upgrading, and export readiness. Practically, this means:
- ∙
- Commercialization pipelines: expand programs that link universities/research centers with manufacturers (contract R&D, proof-of-concept funding, licensing support, prototyping facilities) so patenting becomes a usable process/product upgrade.
- ∙
- Technology diffusion for SMEs: scale “extension-style” support for SMEs (diagnostics, lean/automation audits, adoption grants for Industry 4.0 tools), since diffusion typically generates broader competitiveness effects than frontier R&D alone.
- ∙
- Cluster-based innovation: target patents toward priority value chains (e.g., chemicals, downstream energy-intensive manufacturing, machinery, pharma/biotech, advanced materials), using industrial clusters and supplier-development programs aligned with NIS upgrading objectives.
Suggested KPI set (annual): patents-to-licenses ratio; share of patents co-owned with industry; number of firms adopting targeted advanced manufacturing technologies; manufacturing TFP proxy (where available).
- (2)
- Reframe energy policy around “energy productivity” and industrial efficiency
The insignificance of short-run energy-use changes suggests that more energy consumption does not automatically translate into stronger industrial competitiveness; what matters is producing more value per unit of energy. This aligns with IEA evidence that energy efficiency improves competitiveness by reducing costs and improving operations and product value. Recommended actions:
Industrial energy-efficiency acceleration (audits, performance standards, process optimization, motors/boilers upgrades, waste-heat recovery), prioritized in energy-intensive subsectors.
Energy management systems (ISO 50001) incentives for large plants and strategic suppliers (financing support, recognition, procurement preferences).
Competitiveness-oriented tariff and contracting design that rewards verified efficiency and load flexibility (where feasible), rather than encouraging higher energy throughput.
Connect renewables to industry through electrification readiness and reliable procurement channels. Renewable energy consumption is insignificant in the short run, which is consistent with a transition reality: renewables affect competitiveness when they are reliably accessible to industrial users, integrated into the grid, and paired with flexibility and electrification investments. Saudi Arabia’s renewable energy program explicitly aims to increase renewables’ share in the energy mix under Vision 2030. Recommended actions:
Industrial renewable procurement: expand bankable structures (e.g., long-term offtake/PPAs, green tariffs) that allow manufacturers to lock in predictable electricity costs and decarbonize products for export markets.
Electrification investments: support retrofits for heat and process electrification where economically viable; pair with storage/flexibility solutions to protect reliability and cost stability.
Green industrial zones: pilot zones where renewables supply, grid upgrades, energy efficiency services, and innovation support are bundled, turning “renewables deployment” into measurable competitiveness outcomes.
Protect competitiveness by anchoring macro-stability and industrial planning certainty. Inflation is negative and marginally significant, suggesting that price instability can weaken competitiveness, likely through uncertainty, costs, and planning horizons. While GDP growth and urbanization are insignificant in the short run, stable macro conditions still matter as “enablers” for investment and technology upgrading. Policy priorities include:
maintaining predictable industrial financing conditions for upgrading investments;
reinforcing policy credibility and consistency for multi-year manufacturing transformation programs;
improving the “coordination layer” across industrial, energy, skills, and innovation agencies to reduce implementation frictions (critical when adjustment is fast, as the ECT suggests).
6.3. Implementation Priorities by Time Horizon
- Short term (1–2 years): scale diffusion and commercialization tools (industry–academia pipelines, SME technology adoption support); launch industrial efficiency accelerators tied to verified savings.
- Medium term (3–5 years): expand industrial renewable procurement channels; pilot green industrial zones; deepen cluster/supplier upgrading aligned with NIS priority value chains.
- Long term (to 2030): integrate innovation, renewables, and efficiency into a single competitiveness architecture—measured by manufacturing value creation, export sophistication, and energy productivity.
6.4. Limitations and Future Research Directions
Three limitations should be acknowledged.
- (1)
- The bounds-test evidence is strongest at 5–10%, suggesting sensitivity to specification, sample size (35 observations), and potential structural changes across 1990–2024.
- (2)
- Economy-wide energy-use and renewable-share indicators may not capture the industrial energy price/reliability and sectoral electrification mechanisms most relevant for competitiveness.
- (3)
- Patent counts proxy innovation output but do not directly measure diffusion quality or the share of patents implemented in production.
Future research could therefore:
- Test structural breaks and alternative lag structures;
- Use sectoral manufacturing data (by subsector) and industrial electricity indicators;
- replace total patents with “manufacturing/green patents” or innovation-quality measures; and
- Examine interaction terms (e.g., innovation and renewables, innovation and efficiency) to capture complementarity effects that may be central to industrial upgrading.
Funding
This research received no external funding.
Data Availability Statement
The data presented in this study are available on request from the author due to privacy, legal, and ethical issues.
Conflicts of Interest
The authors declare there are no conflicts of interest.
References
- UNIDO. (2023). Industrial Development Report 2024: Turning Challenges into Sustainable Solutions—The New Era of Industrial Policy (Overview). Vienna: UNIDO. unido.org/sites/default/files/unido-publications/2024-06/Industrial Development Report 2024.pdf.
- Correa, T., & Todorov, V. (2021). Competitive Industrial Performance Report 2020: Industrializing in the digital age. UNIDO. https://stat.unido.org/sites/default/files/2023-01/CIP-2020-full.pdf.
- Anouze, A. L.; Lu, C.; Emrouznejad, A. Redefining competitive industrial performance indicator: A multiplicative data envelopment analysis approach . Journal of the Operational Research Society 2025. [Google Scholar] [CrossRef]
- Cantore, N., & Cheng, C. F. C. (2021). The Inclusive and Sustainable Competitive Industrial Performance Index (ISCIP) (Working Paper 5/2021). UNIDO. https://unido-gc.org/Publications/The%20extended%20inclusive%20and%20sustainable%20index.pdf.
- Cheng, C. F. C.; Yuan, Q.; Hua, C.; Xu, Y.; Cantore, N.; Wang, K. Global Inclusive and Sustainable Competitive Industrial Performance (ISCIP): An efficiency based spatio-temporal analysis for 139 countries . Applied Energy 2023, 333, 120603. [Google Scholar] [CrossRef]
- World Bank. (2025). Manufacturing, value added (% of GDP) (NV.IND.MANF.ZS). World Development Indicators. https://data.worldbank.org/indicator/NV.IND.MANF.ZS?utm_source=chatgpt.com.
- IRENA. (2024). Renewable Power Generation Costs in 2023. https://www.irena.org/Publications/2024/Sep/Renewable-Power-Generation-Costs-in-2023.
- Ministry of Energy (Saudi Arabia). (2025). Renewable Energy (National Renewable Energy Program). https://www.moenergy.gov.sa/en/eco-system/programs/renewable-energy.
- Pavlík, M.; Kurimský, F.; Ševc, K. Renewable Energy and Price Stability: An Analysis of Volatility and Market Shifts in the European Electricity Sector (2015–2025). Applied Sciences (2076-3417) 2025, 15(12). [Google Scholar] [CrossRef]
- Das, K. C., & Mahalik, M. K. (2023). Renewable energy use and export performance of manufacturing firms: Panel evidence from six industries in India. Energy Economics, 125, 106894. [CrossRef]
- Nouira, R.; Salem, L. B.; Saafi, S.; Rault, C. Renewable energy consumption and international trade: Does climate policy stringency matter? Energy Policy 2025, 206, 114728. [Google Scholar] [CrossRef]
- IEA. (2025). Gaining an Edge: Energy demand and competitiveness. International Energy Agency. https://www.iea.org/reports/gaining-an-edge/energy-demand-and-competitiveness.
- Dechezleprêtre, A., Dernis, H., Díaz, L., Lalanne, G., Romaniega Sancho, S., & Samek, L. (2025). A comprehensive overview of the Energy Intensive Industries ecosystem. OECD STI Working Papers 2025/09. [CrossRef]
- IEA. (2025). Competitiveness (Energy efficiency benefits). International Energy Agency. https://www.iea.org/reports/energy-efficiency-2025.
- Romero-Jordán, D.; del Río, P.; Pinto, F. Does energy productivity boost total factor productivity? Energy Policy 2025, 206, 114766. [Google Scholar] [CrossRef]
- Anyanwu, O. C. (2024). Impact of Energy Consumption on Industrial Sector Performance in 32 Sub-Saharan African countries (2002–2019). SAGE Open. [CrossRef]
- Aterido, R., Iootty, M., & Melecky, M. (2025). Energy Prices, Energy Intensity, and Firm Performance. World Bank Policy Research Working Paper 11069. [CrossRef]
- Norvaiša, E.; et al. Energy intensity forecasting models for manufacturing industries of “catching up” economies: Lithuanian case. Energies 2024, 17(12), 2860. [Google Scholar] [CrossRef]
- World Bank. (2025). WDI Metadata Glossary: Patent applications, nonresidents (IP.PAT.NRES). [CrossRef]
- Calvino, F., Dechezleprêtre, A., De Lyon, J., Dernis, H., & Vítková, A. (2025). Productivity among firms patenting in fourth industrial revolution technologies: A focus on Canadian firms (OECD STI Working Paper 2025/18). [CrossRef]
- Guzmán, A. (2025). Dynamics of R&D efforts, patents, exports and economic growth… (ARDL evidence on resident/nonresident patents and high-tech exports). [CrossRef]
- Zhu, Z.; Li, H. Technological catch-up: A new measure and patent-based evidence from China’s manufacturing industries. Research Policy 2025, 54(8), 105299. [Google Scholar] [CrossRef]
- OECD. (2025). Measuring Science and Innovation for Sustainable Growth (discussion of limitations of patents as innovation output indicators and ways to address them). [CrossRef]
- Mohammed, M. G. A.; Abdel-Gadir, S. E. M.; Alsulami, F.; Mannai, S.; Arfaoui, L.; Alharbi, K.; Qassim, A. A.; Alsafy, M. M. Exploring the effects of renewable energy, energy consumption, and industrial growth on Saudi Arabia’s environmental footprint: An autoregressive distributed lag analysis. Energies 2024, 17(24), 6327. [Google Scholar] [CrossRef]
- Abd El-Aal, M. F.; Shrahili, M.; Kayid, M.; Mohammad, S. GDP growth drivers in Saudi Arabia based on machine learning algorithms . Journal of Radiation Research and Applied Sciences 2025, 18(2), 101380. [Google Scholar] [CrossRef]
- Stamm, K., & Vorisek, D. (2023). The Global Investment Slowdown: Challenges and Policies (Policy Research Working Paper 10364). World Bank. [CrossRef]
- IMF. (2024). High Uncertainty and the Unknown (IMF Annual Report 2024, In Focus). https://www.imf.org/external/pubs/ft/ar/2024/in-focus/high-uncertainty-and-the-unknown/.
- Mohammed, M. G. A. Analyzing GDP Growth Drivers in Saudi Arabia: Investment or Consumption: An Evidence-Based ARDL-Bound Test Approach . Sustainability 2024, 16(9), 3786. [Google Scholar] [CrossRef]
- Kripfganz, S.; Schneider, D. C. ardl: Estimating autoregressive distributed lag and equilibrium correction models . Stata Journal 2023, 23(4), 983–1019. [Google Scholar] [CrossRef]
- Stewart, C. Demonstrating that the Autoregressive Distributed Lag Bounds Test Can Detect a Long-Run Levels Relationship When the Dependent Variable Is I(0) . Econometrics 2025, 13(4), 39. [Google Scholar] [CrossRef]
- Wan, J.; Wang, Q.; Miao, S. The impact of urbanization on industrial transformation and upgrading: Evidence from early 20th century China. Sustainability 2024, 16(11), 4720. [Google Scholar] [CrossRef]
- Xiao, W.; Ji, C.; Shao, Q.; Zhang, S. Does population agglomeration of urban clusters boost total factor productivity of enterprises? PLOS ONE 2025, 20(6), e0325703. [Google Scholar] [CrossRef] [PubMed]
- Maket, I., Szakálné Kanó, I., & Vas, Z. (2024). Urban agglomeration and regional economic performance connectedness: Thin ice in developing regions. Research in Globalization, 8, 100211. [CrossRef]
- Granda, D.; Mateo-Peinado, L.; Obaco, M.; Urrutia-Mosquera, J. Housing Deprivation in Rapidly Urbanizing Regions: Evidence from Functional Urban Areas in Sub-Saharan Africa, South Asia, and Southeast Asia. Global Challenges & Regional Science 2025, 100021. [Google Scholar] [CrossRef]
- Hou, C. Analysis of the factors promoting urban green productivity using a system dynamics simulation. Scientific Reports 2025, 15(1), 27928. [Google Scholar] [CrossRef]
- Du, C.; Cao, Y.; Ling, Y.; Jin, Z.; Wang, S.; Wang, D. Does manufacturing agglomeration promote green productivity growth in China? Energy Economics 131 2024, 107352. [Google Scholar] [CrossRef]
- Binder, C.; Ozturk, E.; Sheng, X. S. The effects of inflation uncertainty on firms and the macroeconomy . Journal of International Money and Finance 2025, 151, 103239. [Google Scholar] [CrossRef]
- Brandao-Marques, L., Meeks, R., & Nguyen, V. (2024). Monetary policy with uncertain inflation persistence (IMF Working Paper WP/24/47). International Monetary Fund. [CrossRef]
- Yotzov, I., Bloom, N., Bunn, P., Mizen, P., & Thwaites, G. (2024). The speed of firm response to inflation (Bank of England Staff Working Paper; updated version). Bank of England. [CrossRef]
- Cevik, S., Fan, A., & Naik, S. (2024). Is inflation good for business? The firm-level impact of inflation shocks in the Baltics, 1997–2021 (IMF Working Paper 2024/043). International Monetary Fund. [CrossRef]
- Bambe, B.-W.-W.; Combes, J.-L.; Kaba, K.; Minea, A. Inflation targeting and firm performance in developing countries . Journal of Economic Dynamics and Control 2024, 163, 104854. [Google Scholar] [CrossRef]
- Ministry of Industry and Mineral Resources. (2025). Kingdom’s industrial transformation driven by Vision 2030. https://www.mim.gov.sa/en/media-center/news/industrial-transformation-kingdom-vision-2030-advanced-infrastructure.
- Strategic Gears. (2022). Saudi Arabia’s National Strategy for Industry: Evolving Ecosystem & Future Opportunities (report). https://engine.strategicgears.com/files/Saudi_Arabias_National_Strategy_for_Industry_EN.pdf.
- Derouez, F. Energy, technology, and economic growth in Saudi Arabia: An ARDL and VECM analysis approach . Heliyon 2024, 10, e26033. [Google Scholar] [CrossRef]
- Al Shammre, A.; et al. Investigating the Impact of Energy Consumption and Economic Activities on CO2 Emissions from Transport in Saudi Arabia . Energies 2024, 17(17), 4448. [Google Scholar] [CrossRef]
- Alsulamy, N.; Shoukat, A.; Elgammal, I. Business Strategies for Managing Non-Renewable Energy Dynamics in Saudi Arabia’s Manufacturing Sector . Sustainability 2025, 17(10), 4331. [Google Scholar] [CrossRef]
- Nilsen, Ø. A.; Raknerud, A. Dynamics of first-time patenting firms. Research Policy 2024, 53(8), 105054. [Google Scholar] [CrossRef]
- European Central Bank. (2023). The energy shock, price competitiveness and euro area export performance. European Central Bank. https://www.ecb.europa.eu/press/economic-bulletin/focus/2023/html/ecb.ebbox202303_03~23c48fe595.en.html.
- Reinstaller, A., & Sellner, R. (2024). Industrial energy prices and the competitiveness of the Austrian business sector.
- Mellot, A.; Moretti, C.; Nuñez-Jimenez, A.; Linder, J.; Moro, N.; Powell, S.; Markard, J.; Winzer, C.; Patt, A. Electrification, flexibility or both? Emerging trends in European energy policy. Energy Policy 206 2025, 114725. [Google Scholar] [CrossRef]
- General Authority for Statistics (GASTAT). (2024). Renewable energy statistics 2024. Kingdom of Saudi Arabia. https://www.stats.gov.sa/en/home.
- Ha, J., & So, I. (2023). The Economic Effects of Global Inflation Uncertainty. Available at SSRN 4353155.
- Donovan, S.; de Graaff, T.; de Groot, H. L.; Koopmans, C. C. Unraveling urban advantages—A meta-analysis of agglomeration economies. Journal of Economic Surveys 2024, 38(1), 168–200. [Google Scholar] [CrossRef]
- Grover, A., Lall, S. V., & Timmis, J. (2021). Agglomeration economies in developing countries: A meta-analysis (Policy Research Working Paper No. 9730). [CrossRef]
- OECD. (2025). OECD Science, Technology and Innovation Outlook 2025: Driving change in a shifting landscape (Chapter: “An ecosystems approach to industrial policy”). OECD Publishing. [CrossRef]
Table 2.
Unit-root test results.
| Variable | Level t-Statistic | Level Prob.* |
First Difference t-Statistic |
First Difference Prob.* |
Orderof Cointegration |
| Ln MVA | -0.345 | 0.908 | -5.386 | 0.000 | I(1) |
| Ln EU | -2.129 | 0.235 | -5.763 | 0.000 | I(1) |
| Ln GDP | -4.867 | 0.000 | I(0) | ||
| Ln Inflation | -3.110 | 0.035 | I(0) | ||
| Ln REC | -0.044 | 0.948 | -5.141 | 0.000 | I(1) |
| Ln TI | -3.670 | 0.009 | I(0) | ||
| Ln UP | -0.346 | 0.907 | -5.831 | 0.000 | I(1) |
*MacKinnon (1996) one-sided p-values.
Table 3.
F-Bounds test results.
| Test Statistic | Value | Signif | I(0) | I(1) |
| Asymptotic n=1000 | ||||
| F-statistic | 3.359315 | 10% | 1.99 | 2.94 |
| k | 6 | 5% | 2.27 | 3.28 |
| 2.5% | 2.55 | 3.61 | ||
| 1% | 2.88 | 3.99 | ||
Table 5.
Residual diagnostics test results.
| Statistic | Heteroskedasticity Test | Serial Correlation LM Test | Normality | |||
| Value | Prob. | Value | Prob. | Jarque-Bera | Prob. | |
| F-statistic | 1.014 | Prob. F(9,23) = 0.4575 | 2.140 | Prob. F(2,21) = 0.1427 | 3.838 | 0.147 |
| Obs*R-squared | 9.375 | Prob. Chi-Square(9) = 0.4034 | 5.586 | Prob. Chi-Square(2) = 0.0612 | ||
| Scaled explained | 6.284 | Prob. Chi-Square(9) = 0.7112 | ||||
Table 6.
Ramsey RESET Test.
| Statistic | Value | df | Probability |
| F-statistic | 0.062241 | (2, 2) | 0.9414 |
| Likelihood ratio | 1.932180 | 2 | 0.3806 |
| F-test summary | |||
| Sum of Sq. | df | Mean Squares | |
| Test SSR | 0.000271 | 2 | 0.000135 |
| Restricted SSR | 0.004622 | 4 | 0.001156 |
| Unrestricted SSR | 0.004351 | 2 | 0.002176 |
Disclaimer/Publisher’s Note: The statements, opinions and data contained in all publications are solely those of the individual author(s) and contributor(s) and not of MDPI and/or the editor(s). MDPI and/or the editor(s) disclaim responsibility for any injury to people or property resulting from any ideas, methods, instructions or products referred to in the content. |
© 2026 by the authors. Licensee MDPI, Basel, Switzerland. This article is an open access article distributed under the terms and conditions of the Creative Commons Attribution (CC BY) license (http://creativecommons.org/licenses/by/4.0/).
Copyright: This open access article is published under a Creative Commons CC BY 4.0 license, which permit the free download, distribution, and reuse, provided that the author and preprint are cited in any reuse.


