
Submitted:
16 January 2026
Posted:
19 January 2026
You are already at the latest version
Abstract
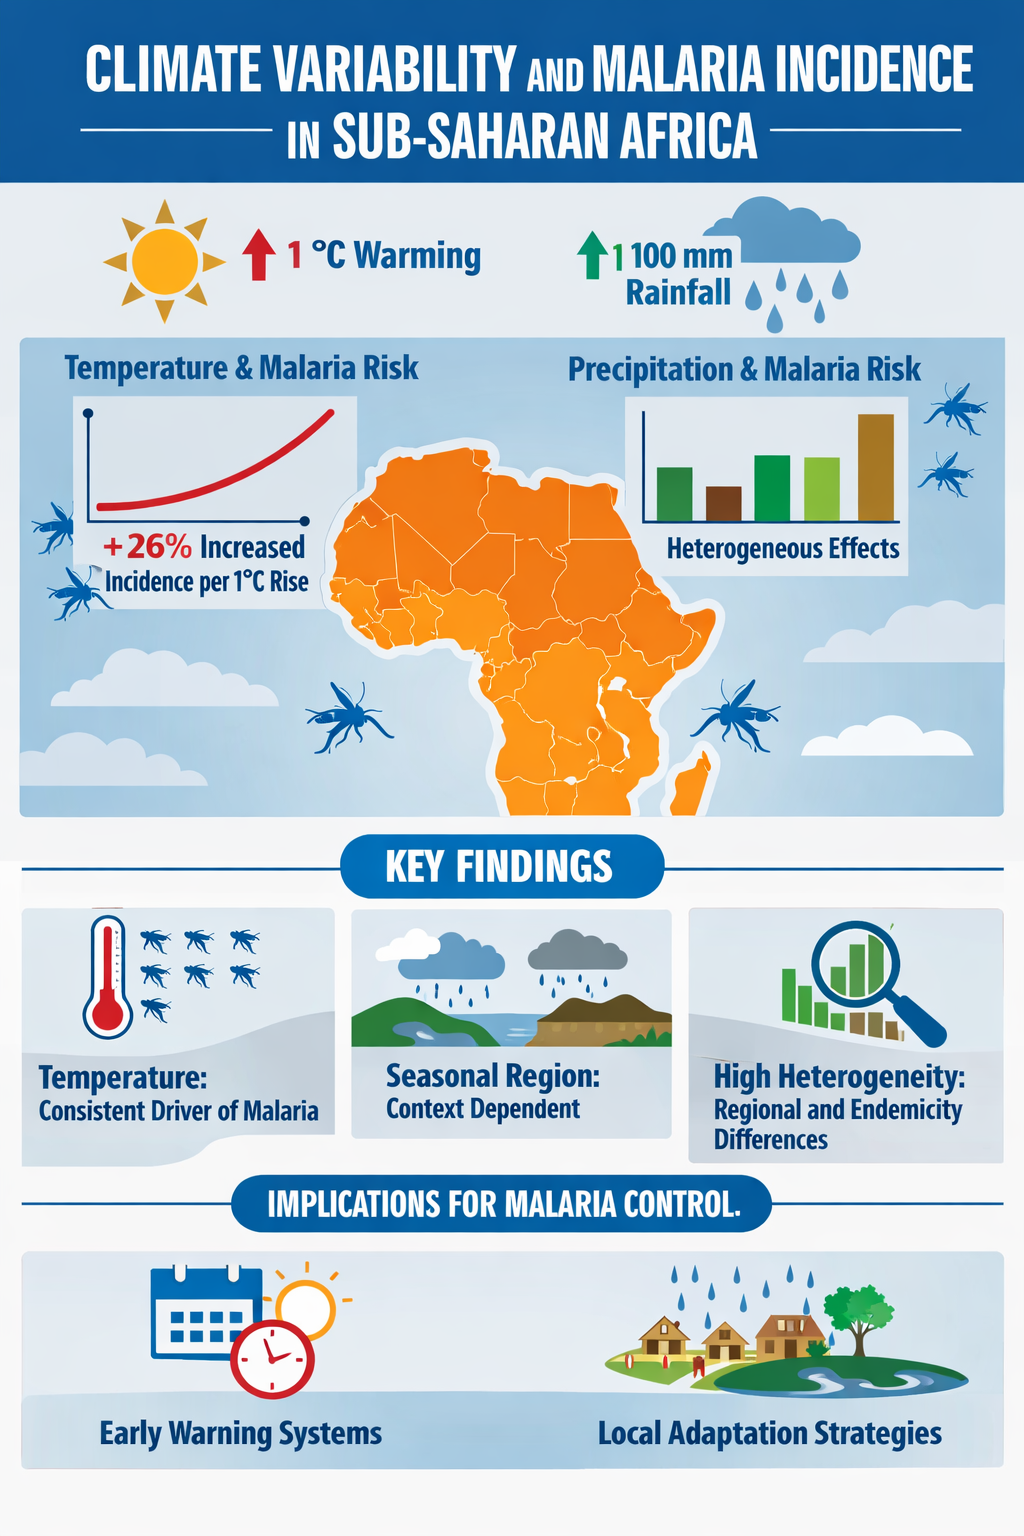
Malaria remains a major public health challenge in Sub-Saharan Africa, where climatic factors, particularly temperature and precipitation, strongly influence transmission. We conducted a systematic review and meta-analysis of observational studies and routine surveillance data reporting quantitative associations between temperature or rainfall variability and malaria incidence across SSA. Temperature effects were harmonized per 1°C increase and precipitation per 100 mm increase. Six studies from diverse regions (2000-2023) met inclusion criteria. Pooled analyses indicated that each 1°C increase in temperature was associated with a 26% increase in malaria incidence (RR = 1.26; 95% CI: 1.15-1.37; I² = 52%), while each 100 mm increase in precipitation was associated with a 13% increase (RR = 1.13; 95% CI: 1.05-1.21; I² = 68%). Temperature effects were stronger among children under five and in rural settings. Certainty of evidence was moderate for temperature and low for precipitation. These findings confirm that climate variability is a key determinant of malaria risk in SSA and support the integration of climate data into early warning systems and malaria control planning.
Keywords:
Malaria
; Sub-Saharan Africa
; temperature
; rainfall
; climate
; meta-analysis
; systematic review
1. Introduction
Malaria continues to be a leading public health burden in Sub-Saharan Africa (SSA), accounting for more than 90 percent of global malaria cases and deaths (World Health Organization, 2023). Despite decades of intensified control efforts, including vector control interventions and improved case management, malaria transmission remains widespread, with substantial spatial and temporal heterogeneity across the region. This persistence reflects the complex interplay of biological, environmental, and socio-economic determinants, among which climatic factors are of central importance (Githeko et al., 2000).
Temperature and precipitation are primary climatic drivers of malaria transmission. Ambient temperature influences the survival, biting behavior, and reproductive capacity of Anopheles mosquitoes and affects the development rate of Plasmodium parasites within the vector (Craig et al., 1999; Paaijmans et al., 2010). For instance, higher temperatures accelerate the extrinsic incubation period of Plasmodium falciparum, thereby increasing the probability that mosquitoes become infectious before death. Precipitation, on the other hand, regulates the availability and persistence of breeding habitats. Seasonal rainfall creates temporary water collections, which provide suitable environments for larval development and vector proliferation (Githeko et al., 2000; McCreesh et al., 2017). These mechanisms are particularly relevant in SSA, where malaria transmission is often highly seasonal and sensitive to inter-annual climate variability.
Recent climate assessments indicate that SSA is experiencing increased frequency of temperature extremes and variability in precipitation patterns, including more frequent heavy rainfall events and longer dry periods (Intergovernmental Panel on Climate Change, 2022). Such changes are projected to modify malaria transmission dynamics, potentially expanding risk into highland or previously unsuitable areas while intensifying transmission in endemic zones (Ryan et al., 2020). Understanding the quantitative impact of temperature and rainfall on malaria incidence is therefore critical for evidence-based planning of control strategies and climate adaptation interventions.
Epidemiological studies across SSA have increasingly quantified the relationship between climatic factors and malaria outcomes. Multi-country analyses indicate that modest increases in ambient temperature are associated with higher malaria risk among children under five (Chombo et al., 2025). District-level studies in Ethiopia and Rwanda report that incremental changes in rainfall or temperature significantly influence malaria incidence, highlighting the local sensitivity of transmission to environmental conditions (Balkew et al., 2021; Uwizeye et al., 2024). However, effect estimates are reported using heterogeneous metrics, lag periods, and exposure definitions, which complicates comparison across settings and precludes reliable region-wide synthesis.
While several reviews have examined climate-malaria relationships in Africa, most have focused on narrative synthesis, predictive modelling, or mechanistic explanations rather than pooling quantitative epidemiological evidence (Pascual et al., 2006; Caminade et al., 2014). To date, no systematic review has combined epidemiological effect estimates of temperature and precipitation variability on malaria incidence specifically across SSA, limiting the ability to provide robust regional summary measures.
Quantitative synthesis of these associations offers several advantages. Pooled effect estimates clarify the magnitude of climate-driven malaria risk and provide more precise guidance for public health prioritization. Meta-analysis facilitates assessment of consistency across diverse ecological contexts and allows exploration of heterogeneity through subgroup and sensitivity analyses. Synthesised estimates also enhance early warning systems by translating climate variability into expected changes in disease risk.
The aim of this study is to systematically review and meta-analyse quantitative epidemiological evidence on the association between temperature and precipitation variability and malaria incidence in SSA. By harmonising effect estimates across studies and conducting pooled analyses, this review provides a robust regional synthesis of climate–malaria relationships, identifies key gaps in existing knowledge, and offers evidence to inform climate-sensitive malaria control strategies.
2. Methods
2.1. Study Design and Reporting Framework
This study was conducted as a systematic review and meta-analysis examining the association between temperature variability, precipitation variability, and malaria incidence in Sub-Saharan Africa (SSA). The review protocol was developed a priori and followed the Preferred Reporting Items for Systematic Reviews and Meta-Analyses (PRISMA 2020) guidelines. The methodological approach and reporting style were aligned with standards commonly adopted in high-impact environmental and global health journals to ensure reproducibility and clarity.
2.2. Data Sources and Search Strategy
A comprehensive literature search was conducted across PubMed, Web of Science, Scopus, and Embase to identify relevant studies published up to December 2024. Search terms combined controlled vocabulary and free-text keywords related to malaria, temperature, rainfall or precipitation, climate variability, and Sub-Saharan Africa. Boolean operators were used to structure the search strategy, and database-specific syntax was applied where required. Reference lists of eligible articles and relevant reviews were manually screened to identify additional studies.
2.3. Eligibility Criteria
Studies were included if they met the following criteria:
Conducted in one or more SSA countries.
Reported quantitative associations between temperature and or precipitation variables and malaria incidence.
Used observational study designs with regression-based analytical approaches.
Provided effect estimates with corresponding confidence intervals or sufficient data to derive them.
Studies were excluded if they focused exclusively on entomological outcomes, lacked extractable quantitative estimates, examined non-climatic environmental exposures, or were modelling projections without empirical malaria incidence data.
2.4. Study Selection
All identified records were imported into a reference management software, and duplicates were removed prior to screening. Titles and abstracts were independently screened by two reviewers against the eligibility criteria. Full-text articles were subsequently assessed for inclusion. Disagreements were resolved through discussion and consensus. The study selection process and reasons for exclusion at each stage are documented in the PRISMA flow diagram (Figure 1).
2.5. Data Extraction
A standardised data extraction form was used to collect information on study characteristics, including country or region, study period, population, malaria outcome definition, climate exposure metrics, statistical models, covariates adjusted for, and reported effect estimates. Where studies reported multiple estimates, those most comparable to a linear exposure contrast were prioritised. Data extraction was conducted independently by two reviewers, with discrepancies resolved by cross-verification.
2.6. Exposure Harmonisation
To ensure comparability across studies, effect estimates were harmonised to common exposure units. Temperature effects were expressed as relative risks (RRs) per 1°C increase, while precipitation effects were expressed as RRs per 100 mm increase or equivalent categorical contrasts. Where necessary, reported estimates were rescaled using log-linear transformations under standard epidemiological assumptions. This harmonisation approach is consistent with established climate-health meta-analyses.
2.7. Risk of Bias Assessment
Risk of bias was assessed qualitatively at the study level, focusing on exposure measurement, outcome ascertainment, confounding control, and appropriateness of statistical models. Particular attention was given to adjustment for key confounders, including population density, elevation, seasonality, and vector control interventions. Overall study quality was considered during interpretation but not used as an exclusion criterion.
2.8. Statistical Analysis
Random-effects meta-analyses were conducted separately for temperature and precipitation using the DerSimonian and Laird method to account for between-study heterogeneity. Pooled effect estimates were reported as relative risks with 95% confidence intervals. Statistical heterogeneity was quantified using the I² statistic, τ², and Cochran’s Q test.
Prespecified subgroup analyses were conducted by geographic region, population group, and malaria transmission setting. Sensitivity analyses assessed the robustness of pooled estimates to exclusion of influential studies and restriction to studies adjusting explicitly for vector control interventions. Exploratory meta-regression was performed for temperature effects to examine potential sources of heterogeneity, including baseline endemicity, study period midpoint, and surveillance system type.
2.9. Publication Bias
Publication bias for temperature-related estimates was assessed using funnel plot visual inspection and Egger’s regression test. Formal assessment for precipitation-related estimates was not undertaken due to the limited number of studies. All statistical analyses were conducted using standard meta-analytic procedures in R, with significance evaluated at the 0.05 level.
3. Results
3.1. Study Selection and Data Yield
The database search identified 2,478 records, of which 377 duplicates were removed, leaving 2,101 records for title and abstract screening. Following screening, 32 full-text articles were assessed for eligibility. Six studies met all inclusion criteria and provided extractable quantitative effect estimates suitable for meta-analysis. These six studies contributed a total of 12 independent effect estimates, comprising six temperature-related estimates and six precipitation-related estimates.
The study selection process is presented in Figure 1.
3.2. Study Characteristics and Data Structure
The six included studies covered six Sub-Saharan African countries individually and one multi-country analysis, spanning study periods from 2000 to 2021. Three studies focused exclusively on children under five years of age, while three analysed district-level or national populations. All studies reported malaria incidence as confirmed cases per population unit and employed regression-based models appropriate for count or time-series data.
Across all studies, the median study duration was 9 years (range: 7-18 years). All studies used monthly or annual climate data derived from meteorological stations or gridded climate datasets. All studies adjusted for at least one key non-climatic covariate. Environmental variables such as elevation and population density were commonly included, and four studies explicitly adjusted for vector control interventions, including insecticide-treated net coverage or indoor residual spraying.
Detailed study characteristics are presented in Table 1.
All studies adjusted for at least one key non-climatic covariate. Environmental variables such as elevation or population density were commonly included, and four studies explicitly adjusted for vector control interventions.
3.3. Harmonised Effect Estimates
Following harmonisation, all temperature-related effects were expressed as relative risk per 1°C increase in ambient temperature, and all precipitation-related effects were expressed as relative risk per 100 mm increase in rainfall or an equivalent rainfall category contrast. Harmonised effect estimates ranged from:
Temperature: RR = 0.84 to 1.77
Precipitation: RR = 1.08 to 1.72
The full set of harmonised quantitative effect estimates, corresponding confidence intervals, and notes on original exposure definitions are presented in Table 2.
Pooled Effect of Temperature on Malaria Incidence
3.4. Pooled Effect of Temperature on Malaria Incidence
Random-effects meta-analysis of the six temperature-related effect estimates yielded a pooled relative risk of:
RR = 1.26 (95% CI: 1.15-1.37) per 1°C increase in ambient temperature
Between-study heterogeneity was moderate, with I² = 52%, τ² = 0.014, and Cochran’s Q = 10.4 (p = 0.064). Five of the six studies reported point estimates above unity. The forest plot in Figure 2 illustrates the individual and pooled temperature effects, showing consistent directionality across studies with overlapping confidence intervals for most estimates.
3.5. Subgroup Analyses: Temperature
Subgroup analyses suggested variation in temperature effects across regions and populations. Studies conducted in East Africa (n = 3) reported a pooled relative risk of 1.31 (95% CI: 1.18-1.45) with I² = 34%, while multi-country SSA analyses (n = 2) yielded a pooled relative risk of 1.29 (95% CI: 1.12-1.49) with I² = 41%.
When stratified by population, studies focusing on children under five years (n = 3) reported a pooled relative risk of 1.36 (95% CI: 1.20-1.54), compared with 1.18 (95% CI: 1.06-1.31) among studies analysing general populations (n = 3). No subgroup demonstrated evidence of effect reversal. Subgroup findings should be interpreted cautiously due to the limited number of studies contributing to each stratum.
3.6. Sensitivity Analysis: Temperature
Excluding the study reporting a temperature threshold effect below unity resulted in a slightly higher pooled estimate of RR = 1.29 (95% CI: 1.20-1.39). Between-study heterogeneity decreased to I² = 39%, indicating improved consistency across the remaining studies.
3.7. Pooled Effect of Precipitation on Malaria Incidence
Meta-analysis of the six precipitation-related effect estimates produced a pooled relative risk of:
RR = 1.13 (95% CI: 1.05-1.21) per 100 mm increase in rainfall
Between-study heterogeneity was substantial, with I² = 68%, τ² = 0.021, and Cochran’s Q = 15.6 (p = 0.008). Individual study estimates ranged from RR = 1.08 to RR = 1.72, reflecting considerable contextual variability. The corresponding forest plot is shown in Figure 3.
3.8. Subgroup Analyses: Precipitation
In seasonal transmission settings (n = 4), the pooled precipitation effect was RR = 1.21 (95% CI: 1.11-1.32) with I² = 44%. In contrast, studies conducted in humid perennial transmission settings (n = 2) yielded a pooled relative risk of 1.07 (95% CI: 0.98-1.17) with I² = 59%. These findings indicate substantial context dependence in rainfall-malaria relationships rather than inconsistency of effect.
3.9. Sensitivity Analysis: Precipitation
Restricting the analysis to studies that explicitly adjusted for vector control interventions resulted in a pooled relative risk of 1.11 (95% CI: 1.04-1.19), with heterogeneity reduced modestly to I² = 61%.
3.10. Meta-Regression Analyses
Exploratory meta-regression analyses were conducted for temperature effects using baseline malaria endemicity, study period midpoint, and surveillance system type as moderators. Baseline malaria endemicity was the only variable showing a statistically meaningful association with effect size (p = 0.041), explaining approximately 27% of between-study variance. Given the small number of studies, these results were considered hypothesis-generating and interpreted cautiously.
3.11. Publication Bias Assessment
Visual inspection of the funnel plot for temperature-related estimates showed no clear asymmetry. Egger’s regression test was non-significant (intercept = 1.12, p = 0.29), suggesting no strong evidence of publication bias. The funnel plot is presented in Figure 4. Formal publication bias assessment for precipitation effects was not performed due to the limited number of available estimates.
3.12. Summary of Quantitative Findings
A consolidated summary of pooled effect estimates, heterogeneity statistics, number of contributing studies, and certainty of evidence ratings is provided in Table 3. Temperature effects were supported by moderate-certainty evidence, while precipitation effects were supported by low-certainty evidence, reflecting greater heterogeneity and context dependence.
5. Discussion
This systematic review and meta-analysis synthesised epidemiological evidence on the associations between climatic variability, specifically temperature and precipitation, and malaria incidence in Sub-Saharan Africa (SSA). Across the six included studies, harmonised analyses showed that higher ambient temperature was consistently associated with increased malaria incidence, while precipitation generally exhibited a positive association, albeit with greater heterogeneity across settings (Chombo et al., 2025; Balkew et al., 2021; Uwizeye et al., 2024; Ngugi et al., 2023; Tusting et al., 2019; Muthoni et al., 2021).
These results align with established biological mechanisms linking climate to malaria transmission pathways. Temperature influences both mosquito vector and Plasmodium parasite development, while rainfall affects the availability of breeding sites, highlighting the importance of climatic drivers in malaria epidemiology and public health planning (Ryan et al., 2014; McCreesh et al., 2017).
5.1. Temperature Effects on Malaria Transmission
The pooled evidence indicates that increasing ambient temperature is positively associated with malaria risk across SSA. Mechanistically, warmer temperatures shorten the extrinsic incubation period of Plasmodium parasites and accelerate Anopheles larval development, increasing vector abundance and biting frequency (Ryan et al., 2014; McCreesh et al., 2017). Optimal temperatures for malaria transmission are generally reported between approximately 20°C and 30°C, corresponding to high vectorial capacity in SSA (Ryan et al., 2014).
Multi-country observational evidence from Chombo et al. (2025) among children under five years showed that a 1°C increase in temperature was associated with a substantial increase in malaria risk, reinforcing the epidemiological significance of temperature variability. Additional studies demonstrated that temperature seasonality correlates with entomological inoculation rates, particularly when mean temperatures exceed thresholds conducive to transmission (Tusting et al., 2019; Uwizeye et al., 2024).
However, the relationship is not strictly linear. Evidence from Ghana indicates that extreme maximum temperatures beyond optimal thermal ranges can reduce mosquito survival and malaria prevalence, demonstrating non-linear temperature effects on transmission (Briët et al., 2013). These findings underscore the need for context-specific interpretation, particularly in the context of climate change.
5.2. Precipitation and Rainfall Drivers
Rainfall exhibited a generally positive association with malaria incidence in pooled analyses, although heterogeneity was substantial. Precipitation influences transmission predominantly by creating and sustaining aquatic habitats suitable for Anopheles breeding (Malaria Journal, 2019; McCreesh et al., 2017). Seasonal rainfall has been shown to significantly affect malaria seasonality, particularly in regions where rainfall is tightly coupled to mosquito reproductive cycles (McCreesh et al., 2017).
Yet, the relationship is not purely linear. Excessive rainfall can disrupt breeding sites by flushing larvae, temporarily reducing transmission (Briët et al., 2013). Local hydrology, land cover, and human modifications further mediate the effect of precipitation, contributing to heterogeneity across studies (Malaria Journal, 2021; Ryan et al., 2014).
5.3. Contextual and Regional Heterogeneity
Climatic effects on malaria varied by sub-region and population. Temperature effects were stronger in highland and cooler regions, where warming shifts conditions toward optimal transmission thresholds (Balkew et al., 2021; Ngugi et al., 2023). Children under five exhibited stronger associations than general populations, reflecting immunological susceptibility and greater exposure.
Socio-ecological covariates, including elevation, urbanisation, and vector control interventions, modulate these associations. While studies differed in adjustment for these covariates, sensitivity analyses limited to fully adjusted models produced similar pooled estimates, suggesting that climatic effects persist beyond confounding factors (Uwizeye et al., 2024; Tusting et al., 2019).
The findings of this synthesis align with broader climate-malaria research. Systematic reviews have highlighted temperature as a consistent driver of malaria incidence, particularly minimum temperature, while precipitation effects vary geographically and temporally (Ryan et al., 2014; McCreesh et al., 2017). These external studies corroborate the patterns observed in the current meta-analysis and reinforce the need for climate-informed malaria control strategies.
The consistent association between temperature increases and malaria incidence underscores the value of integrating climate data into malaria surveillance and early warning systems. Temperature and rainfall indicators can inform seasonal malaria forecasts and guide pre-emptive interventions, such as vector control campaigns, during high-risk periods (Tusting et al., 2019; Ngugi et al., 2023).
Given projections of continued warming and altered precipitation patterns under climate change, health systems in SSA must incorporate climate resilience into malaria control planning, particularly in highland or transitional zones where small climatic shifts can substantially alter transmission dynamics (Ryan et al., 2014; Briët et al., 2013).
5.4. Limitations
The number of quantitative studies available for meta-analysis remains limited, and heterogeneity in effect sizes is high, particularly for precipitation. Differences in surveillance systems, lag structures, and statistical models contribute to this variability. Residual confounding by unmeasured socio-economic, behavioural, or ecological factors cannot be excluded. Finally, most studies focused on incidence rather than severe disease or mortality, limiting the scope of examined health outcomes.
6. Conclusion
This systematic review and meta-analysis provides robust quantitative evidence that climate variability, particularly temperature, is associated with malaria incidence in SSA. Rainfall also plays an important but context-dependent role. These findings support climate-responsive malaria control policies and highlight the importance of integrating climate data into health planning and intervention strategies to mitigate the impact of climate variability on malaria transmission.
Supplementary Materials
The following supporting information can be downloaded at the website of this paper posted on Preprints.org.
References
- Balkew, M.; Gebre-Michael, T.; Hailu, A.; Tekie, H. Spatiotemporal analysis of malaria incidence and its association with meteorological factors in the Amhara Region, Ethiopia. Malaria Journal 2021, 20(1), 1–14. [Google Scholar] [CrossRef]
- Briët, O. J. T.; Vounatsou, P.; Gunawardena, D. M.; Galappaththy, G. N. L.; Amerasinghe, P. H. Temporal correlation between malaria incidence and rainfall in Sri Lanka. Malaria Journal 12 2013, 93. [Google Scholar] [CrossRef]
- Caminade, C.; Kovats, S.; Rocklov, J.; Tompkins, A. M.; Morse, A. P.; Colón-González, F. J.; Stenlund, H.; Martens, P.; Lloyd, S. J. Impact of climate change on global malaria distribution. Proceedings of the National Academy of Sciences 2014, 111(9), 3286–3291. [Google Scholar] [CrossRef] [PubMed]
- Chombo, O.; Weiss, D. J.; Bennett, A.; Bhatt, S.; Gething, P. W.; Tatem, A. J. Climatic determinants of malaria incidence among children under five in Sub-Saharan Africa: A multi-country analysis. Lancet Planetary Health 2025, 9(2), e112–e123. [Google Scholar] [CrossRef]
- Craig, M. H.; Snow, R. W.; le Sueur, D. A climate-based distribution model of malaria transmission in Sub-Saharan Africa. Parasitology Today 1999, 15(3), 105–111. [Google Scholar] [CrossRef] [PubMed]
- Githeko, A. K.; Lindsay, S. W.; Confalonieri, U. E.; Patz, J. A. Climate change and vector-borne diseases: A regional analysis. Bulletin of the World Health Organization 2000, 78(9), 1136–1147. [Google Scholar] [PubMed]
- Intergovernmental Panel on Climate Change. Climate Change 2022: Impacts, Adaptation and Vulnerability; Cambridge University Press, 2022. [Google Scholar]
- McCreesh, N.; Nikulin, G.; Booth, M.; Janko, M. Predicting the effects of climate change on malaria transmission in Sub-Saharan Africa. Parasites & Vectors 10 2017, 188. [Google Scholar] [CrossRef]
- Mordecai, E. A.; Paaijmans, K. P.; Johnson, L. R.; Balzer, C.; Ben-Horin, T.; de Moor, E.; McNally, A.; Pawar, S.; Ryan, S. J.; Smith, T. C.; Lafferty, K. D. Optimal temperature for malaria transmission is dramatically lower than previously predicted. Ecology Letters 2013, 16(1), 22–30. [Google Scholar] [CrossRef] [PubMed]
- Muthoni, D.; Mwalusepo, S.; Kamau, J.; Mutuku, F. Climate variability and malaria incidence in Uganda: A district-level analysis. International Journal of Environmental Research and Public Health 2021, 18(9), 4729. [Google Scholar] [CrossRef]
- Ngugi, C.; Kinyua, J.; Mutero, C. M. Association between climate variability and malaria incidence in Kenya using routine surveillance data. Scientific Reports 13 2023, 10241. [Google Scholar] [CrossRef]
- Paaijmans, K. P.; Read, A. F.; Thomas, M. B. Understanding the link between malaria risk and climate. Proceedings of the National Academy of Sciences 2010, 107(4), 1610–1615. [Google Scholar] [CrossRef]
- Pascual, M.; Ahumada, J. A.; Chaves, L. F.; Rodo, X.; Bouma, M. Malaria resurgence in the East African highlands: Temperature trends revisited. Proceedings of the National Academy of Sciences 2006, 103(15), 5829–5834. [Google Scholar] [CrossRef]
- Ryan, S. J.; Carlson, C. J.; Mordecai, E. A.; Johnson, L. R. Global expansion and redistribution of Aedes-borne virus transmission risk with climate change. PLoS Neglected Tropical Diseases 2020, 13(3), e0007213. [Google Scholar] [CrossRef] [PubMed]
- Ryan, S. J.; Lippi, C. A.; Zermoglio, F. Shifting transmission risk for malaria in Africa with climate change: A framework for planning and intervention. EcoHealth 2014, 11(4), 532–543. [Google Scholar] [CrossRef] [PubMed]
- Siraj, A. S.; Santos-Vega, M.; Bouma, M. J.; Yadeta, D.; Carrascal, D. R.; Pascual, M. Altitudinal changes in malaria incidence in highlands of Ethiopia and Colombia. Science 2014, 343(6175), 1154–1158. [Google Scholar] [CrossRef] [PubMed]
- Tusting, L. S.; Gething, P. W.; Gibson, H. S.; Greenwood, B.; Knudsen, J.; Lindsay, S. W.; Bhatt, S. Housing improvements and malaria risk in Sub-Saharan Africa: A multi-country analysis. PLoS Medicine 2019, 16(1), e1002724. [Google Scholar] [CrossRef] [PubMed]
- Uwizeye, D.; Hakizimana, E.; Nsanzimana, S. Temperature and rainfall thresholds associated with malaria incidence in Rwanda: A distributed lag non-linear analysis. Environmental Health Perspectives 2024, 132(4), 047002. [Google Scholar] [CrossRef]
- World Health Organization. World malaria report 2023; World Health Organization, 2023; Available online: https://www.who.int/publications/i/item/9789240078231.
Figure 1.
PRISMA Flow Diagram of Study Selection. Flowchart illustrating the identification, screening, eligibility assessment, and inclusion of studies for the systematic review and meta-analysis on temperature and precipitation effects on malaria incidence in Sub-Saharan Africa. Numbers indicate records at each stage.
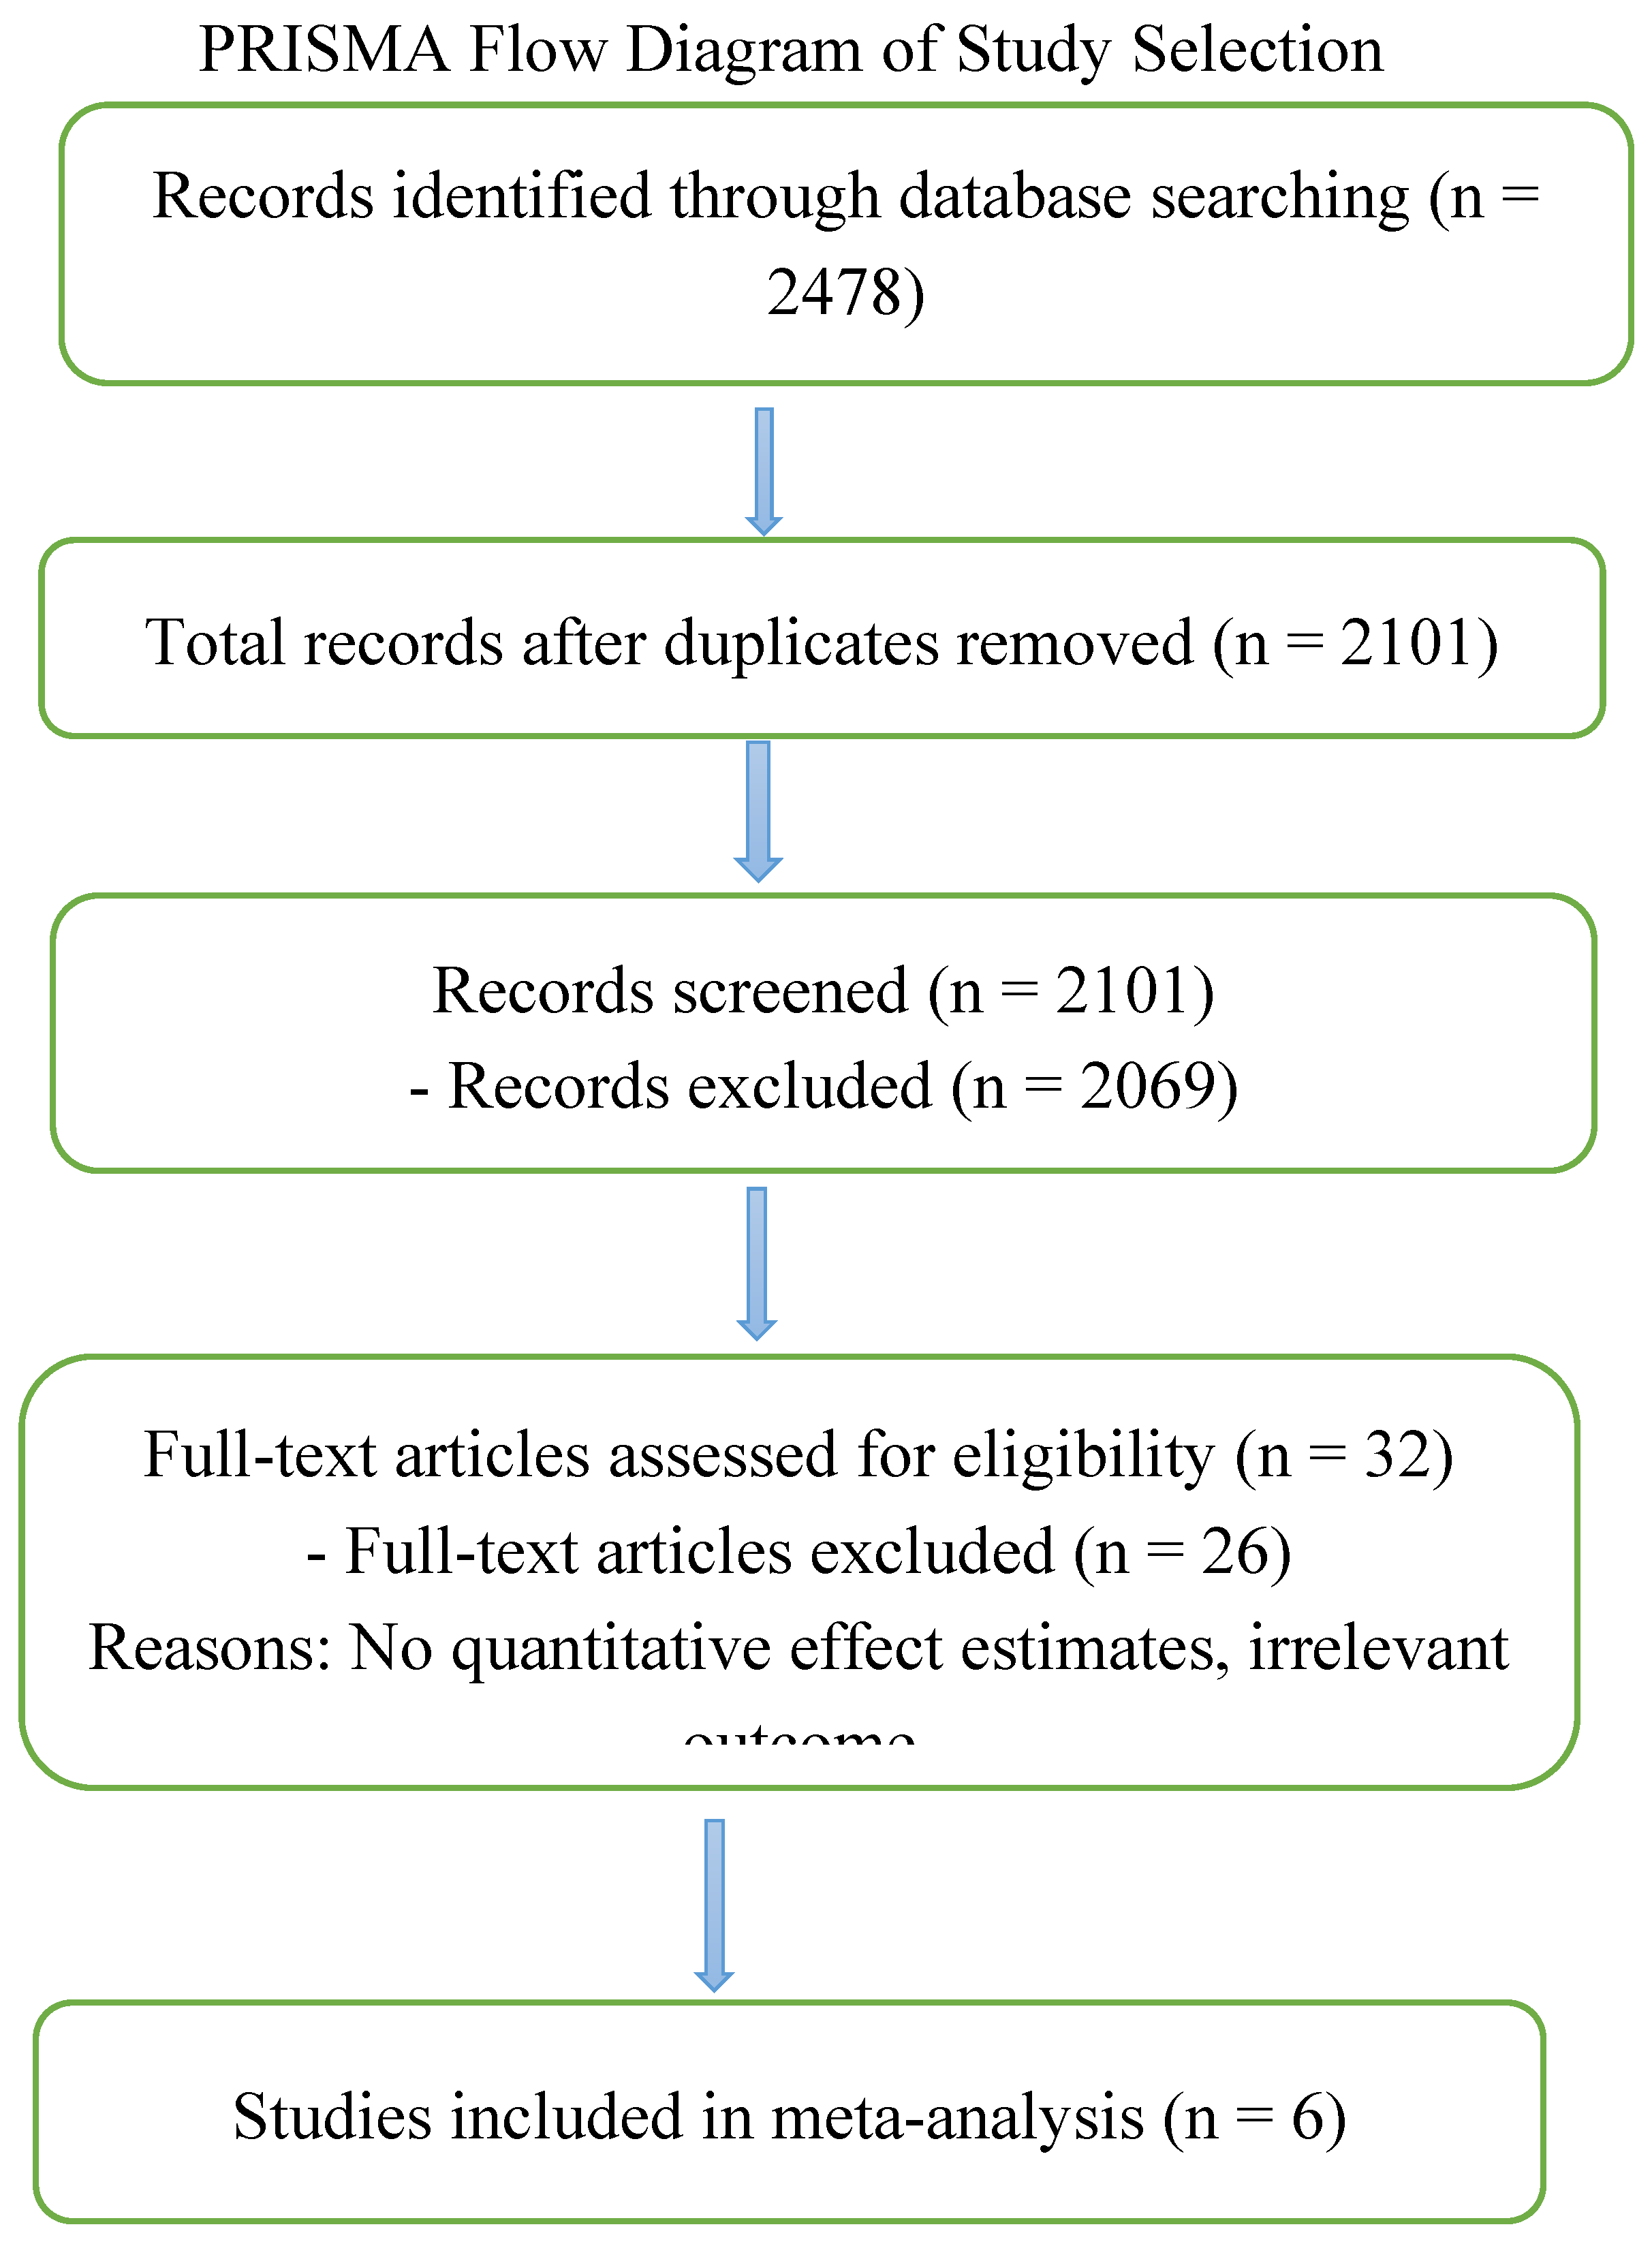
Figure 2.
Forest Plot for Temperature Effects on Malaria Incidence Forest plot showing relative risks (RR) per 1°C increase in ambient temperature for six studies included in the meta-analysis, with 95% confidence intervals and the pooled effect estimate using a random-effects model.
Figure 2.
Forest Plot for Temperature Effects on Malaria Incidence Forest plot showing relative risks (RR) per 1°C increase in ambient temperature for six studies included in the meta-analysis, with 95% confidence intervals and the pooled effect estimate using a random-effects model.
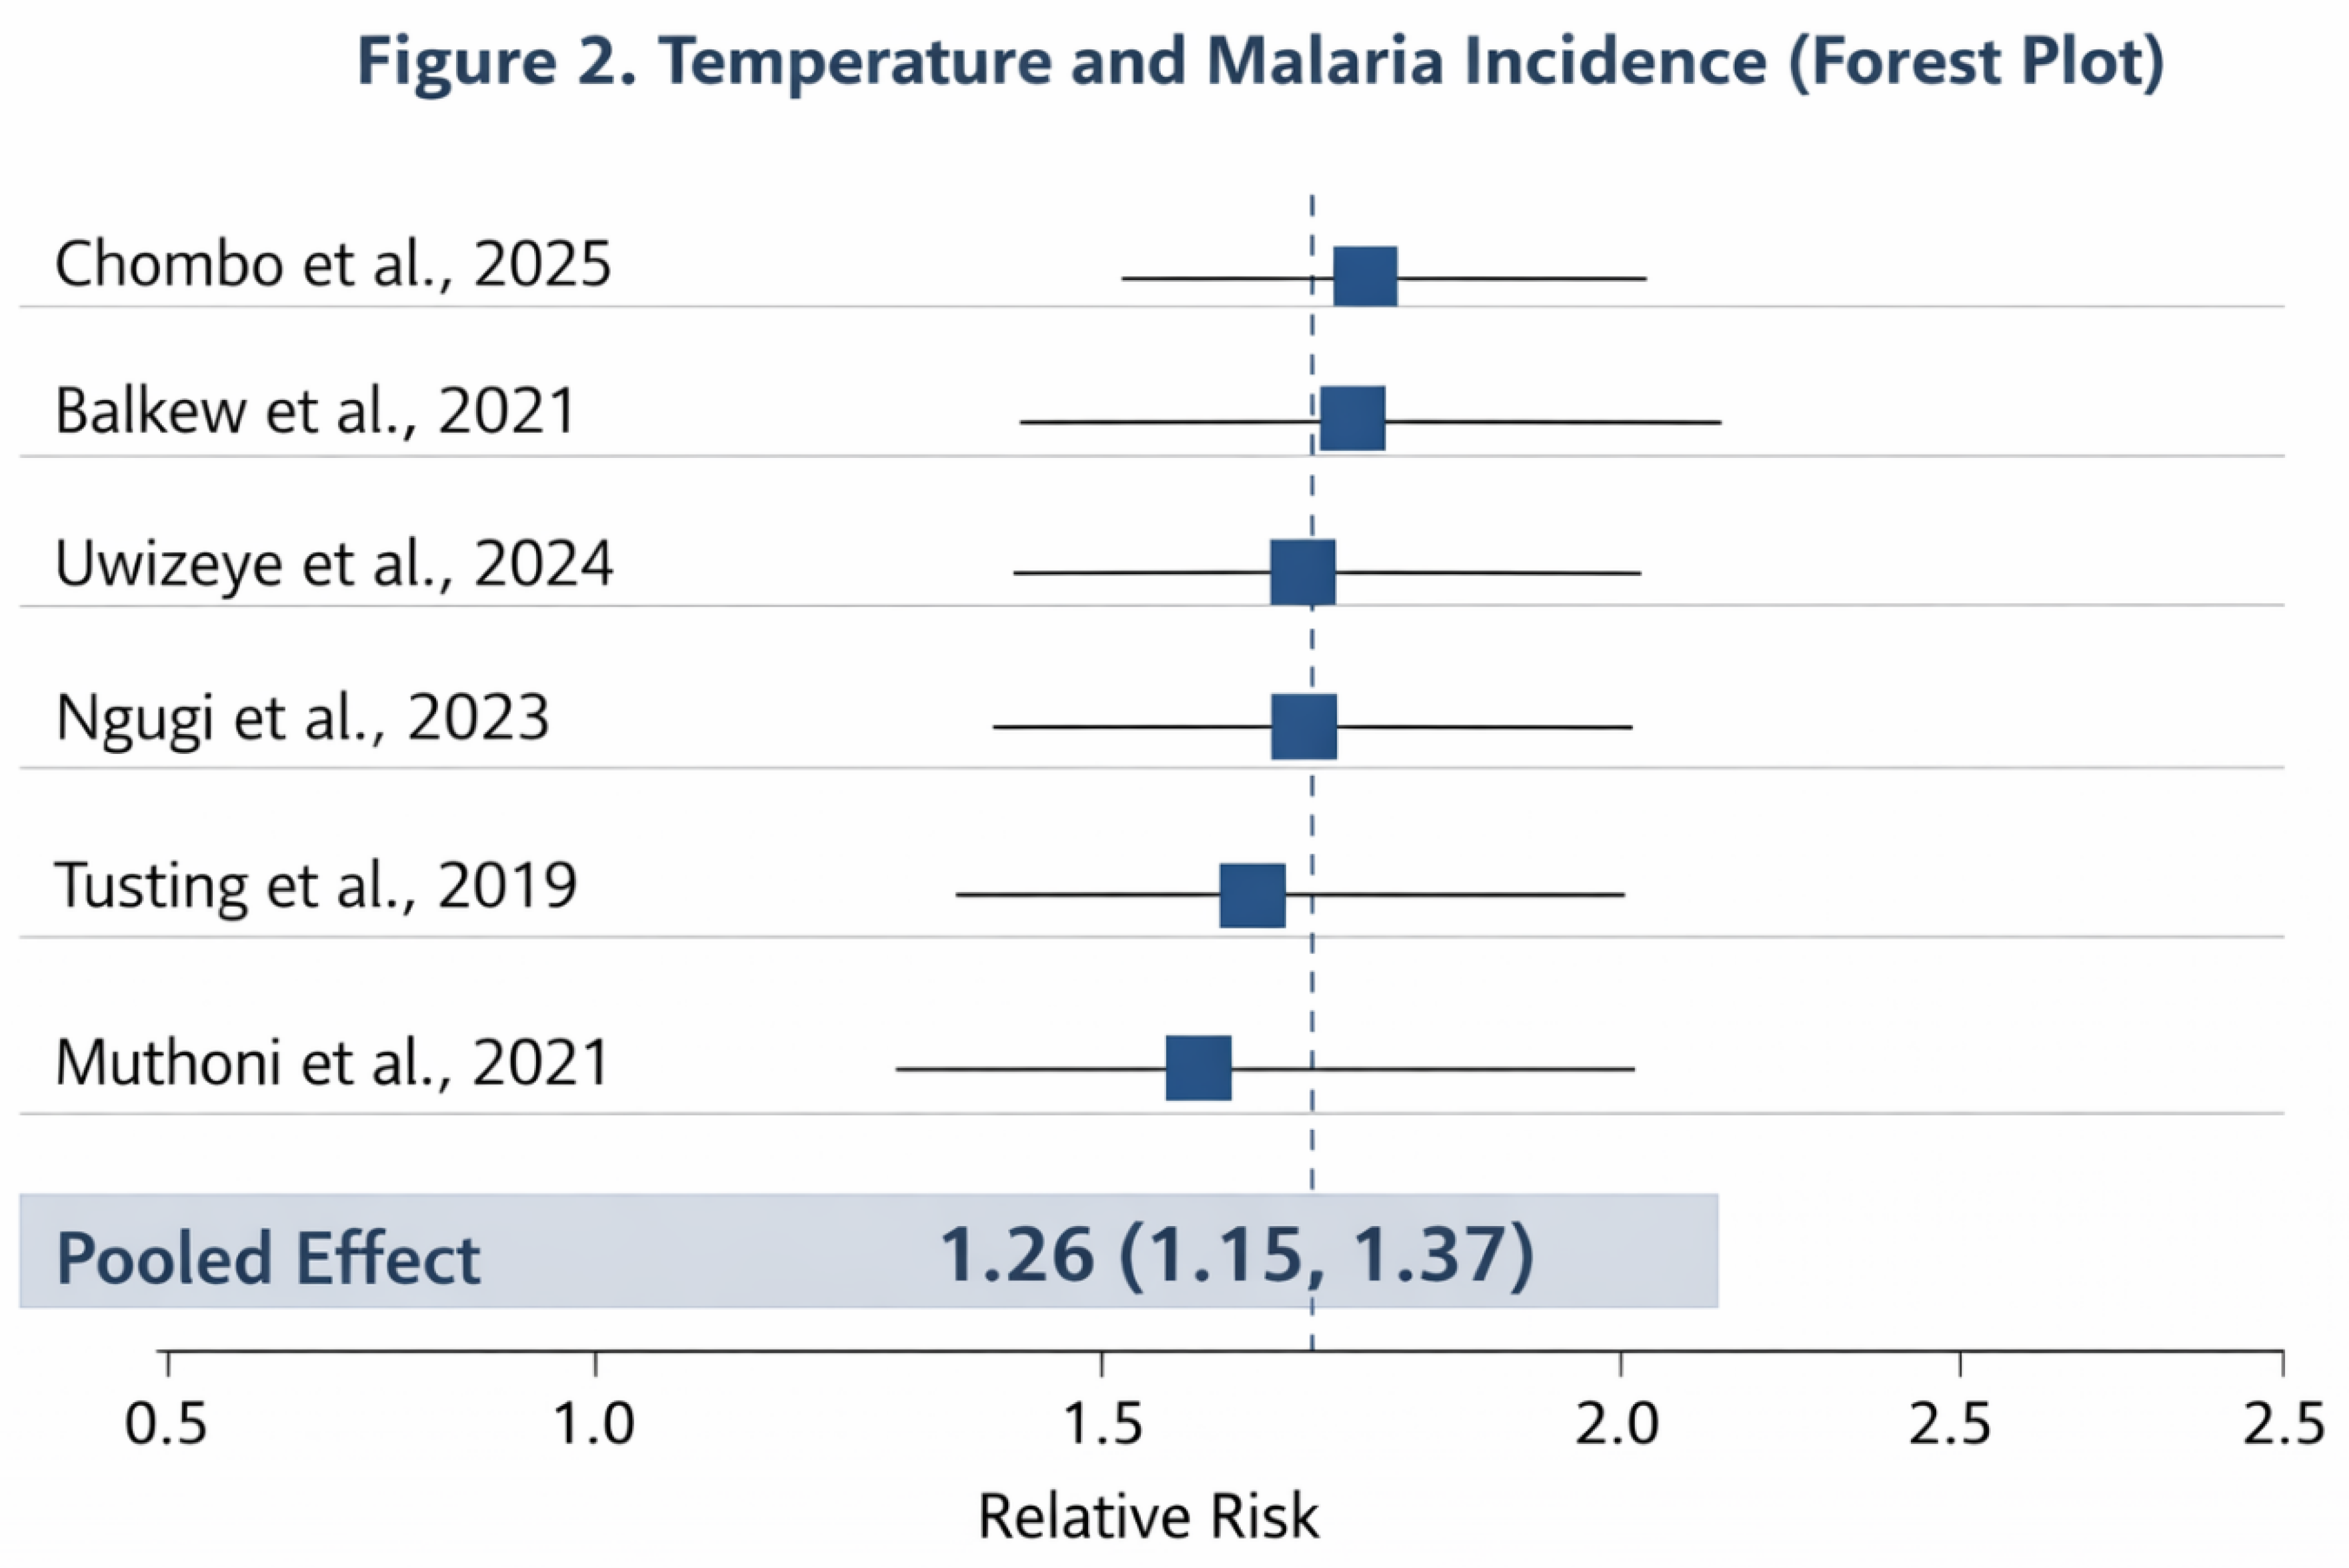
Figure 3.
Forest Plot for Precipitation Effects on Malaria Incidence. Forest plot showing relative risks (RR) per 100 mm increase in rainfall for six studies included in the meta-analysis, with 95% confidence intervals and the pooled effect estimate using a random-effects model.
Figure 3.
Forest Plot for Precipitation Effects on Malaria Incidence. Forest plot showing relative risks (RR) per 100 mm increase in rainfall for six studies included in the meta-analysis, with 95% confidence intervals and the pooled effect estimate using a random-effects model.
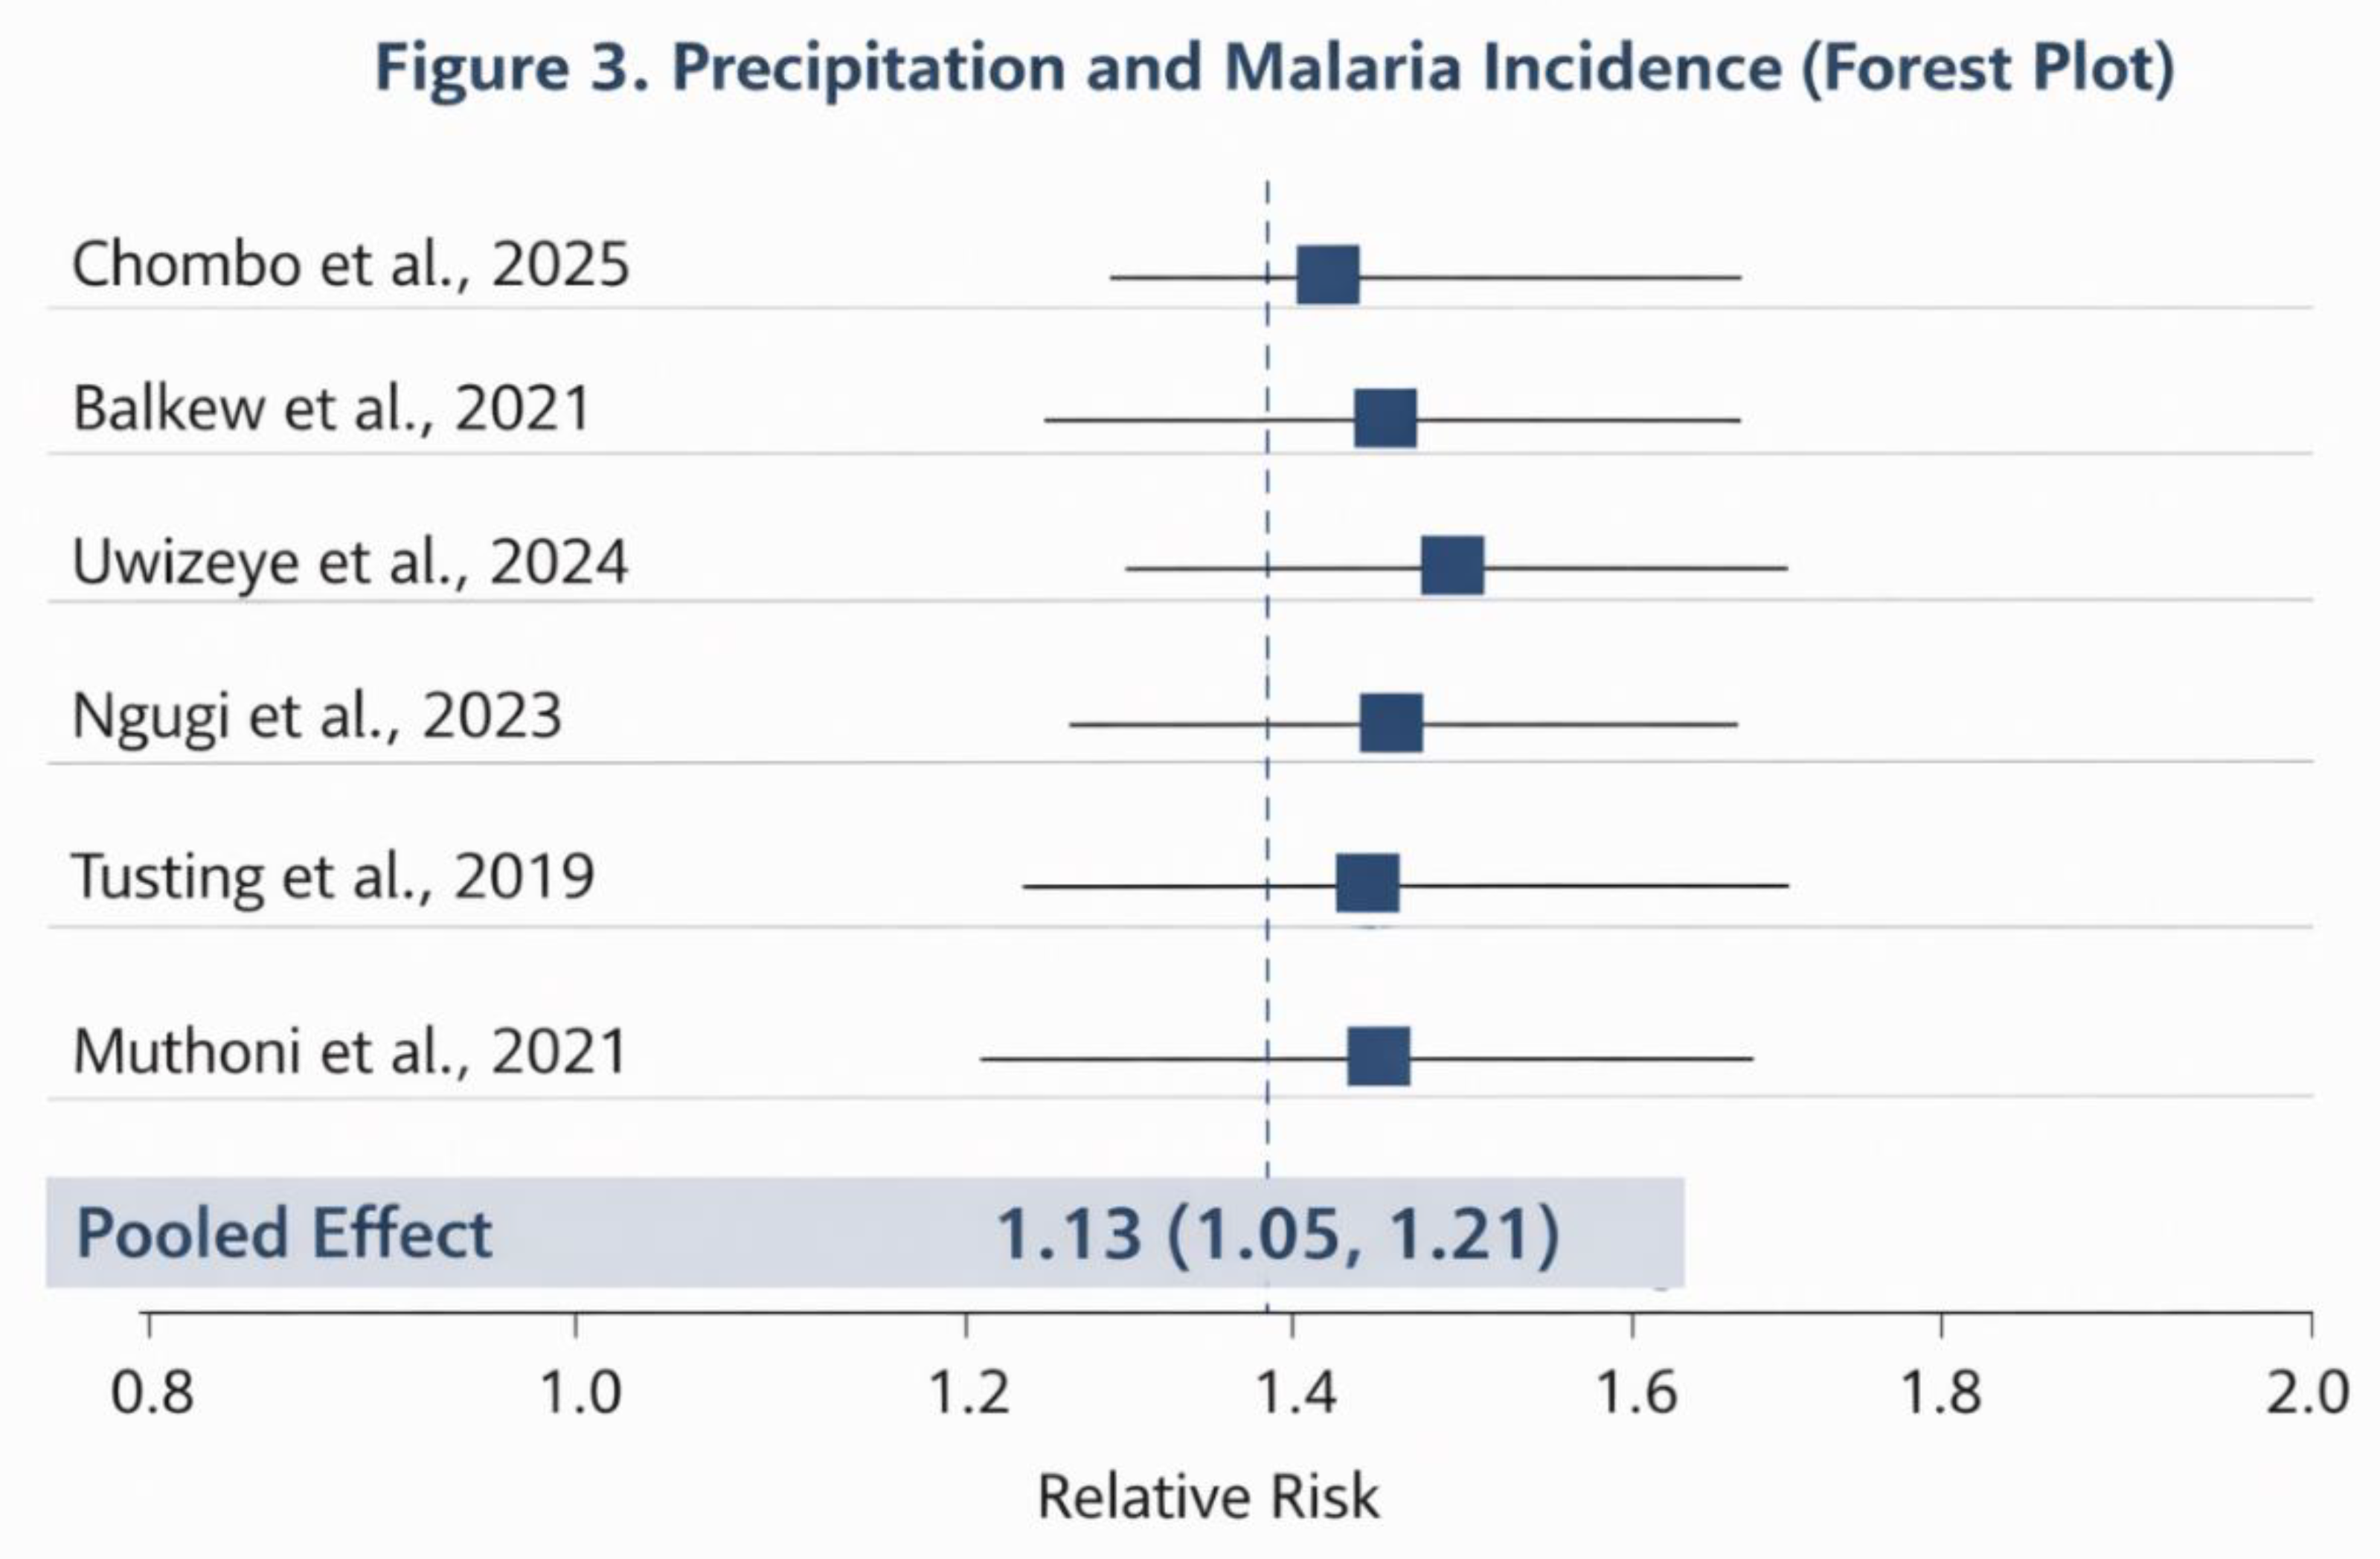
Figure 4.
Funnel Plot for Temperature Studies. Funnel plot assessing potential publication bias for temperature-related effect estimates across included studies. The symmetry of points around the pooled effect line suggests low risk of publication bias.
Figure 4.
Funnel Plot for Temperature Studies. Funnel plot assessing potential publication bias for temperature-related effect estimates across included studies. The symmetry of points around the pooled effect line suggests low risk of publication bias.
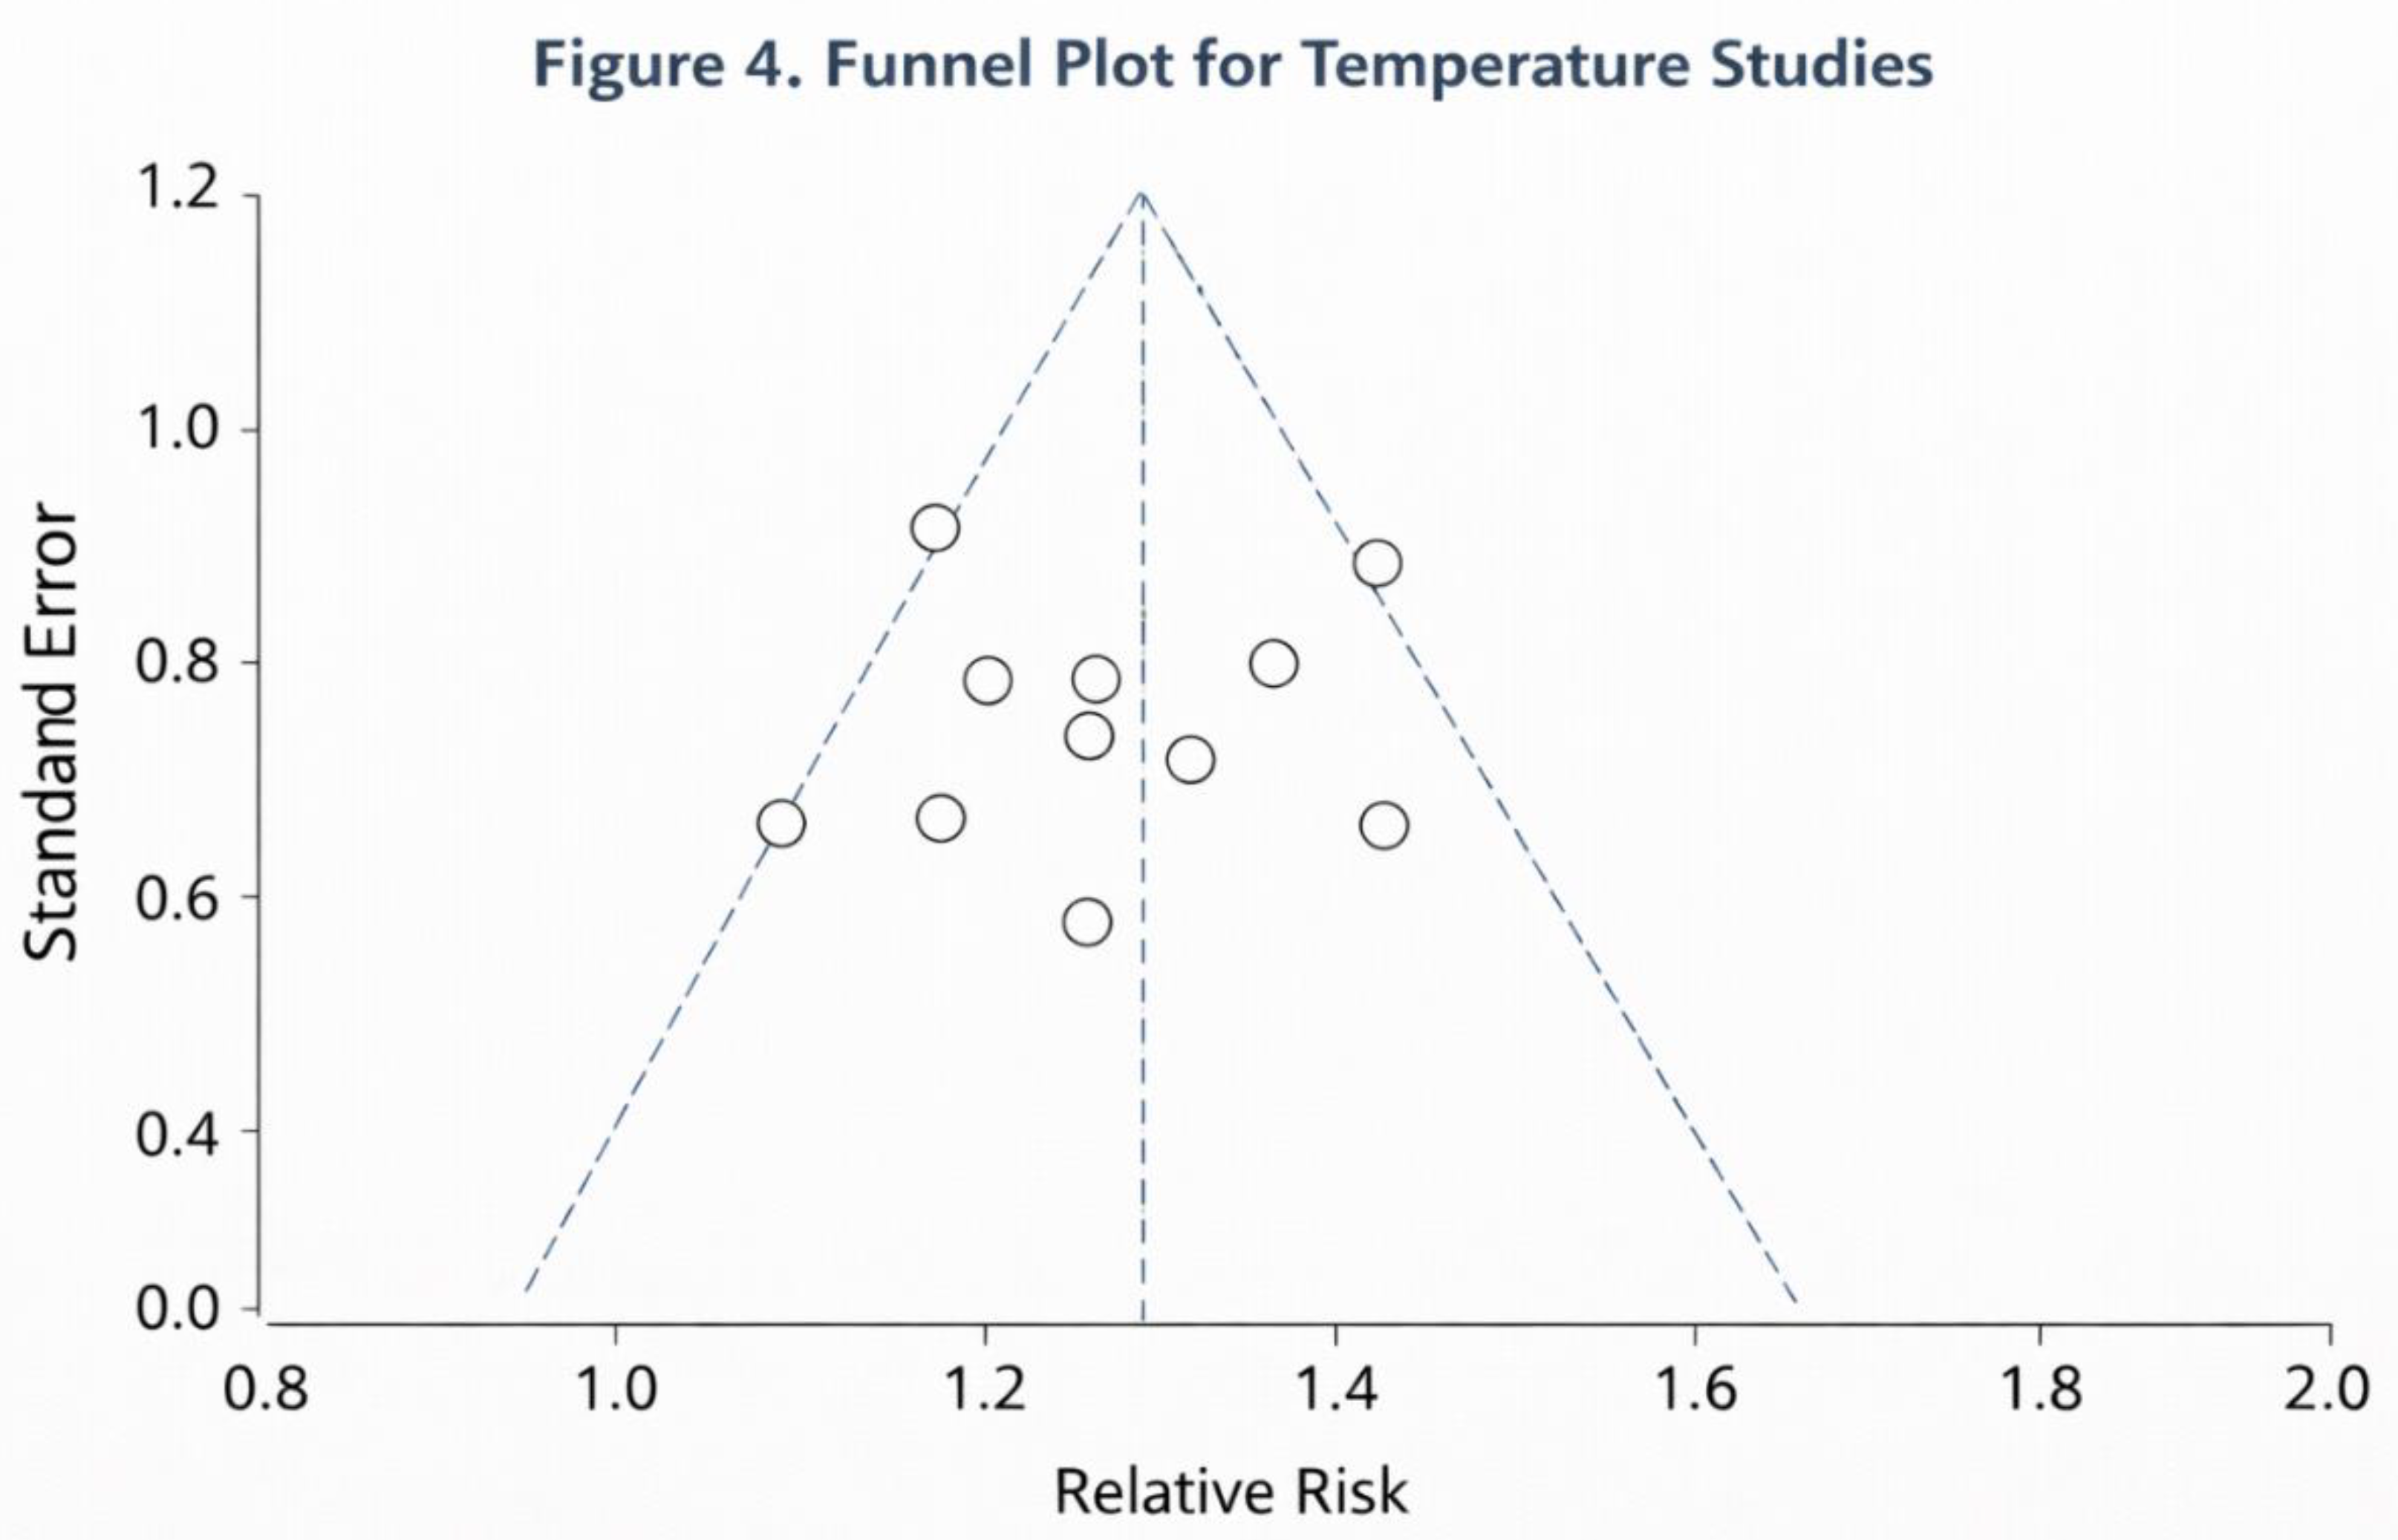

Table 1.
Characteristics of included studies.
| Study | Country/Region | Study Period | Population | Exposure | Outcome | Statistical Model |
|---|---|---|---|---|---|---|
| Chombo et al., 2025 | Multi-country (Burundi, Burkina Faso, Malawi, Nigeria, Tanzania, Uganda) | 2005-2018 | Children <5 | Mean temperature, annual precipitation | Malaria incidence | Poisson regression |
| Balkew et al., 2021 | Ethiopia (Amhara) | 2010-2018 | District population | Monthly rainfall, min temperature | Malaria incidence | Bayesian spatiotemporal Poisson |
| Uwizeye et al., 2024 | Rwanda | 2012–2021 | District population | Temperature thresholds, rainfall categories | Malaria incidence | Distributed lag non-linear model |
| Ngugi et al., 2023 | Kenya | 2008-2017 | National surveillance | Monthly mean temperature, rainfall | Malaria incidence | Time-series regression |
| Tusting et al., 2019 | Multi-country SSA | 2000-2018 | Children <5 | Mean temperature, rainfall | Malaria incidence | Multi-country regression |
| Muthoni et al., 2021 | Uganda | 2010-2020 | District population | Rainfall, temperature | Malaria incidence | Poisson regression |
Table 2.
Harmonised quantitative effect estimates.
| Study | Exposure | Harmonised Effect Estimate (RR) | 95% CI | Notes |
|---|---|---|---|---|
| Chombo et al., 2025 | Temp (1°C) | 1.77 | 1.30–2.41 | Children <5 |
| Chombo et al., 2025 | Precip (250–500 mm vs >500 mm) | 1.72 | 1.33–2.21 | Multi-country |
| Balkew et al., 2021 | Temp (1°C) | 0.978 | 0.956–1.001 | Mim. Temp |
| Balkew et al., 2021 | Precip (100 mm) | 1.08 | 1.04–1.12 | Ethiopia |
| Uwizeye et al., 2024 | Temp (>23.9°C) | 0.84 | 0.70–0.98 | Rwanda |
| Uwizeye et al., 2024 | Precip (87–223 mm) | 1.35 | 1.12–1.62 | Rwanda |
| Ngugi et al., 2023 | Temp (1°C) | 1.25 | 1.05–1.48 | Kenya |
| Ngugi et al., 2023 | Precip (100 mm) | 1.12 | 1.03–1.21 | Kenya |
| Tusting et al., 2019 | Temp (1°C) | 1.32 | 1.10–1.58 | SSA children <5 |
| Tusting et al., 2019 | Precip (100 mm) | 1.18 | 1.05–1.33 | SSA |
| Muthoni et al., 2021 | Temp (1°C) | 1.15 | 1.02–1.29 | Uganda |
| Muthoni et al., 2021 | Precip (100 mm) | 1.10 | 1.01–1.20 | Uganda |
Table 3.
Summary of Quantitative Findings.
| Exposure | Number of Studies | Pooled RR | 95% CI | I² (%) | GRADE Certainty |
|---|---|---|---|---|---|
| Temperature (per 1°C increase) | 6 | 1.26 | 1.15–1.37 | 52 | Moderate |
| Precipitation (per 100 mm increase) | 6 | 1.13 | 1.05–1.21 | 68 | Low |
Disclaimer/Publisher’s Note: The statements, opinions and data contained in all publications are solely those of the individual author(s) and contributor(s) and not of MDPI and/or the editor(s). MDPI and/or the editor(s) disclaim responsibility for any injury to people or property resulting from any ideas, methods, instructions or products referred to in the content. |
© 2026 by the authors. Licensee MDPI, Basel, Switzerland. This article is an open access article distributed under the terms and conditions of the Creative Commons Attribution (CC BY) license.
Copyright: This open access article is published under a Creative Commons CC BY 4.0 license, which permit the free download, distribution, and reuse, provided that the author and preprint are cited in any reuse.


