
Submitted:
16 January 2026
Posted:
19 January 2026
You are already at the latest version
Abstract
Data augmentation is a foundational component of modern deep learning for enhancing robustness and generalization. However, medical imaging lacks a universally reliable augmentation strategy, forcing researchers into an inefficient “augmentation lottery” that hinders experimental progress and reproducibility. We introduce Stepwise Upper and Lower Boundaries Augmentation (SULBA), a simple, parameter-free framework designed to eliminate per-task augmentation tuning. SULBA generates training variations through stepwise cyclic shifts applied along data dimensions, making it inherently applicable to 2D, 3D, and higher-dimensional medical imaging data. Benchmarking across 27 publicly available datasets spanning classification and segmentation tasks, and 10 convolutional and transformer-based architectures, demonstrates that SULBA achieves the highest overall performance rank and consistently outperforms 16 widely used standard augmentation techniques. By delivering robust and reliable improvements without task- or parameter-specific tuning, SULBA establishes a principled universal default for data augmentation in medical imaging, with the potential to accelerate the development of generalizable and reproducible medical AI systems.
Keywords:
data augmentation
; medical imaging
; medical diagnosis
; deep learning
; artificial intelligence
1. Introduction
Deep learning has become a cornerstone of modern medical image analysis, enabling substantial advances in tasks such as disease classification, lesion detection, and anatomical segmentation [1,2,3]. Convolutional neural networks (CNNs) have demonstrated strong performance across a wide range of imaging modalities by learning hierarchical representations directly from pixel or voxel data [4]. More recently, transformer-based and hybrid architectures have further extended modeling capacity through enhanced long-range contextual reasoning and hierarchical attention mechanisms [5,6]. These advances hold promise for improved diagnostic accuracy, reduced clinician workload, and enhanced patient outcomes. However, achieving robust and generalizable performance with such data-hungry models fundamentally depends on access to large, diverse, and well-annotated datasets [7].
Medical imaging datasets are fundamentally constrained by several factors. Expert annotation is expensive and time-consuming, class imbalance is pervasive, and data sharing is restricted by privacy, ethical, and regulatory requirements [8,9]. As a result, many medical imaging studies operate in data-limited regimes, where overfitting and poor generalization remain persistent challenges [10,11]. These limitations have made data augmentation (DA) an indispensable component of medical deep learning pipelines, providing a mechanism to expand training datasets through diverse mechanisms [12].
Existing DA approaches broadly fall into two paradigms: data generation and data transformation. Generative methods, including variational autoencoders, generative adversarial networks and diffusion models, synthesize new samples that approximate the statistical distribution of the original training data [13,14,15]. Transformation-based approaches instead apply predefined operations such as rotation, flipping, cropping, intensity perturbation, or elastic deformation to existing images [12,16]. While both paradigms have shown benefits, they present critical challenges when applied to medical imaging.
A central requirement of medical data augmentation is the preservation of diagnostic validity [12,17]. Generative approaches may exhibit hidden failure modes, leading to generation of anatomically implausible structures or subtle artifacts that are difficult to detect without expert review, thereby compromising model reliability and clinical trust [18,19]. Transformation-based techniques can similarly undermine diagnostic integrity: mixing-based augmentations may introduce biologically implausible tissue combinations that obscure true anatomy and degrade learning, while occlusion-based and aggressive cropping can eliminate clinically salient regions [17,20]. Additionally, commonly used geometric transformations may disrupt anatomical context or alter spatial relationships that are diagnostically meaningful, particularly when applied without domain-specific considerations [12,21].
These limitations create a persistent tension between inducing sufficient variability to improve model generalization and preserving the anatomical and pathological fidelity required for clinical relevance, exposing a deeper systemic inefficiency in current practice [13]. In the absence of a universally reliable augmentation strategy, researchers are often compelled to empirically evaluate numerous augmentation techniques and hyperparameter configurations for each new task, imaging modality, and network architecture, which may adversely affect result reproducibility [22]. Although many augmentation methods are standardized and readily accessible through widely adopted deep learning frameworks such as PyTorch [23], TorchIO [24], and TensorFlow [25], the lack of a principled, universally applicable strategy continues to necessitate empirical, task-specific and architecture-dependent selection [26]. This phenomenon, often described as an “augmentation lottery”, represents a significant bottleneck in medical AI research, slowing progress, increasing experimental uncertainty, and hindering reproducibility [22,27].
Here, we introduce Stepwise Upper and Lower Boundaries Augmentation (SULBA), a simple, parameter-free, perfectly reversible, and dimension-agnostic data augmentation framework. SULBA generates novel training samples via stepwise cyclic shifts applied along data dimensions (e.g., height, width, or depth). While each shift operation is deterministic, diversity arises from stochastic selection of shift offsets during training. Because SULBA is invariant to data dimensionality and feature composition, it can be applied seamlessly to 2D, 3D, and higher-dimensional data including single- and multi-channel images without architectural modifications or per-task hyperparameter tuning. This structured reordering aligns with principles explored in permutation-invariant and equivariant learning, where robustness arises from controlled input reordering rather than content corruption [28,29,30].
Unlike conventional augmentation strategies that interpolate, corrupt, or replace image content, SULBA preserves all original information by systematically repositioning contiguous regions through cyclic shifts. This transformation produces complementary partial views within a single image, preserving pixel intensities as well as the integrity of corresponding local tissue structure and pathology while introducing coherent global variation (Figure 1). As a result, SULBA exposes models to anatomically plausible reconfiguration in which salient features appear in altered spatial or feature contexts, reducing reliance on absolute position and encouraging robust, position-invariant representation learning. These properties are particularly advantageous in medical imaging, where maintaining anatomical and pathological fidelity is essential [19,31].
This work makes two key contributions. First, we propose SULBA as a universal, parameter-free augmentation framework that is reversible, dimension-agnostic, and directly applicable across imaging modalities, data dimensionalities, and task types. Second, to our knowledge, we present the most comprehensive empirical evaluation of data augmentation methods in medical imaging to date, benchmarking 27 publicly available datasets across 10 convolutional and transformer-based architectures for both classification and segmentation tasks in 2D and 3D. Across this diverse experimental landscape, SULBA consistently achieves superior performance, outperforming 16 widely used augmentation strategies while eliminating the need for task-specific augmentation tuning, thereby enabling more robust, reproducible, and scalable medical AI development.
2. Materials and Methods
2.1. SULBA Framework
Stepwise Upper and Lower Boundaries Augmentation (SULBA) is a deterministic, dimension-agnostic data augmentation framework. Given an input image tensor defined over feature and spatial dimensions, SULBA generates a novel sample by applying a cyclic shift along a randomly selected data dimension .
Formally, given an input tensor , a SULBA transformation along dimension , {0, …, N}) is defined as a cyclic shift operation governed by the modulo function described by:
where mod denotes the modulo operation,
{0,…,}is a specific location along dimension }is a randomly sampled step size.
As shown in Equation. 1, The cyclic shift operation is deterministic and perfectly reversible. During training, diversity is introduced by stochastically sampling both the dimension to be shifted and the step size at each application. This design preserves all original voxel intensities and local structures while systematically re-configuring the global spatial or feature context of the input. For segmentation tasks, identical shift parameters are applied synchronously to both the input image and its corresponding label mask, ensuring pixel- or voxel-perfect alignment. The full procedure is summarized in Algorithm 1.
| Algorithm 1. Stepwise Upper and Lower Boundaries Augmentation (SULBA) |
| Input: |
2.2. Scaling of Generated Samples
The number of novel samples generated by SULBA scales with both image resolution and dimensionality. For an input tensor :
the total number of possible novel configurations is given by:
Each term corresponds to the set of all valid step sizes along and shifts are applied along one dimension at a time. The resulting sample generation is additive across dimensions and automatically adapts to the complexity of the input data. Consequently, larger or higher-dimensional images yield a greater diversity of training samples without requiring manual parameter tuning.
2.3. SULBA Perfect Reversibility
SULBA guarantees perfect reversibility due to the invertible nature of cyclic shifts [28,29,30]. Let denote an input tensor, and let represent a cyclic shift of along dimension by a step size The original input can be exactly recovered by applying a complementary shift of , where denotes the size of dimension .
Formally, if
Then the inverse operation is given by:
Because SULBA does not perform interpolation, cropping, or any pixel-level modification, the original image is fully recoverable. This deterministic and reversible property preserves anatomical and pathological content within each transformed view, a critical requirement for reliable medical image analysis and reproducible model training.
2.4. Datasets and Preprocessing
Benchmarking was conducted across 27 publicly available medical imaging datasets spanning four task categories: 2D classification, 3D classification, 2D segmentation, and 3D segmentation.
For 2D classification, ten datasets from the MedMNIST v2 [32] suite were used: BloodMNIST, BreastMNIST, DermaMNIST, OctMNIST, OrganAMNIST, OrganCMNIST, OrganSMNIST, PathMNIST, PneumoniaMNIST, and TissueMNIST. Six volumetric MedMNIST v2 datasets with isotropic resolution—AdrenalMNIST3D, FractureMNIST3D, NoduleMNIST3D, OrganMNIST3D, SynapseMNIST3D, and VesselMNIST3D—were used for 3D classification.
For 2D segmentation, seven datasets were evaluated from the MedSegBench datasets [33]: AbdomenUSMSBench, Bkai-Igh-MSBench, CystoFluidMSBench, DeepbacsMSBench, FHPsAOPMSBench, MosMedPlusMSBench, and Promise12MSBench. For 3D segmentation, experiments were conducted on IXITiny [24] and the Medical Segmentation Decathlon (MSD) datasets [34] for the Heart and Hippocampus tasks. A complete dataset description is provided in Supplementary Table S30.
For 2D data, preprocessing included normalization using ImageNet [35] statistics and conversion of grayscale images to three channels to enable the use of pretrained weights. For 3D data, images were standardized to canonical orientation, normalized using Z-score normalization, and rescaled to an intensity range of [−1, 1]. When native image sizes varied, inputs were resized to match the architectural requirements of each model.
For cross-dataset generalization, models trained on PneumoniaMNIST were evaluated on publicly available chest X-ray pneumonia dataset [36] using identical preprocessing pipelines. Additional dataset and preprocessing details are provided in Supplementary Table S30.
2.5. Network Architectures
To evaluate robustness across diverse model architectures, we considered both convolutional and transformer-based networks. For 2D classification tasks, we employed ResNet-18 [37] and Swin Transformer Tiny [38] models initialized with ImageNet-pretrained weights. For 3D classification, we used R(2+1)D-18 [39] and 3D Swin Transformer [40] Tiny models initialized with Kinetics-400 pretrained weights [41]. All classification models were implemented using standard architectures through the PyTorch TorchVision framework.
For 2D segmentation, we evaluated a U-Net [42] with an ImageNet-pretrained ResNet-18 encoder and a SegFormer [43] model with an ImageNet-pretrained MiT-B1 backbone, both implemented using the Segmentation Models PyTorch library. For 3D segmentation, we employed a standard 3D U-Net [44] and SwinUNETR [45] implemented through MONAI [46] and trained from randomly initialized weights.
Cross-dataset generalization experiments additionally included both pretrained and randomly initialized variants of ResNet-18, Swin Transformer Tiny, MobileNetV3 (small) [47], and MobileViT-xxs [48], all implemented using standard architectures through the PyTorch TorchVision.
D and 3D Data Augmentation
For 2D augmentation baselines, we evaluated commonly used transformations including random horizontal flip, random vertical flip, random rotation, Random Erasing [49], Cutout [50], CutMix [51], and MixUp [52]. Random flipping and rotation were applied with a fixed probability (p = 0.5) consistent with standard practice. All other augmentation methods, including SULBA, were evaluated at two application probabilities (p = 0.5 and p = 1.0). Unless otherwise specified, standard implementations and default parameters were used through the PyTorch TorchVision parameters to facilitate reproducibility. Cutout was implemented using a custom implementation following the standard formulation.
For 3D experiments, volumetric augmentations including spike noise and gamma adjustment [24] anisotropy [53], bias field distortion [54], elastic deformation [55], blurring [56], ghosting [57], , random flipping, and additive noise were implemented using standard transformations through the TorchIO library. All transformations were evaluated at the same application probabilities. Default parameters were used for all transformations except elastic deformation, where the number of control points , maximum displacement , and border locking (set to 2) were configured to preserve anatomical plausibility.
2.6. Training and Implementation Details
Models were trained using AdamW optimization with mixed-precision training. Cross-entropy loss was minimized using standard mini-batch gradient descent with gradient clipping (ℓ₂ norm = 1.0). The model with the highest validation accuracy was retained. Batch sizes were adjusted according to dataset size and data dimensionality. After evaluating multiple learning rates, values that consistently yielded optimal performance over 100 training epochs were selected for both classification and segmentation tasks Extending training beyond this point resulted in overfitting and performance degradation. Models were trained using the standard training splits and evaluated on the corresponding test splits provided with each dataset.
To assess reproducibility, three independent runs were performed on a randomly selected dataset and model architecture across all augmentation techniques using random seeds 1, 42, and 100. After confirming consistent trends, the random seed was fixed to 42 for all subsequent experiments. All experiments were implemented in Python 3.13 using PyTorch 2.7.1+cu126 within Jupyter Notebook 7.3.2. Statistical analyses were performed using SciPy (v1.15.2), Pandas (v2.2.3), scikit-learn (v1.6.1), and NumPy (v2.2.6). Experiments were conducted on an NVIDIA Quadro RTX 3000 GPU.
2.7. Evaluation Protocol and Statistical Analysis
Performance was evaluated using task-standard metrics. For classification, we report accuracy, sensitivity, specificity, area under the receiver operating characteristic curve (AUROC), and F1-score. For segmentation, we report Intersection over Union (IoU), precision, recall, and F1-score.
To enable holistic comparison across models, architectures, and datasets, we adopted a cumulative ranking system based on aggregated metric performance [17], with minor modifications. The cumulative score was computed as:
Where C is cumulative score, M is evaluation metric, n is total number of evaluation metrics and technique is data augmentation method.
Relative improvement over a non-augmented baseline was calculated as:
Ninety-five percent confidence intervals for mean improvements in classification and segmentation benchmarks (Figure 2, Figure 3, Figure 4 and Figure 5) were computed using the standard error of the mean across datasets. For cross-dataset generalization (Figure 6), a composite score was calculated as the arithmetic mean of five classification metrics: accuracy, sensitivity, specificity, AUROC, and F1-score.
3. Results
3.1. Benchmark Performance on 2D Medical Image Classification
To evaluate the efficacy of SULBA in 2D medical image cassification, we performed an extensive benchmark across ten diverse 2D medical image datasets from the MedMNISTv2 suite, spanning dermatology, pathology, radiology, and histology. Performance was assessed using two widely adopted model architectures: a convolutional neural network (ResNet-18) and a vision transformer (Swin Transformer Tiny), both initialized with ImageNet pre-trained weights. A baseline model trained without data augmentation served as the reference for all comparisons. SULBA and four conventional augmentation techniques were evaluated at two application probabilities ). For all augmentation experiments, transformations were applied stochastically with the predefined probability p. SULBA and four widely used augmentation techniques including CutMix, Cutout, MixUp, Random Erasing were implented with application probabilities and while commonly used spatial augmentations including Rotation, Horizontal Flip, and Vertical Flip were implemented with , consistent with standard practice.
3.1.1. SULBA Provides Robust Performance Gains Across Diverse Datasets and Model Architectures
The aggregate improvement heatmap indicates that SULBA (p = 1.0) achieved positive performance gains in 8 out of 10 datasets when averaged across both model architectures, ranking highest among all evaluated augmentation techniques. Only OrganCMNIST (–0.99) and PathMNIST (–1.54) exhibited modest declines. Notably large improvements were observed on DermaMNIST (+25.16), PneumoniaMNIST (+17.16), and TissueMNIST (+24.71) (Figure 2a; Supplementary Tables S1-S7). Overall, SULBA (p = 1.0) attained a mean relative improvement of +5.56 score points over the non-augmented baseline (95% CI ± 2.61), the highest among all evaluated augmentation methods (Figure 2c). In a per-architecture analysis, SULBA (p = 1.0) yielded the strongest mean percentage improvement for both ResNet-18 (+1.27%, 95% CI ± 0.88) and the Swin Transformer (+1.27%, 95% CI ± 0.89), followed by SULBA (p = 0.5). Among competing techniques, Random Rotation achieved the best performance, with mean percentage improvements of +0.56% (95% CI ± 0.91) for ResNet-18 and +0.61% (95% CI ± 1.10) for the Swin Transformer. Collectively, these results demonstrate the robustness of SULBA across both convolutional and attention-based architectures (Figure 2b).
3.1.2. SULBA Demonstrates Superior and Consistent Performance Improvements
The benchmark analysis revealed that SULBA variants ranked highest among all tested data augmentation methods in the aggregate performance ranking. Across all datasets and both model architectures, SULBA (p = 1.0) achieved the top cumulative score (9,355.24), followed closely by SULBA (p = 0.5) with a score of 9,340.43 (Figure 2d; Supplementary Table S10). The performance margin between SULBA (p = 1.0) and the strongest conventional augmentation, Rotation (p = 0.5), was 63 points, increasing to 95 points relative to the runner-up method (Random Erasing, p = 0.5) and 205 points compared with the lowest-performing technique (Vertical Flip). Importantly, both SULBA variants consistently yielded positive performance gains across architectures, whereas several standard augmentations including MixUp (p = 1.0) and Horizontal Flip (p = 0.5) exhibited negative mean relative improvements (Figure 2c), underscoring SULBA’s robustness and reliability.
3.1.3. The Integration of SULBA with Traditional Augmentations Does Not Confer Synergistic Benefits
We investigated whether combining SULBA with foundational spatial transforms (Horizontal Flip, Vertical Flip, Rotation) could yield complementary effects. Contrary to expectation, these combinations consistently underperformed compared to SULBA applied alone (Figure 2e,f). For instance, combining SULBA (p=1.0) with Horizontal Flip resulted in a mean performance decrease of 0.39% compared to standalone SULBA, while combinations with Vertical Flip showed a more pronounced detrimental effect (-1.46%) (Figure 2f; Supplementary Tables S8 and S9). This suggests that SULBA's learned, saliency-guided transformations may subsume or conflict with the benefits of heuristic, label-agnostic spatial modifications, establishing SULBA as a performant standalone augmentation strategy.
3.2. Benchmark Performance on 3D Medical Image Classification
We extended our benchmark to the 3D domain using six volumetric medical imaging datasets from the 3D MedMNISTv2 (AdrenalMNIST, FractureMNIST, NoduleMNIST, OrganMNIST, SynapseMNIST, VesselMNIST) suite. The evaluation included 9 volumetric augmentation techniques pertinent to 3D data such as anisotropic scaling, bias field simulation, 3D elastic deformation, blurring and ghost artifacts alongside the baseline and SULBA. Each DA method was assessed with R(2+1)D-18 and 3D Swin Transformer models, both initialized with Kinetics-400 natural video dataset pretrained weights. The selected augmentation strategies were implemented with an application probabilities p = 0.5 and p = 1.0
3.2.1. SULBA Delivers Consistent and Exceptionally Large Improvements Across All 3D Datasets
The improvement heatmap reveals that SULBA (p=1.0) provided the highest positive gains for all dataset (Figure 3a). The improvements were most pronounced on VesselMNIST (+87.73), FractureMNIST (+62.67), and SynapseMNIST (+60.24). The mean relative improvement for SULBA (p=1.0) was +24.52 score points (95% CI ± 9.45), surpassing all other DA techniques (Figure 3c). Architecturally, SULBA (p=1.0) showed robust gains for both backbones, with a mean percentage improvement of +6.49% (95% CI ± 3.29) for R(2+1)D-18 and +6.76% (95% CI ± 4.42) for the 3D Swin Transformer (Figure 3b).
3.2.2. Traditional 3D Augmentations Show High Dataset-Specific Variance and Inconsistent Effects
While techniques like Blurring, Anisotropy provided moderate aggregate benefits, their effects varied widely-and sometimes severely negatively-across datasets. Other techniques demonstrated overall degradation such as Flipping (p=1.0) on OrganMNIST (-66.26) (Figure 3a; Supplementary Tables S11 -S14). In contrast, SULBA’s saliency-guided approach generated uniformly high, positive impacts, underscoring its generalizability and reliability for 3D medical image analysis.
3.2.3. SULBA Substantially Outperforms Standard Volumetric Augmentation Techniques in 3D Classification
In the aggregate performance ranking across all 3D classification datasets and model architectures, SULBA (p = 1.0) achieved the highest cumulative score (5011.45), followed closely by SULBA (p = 0.5) with a score of 4980.96 (Figure 3d; Supplementary Tables S15 and S16). Both SULBA variants outperformed all conventional volumetric augmentation techniques. SULBA (p = 1.0) exceeded the best-performing traditional method (Blurring, p = 1.0) by 211 points and the lowest-performing technique (Ghosting, p = 1.0) by 348 points. These results highlight SULBA’s pronounced and consistent superiority in the volumetric classification setting.
3.3. Benchmark Performance on 2D Medical Image Segmentation
To validate SULBA’s efficacy on dense prediction tasks, we benchmarked against 7 augmentation methods across seven diverse 2D medical image segmentation datasets from the MedSegBench using both CNN (U-Net with an ImageNet-pretrained ResNet-18 encoder) and Transformer (SegFormer model with an ImageNet-pretrained MiT-B1 backbone) segmentation architectures. Standard data augmentation techniques were evaluated at application probabilities p = 0.5 and p = 1.0. Flipping and rotation techniques were evaluated at p = 0.5.
3.3.1. SULBA Provides Robust, Positive Improvements Across Diverse Segmentation Datasets
The improvement heatmap shows SULBA (p=1.0) delivered strong gains on AbdomenUSMSBench (+16.28), Bkai-Igh-MSBench (+16.83), and CystoFluidMSBench (+11.47) (Figure 4a). The mean relative improvement for SULBA (p=1.0) was +4.49 score points (95% CI ± 2.15), surpassing all other methods (Figure 4c). Architecturally, SULBA showed consistent gains for both backbones, with mean percentage improvements of +1.58% (ResNet-18, 95% CI ± 0.64) and +1.22% (Segformer, 95% CI ± 1.39) (Figure 4b; Supplementary Table S21)
3.3.2. SULBA Ranks as the Top-Performing Augmentation Strategy for 2D Segmentation
In the aggregate performance ranking across seven 2D segmentation datasets and two model architectures, SULBA (p = 1.0) achieved the highest cumulative score (4655.95), closely followed by SULBA (p = 0.5) (4649.50) (Figure 4d; Supplementary Table S22). SULBA (p = 1.0) outperformed the best-performing conventional augmentation (Rotation) by 13 points, exceeded the runner-up method (Horizontal Flip) by 21 points, and surpassed the weakest-performing technique (MixUp, p = 1.0) by 171 points. Notably, SULBA and its variant were among only three augmentation methods that improved performance in more than 85% of dataset-architecture combinations, alongside Random Erasing and Rotation (Supplementary Tables S17–S20). This consistent superiority demonstrates that SULBA’s advantages extend robustly beyond classification to the more challenging task of dense, pixel-wise segmentation.
3.3.3. Combining SULBA with Spatial Augmentations Provides Marginal and Inconsistent Benefits
When SULBA was combined with traditional spatial augmentations, the effects were small and varied by probability setting. For SULBA (p=0.5), pairing with Horizontal Flip yielded a slight improvement of +0.29%, and with Rotation +0.11%, while Vertical Flip resulted in a minor decline of –0.14%. In contrast, SULBA (p=1.0) combinations led to small decreases across all spatial transforms: Horizontal Flip (–0.004%), Rotation (–0.17%), and Vertical Flip (–0.22%) (Figure. 4f).
The magnitude of these changes was minimal all below 0.30% and inconsistent across probability settings, indicating no reliable synergistic gain (Supplementary Tables S21 and S22). These results reinforce that SULBA alone provides near-optimal augmentation for 2D segmentation, with traditional spatial transforms offering little complementary benefit. This observation further simplifies pipeline design by eliminating the need to combine multiple augmentation strategies.
3.4. Benchmark Performance on 3D Medical Image Segmentation
We evaluated SULBA on 3D segmentation tasks using three volumetric datasets: IXITiny24, the Medical Segmentation Decathlon50 (MSD) Heart dataset, and the MSD Hippocampus dataset. The benchmark included 9 volumetric augmentation techniques spanning geometric transformations, intensity perturbations, and artifact-related augmentations, each applied with application probabilities of p = 0.5 and 1.0. Experiments were conducted using two representative and randomly initialized segmentation architectures: a convolutional 3D U-Net51 and the transformer-based SwinUNETR52. A baseline model trained without augmentation was used as the reference for all comparisons.
3.4.1. SULBA Delivers Consistent Improvements Across 3D Segmentation Datasets
The improvement heatmap shows that SULBA (p=1.0) provided the highest gains on all three datasets, with particularly pronounced improvements on MSD-Heart (+54.82) and MSD-Hippocampus (+18.44) (Figure 5a). The mean relative improvement for SULBA (p=1.0) was +12.75 score points (95% CI ± 9.56), a 4.68 improvement over the best competing method (Elastic Deformation, p=1.0) (Figure 5c). Architecturally, SULBA demonstrated consistent benefits, with mean percentage improvements of +4.28% (95% CI ± 5.89) for 3D U-Net and +4.85% (95% CI ± 5.91) for SwinUNETR (Figure 5b).
3.4.2. Conventional 3D Augmentation Methods Exhibit Pronounced Dataset-Dependent Variability
Many established volumetric augmentation techniques produced highly variable and often negative effects across datasets and model architectures. On the MSD-Heart dataset, all augmentation method–probability combinations reduced performance except SULBA and Elastic Deformation, with several techniques inducing relative declines exceeding 28 points. Although certain methods, such as Elastic Deformation, yielded moderate improvements on specific datasets, their effects were inconsistent and strongly dependent on both the dataset and the applied probability (0.5 or 1.0) (Figure 5a; Supplementary Tables S23 and S24). Comparable instability was observed on IXITiny and MSD-Hippocampus, where performance gains varied widely across augmentation strategies and experimental settings. Together, these findings highlight the limited reliability of conventional 3D augmentation methods, which may improve performance in isolated cases but frequently degrade it in others, underscoring the need for more robust and task-agnostic augmentation strategies
3.4.3. SULBA Achieves the Highest Overall Ranking Among 3D Augmentation Strategies
Across all three volumetric datasets and both evaluated architectures, SULBA consistently delivered positive performance gains and achieved the strongest overall results. SULBA (p = 1.0) attained the highest cumulative score (2023.55), followed closely by SULBA (p = 0.5) with a score of 2014.51. The leading SULBA variant outperformed the best competing conventional method, Random Elastic Deformation (p = 1.0), by 28 points, exceeded the runner-up technique, Random Ghosting (p = 1.0), by 73 points, and surpassed the lowest-performing method, Bias Field (p = 1.0), by 111 points (Figure 5d; Supplementary Tables S25 and S26). Collectively, these results establish SULBA as the most effective and robust augmentation strategy among all evaluated 3D methods, delivering reliable improvements across datasets and architectural paradigms.
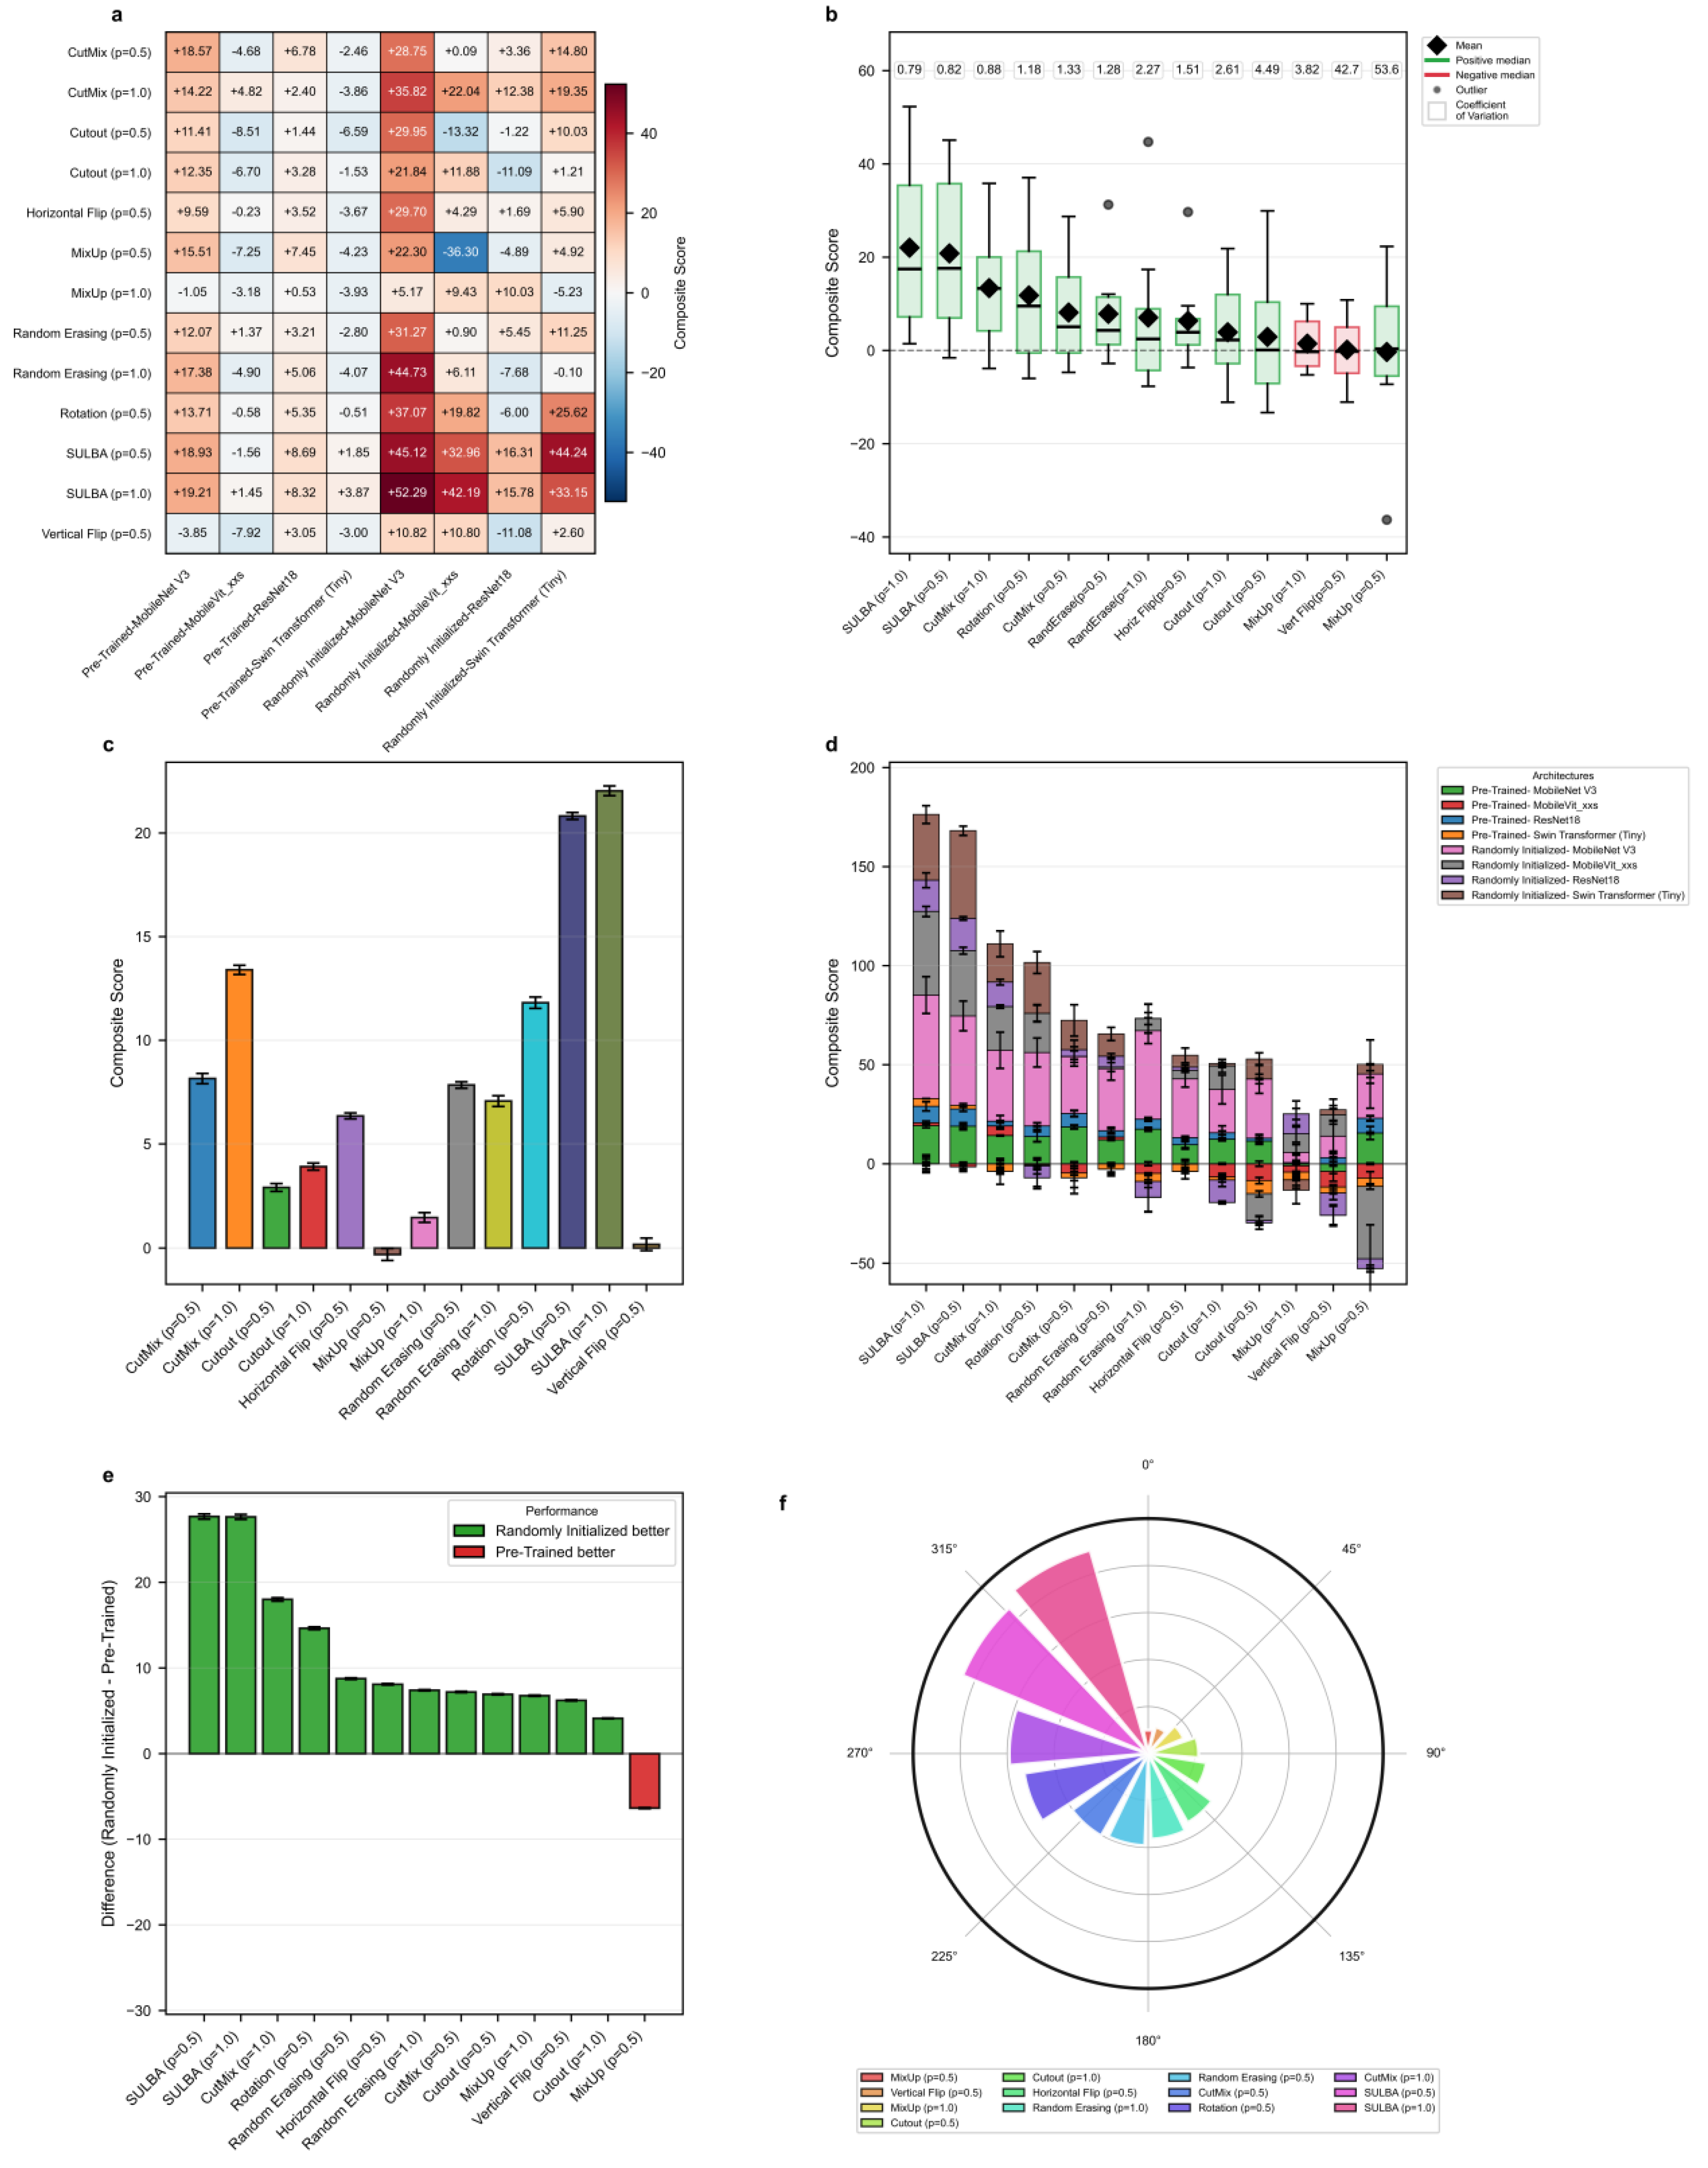
3.5. Generalization Performance Across Diverse Architectures
To evaluate SULBA’s ability to generalize beyond the training distribution, models were trained on PneumoniaMNIST and tested on an independent chest X-ray pneumonia dataset. Seven augmentation strategies including, CutMix, Cutout, MixUp, Random Erasing, Horizontal Flip, Rotation, and Vertical Flip were benchmarked on four architectures including ResNet-18, Swin Transformer (Tiny), MobileNet V3 (small variant), and MobileViT_xxs, each implemented with both randomly initialized and ImageNet-pre-trained weights. Traditional augmentations were applied at application probabilities of 0.5 and 1.0, while spatial augmentations used a fixed probability of 0.5, consistent with standard practice. Comparisons were made across all selected data augmentation strategies across all eight model variants (Figure 6; Supplementary Tables S27 and S28).
3.5.1. SULBA Delivers Superior Cross-Dataset Generalization
SULBA demonstrated robust and consistent cross-dataset generalization across all eight evaluated model variants, achieving positive composite gains in every case. The largest improvements were observed for randomly initialized models, including MobileNet V3 (+52.29) and Swin Transformer (+33.15) (Figure 6a; Supplementary Table S28). Overall, SULBA (p=1.0) achieved the highest mean composite score (22.03; 95% CI ± 12.92), an 8.63 improvement over the best competing method, CutMix (p=1.0; 13.40; 95% CI ± 8.71) (Figure 6c). In the cumulative performance ranking, SULBA (p=1.0) attained the highest total score (3703.84), followed closely by SULBA (p=0.5) with a score of 3694.12, outperforming all 13 evaluated augmentation strategies. The leading SULBA variant exceeded the strongest competing method, CutMix (p=1.0), by 69 points, Rotation by 82 points, and the lowest-performing method, MixUp (p=0.5), by 179 points (Figure 6f; Supplementary Table S29). Notably, while conventional augmentations exhibited negative or inconsistent effects when applied to pretrained models, SULBA maintained uniformly positive gains across both randomly initialized and pretrained training regimes, underscoring its reliability for cross-dataset generalization.
3.5.2. SULBA Provides Consistent Improvements Across Architectures
SULBA demonstrated remarkably stable performance across architectural families, with low variability quantified by a coefficient of variation (CV) of 0.79 for SULBA (p=1.0), the lowest among all methods evaluated (Figure 6b). In contrast, conventional augmentations exhibited high instability: Vertical Flip (p=0.5) demonstrated a CV of 42.67 and MixUp (p=0.5) showed a CV of 53.63, reflecting unpredictable and frequent detrimental effects on individual architectures (Figure 6b; Supplementary Tables S27 and S28). SULBA’s consistency, coupled with its uniformly positive contributions across both randomly initialized and pre-trained models (Figure 6d), underscores its reliability as an architecture-agnostic augmentation strategy.
3.5.3. Training with Randomly Initialized Weights Amplifies SULBA’s Benefits
Analysis of training paradigms revealed that SULBA delivered substantially larger gains in models trained with randomly initialized weights than in those initialized with ImageNet-pretrained weights. The performance increase of randomly initialized models over pretrained models reached +27.68 for SULBA (p=0.5) and +27.64 for SULBA (p=1.0), the largest differential observed among all augmentation methods (Figure 6e). This advantage was consistent across architectural families, with the randomly initialized variants of MobileNet V3 (+52.29) and Swin Transformer (+33.15) showing the most pronounced absolute improvements under SULBA (p=1.0) (Figure 6a). In contrast, traditional augmentation methods such as MixUp and Vertical Flip exhibited inconsistent or negative effects in the pre-trained setting, further highlighting SULBA’s reliability (Supplementary Table S27). These results underscore SULBA’s particular value in data-scarce regimes or when transfer learning from natural images is infeasible or suboptimal for the target medical domain.
4. Discussion
Data augmentation is a cornerstone of contemporary deep learning, enhancing model robustness and generalization. In medical imaging, however, no established augmentation approach has demonstrated reliable cross-task, cross-modal, or cross-architectural transferability [18,19,20]. As a result, augmentation pipelines are typically constructed through extensive trial-and-error tuning, which increases experimental burden and undermines reproducibility [13,22]. Our large-scale benchmarks across classification, segmentation, and cross-dataset generalization tasks demonstrate that SULBA offers a simple, deterministic, and parameter-free alternative. Unlike conventional augmentation strategies, SULBA systematically transforms data along intrinsic dimensions without modifying pixel intensities, interpolating content, or altering local structure (Figure 1). Its consistent performance across convolutional and transformer-based architectures, as well as across diverse imaging domains, establishes SULBA as a reliable default augmentation strategy that removes the need for task-specific parameter tuning and directly addresses long-standing inefficiencies in medical data augmentation practice.
Conventional augmentation approaches typically rely on stochastic deformation, interpolation, partial occlusion, or content mixing [49,50,51,52,53,54,55,56,57]. While such methods can improve performance in specific settings, their effectiveness is often highly sensitive to anatomical orientation, acquisition protocol, label structure, and model architecture [12,13]. Mixing-based techniques may generate biologically implausible tissue combinations, while aggressive cropping or erasure risks removing clinically salient regions [17] and widely adopted geometric transformations can disrupt critical spatial relationships [26]. Consequently, prior studies have emphasized that augmentation performance is difficult to predict a priori and frequently requires dataset-specific tuning [58,59]. Consistent with these observations, our benchmarks reveal substantial dataset-dependent variability among conventional methods (Figure 2, Figure 3, Figure 4 and Figure 5). In contrast, SULBA exhibits stable performance across architectures, dimensionalities (2D and 3D), and task types, indicating that its benefits do not depend on narrow inductive biases but instead arise from a more general, architecture-agnostic regularization mechanism.
The robustness of SULBA stems from its mechanistic design. By applying cyclic shifts along data dimensions, SULBA systematically repositions existing image content while preserving all anatomical and pathological information (Equation 1). Repeated application across training epochs exposes models to structured yet diverse views of the same underlying sample, reinforcing feature representations without introducing artifacts or synthetic content. This encourages distributed, position-tolerant feature learning and yields consistent gains across both classification and segmentation tasks. In segmentation tasks, exact voxel-level correspondence between inputs and labels is preserved, enabling reliable dense prediction without auxiliary heuristics. Experimental analysis of shift offsets further demonstrates that even a limited number of cyclic shifts can generate sufficient diversity to improve model generalization, particularly for small or low-resolution volumetric inputs (e.g., 3D benchmark using 32 × 32 × 32 voxels images; Figure 5).
SULBA’s impact is most pronounced in data-scarce regimes, including training from random initialization without pretrained representations (Figure 5b and Figure 6e). In such settings, early feature learning is especially vulnerable to spurious correlations and dataset-specific biases due to the absence of strong inductive priors [60,61]. By systematically reconfiguring input structure, SULBA mitigates this vulnerability and promotes the learning of position-invariant features that generalize beyond the training distribution. Across cross-dataset evaluations, SULBA consistently improved performance on independent test sets, indicating enhanced robustness under distributional shift. In the PneumoniaMNIST generalization experiment, SULBA-augmented models achieved nearly twofold higher mean composite scores compared with competing augmentation strategies across four architectures trained without pre-trained representation, spanning both convolutional and transformer-based models (Figure 6c). Similarly, on 3D volumetric datasets such as MSD-Heart and IXITiny, SULBA produced uniformly strong gains for both 3D U-Net and SwinUNETR models initialized with random weights (Figure 5a). Together, these results indicate that SULBA regularizes early feature learning and mitigates the risks associated with limited labeled data across modalities and dimensionalities.
Across extensive benchmarks, SULBA demonstrated highly stable performance under diverse experimental settings (Supplementary Tables S10, S16, S22, and S26). Performance remained robust to the choice of application probability, with both evaluated settings yielding consistent gains (Figure 2, Figure 3, Figure 4 and Figure 5). When combined with conventional spatial transformations, SULBA maintained high performance. However, these combinations provided no systematic advantage in classification tasks and only modest, dataset-specific improvements in select 2D segmentation benchmarks. These results suggests that SULBA’s intrinsic transformation accounts for the dominant augmentation effect (Figure 2e and Figure 4e). Supporting this interpretation, cross-dataset analyses revealed that SULBA exhibited the lowest coefficients of variation across all evaluated architectures, irrespective of whether models were trained with randomly initialized or pretrained weights (Figure 6b). This low variability underscores SULBA’s predictability and reliability as a default augmentation strategy, beyond improvements in mean performance alone.
Despite these strengths, our evaluation primarily relies on curated, publicly available datasets. Although these datasets span a wide range of modalities, tasks, and architectures, they cannot fully capture the heterogeneity encountered in prospective clinical environments, including site-specific acquisition protocols, scanner variability, and population-level differences [62,63]. Consequently, while the observed gains strongly suggest generalizability, real-world deployment may introduce additional challenges. Future work will therefore focus on multi-institutional validation, longitudinal evaluation, and deployment under heterogeneous clinical conditions to more comprehensively assess robustness and reproducibility in operational settings.
5. Conclusions
Data augmentation is essential for training robust medical AI models, yet existing strategies lack generalizability across imaging modalities, tasks, and architectures, requiring extensive task-specific tuning that introduces significant experimental overhead and limits reproducibility. We introduce SULBA, a simple, parameter-free, and dimension-agnostic framework based on deterministic cyclic shifts. Comprehensive benchmarking across 27 diverse 2D and 3D medical imaging datasets spanning classification, segmentation, and cross-dataset generalization tasks demonstrates that SULBA consistently achieves top-ranked performance, outperforming a wide range of conventional techniques while eliminating the need for empirical parameter selection and directly addressing the inefficient "augmentation lottery." These findings position SULBA as a reliable, universal default for data augmentation in medical image analysis with the potential to improve experimental reproducibility, and accelerate the development of robust, generalizable clinically translatable AI models.
Supplementary Materials
The following supporting information can be downloaded at the website of this paper posted on Preprints.org, Tables S1–S31.
Author Contributions
Conceptualization, A.A.; methodology, A.A.; software, AA.; validation, A.A.; formal analysis, A.A.; investigation, A.A.; resources, A.A.; data curation, A.A.; writing—original draft preparation, A.A.; writing—review and editing, A.A.; and N.M.; visualization, A.A.; supervision, A.A.; and NM.; project administration, A.A.; funding acquisition, A.A. All authors have read and agreed to the published version of the manuscript.
Funding
This work was supported by the Department of Science and Innovation and the Center for Scientific and Industrial Research (IBS) Programme.
Institutional Review Board Statement
The study was approved by the Sefako Makgatho Health Sciences University Research Ethics Committee (SMUREC /M/12/2022, PG).
Informed Consent Statement
Thestudy involved the analysis of publicly available, de-identified benchmark datasets. No human subjects were directly involved, and ethical review or patient consent was not required.
Data Availability Statement
All datasets used in this study are publicly available. The MedMNIST v2 datasets were obtained from their official public repository. Additional 2D and 3D segmentation datasets, including MSBench datasets, IXITiny and Medical Segmentation Decathlon (MSD) tasks, are accessible from their respective public sources. The independent chest X-ray pneumonia dataset used for cross-dataset generalization is also publicly available. All datasets were accessed from their original repositories. Detailed dataset descriptions, access information, and preprocessing settings are provided in Supplementary Table S31. No new datasets were generated during this study.
Code Availability Statement
the SULBA data augmentation code including evaluation, benchmark data augmentation implemetation and figure generation is available at the GitHub repository: https://github.com/Saintcodded/SULBA-Stepwise-Upper-and-Lower-Boundaries-Augmention.git.
Acknowledgments
The authors thank the developers and contributors of the publicly available datasets and open-source software libraries used in this study for enabling reproducible research.
Conflicts of Interest
The authors declare no conflicts of interest. The funders had no role in the design of the study; in the collection, analyses, or interpretation of data; in the writing of the manuscript; or in the decision to publish the results.
Abbreviations
The following abbreviations are used in this manuscript:
| n | Number |
| C | Cumulative |
| M | Metric |
| 2D | Two Dimension |
| 3D | Three Dimension |
| DA | Data Augmentation |
| AI | Artificial Intelligent |
| MSD | Medical Segmentation Decalthlon |
| SULBA | Stepwise Upper and Lower Boundaries Augmentation |
| AUROC | Area Under the Receiver Operating Characteristic Curve |
References
- Tian, F.; Liu, D.; Wei, N.; Fu, Q.; Sun, L.; Liu, W.; Sui, X.; Tian, K.; Nemeth, G.; Feng, J.; Xu, J. Prediction of tumor origin in cancers of unknown primary origin with cytology-based deep learning. Nature Medicine 2024, 30, 1309–19. [Google Scholar] [CrossRef]
- Kumar, R.; Kumbharkar, P.; Vanam, S.; Sharma, S. Medical images classification using deep learning: a survey. Multimedia Tools and Applications 2024, 83, 19683–728. [Google Scholar] [CrossRef]
- Ma, J.; He, Y.; Li, F.; Han, L.; You, C.; Wang, B. Segment anything in medical images. Nature Communications 2024, 15, 654. [Google Scholar] [CrossRef] [PubMed]
- Kshatri, S.S.; Singh, D. Convolutional neural network in medical image analysis: a review. Archives of Computational Methods in Engineering 2023, 30, 2793–810. [Google Scholar] [CrossRef]
- Takahashi, S.; Sakaguchi, Y.; Kouno, N.; Takasawa, K.; Ishizu, K.; Akagi, Y.; Aoyama, R.; Teraya, N.; Bolatkan, A.; Shinkai, N.; Machino, H. Comparison of vision transformers and convolutional neural networks in medical image analysis: A systematic review. Journal of Medical Systems 2024, 48, 84. [Google Scholar] [CrossRef]
- Khan, R.F.; Lee, B.D.; Lee, M.S. Transformers in medical image segmentation: a narrative review. Quantitative Imaging in Medicine and Surgery 2023, 13, 8747. [Google Scholar] [CrossRef]
- Tudosiu, P.D.; Pinaya, W.H.; Ferreira Da Costa, P.; Dafflon, J.; Patel, A.; Borges, P.; Fernandez, V.; Graham, M.S.; Gray, R.J.; Nachev, P.; Ourselin, S. Realistic morphology-preserving generative modelling of the brain. Nature Machine Intelligence 2024, 6, 811–9. [Google Scholar] [CrossRef]
- Dhar, T.; Dey, N.; Borra, S.; Sherratt, R.S. Challenges of deep learning in medical image analysis—improving explainability and trust. IEEE Transactions on Technology and Society 2023, 4, 68–75. [Google Scholar] [CrossRef]
- Price, W.N.; Cohen, I.G. Privacy in the age of medical big data. Nature medicine 2019, 25, 37–43. [Google Scholar] [CrossRef]
- Xu, C.; Coen-Pirani, P.; Jiang, X. Empirical study of overfitting in deep learning for predicting breast cancer metastasis. Cancers 2023, 15, 1969. [Google Scholar] [CrossRef]
- Azizi, S.; Culp, L.; Freyberg, J.; Mustafa, B.; Baur, S.; Kornblith, S.; Chen, T.; Tomasev, N.; Mitrović, J.; Strachan, P.; Mahdavi, S.S. Robust and data-efficient generalization of self-supervised machine learning for diagnostic imaging. Nature Biomedical Engineering 2023, 7, 756–79. [Google Scholar] [CrossRef]
- Goceri, E. Medical image data augmentation: techniques, comparisons and interpretations. Artificial intelligence review 2023, 56, 12561–605. [Google Scholar] [CrossRef] [PubMed]
- Kebaili, A.; Lapuyade-Lahorgue, J.; Ruan, S. Deep learning approaches for data augmentation in medical imaging: a review. Journal of imaging 2023, 9, 81. [Google Scholar] [CrossRef] [PubMed]
- Makhlouf, A.; Maayah, M.; Abughanam, N.; Catal, C. The use of generative adversarial networks in medical image augmentation. Neural Computing and Applications 2023, 35, 24055–68. [Google Scholar] [CrossRef]
- Wang, J.; Wang, K.; Yu, Y.; Lu, Y.; Xiao, W.; Sun, Z.; Liu, F.; Zou, Z.; Gao, Y.; Yang, L.; Zhou, H.Y. Self-improving generative foundation model for synthetic medical image generation and clinical applications. Nature Medicine 2025, 31, 609–17. [Google Scholar] [CrossRef]
- Fujii, Y.; Uchida, D.; Sato, R.; Obata, T.; Akihiro, M.; Miyamoto, K.; Morimoto, K.; Terasawa, H.; Yamazaki, T.; Matsumoto, K.; Horiguchi, S. Effectiveness of data-augmentation on deep learning in evaluating rapid on-site cytopathology at endoscopic ultrasound-guided fine needle aspiration. Scientific reports 2024, 14, 22441. [Google Scholar] [CrossRef]
- Abe, A.A.; Nyathi, M. Lung Cancer Diagnosis From Computed Tomography Images Using Deep Learning Algorithms With Random Pixel Swap Data Augmentation: Algorithm Development and Validation Study. JMIR Bioinformatics and Biotechnology 2025, 6, e68848. [Google Scholar] [CrossRef]
- Saad, M.M.; O’Reilly, R.; Rehmani, M.H. A survey on training challenges in generative adversarial networks for biomedical image analysis. Artificial Intelligence Review 2024, 57, 19. [Google Scholar] [CrossRef]
- Islam, S.; Aziz, M.T.; Nabil, H.R.; Jim, J.R.; Mridha, M.F.; Kabir, M.M.; Asai, N.; Shin, J. Generative adversarial networks (GANs) in medical imaging: Advancements, applications, and challenges. IEEE Access. 2024, 12, 35728–53. [Google Scholar] [CrossRef]
- Rao, A.; Lee, J.Y.; Aalami, O. Studying the impact of augmentations on medical confidence calibration. In InProceedings of the IEEE/CVF International Conference on Computer Vision, 2023; pp. 2462–2472. [Google Scholar]
- Sun, D.; Dornaika, F. Data augmentation for deep visual recognition using superpixel based pairwise image fusion. Information Fusion. 2024, 107, 102308. [Google Scholar] [CrossRef]
- Pineau, J.; Vincent-Lamarre, P.; Sinha, K.; Larivière, V.; Beygelzimer, A.; d'Alché-Buc, F.; Fox, E.; Larochelle, H. Improving reproducibility in machine learning research (a report from the neurips 2019 reproducibility program). Journal of machine learning research 2021, 22, 1–20. [Google Scholar]
- Paszke, A.; Gross, S.; Massa, F.; Lerer, A.; Bradbury, J.; Chanan, G.; Killeen, T.; Lin, Z.; Gimelshein, N.; Antiga, L.; Desmaison, A. Pytorch: An imperative style, high-performance deep learning library. Advances in neural information processing systems 2019, 32. [Google Scholar]
- Pérez-García, F.; Sparks, R.; Ourselin, S. TorchIO: a Python library for efficient loading, preprocessing, augmentation and patch-based sampling of medical images in deep learning. Computer methods and programs in biomedicine 2021, 208, 106236. [Google Scholar] [CrossRef] [PubMed]
- Abadi, M.; Barham, P.; Chen, J.; Chen, Z.; Davis, A.; Dean, J.; Devin, M.; Ghemawat, S.; Irving, G.; Isard, M.; Kudlur, M. {TensorFlow}: a system for {Large-Scale} machine learning. In12th USENIX symposium on operating systems design and implementation (OSDI 16), 2016; pp. 265–283. [Google Scholar]
- Shorten, C.; Khoshgoftaar, T.M. A survey on image data augmentation for deep learning. Journal of big data 2019, 6, 1–48. [Google Scholar] [CrossRef]
- Zoph, B.; Cubuk, E.D.; Ghiasi, G.; Lin, T.Y.; Shlens, J.; Le, Q.V. Learning data augmentation strategies for object detection. In InEuropean conference on computer vision; Springer International Publishing: Cham, 23 Aug 2020; pp. 566–583. [Google Scholar]
- Cohen, T.; Welling, M. Group equivariant convolutional networks. InInternational conference on machine learning, 2016 Jun 11; PMLR; pp. 2990–2999. [Google Scholar]
- Zhang, Y.; Hare, J.; Prugel-Bennett, A. Deep set prediction networks. In Advances in Neural Information Processing Systems; 2019; p. 32. [Google Scholar]
- Gerken, J.E.; Aronsson, J.; Carlsson, O.; Linander, H.; Ohlsson, F.; Petersson, C.; Persson, D. Geometric deep learning and equivariant neural networks. Artificial Intelligence Review 2023, 56, 14605–62. [Google Scholar] [CrossRef]
- Diaz-Peregrino, R.; Robles, F.T.; Gonzalez, G.; Palma, R.; Escalante-Ramirez, B.; Olveres, J.; Reyes-Gonzalez, J.P.; Gomez-Coeto, J.A.; Rodriguez-Herrera, C.A. Enhancing generalization in whole-body MRI-based deep learning models: A novel data augmentation pipeline for cross-platform adaptation. Intelligence-Based Medicine 2025, 100277. [Google Scholar] [CrossRef]
- Yang, J.; Shi, R.; Wei, D.; Liu, Z.; Zhao, L.; Ke, B.; Pfister, H.; Ni, B. Medmnist v2-a large-scale lightweight benchmark for 2d and 3d biomedical image classification. Scientific Data 2023, 10, 41. [Google Scholar] [CrossRef]
- Kuş, Z.; Aydin, M. MedSegBench: A comprehensive benchmark for medical image segmentation in diverse data modalities. Scientific Data 2024, 11, 1283. [Google Scholar] [CrossRef]
- Antonelli, M.; Reinke, A.; Bakas, S.; Farahani, K.; Kopp-Schneider, A.; Landman, B.A.; Litjens, G.; Menze, B.; Ronneberger, O.; Summers, R.M.; Van Ginneken, B. The medical segmentation decathlon. Nature communications 2022, 13, 4128. [Google Scholar] [CrossRef]
- Deng, J.; Dong, W.; Socher, R.; Li, L.J.; Li, K.; Fei-Fei, L. Imagenet: A large-scale hierarchical image database. In2009 IEEE conference on computer vision and pattern recognition, 2009 Jun 20; Ieee; pp. 248–255. [Google Scholar]
- Kermany, D.S.; Goldbaum, M.; Cai, W.; Valentim, C.C.; Liang, H.; Baxter, S.L.; McKeown, A.; Yang, G.; Wu, X.; Yan, F.; Dong, J. Identifying medical diagnoses and treatable diseases by image-based deep learning. cell. 2018, 172, 1122–31. [Google Scholar] [CrossRef]
- He, K.; Zhang, X.; Ren, S.; Sun, J. Deep residual learning for image recognition. In InProceedings of the IEEE conference on computer vision and pattern recognition, 2016; pp. 770–778. [Google Scholar]
- Liu, Z.; Lin, Y.; Cao, Y.; Hu, H.; Wei, Y.; Zhang, Z.; Lin, S.; Guo, B. Swin transformer: Hierarchical vision transformer using shifted windows. In InProceedings of the IEEE/CVF international conference on computer vision, 2021; pp. 10012–10022. [Google Scholar]
- Tran, D.; Wang, H.; Torresani, L.; Ray, J.; LeCun, Y.; Paluri, M. A closer look at spatiotemporal convolutions for action recognition. In InProceedings of the IEEE conference on Computer Vision and Pattern Recognition, 2018; pp. 6450–6459. [Google Scholar]
- Liu, Z.; Ning, J.; Cao, Y.; Wei, Y.; Zhang, Z.; Lin, S.; Hu, H. Video swin transformer. In InProceedings of the IEEE/CVF conference on computer vision and pattern recognition, 2022; pp. 3202–3211. [Google Scholar]
- Kay, W.; Carreira, J.; Simonyan, K.; Zhang, B.; Hillier, C.; Vijayanarasimhan, S.; Viola, F.; Green, T.; Back, T.; Natsev, P.; Suleyman, M. The kinetics human action video dataset. arXiv 2017, arXiv:1705.06950. [Google Scholar] [CrossRef]
- Ronneberger, O.; Fischer, P.; Brox, T. U-net: Convolutional networks for biomedical image segmentation. In InInternational Conference on Medical image computing and computer-assisted intervention; Springer international publishing: Cham, 2015; pp. 234–241. [Google Scholar]
- Xie, E.; Wang, W.; Yu, Z.; Anandkumar, A.; Alvarez, J.M.; Luo, P. SegFormer: Simple and efficient design for semantic segmentation with transformers. Advances in neural information processing systems 2021, 34, 12077–90. [Google Scholar]
- Çiçek, Ö.; Abdulkadir, A.; Lienkamp, S.S.; Brox, T.; Ronneberger, O. 3D U-Net: learning dense volumetric segmentation from sparse annotation. In InInternational conference on medical image computing and computer-assisted intervention; Springer International Publishing: Cham, 2 Oct 2016; pp. 424–432. [Google Scholar]
- Hatamizadeh, A.; Nath, V.; Tang, Y.; Yang, D.; Roth, H.R.; Xu, D. Swin unetr: Swin transformers for semantic segmentation of brain tumors in mri images. In InInternational MICCAI brainlesion workshop; Springer International Publishing: Cham, 27 Sep 2021; pp. 272–284. [Google Scholar]
- Cardoso, M.J.; Li, W.; Brown, R.; Ma, N.; Kerfoot, E.; Wang, Y.; Murrey, B.; Myronenko, A.; Zhao, C.; Yang, D.; Nath, V. Monai: An open-source framework for deep learning in healthcare. arXiv 2022, arXiv:2211.02701. [Google Scholar] [CrossRef]
- Howard, A.; Sandler, M.; Chu, G.; Chen, L.C.; Chen, B.; Tan, M.; Wang, W.; Zhu, Y.; Pang, R.; Vasudevan, V.; Le, Q.V. Searching for mobilenetv3. In InProceedings of the IEEE/CVF international conference on computer vision, 2019; pp. 1314–1324. [Google Scholar]
- Mehta, S.; Rastegari, M. Mobilevit: light-weight, general-purpose, and mobile-friendly vision transformer. arXiv 2021, arXiv:2110.02178. [Google Scholar]
- Zhong, Z.; Zheng, L.; Kang, G.; Li, S.; Yang, Y. Random erasing data augmentation. InProceedings of the AAAI conference on artificial intelligence 2020, Vol. 34(No. 07), 13001–13008. [Google Scholar] [CrossRef]
- DeVries, T.; Taylor, G.W. Improved regularization of convolutional neural networks with cutout. arXiv 2017, arXiv:1708.04552. [Google Scholar] [CrossRef]
- Yun, S.; Han, D.; Oh, S.J.; Chun, S.; Choe, J.; Yoo, Y. Cutmix: Regularization strategy to train strong classifiers with localizable features. In InProceedings of the IEEE/CVF international conference on computer vision, 2019; pp. 6023–6032. [Google Scholar]
- Zhang, H.; Cisse, M.; Dauphin, Y.N.; Lopez-Paz, D. mixup: Beyond empirical risk minimization. arXiv 2017, arXiv:1710.09412. [Google Scholar]
- Billot, B.; Robinson, E.; Dalca, A.V.; Iglesias, J.E. Partial volume segmentation of brain MRI scans of any resolution and contrast. In InInternational Conference on Medical image computing and computer-assisted intervention; Springer International Publishing: Cham, 29 Sep 2020; pp. 177–187. [Google Scholar]
- Sudre, CH; Cardoso, MJ; Ourselin, S; Alzheimer’s Disease Neuroimaging Initiative. Longitudinal segmentation of age-related white matter hyperintensities. Medical Image Analysis 2017, 38, 50–64. [Google Scholar] [CrossRef]
- Shackleford, J.; Kandasamy, N.; Sharp, G. High performance deformable image registration algorithms for manycore processors; Newnes, 2013; pp. pp1–12. [Google Scholar]
- Goceri, E. Medical image data augmentation: techniques, comparisons and interpretations. Artificial intelligence review 2023, 56, 12561–605. [Google Scholar] [CrossRef]
- Zhao, M.; Wei, Y.; Lu, Y.; Wong, K.K. A novel U-Net approach to segment the cardiac chamber in magnetic resonance images with ghost artifacts. Computer Methods and Programs in Biomedicine 2020, 196, 105623. [Google Scholar] [CrossRef]
- Kumar, T.; Brennan, R.; Mileo, A.; Bendechache, M. Image data augmentation approaches: A comprehensive survey and future directions. IEEE Access, 2024 Sep 30. [Google Scholar]
- Cubuk, E.D.; Zoph, B.; Mane, D.; Vasudevan, V.; Le, Q.V. Autoaugment: Learning augmentation strategies from data. In InProceedings of the IEEE/CVF conference on computer vision and pattern recognition, 2019; pp. 113–123. [Google Scholar]
- Theodoris, C.V.; Xiao, L.; Chopra, A.; Chaffin, M.D.; Al Sayed, Z.R.; Hill, M.C.; Mantineo, H.; Brydon, E.M.; Zeng, Z.; Liu, X.S.; Ellinor, P.T. Transfer learning enables predictions in network biology. Nature 2023, 618, 616–24. [Google Scholar] [CrossRef]
- Sabha, S.U.; Assad, A.; Din, N.M.; Bhat, M.R. From scratch or pretrained? An in-depth analysis of deep learning approaches with limited data. International Journal of System Assurance Engineering and Management 2024, 1–0. [Google Scholar] [CrossRef]
- Jiménez-Sánchez, A.; Avlona, N.R.; de Boer, S.; Campello, V.M.; Feragen, A.; Ferrante, E.; Ganz, M.; Gichoya, J.W.; Gonzalez, C.; Groefsema, S.; Hering, A. In the picture: Medical imaging datasets, artifacts, and their living review. In InProceedings of the 2025 ACM Conference on Fairness, Accountability, and Transparency, 2025; pp. 511–531. [Google Scholar]
- Dulaney, A.; Virostko, J. Disparities in the demographic composition of The Cancer Imaging Archive. Radiology: Imaging Cancer 2024, 6, e230100. [Google Scholar] [CrossRef]
Figure 1.
Conceptual overview and visual examples of Stepwise Upper and Lower Boundaries Augmentation (SULBA). a, Illustration of the SULBA operation applied along the height dimension of 2D medical images. b, Illustration of the SULBA operation applied along the width dimension of 2D medical images. c, Paired example showing SULBA applied along the height dimension to a 2D chest computed tomography scan (top) and its synchronously transformed tumor segmentation mask (bottom), demonstrating pixel-perfect alignment. d, Paired example showing the same principle applied in c along the width dimension, confirming the dimension-agnostic nature of the transformation. For all panels, the original image or mask is shown in the first column, with three distinct augmented outputs (generated using different random step sizes) shown in columns 2–4. SULBA performs a deterministic cyclic shift of image regions, preserving all anatomical content while transforming global structure.
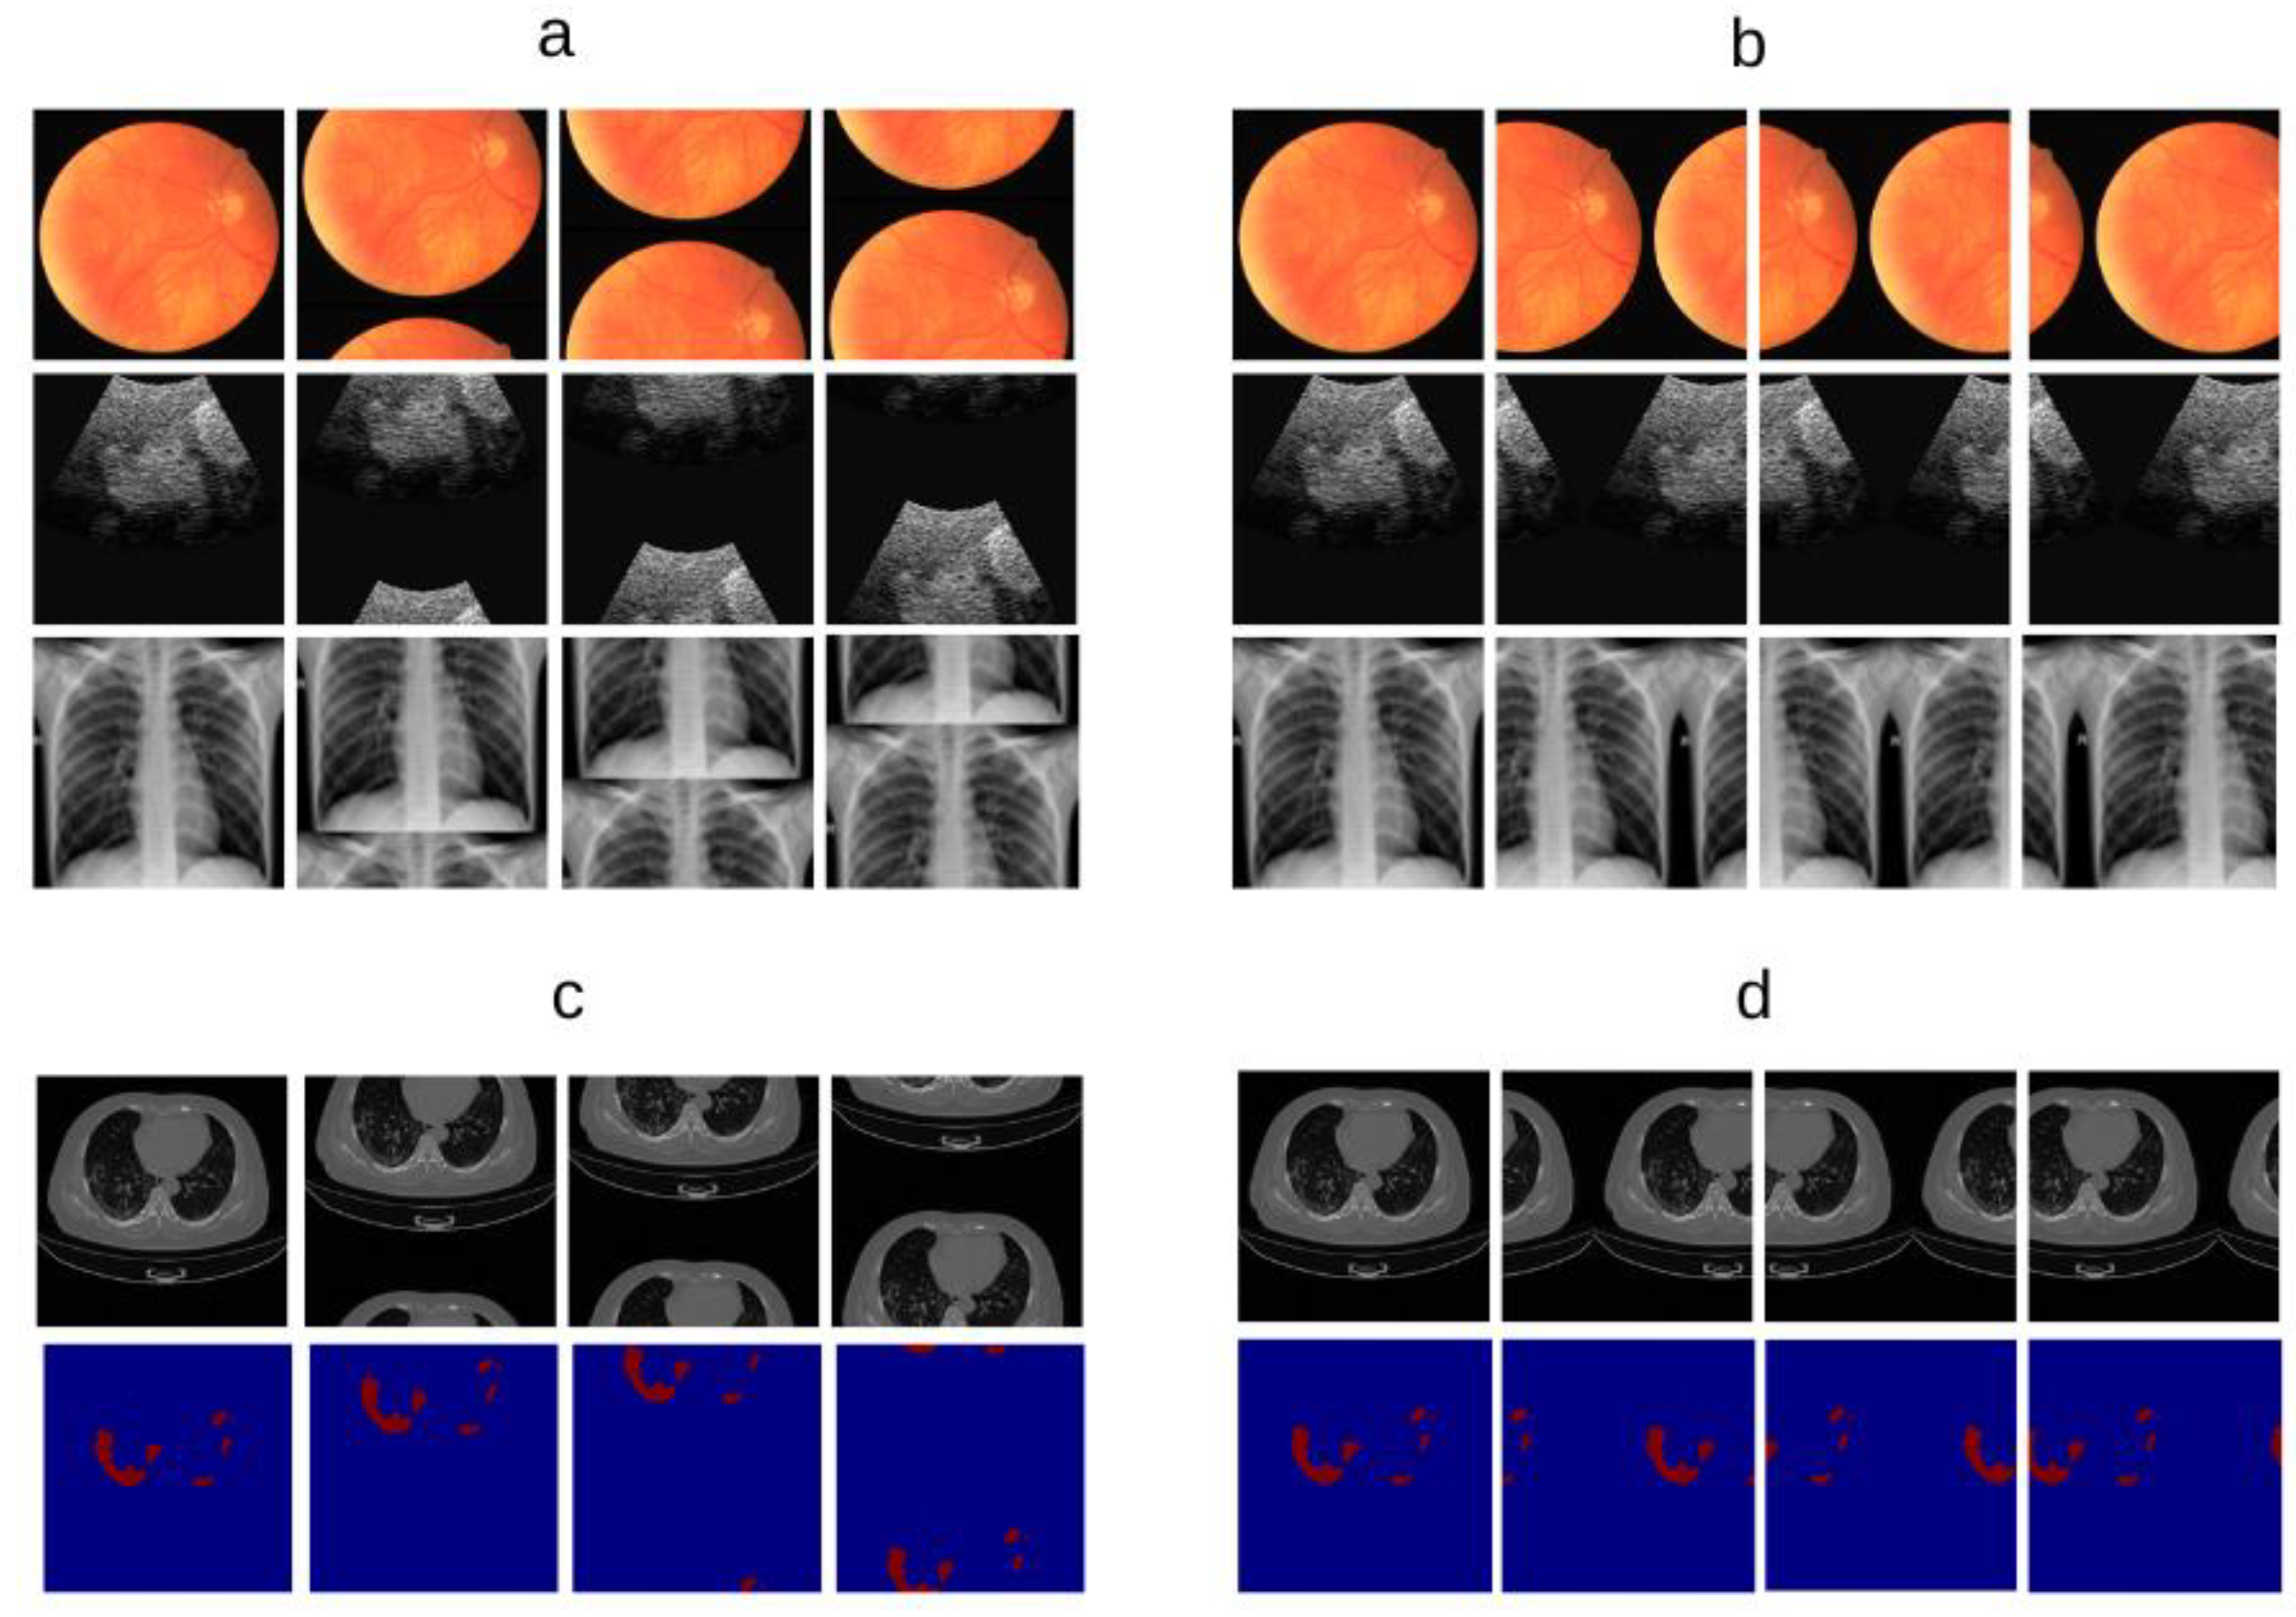
Figure 2.
Benchmark performance of SULBA on 2D medical image classification. a, Heatmap showing the aggregated performance improvement (averaged across ResNet-18 and Swin Transformer Tiny) for each data augmentation method (p = application probabilty) relative to a non-augmented baseline across ten 2D MedMNIST datasets. b, Percentage improvement over the baseline for each method, shown separately for the ResNet-18 (solid bars) and Swin Transformer (hatched bars) architectures (mean ± 95% CI). c, Mean relative improvement for each method across all datasets and architectures (mean ± 95% CI). d, Overall performance ranking based on the sum of scores across all datasets and architectures. e, Performance comparison of SULBA variants and their combinations with traditional spatial augmentations (Horizontal Flip, Rotation, Vertical Flip). f, Impact on performance (percentage change) when combining SULBA variants with traditional augmentation techniques.
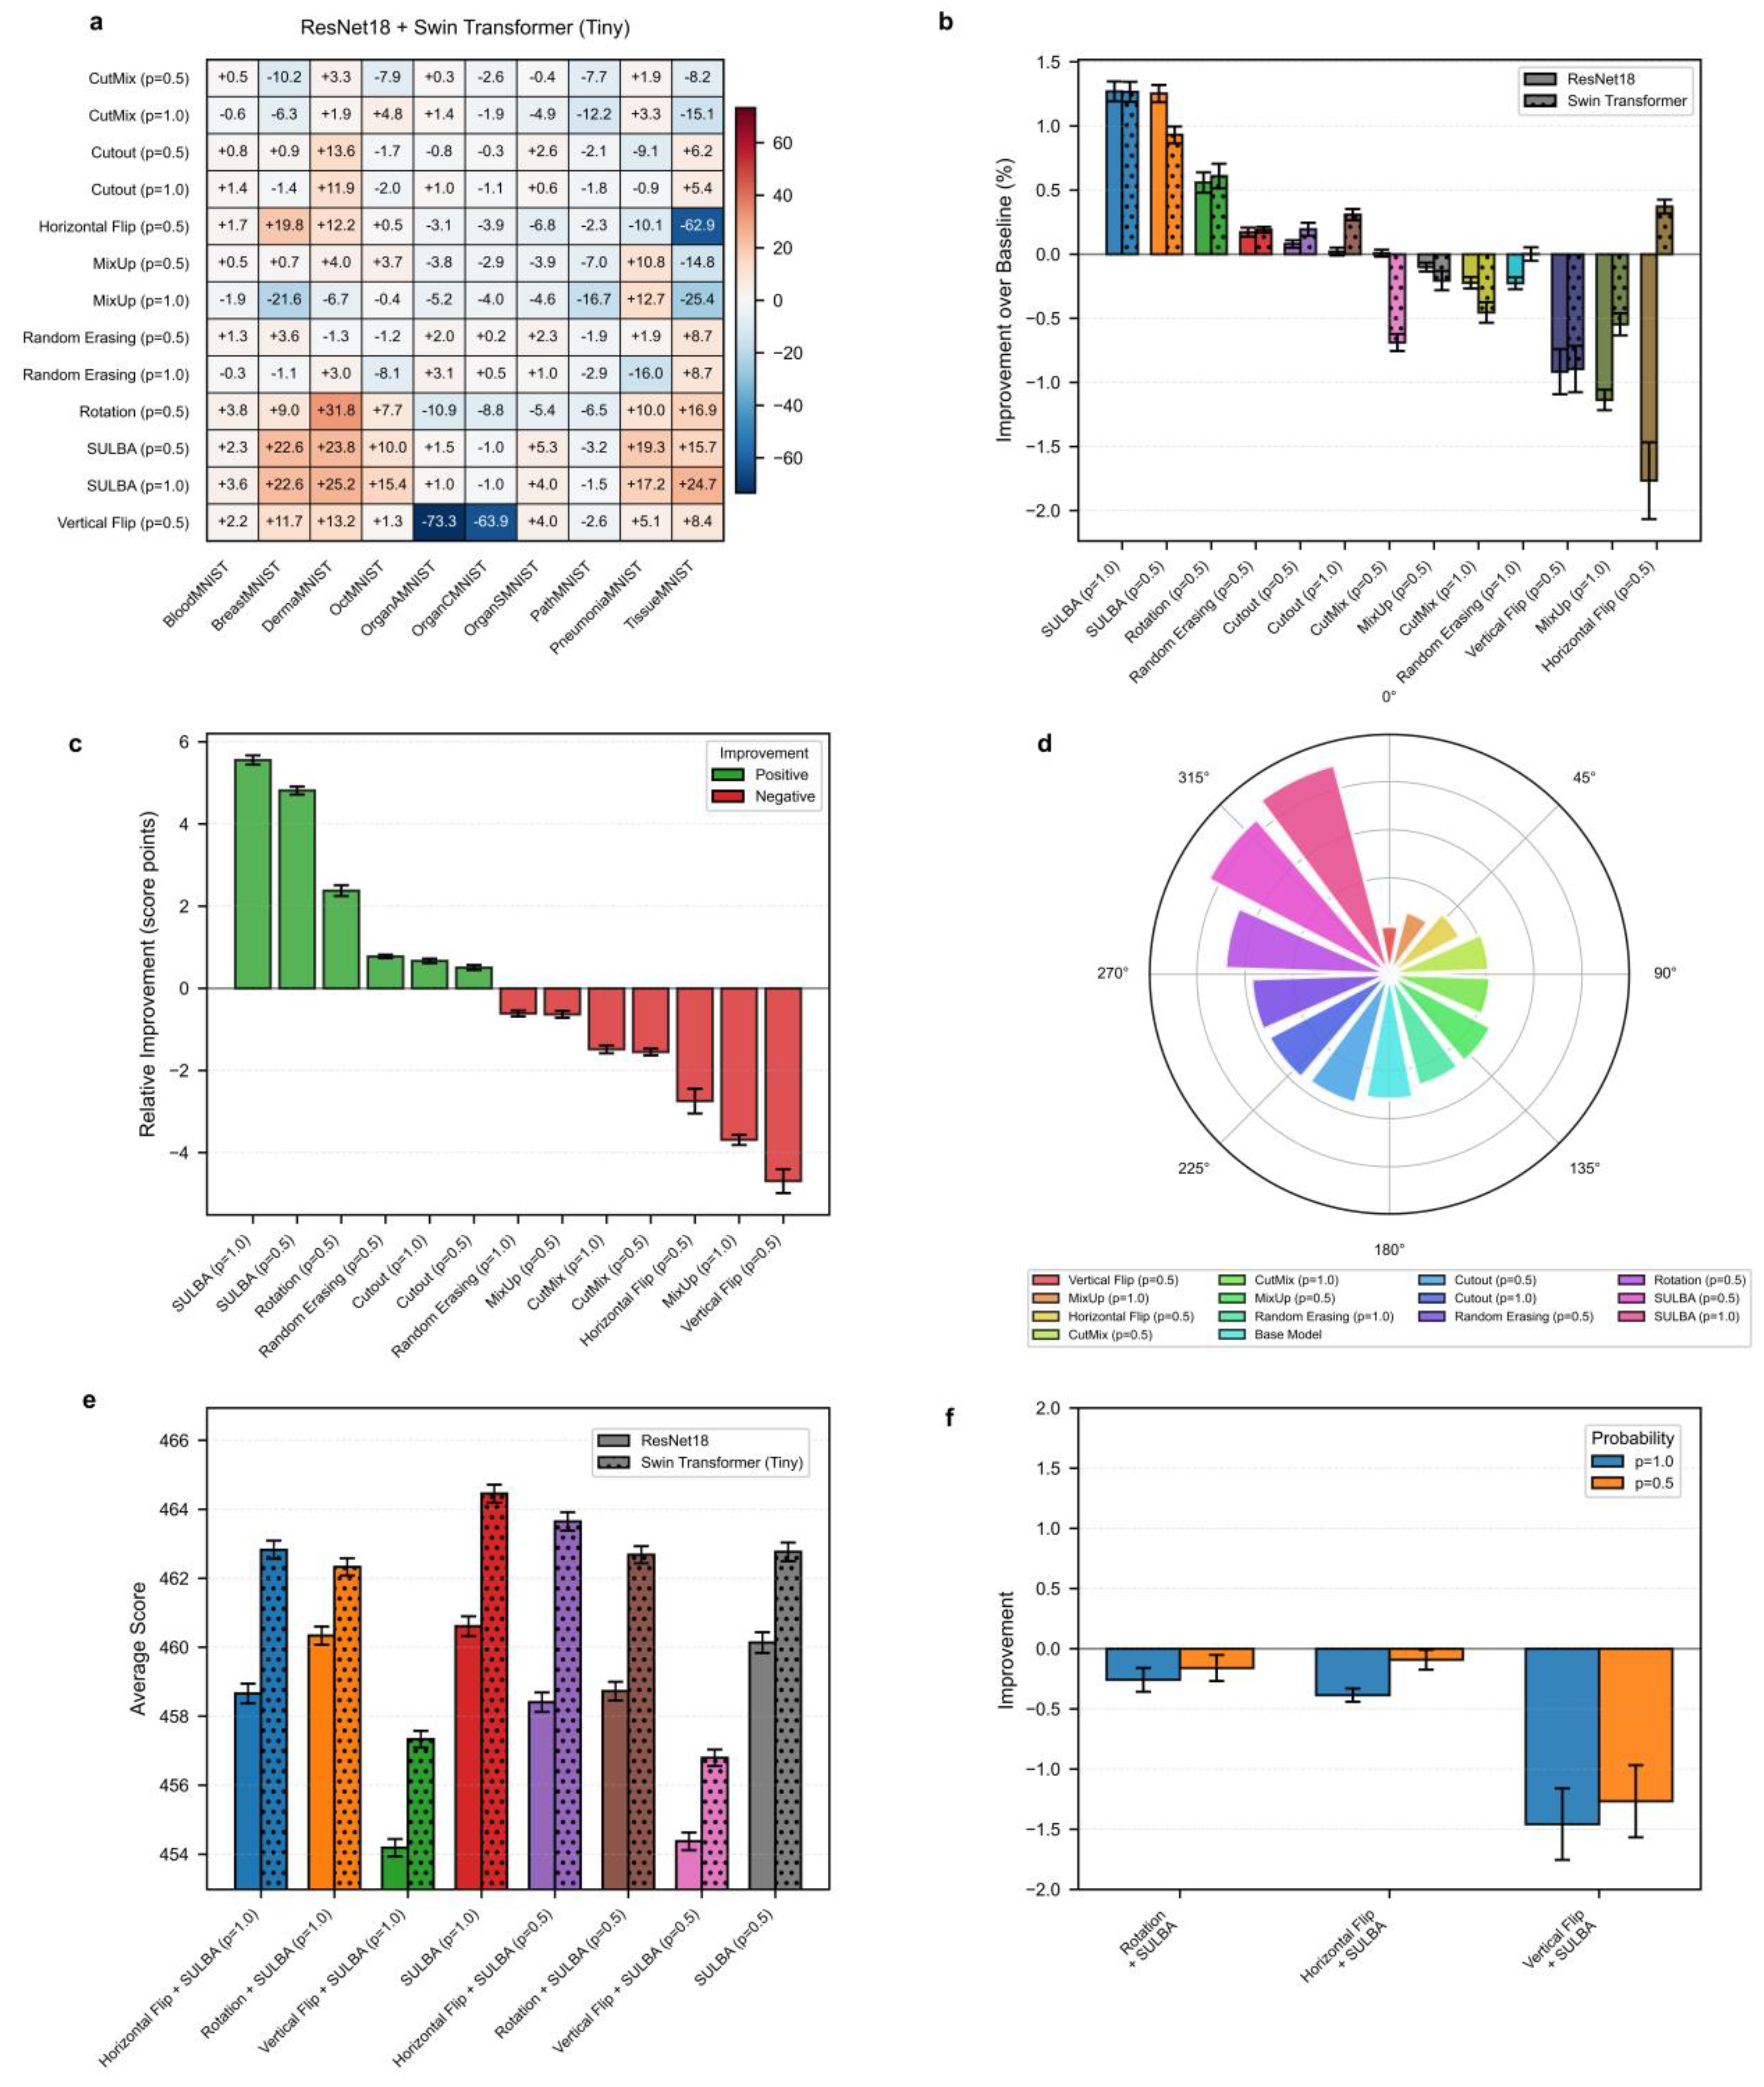
Figure 3.
Benchmark performance of SULBA on 3D medical image classification. a, Heatmap of the aggregated improvement for each volumetric augmentation method (p = application probabilty) across six 3D MedMNIST datasets, averaged across R(2+1)D-18 and 3D Swin Transformer models. b, Percentage improvement for each method shown separately for the two architectures (mean ± 95% CI). c, Mean relative improvement for each method (mean ± 95% CI). d, Circular ranking plot displaying the total aggregated score for each method across all 3D classification experiments.
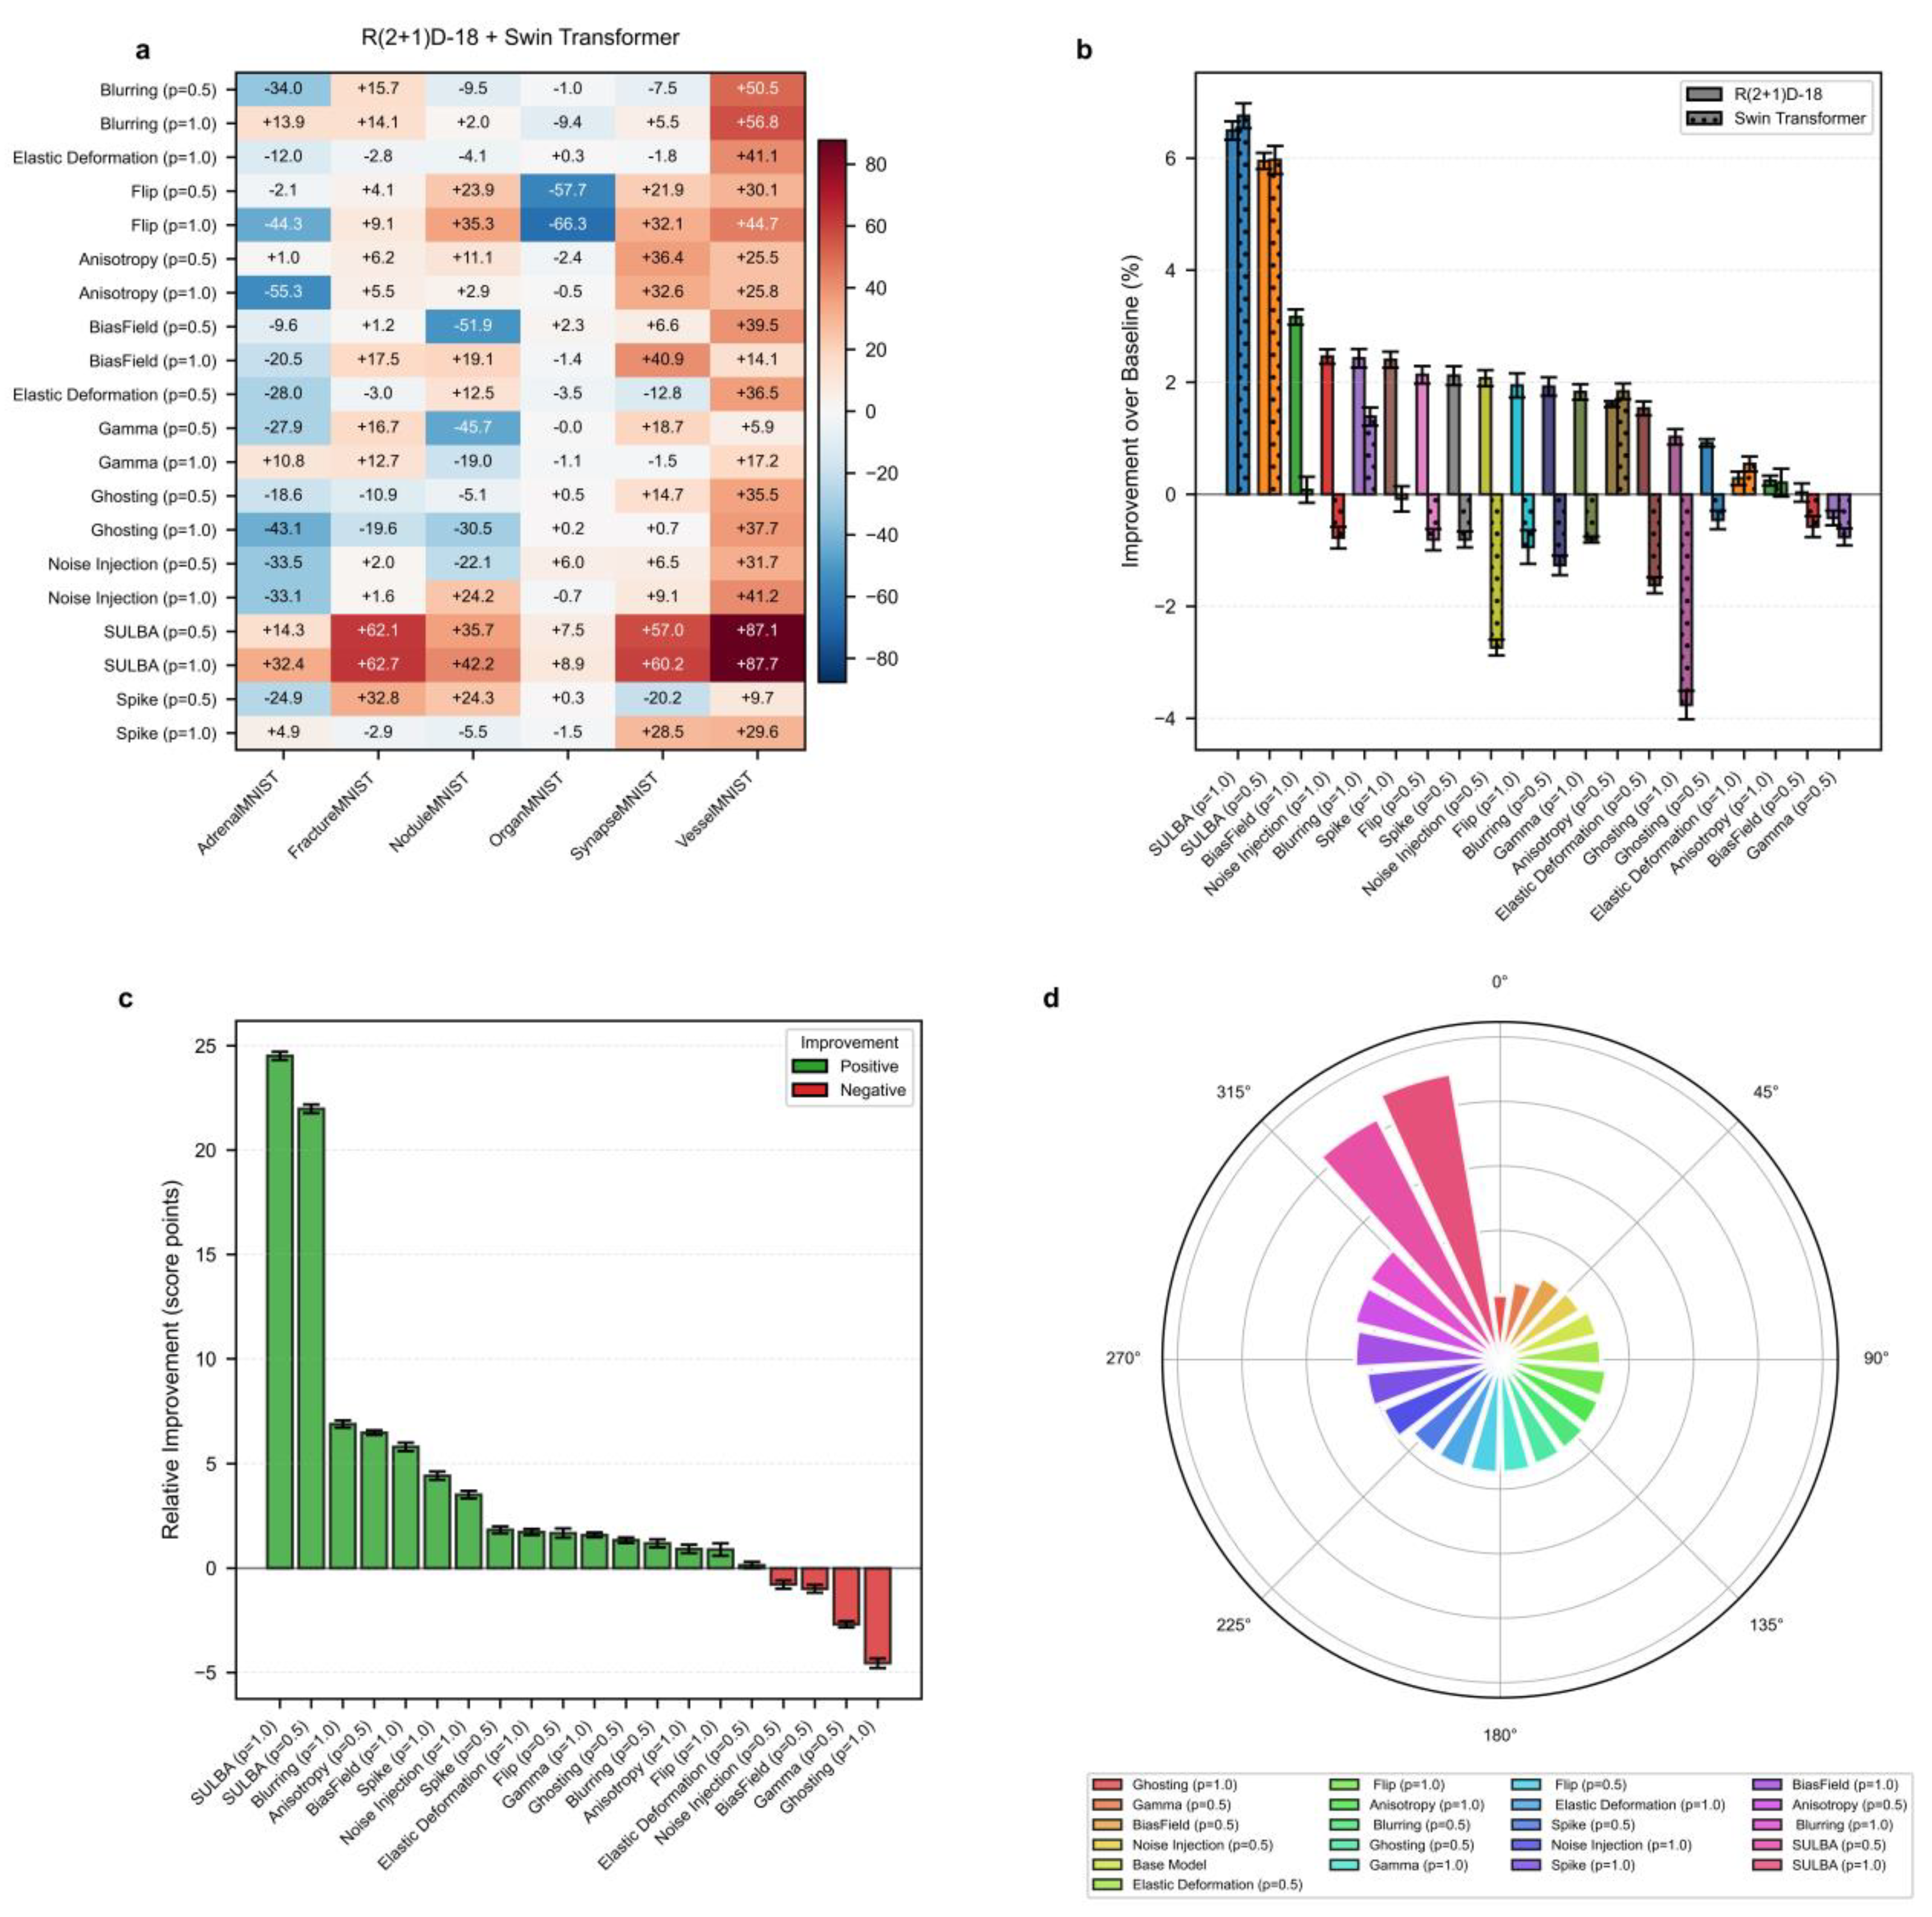
Figure 4.
Benchmark performance of SULBA on 2D medical image segmentation. a, Heatmap of performance improvement for each augmentation method (p = application probabilty) across seven 2D segmentation datasets, averaged across ResNet-18-based U-Net and SegFormer models. b, Architecture-specific percentage improvement for the two segmentation backbones (mean ± 95% CI). c, Mean relative improvement for each method (mean ± 95% CI). d, Overall performance ranking of all methods based on total aggregated score. e, Performance of SULBA variants and their combinations with traditional augmentations. f, Impact on performance when combining SULBA variants with traditional techniques.
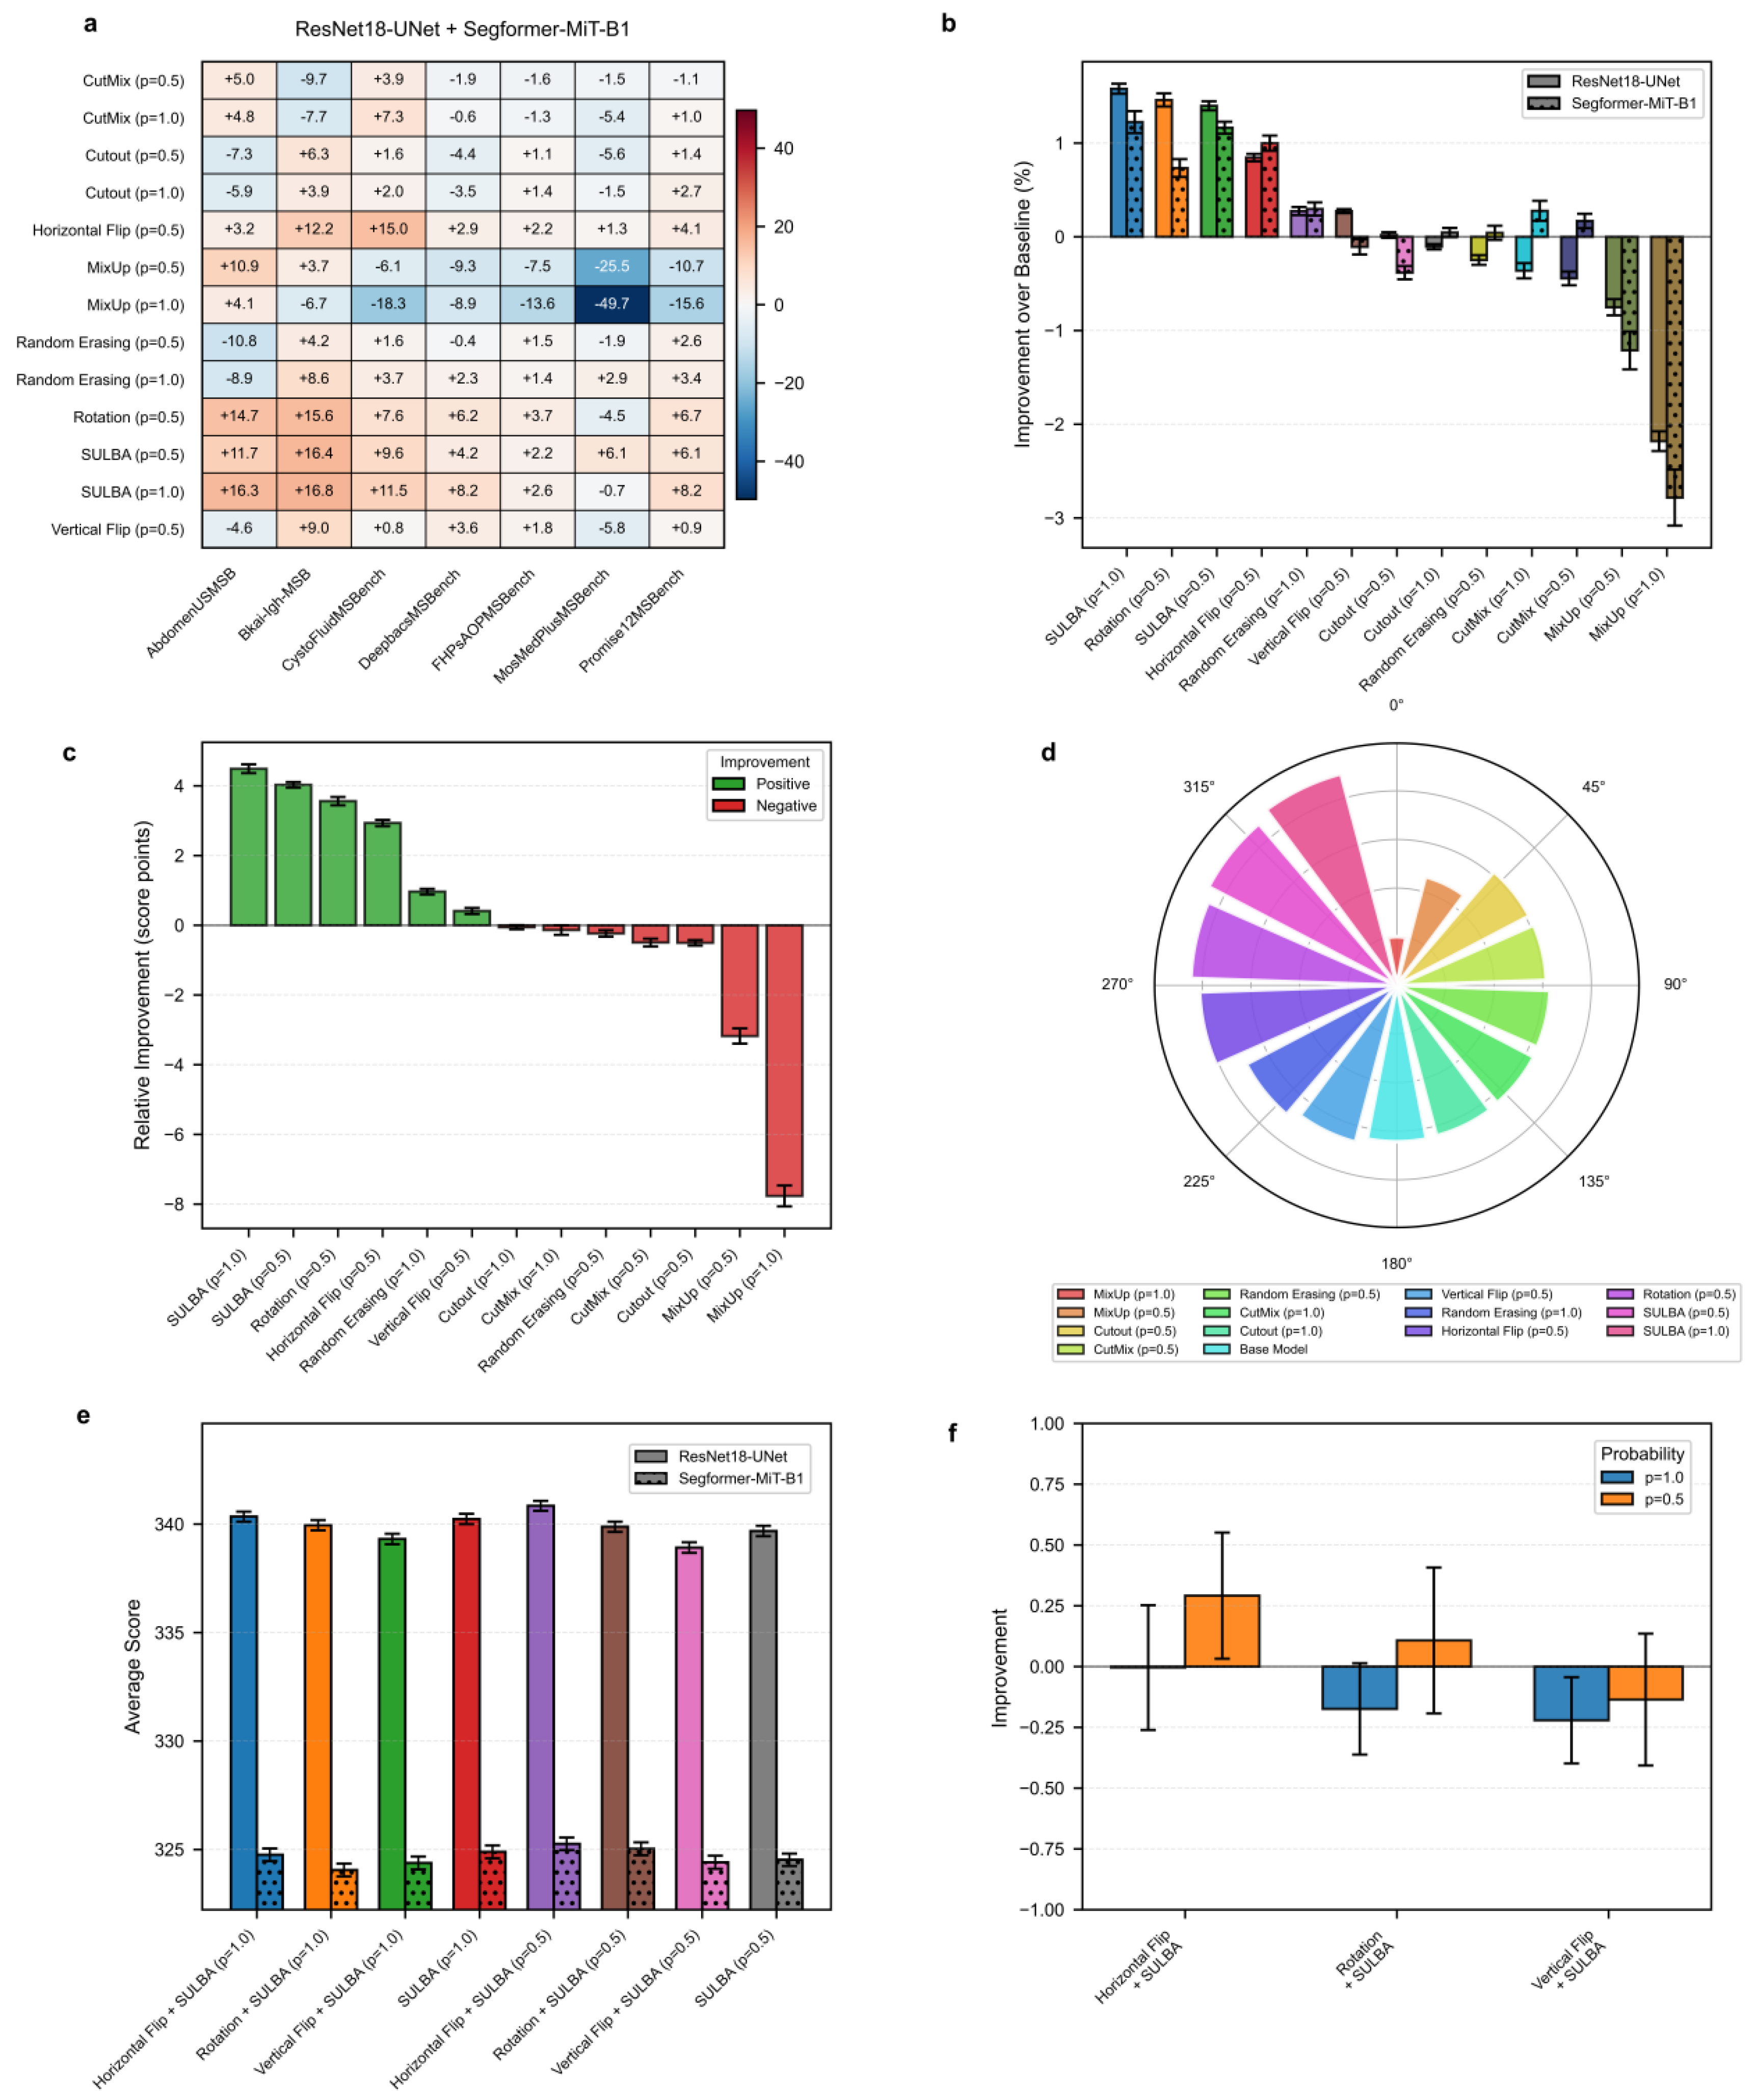
Figure 5.
Benchmark performance of SULBA on 3D medical image segmentation. a, Heatmap of improvement for each volumetric augmentation method (p = application probabilty) across three 3D segmentation datasets (IXITiny, Medical Segmentation Decathlon-Heart and Hippocampus), averaged across 3D U-Net and SwinUNETR. b, Percentage improvement shown separately for the two 3D segmentation architectures (mean ± 95% CI). c, Mean relative improvement for each method (mean ± 95% CI). d, Overall performance ranking based on total aggregated score across all 3D segmentation experiments.
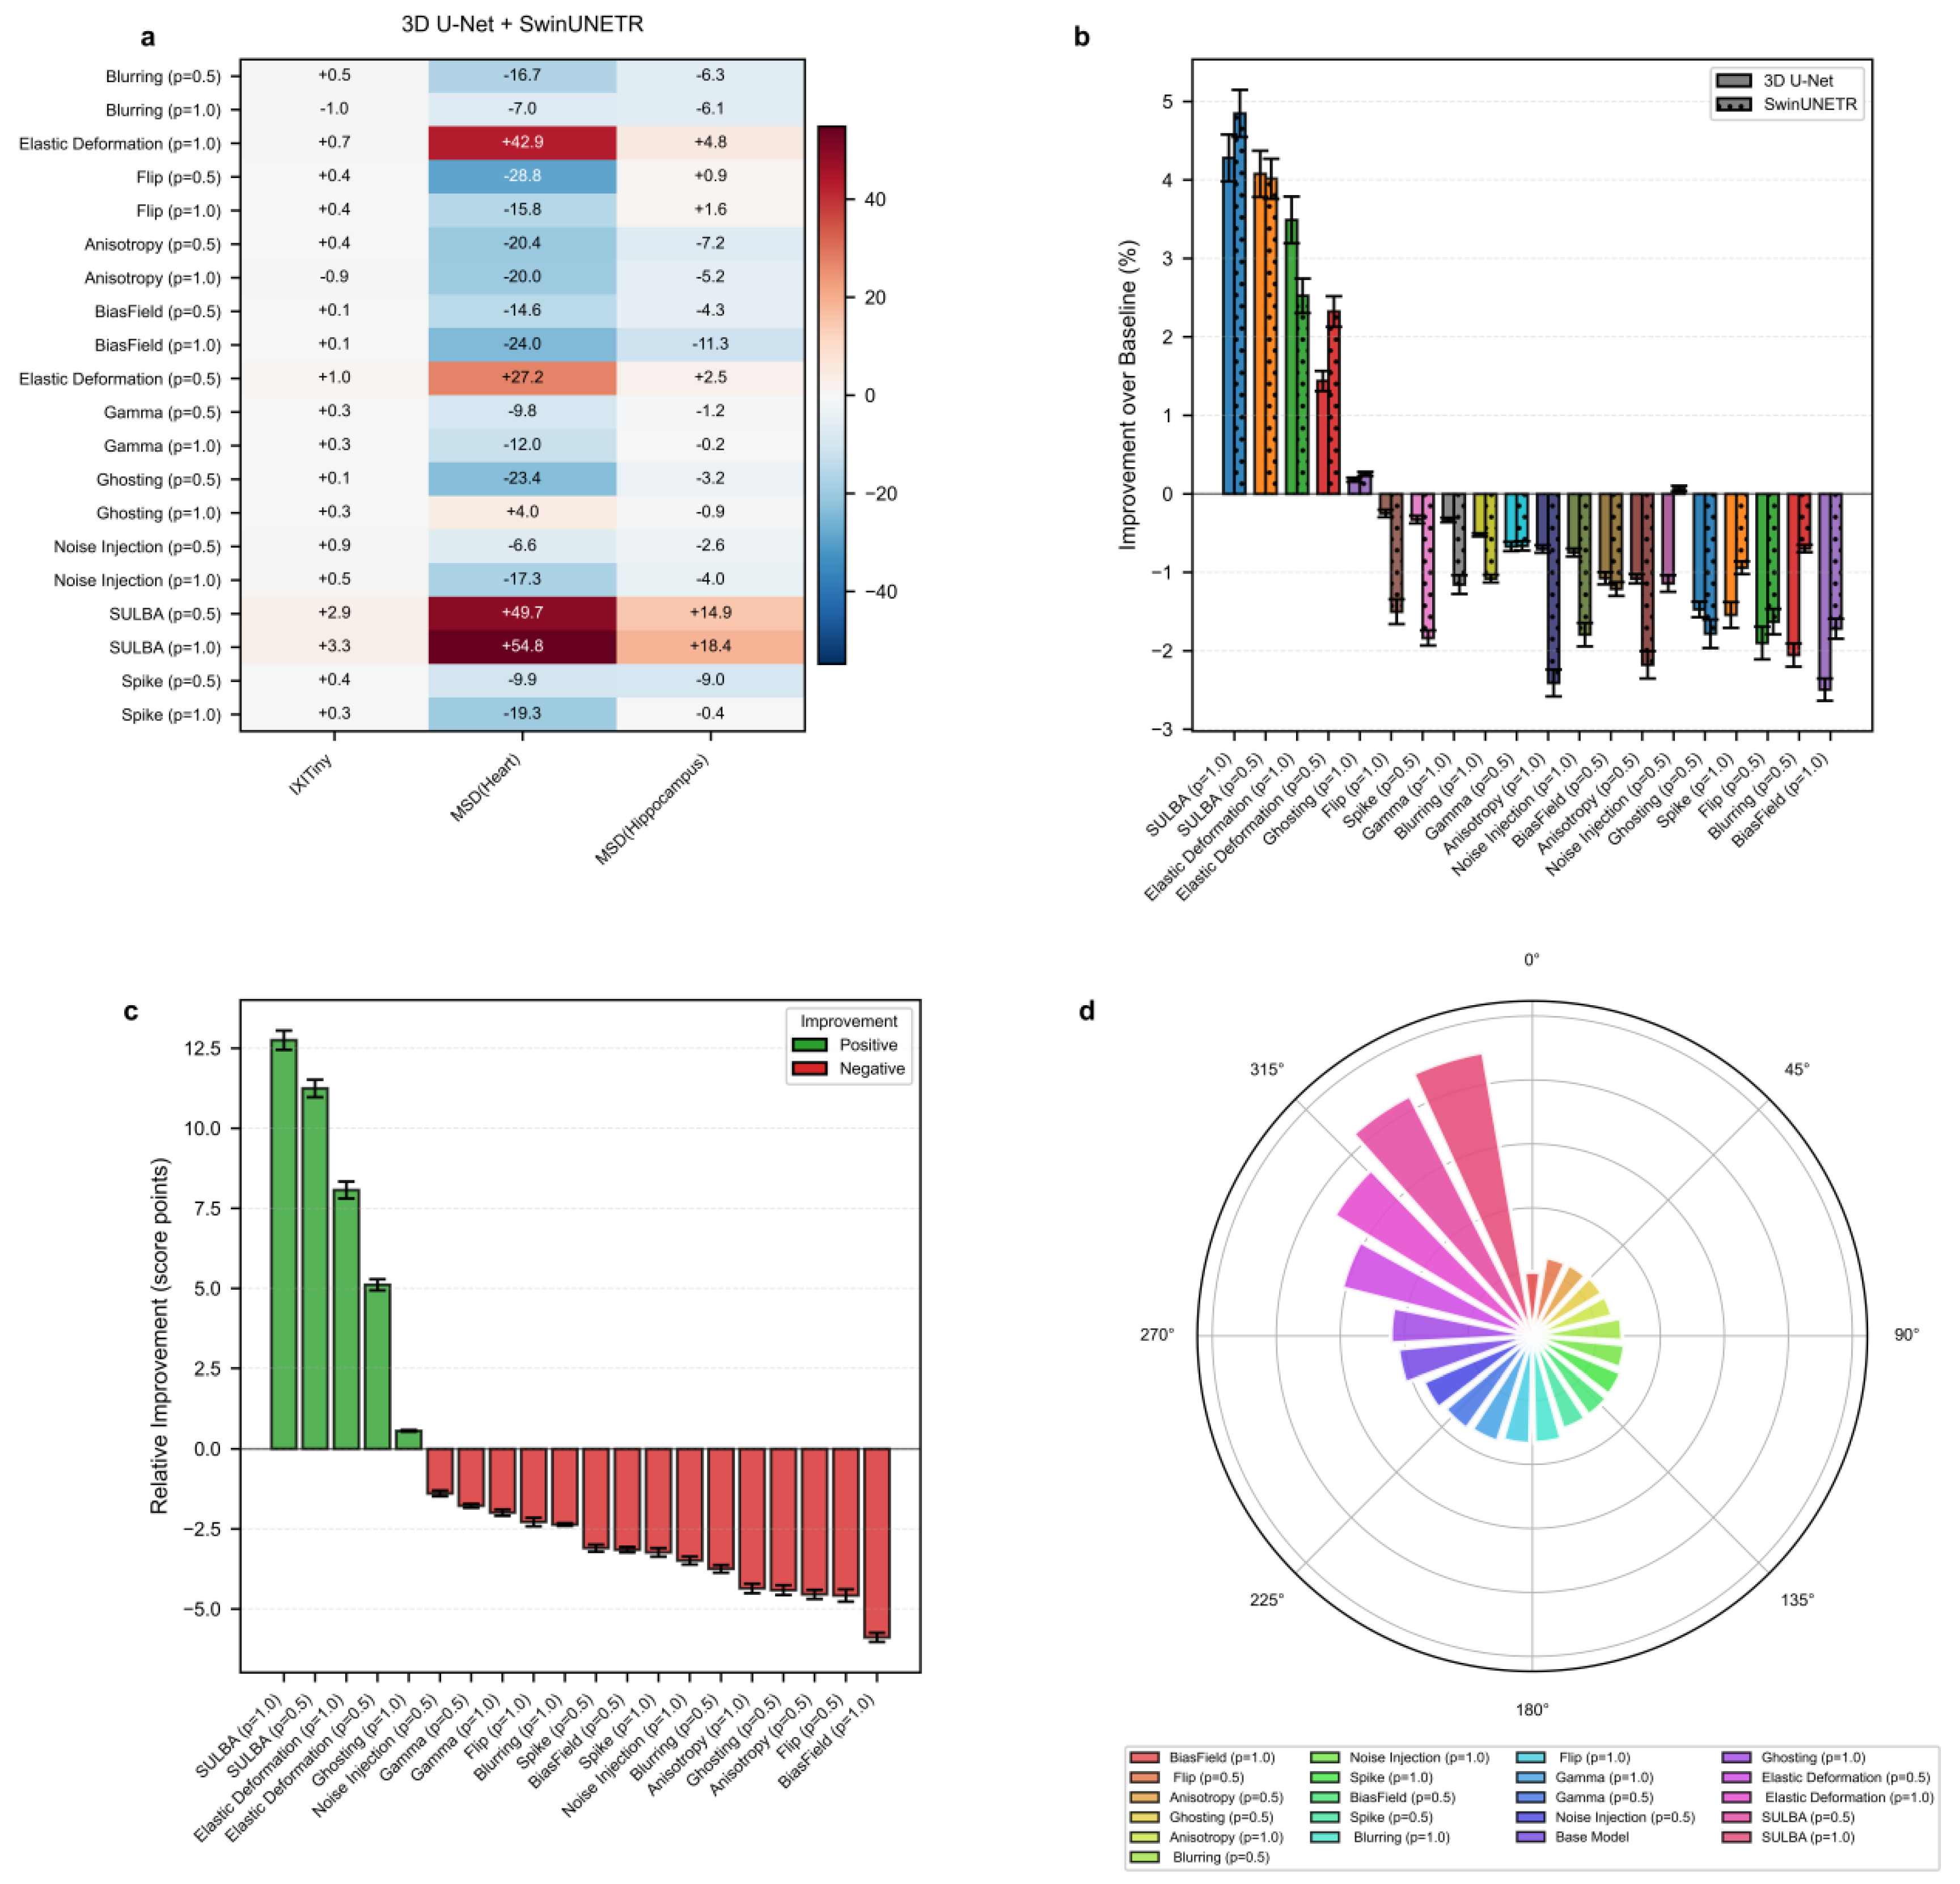
Figure 6.
Generalization performance of SULBA across diverse neural architectures. a, Heatmap of the composite performance score for each augmentation method (p = application probabilty) across eight neural network architectures (including randomly initialized and pre-trained variants of ResNet-18, Swin Transformer (Tiny), MobileNet V3 (small variant), and MobileViT_xxs) in a cross-dataset pneumonia classification task. b, Distribution of composite scores for each method across all architectures, displayed as box plots (median, quartiles, range); the coefficient of variation (CV) for each method is annotated. c, Mean composite score for each augmentation method (mean ± 95% CI). d, Stacked bar chart showing the contribution of each architecture to the total composite score for each method. e, Performance difference (randomly initialized models and pre-trained models) for each augmentation method. f, Circular ranking plot of the total composite score for each method across all architectures in the generalization benchmark.
Disclaimer/Publisher’s Note: The statements, opinions and data contained in all publications are solely those of the individual author(s) and contributor(s) and not of MDPI and/or the editor(s). MDPI and/or the editor(s) disclaim responsibility for any injury to people or property resulting from any ideas, methods, instructions or products referred to in the content. |
© 2026 by the authors. Licensee MDPI, Basel, Switzerland. This article is an open access article distributed under the terms and conditions of the Creative Commons Attribution (CC BY) license (http://creativecommons.org/licenses/by/4.0/).
Copyright: This open access article is published under a Creative Commons CC BY 4.0 license, which permit the free download, distribution, and reuse, provided that the author and preprint are cited in any reuse.


