Submitted:
15 January 2026
Posted:
20 January 2026
You are already at the latest version
Abstract
The development of new energy technologies is crucial for the future competitiveness of the automotive industry. Green innovation is a key driver of industrial transformation and advancement. Companies in the new energy vehicle (NEV) sector play a critical role in the automotive supply chain and demonstrate their green innovation capabilities across the industry. The dual-credit policy, a major governmental regulatory incentive, has a significant impact on the innovation performance of NEVs. Therefore, it is important to examine its influence on green innovation outcomes. This study is grounded in institutional theory and the resource-based view, and informed by the TOE (Technology-Organization-Environment) analytical framework. It aims to develop a theoretical model to investigate the interplay among technological, organizational, and environmental factors in fostering green innovation. Using panel data from 21 NEV companies spanning the period 2014–2024, the research employs the dynamic fuzzy-set Qualitative Comparative Analysis (fsQCA) method to identify causal configurations associated with high green innovation performance. The results show that no single factor is necessary for achieving superior outcomes. Configuration analysis reveals 3 dominant pathways: the “Technology-driven+Environment-pulled” pathway, the “Technology-driven+Organizational collaboration” pathway and the ”Technology-organization-environment tripartite linkage“ pathway. This study advances theoretical understanding by moving beyond unidimensional analyses and offering a holistic perspective on the multiple equifinal paths to high green innovation performance. It also provides practical insights for NEV firms to strategically align their technological, organizational, and environmental resources to enhance green innovation performance.
Keywords:
dual-credit policy
; green innovation performance
; TOE framework
; institutional theory
; resource theory
1. Introduction
As a rapidly growing strategic industry, the new energy vehicle sector has received consistent support from the government in the form of financial subsidies and tax incentives. These measures are aimed at promoting green innovation capabilities. In addition to these initiatives, the Dual-Credit Policy was officially implemented in 2018. This policy effectively encourages enterprise innovation by combining positive incentives with regulatory constraints. Current research on the Dual-Credit Policy can be divided into two main areas. One focuses on its role as an external environmental pressure that motivates companies to invest in research and development and prioritize social responsibility, ultimately leading to improved green innovation performance(Hou, Bello-Pintado,& Teresa García-Marco,2025). The other examines its impact on green technological innovation and business performance, with findings consistently showing a significant positive
effect on enterprise-level innovation outcomes(Wang, et al.,2021). As the government implements the dual-credit policy, it has led to a decrease in intrinsic innovation motivation among electric car manufacturers and an increase in instances of subsidy-related fraud. Evidence of these effects has emerged, including a lack of motivation for innovation and instances of fraud related to subsidies. However, green innovation arises from the interplay of internal resources and external environmental factors within enterprises, as well as from the collaborative efforts of multiple stakeholders
(Aguilera-Caracuel, & Ortiz-De-Mandojana, 2013). Therefore, a
single-dimensional perspective is inadequate to fully elucidate the complex mechanisms underlying green innovation in new energy vehicle enterprises. The configuration perspective enables an exploration of the intricate mechanisms
through which systems achieve organizational objectives
via the interplay of multiple factors. Consequently, adopting this perspective facilitates a systematic investigation into
the complex dynamics underlying green innovation in new energy vehicle enterprises. New energy enterprises can be categorized into upstream and downstream entities based
on their positions within the supply chain. As key players in the new energy vehicle sector, these enterprises exhibit dual roles as both leaders and integral nodes within the automotive industry supply chain. Their green innovation performance demonstrates a characteristic of full-chain penetration. While existing research has predominantly focused on the impact of the dual-credit policy on green technological innovation among upstream enterprises, scholarly attention to the green innovation performance of downstream manufacturers remains relatively limited.
Therefore, this study selects 21 A-share listed new energy vehicle enterprises as research subjects, constructs a theoretical model grounded in institutional theory and resource theory, and integrates the TOE analytical framework to explore, through dynamic fsQCA, the complex mechanisms underlying the interaction of multiple factors influencing the green innovation performance of new energy vehicle enterprises. This research not only contributes to a deeper understanding of the developmental pathways and driving forces behind green innovation performance in this sector but also offers theoretical support for policymakers in designing effective incentive mechanisms.
2. Theory and Model
2.1. Institutional Theory
Di Maggio and Powell (1983) summarized the impact of the institutional environment on corporate behavior as institutional pressure, which includes mandatory, imitative, and normative pressures. As this theory has evolved, research has shown that the external environment faced by organizations is not singular and stable, but rather a complex situation composed of interwoven institutional logics (Pece et al., 2012). The environmental factors that influence the green innovation performance of new energy vehicle enterprises are also diverse and vary in complexity. Qiaozhi Zhao and Ziqing Guo (2025) have proposed a dual-dimensional framework, known as compliance and structure, to analyze the green transformation of enterprises. This framework categorizes corporate response patterns into two types: institutional expectation-oriented and institutional opportunity-seeking. Existing research suggests that new energy vehicle (NEV) enterprises operate within a complex institutional environment, characterized by the coexistence and interaction of four distinct institutional logics: political, market, community, and organizational logic(Zhang Mingzhi, Wang Xinpei, & Yu Donghua, 2024). As a result, the green innovation performance of NEV enterprises is not only influenced by their position within the supply chain, but also by the prevailing institutional logic context. Institutional theory not only reveals the institutional logics embedded within firms, but also examines the interplay among various environmental forces, providing a comprehensive understanding of the external factors that influence enterprise behavior.
2.2. Resource Theory
Resource theory refers to the process by which enterprises integrate internal and external resources to create value based on their existing resource endowments(Silviano Esteve-Pérez &A. Mañez-Castillejo,2008). These resources play a critical role in enabling firms to sustain competitive advantage and achieve technological advancement. According to the resource-based theory, a firm's competitive advantage stems from its control over strategic resources, which serve as key determinants of green innovation performance(Aguilera-Caracuel, & Ortiz-De-Mandojana, 2013). Digital transformation enhances R&D efficiency and optimizes innovation processes, while adequate investment in R&D provides the necessary material foundation for breakthroughs in green technologies. These factors collectively represent the accumulation and deployment of a firm’s technological resources, forming essential support for green innovation outcomes. Additionally, organizational resilience reflects a firm’s capacity to respond to external risks and effectively reconfigure resources. Higher resilience enables more flexible allocation of financial and human capital towards green innovation initiatives(
C
hen, Chang, & Lin, 2014). Furthermore, a firm’s growth potential indicates its ability to access external market resources. High-growth firms are better positioned to secure funding, talent, and other critical inputs for research and development. Therefore, resource theory offers a robust framework for understanding how technological and organizational capabilities influence the green innovation performance of new energy vehicle enterprises, highlighting its theoretical and practical significance.
2.3. Theoretical Model Based on the TOE Framework
The TOE framework is based on the theory of information technology innovation adoption and expands it by categorizing the factors that influence the implementation of technological innovation in enterprises or organizations into three categories: technology, organization, and environment (Yamakawa, & Ostos, 2013). It is a well-established theory for analyzing the adoption of innovation in enterprises. Liu & Wang (2024) explored intricate paths towards achieving substantial green innovation, leveraging the Technology-Organization-Environment (TOE) framework. Therefore, this study aims to construct an analytical framework for assessing the green innovation performance of new energy vehicle enterprises by integrating the TOE framework with institutional theory and resource-based theory.
2.3.1. Technology and Green Innovation Performance
Scholars' research demonstrates that digital transformation has a significant impact on both the quantity and quality of green innovation in enterprises, with a particularly pronounced impact on substantive green innovation(He, Ribeiro-Navarrete,& Botella-Carrubi, 2024). Foundational technologies have a greater positive influence on both substantive and strategic green innovation compared to applied technologies. Mechanism analysis has revealed that digital transformation primarily fosters green innovation through three pathways: improving the quality of surplus information, alleviating financing constraints, and enhancing technological integration capabilities. This effect is more evident in regions with relatively underdeveloped digital economies. Further findings indicate that environmental uncertainty weakens the positive impact of digital transformation on corporate green innovation(Zhang Zenan, Qian Xinyu, Cao Xinwei.,2003). However, government subsidies can have a timely "catalytic" effect, effectively mitigating the adverse consequences associated with high levels of environmental uncertainty. The "Several Opinions on Accelerating the Digital and Intelligent Development of Energy" issued by the National Energy Administration emphasizes the importance of deep integration between digital technologies and the real economy. It also highlights the digital and intelligent transformation of traditional industries as an essential pathway for enterprise innovation. Digital transformation is not just about technological adoption, but it also reflects an enterprise's capacity for resource integration. By leveraging data resources, it connects R&D, production, and sales processes, thereby improving the efficiency of innovation resource utilization. As a strategic emerging industry shaping future development, the digital transformation of new energy vehicle enterprises holds particular significance. On one hand, the convergence of new energy vehicles and digital technologies enables the delivery of more comfortable and intelligent services to consumers. On the other hand, digital transformation provides critical technical support for advancing automation and intelligence in production processes.
2.3.2. Organization and Green Innovation Performance
Green innovation performance represents a core strategic imperative for new energy vehicle (NEV) enterprises in achieving the dual carbon goals, complying with policy regulations, and maintaining competitiveness in dynamic markets. However, green innovation is inherently characterized by high investment requirements, long development cycles, and significant uncertainty. NEV enterprises must navigate multiple challenges, including subsidy reductions, supply chain disruptions, shortages of critical battery raw materials, rapid technological iteration, and evolving market demands. The concept of "resilience," originally derived from physics, has been widely adopted in organizational management research. Organizational resilience refers to an enterprise’s capacity to effectively respond to external shocks, restore operational functionality, and adapt dynamically to changing environments (Vogus, & Sutcliffe, 2007). It has become a crucial enabler for downstream firms to overcome performance bottlenecks in green innovation and achieve synergistic integration across technology, market, and environmental objectives (Gao, Wang, & Teng, 2024). Subsidy reduction constitutes a prominent policy shock confronting such enterprises. In 2022, for example, government subsidies for NEVs were reduced by 30%, leading several subsidy-dependent companies into financial losses. Firms exhibiting strong organizational resilience, however, can transform such policy pressures into drivers of green innovation. BYD, for instance, anticipated the trend of declining subsidies as early as 2020 and proactively shifted its R&D focus from low-cost models to technologically advanced vehicles with higher value-added features. This strategic adjustment enabled its hybrid models to achieve fuel consumption as low as 3.8L/100km, aligning with the energy efficiency standards set by the dual credit policy. This case exemplifies the rapid decision-making and efficient resource mobilization capabilities inherent in organizational resilience. By reorienting R&D strategies and converting policy challenges into innovation opportunities, resilient organizations demonstrate their ability to not only withstand crises but also rebound and advance toward sustainable performance.
The enterprise growth potential is a crucial factor in determining the success of new energy vehicle companies. It not only indicates the ability to expand into new markets and create value, but also plays a key role in driving downstream market development, optimizing resource allocation, and promoting technological collaboration (Javed, et al., 2024). The growth potential of an enterprise directly impacts the demand for its products from downstream partners, as the expansion of the enterprise is largely driven by increasing market demand. The performance of original equipment manufacturers has a direct impact on the operational volume and market opportunities of downstream entities, such as dealers, after-sales service providers, and battery recycling companies. Empirical evidence suggests that China's new energy vehicle market is experiencing rapid growth. The success of leading automaker BYD, for example, has led to a surge in demand for digital marketing platforms and improved distribution channel services. This growth in sales has also resulted in increased orders and revenue prospects for associated enterprises. Additionally, the growing number of new energy vehicles in use is expected to drive significant demand for large-scale recycling of end-of-life batteries, leading to capacity expansion and technological innovation within the downstream recycling sector. Secondly, the growth potential of an enterprise significantly influences its resource allocation strategies and risk management decisions (Pujari, 2010). In the context of new energy vehicle (NEV) enterprises, high growth rates lead to increased demand for supply chain resources. To align with this demand, enterprises must dynamically adjust their resource inputs based on the production expansion pace of vehicle manufacturers. Taking Company A as a case study, the research identifies core risks within the NEV supply chain and reveals that rising sales revenue among vehicle manufacturers accelerates risk propagation across the supply chain. However, it simultaneously incentivizes enterprises to enhance their risk early warning systems. High-growth enterprises typically exhibit greater demand certainty, enabling them to mitigate operational risks through strategic adjustments in inventory management and supplier relationships. Moreover, empirical studies on listed small and medium-sized enterprises (SMEs) indicate that growth in sales revenue can influence corporate capital structure(Anderson, & Carverhill, 2012). Parts distributors that are closely tied to high-growth NEV manufacturers can strengthen their capital structures and reduce financial risks by securing stable order flows. Finally, enterprise growth potential fosters technological collaboration and drives innovation upgrading throughout the supply chain. The rapid expansion of NEV enterprises is often associated with heightened demand for technological advancement, requiring downstream partners to accelerate innovation efforts to keep pace with original equipment manufacturers (OEMs). A game-theoretic model between battery suppliers and vehicle manufacturers demonstrates that during periods of high growth, battery suppliers are more likely to adopt cooperative R&D strategies(Kaselimi, Notteboom, & Borger, 2011). This is attributable to the greater availability of R&D resources in high-growth firms, which enables suppliers to lower technology adoption costs through collaborative innovation. Based on the above analysis, organizational resilience and enterprise growth potential are selected as key indicators for assessing green innovation performance at the organizational level within the new energy vehicle industry.
2.3.3. Environment and Green Innovation
As a mandatory institutional arrangement, the dual-credit policy imposes legal pressure on enterprises by establishing proportionate requirements for energy-saving and new energy vehicles, thereby prompting them to adjust their innovation strategies in alignment with regulatory mandates. The policy also fosters an industry-wide innovation consensus through an imitation mechanism. Leading enterprises that proactively engage with the policy serve as a benchmark for best practices, guiding small and medium-sized enterprises to follow suit in advancing green technology research and development. Additionally, the policy promotes green development principles that are gradually internalized as part of corporate social responsibility, further reinforcing the motivation for sustainable innovation (Wang,et al.,2025). According to institutional theory, mandatory institutions have a constraining and directive influence on corporate behavior. As a representative regulatory instrument, the dual-credit policy is closely linked to enterprise green innovation performance. This relationship requires a strategic shift from mere compliance-driven responses to proactive, strategy-oriented adaptation.
The dual-credit policy plays a crucial role in promoting the growth of China's new energy vehicle (NEV) industry by shifting its focus from relying on subsidies to market-driven development. This policy has a significant impact on the green innovation strategies of downstream enterprises, particularly automotive manufacturers (Peng, Li, & Yu, 2021). It puts pressure on both traditional internal combustion engine vehicle producers and NEV manufacturers. By combining credit compliance requirements and tradable credits, the policy directly links enterprise innovation behavior to financial incentives and regulatory penalties. In other words, companies are required to either increase the production of NEVs to earn positive credits or improve the fuel efficiency of conventional vehicles through technological advancements to avoid negative credits. This regulatory framework compels downstream enterprises to prioritize green innovation in their strategic decision-making. Empirical studies have shown that the dual-credit policy encourages transformation innovation in downstream firms through two main channels: first, by increased investment in green research and development initiatives, such as vehicle light weighting and battery range enhancement technologies, to meet the quantitative NEV credit targets. Secondly, it is important to encourage enterprises to actively participate in the development and implementation of technical standards, particularly in areas such as new energy vehicle safety and intelligent connectivity(Yang, R., & Zhang, W.,2025). This will help to raise the quality standards for innovation. This approach is especially relevant for downstream enterprises, as they are directly affected by regulatory compliance requirements and consumer expectations. As the final stage of the industrial chain, downstream firms are more responsive to policy signals when it comes to their innovation strategies. Additionally, the dual-credit policy indirectly promotes green innovation by promoting corporate social responsibility and increasing investment in research and development. A study conducted by scholars using a sample of listed companies in the new energy vehicle sector found that the dual-credit policy has significantly increased R&D expenditures among downstream enterprises (Li, X.,
& Xiong, Q.,2021). Moreover, by reinforcing firms' sense of environmental responsibility, the policy has directed innovation efforts towards low-carbon and circular technologies. This responsibility-driven innovation transmission mechanism is particularly evident in downstream enterprises. Therefore, the implementation of the dual-credit policy not only serves as a regulatory framework but also acts as a catalyst for sustained green innovation within the new energy vehicle industry.
Competitive pressure is a major driving force for green innovation performance in new energy vehicle enterprises. As a form of mimetic pressure, its influence extends across multiple dimensions, including market mechanisms, industrial chain dynamics, and policy coordination, and is closely associated with the characteristic of downstream firms being positioned near the market endpoint. In terms of market competition, these downstream enterprises directly face consumer demands for low energy consumption and extended battery life. The success of their products greatly depends on their ability to differentiate through green innovation. Empirical studies have shown that moderate levels of market competition are crucial for technological innovation within firms (Achim, Hecker, Alois, & Ganter.,2013). As new energy vehicle enterprises are at the forefront of the market, they are particularly influenced by competitive pressures to drive innovation. In a balanced competitive environment, firms are more likely to pursue green product and process innovations to improve product value and meet the increasing expectations of consumers for environmental sustainability. From the perspective of industrial chain dynamics, downstream enterprises face cost pressures and technological constraints from upstream suppliers of battery and motor components, while also being expected to meet the growing green demands of end consumers. This dual pressure compels firms to integrate resources from both upstream and downstream segments through green innovation initiatives. Competitive pressure not only acts as a catalyst for innovation, but also plays a crucial role in ensuring the quality and sustainability of these innovations. Empirical evidence from the new energy vehicle (NEV) industry chain shows that the level of competitive intensity faced by downstream enterprises is positively correlated with the quality of innovation (Zhang, & Jedin, 2022). Specifically, under moderate competitive pressure, firms are more likely to pursue high-quality green innovation outcomes. In contrast, when competitive pressure is insufficient, government subsidies may incentive firms to engage in low-quality innovation, such as incremental improvements to existing technologies, primarily to secure financial support. This can lead to a dependency on subsidies, risking the entrapment of firms in a cycle of low-quality innovation. From a policy standpoint, the interplay between competitive pressure and government interventions can greatly enhance the effectiveness of incentives aimed at promoting green innovation performance.
Investor attention is a critical factor in the success of new energy vehicle companies' green innovation performance (Li, Diao, Wu,& Phillips, 2024). It serves as a form of regulatory pressure. From a risk management perspective, investor attention can enhance companies' motivation to innovate by sharing the risks involved (Karolyi, Kim, &Liao,2020). This study examines the impact of venture capital institution intervention on corporate green innovation performance. The focus of venture capital is to reduce innovation risks through cognitive change and factor upgrading, and to encourage enterprises to incorporate green technologies into their strategic plans. According to Li et al. (2024), institutional investors' attention to green policies can help prevent corporate "greenwashing" behavior and guide resources towards long-term green innovation performance. This is supported by empirical evidence from a study on the relationship between green investors, environmental regulations, and corporate green innovation performance (Machiba, 2010). The implementation of new standards has shown a significant increase in the promoting effect of green investors on corporate green innovation performance. This attention from green investors also sends a signal of green values, attracting more green capital to enter downstream industries such as vehicle manufacturing, component manufacturing, charging facility operation, and terminal distribution for new energy vehicles. This is in line with resource theory, which suggests that high investor attention can provide companies with support from the capital market and supplement resources for green innovation performance.
In summary, this study utilizes institutional theory and resource theory to construct theoretical models, using the TOE framework as the analytical framework. The study examines the impact of technology, organization, and environment on the green innovation performance of new energy enterprises, taking into account factors such as the degree of digital transformation, R&D investment intensity, organizational resilience, enterprise growth, double integral ratio, competitive pressure, and investor attention. The theoretical model is illustrated in Figure 1.
3. Research Methods
The research perspectives in management are generally divided into three categories (Delery & Doty,1996) general perspective, contingency perspective, and configuration perspective. Different from the previous two perspectives, the configuration perspective system reveals the complex interaction mechan ism between conditional variables and outcome variables, which is more suitable for this study. Qualitative Comparative Analy
sis
(QCA) was proposed by Ragin (1987). Traditional fsQCA relies on static cross-sectional data and cannot capture the temporal evolution characteristics of causal configurations. With the increasing demand for dynamic research, dynamic fsQCA methods incorporating time dimensions have gradually emerged. This study takes panel data from 21 A-share listed companies from 2014 to 2024 as the research object, and uses dynamic fsQCA to explore in depth the dynamic impact mechanism of technology, organization, and environment on the green innovation performance of new energy vehicle enterprises.
3.1. Sample Data and Variable Measurement
3.1.1. Research Sample
In accordance with the research objectives of this study, a sample of 21 new energy vehicle enterprises listed on the A-share market between 2014 and 2024 was selected. The sample selection process adhered to the following criteria: firms with missing key variables were excluded; firms established for less than one year were excluded; and firms designated as ST, *ST, or exhibiting abnormal listing statuses were excluded. Annual report data were obtained from Juchao Information Network, while patent data were sourced from the Guotai’an Database. To examine the temporal effects of the dual-credit policy implementation and its comparative implications relative to the subsidy policy, this study employs panel data from target enterprises spanning 2014 to 2024. From 2014 to 2018, China implemented a series of financial subsidy policies aimed at promoting new energy vehicle (NEV) adoption, thereby stimulating both automakers' production incentives and consumer demand. This phase represents the period during which the subsidy policy operated independently. The dual-credit policy, a mandatory regulatory mechanism introduced by the Chinese government for passenger vehicle manufacturers, officially took effect in 2018. During the subsequent transition period, the subsidy policy was gradually phased out, culminating in its full withdrawal. Thus, the period from 2018 onward marks the co-implementation phase of the dual-scores policy and the diminishing subsidy regime.
3.1.2. Variable Measurement
Green Innovation Performance. This refers to the achievements in green innovation realized by an enterprise over a specific period, including green products, new technologies, patents, or academic publications. While previous studies have often used the number of invention patent applications, this study measures the proportion of authorized green invention patents as the measurement indicator. The proportion of green patent authorizations proportion is calculated as (Number of green patent authorizations / Total number of patent authorizations) × 100%. In this context, the number of green patent authorizations refers to the sum of green invention patents and green utility model patents granted within the reporting year. The total number of patent authorizations encompasses all patent types awarded in the region or technological domain, including invention, utility model, and design patents.
In comparison to utility model and design patents, invention patents generally involve higher levels of technological sophistication and innovation intensity. Additionally, by focusing on authorized green invention patents, this study emphasizes not only novelty but also the quality and substantive contribution of innovations. Data for this study were obtained from the Guotai'an Database, a comprehensive source of patent information in China.
Condition variables
Digital technology. It can optimize the research and development (R&D) processes within enterprises. For example, through big data analytics, it enables the precise identification of market demand pain points related to green new energy vehicles. This capability helps shorten the R&D cycle for green technologies, thereby enhancing green innovation performance. The level of digital transformation is measured by the ratio of an enterprise’s intangible assets in digital technology to its total assets. This metric reflects the proportion of intangible assets accumulated by the enterprise in the digital domain and directly indicates the extent of resource allocation and asset accumulation associated with digital transformation.
R&D investment. It facilitates the optimization and upgrading of green technologies, allowing enterprises to respond effectively to technological advancements in the industry and shifts in market demand. It also provides financial support for green innovation performance in new energy vehicle enterprises and helps attract high-end talent in the field of green technology. The intensity of R&D investment is measured by the ratio of R&D expenditure to operating income, reflecting the proportion of operating income allocated to technological research and development. This indicator demonstrates the enterprise’s commitment to R&D activities and the scale of its resource investment, serving as one of the core metrics for assessing a firm’s innovation potential. Organizational resilience. It refers to the capacity of enterprises to sustain stable cash flows during periods of industry downturns or external disruptions, while effectively reallocating R&D and production resources in response to advancements in green innovation performance research. This resilience is quantified by the ratio of an organization's total liabilities to its total assets, serving as an indicator of its risk-bearing capability—specifically, its ability to maintain operational stability and recover promptly when confronted with external shocks such as market volatility, technological shifts, and policy changes. The data utilized in this context are derived from the official annual reports published by enterprises on Juchao Information Network.
Enterprise growth potential: A strong growth trajectory is characterized by continuously expanding market share and steadily increasing sales revenue, which generates a more robust cash flow for the enterprise. This financial capacity can be strategically reinvested into green innovation initiatives, thereby establishing a virtuous cycle of business growth—capital accumulation—innovation investment—sustained expansion. Such a cycle supports the research and development of green technologies and facilitates continuous product iteration. Enterprise growth data are derived from official annual reports disclosed on Juchao Information Network. The growth rate is calculated as (current period sales revenue minus the same period’s revenue from the prior year) divided by the prior period’s revenue, multiplied by 100%. This metric reflects the pace of business expansion and the potential for market scale growth over a given period, serving as an indicator of the enterprise’s market competitiveness and long-term developmental vitality.
The Dual-Credit Policy. It officially known as the "Measures for the Parallel Management of Average Fuel Consumption of Passenger Vehicles and New Energy Vehicle Credits," was implemented in April 2018. As a mandatory regulatory framework imposed by the Chinese government on passenger vehicle manufacturers, the policy employs a dual mechanism of regulatory mandates and market-based incentives to drive the transformation of the automotive industry toward green and low-carbon development.
The dual-credit system comprises two components. The first is the CAFC (Corporate Average Fuel Consumption) credit mechanism, which evaluates enterprises based on the average fuel consumption of their passenger vehicles or imported models. It measures the deviation between actual fuel consumption and the regulatory standard. When actual performance exceeds the standard, positive credits are awarded; otherwise, negative credits are assigned. The second component is the NEV (New Energy Vehicle) credit mechanism. This evaluates individual credits according to technical parameters such as driving range and energy efficiency of new energy vehicles. These credits are then aggregated in relation to the enterprise’s annual production volume of new energy vehicles and compared against the mandated annual credit ratio (e.g., 18% in 2023). If the actual credit generation surpasses the required threshold, surplus positive credits are granted; if it falls short, a deficit of negative credits is incurred. This integrated mechanism aims to incentivize energy conservation and emission reduction across the automotive industry.
Enterprises must maintain a non-negative credit balance—specifically, they must achieve sufficient positive credits. Failure to meet the requirement necessitates offsetting deficits through internal adjustments or market-based credit transactions; otherwise, regulatory penalties will be imposed. The overarching objective of the dual-point policy is to leverage credit incentives to compel automakers to reduce fuel consumption in conventional internal combustion engine vehicles and to increase the proportion of new energy vehicle production and sales.
It serves to align enterprises' green innovation performance with national industrial policy objectives, thereby promoting comprehensive technological upgrades toward sustainability within the industry. The policy is operationalized through the proportion of dual credits disclosed in official government announcements and represents a pivotal industrial policy for China's new energy vehicle sector. This credit ratio reflects both the regulatory constraints and incentive mechanisms imposed by the policy on enterprises.
In this study, the dual-credit policy is measured by the proportion of new energy vehicle credits specified in official government announcements. For example, the credit requirements were set at 8% in 2018, increased to 10% in 2019, and further raised to 12% in 2020. The progressive increase in these proportions reflects increasingly stringent regulatory demands on enterprises to achieve energy conservation and emission reduction targets. This evolving quota system serves as a key mechanism through which the policy exerts both regulatory constraints and incentive-based encouragement on corporate behavior. Additionally, from 2014 to 2018, prior to the implementation of the dual-credit system policy, all data values were uniformly assigned a value of 0.
Industry competition. It exerts pressure on firms to rapidly adopt and assimilate advanced green technologies prevalent within the sector. Competitive intensity is measured using the Herfindahl-Hirschman Index (HHI), calculated as the sum of the squared ratios of each firm’s main business revenue to the total industry main business revenue. Data are obtained from enterprise annual reports published on the Juchao Information Network. A higher HHI value indicates greater market concentration and, consequently, relatively lower competitive pressure. Investor attention. It refers to the degree of market scrutiny directed toward enterprises, which incentivizes enhanced disclosure of information related to green innovation performance. Improved transparency, in turn, facilitates the accumulation of external resources, fostering a virtuous cycle of sustainable innovation. Investor attention is quantified by the average search volume for each enterprise on Baidu Index, transformed using the natural logarithm. Data are sourced from Baidu Index and reflect the level of interest exhibited by market investors. Higher values indicate greater investor attention, signaling stronger market influence and positive expectations regarding the enterprise’s developmental potential.
4. Data analysis and Results
4.1. Variable Calibration
Since the units of the variable data collected in the early stage were not uniform, the secondary data was preprocessed. Calibration is the process of assigning set membership to a case. The relationship between the variable values and the membership of the fuzzy set is established through anchor points. Based on scholars' research, 0.95, 0.5, and 0.05 are selected as the anchor point setting points. The information of full membership, crossover points, and full non-membership points of the result variable and the condition variable is shown in Table 1.
4.2. Analysis of Necessary Conditions
The analysis of necessary conditions is a methodological approach used to determine if a specific factor is necessary for a given outcome to occur. This approach uses two key metrics, consistency and coverage, to evaluate the necessity of a condition. A condition is considered necessary if its consistency is above 0.9 and its coverage is above 0.5. Conversely, if both values fall below these thresholds, the condition is deemed not necessary. It is also important to examine the consistency adjustment distance across observation groups, with a distance greater than 0.2 indicating a significant temporal effect that requires further investigation. The calibrated fuzzy-set data was analyzed using R software, and the results are presented in the figure below. The analysis shows that neither high-level nor low-level green innovation performance has consistency or coverage values above 0.9 and 0.5, respectively. This suggests that none of the six condition variables individually constitute a necessary condition for green innovation performance. However, there are multiple instances where the consistency adjustment distance is greater than 0.2 across groups. In total, eight such cases were identified and selected for further in-depth analysis, as a distance greater than 0.2 indicates a significant time-related variation.

Table 2.
Analysis of Necessary Conditions.
| Conditional variable |
High level of green innovation performance | Low level of green innovation performance | ||||||
| Summary consistency | Summary coverage | Adjust distance for consistency between groups | Adjustment distance for consistency Intra-group | Summary consistency | Summary coverage | Adjust distance for consistency between groups | Adjustment distance for consistency Intra-group | |
| X1 | 0.643 | 0.688 | 0.377 | 0.329 | 0.457 | 0.618 | 0.486 | 0.496 |
| ~X1 | 0.644 | 0.484 | 0.339 | 0.324 | 0.770 | 0.731 | 0.211 | 0.295 |
| X2 | 0.624 | 0.637 | 0.181 | 0.339 | 0.544 | 0.701 | 0.298 | 0.412 |
| ~X2 | 0.708 | 0.551 | 0.147 | 0.378 | 0.719 | 0.707 | 0.094 | 0.353 |
| X3 | 0.686 | 0.624 | 0.154 | 0.378 | 0.590 | 0.678 | 0.230 | 0.432 |
| ~X3 | 0.646 | 0.555 | 0.196 | 0.417 | 0.673 | 0.730 | 0.128 | 0.358 |
| X4 | 0.693 | 0.585 | 0.188 | 0.226 | 0.647 | 0.690 | 0.117 | 0.236 |
| ~X4 | 0.632 | 0.586 | 0.222 | 0.250 | 0.611 | 0.715 | 0.109 | 0.182 |
| X5 | 0.653 | 0.712 | 0.674 | 0.236 | 0.416 | 0.574 | 0.855 | 0.231 |
| ~X5 | 0.610 | 0.453 | 0.501 | 0.245 | 0.791 | 0.742 | 0.384 | 0.133 |
| X6 | 0.544 | 0.558 | 0.309 | 0.609 | 0.517 | 0.671 | 0.343 | 0.555 |
| ~X6 | 0.679 | 0.527 | 0.218 | 0.388 | 0.659 | 0.646 | 0.230 | 0.334 |
| X7 | 0.780 | 0.642 | 0.124 | 0.241 | 0.615 | 0.640 | 0.305 | 0.255 |
| ~X7 | 0.563 | 0.536 | 0.260 | 0.452 | 0.657 | 0.790 | 0.173 | 0.295 |
The results indicate the following. First, in Cases 1 and 3, which exhibit high level of green innovation performance, the inter-group consistency levels are both below 0.9, suggesting that no necessary condition exists in these instances. In Case 2, however, the inter-group consistency reached 1.0 in 2023, with an inter-group coverage of 0.763. An X-Y scatter plot was therefore constructed for further analysis, as presented in Figure 2. The scatter plot results confirm that the necessary condition test was not satisfied. Second, in Situation 4, the data for X5 across 2021, 2022, and 2023 demonstrate inter-group consistency exceeding 0.9 and inter-group coverage surpassing 0.5. A subsequent X-Y scatter plot analysis was conducted, as shown in Figure 3 , and the results again indicate failure to meet the necessary condition criteria. In Cases 5 through 10, no instance exhibited both inter-group consistency above 0.9 and inter-group coverage above 0.5. Finally, a scatter plot test was performed for the period 2014–2017 in Case 11, characterized by low green innovation performance, where inter-group consistency exceeded 0.9 and inter-group coverage exceeded 0.5. As illustrated in Figure 4, the results also fail to satisfy the necessity test. Overall, these findings suggest that none of the examined conditions fulfill the criteria for necessity.
Table 3.
The causal configurations of groups exhibiting a consistency-adjusted distance exceeding 0.2.
Table 3.
The causal configurations of groups exhibiting a consistency-adjusted distance exceeding 0.2.
| Situation | Causal combination | Year | ||||||||||
| Index | 2014 | 2015 | 2016 | 2017 | 2018 | 2019 | 2020 | 2021 | 2022 | 2023 | ||
| Situation1 | X1/Y | Inter-group consistency | 0.588 | 0.631 | 0.590 | 0.734 | 0.845 | 0.746 | 0.740 | 0.812 | 0.842 | 0.069 |
| Inter-group coverage | 0.425 | 0.576 | 0.728 | 0.705 | 0.652 | 0.681 | 0.698 | 0.721 | 0.788 | 1.000 | ||
| Situation2 | ~X1/Y | Inter-group consistency | 0.746 | 0.725 | 0.735 | 0.722 | 0.621 | 0.670 | 0.548 | 0.390 | 0.320 | 1.000 |
| Inter-group coverage | 0.249 | 0.474 | 0.600 | 0.591 | 0.480 | 0.581 | 0.572 | 0.625 | 0.733 | 0.763 | ||
| Situation3 | ~X4/Y | Inter-group consistency | 0.767 | 0.714 | 0.653 | 0.661 | 0.625 | 0.665 | 0.582 | 0.551 | 0.431 | 0.61 |
| Inter-group coverage | 0.350 | 0.559 | 0.685 | 0.630 | 0.553 | 0.582 | 0.694 | 0.695 | 0.757 | 0.881 | ||
| Situation4 | X5/Y | Inter-group consistency | 0.219 | 0.131 | 0.102 | 0.122 | 0.693 | 0.828 | 0.861 | 0.909 | 0.933 | 0.980 |
| Inter-group coverage | 1.000 | 1.000 | 1.000 | 1.000 | 0.614 | 0.646 | 0.660 | 0.723 | 0.808 | 0.767 | ||
| Situation5 | ~X5/Y | Inter-group consistency | 0.999 | 1.000 | 1.000 | 1.000 | 0.808 | 0.688 | 0.561 | 0.415 | 0.289 | 0.101 |
| Inter-group coverage | 0.240 | 0.401 | 0.517 | 0.433 | 0.533 | 0.710 | 0.787 | 0.838 | 0.882 | 1.000 | ||
| Situation6 | X6/Y | Inter-group consistency | 0.713 | 0.489 | 0.573 | 0.716 | 0.667 | 0.670 | 0.462 | 0.487 | 0.438 | 0.425 |
| Inter-group coverage | 0.032 | 0.404 | 0.540 | 0.547 | 0.511 | 0.617 | 0.553 | 0.609 | 0.776 | 0.794 | ||
| Situation7 | ~X1/~Y | Inter-group consistency | 0.765 | 0.714 | 0.787 | 0.786 | 0.717 | 0.720 | 0.685 | 0.582 | 0.530 | 1.000 |
| Inter-group coverage | 0.862 | 0.759 | 0.665 | 0.809 | 0.88 | 0.779 | 0.728 | 0.700 | 0.619 | 0.290 | ||
| Situation8 | X2/~Y | Inter-group consistency | 0.379 | 0.441 | 0.500 | 0.524 | 0.603 | 0.587 | 0.513 | 0.710 | 0.864 | 0.841 |
| Inter-group coverage | 0.818 | 0.782 | 0.681 | 0.820 | 0.782 | 0.713 | 0.58 | 0.672 | 0.544 | 0.449 | ||
| Situation9 | X3/~Y | Inter-group consistency | 0.397 | 0.422 | 0.582 | 0.623 | 0.612 | 0.607 | 0.703 | 0.736 | 0.768 | 0.807 |
| Inter-group coverage | 0.850 | 0.691 | 0.651 | 0.798 | 0.798 | 0.641 | 0.663 | 0.616 | 0.461 | 0.395 | ||
| Situation10 | X5/~Y | Inter-group consistency | 0.065 | 0.081 | 0.098 | 0.085 | 0.589 | 0.775 | 0.851 | 0.893 | 0.92 | 1.000 |
| Inter-group coverage | 0.997 | 1.000 | 0.997 | 1.000 | 0.830 | 0.756 | 0.663 | 0.534 | 0.384 | 0.297 | ||
| Situation11 | ~X5/~Y | Inter-group consistency | 1.000 | 1.000 | 1.000 | 1.000 | 0.726 | 0.638 | 0.564 | 0.537 | 0.541 | 0.214 |
| Inter-group coverage | 0.812 | 0.652 | 0.535 | 0.620 | 0.790 | 0.822 | 0.805 | 0.815 | 0.796 | 0.805 | ||
4.3. Configuration Analysis
This paper examines the green innovation performance of new energy vehicle enterprises from a configuration perspective. The study focuses on 21 new energy vehicle enterprises listed on the A-share market, which is a relatively small sample size. In the R software, the original consistency threshold is set to 0.80 based on the results from the truth table. For larger sample sizes, the frequency setting can be greater than 1, but since this study only has a sample size of 231, it is set to 1. The prisetting should not be lower than 0.5, but for this paper, it is set at 0.6. Based on the principle of prioritizing intermediate solutions while complementing them with simpler configurations, this study identifies the core conditions influencing enterprise green innovation performance. Among the five high-outcome configurations, consistency values were 0.896, 0.917, 0.899, 0.912, and 0.914, respectively—all exceeding the threshold of 0.80—indicating that each configuration is sufficient to explain high green innovation performance. The overall solution consistency was 0.875, implying that more than 80% of the enterprise samples in this study follow a configurational pathway conducive to high level of green innovation performance.
Configuration 1 (Technology-driven+Environment-pulled). A typical representative enterprise is Yutong Bus located in Zhengzhou, Henan Province in 2019. The core conditions are a high level of digital transformation and high investor attention. The intensity of R&D investment and institutional pressure serve as marginal conditions, which prompt the enterprise to achieve high level of green innovation performance. After the implementation of the dual-credit policy in 2018, Yutong faced internal constraints such as insufficient organizational resilience and a slowdown in growth. However, through high-level digital transformation, it enhanced its own competitiveness, quickly launched low-energy bus models, met the requirements of the dual-credit policy, and achieved high green innovation performance.
Configuration 2 and Configuration 3(Technology-driven + organizational collaboration)A representative enterprise in Configuration 2 is Jiangling Motors (2021–2022). Under marginal conditions including a high degree of digital transformation, strong organizational resilience, significant enterprise growth potential, substantial institutional pressure, and high R&D investment intensity, the company achieves a high level of green innovation performance. Located within the Jiangxi New Energy Vehicle Industrial Base, it benefits from its proximity to Farasis Energy, a key upstream lithium battery supplier, which helps reduce supply chain costs. A typical enterprise in Configuration 3 is BYD (2022). Leveraging the integrated industrial advantages of the electronics and automotive sectors in the Greater Bay Area, along with high levels of digital transformation, organizational resilience, enterprise growth potential, institutional pressure, and investor attention—reflected by an investor attention index of 8.9—the company also achieves high green innovation performance. The capital market advantages derived from this visibility enabled BYD to raise 15 billion yuan through a private placement in 2022, providing critical financial support for its green technology research and development initiatives.
Table 4.
Results of Green Innovation Performance Configuration Analysis.
| Conditional variable |
High level of green innovation performance | Low level of green innovation performance |
||||||
| C1 | C2 | C3 | C4 | C5 | C1 | C2 | C3 | |
| Digital technology | ● | ● | ● | ● | ● | ⊗ | ||
| R&D investment | ● | ● | ⊗ | |||||
| Organizational resilience | ⊗ | ● | ● | ● | ⊗ | |||
| Enterprise growth potential | ⊗ | ● | ● | ● | ||||
| Dual credit policy | ● | ● | ● | ● | ● | ⊗ | ⊗ | |
| Industry competition | ⊗ | ● | ● | ⊗ | ● | |||
| Investor attention | ● | ● | ● | ⊗ | ||||
| Consistency | 0.896 | 0.917 | 0.899 | 0.912 | 0.914 | 0.802 | 0.883 | 0.868 |
| PRI | 0.606 | 0.688 | 0.654 | 0.706 | 0.747 | 0.689 | 0.808 | 0.755 |
| Coverage | 0.200 | 0.249 | 0.271 | 0.226 | 0.250 | 0.564 | 0.577 | 0.310 |
| Unique coverage | 0.023 | 0.012 | 0.018 | 0.023 | 0.033 | 0.075 | 0.058 | 0.067 |
| Adjust the distance for consistency between groups | 0.158 | 0.072 | 0.083 | 0.087 | 0.087 | 0.166 | 0.083 | 0.139 |
| Adjustment distance for consistency Intra-group | 0.162 | 0.172 | 0.177 | 0.162 | 0.152 | 0.211 | 0.142 | 0.167 |
| Consistency of overall solution | 0.875 | 0.793 | ||||||
| PRI of overall solution | 0.700 | 0.691 | ||||||
| Coverage of overall solution | 0.383 | 0.731 | ||||||
Note: • or •means the condition exists, ⊗ or ⊗ means the condition does not exist; • or ⊗ stands for core condition, •or ⊗ for edge condition.
Configuration 4 and Configuration 5 (Technology-organization-environment tripartite linkage type) A typical enterprise in Configuration 4 is GAC Group (2021), which is located in the core region of the Pearl River Delta and has a strong partnership with upstream supplier CATL. The company strives to match the operations of Tesla and works together with them to improve the industrial value chain. Its advanced level of digital transformation and potential for growth are internal factors that drive its success in green innovation. Additionally, external factors such as institutional pressures, competition, and increased investor attention create significant environmental pressure, leading the company to prioritize investments in digital technologies like intelligent connectivity. The company's promising growth prospects have also boosted investor confidence and provided access to a variety of financing options. Foton Motor (2019–2022), based in Beijing, is a prime example of a Configuration 5 enterprise. The company takes advantage of the new energy industry cluster in the Beijing–Tianjin–Hebei region, which provides access to advanced intelligent connected vehicle technologies and policy support. However, Foton Motor faces dual pressures from the dual-credit policy and increasing competition in the commercial vehicle market. To stay ahead of competitors like Yutong and King Long, the company has utilized digital technologies to speed up the development of its pure electric bus models. Additionally, Foton Motor has demonstrated strong organizational resilience by maintaining stable R&D funding.
4.4. Robustness Test
In this study, the original consistency threshold changed from 0.8 to 0.85, and five configurations emerged. If the configuration that appears in the research has a nested relationship with the original configuration and can form a clear subset relationship, it indicates that the result is robust. Or if the configuration that appears is completely consistent with the original one, it also suggests that the research result is robust. The robustness test results are shown in Table 5. The configuration that appears is consistent with the original configuration, so the results are robust.
4.5. Discussion
Configuration 1 (technology-driven+environment-pulled) The core logic lies in the synergy between technological capabilities and institutional environmental regulations. This configuration does not emphasize organizational conditions, making it particularly suitable for enterprises with limited organizational resources but strong technological reserves and substantial external support. Digital transformation and high R&D investment intensity ensure the potential for technological innovation, while the dual-credit policy provides institutional constraints. Meanwhile, competitive pressure and investor attention serve as mechanisms of external supervision and sources of resource support. Although this configuration has a relatively narrow coverage compared to the three linkage paths, it offers a viable pathway for organizations constrained by organizational capacity. Among the five configurations associated with high green innovation performance, the dual-credit ratio appears as a core condition in all cases, with consistency levels exceeding 0.89, thereby strongly confirming the mandatory driving effect of the dual-credit policy on the green innovation performance of downstream enterprises. From a dynamic evolutionary perspective, since the formal implementation of the dual-credit policy in 2018, its influence on innovation has exhibited a significantly increasing trend. This suggests that as credit ratios rise and the pricing mechanism improves, the policy’s institutional regulatory power continues to strengthen, prompting enterprises to transition from passive compliance to proactive green innovation strategies. This finding aligns closely with institutional theory, which posits that regulatory institutions shape corporate behavior through legitimacy pressures. It also validates the dual-credit policy as an effective instrument for shifting industrial development from subsidy-dependent models toward market- and regulation-driven paradigms. As direct implementer of this policy, downstream enterprises must enhance their green innovation capabilities to transform regulatory pressure into a driver of innovation.
Configuration2 and Configuration3 (Technology-driven+organizational collaboration). Configuration 2 and Configuration 3 are driven by technology and organizational collaboration. According to resource-based theory, the key concept of Configuration Two is the integration of both internal and external organizational resources to collaboratively create value by leveraging existing technological assets and organizational capabilities. Technological resources play a crucial role in achieving sustained competitive advantage, while organizational capabilities serve as the foundation for maximizing the effectiveness of enterprise resources. The synergistic interaction between technical and organizational capabilities is essential for supporting corporate green innovation. By accumulating, strategically investing in, and integrating these resources, enterprises can collectively enhance their green innovation performance.
Configuration 4 and Configuration 5 (Technology-organization-environment tripartite linkage). The core logic of green innovation lies in the synergy among technical foundation, organizational support, policy regulation, and external pressure. Digital transformation and the intensity of R&D investment constitute the technological basis. Digital transformation enhances innovation by improving R&D efficiency and enabling precise identification of market demands, while R&D investment provides essential material support for breakthroughs in green technologies. Organizational resilience serves as a risk-mitigation mechanism, allowing enterprises to swiftly reallocate resources and sustain innovation continuity amid declining subsidies. The growth potential of an enterprise reflects its capacity to access market resources; firms with high growth rates can reinvest revenues into R&D, thereby establishing a positive cycle of market-driven research and development leading to innovation. The consistency of this pathway exceeds that of the technology-environment pathway, indicating that the integration of technological, organizational, and environmental factors yields a more stable performance-driven effect on green innovation within new energy vehicle enterprises.
5. Conclusion and Significance
This paper takes 21 listed new energy vehicle enterprises on the A-share market as the research objects, constructs a theoretical model based on institutional theory and resource theory, uses the TOE framework as the analysis framework, and conducts configuration analysis through dynamic fsQCA.
5.1. Conclusions and Theoretical Significance
It can be concluded that the analysis of a single necessary condition shows that a single antecedent condition does not constitute a necessary condition for a high level of green innovation performance. Previous studies, which have primarily focused on a unidirectional causal perspective, have shown that enhancing individual factors, such as R&D investment, can have a positive impact on the green innovation performance of new energy vehicle enterprises. However, the necessary condition analysis in this study suggests that no single factor is essential for achieving high-level green innovation performance. This indicates that green innovation performance is a complex and multifaceted process, driven not by the optimization of any isolated factor, but by the synergistic alignment of multiple internal and external elements. Additionally, this study identifies digital technology as a crucial component in all identified configurations. In the context of rapid digital economic development, enterprise-level digital capabilities play a pivotal role in advancing green innovation outcomes. However, no configuration reveals that digital technology alone is sufficient to achieve high performance. For instance, Configuration 21 demonstrates that high green innovation performance results from the combination of high digital technology adoption, substantial R&D investment, and strong investor attention. This suggests that while elevated digital capability is important, it must be complemented by other enabling conditions. These findings further validate the interdependence among the technological, organizational, and environmental (TOE) dimensions in practice and reveal the configurational patterns through which these dimensions interact and reinforce each other.
The interplay of technological, organizational, and environmental conditions engenders multiple pathways leading to high green innovation performance, characterized by the phenomenon of "convergent outcomes through divergent paths." Grounded in institutional theory and resource-based theory, this study systematically investigates the complex mechanisms through which technological, organizational, and environmental factors influence the green innovation performance of new energy vehicle enterprises, thereby deepening the understanding of green innovation under conditions of multiple, coexisting institutional logics—encompassing dominance, complementarity, and conflict. The research identifies diverse configurations shaped by these institutional logics, in which various factors interact synergistically to effectively enhance green innovation performance. Specifically, Configuration 1 indicates that the synergy between the internal digital technology transformation of enterprises and the external environmental regulation of the dual-credit policy can effectively enhance the green innovation performance of new energy vehicle enterprises. Configurations 4, and 5 indicate that, within the TOE framework, external factors—such as the dual credit policy, competitive pressure, and investor attention—exert regulatory and incentive effects, which, when combined with internal technological capabilities and organizational resource support, collectively influence the green innovation performance of new energy vehicle enterprises.
There is no obvious time effect in each configuration solution. With the increase of institutional pressure, the dual-credit policy has become the driving force to stimulate the green innovation performance of enterprises. New energy vehicle enterprises are located at the downstream of the supply chain. Their green innovation performance permeates the entire industrial chain and they are the chain leaders driving upstream and midstream enterprises. Their response and sensitivity to policies will expand the application and effectiveness of green innovation.
5.2. Practical Significance
The dual-credit policy has been empirically validated as an effective mechanism for promoting green innovation in enterprises. Rather than being a standalone mandatory instrument, the policy operates through a combination of compliance obligations and market-based transactions, encouraging enterprises to actively integrate green innovation into their core strategic frameworks. This approach offers valuable insights for designing industrial policies that combine regulatory mandates with market incentives. To enhance policy effectiveness, governments should dynamically adjust credit ratios and pricing mechanisms according to different stages of industrial development and establish differentiated regulatory provisions for new energy vehicle enterprises based on their size. The study identifies three distinct innovation pathways, providing tailored strategic guidance for enterprises with varying resource endowments. Enterprises with strong organizational resilience and high growth potential may benefit from the technology-organization-environment (TOE) co-evolutionary pathway. For those with limited organizational resources but substantial technological reserves, the technology-environment pathway is recommended. Enterprises with a significant portfolio of green patents and robust innovation capabilities could benefit from targeted tax incentives to further improve resource utilization efficiency through digital transformation. Specifically, financial support could be provided for the adoption of digital R&D tools and the development of intelligent manufacturing platforms, minimizing resource waste during research, development, and production processes.
5.3. Research Limitations and Future Directions
This article provides a comprehensive analysis of the green innovation performance of new energy vehicle enterprises in the context of the dual-credit policy. However, there are certain limitations that require further investigation. Firstly, the current sample mainly consists of downstream firms listed in the A-share market. To enhance the study, future research could expand the scope to include upstream enterprises, allowing for comparative analyses across firms with different ownership structures and regional characteristics. Secondly, incorporating the variable of supply chain collaboration intensity could enrich the environmental and technological dimensions of the TOE framework, providing a more holistic understanding of inter-firm synergies within the industrial chain. Additionally, the current dynamic analysis is conducted on an annual basis. Shortening the time interval in future studies may improve the precision of capturing the short-term effects of policy changes on corporate innovation behavior. Furthermore, integrating case study methodologies could help validate the mechanisms through which the dual-credit policy stimulates R&D investment and subsequently drives green innovation. This would complement the existing quantitative findings. Therefore, future research should consider incorporating additional variables and higher-frequency data to derive more robust and insightful conclusions.
Author Contributions
H.W.: Conceptualization, Writing—Original Draft, Funding acquisition, Methodology, Writing—Reviewing, Editing, Investigation, Data Curation, Formal analysis.
Funding
This work has been supported by grants from National Natural Science Foundation of China (Grant No.71962025) and Natural Science Foundation of Inner Mongolia Autonomous Region (Grant No.2023LHMS07002), and Humanities and Social Science Fund of Ministry of Education of China(Grant No.19XJC630013), and was sponsored by Digital Economy and Digital Governance Research Center Fund (Grant No.szzl202310), Inner Mongolia Yellow River Basin High Quality Development Research Center (Grant No.25HND04).
Institutional Review Board Statement
Ethical review and approval were waived for this study.
Data Availability Statement
The data presented in this study are available on request from the corresponding author.
Conflicts of Interest
The author declares no conflicts of interest. We express my sincere thanks to the Editor and Reviewers for their valuable comments.
References
- Achim; Hecker; Alois; Ganter. The influence of product market competition on technological and management innovation: firm-level evidence from a large-scale survey. European Management Review 2013, 10(1), 17–33. [Google Scholar]
- Aguilera-Caracuel, J.; Ortiz-De-Mandojana, N. Green innovation and financial performance: an institutional approach. Organization & Environment 2013, 26(4), 365–385. [Google Scholar]
- Aguilera-Caracuel, J.; Ortiz-De-Mandojana, N. Green innovation and financial performance: an institutional approach. Organization & Environment 2013, 26(4), 365–385. [Google Scholar]
- Anderson, R. W.; Carverhill, A. Corporate liquidity and capital structure. Review of Financial Studies 2012, 25(3), 797–837. [Google Scholar] [CrossRef]
- Chen, Y. S.; Chang, C. H.; Lin, Y. H. The determinants of green radical and incremental innovation performance: green shared vision, green absorptive capacity, and green organizational ambidexterity. Sustainability 2014, 6(11), 7787–7787. [Google Scholar] [CrossRef]
- He, Q.; Zhao, H. Influence of dual-credit policy on the energy conservation and emission reduction technology r&d of chinese auto industry. Results in Engineering 2023, 20(c), 101487. [Google Scholar]
- He, Q.; Ribeiro-Navarrete, S.; Botella-Carrubi, D. A matter of motivation: the impact of enterprise digital transformation on green innovation. Review of Managerial Science 2024, 18(5), 1489–1518. [Google Scholar] [CrossRef]
- Hou, Y.; Bello-Pintado, A.; García-Marco, & Teresa. Pay to be green? the effect of corporate social responsibility contracting on green innovation performance. BRQ-Business Research Quarterly 2025, 28(2), 421–437. [Google Scholar] [CrossRef]
- Kaselimi, E. N.; Notteboom, T. E.; Borger, B. D. A game theoretical approach to competition between multi-user terminals: the impact of dedicated terminals. Maritime policy and management 2011, 38(4), 395–414. [Google Scholar] [CrossRef]
- Li, X.; Xiong, Q. Phased impacts of china's dual-credit policy on r&d. Frontiers in Energy Research 2021, 9(6). [Google Scholar] [CrossRef]
- Liang, Y.; Le, H.; Lu, Z. How does strict financial supervision affect corporate green credit: empirical evidence from the new capital management regulation. Finance Research Letters 2025, 86(PartB), 10. [Google Scholar] [CrossRef]
- Liu, Y.; Wang, Y. Determinants of corporate green innovation? a configuration analysis based on the toe framework; Technology Analysis & Strategic Management, 2024; pp. 1–15. [Google Scholar]
- Gorsevski, Pece V.; Donevska, Katerina R.; Mitrovski, Cvetko D.; Frizado, Joseph P. Integrating multi-criteria evaluation techniques with geographic information systems for landfill site selection: a case study using ordered weighted average. Waste Management 2012, 32(2), 287–296. [Google Scholar] [CrossRef] [PubMed]
- Peng, L.; Li, Y.; Yu, H. Effects of dual credit policy and consumer preferences on production decisions in automobile supply chain. Sustainability 2021, 13. [Google Scholar] [CrossRef]
- Powell, D. M. W. The iron cage revisited: institutional isomorphism and collective rationality in organizational fields. American Sociological Review 1983, 48(2), 147–160. [Google Scholar] [CrossRef]
- Zhao, Qiaozhi; Guo, Ziqing. Digital Transformation Empowering New Quality Productivity Development of Manufacturing Industry in China——Evidence From Resource-based and Dynamic Capability Theory. Journal of Industrial Technological Economics 2025, 44(1), 12–24. [Google Scholar] [CrossRef]
- Esteve-Pérez, Silviano; Mañez-Castillejo, Juan A. The resource-based theory of the firm and firm survival. Small Business Economics 2008, 30(3), 231–249. [Google Scholar] [CrossRef]
- Wang; Bo, X.; Yao, L.; Zhang, H.; Zhang, N.; Phillips, X.A. Do corporate bond defaults affect the corporate social responsibility performance of non-defaulting industry peers? evidence of credit risk contagion from china. Applied Economics 2025, 57(11), 1257–1271. [Google Scholar] [CrossRef]
- Wang, Y.; Lei, X.; Zhao, D.; Long, R.; Wu, M. The dual impacts of green credit on economy and environment: evidence from china. Sustainability 2021, 13. [Google Scholar] [CrossRef]
- Yamakawa, T. P.; Ostos, M. J. The influence of the environment on organizational innovation in service companies in peru. Rbgn-revista Brasileira de Gestao de Negocios 2013, 15, 582–600. [Google Scholar]
- Yang, R.; Zhang, W. Paths for enhancing innovation performance of new energy enterprises under the TOE framework. Science & Technology and Industry 2025, 25(5), 256–264. [Google Scholar]
- Mingzhi, Zhang; Xinpei, Wang; Donghua, Yu. The Impact of Government Subsidies on the Innovation Structure of the New Energy Vehicle Industry. China Population Resources & Environment 2024, 34(07), 35–46. [Google Scholar]
- Zenan, Zhang; Xinyu, Qian; Xinwei, Cao. Research on the Green Innovation Effect of Enterprise Digital Transformation: Substantive innovation or strategic innovation? 2023, 1, 86–100. [Google Scholar]
- Zhang, M.; Jedin, M.H. Firm innovation and technical capabilities for enhanced export performance: the moderating role of competitive intensity. In Review of International Business and Strategy; 2022. [Google Scholar]
Figure 1.
Theory Model.
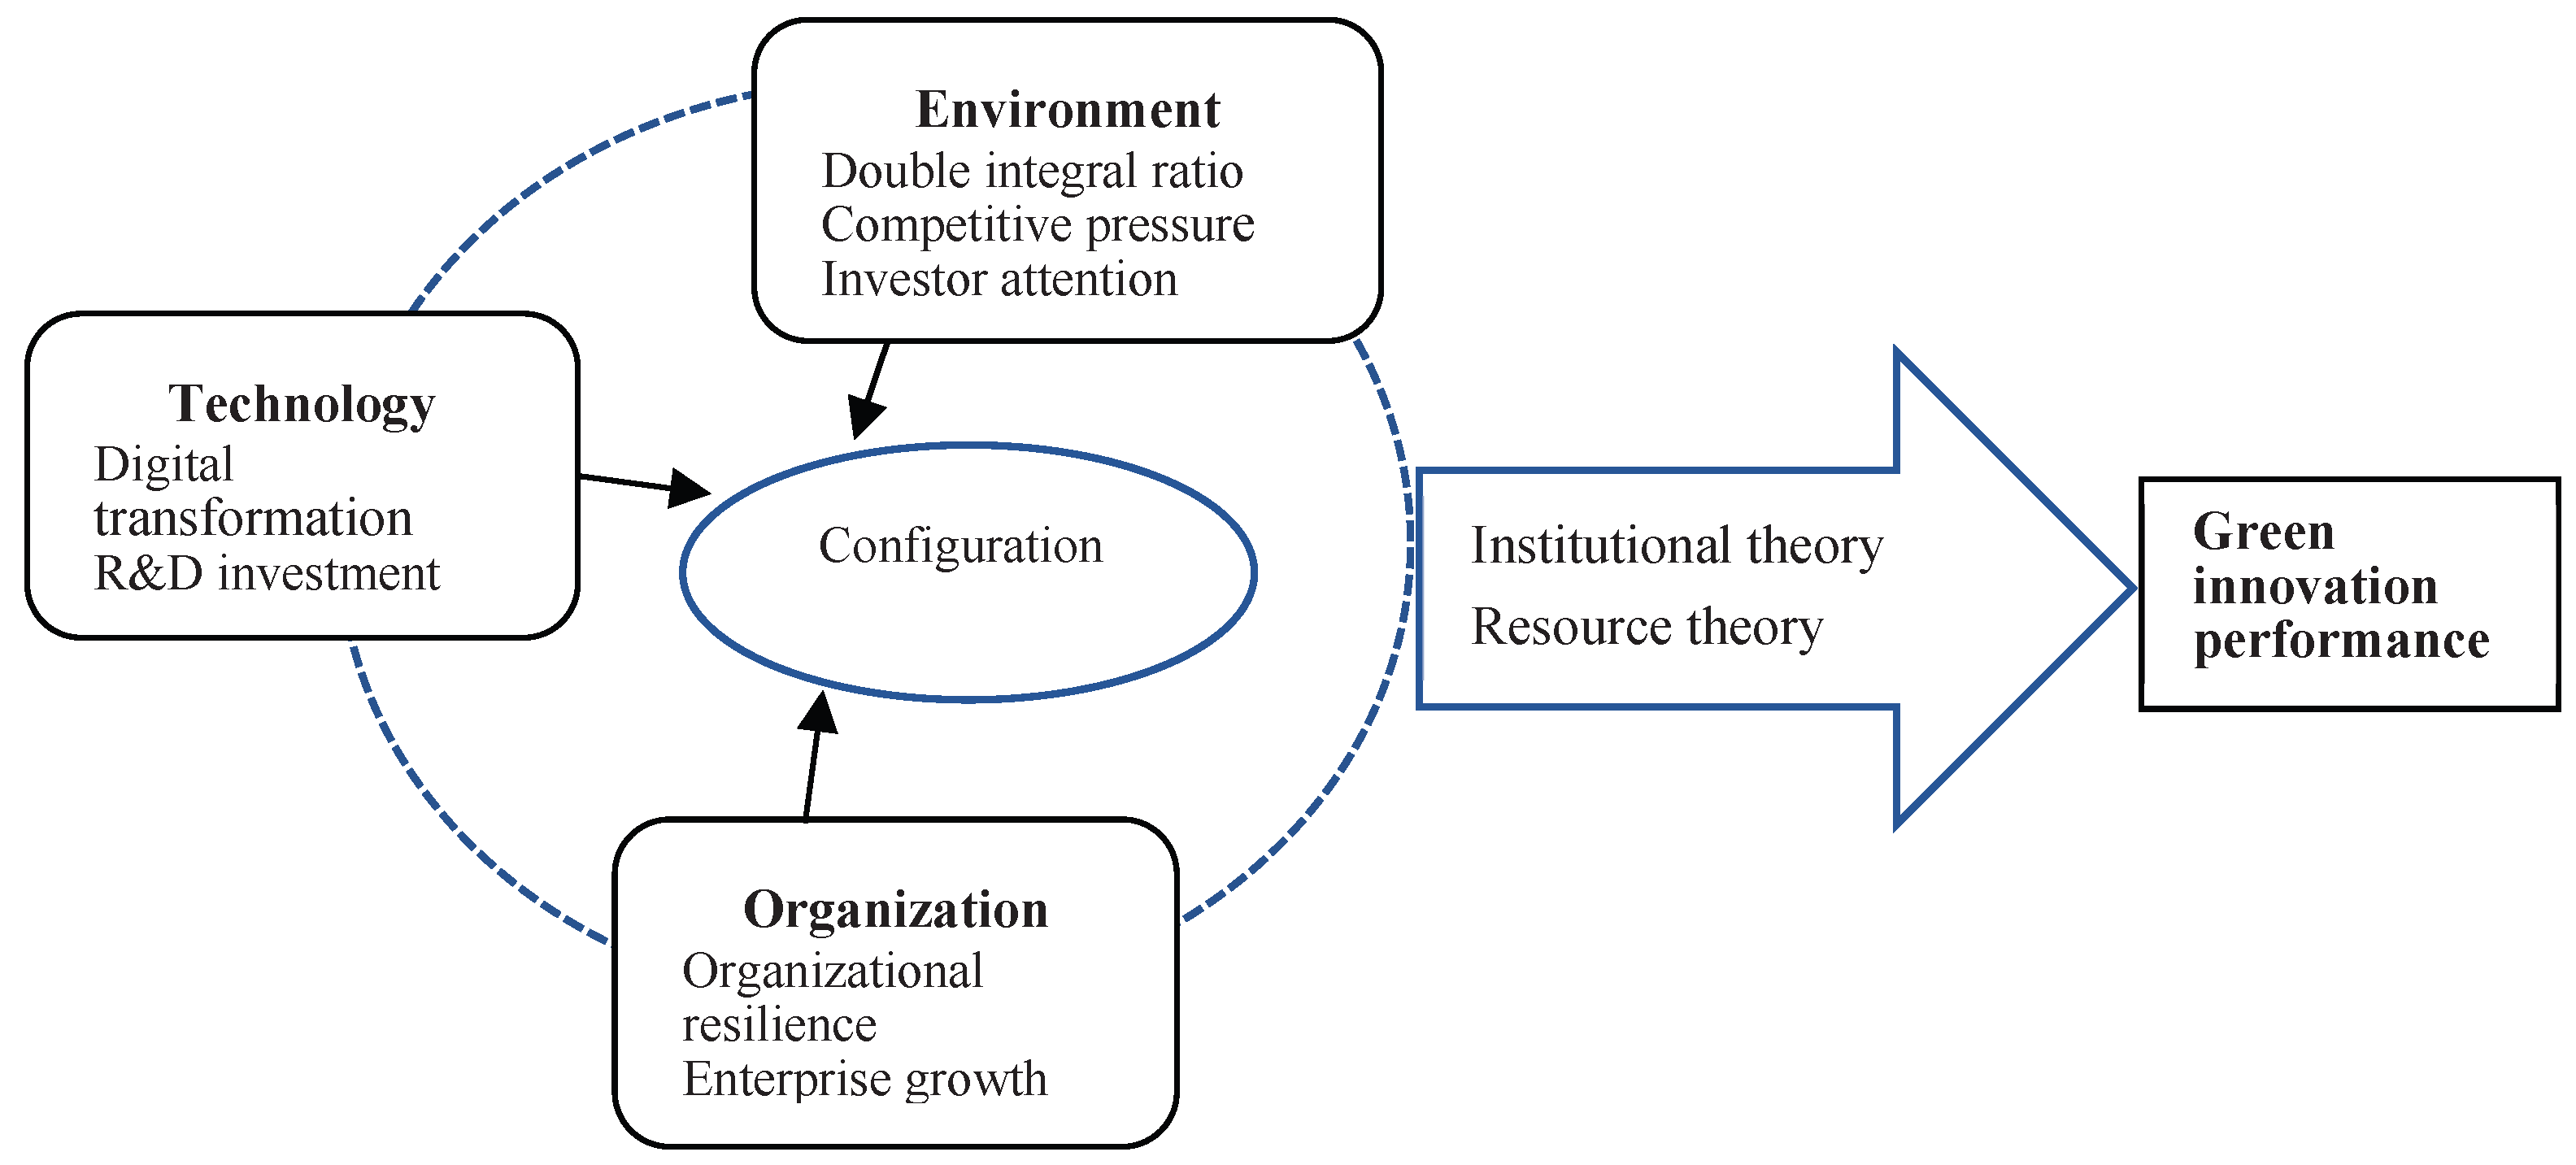
Figure 2.
.
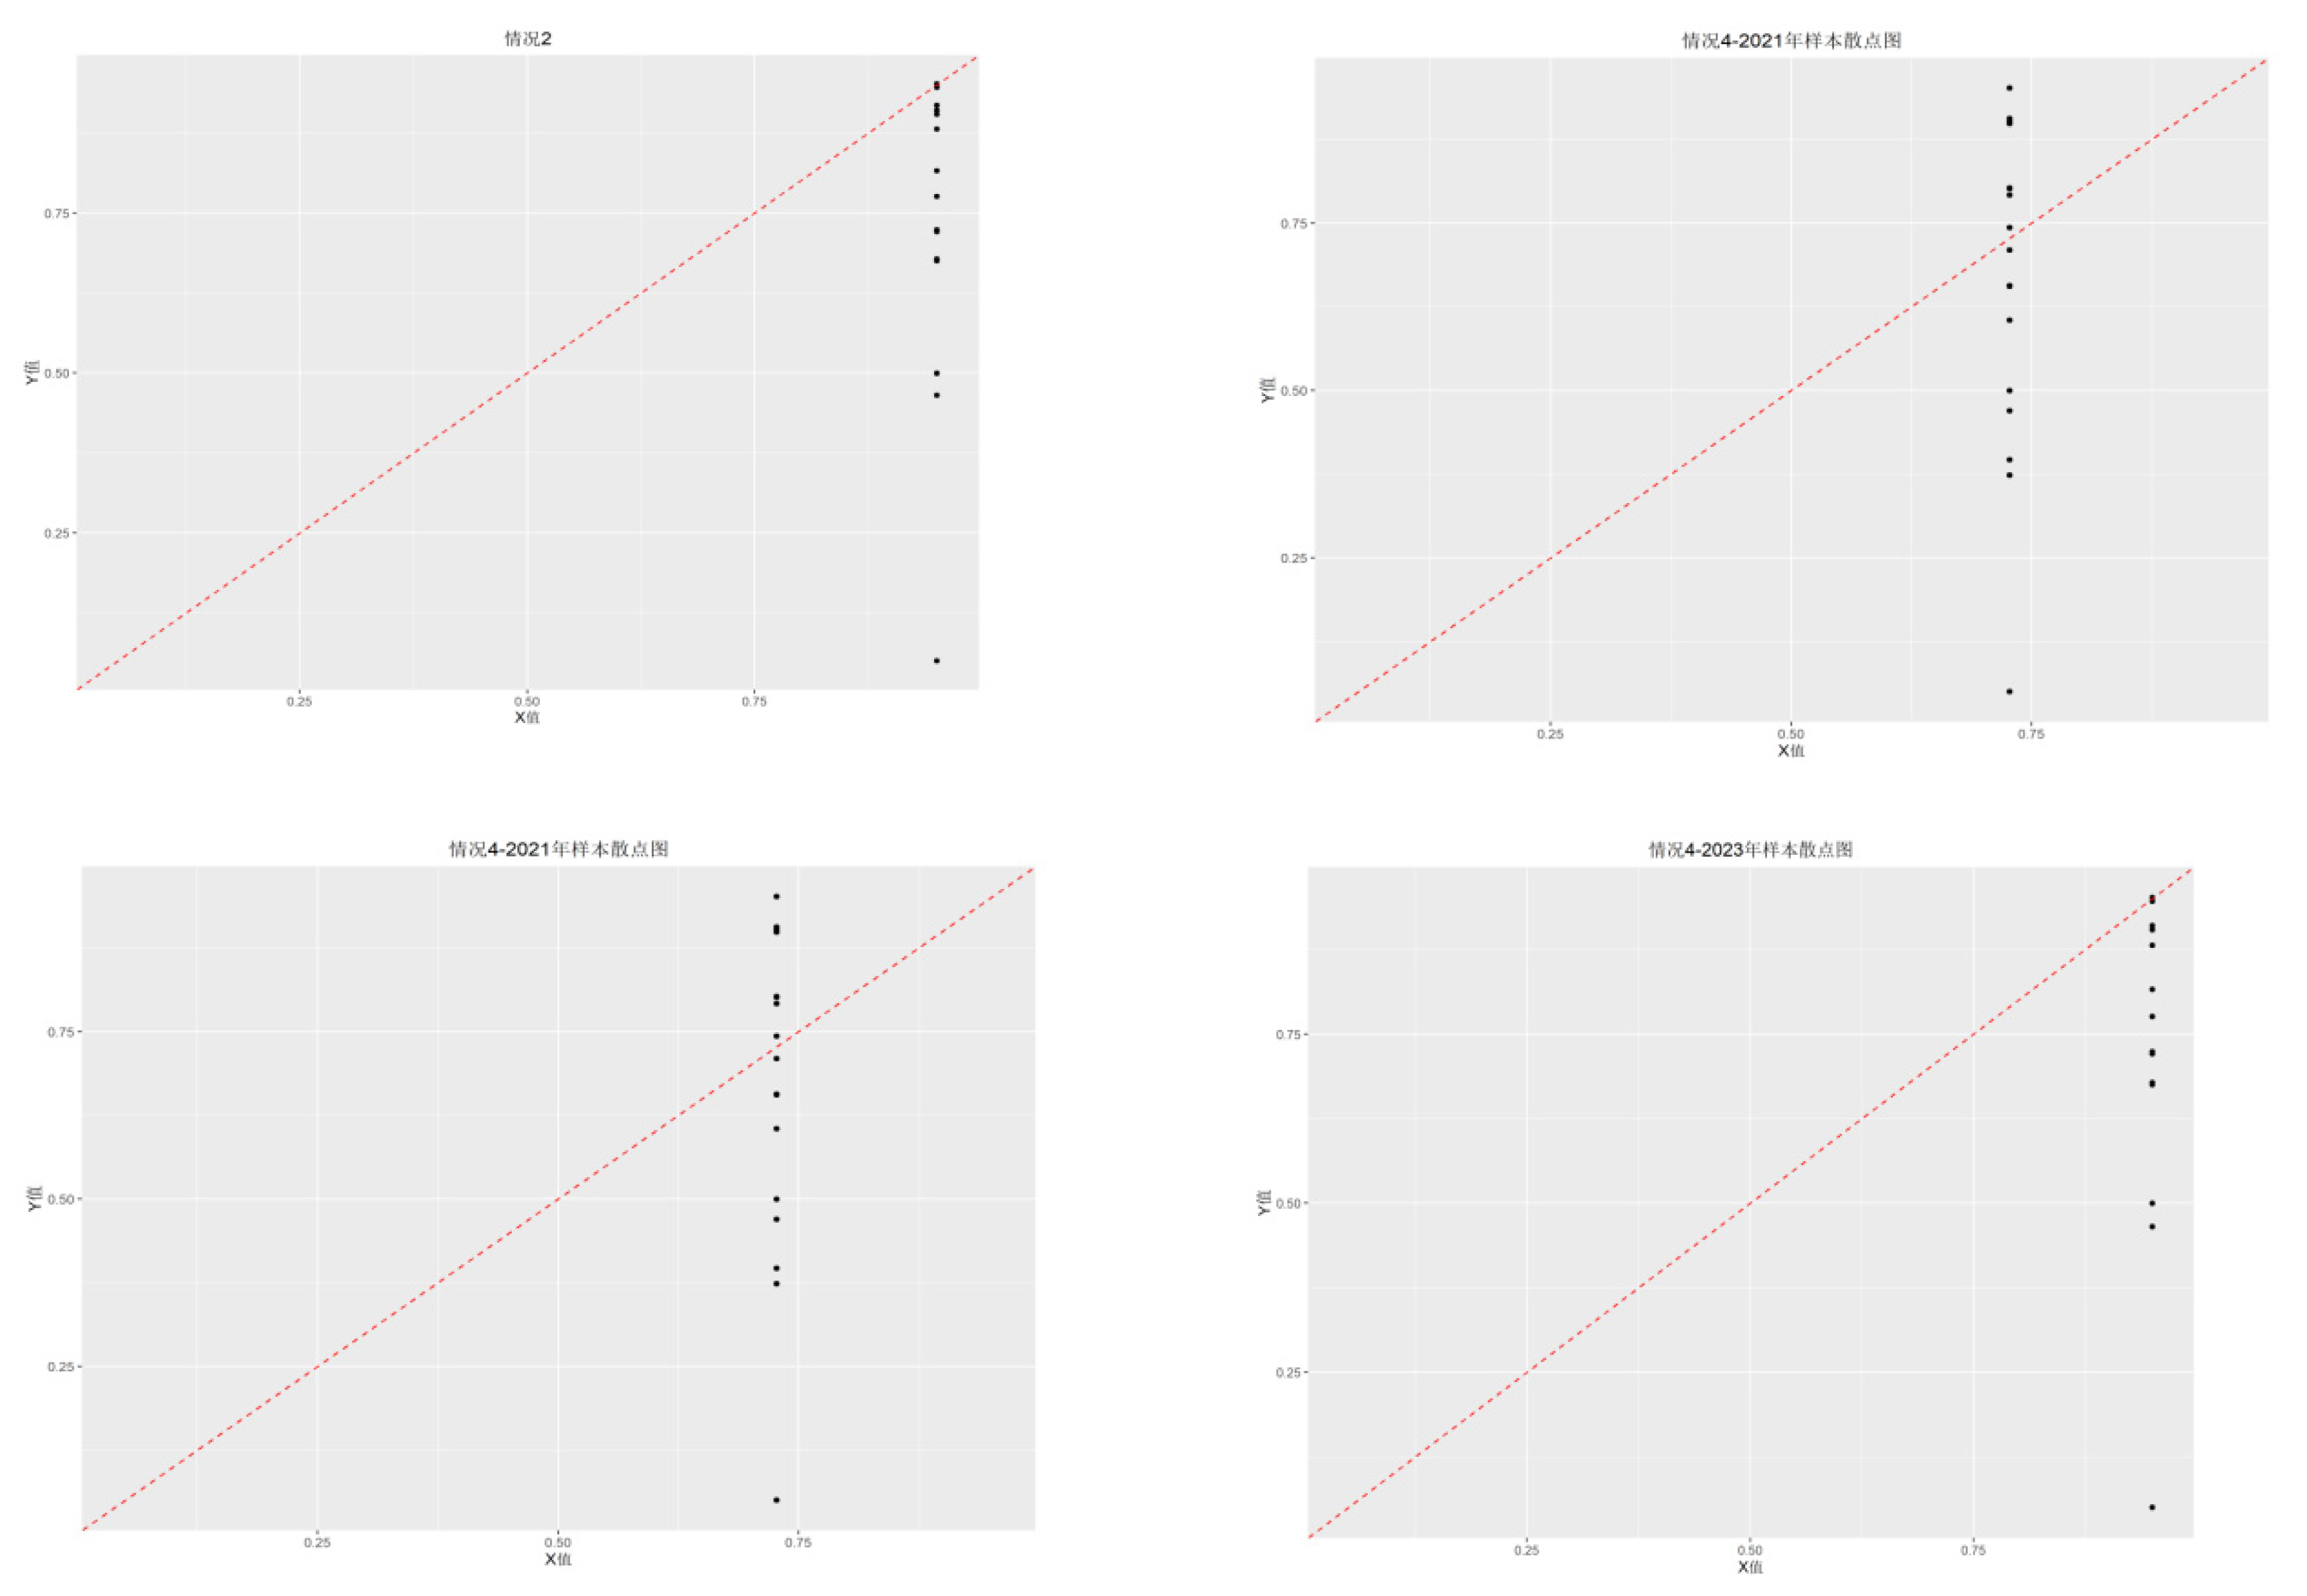
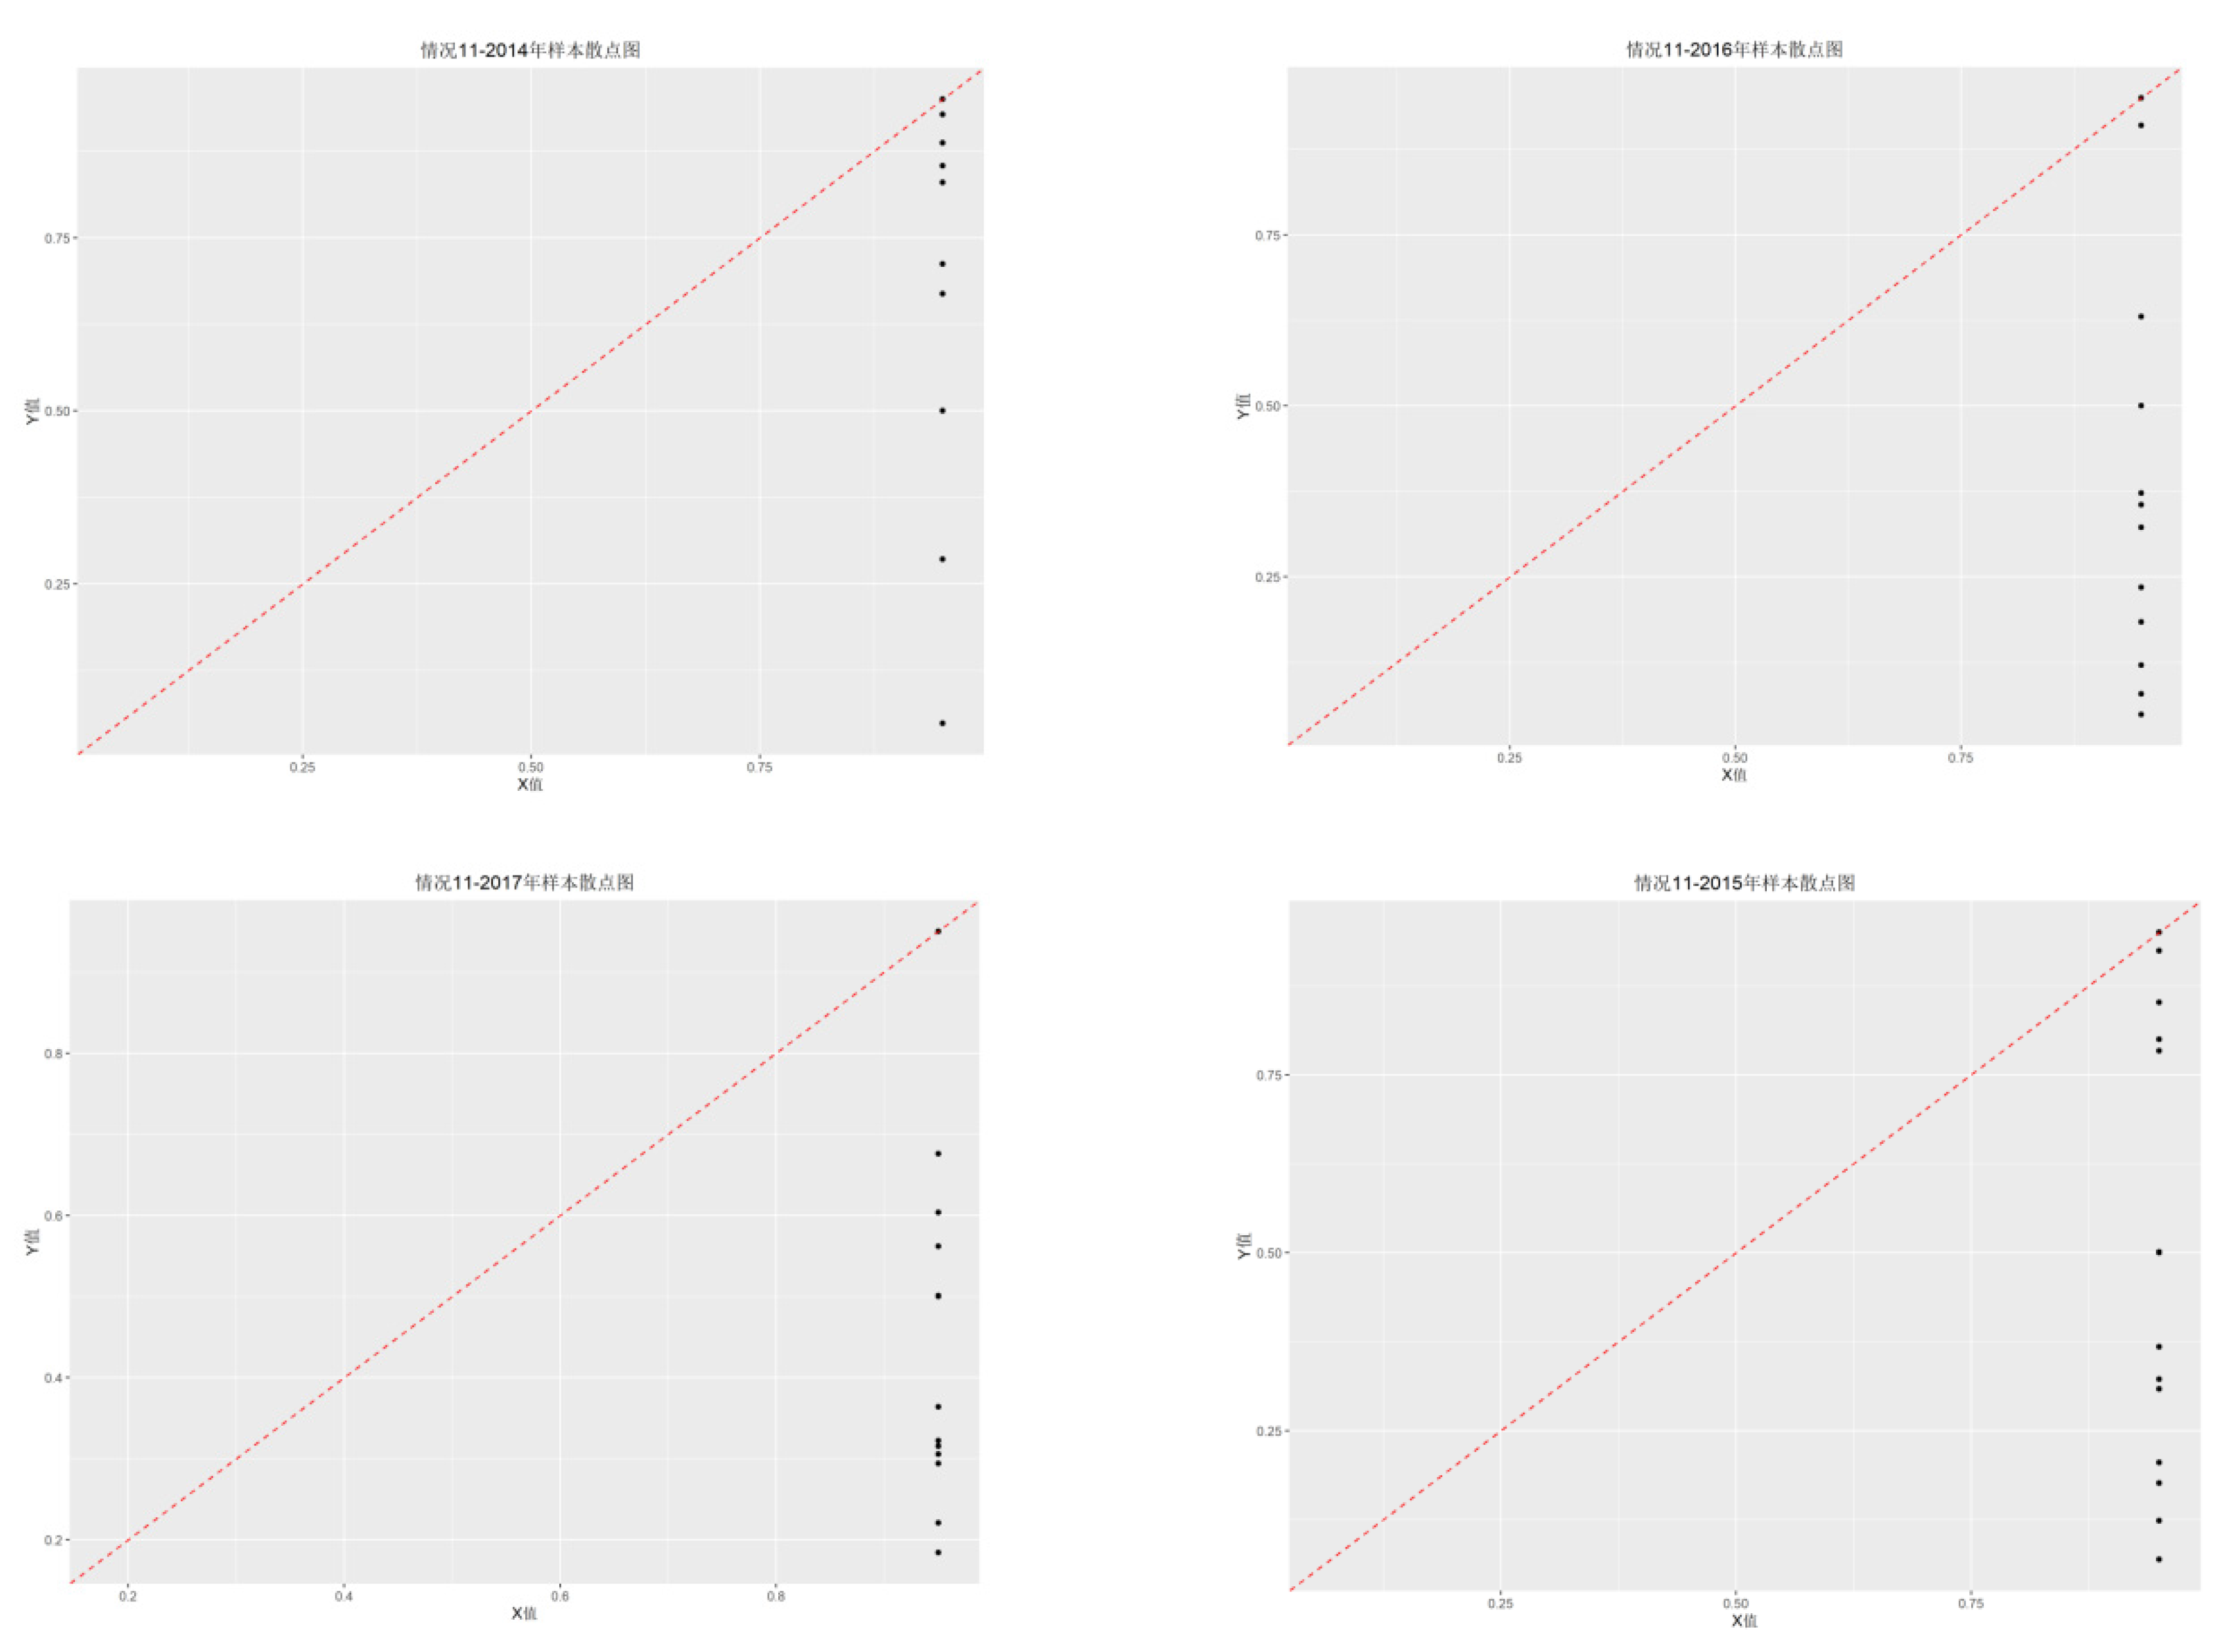
Table 1.
Measurement and Calibration of Condition Variables and Outcome Variables.
| Conditions and results | Indicator measurement | Calibration | |||
| Full membership | Crossover point | Full non membership | |||
| Result variable |
Green Innovation Performance |
Proportion of authorized green invention patents | 4.4517 | 3.8102 | 3.1687 |
| Conditional variable |
Digital technology | Intangible assets of digital technology/Total assets | 4.3444 | 3.2660 | 2.1876 |
| R&D investment | R&D Investment/operating income | 4.7292023 | 3.9675023 | 3.2058023 | |
| Organizational resilience | Asset-liability ratio | 4.3395 | 3.5010 | 2.6625 | |
| Enterprise growth potential | Growth rate of new energy sales revenue | 4.5394 | 3.7665 | 2.9936 | |
| Dual credit policy | Double integral ratio | 4.6506 | 3.7911 | 2.9316 | |
| Industry competition | Herfindahl-Hirschman Index | 40.166 | 33.8400 | 27.514 | |
| Investor attention | Natural logarithm of the average search volume | 5.0417 | 4.1420 | 3.2423 | |
Table 5.
Configuration for High / Non-High Green Innovation Performance.
| Conditional variable | High level of green innovation performance | ||||
| C1 | C2 | C3 | C4 | C5 | |
| Digital technology | ● | ● | ● | ● | ● |
| R&D investment | ● | ⊗ | ● | ||
| Organizational resilience | ● | ● | ● | ⊗ | |
| Enterprise growth potential | ● | ● | ● | ⊗ | |
| Dual credit policy | ● | ● | ● | ● | ● |
| Industry competition | ● | ● | ⊗ | ||
| Investor attention | ● | ● | ● | ||
| Consistency | 0.914 | 0.917 | 0.899 | 0.912 | 0.896 |
| PRI | 0.747 | 0.688 | 0.654 | 0.706 | 0.606 |
| Coverage | 0.250 | 0.249 | 0.271 | 0.226 | 0.200 |
| Unique coverage | 0.033 | 0.012 | 0.018 | 0.023 | 0.023 |
| Adjust the distance for consistency between groups | 0.087 | 0.072 | 0.083 | 0.087 | 0.158 |
| Adjustment distance for consistency Intra-group |
0.152 | 0.172 | 0.177 | 0.162 | 0.162 |
| Consistency of overall solution | 0.875 | ||||
| PRI of overall solution | 0.700 | ||||
| Coverage of overall solution | 0.383 | ||||
Note: • or •means the condition exists, ⊗ or ⊗ means the condition does not exist; • or ⊗ stands for core condition, •or ⊗ for edge condition.
Disclaimer/Publisher’s Note: The statements, opinions and data contained in all publications are solely those of the individual author(s) and contributor(s) and not of MDPI and/or the editor(s). MDPI and/or the editor(s) disclaim responsibility for any injury to people or property resulting from any ideas, methods, instructions or products referred to in the content. |
© 2026 by the authors. Licensee MDPI, Basel, Switzerland. This article is an open access article distributed under the terms and conditions of the Creative Commons Attribution (CC BY) license (http://creativecommons.org/licenses/by/4.0/).
Copyright: This open access article is published under a Creative Commons CC BY 4.0 license, which permit the free download, distribution, and reuse, provided that the author and preprint are cited in any reuse.


