
Submitted:
14 January 2026
Posted:
16 January 2026
You are already at the latest version
Abstract
We analyzed the behavior of a “Solar Wall” and validated the apparatus with three nanofluids (silver, titanium dioxide and a hybrid compound) in view of their photothermal conversion performance. The factors considered were the temperature gain in relation to the base fluid, the stored energy and the specific absorption rate. A cost survey was carried out to find out the profit of each nanofluid. Five concentrations were studied for each nanofluid. A hybrid nanofluid formed by the previous ones was also tested. The results presented that the Solar Wall has achieved repeatability, and we can state that it is suitable for the tests on other nanofluids. The silver and hybrid nanofluids performed better, the first obtained a temperature gain of 10.2 °C compared to the base fluid and the hybrid reached 9.9 °C. Regarding the energy gain, the silver-based obtained a gain of 31.93%, and the hybrid obtained 34.52%. The SAR values for the silver nanofluid were higher than the titanium-based, nevertheless the cost to generate an energy unit using the former was higher than in the titanium case. The silver-based and the hybrid nanofluids obtained improved photothermal conversion, being the most promising options.
Keywords:
renewable energy
; solar thermal conversion
; solar wall
; nanofluids
; cost assessment
1. Introduction
Concerns about environmental causes have been a major issue at the moment, since one of the main factors is linked to the use of fossil fuels, which has been causing great degradation to nature. The generation of energy from conventional sources has resulted in environmental degradation that can be seen by pollution levels, acid rain, global warming, etc. [1]. Due to this problem, the search for renewable energy has increased significantly in recent years, when it has been an object of study by scientists and professionals [2]. One of the notable renewable energy sources is solar energy, which has applications both for converting solar energy into electrical (photovoltaic) and for converting solar energy into thermal energy, which thereafter can be applied for heating fluids for domestic and industrial use or electrical energy generation by power cycles.
The use of thermal energy to heat fluids occurs through the use of solar collectors, where the efficiency of a collector is a parameter of study that is often limited [3,4,5]. Conventional fluids that are used in solar systems are very limited in relation to their capacity and thermal properties, so the use of nanofluids can be indicated to solve this type of problem [6]. Nanofluids are constituted by nanoparticles dispersed in a base fluid with a size ranging from 1 nm to 100 nm. In recent results, it has been shown that characteristics such as thermal conductivity, viscosity, thermal diffusivity and heat transfer coefficient have been improved when compared to conventional fluids [7]. Nanoparticles can be made of several materials, such as metals, non-metals, oxides, carbides, mixtures of nanoparticles (hybrid fluids), etc. [8,9,10].
Recent research on nanofluids has demonstrated their superiority compared to common fluids, showing that they have great heat transfer potential [11]. A study in which a silver nanofluid was applied in an evacuated tube solar collector showed a 40% improvement in efficiency [12]. Another study performed on a ribbed flat plate solar collector showed an improvement of 10% in the efficiency of the collector [2]. Zinc oxide increased the efficiency of a U-tube solar collector by 62.87% [13]. A new category of nanofluids is under study, called hybrid nanofluids, which are formed by the agglomeration of two or more nanoparticles in a base fluid. Recent research has revealed that the hybrid nanofluids have been increasingly outperforming ordinary nanofluids, thus enhancing their thermal properties when dispersed in the base fluid.
Graphene oxide and gold formed a hybrid solution and improved the efficiency of steam generation by 10.8% [14], the hybrid nanofluid TiO2-MWCNT obtained a maximum increase in thermal conductivity by 34.31% [7], the ternary nanoparticles rGO-Fe3O4-TiO2 showed an improvement in thermal conductivity by 13.3% [15], Fe3O4/SiO2 improved the efficiency of a solar collector in 21.7% [16] and the thermal conductivity using SWCNTs-MgO was increased by 35% at a temperature of 50° C [17]. Much other research has also revealed a higher thermal conductivity of nanofluids compared to the base fluid [18,19,20,21].
Another practical limitation that may be cited, in the case of solar collectors, is the efficiency with which energy is transferred to the fluid. In this way, studies were made on direct absorption solar collectors (DASC), where the fluid directly absorbs solar energy, thus mitigating the efficiency limitation in this regard. A balance was observed between the temperature and power gain in direct absorption solar collectors, where the efficiency of 55% was observed without major losses in temperature gain [22], and the efficiency of 40% in heating for direct steam generation using gold nanofluids was found [23].
In front of the recent research efforts that test nanofluids aiming at their characterization, this work built, field tested and analyzed an apparatus called “Solar Wall”, taking into consideration that it might be able to standardize the testing of different types of nanofluids, under direct radiation absorption. In our Solar Wall, several concentrations of silver nanofluid, titanium dioxide and a hybrid compound were used to verify in a uniformed fashion if the results of photothermal conversion capacity were consistent with those presented in the literature. One of the main focuses was to validate the Solar Wall layout suitability for this task. Temperature gains in relation to the base fluid, total stored energy and the specific absorption rate per unit of mass (SAR) was measured and analyzed. In addition, the work estimated the production costs of an energy unit (kW) for each tested nanoparticle.
This work is outlined as follows: after this introduction, the employed materials and methods are presented with the experimental configuration (Section 2); in Section 3 the data acquisition procedures are detailed; in Section 4 the tested nanofluids are characterized; the results are presented and discussed in Section 5; Section 6 depicts the evaluation of the stored energy, while the economic viability is presented in Section 7; finally the conclusions are drawn in Section 8.
2. Materials and Methods
Figure 1 shows an experimental apparatus called “Solar Wall”, which was designed and built to accomplish the research objectives, i.e., to uniformly compare the performance of different nanofluids. Similar devices are available for the purpose of analyzing nanofluids [3], and in this sense, our intention was to use them as a model to standardize the performance values obtained. The bench was composed of an aluminum structure with glass cells at the bottom and at the top, each cell had two tempered glasses and between them there was the nanofluid, occupying a volume of 3.5 L. The dimensions of the glasses were as follows: 8 mm thick, 1000 mm in length and 500 mm in height. In order to minimize convection losses, two extra glasses were inserted in each cell, where the external glasses were 4 mm thick. A white paint coating was used on the aluminum structure to prevent its heating and, consequently, not to influence the cell temperature. In addition, steel cables supported the structure.
2.1. Data Acquisition
During the experiments, six type K thermocouples were used. They have 0.1 °C accuracy, 2 Hz frequency. They were calibrated in a thermostatic bath against a glass thermometer. Three of the thermocouples were placed in the lower cell, and the other three were placed in the corresponding positions of the upper cell. They were equally spaced and fixed with resin support. The registered temperature was given by the arithmetic mean of the three measurements in each cell. For data acquisition, a Datalogger model RX12 OMEGA was used. The experiments were carried out at the Solar Energy and Natural Gas Laboratory (LESGN) of the Federal University of Ceará in the city of Fortaleza (Latitude: 03° 43’ 02’’ south, Longitude: 38° 32’ 35'' west) in the period between 20/06/2019 and 10/16/2019. The measurements were taken from 5:30 am to 9:30 pm, since before that time it was still possible to verify a temperature differential of the nanofluid compared to the distilled water. The experimental apparatus had one side facing east and the other facing west, in such a way that the incidence of solar radiation occurring before and after noon penetrated through the cells as shown in Figure 2.
The temperature distribution over the surface of the glasses was also verified with the aim of correcting any position deviation from the measured temperatures, and thus giving more reliability to the data obtained. A higher temperature was registered in the lower glasses due to the reflection of the sun’s rays coming from the ground, as can be seen in Figure 3. Several tests were done only with the base fluid inside the two cells in order to develop a correction equation that equalizes the temperature curves for each test instant. The effect was corrected by a polynomial regression () in such a way that the data of the temperature curves of the lower and upper glasses were then correspondent.
2.2. Characterization of the Nanofluids
The experiments were carried out using water-based nanofluids of silver and titanium dioxide (TiO2) in several concentrations. The titanium dioxide nanofluid was obtained by dispersing TiO2 nanoparticles in water using ultrasound. In a different way, the production of silver nanofluid consists of a chemical reduction of silver nitrate to form the nanoparticles in the nanofluid itself. Five concentrations were studied for silver and titanium dioxide nanofluids, according to Table 1.
The nanofluids with the same molar concentration (mol/L) have different proportions in volume (ppm v/v) because of the difference in their density, but for comparison, it was preferable to consider equal values of molar concentrations. Also seeking to improve the performance of the nanofluids, an analysis of hybrid nanofluids made of silver and titanium was carried out, where the titanium nanoparticle (23.2 ppm) was doped with the increase of several amounts of silver (0.40625; 0, 8125; 1.625; 3.25), corresponding to the molar fractions of 3%, 6%, 12% and 25% respectively. The quantity of titanium dioxide remained fixed, since previous experiments showed the superiority of silver. In this sense, we applied the best concentration of titanium with silver increments. Table 2 details these samples.
3. Results
3.1. Temperature Gain of Nanofluids
An analysis was done to determine how much the nanofluid achieved in temperature gain over the base fluid during the experiment. Figure 4 shows the temperature gains of the titanium dioxide nanofluid compared to water. The temperature profile has an upward trend until 12:00, and just after a drop in this temperature, since the angle of incidence of the solar rays to the Solar Wall reaches near parallel values, which causes this temperature drop. In the second half of the day, the temperature profile returns to normal behavior and presents similar values. Figure 5 shows the maximum gain for each concentration of TiO2 nanofluid, which establishes that the higher the concentration of nanoparticles, the greater the gain. The concentration of 23.2 ppm showed a gain in temperature of 2.7 °C (increase of 5%), i.e. an advantage with a little relative expression, since the nanofluid of 1.45 ppm reaches a very similar gain. This poor relative performance may justify not using the 23.2 concentration, because the 1.45 ppm concentration already makes it possible to obtain similar gains, and the expense with nanoparticles is lower. The comparison against the silver nanofluid will give even more reasonability to this choice. One of the limiting factors that may have caused the low temperature gain of this nanofluid is its white color, which may be responsible for the partial reflection of the sun’s rays, even though it presents a higher thermal conductivity than water.
Some studies also found that TiO2 nanofluids were not so promising for direct absorption, always obtaining inferior results when compared to other nanofluids [24,25].
The same analysis was carried out for the silver nanofluids, where one can notice that the temperature profile of both nanofluids is very similar. It is noteworthy strong correlation between the concentrations and the temperature gain, as can be seen in Figure 6. Silver nanofluids have reached energy gains well above titanium nanofluids, showing a maximum gain of 14° C (26% gain compared to the base fluid) for a 6.5 ppm concentration (Figure 7). Silver nanofluids gains related to increasing concentrations were very expressive too. In this analysis, it can be seen that the strong influence that the concentration of nanoparticles has on the temperature increase, implying in both cases that the higher the concentration, the higher the energy gain. For other authors, silver obtained satisfactory results accordingly. In [3], the authors found that silver nanofluids provided a 144% increase in stored energy.
Figure 8 depicts a similar analysis for the hybrid nanofluid, and once again, the same shape as the temperature profile was noticed when compared to the isolated nanofluids, thus showing the good repeatability of the Solar Wall to collect temperature data. The quantity of titanium nanoparticles of 23.2 ppm was fixed, and the nanofluids were doped with a double-wise increase in silver nanoparticles (0.4025, 0.8125, 1.625, 3.25 ppm). As a result, the hybrid nanofluid with a 25% molar fraction achieved a gain of 9.9 °C, an improvement of 18.3% over the base fluid. Figure 9 shows behavior for the hybrid nanofluid, in such a way that the higher the proportion of silver in the titanium nanoparticles, the greater the temperature gain, being a prominent factor in this work. It is noteworthy that this gain reaches values higher than the algebraic sum of the isolated gains from silver and titanium dioxide nanofluids.
These findings can be explained because the hybrid fluid is not a mixture of two nanoparticles, i.e., Ag + TiO2, in the water-based fluid. Instead, the silver nanoparticles are formed onto TiO2 nanoparticles dispersed in water by chemical reduction of silver nitrate. These approaches cause a significant difference in the ultraviolet light absorption spectra of the fluids.
Figure 10 shows a laboratory experiment in which four types of nanofluids, namely silver, titanium oxide, a mixture of these two nanofluids and a hybrid Ag/TiO2 nanofluid, were analyzed by UV-VIS Silver nanofluid is characterized by a pick absorption at 415 nm (red line), while TiO2 spectrum shows a wide band at 240 nm to 280 nm (green line). A mixture of these two nanofluids in the same proportion as the hybrid fluid results in almost the same shape of the curve (orange line) as the calculated algebraic sum of two separate spectra (dashed black lines). Differently, hybrid Ag/TIO2 nanofluid presents an absorption curve (blue line) that reveals, in addition to the two characteristic bands of TiO2 and Ag, a new broad band between 480 nm and 740 nm that is not seen in the original fluids or in their mixture. It means the new nanoparticles are formed as a composite of both species, corroborating to increasing the light absorption.
A comparison was made of the three situations involved in the tests with the solar wall. Figure 11 shows the maximum temperature gain for each molar fraction of the hybrid and the corresponding concentrations of silver and titanium dioxide nanofluids. It is noticed that the hybrid nanofluid has a remarkably higher gain than the silver and titanium in the case of 3% molar fractions. Nevertheless, the silver nanofluid achieves greater differential gains with increasing concentrations, and it finally reaches temperature gains even higher than the hybrid nanofluid. Figure 12 shows that the 3.5 ppm silver nanofluid was able to achieve a temperature gain of 10.2 °C, while the hybrid nanofluid reached a value of 9.9 °C. Therefore, it is possible to infer the unfeasibility (regarding the temperature gain) of the hybrid nanofluid for higher silver concentrations.
3.2. Total Energy Stored
The total energy stored in the nanofluids was calculated during the heating period:
where and are the mass, specific heat and temperature and the subscript refers to the nanofluid.
The energy gain obtained by each nanofluid tested was calculated relative to the base fluid, for which the results are shown in Figure 13. The four samples of the hybrid nanofluid were compared with the nanofluids of silver and titanium dioxide. The hybrid nanofluid has always obtained a greater energy gain for all samples, while the titanium dioxide obtained gains much lower than the other nanofluids. The silver nanofluid started out with a relatively small energy gain, but increasing its concentration leads the values to a result more equivalent to that of the hybrid, such that the most concentrated silver nanofluid shows an energy gain of 31.93% compared to the base fluid, while the hybrid obtained an energy gain of 34.52% (e.g. titanium dioxide obtained 9.04%). These results show once again the effectiveness of the use of the solar wall, where a better performance of the hybrid nanofluid was expected and confirmed in comparison to the isolated nanofluids, even when this reaches a relative small amount.
3.2. Economic Viability Evaluation
The cost for applications using nanofluids must also be taken into account, as it is an important factor in industrial analysis. The cost evaluation regarding the performance of nanofluids was studied in this work, where the relationship between the price of the nanoparticle and the capacity of the nanoparticle to generate thermal energy was estimated; that is, the cost to generate a thermal energy unit was investigated [26].
in our evaluation, the specific absorption rate per unit mass is given by:
where represents mass, is specific heat, is temperature, and is time. The subscripts , and represent the base fluid, nanofluid and nanoparticle, respectively.
Figure 14. shows that silver nanofluids have a SAR consistently higher than titanium dioxide ones, for corresponding concentrations, and thus have greater absorption capacity per unit of mass. Nevertheless, in Figure 14, Figure 15 and Figure 16, it can be seen the economic viability for the production of nanofluids with these nanoparticles, where the cost of silver nanofluid to produce 1 kW of energy at a concentration of 0.40625 ppm is close to US $10, while the cost of producing 1 kW of energy for TiO2 at the highest concentration of 23.2 ppm is close to US $0.49. Through this comparison, the highest cost of silver is perceived, but when analyzing the type of application, the cost-benefit of nanofluids must be taken into account, too.
5. Conclusions
The work presented experimental modelling to analyze the ability of a Solar Wall to collect nanofluid analysis data in a standard procedure. It proved to be suitable for the evaluation of direct absorption of solar irradiation by nanofluids, where the photothermal conversion capacity of three types of nanofluids, namely silver, titanium dioxide and yet another hybrid compound formed by the union of the previous nanoparticles, was verified. After all, the following conclusions could be drawn:
- The Solar Wall device was found to be suitable for direct energy absorption tests, where the results showed good repeatability for three different types of nanofluids in several concentrations.
- Regarding the temperature gain, titanium dioxide nanofluids were not as effective as the silver nanofluids and the hybrid compounds. Silver obtained a gain of 10.22 °C in the nanofluid concentration of 3.5 ppm, while the hybrid obtained a gain of 9.97 °C in the molar fraction of 25%, thus indicating the impracticability of a higher molar fraction for the hybrid compound, since silver alone leads to a better result.
- At a maximum concentration (i.e. 23.2 ppm of TiO2), the nanofluid achieves an energy gain in relation to the base fluid of less than 10% and the additional increase in concentrations did not imply any significant energy gain. This fact justifies not using higher concentrations, since 1.45 ppm already obtains similar results to those of high concentrations.
- For the concentrations studied, silver nanofluids have obtained significant improvements, reaching an energy increase of up to 45.75% for the concentration of 6.5 ppm in comparison with the base fluid.
- The comparison between the three types of nanofluids indicated a better performance of the hybrid nanofluid in the Solar Wall, which achieves an energy gain of 34.52% in the molar fraction of 25%, while the silver in the concentration of 3.5 ppm obtained an increase of 31.93% in the concentration of 3.5 ppm and the titanium dioxide gained 9.04%.
- Silver nanofluids have shown a direct absorption capacity per unit mass always greater than that of titanium dioxide.
- Regarding the temperature gain, it could be perceived that at some point silver overtakes the hybrid nanofluid, while titanium dioxide does not achieve comparable gains.
- It can be perceived too that silver nanofluids increase the energy gain faster than the hybrid nanofluids, until a moment that these gains become practically the same.
- Considering the cost analysis, silver is less economically viable, as it needs U$10 to produce an energy unit (kW) approximately, whereas titanium dioxide needs U$0.49.
Author Contributions
Ricardo José Pontes Lima-data acquisition, data curation, writing; Juarez Pompeu de Amorim Neto-data acquisition, data curation, writing; Vanja Fontenele Nunes-writing, review and editing; André Valente Bueno-review and supervision; Carla Freitas de Andrade-review and supervision; Maria Eugênia Vieira da Silva-resources and supervision; Paulo Alexandre Costa Rocha-writing, resources, editing, review and supervision.
Funding
This study was financed in part by the Coordenação de Aperfeiçoamento de Pessoal de Nível Superior - Brasil (CAPES) - Finance Code 001 and accomplished with the support of the Conselho Nacional de Desenvolvimento Científico e Tecnológico - Brasil (CNPq) - Grant no. 303585/2022-6 and 405896/2016-6, both Brazilian governmental agencies.
Data Availability Statement
Data will be provided if requested.
Conflicts of Interest
The authors declare no conflicts of interest.
References
- Suman, S.; Khan, M. K.; Pathak, M. Performance enhancement of solar collectors - A review. Renew. Sustain. Energy Rev., 2015, v. 49, p. 192 – 210. [CrossRef]
- Bazdidi-tehrani, F; Khabazipur, A; Vasefi, S. I. Flow and heat transfer analysis of TiO2/water nanofluid in a ribbed flat-plate solar collector. Renew. Energy, 2018, v. 122, p. 406 – 418. [CrossRef]
- Bandarra filho, E. P.; Mendoza, O. S.H.; Beicker, C.L.L.; Menezes, A.; Wen, D. Experimental investigation of a silver nanoparticle-based direct absorption solar thermal system. Energy Convers. Manag., 2014, v. 84, p. 261 – 267. [CrossRef]
- Gopalsamy, V.; Rajasekaran, K.; Baccoli, R. Experimental and analytical evaluation of nanofluid based parabolic trough solar collector under varying concentrations, flow rates, and ambient temperatures, Case Stud. Therm. Eng., 2025, v. 75, 107219. [CrossRef]
- Elmnifi, M.; Aleksandrovna, D.T.; Fadiel, A.F.A.; Shehata, A.I.; Moharram, N.A.; Taha, A.A.Unlocking hybrid solar efficiency: Experimental integration of aluminum foam fins and nanofluids in PVT collectors. RINENG, 2026, v.29,108751. [CrossRef]
- Ebrahimi-moghadam, A.; Mohseni-Gharyehsafa, B.; , Farzaneh-Gord, M. Using artificial neural network and quadratic algorithm for minimizing entropy generation of Al2O3-EG/W nanofluid flow inside parabolic trough solar collector. Renew. Energy, 2018, v. 129, p. 473 – 485. [CrossRef]
- Moradi, A.; Zareh, M.; Afrand, M. Khayat, M. Effects of temperature and volume concentration on thermal conductivity of TiO2-MWCNTs (70-30)/EG-water hybrid nano-fluid. Powder Technol., 2020, v. 362, p. 578-585. [CrossRef]
- Amorim Neto, J.P.de; Lima, Pontes, R.J.; Rocha, P.A.C. Marinho, F.P.; Silva, m.e.v. análise experimental de um sistema solar térmico utilizando nanofluido híbrido de prata e dióxido de titânio. Tchê Quím., 2020, v. 17, n. 34, p. 448-458.
- Sainz-Manas, M.; Vossier, A.; Garcia, R.; Caliot, C.; Bataille, F.; Flamant, G. On-sun performance and stability of graphene nanofluids in concentrating direct absorption solar collectors. Sustain. Energy Technol. Assess.,2025, v. 83, 104605. [CrossRef]
- Sathish, T.; Santhosh, A.J. Colloidal Er2O3 nanofluids for enhanced thermal and exergy performance of flat plate solar collectors: Interfacial insights and energy sustainability implications. Int. J. Thermofluids. 2025, v.30, 101478. [CrossRef]
- Beicker, C. L. L.; Amjad, M.; Filho, E.P.B.; Wen, D. Experimental study of photothermal conversion using gold/water and MWCNT/water nanofluids. Sol. Energy Mater. Sol. Cells, 2018, v. 188, p. 51 - 65. [CrossRef]
- Ozsoy, A; Corumlu, V. Thermal performance of a thermosyphon heat pipe evacuated tube solar collector using silver-water nanofluid for commercial applications. Renew. Energy, 2018, v. 122, p. 26 – 34. [CrossRef]
- Kaya, H; Arslan, K; Eltugral, N. Experimental investigation of thermal performance of an evacuated U-Tube solar collector with ZnO/Etylene glycol-pure water nanofluids. Renew. Energy, 2018, v. 122, p. 329 - 338. [CrossRef]
- FU, Y.; Mei, T.; Wang, G.; Guo, A.; Dai, G.; Wang, S.; Wang, J.; Li, J.; Wang, X. Investigation on enhancing effects of Au nanoparticles on solar steam generation in graphene oxide nanofluids. Appl. Therm. Eng., 2017, v. 114, p. 961 - 968. [CrossRef]
- Cakmak, N. K.; Said, Z.; Sundar, L.S.; Ali, Z.M.; Tiwari, A.K. Preparation, characterization, stability, and thermal conductivity of rGO-Fe3O4-TiO2 hybrid nanofluid: an experimental study. Powder Technol., 2020, v. 372, p. 235-245. [CrossRef]
- Karami, M. Experimental investigation of first and second laws in a direct absorption solar collector using hybrid Fe3O4/SiO2 nanofluid. J Therm Anal Calorim, 2018, v. 136, n. 2, p. 661 - 671. [CrossRef]
- Esfe, M. H.; Esfandeh, S.; Amiri, M.K.; Afrand, M.. A novel applicable experimental study on the thermal behavior of SWCNTs(60%)-MgO(40%)/EG hybrid nanofluid by focusing on the thermal conductivity. Powder Technol., 2019, v. 342, p. 998-1007. [CrossRef]
- Suresh, S. Venkitaraj, K.P.; Selvakumar, P.; Chandrasekar, M. Synthesis of Al2O3–Cu/water hybrid nanofluids using two step method and its thermo physical properties. Colloid Surf. A-Physicochem. Eng. Asp, 2011, v. 388, p. 41 - 48. [CrossRef]
- Buonomo, B; Manca, O; Marinelli, L; Nardini, S. Effect of temperature and sonication time on nanofluid thermal conductivity measurements by nano-flash method. Appl. Therm. Eng., 2015, v. 91, p. 181 - 190. [CrossRef]
- Khedkar, R. S; Shrivastava, N; Sonawane, S. S; Wasewar, K. L. Experimental investigation and theoretical determination of thermal conductivity and viscosity of TiO2-ethylene glycol nanofluid. Int. Commun. Heat Mass Transf., 2016, v. 73, p. 54 - 61. [CrossRef]
- Alfellag, M.A.; Kazi, S.N.; Hasnain, S.U.; Nawaz, R.; Shaikh, K. Experimental evaluation of flat-plate solar collector performance with eco-friendly MWCNTs/hBN hybrid nanofluids: energy, exergy, hydrothermal, economic, and environmental analysis. Energy, 2025, v. 339, 139070. [CrossRef]
- Sharaf, O. Z.; Al-Khateeb, A.N.; Kyritsis, D.C.; Abu-Nada, E. Energy and exergy analysis and optimization of low-flux direct absorption solar collectors (DASCs): balancing power- and temperature-gain. Renew. Energy, 2019, v. 133, p. 861-872. [CrossRef]
- Wang, X.; He, Y.; Liu, X.; Shi, L.; Zhu, J. Investigation of photothermal heating enabled by plasmonic nanofluids for direct solar steam generation. Sol. Energy, 2017, v. 157, p. 35-46. [CrossRef]
- He, Y.; Wang, S.; Ma, J.; Tian, F.; Ren, Y. Experimental Study on the Light-Heat Conversion Characteristics of Nanofluids. Nanosc. Nanotechnol. Lett., 2011, v. 3, p. 494-496. [CrossRef]
- Amjad, M.; Zeiny, A.; Raza, G.; Bai, L Photothermal Conversion Characteristics of Direction Solar Absorption Nanofluids, Crossroads of Particle Science and Technology - Joint Conference of 5th UK-China and 13th UK Particle Technology Forum, 2015.
- Zeiny, A.; Jin, H.; Bai, L.; Lin, G.; Wen, D. A comparative study of direct absorption nanofluids for solar thermal applications. Sol. Energy, 2018, v. 161, p. 74-82. [CrossRef]
Figure 1.
Designed and built Solar Wall for data acquisition. On the left, a picture of the mounted system is shown, whereas on the right, a schematic of the side view is depicted. The circles indicate the positions of the temperature sensors.
Figure 1.
Designed and built Solar Wall for data acquisition. On the left, a picture of the mounted system is shown, whereas on the right, a schematic of the side view is depicted. The circles indicate the positions of the temperature sensors.
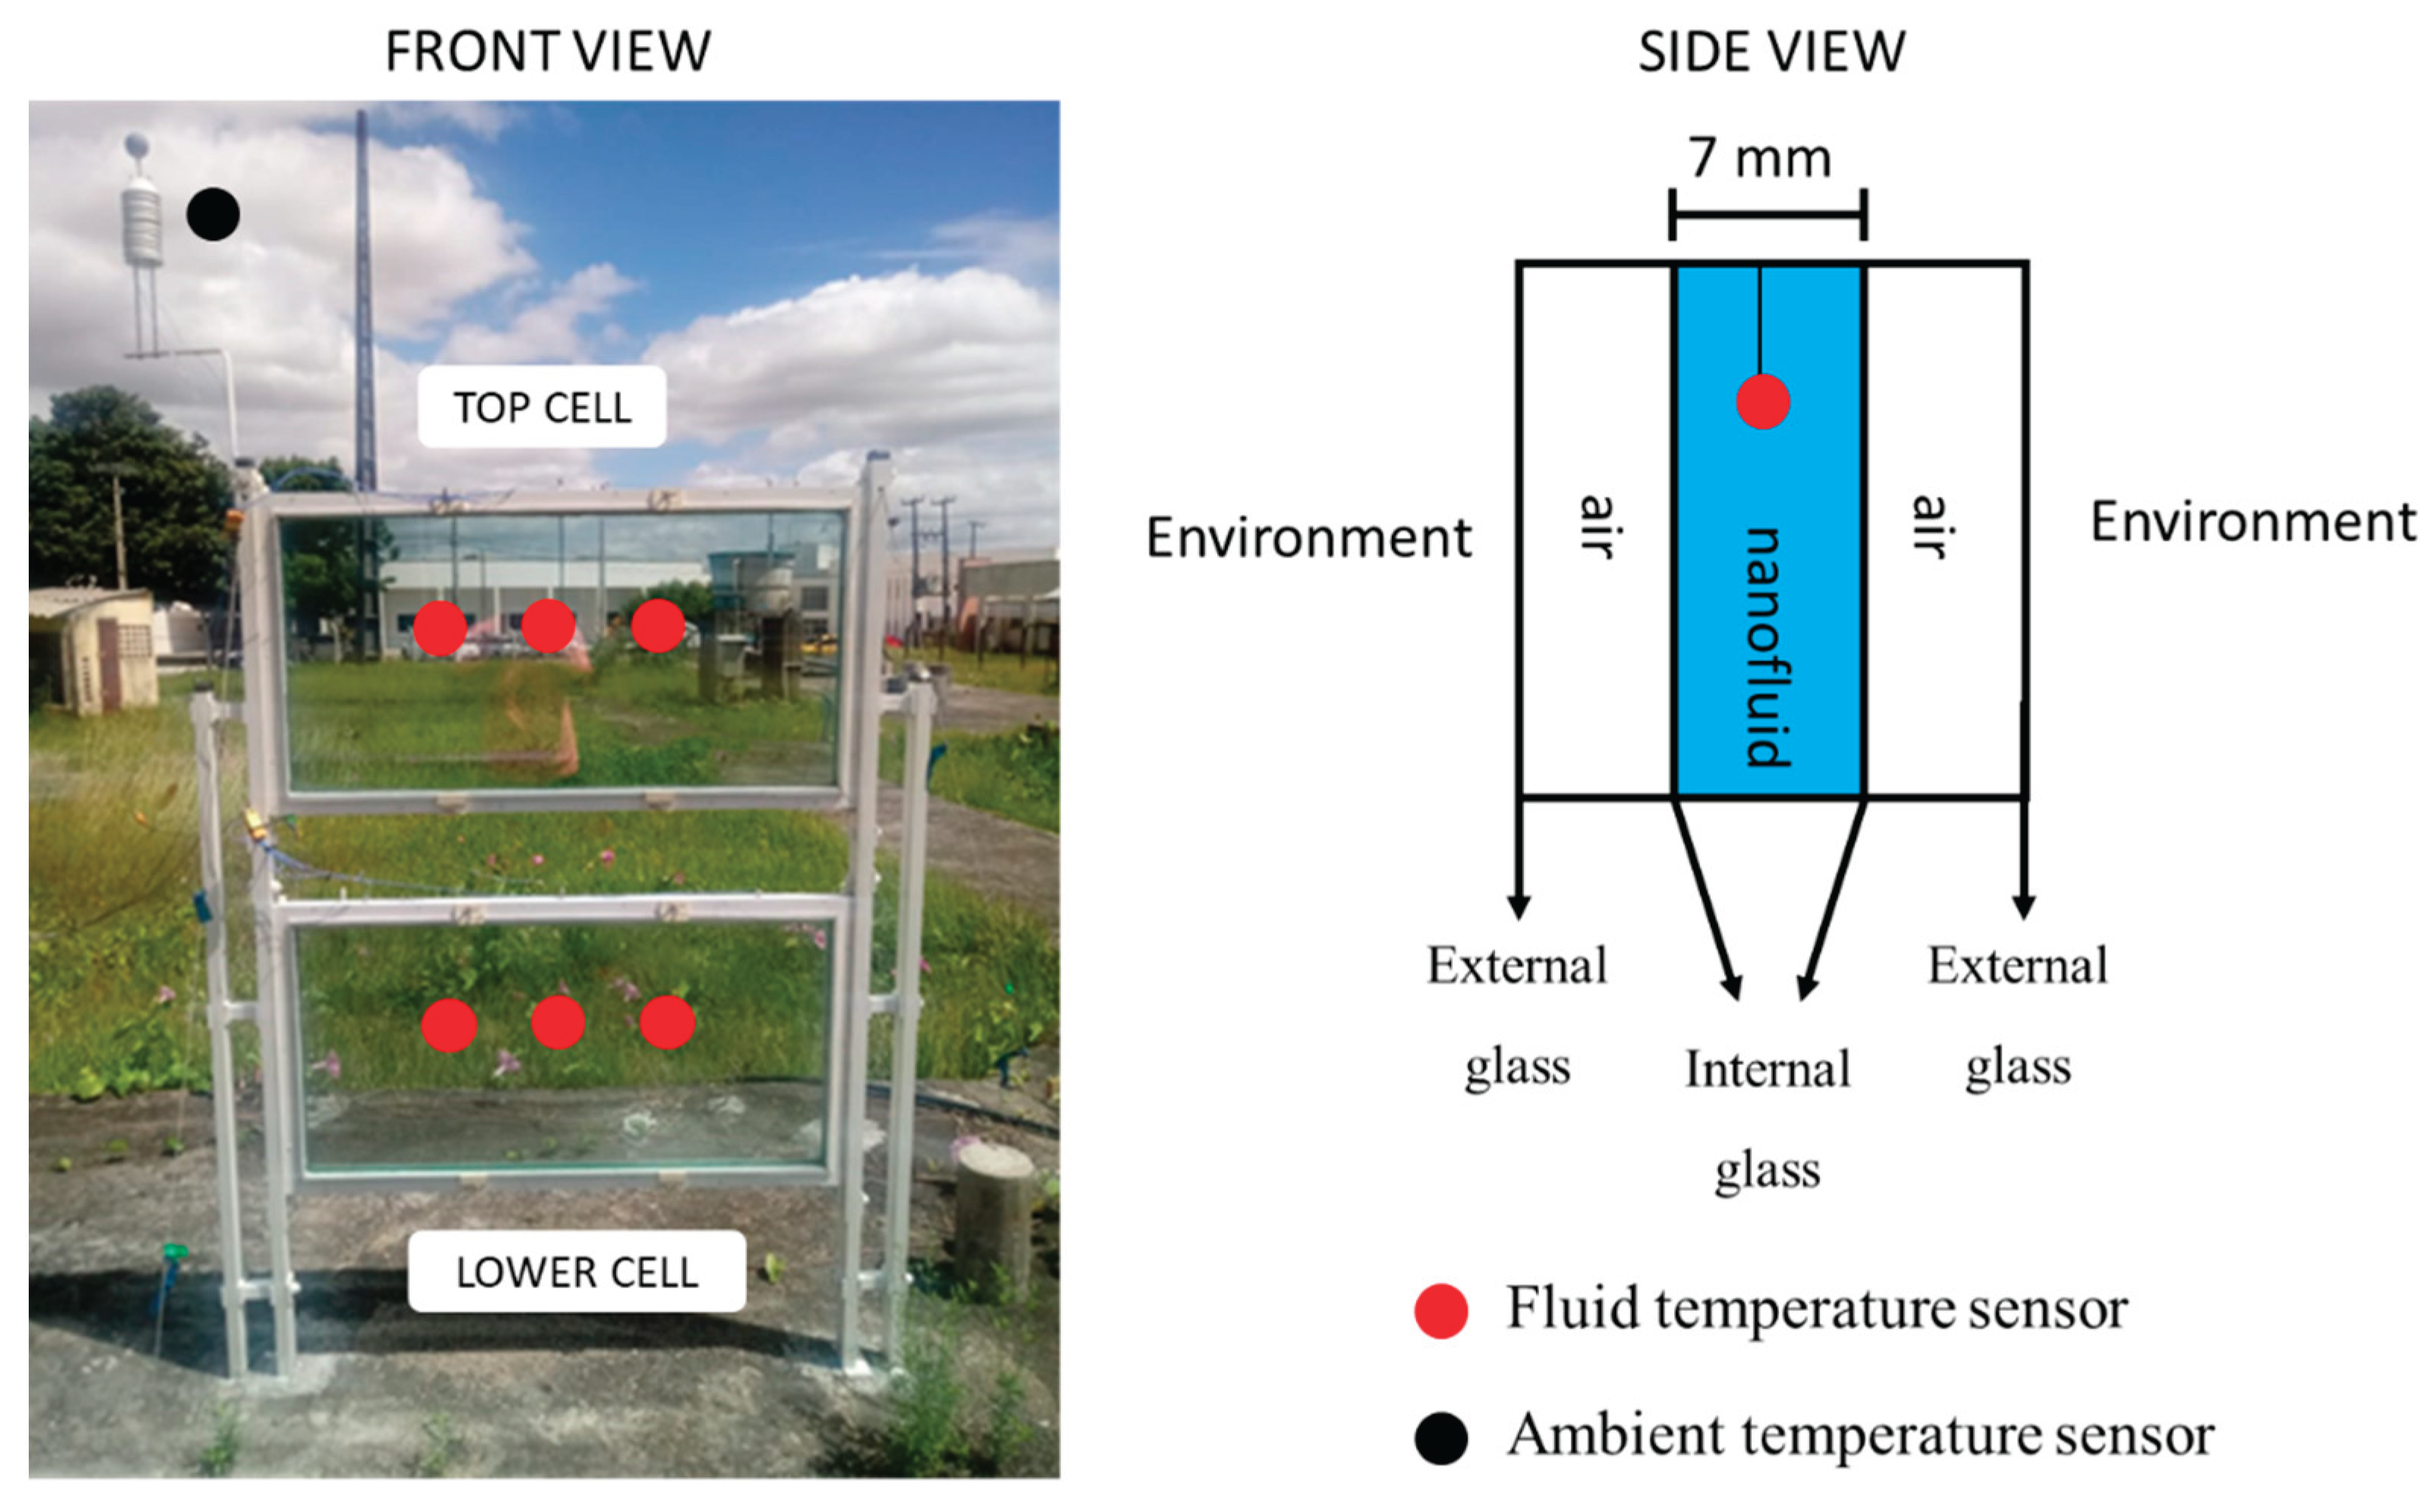
Figure 2.
Schematic side view of the solar incidence during the test hours (5:30—9:30 pm).
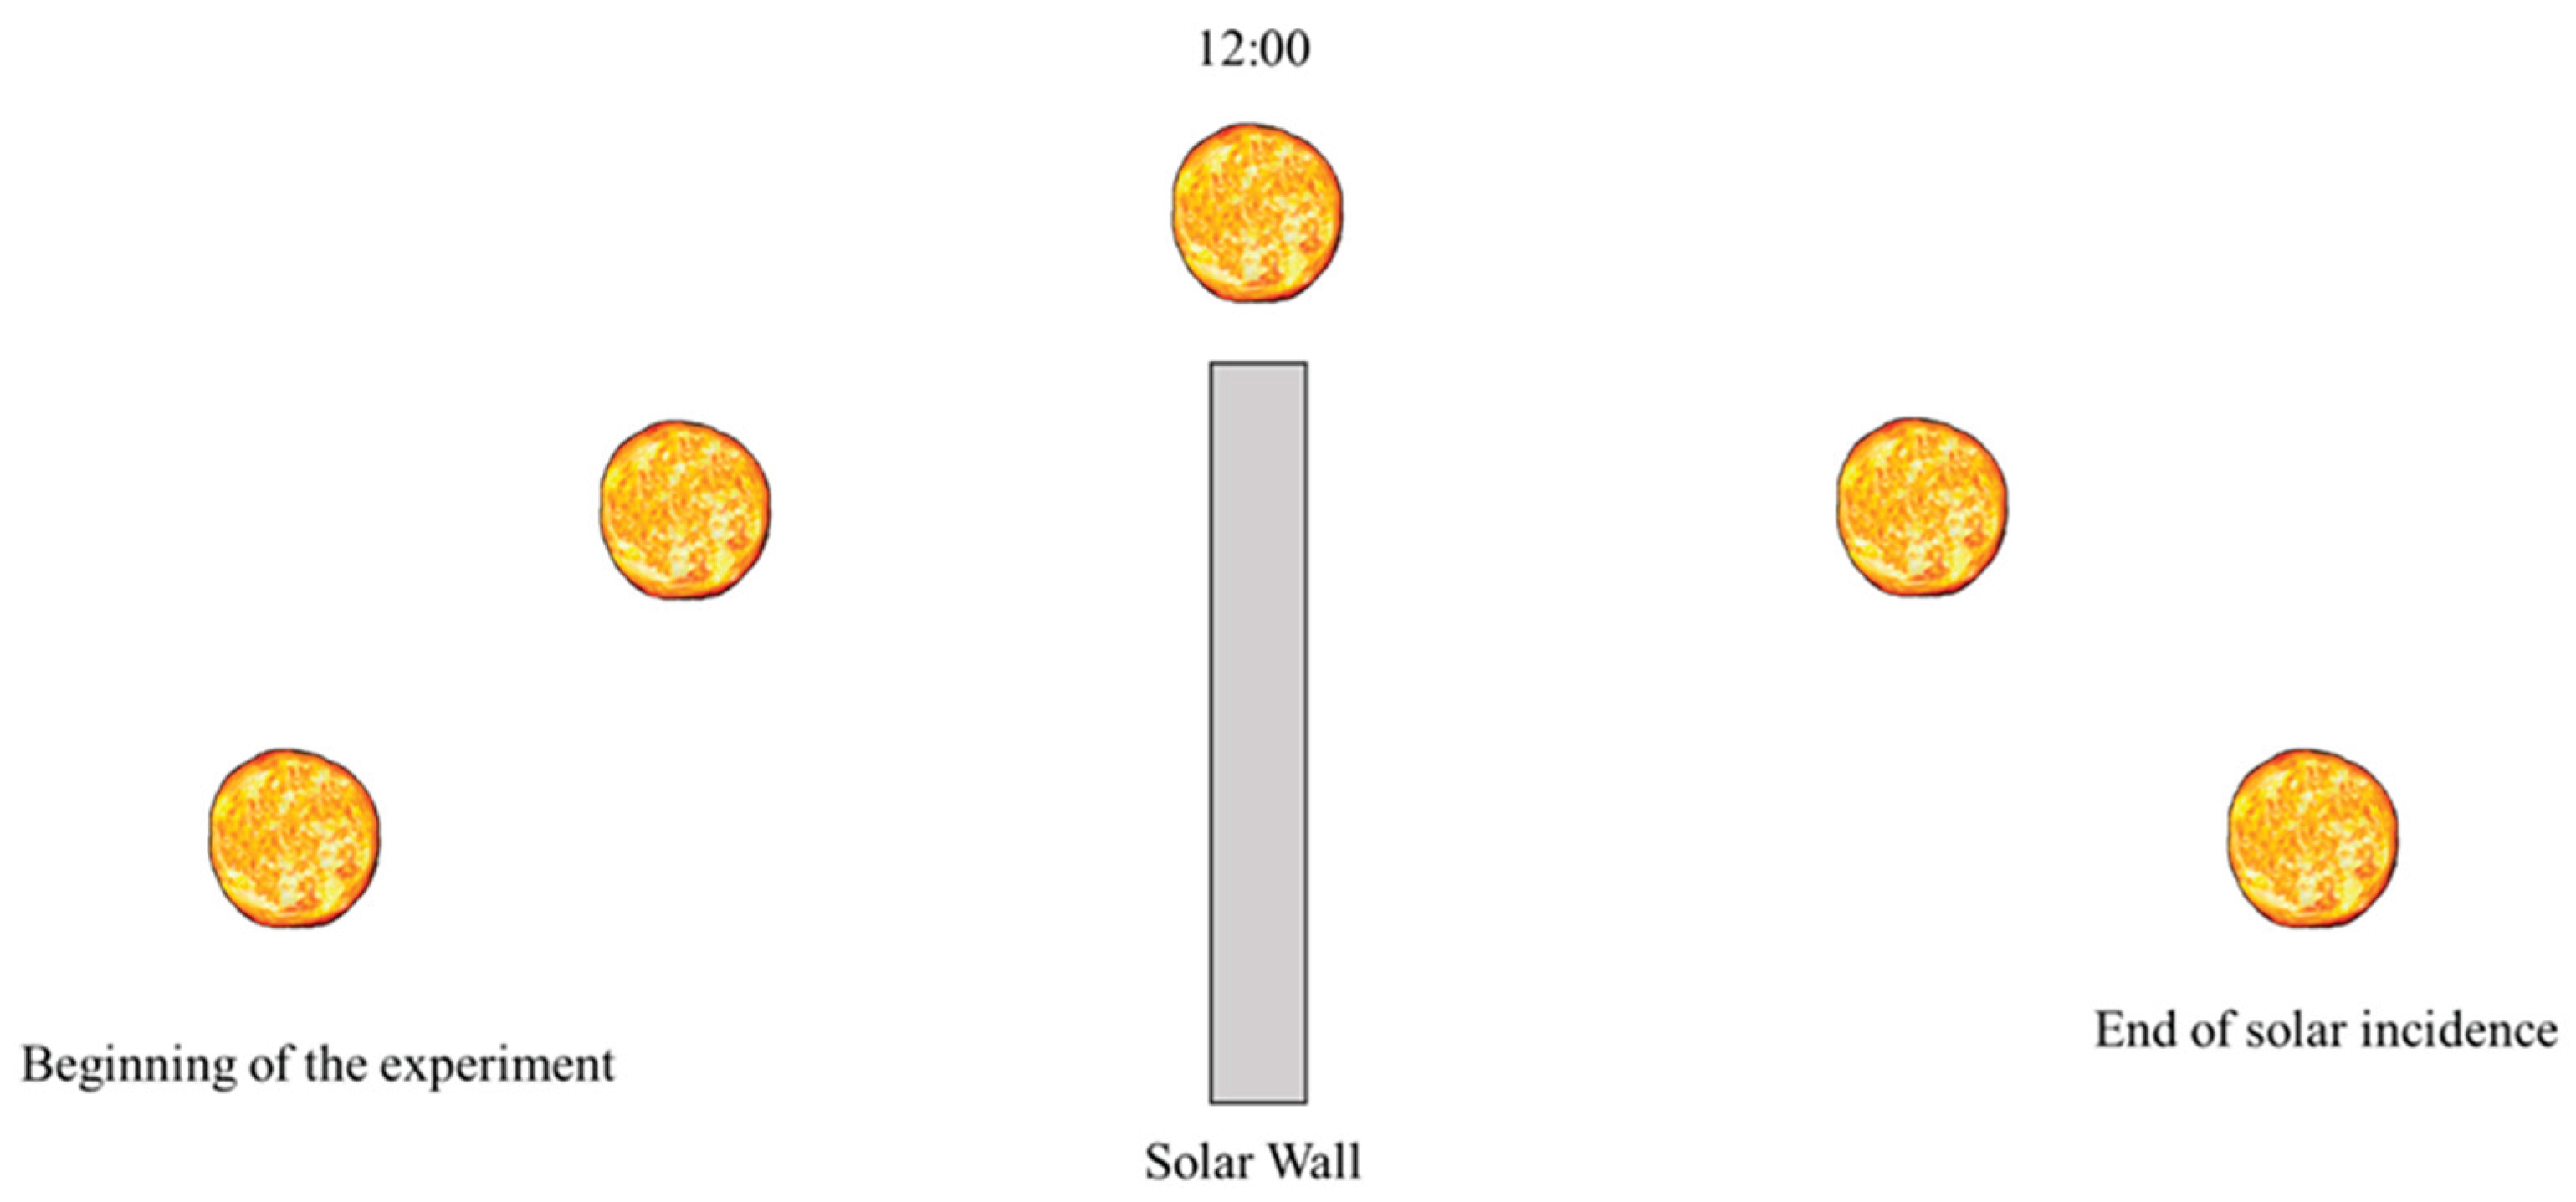
Figure 3.
Temperature profile on the glass surface. A small difference can be perceived between the upper (colder) and the lower (hotter) cell. A correction equation was developed.
Figure 3.
Temperature profile on the glass surface. A small difference can be perceived between the upper (colder) and the lower (hotter) cell. A correction equation was developed.
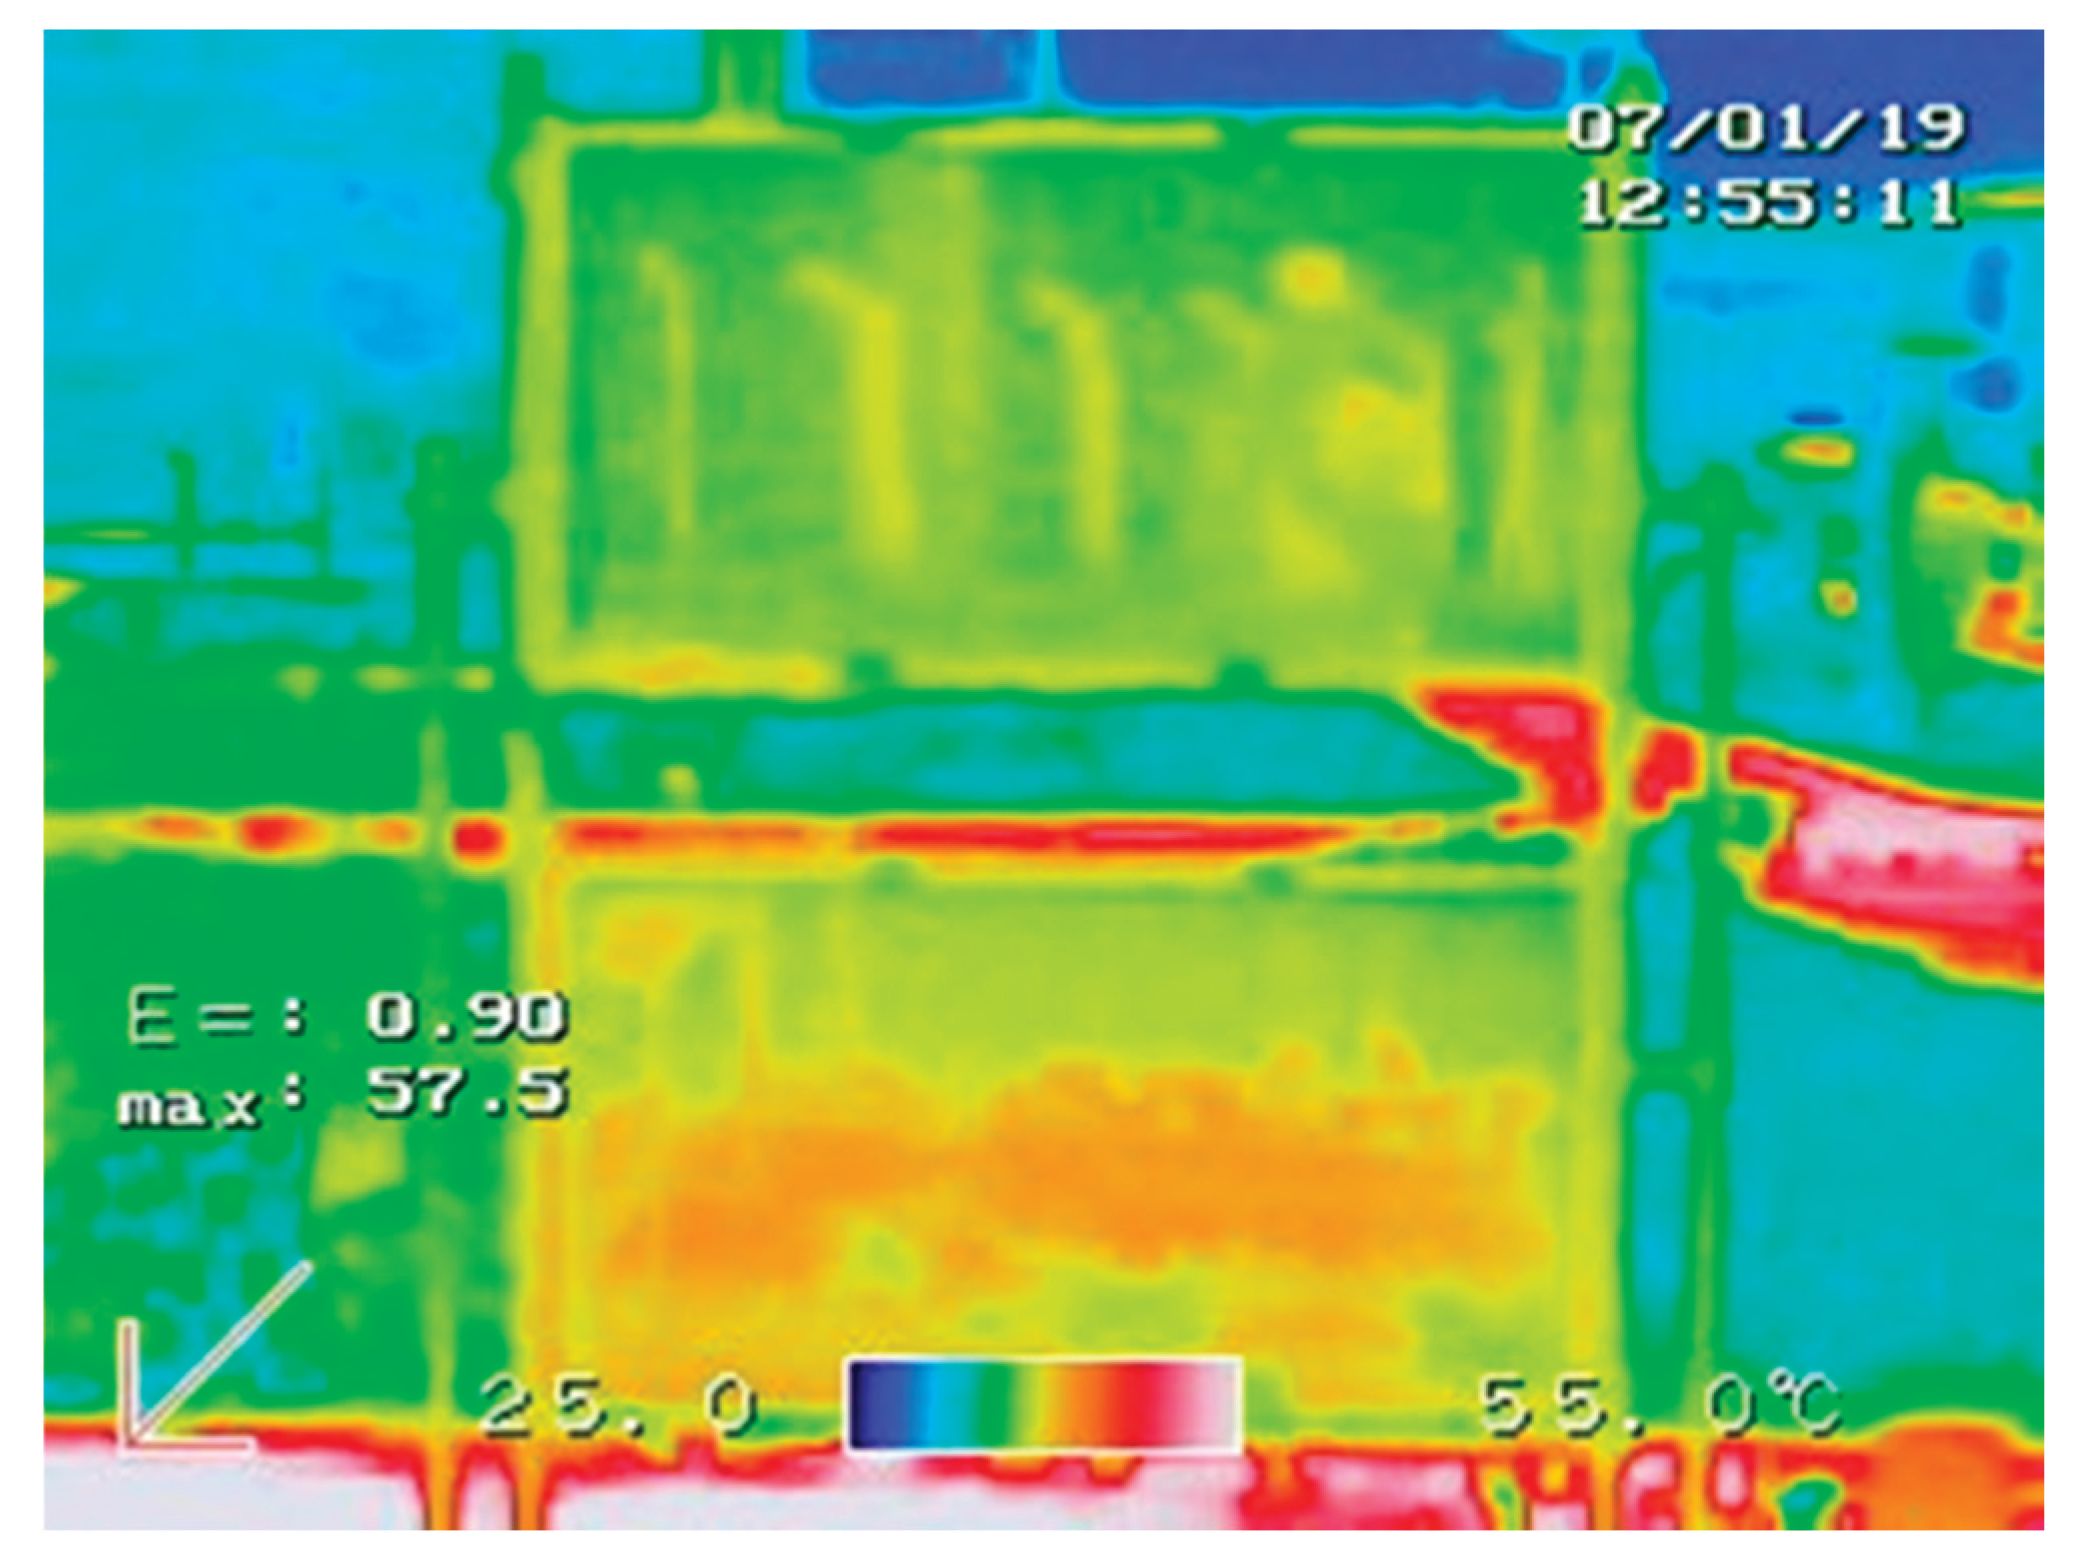
Figure 4.
Temperature gain of the titanium dioxide nanofluid compared to the base fluid. The values are absolutely referred to the base fluid. It can be perceived that the thermal inertia of the system to the right of the lines (after 5:30 pm), since almost no direct radiation reaches the apparatus after this time.
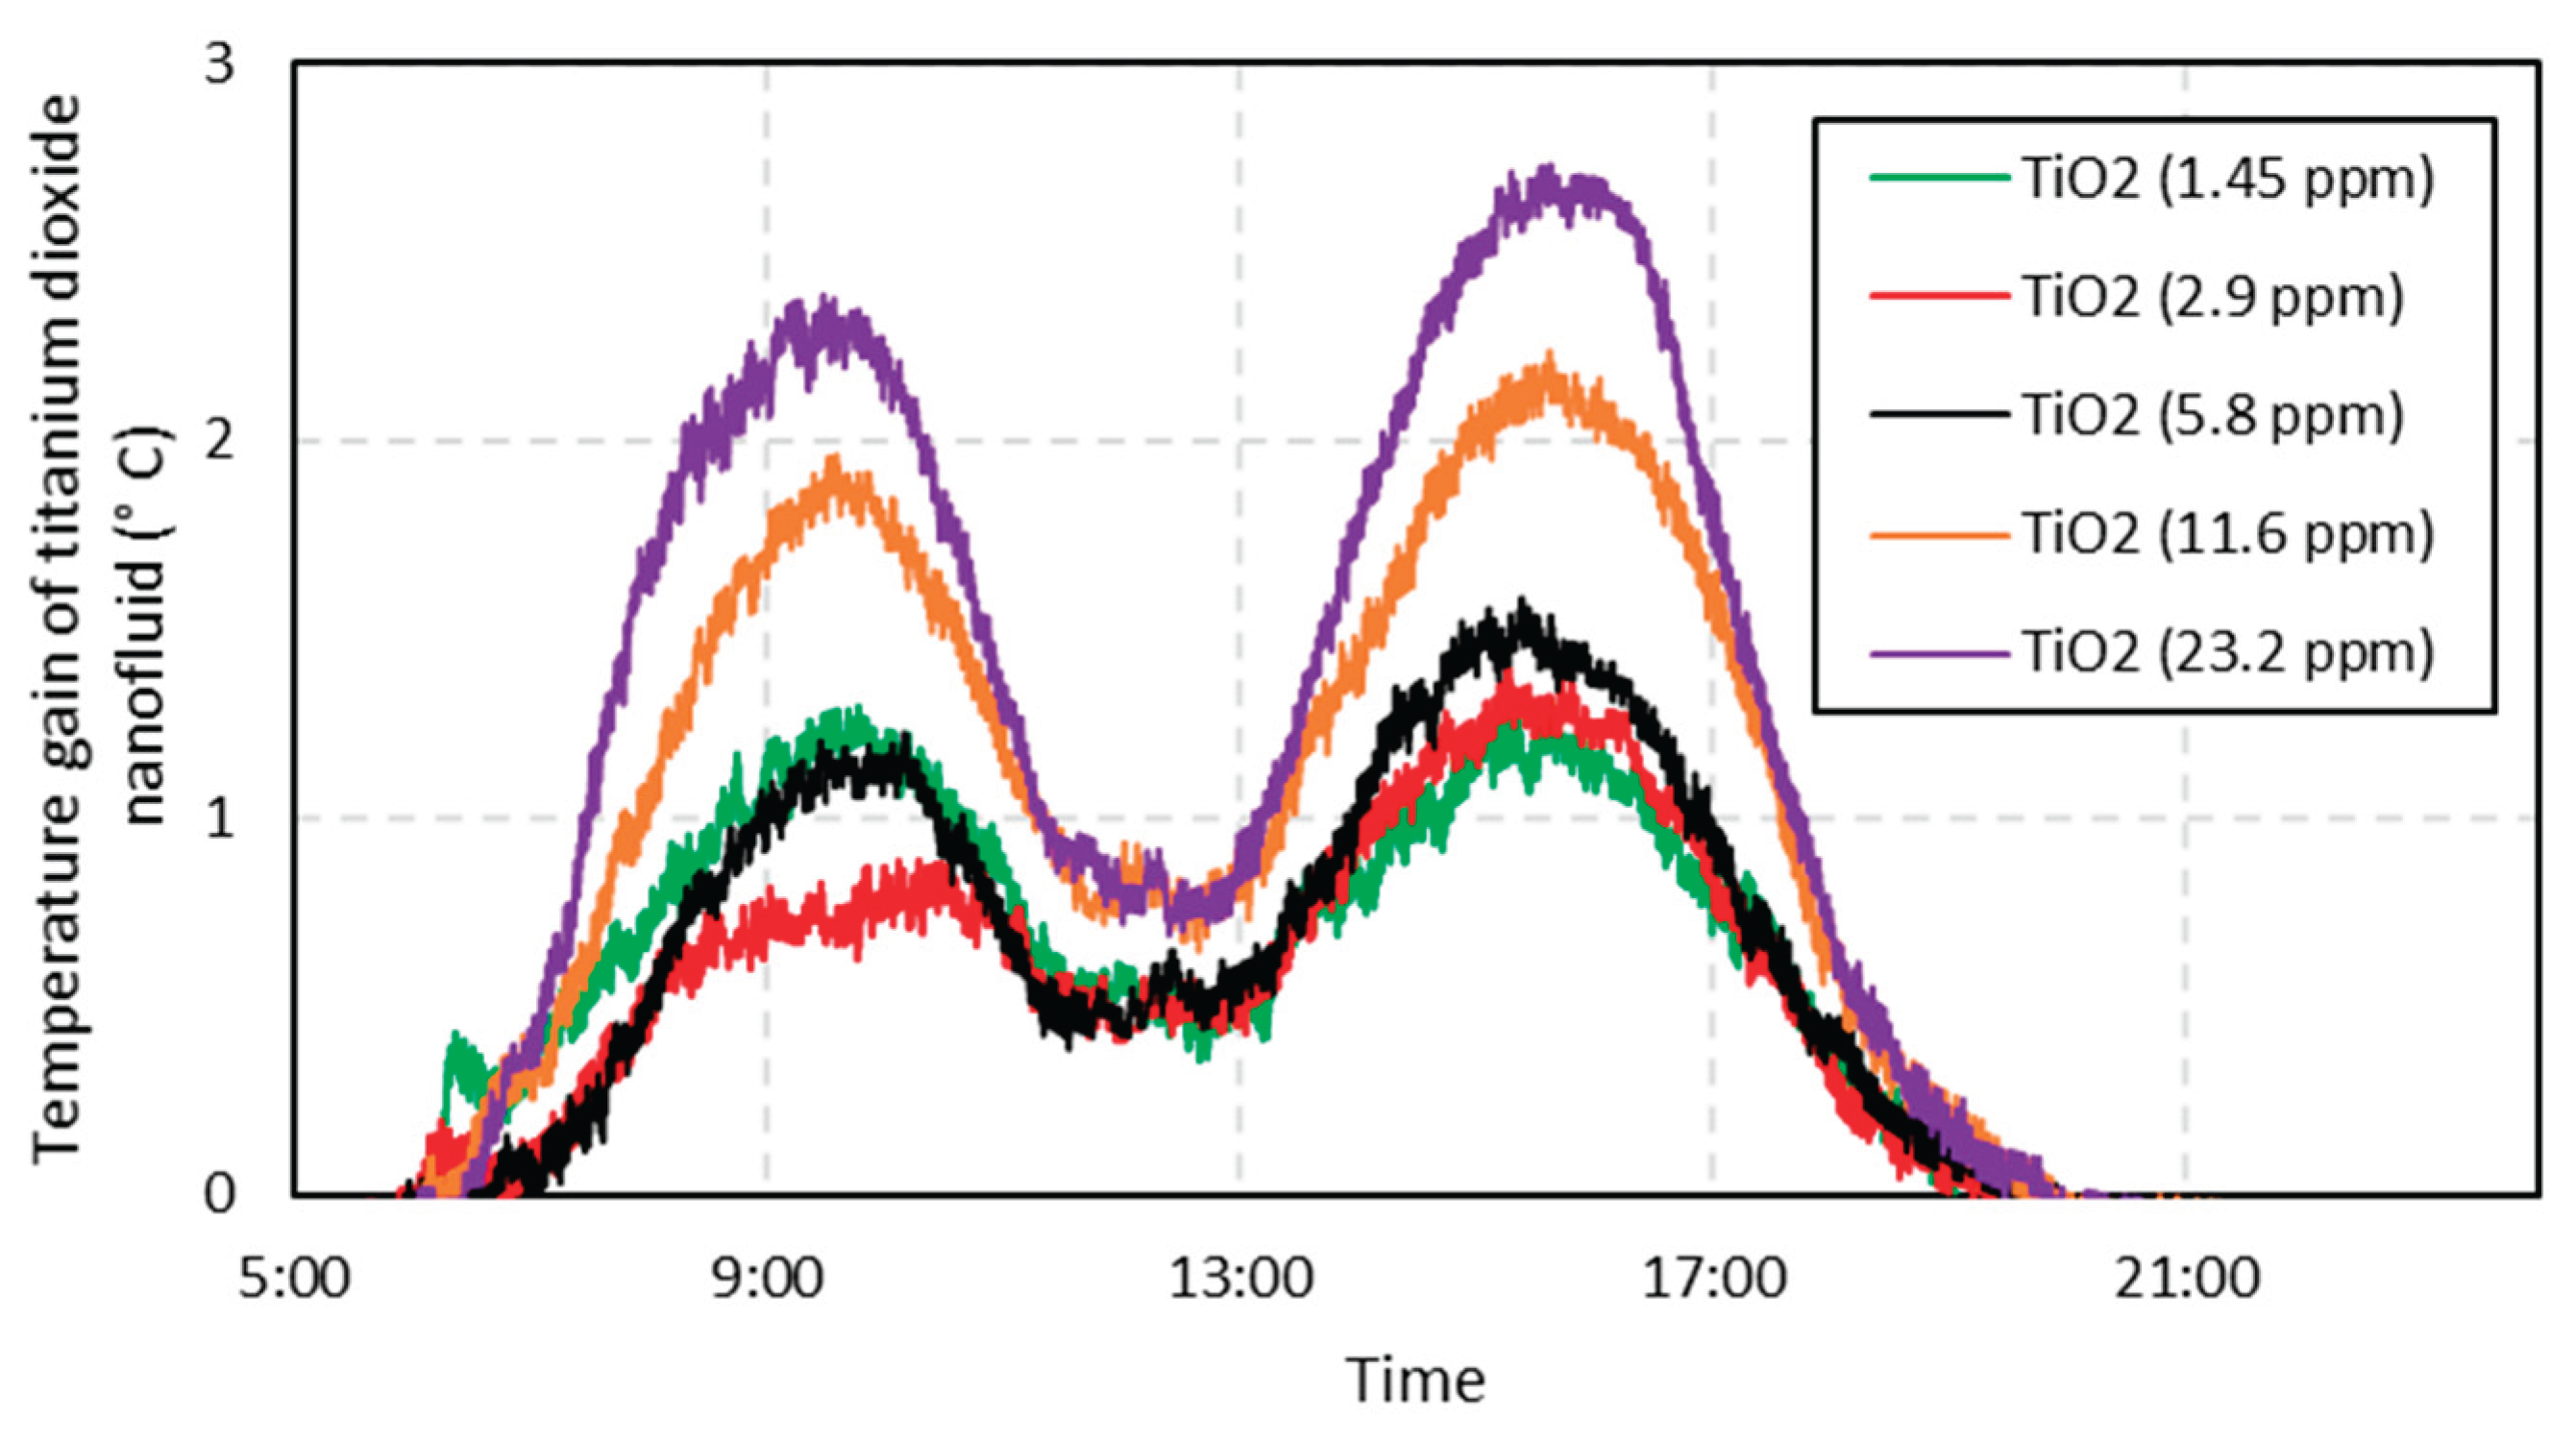
Figure 5.
Maximum temperature gain in relation to the base fluid of the titanium dioxide nanofluid for each one-day test. Very high concentrations were tested, and they did not outperform the smallest value in the same proportion.
Figure 5.
Maximum temperature gain in relation to the base fluid of the titanium dioxide nanofluid for each one-day test. Very high concentrations were tested, and they did not outperform the smallest value in the same proportion.
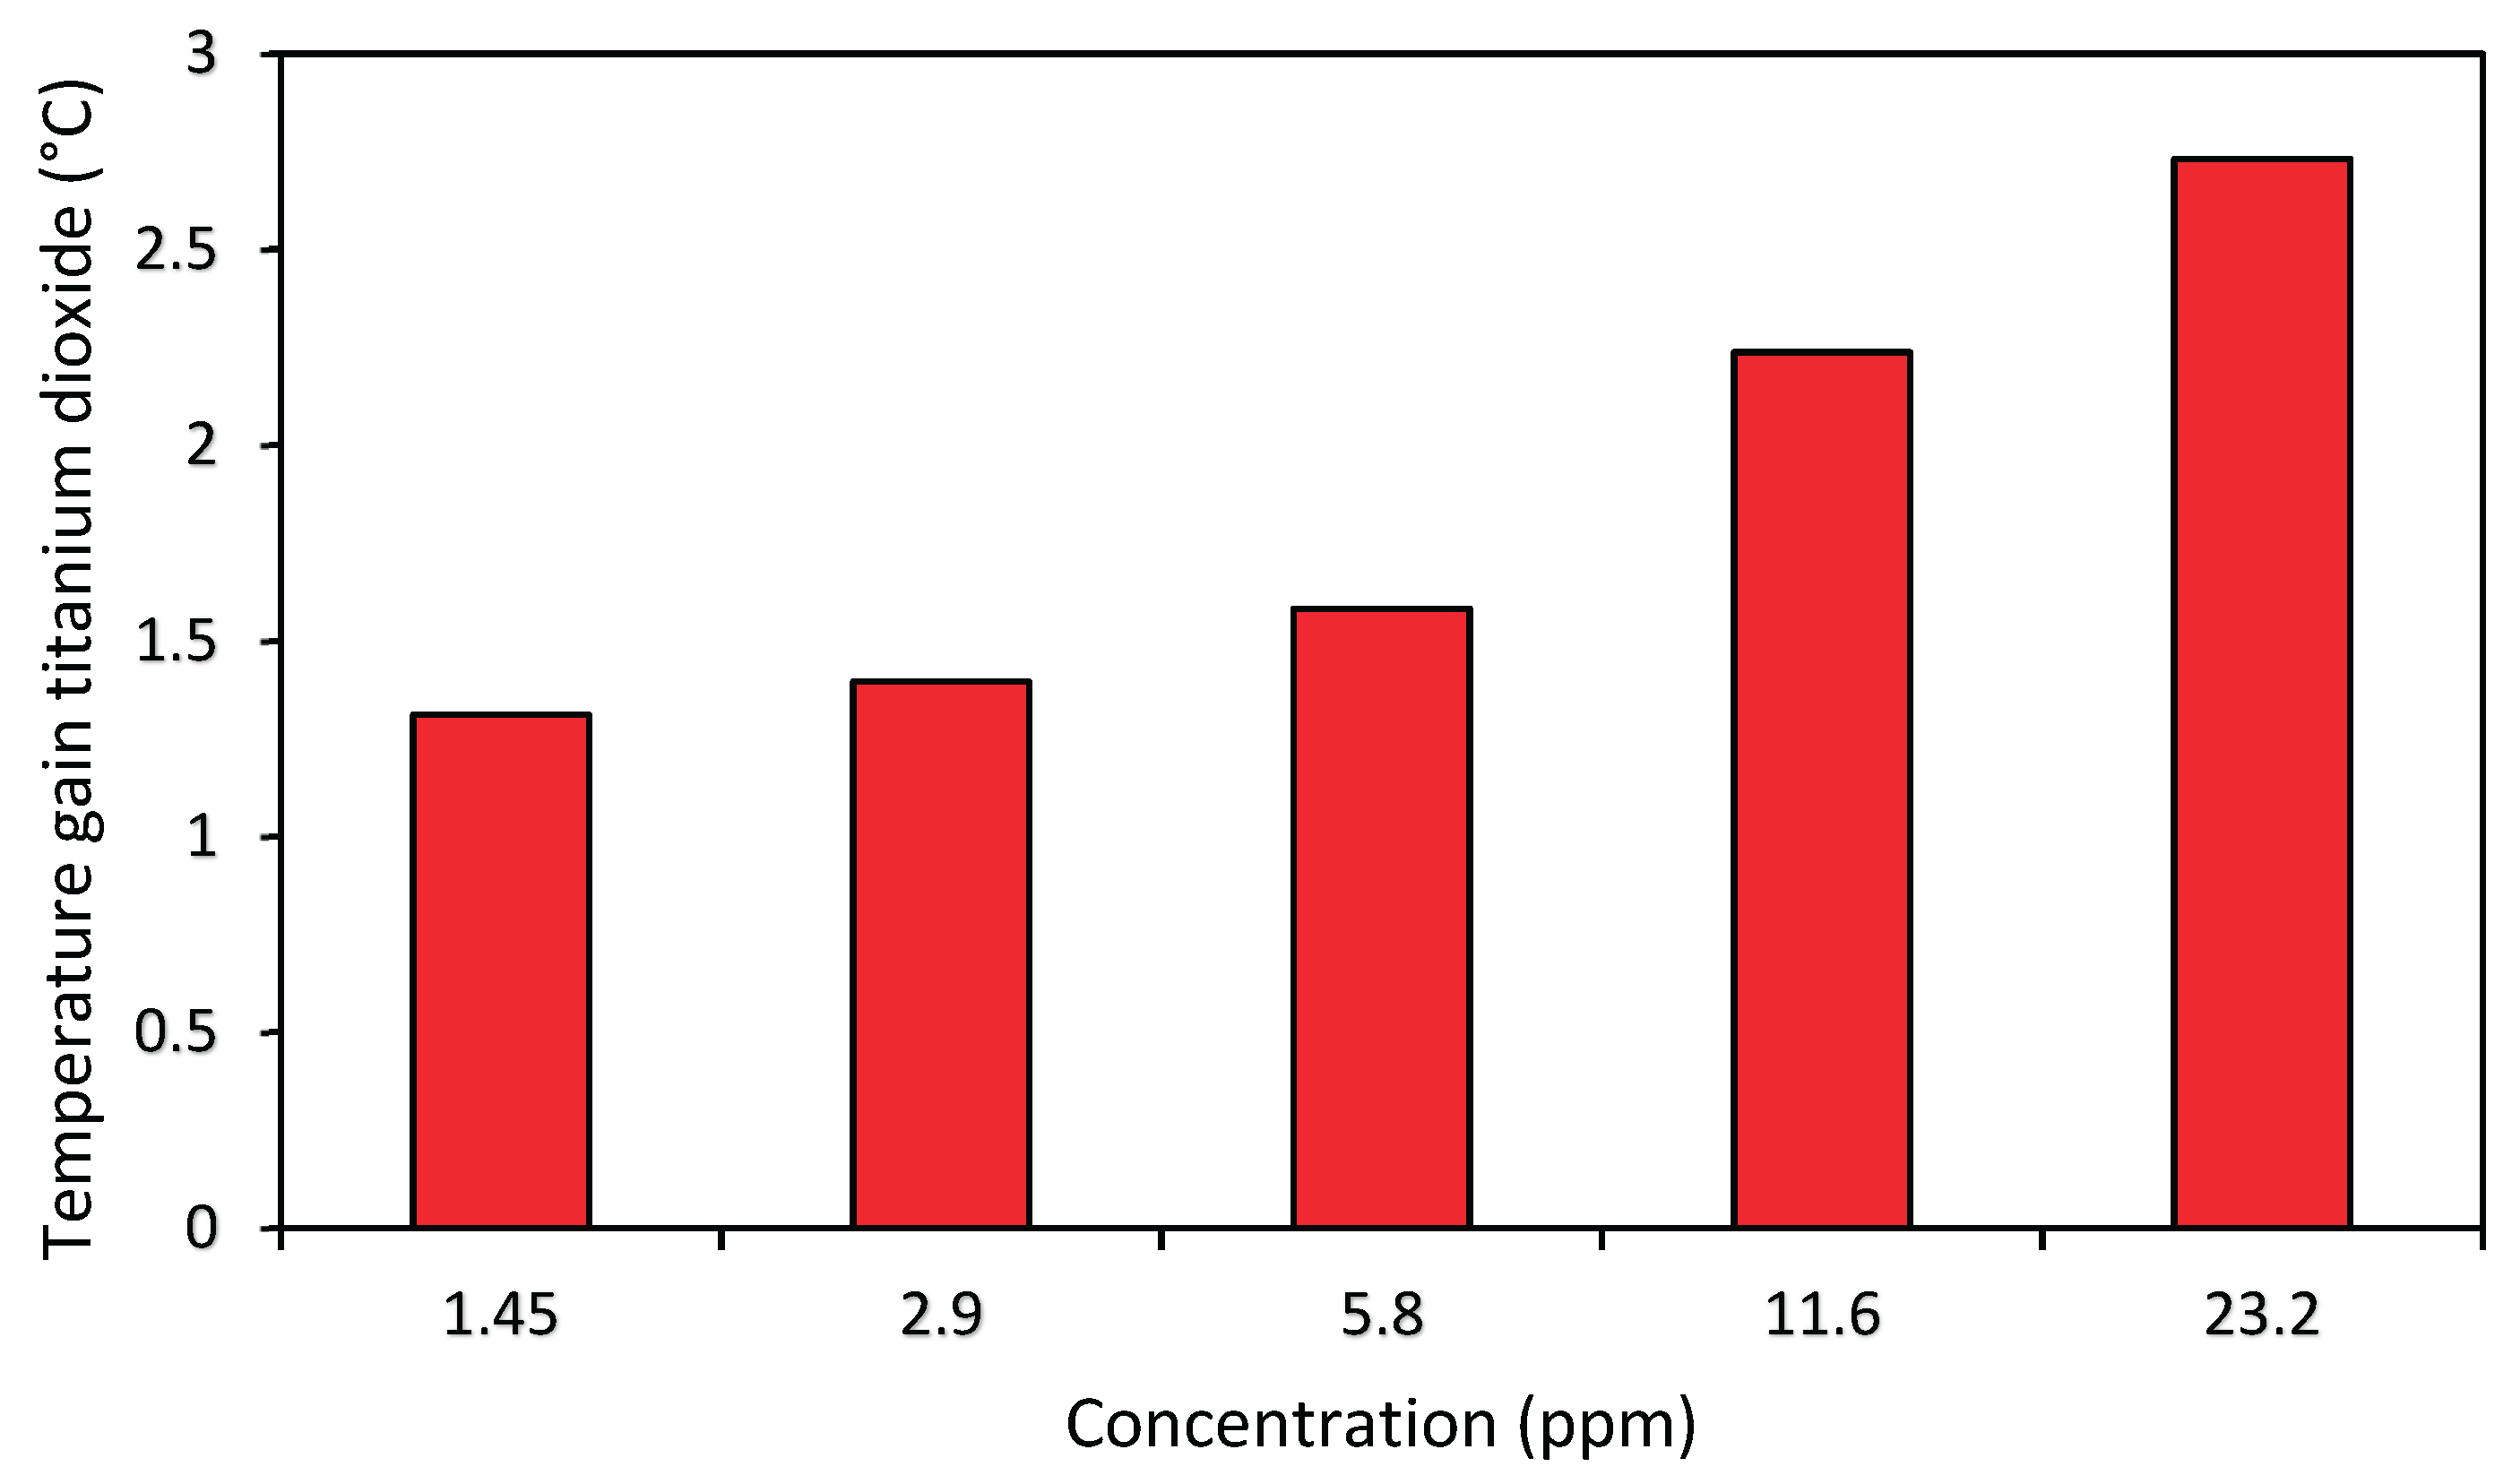
Figure 6.
Temperature gain of the silver nanofluids compared to the base fluid, for a one-day test. Each curve represents a different test concentration.
Figure 6.
Temperature gain of the silver nanofluids compared to the base fluid, for a one-day test. Each curve represents a different test concentration.
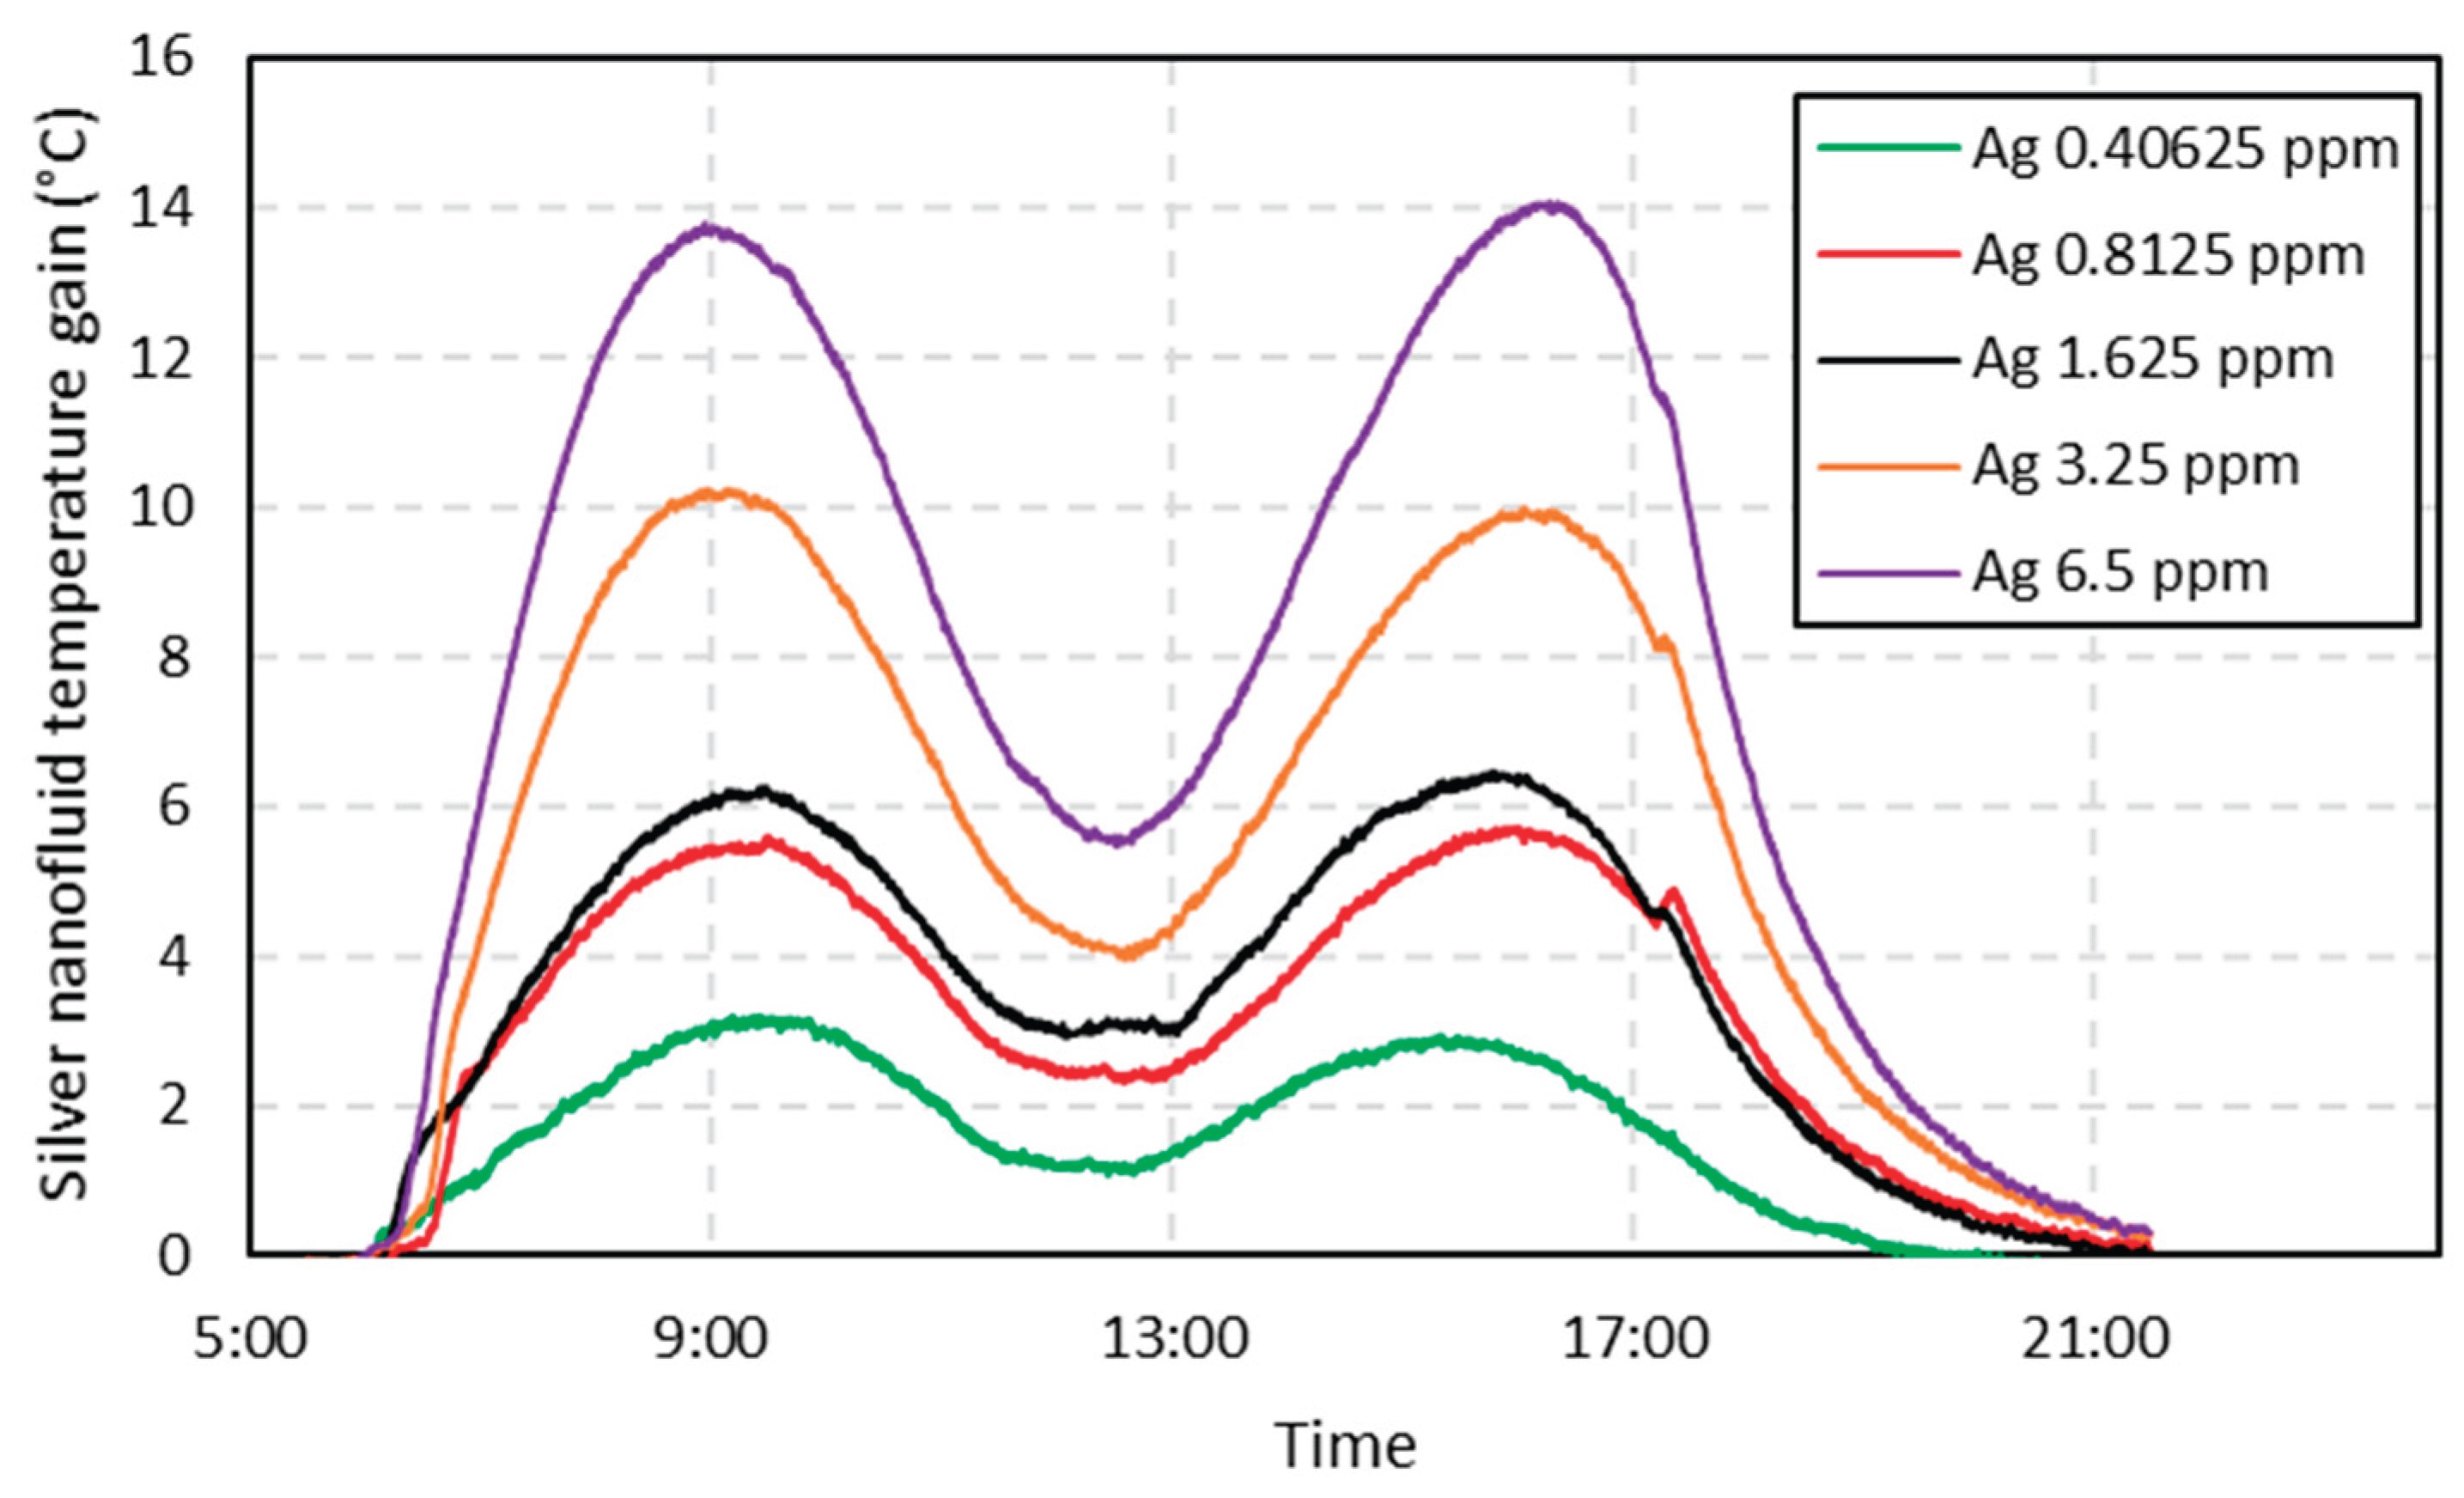
Figure 7.
Maximum temperature gain of the silver nanofluid for each one-day test.
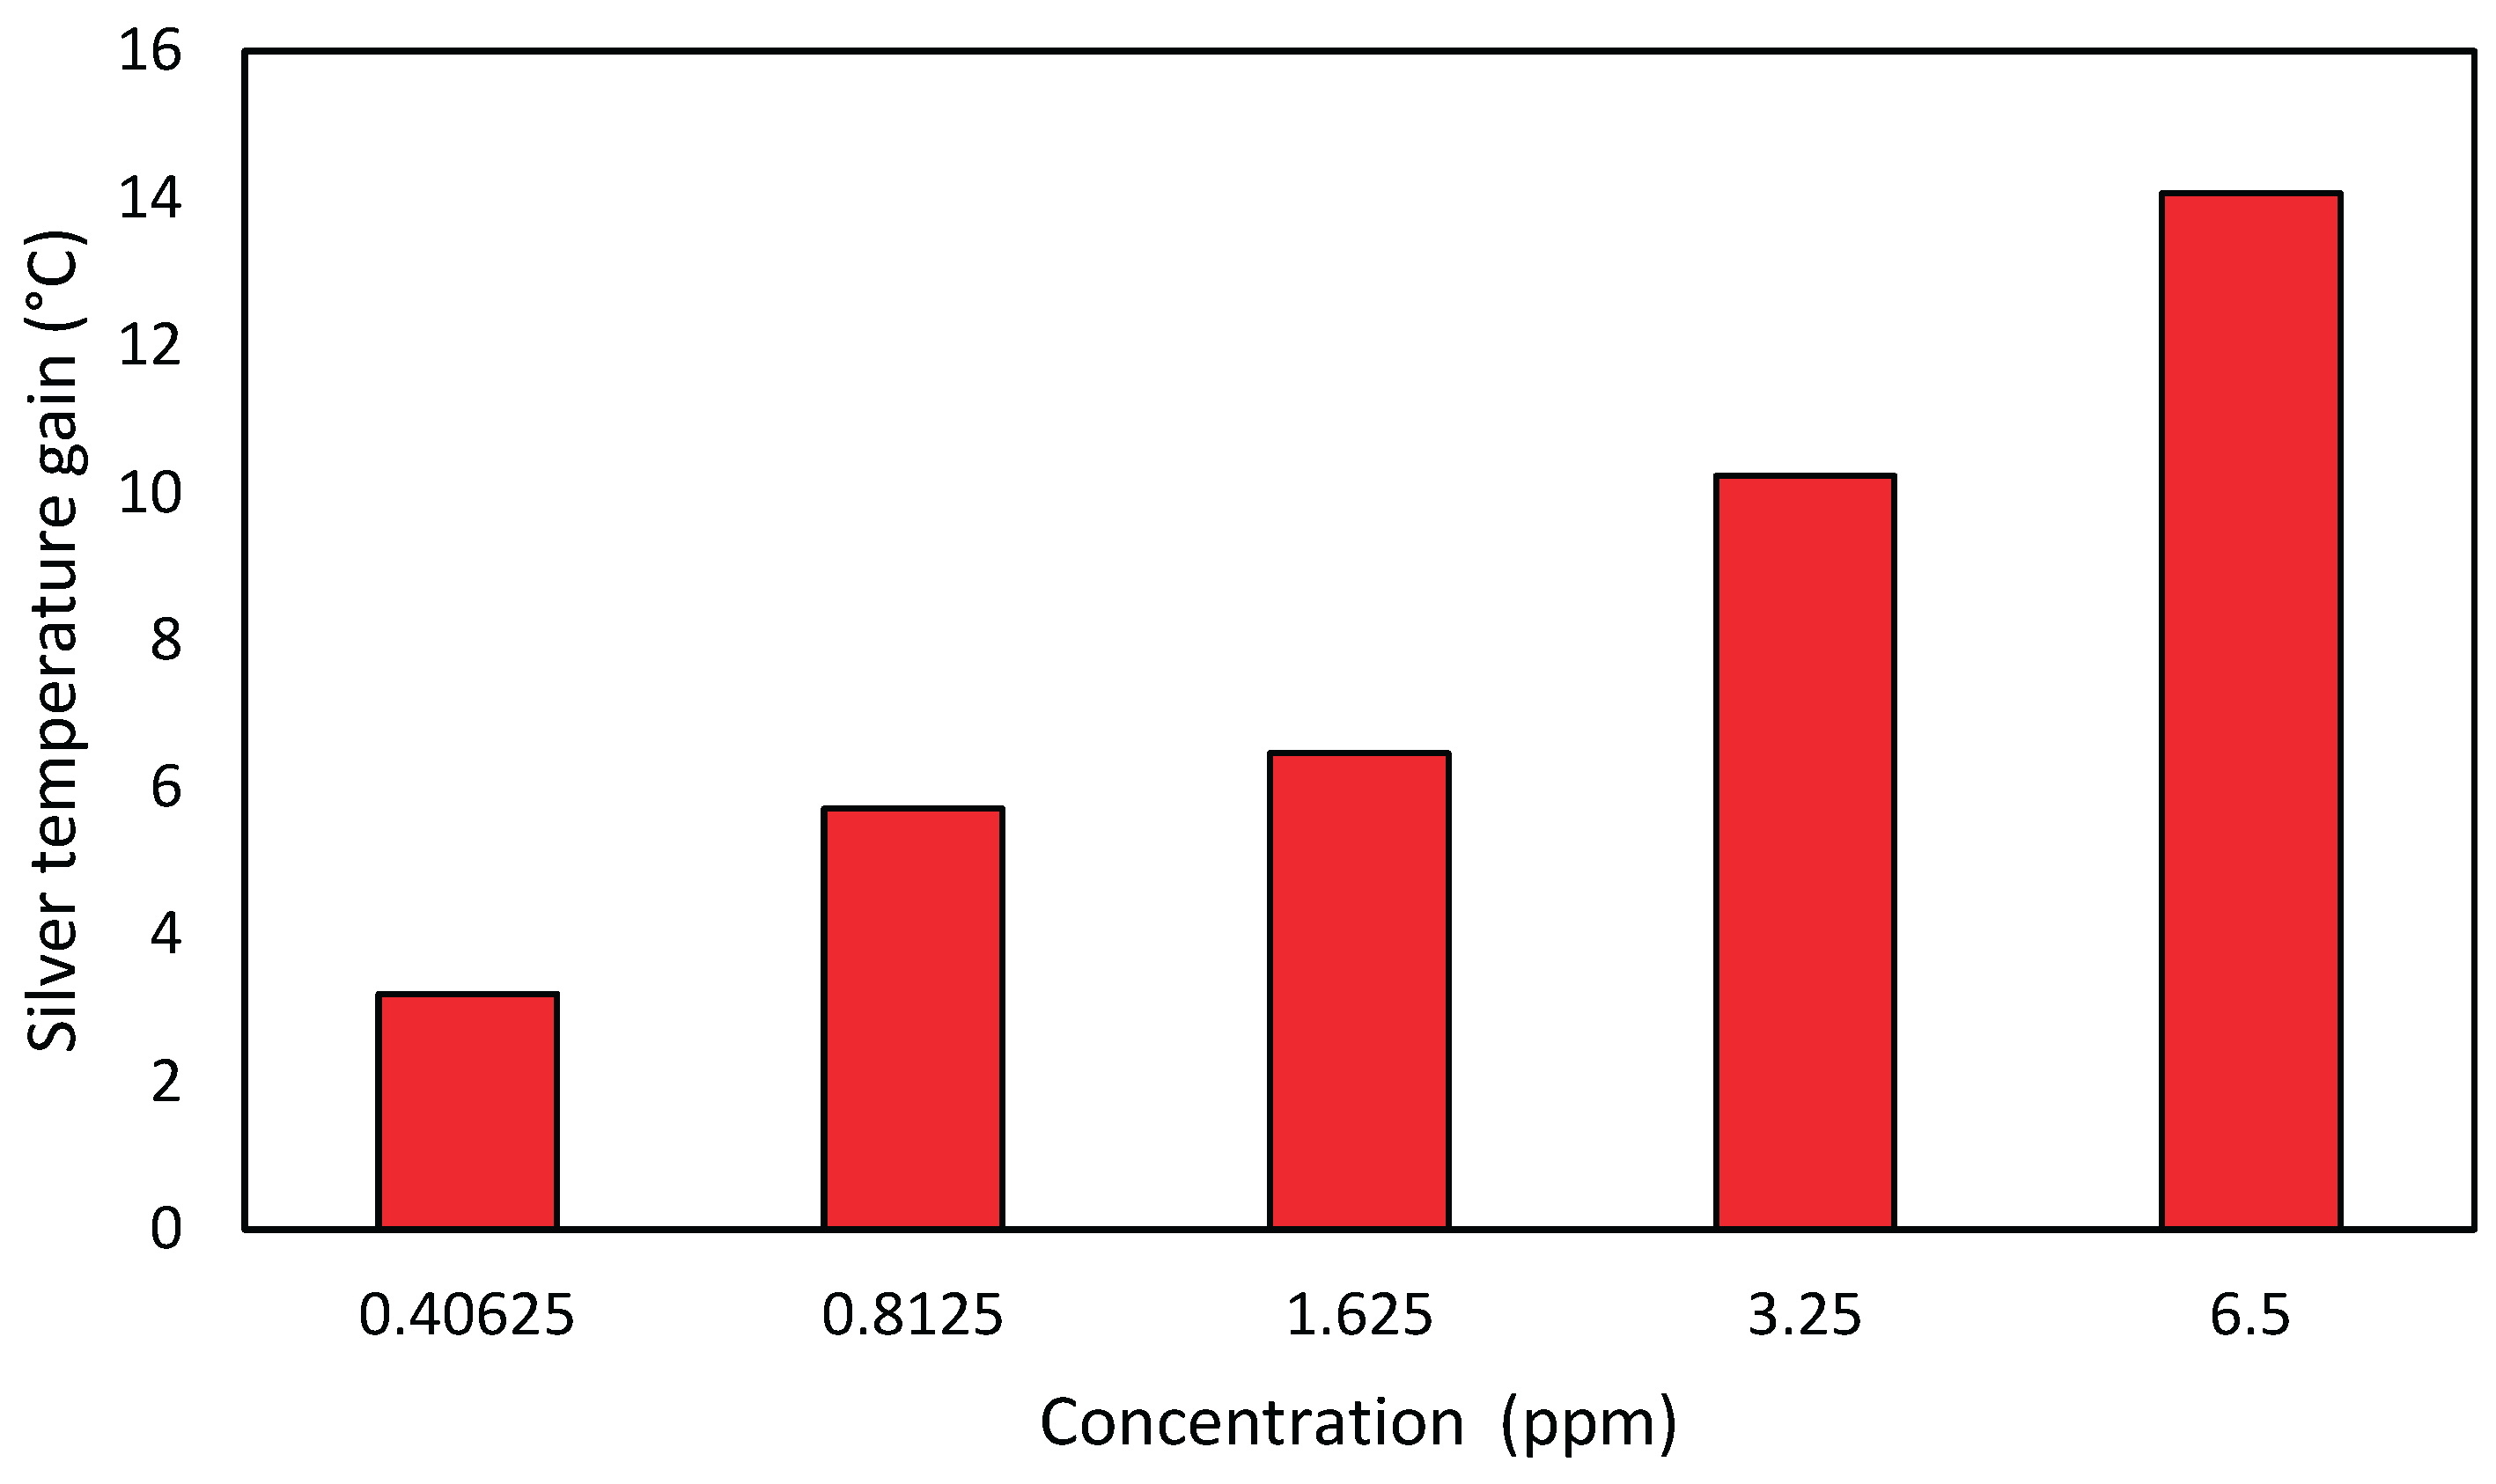
Figure 8.
Temperature gain of the hybrid nanofluid compared to the base fluid, for a one-day test. Each curve represents a different test concentration.
Figure 8.
Temperature gain of the hybrid nanofluid compared to the base fluid, for a one-day test. Each curve represents a different test concentration.
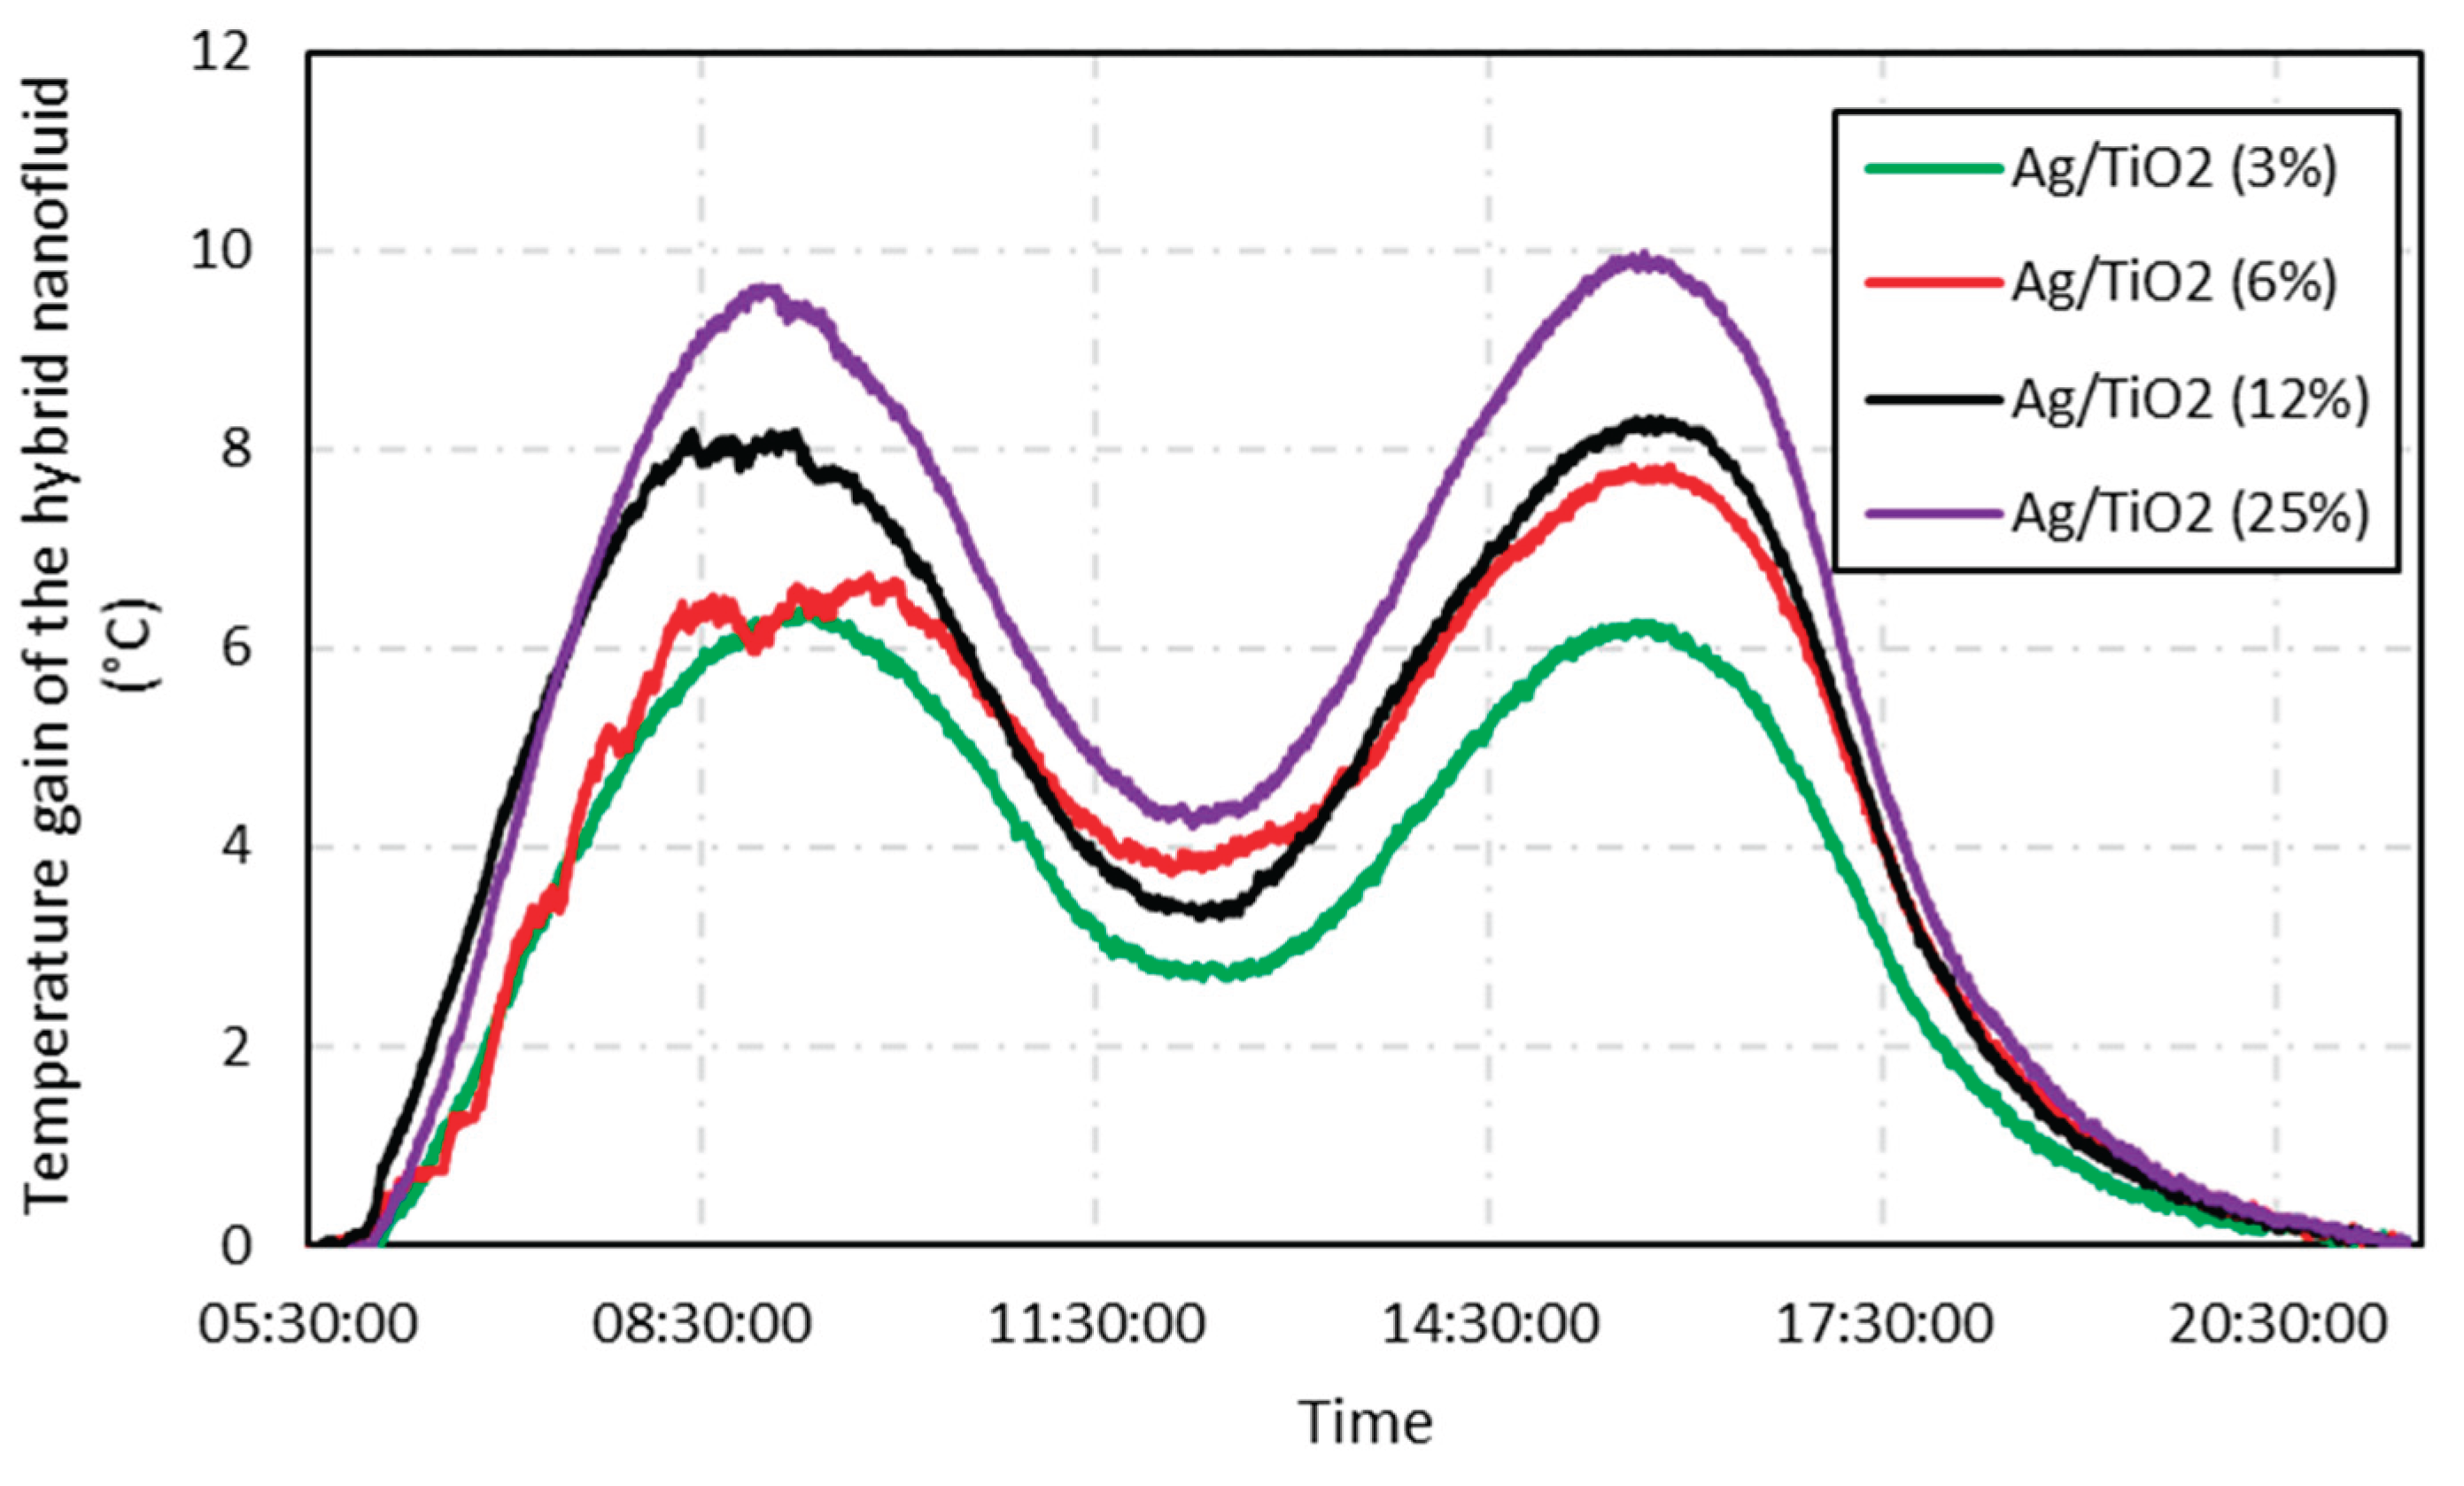
Figure 9.
Maximum temperature gain of the hybrid nanofluid for each one-day test.
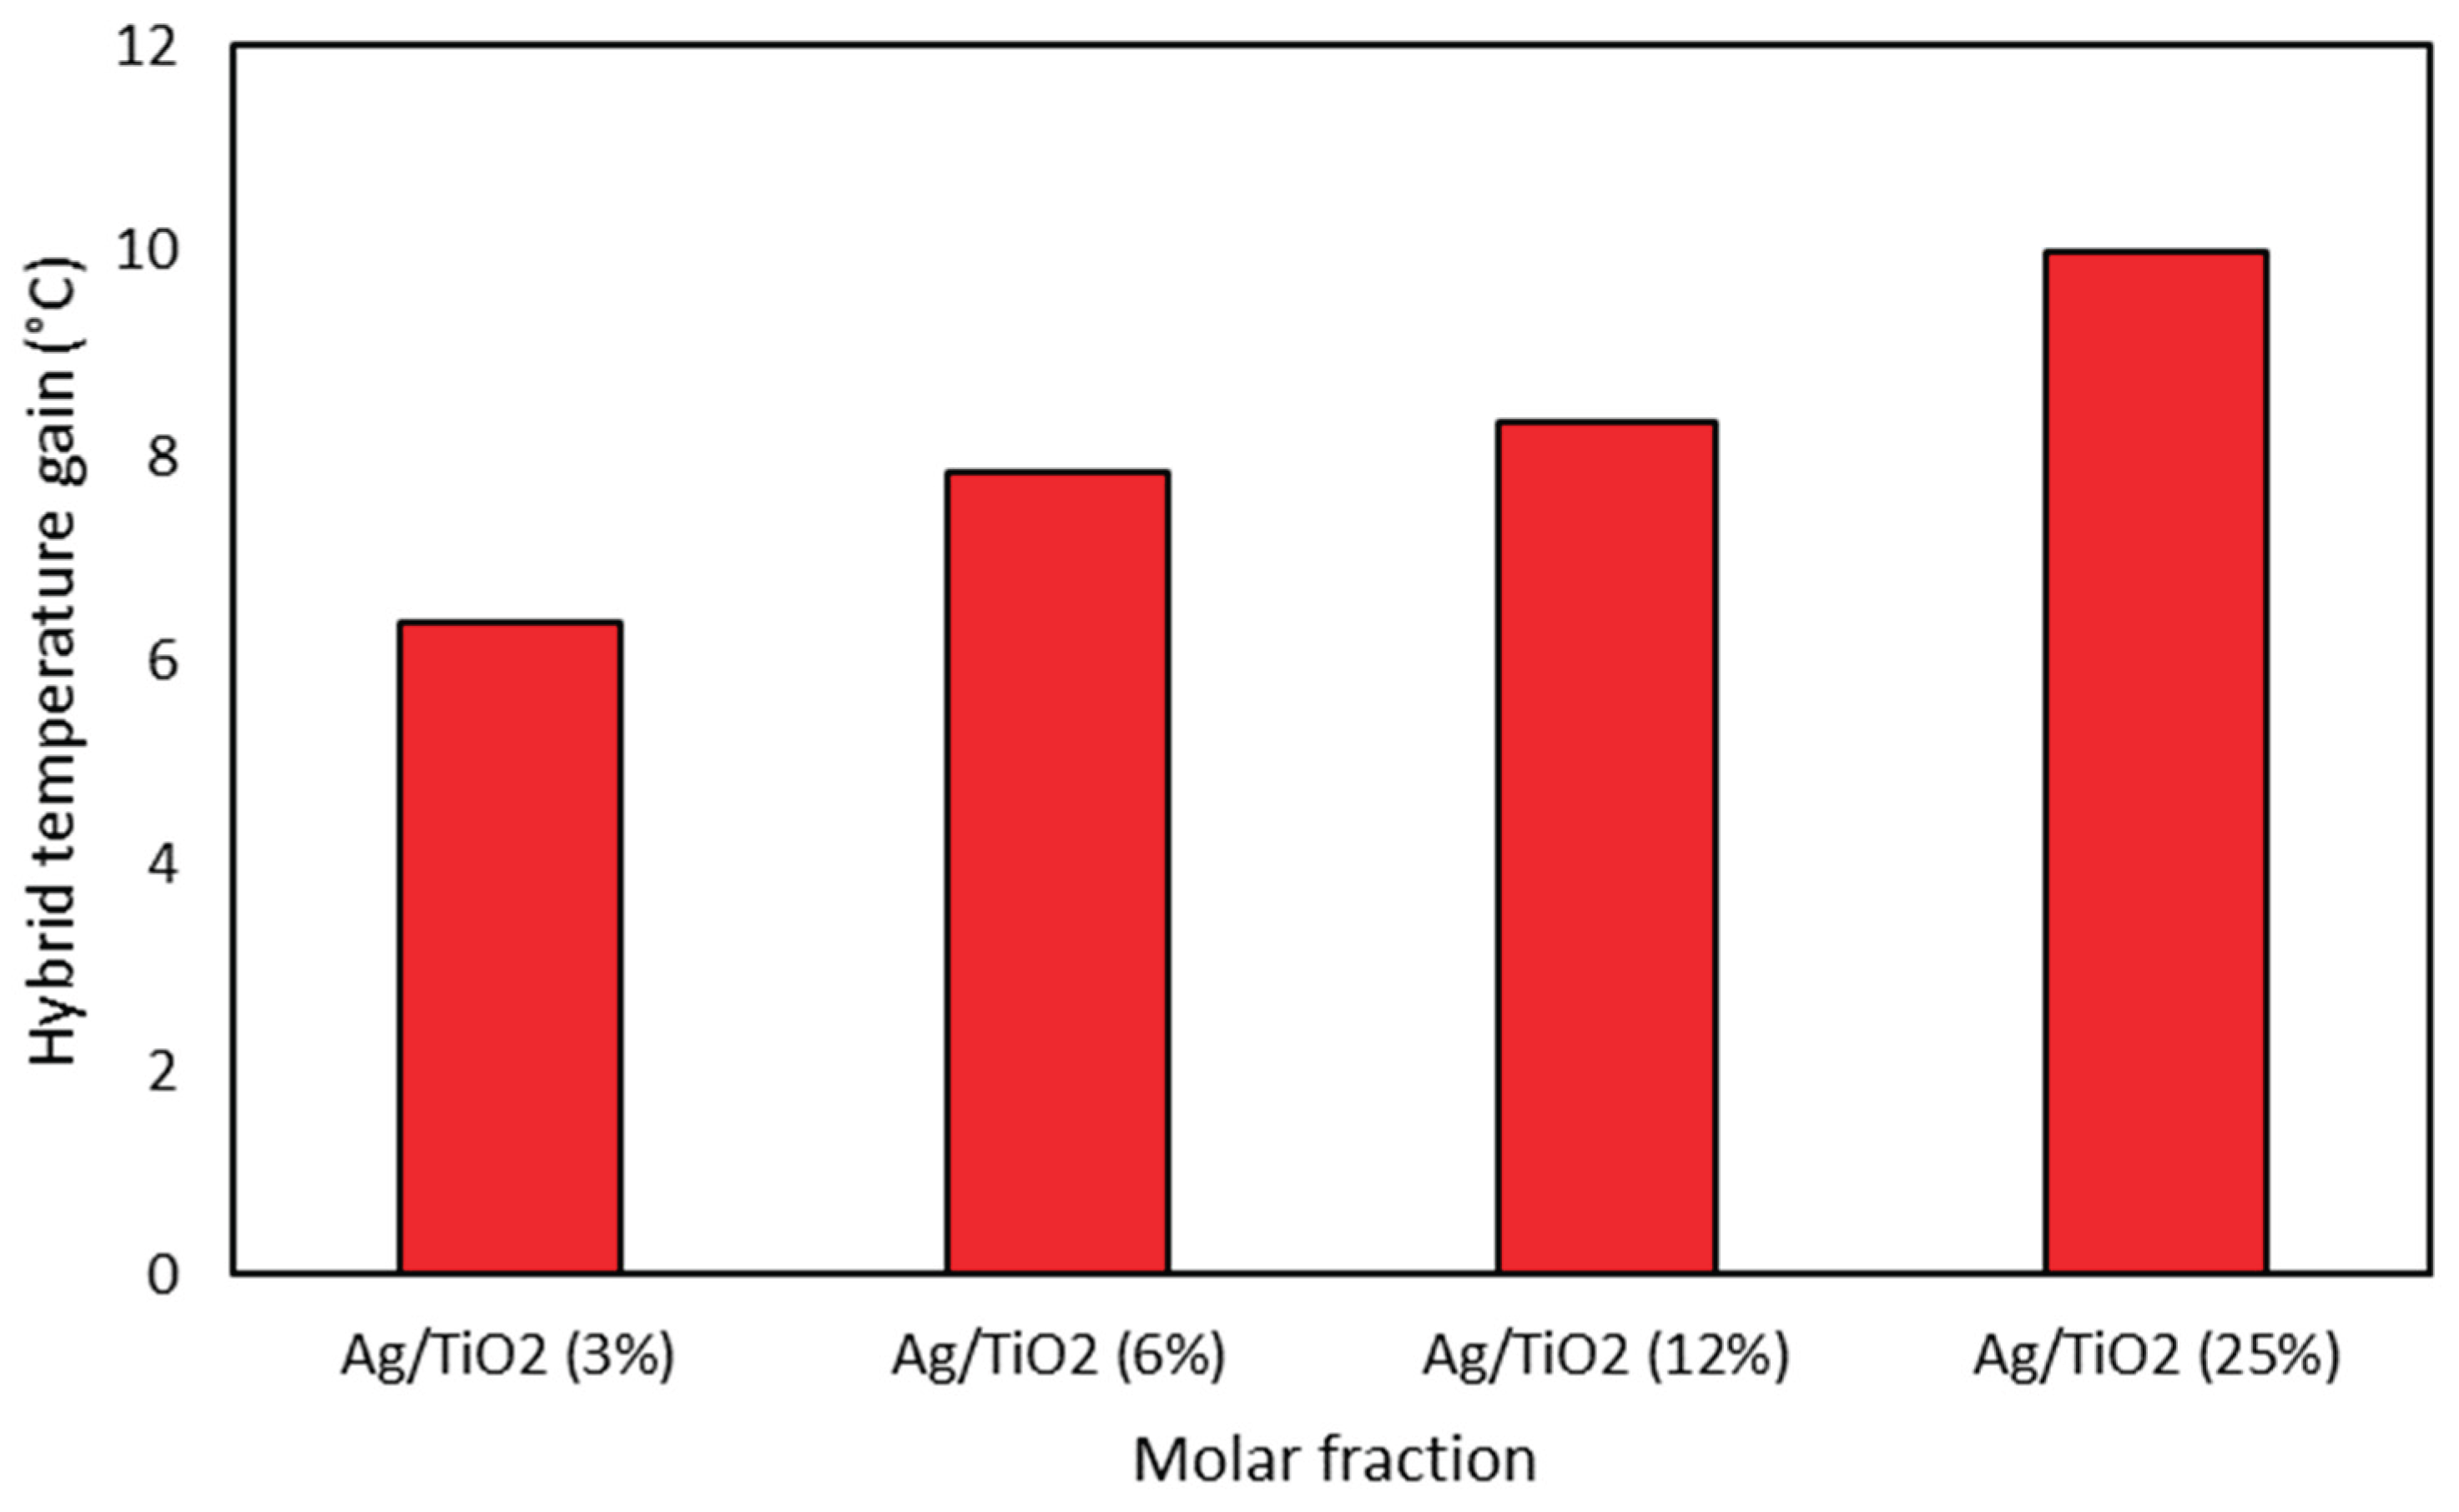
Figure 10.
UV-VIS spectra of Silver nanofluid (red line), Titanium oxide nanofluid (green line), Mixture of Ag and TiO2 nanofluids, Silver/Titanium oxide Hybrid nanofluid (blue line) and algebraic sum of silver nanofluid and titanium oxide nanofluid curves (dashed black curve).
Figure 10.
UV-VIS spectra of Silver nanofluid (red line), Titanium oxide nanofluid (green line), Mixture of Ag and TiO2 nanofluids, Silver/Titanium oxide Hybrid nanofluid (blue line) and algebraic sum of silver nanofluid and titanium oxide nanofluid curves (dashed black curve).
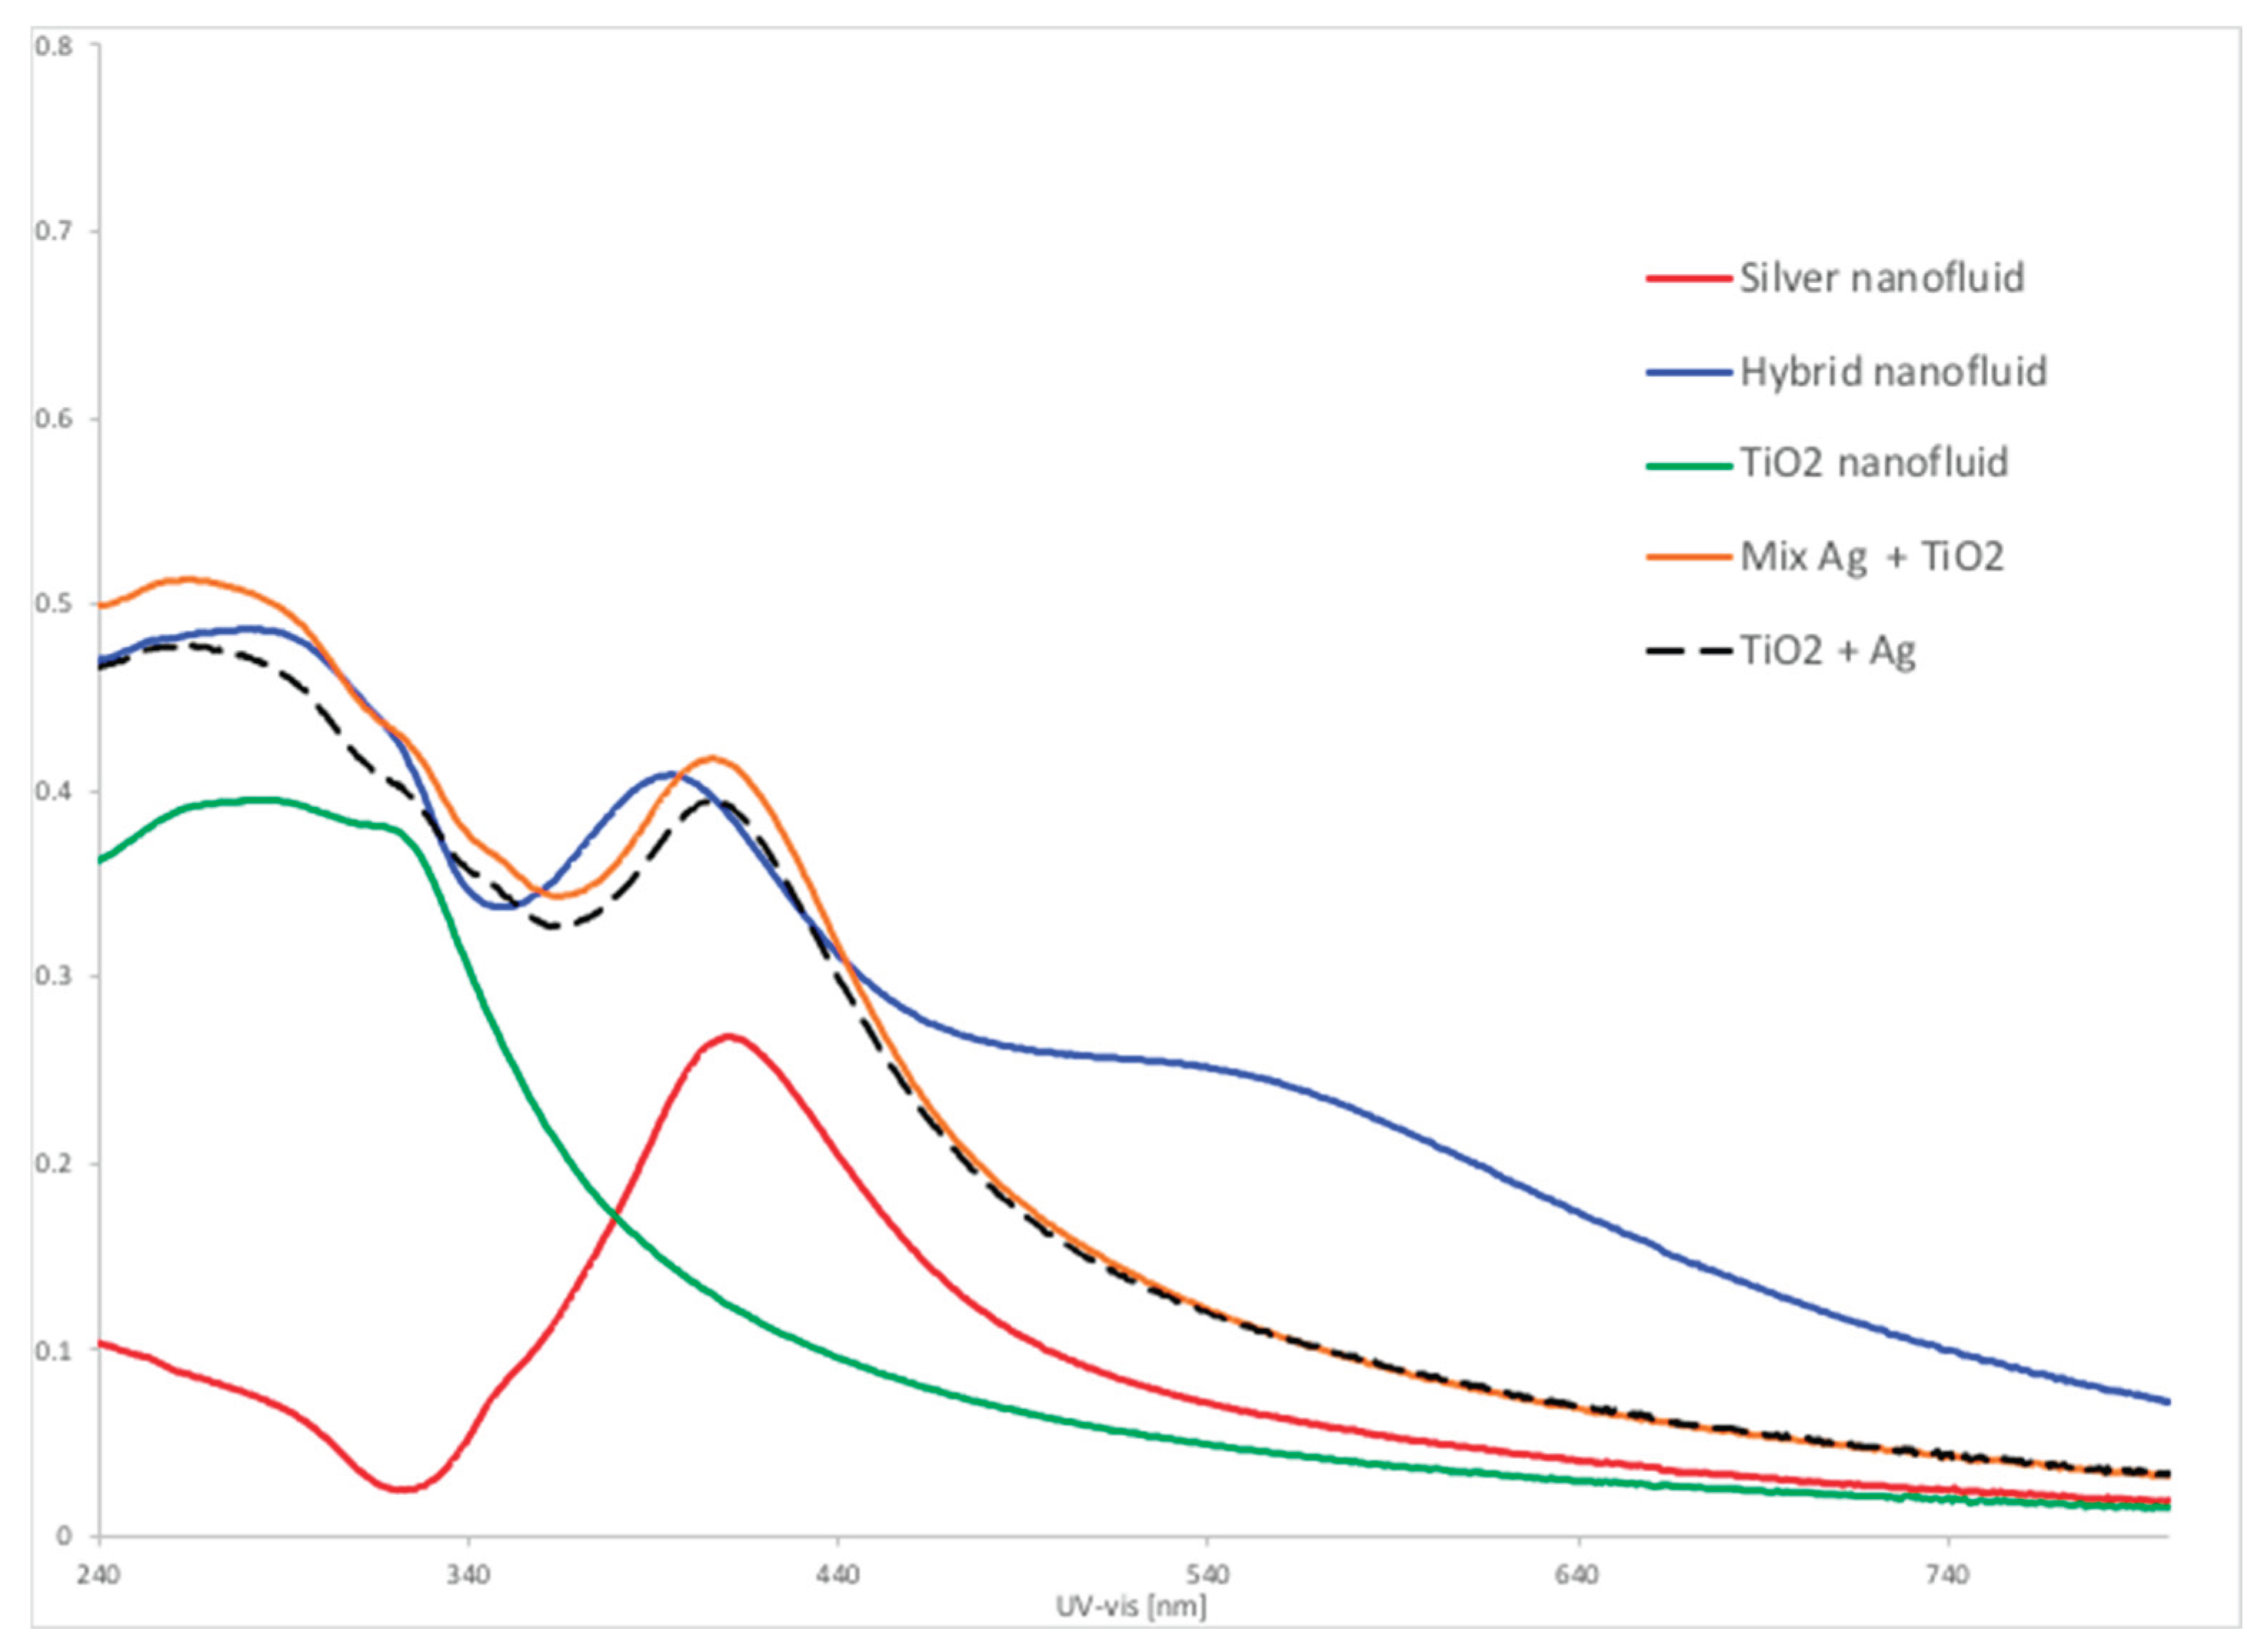
Figure 11.
Comparison of the three tests performed on the solar wall with silver nanofluids (0.4025 ppm, 0.8125 ppm, 1.625 ppm and 3.5 ppm), titanium dioxide (23.2 ppm) and the hybrid nanofluid.
Figure 11.
Comparison of the three tests performed on the solar wall with silver nanofluids (0.4025 ppm, 0.8125 ppm, 1.625 ppm and 3.5 ppm), titanium dioxide (23.2 ppm) and the hybrid nanofluid.
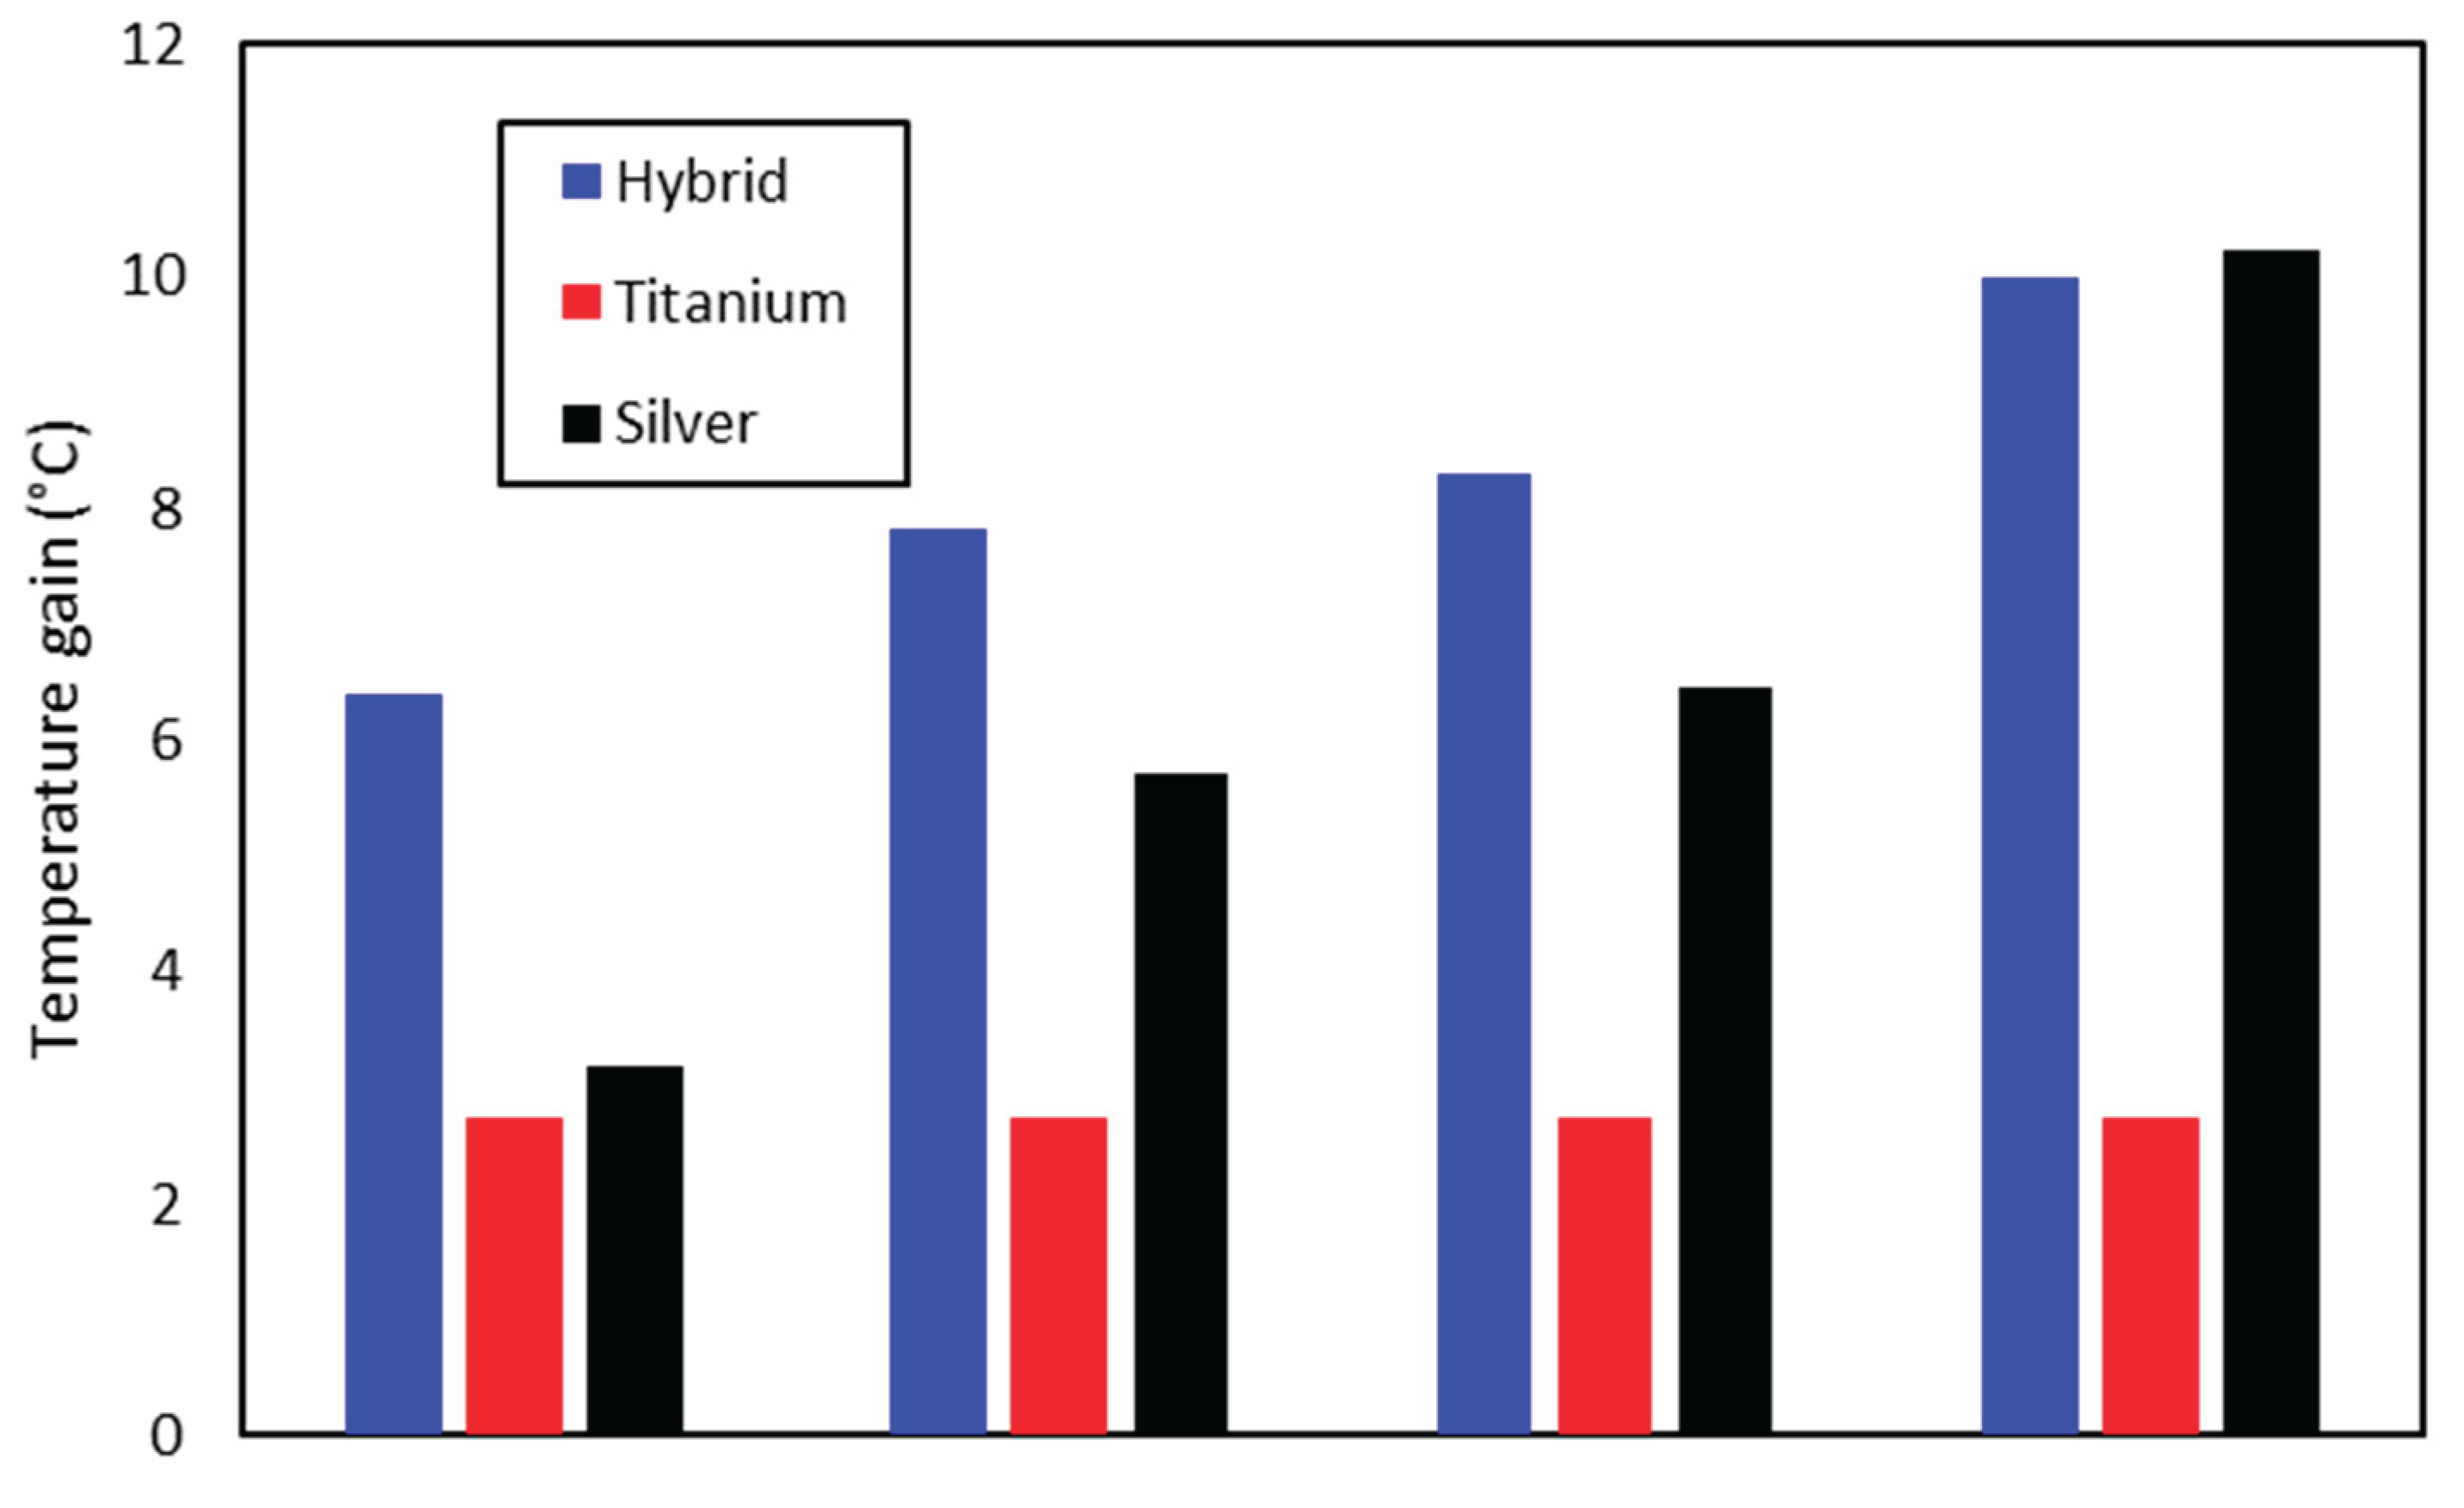
Figure 12.
Comparison of the hybrid nanofluid temperature gain against the silver nanofluid as a function of the tested concentrations.
Figure 12.
Comparison of the hybrid nanofluid temperature gain against the silver nanofluid as a function of the tested concentrations.
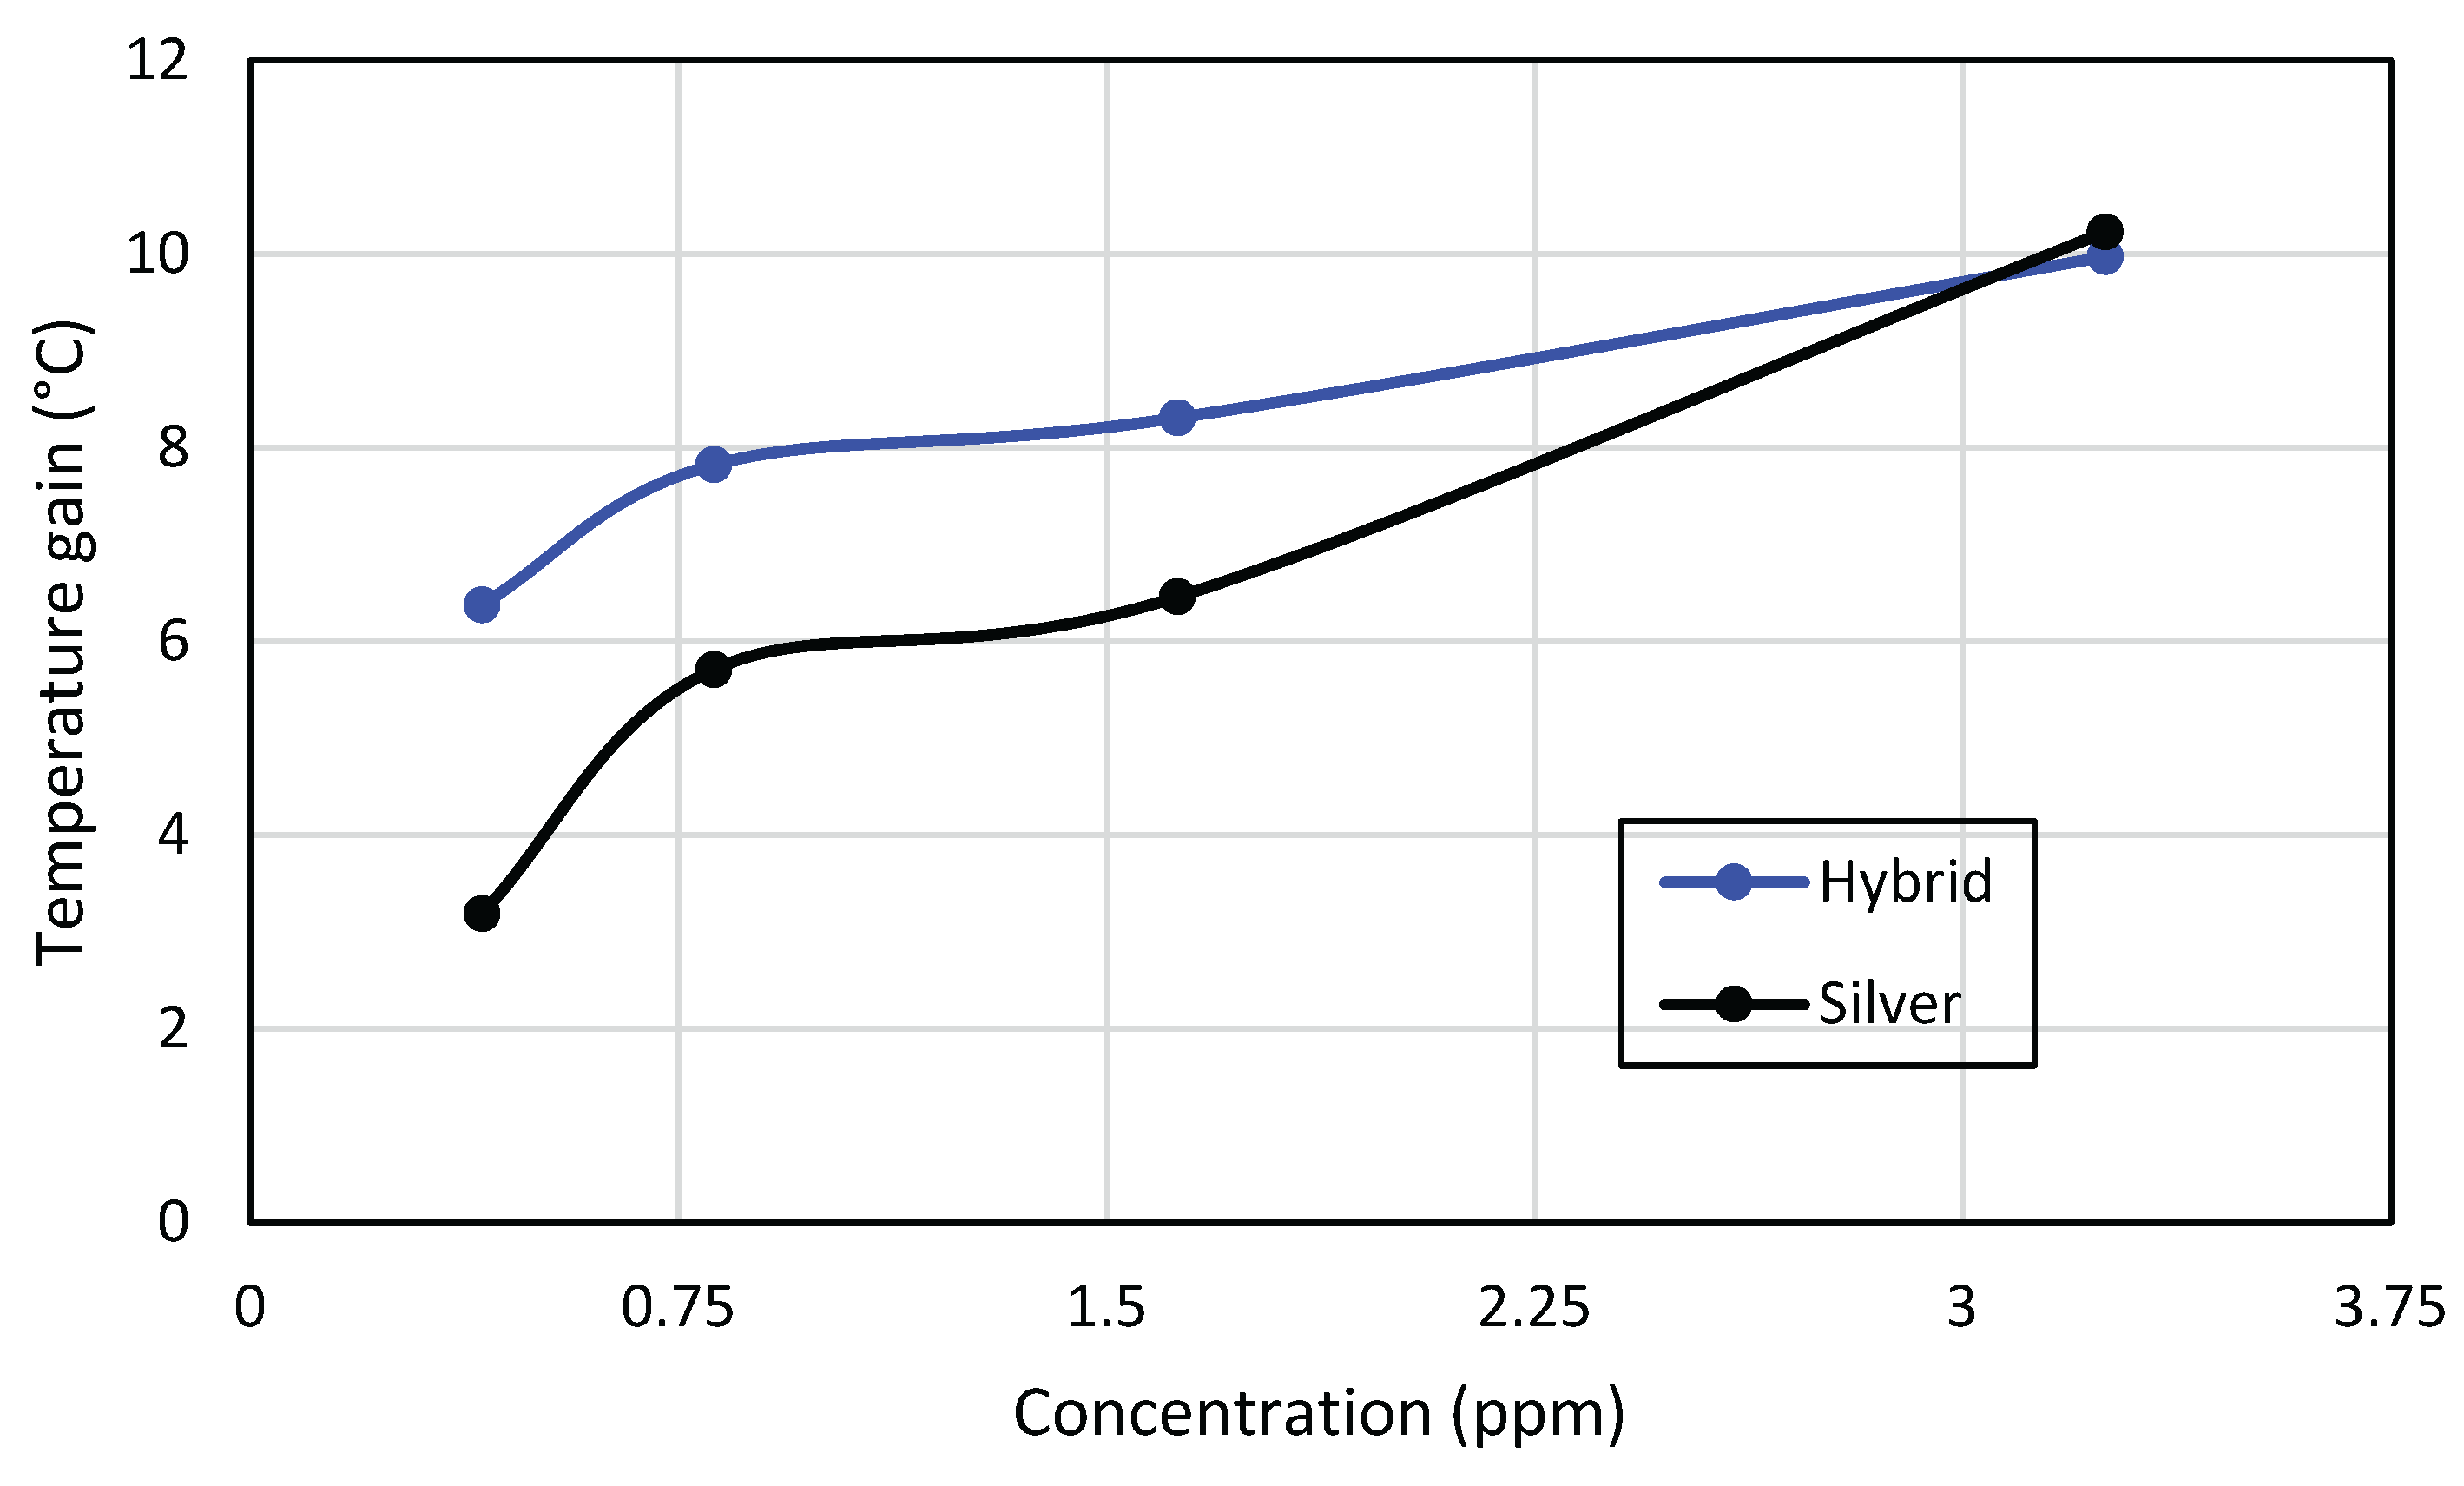
Figure 13.
Percentage of energy gain of the samples for the three nanofluids under study.
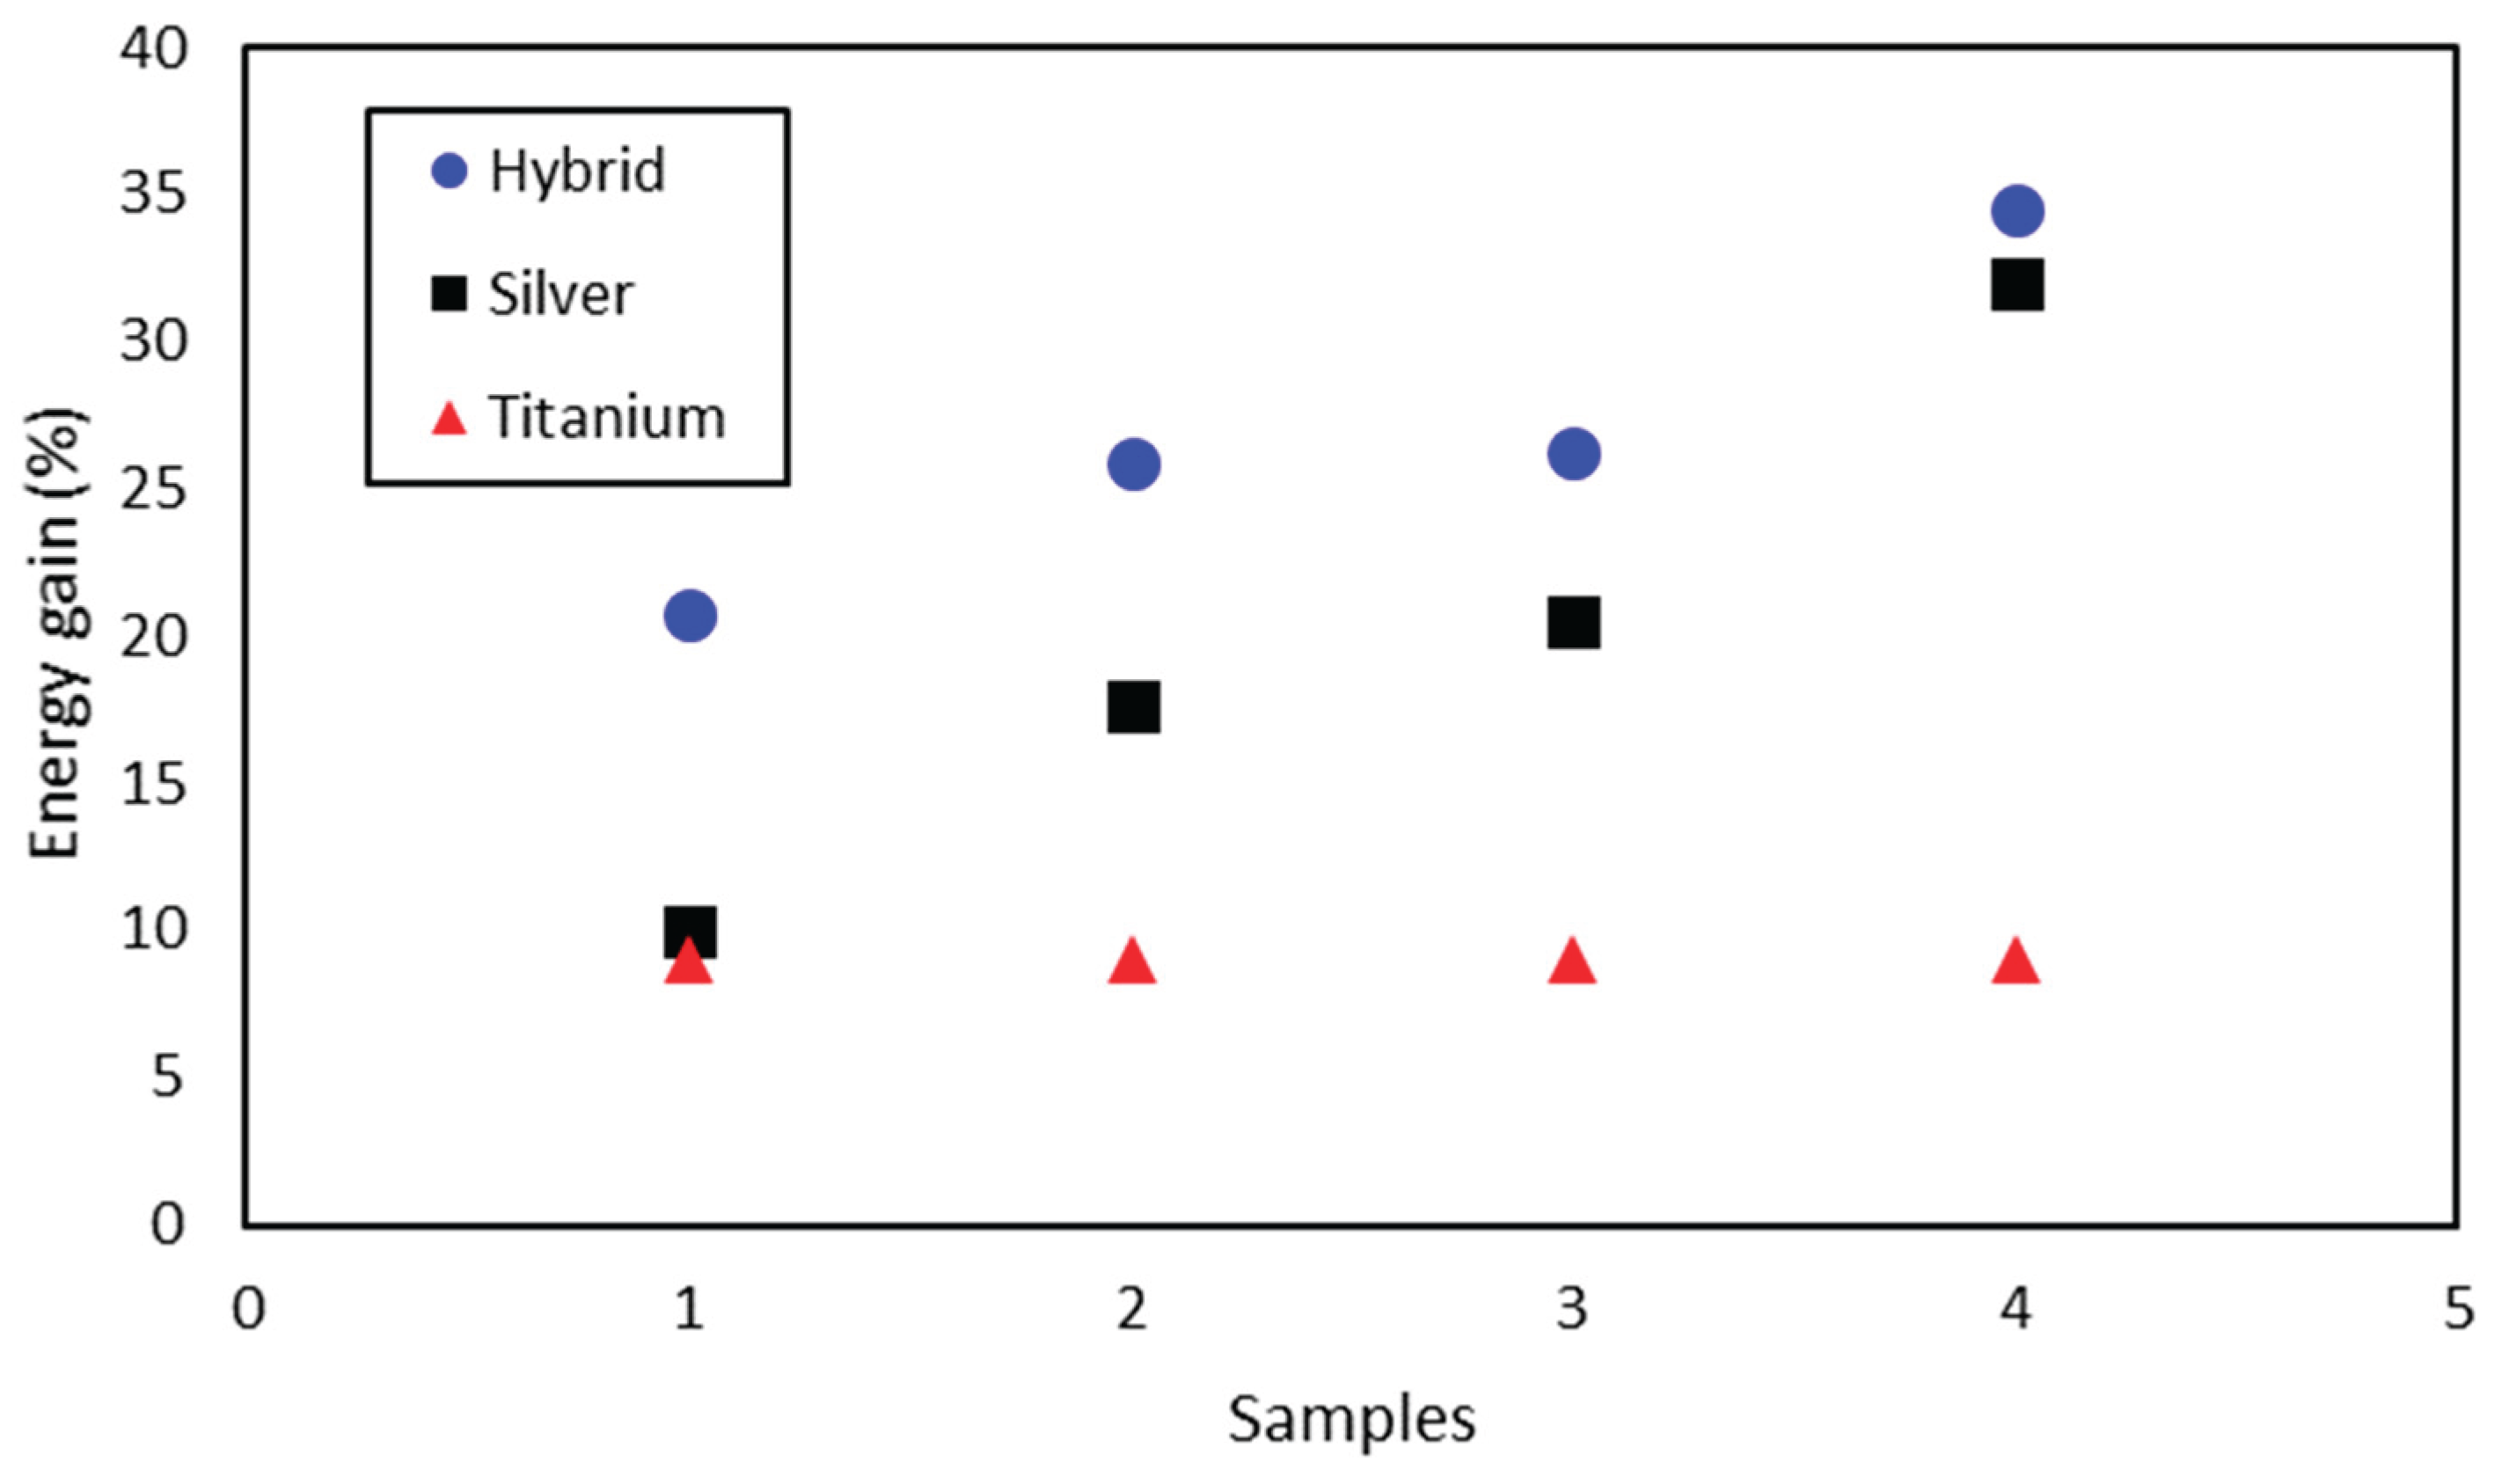
Figure 14.
Comparison between the SAR values of silver and titanium dioxide nanofluids.
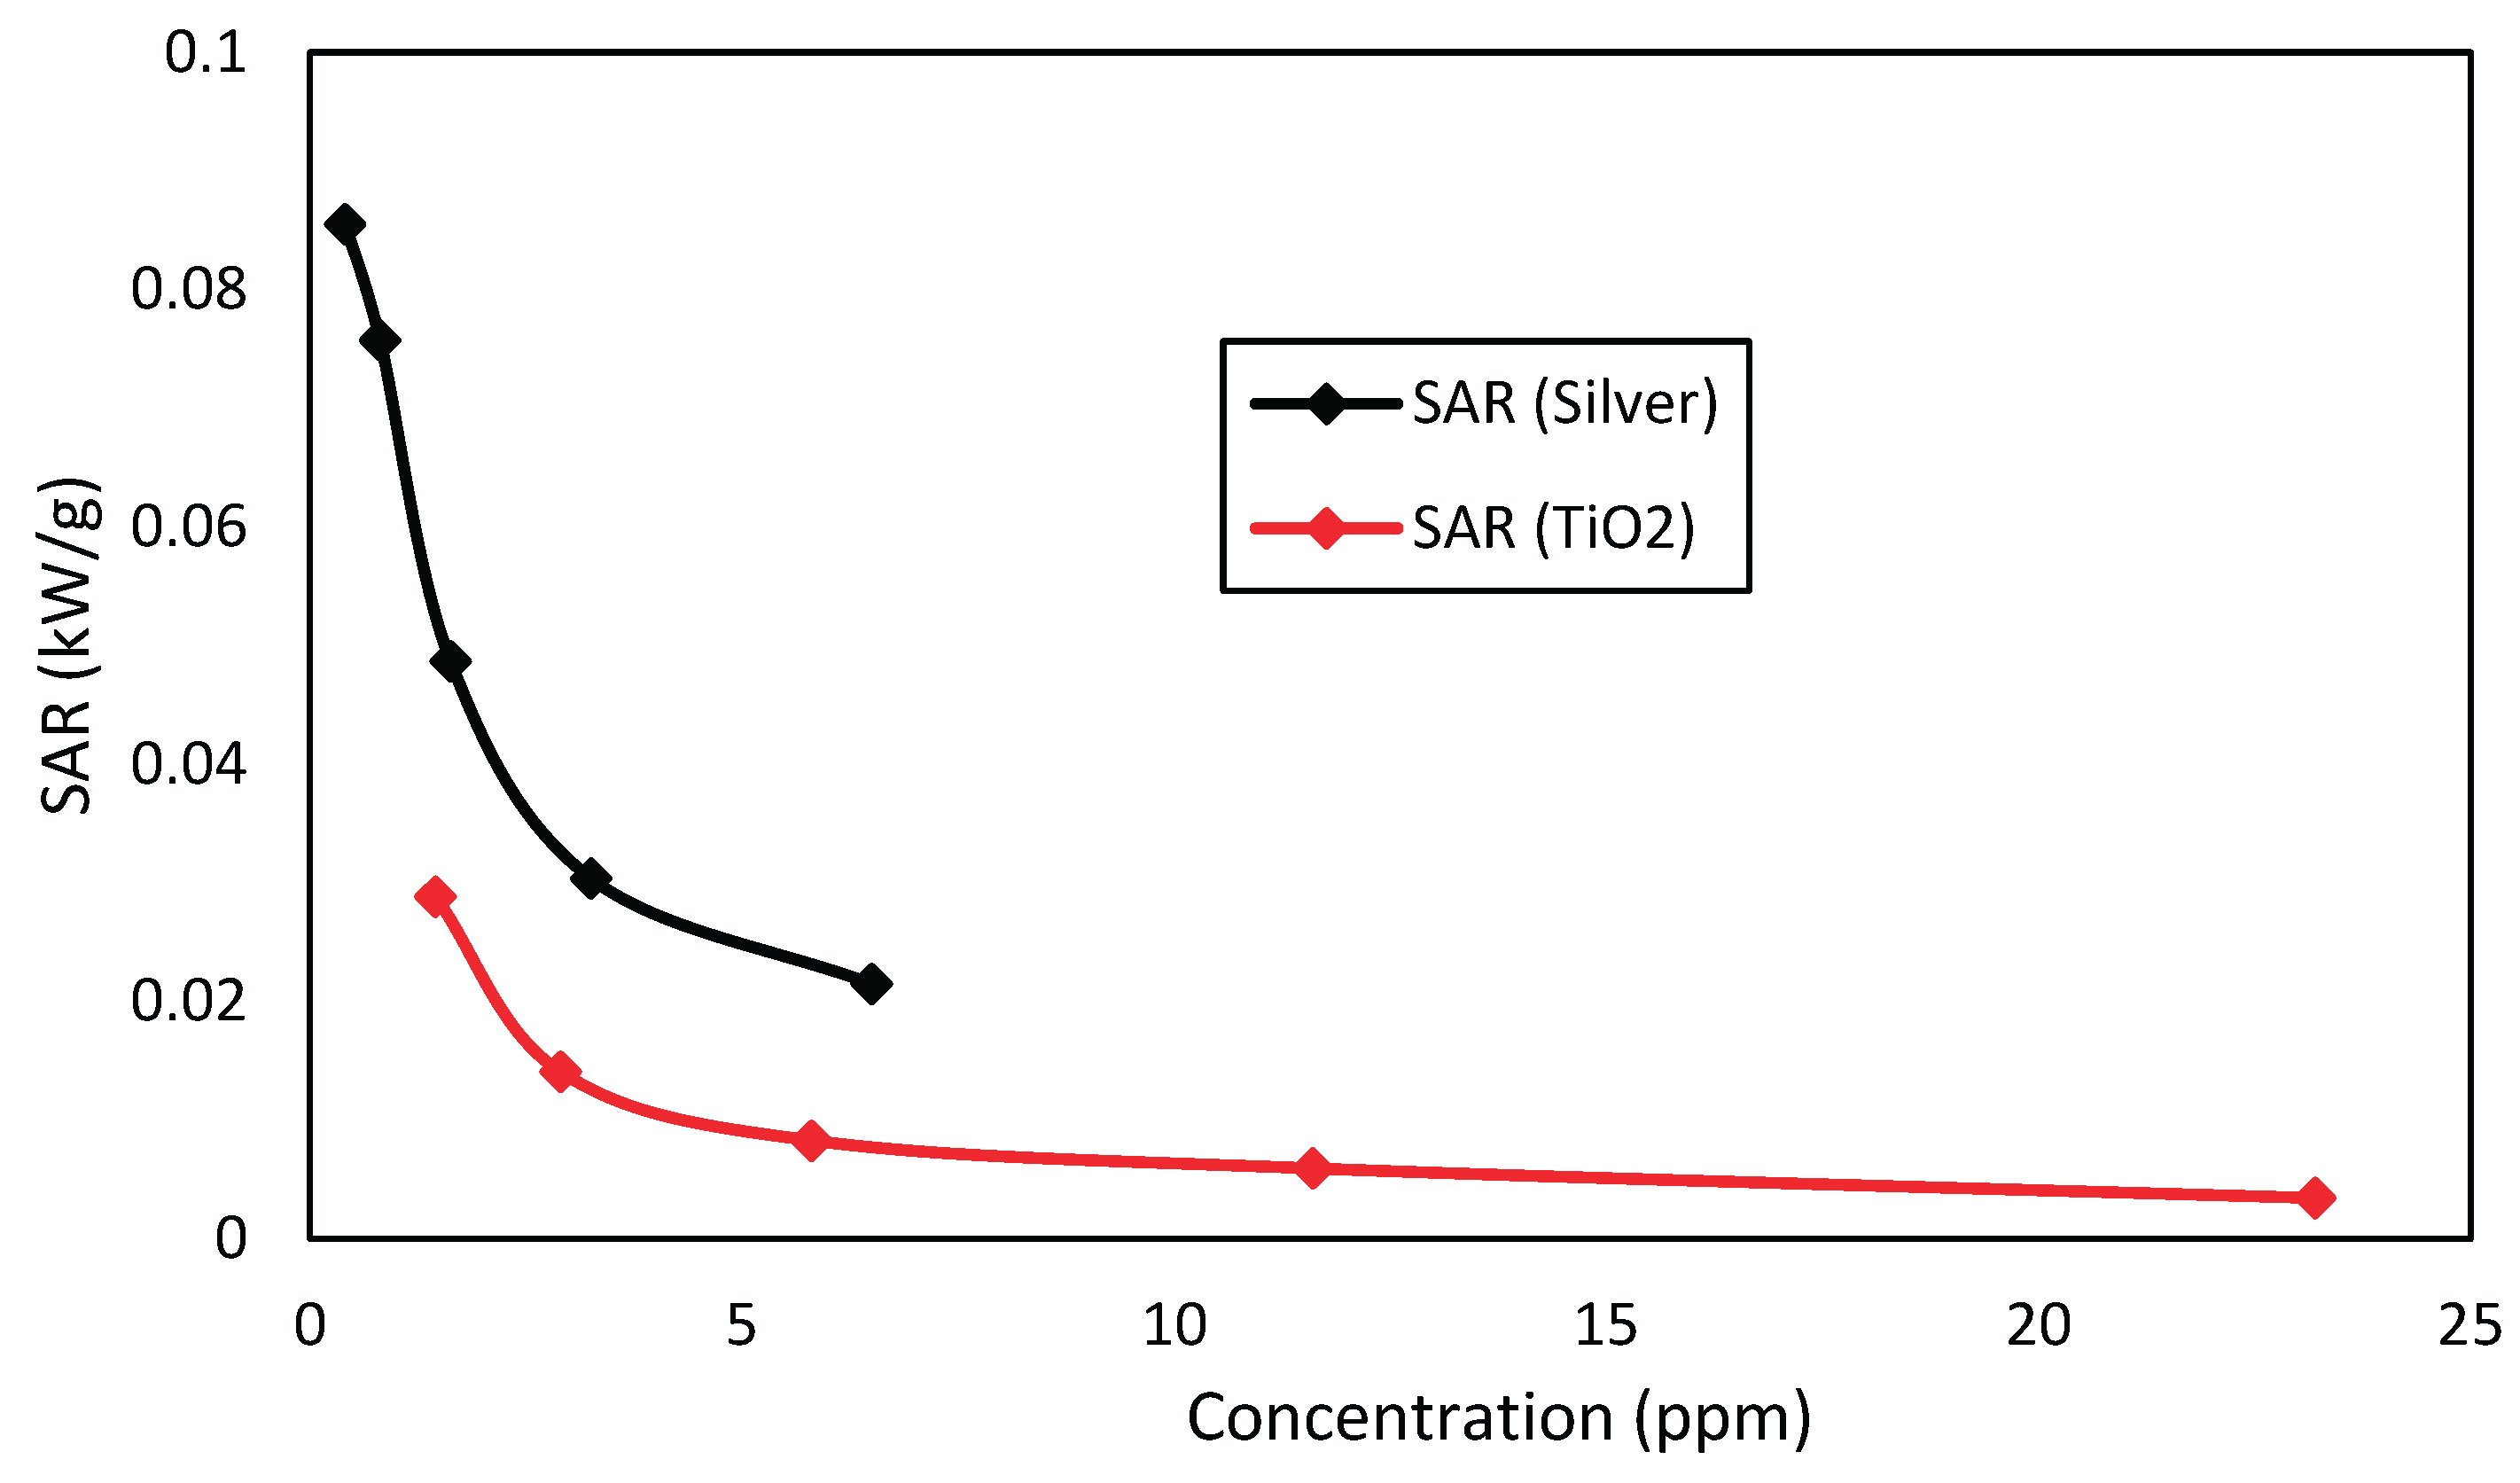
Figure 15.
Economic viability of titanium dioxide nanofluid for the studied concentrations.
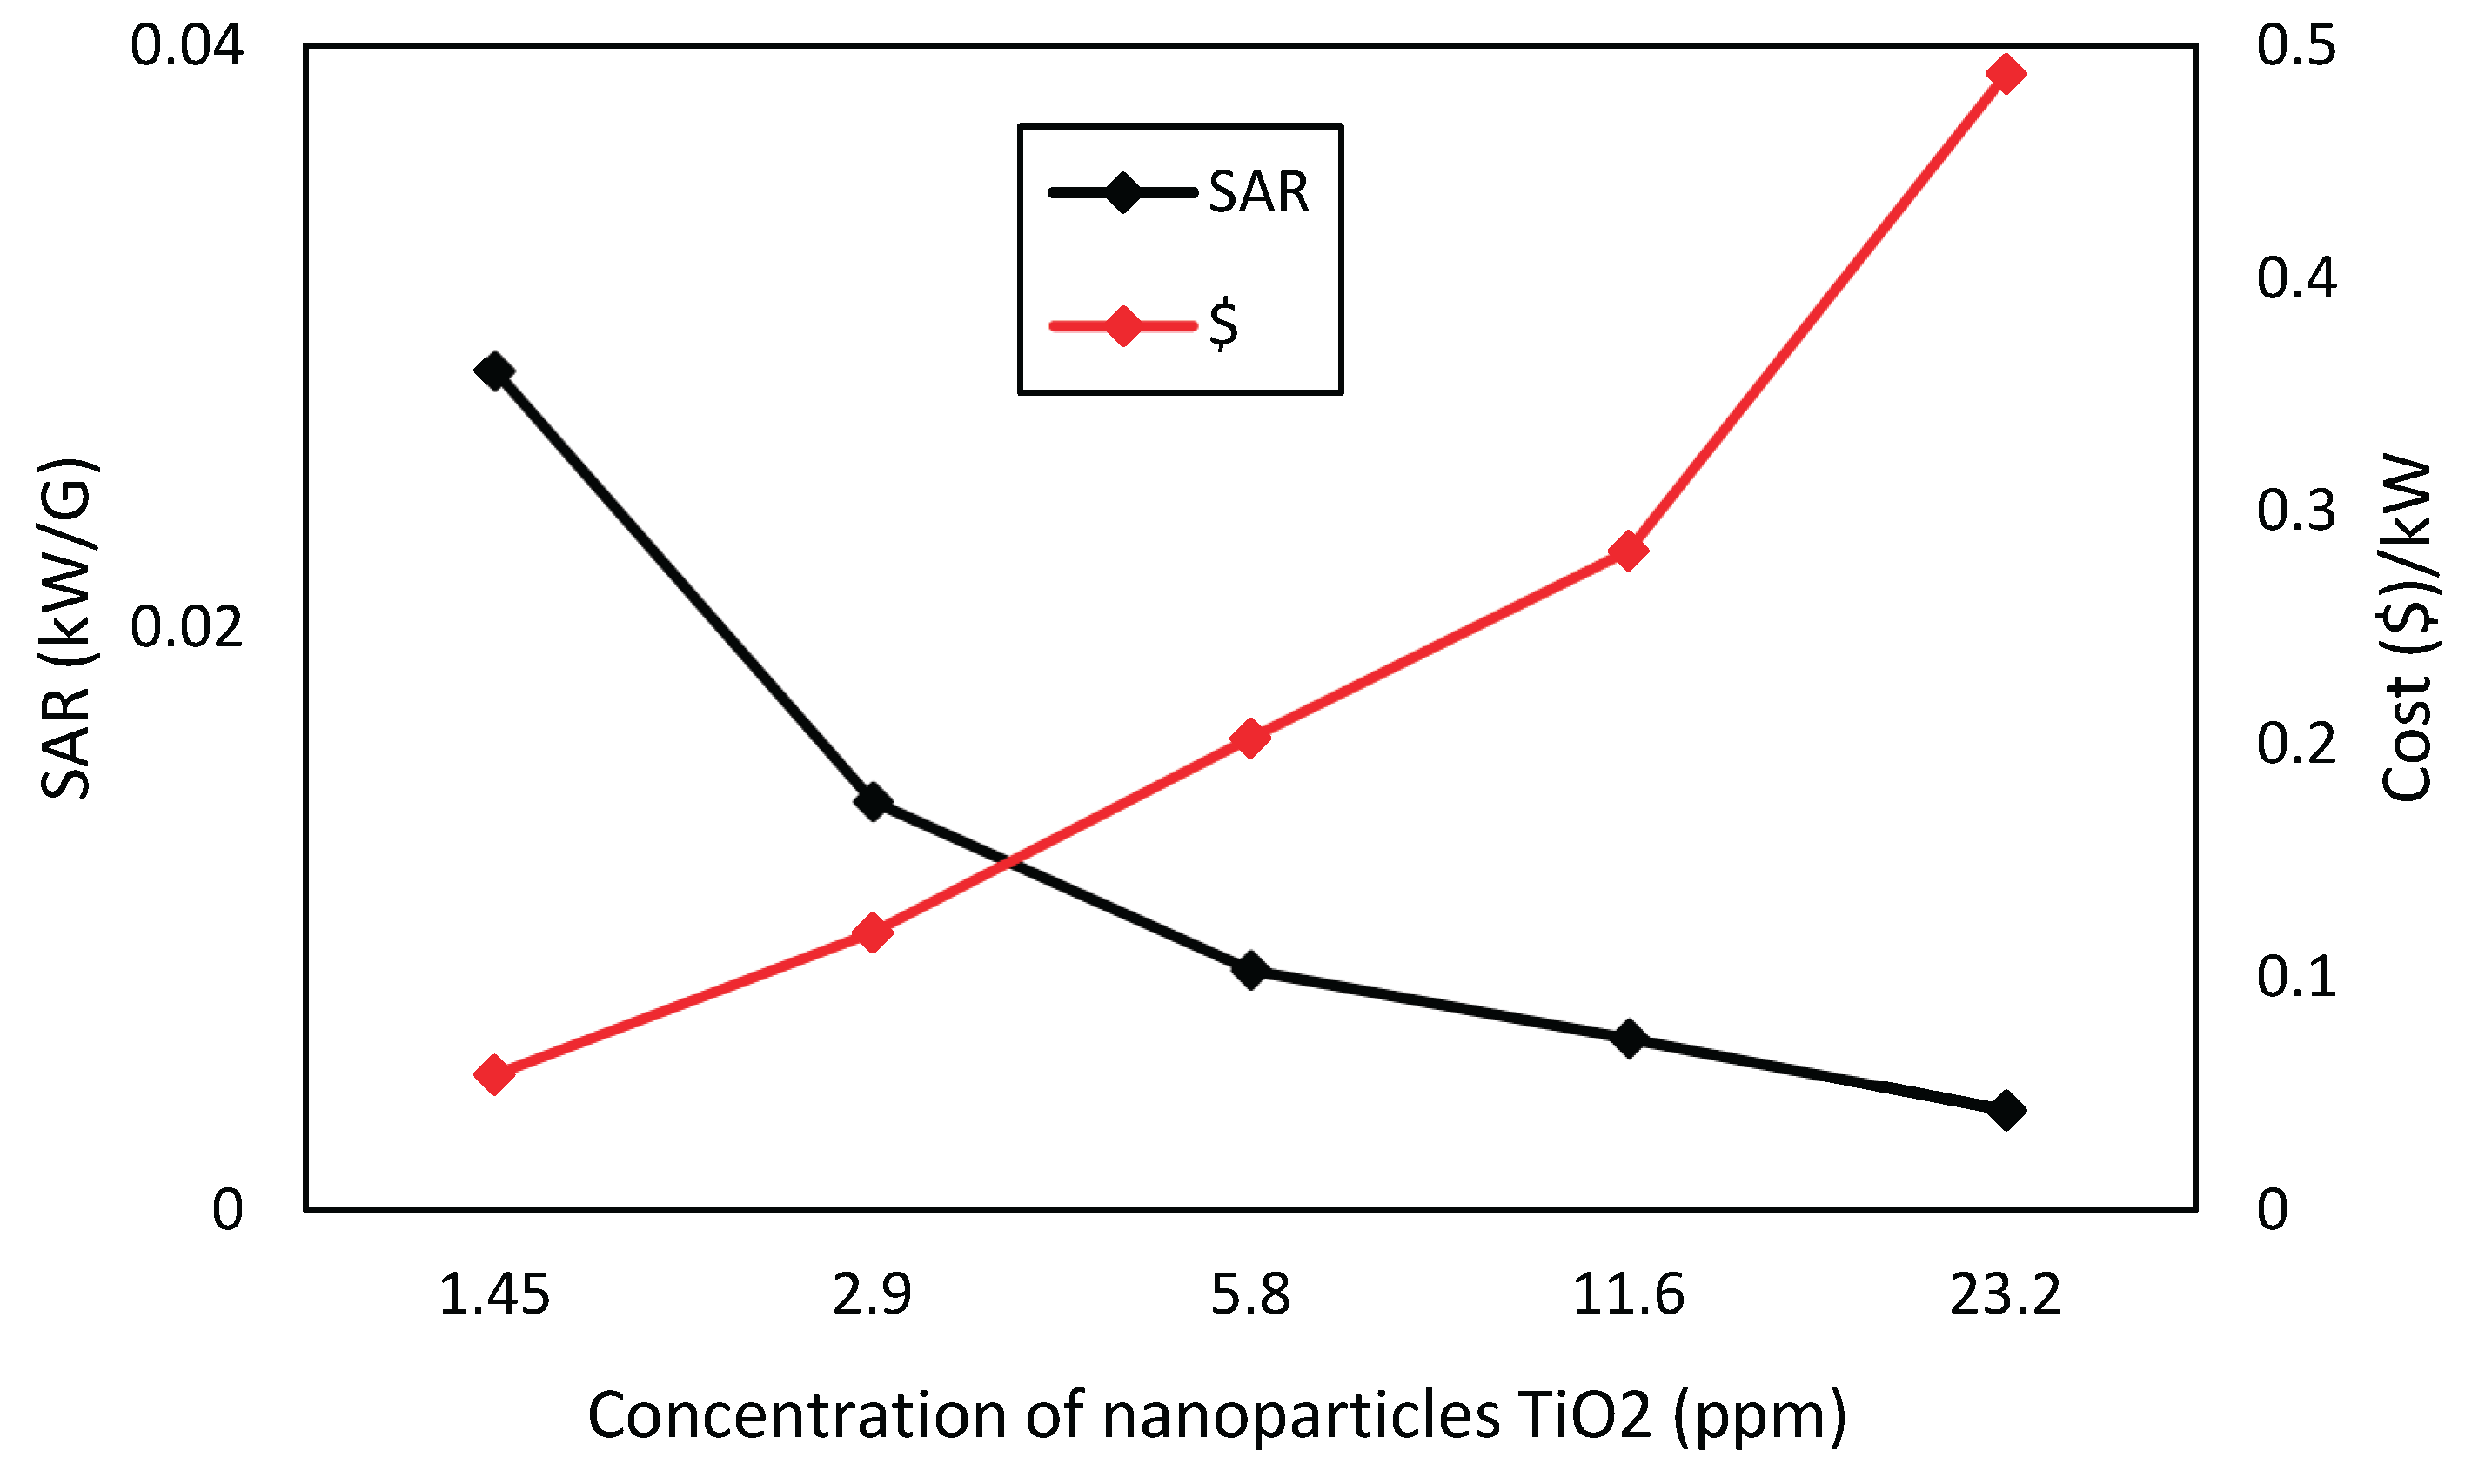
Figure 16.
Economic viability of silver nanofluid for the studied concentrations.
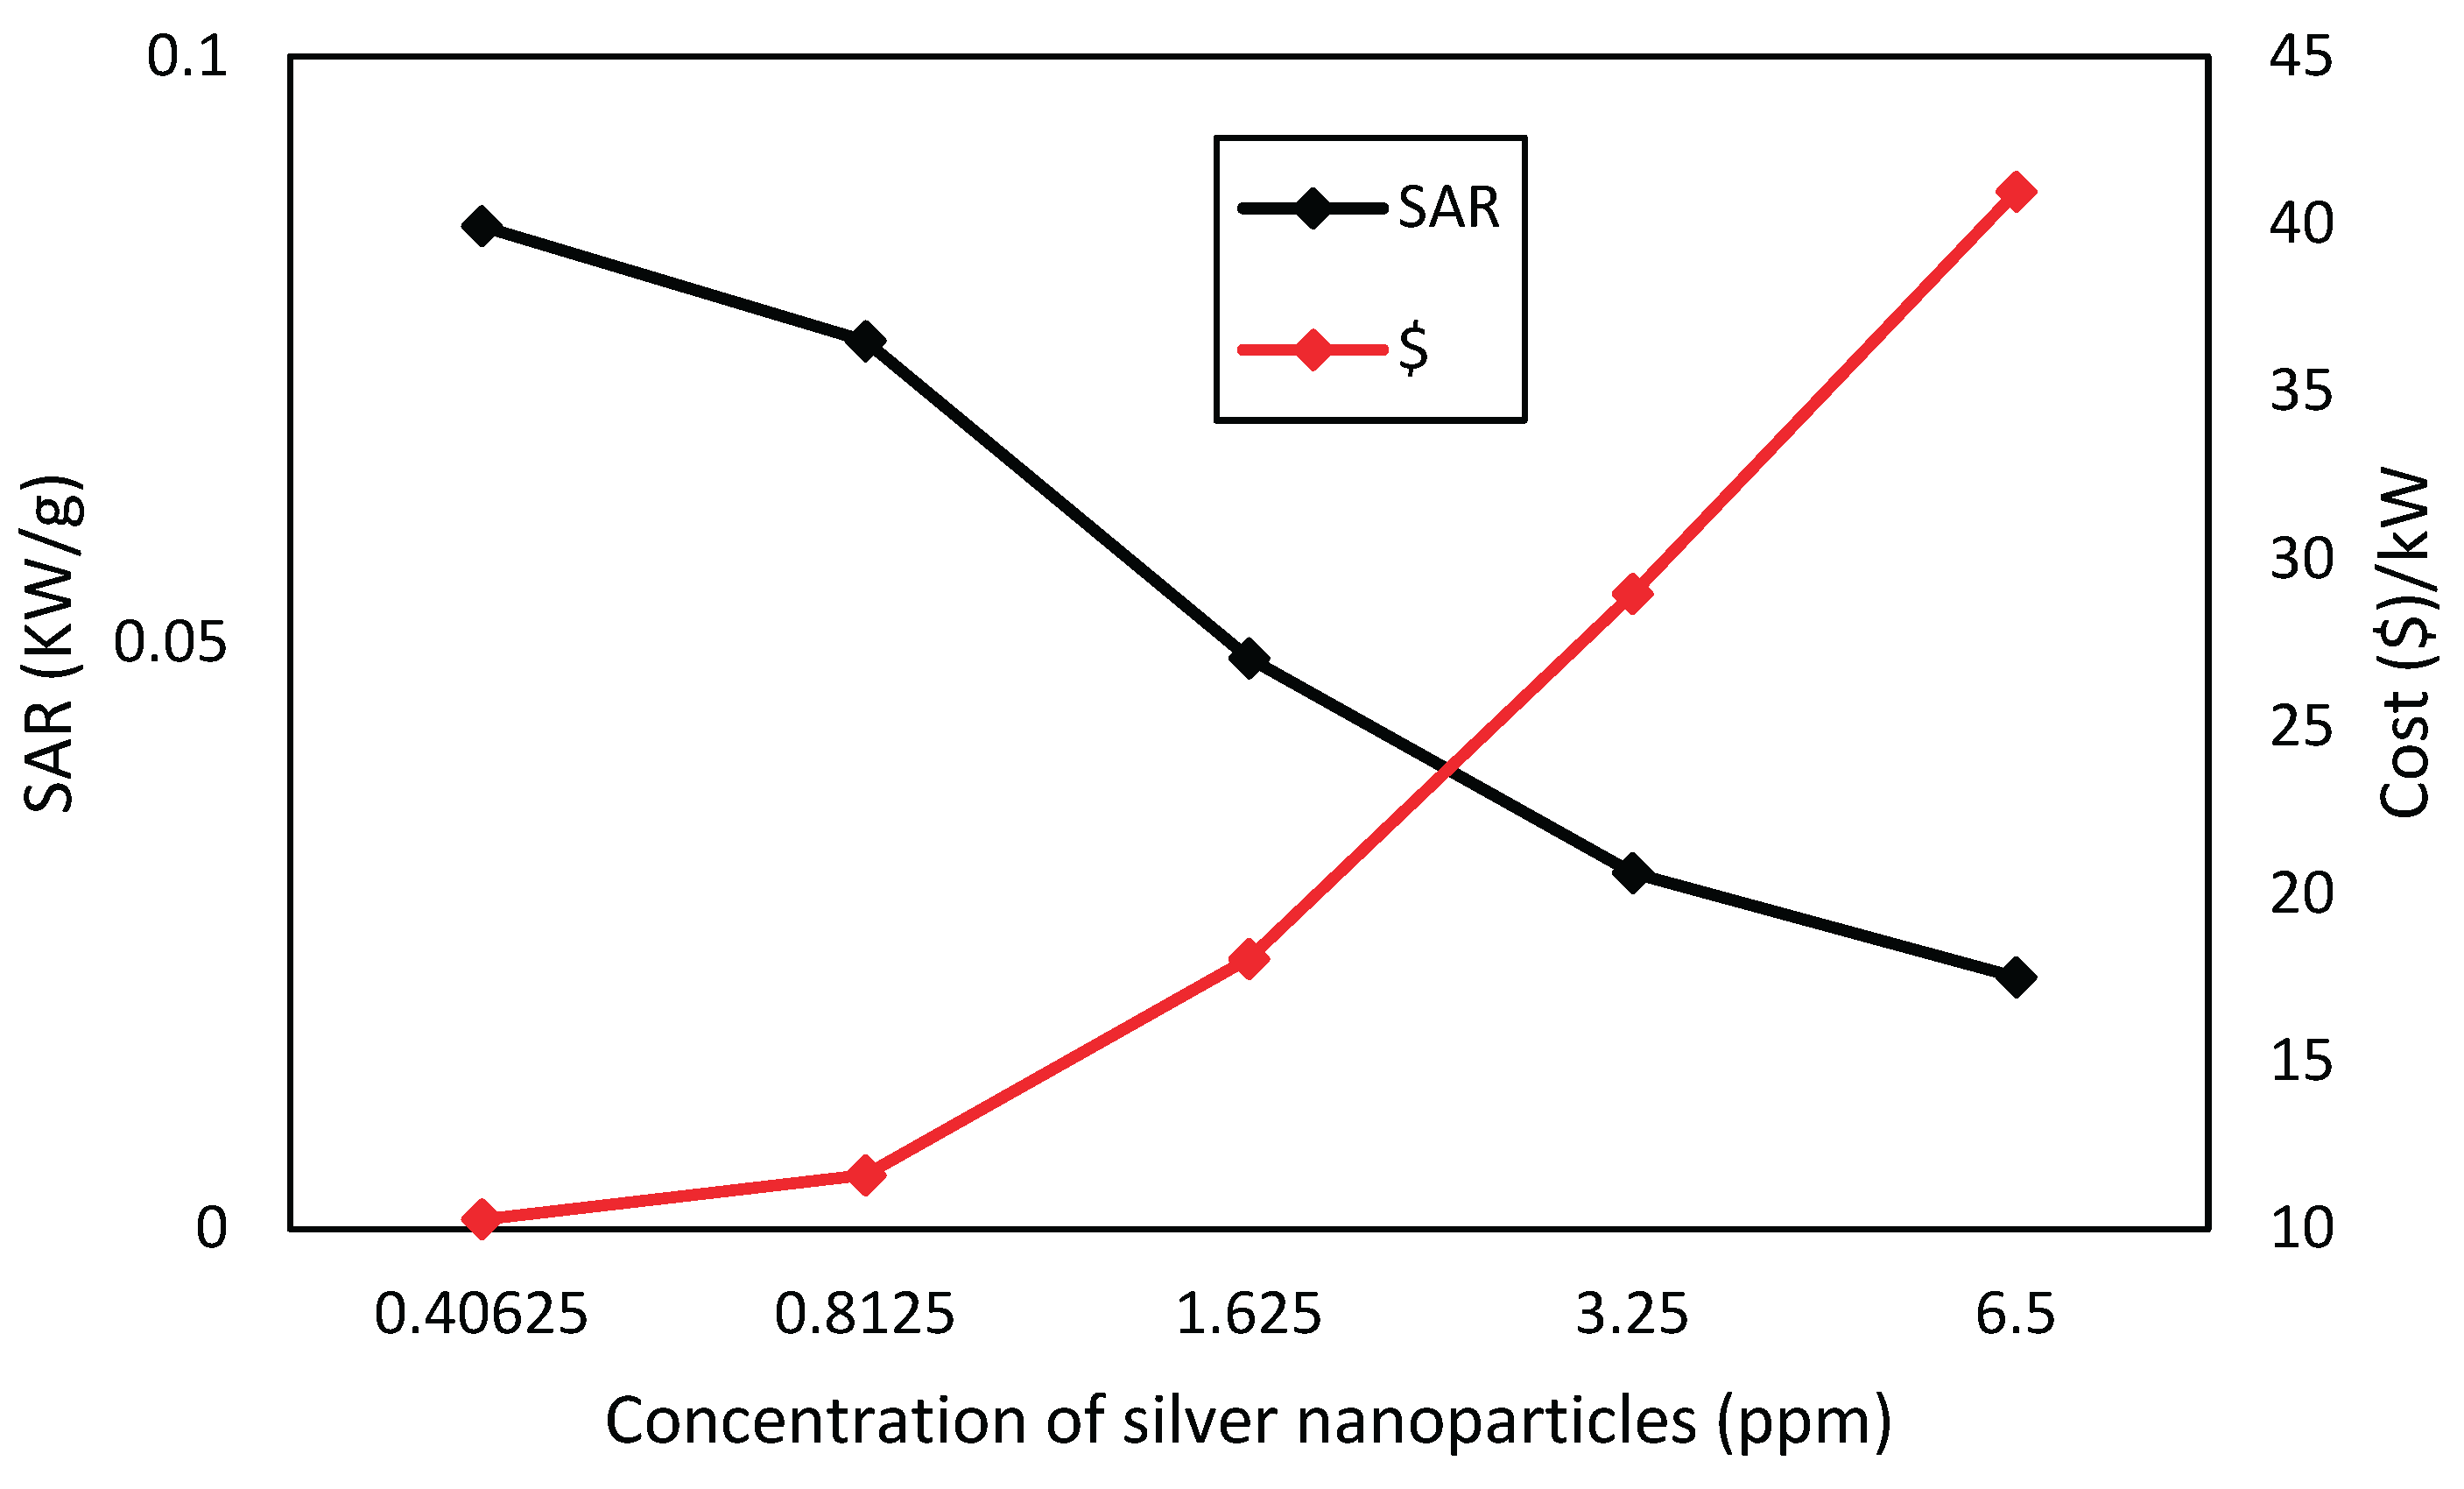

Table 1.
Concentrations of the studied nanofluids.
| Nanofluids | Molar Concentration (mol/L) | Volume Concentration (ppm) |
|---|---|---|
| Silver | 3.86 × 10⁻⁵ | 0.40625 |
| 7.71 x 10⁻⁵ | 0.8125 | |
| 1.54 x 10⁻⁴ | 1.625 | |
| 3.09 x 10⁻⁴ | 3.25 | |
| 6.17 x 10⁻⁴ | 6.5 | |
| TiO2 | 7.71 x 10⁻⁵ | 1.45 |
| 1.54 x10⁻⁴ | 2.9 | |
| 3.09 x 10⁻⁴ | 5.8 | |
| 6.17 x 10⁻⁴ | 11.6 | |
| 1.23 x 10⁻⁴ | 23.2 |
Table 2.
Studied samples of the hybrid nanofluid.
| Samples | Titanium | Silver | Hybrid |
|---|---|---|---|
| Sample 1 | 23.2 ppm | 0.4025 ppm | 3% |
| Sample 2 | 23.2 ppm | 0.8125 ppm | 6% |
| Sample 3 | 23.2 ppm | 1.625 ppm | 12% |
| Sample 4 | 23.2 ppm | 3.5 ppm | 25% |
Disclaimer/Publisher’s Note: The statements, opinions and data contained in all publications are solely those of the individual author(s) and contributor(s) and not of MDPI and/or the editor(s). MDPI and/or the editor(s) disclaim responsibility for any injury to people or property resulting from any ideas, methods, instructions or products referred to in the content. |
© 2026 by the authors. Licensee MDPI, Basel, Switzerland. This article is an open access article distributed under the terms and conditions of the Creative Commons Attribution (CC BY) license (http://creativecommons.org/licenses/by/4.0/).
Copyright: This open access article is published under a Creative Commons CC BY 4.0 license, which permit the free download, distribution, and reuse, provided that the author and preprint are cited in any reuse.


