
Submitted:
15 January 2026
Posted:
15 January 2026
You are already at the latest version
Abstract
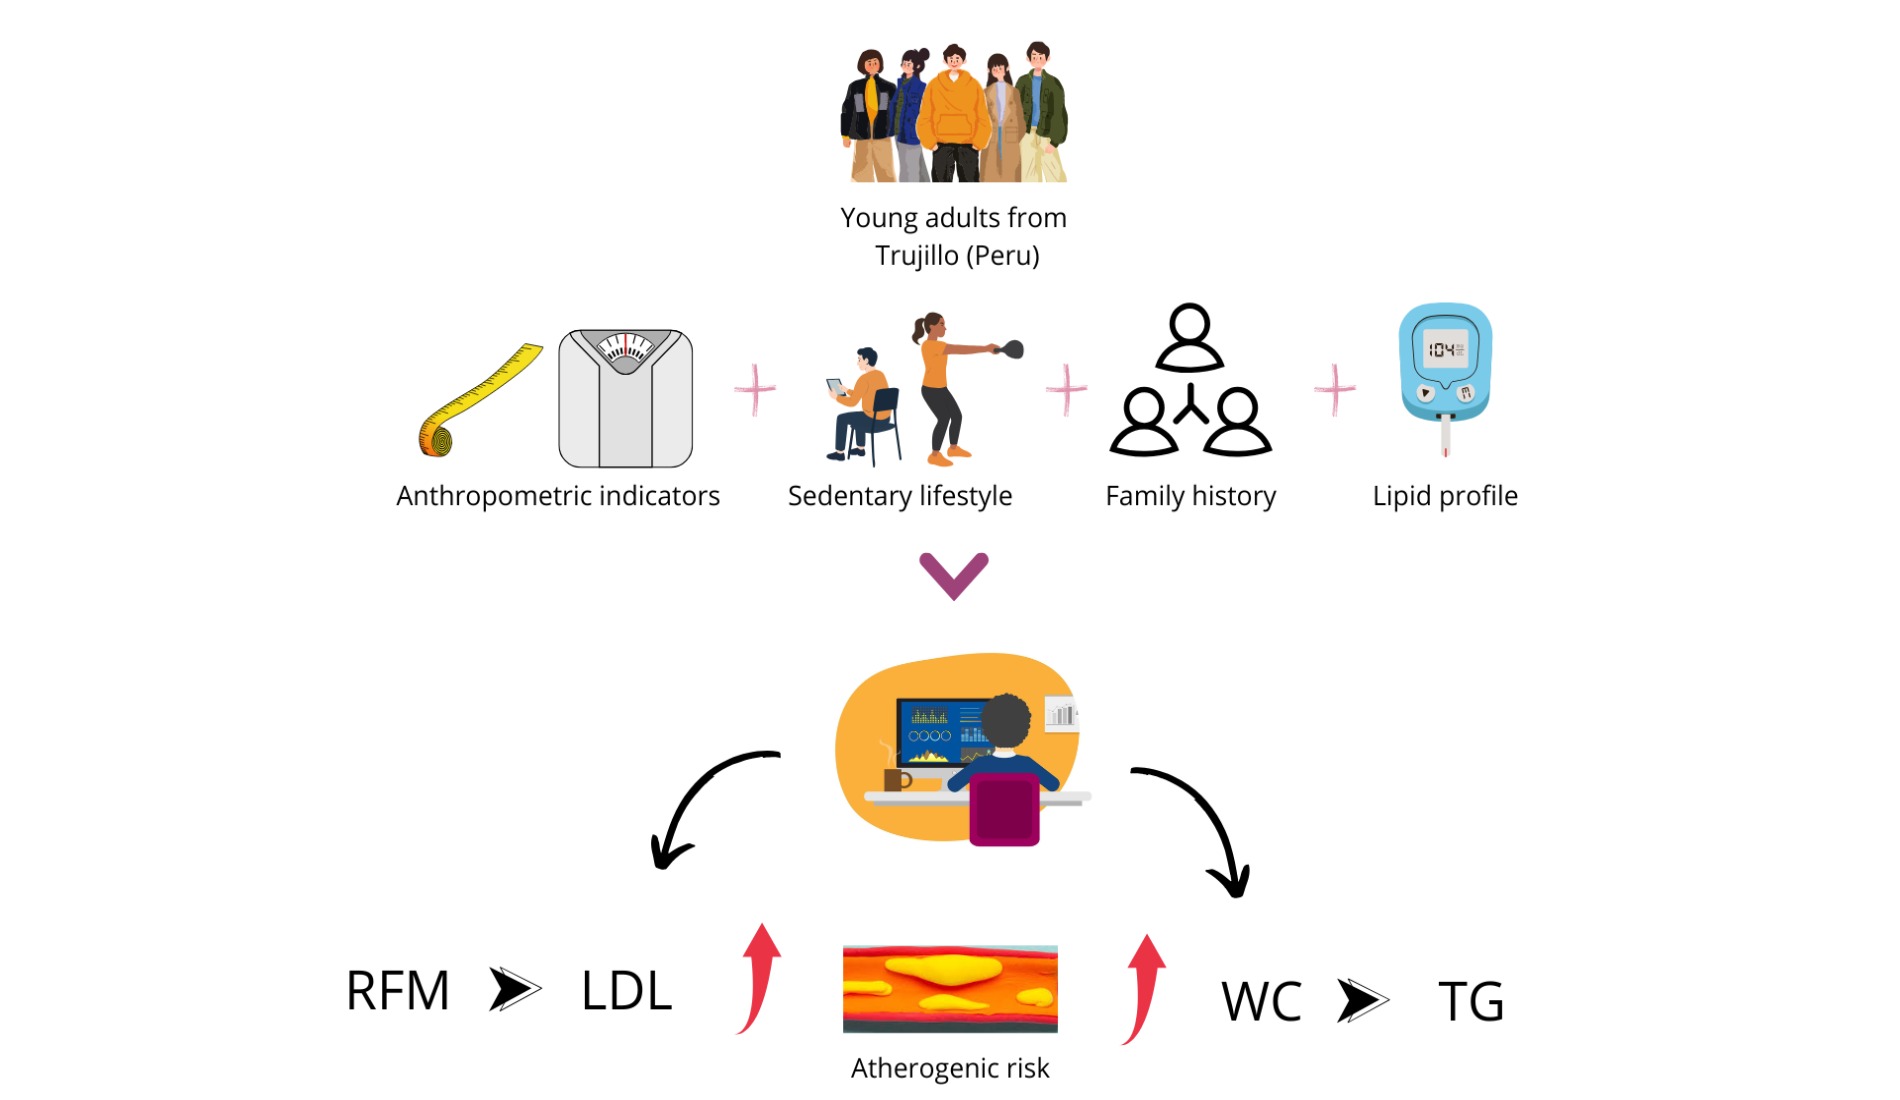
Dyslipidemia is a prevalent metabolic disorder and a major cardiovascular risk factor, often influenced by sedentary lifestyles and family history. This study analyzed the association between sedentary behavior, adiposity indicators, and family history with dyslipidemia in young adults from Trujillo in 2025. A cross-sectional correlational design was applied to 137 participants (41 men and 96 women). Sedentary behavior was measured using the IPAQ questionnaire, while family history of dyslipidemia or cardiovascular disease was recorded. Anthropometric indicators included waist circumference (WC), body mass index (BMI), relative fat mass (RFM), body roundness index (BRI), and conicity index (CI). Lipid profiles were assessed with Mission monitoring equipment. HDL-c was low (38.90 ± 16.45 mg/dL in men; 47.42±15.82 mg/dL in women), while LDL-c was slightly elevated (103.39 ± 36.36 mg/dL and 102.74±33.60 mg/dL). Average cholesterol and triglyceride concentrations were normal in both genders. WC, RFM, and BRI correlated with LDL-c, with RFM showing the strongest association (OR = 4.108; 95% CI: 1.266–13.332). Triglycerides were linked to BMI, WC, BRI, and sedentary lifestyle, with WC being most significant (OR = 6.125; 95% CI: 2.007–18.690). In conclusion, RFM and WC emerged as the most robust predictors of dyslipidemia, underscoring their utility for early detection of elevated LDL-c and hypertriglyceridemia in young populations.
Keywords:
sedentary lifestyle
; anthropometry
; family history
; cholesterol
; triglycerides
1. Introduction
Dyslipidemia is a condition involving elevated blood lipids, as reflected by high levels of total cholesterol (TC), low-density lipoprotein cholesterol (LDL-c), and/or triglycerides (TG), or low levels of high-density lipoprotein cholesterol (HDL-c). These alterations can trigger cardiovascular complications, such as heart attacks, hypertension, and stroke [1].
Globally, more than half of adults in the United States have dyslipidemia. The prevalence is also high and consistent in Latin America, where men have higher rates than women in all studied cities. For example, over 70% of men in Lima and Barquisimeto have dyslipidemia, while the figure is around 50–70% in Bogotá and Buenos Aires. In contrast, women generally have lower rates, ranging from 25% to 60%. This gender difference is a consistent regional pattern [2].
In Peru, approximately 30% of adults between the ages of 18 and 59 have high LDL-c, with higher values in women than in men [3].
Dyslipidemia is detected in clinical settings through lipid profiling, which quantifies total cholesterol, LDL-c, HDL-c, and triglycerides, essential parameters for identifying metabolic disorders and stratifying cardiovascular risk [4].
However, clinical evaluation is complemented by anthropometric indices of adiposity, which are valuable tools for predicting dyslipidemia, especially in young populations and adults. Among these, classic indicators such as body mass index (BMI), waist circumference (WC), and waist-to-height ratio (WHtR) are widely used to assess the risk of dyslipidemia, with WHtR and WC showing a better correlation and association with dyslipidemia compared to BMI [5,6].
However, new indicators have also been used, such as the body roundness index (BRI), which has been shown to predict lipid abnormalities slightly better than the classic indicators mentioned above [7]. Relative fat mass (RFM) also showed a better association with both dyslipidemia and metabolic syndrome (MetS) compared to BMI [8].
The prevalence of dyslipidemia is high in populations with a family history of cardiovascular disease (CVD), and these individuals have a higher frequency of other risk factors such as hypertension, diabetes, and obesity [9].
Sedentary behaviors induce metabolic dysfunction characterized by elevated blood triglyceride levels, reduced HDL-c levels, and decreased insulin sensitivity [10].
Few studies have addressed the association between sedentary habits, anthropometric indicators of adiposity, and family history with dyslipidemia in young adults in Latin American urban settings.
A 2024 study conducted in Trujillo showed that over 70% of participants were overweight or obese. Regarding lipid profiles, women had higher concentrations of TC and LDL-c, while HDL-c levels were below normal for both sexes. Regarding physical activity, the population was evenly distributed among low, moderate, and high levels. A family history of CVD was also common, especially on the maternal side, in mothers and grandmothers [11]
However, age is fundamental in preventive medicine, which is why this study sought to highlight risk patterns in a vulnerable yet understudied population: young adults. Simultaneously integrating behavioral (e.g., sedentary lifestyle), clinical (e.g., adiposity), genetic (e.g., family history), and biochemical (e.g., lipid profile) variables provides a holistic approach that allows for a better understanding of the multifactorial interactions in the development of dyslipidemias.
The overall objective was to identify the association between sedentary lifestyle, anthropometric indicators of adiposity, and family history with different dyslipidemias in young adults in Trujillo in 2025.
2. Materials and Methods
2.1. Type of Research
This study was a cross-sectional analysis.
2.2. Population, Sample and Sampling
The accessible population consisted of adult patients of the Victor Lazarte Echegaray Hospital who attended outpatient consultations in March 2025. The inclusion criteria were adults aged 18 to 44 years. While the World Health Organization generally considers people aged 15–24 to be young and various biomedical authors extend the young adult category to ages 29 or 35 [12], for this study, participants aged 18–44 were defined as young adults. This decision aimed to cover a population in early adulthood [13], recognizing that the classification may vary depending on the context and references used [14,15].
Participants with diabetes mellitus (DM), polycystic ovary syndrome, cancer, hypothyroidism, chronic kidney disease (CKD), pregnant women, postpartum women, and those taking medications such as isotretinoin, thiazide diuretics, atypical antipsychotics, oral estrogens, protease inhibitors, and corticosteroids were excluded from the study.
Non-probability convenience sampling was used to select participants who met the established criteria and were available during the study period.
Of the 143 users initially evaluated, six were excluded (five due to comorbidities and one due to a hysterectomy). This resulted in a final sample of 137 participants, as shown in Figure 1.
The sample size was considered adequate for the proposed statistical analysis, specifically a multivariate logistic regression, which included eight predictor variables, including gender, five indicators of adiposity, sedentary lifestyle, and family history of CVD. According to the methodological recommendation of having at least 15 cases per variable, a minimum of 120 participants were required, so the sample obtained meets the criteria of sufficiency to guarantee the stability of the model.
2.3. Assessment of Adiposity Indicators
2.3.1. Body Mass Index (BMI)
The participant’s weight was measured using digital scales (Personal Scale, model QF – 2003-B, China) and height was measured using a stadiometer (“Seca”, model 213, Hamburg, Germany) [16].
BMI was calculated by dividing weight in kilograms by height in meters squared. A BMI of less than 18.5 kg/m2 is considered thin, between 18.5 a 24.9 is normal, between 25 a 29.9 kg/m2 is considered overweight, and a BMI greater than 30 kg/m2 is considered obese [17].
Waist Circumference (WC)
Measured using a fiberglass tape measure (“Cescorf”, SKU 310, Brazil), at the midpoint between the participant’s last rib and iliac crest. The normal value for men is less than 94 cm and for women less than 80 cm [16].
Relative Fat Mass (RFM)
This is the ratio between height and waist circumference, calculated using the following formula according to sex [18]:
Height and waist circumference were expressed in meters. The normal value for men is less than 22.8%, and for women less than 33.9%.
Body Roundness Index (BRI)
This indicator was calculated using the following formula:
The BRI has cut-off points that depend on gender; 3.47 and 3.58 for adult men and women, respectively, with higher values indicating cardiovascular risk [19]
Conicity Index (CI)
Involves weight, height, and WC to indicate accumulated abdominal fat and was calculated using the following formula [20]:
Values range from 1, referring to a cylindrical shape, to 1.73, referring to a double cone shape. Normal values range from 1 to 1.2, and obesity ranges from 1.21 to 1.73.
All data on adiposity indicators were recorded in Instrument S1 called the indicator record in the data collection form (Supplementary Materials).
Lipid Profile Assessment
TC, LDL-c, HDL-c, and TG were measured using a cholesterol meter (Mission, model CCM-111, San Diego, United States) with a coefficient of variation of less than 4%. Participants fasted for 10 hours and rested for 10 minutes prior to sample collection. The index or ring finger was cleaned with 70% alcohol and lightly massaged to improve blood circulation. A puncture was made with a retractable lancet device (Accu-Chek, model Safe-T-Pro Plus, Mannheim, Germany). The first drop of blood was cleaned with sterile cotton. A 35 µL sample of the second drop was collected using a capillary tube. The sample was placed on the pre-attached test strip on the cholesterol meter. After a couple of minutes, the result appeared on the screen. The data were recorded in the S1 instrument called the indicator record in the data collection form (Supplementary Materials).
Assessment of Family History
A questionnaire was used to identify whether the participant had any immediate family members (father, mother, grandfather, and/or grandmother) with dyslipidemia or other cardiovascular diseases. The data were recorded in Instrument S2 of the Data Collection Form (Supplementary Materials)
Physical Activity Assessment
The short version of the International Physical Activity Questionnaire (IPAQ) was used to measure sedentary behavior. The seven-question survey asked about the time participants spent performing activities of moderate or vigorous intensity. Questions 1 and 2 referred to intense physical activity; questions 3 and 4, to moderate physical activity; questions 5 and 6, to walking; and question 7, to time spent sitting. The metabolic equivalent of task (MET) was determined based on the time and intensity of the activity; less than 480 METs was considered sedentary behavior [21]. The data were recorded in Instrument S3 of the Data Collection Form (Supplementary Materials)
Statistical Analysis
The data obtained for each variable were analyzed using SPSS Statistics version 26. Descriptive statistics were used to determine the frequency and percentage of each variable’s levels, as well as the mean and standard deviation of each evaluated anthropometric and biochemical parameter. Inferential statistics were applied using the Mann-Whitney U test to compare the means of quantitative baseline characteristic data between men and women, the chi-square contingency test in bivariate and multivariate analyses, and binary logistic regression using the Wald forward method to establish the association between sedentary lifestyle, adiposity indicators, and family history with the presence of dyslipidemia. A 95% confidence interval and a significance level of 0.05 were used for the inferences.
Ethical Considerations
This research was approved by the Ethics Committee of the Professional School of Nutrition with Report PI-CEI-NUT-EST.2024-0056. Its development took into account the ethical principles of human integrity, autonomy, and equity established in the Code of Ethics of Cesar Vallejo University and the Declaration of Helsinki [22].
Each participant was informed about the objectives and procedures of the study, the protection of their data was guaranteed, and no financial benefit was offered for their participation. In addition, they were able to withdraw from the project at any time without penalty.
3. Results
3.1. Baseline Characteristics
Table 1 shows the average baseline characteristics of young adults in Trujillo. The average BMI falls within the overweight range for both men and women, though waist circumference remains within normal values for men. Similarly, the average RFM value exceeds normal levels for both men and women, at 22.8% and 33.9%, respectively. The average CI value is higher in men than in women, but both slightly exceed the value of 1.2, indicating obesity. The average BRI value exceeds the cutoff points of 3.47 and 3.58 for men and women, respectively, indicating cardiovascular risk. Regarding the lipid profile, total cholesterol and triglyceride levels are within normal ranges (under 200 and 150 mg/dL, respectively). However, the average LDL-c concentration slightly exceeds the normal value of 100 mg/dL. Additionally, the HDL-c concentration is below the normal values of 40 and 50 mg/dL for men and women, respectively. Men had a higher average physical activity level (1205.36 ± 1138.25 METs) than women (845.36 ± 986.19 METs). Regarding sedentary behavior, the average number of hours spent sitting was 5.37 ± 2.82 and 5.45 ± 2.75 for men and women, respectively, with no significant difference between the two groups (p > 0.05). Additionally, the percentage of individuals leading a sedentary lifestyle is higher in women than in men, though the difference is not significant (p>0.05).
3.2. Relationship Between Adiposity, Sedentary Lifestyle, and Family History with Cholesterol Changes
As shown in Table 2, a higher proportion of women than men have cholesterol levels above 200 mg/dL. This is due to the greater number of women who participated in the study. However, 26% of women (25 out of 96) and around 22% of men (9 out of 41) have these levels, so the proportion of hypercholesterolemic cases in both groups does not differ significantly. Among those with BRI, WC, and RFM at cardiovascular risk, a high percentage have cholesterol levels above 200 mg/dL compared to those with cholesterol levels below 200 mg/dL. A high percentage of people with a family history of dyslipidemia or CVD also have cholesterol levels above 200 mg/dL. However, no relationship was found between adiposity indicators, family history, and total cholesterol levels. Additionally, no relationship was found between a sedentary lifestyle and cholesterol levels.
3.3. Relationship Between Adiposity, Sedentary Lifestyle and Family History with Changes in LDL-c Levels
Table 3 shows that in the bivariate analysis, both WC, BRI, and RFM were associated with LDL (p < 0.05). In the multivariate analysis, referring to binary logistic regression using the forward Wald method, it can be observed that RFM is the indicator of adiposity that predicts the presence of dyslipidemia due to elevated LDL-c, in which a person with RFM values above the established limit (22.8% for men and 33.9% for women) according to the OR value, has approximately 4 times the probability of having elevated LDL-c, compared to those with RFM values within the normal limit.
3.4. Relationship Between Adiposity, Sedentary Lifestyle and Family History with Changes in HDL-c Levels
Table 4 shows that a high percentage of women have low HDL-c levels compared to men, but this is due to women’s greater participation in the study. Within the female group, 61.5% (59 out of 96) have low HDL-c levels. Among men, the percentage is around 70.7% (29 out of 41). These percentages do not differ significantly between the two groups (p > 0.05). The percentage of young adults diagnosed with BMI, WC, RFM, BRI, and CI at cardiovascular risk is similar in those with normal and low HDL-c levels. No relationship was found between adiposity indicators and HDL-c levels. Similarly, there is no relationship between HDL-c levels and either a sedentary lifestyle or family history (p>0.05).
3.5. Relationship of Adiposity, Sedentary Lifestyle, and Family History with Variations in Triglyceride Levels
Table 5 shows the bivariate and multivariate analysis for the different anthropometric indicators compared to dyslipidemia due to hypertriglyceridemia. The bivariate statistical analysis shows a significant inverse relationship with thin and normal BMI, and a significant relationship with obesity BMI, WC, BRI, and sedentary lifestyle with triglycerides.
Binary logistic regression analysis using the forward Wald method shows that WC is an indicator of adiposity that predicts the presence of dyslipidemia due to elevated triglycerides. According to the odds ratio (OR) value, a person with an elevated WC is six times more likely to have elevated triglycerides than someone with a normal WC.
4. Discussion
Sedentary lifestyles, indicators of adiposity, and family history associated with dyslipidemia represent a persistent public health problem in the country. The results of this study show that a large part of the population evaluated has parameters linked to cardiovascular risk. The lipid profile observed in young adults in the city of Trujillo shows similarities in TC, LDL-c, and triglyceride levels to those reported in young adults belonging to ethnic groups in the Xinjiang region of China, according to Liu et al. [23]. However, there was a significant difference in average HDL-c values, which in the Xinjiang population are above the ranges considered normal in both men and women.
On the other hand, it has been shown that regular aerobic and combined exercise, equivalent to 800 METs per week, has positive effects on dyslipidemia in people with type 2 diabetes mellitus [24]. In the present study, the average METs exceeded this threshold, which could explain why most lipid parameters remained within normal ranges, with the exception of HDL. This finding reinforces the importance of physical activity as a preventive and therapeutic strategy against metabolic disorders.
Finally, consideration should be given to the role of biochemical mediators such as adiponectin and orexin A, whose production increases with structured physical activity. Adiponectin promotes fatty acid oxidation in the liver [25], while orexin A regulates food intake and thermogenesis [26]. Both mechanisms contribute to improving the lipid profile and partly explain the benefits observed in young populations who engage in physical activity for longer periods of time.
An additional factor to consider is age. In the study by Bustamante et al.[11], conducted on participants from the city of Trujillo with an average age of 47 years, higher average values of TC, LDL-c, and TG were observed, exceeding normal ranges, along with lower concentrations of HDL in both sexes, maintaining the same differential trends between men and women. In contrast, in younger populations, such as the young English adults evaluated in the study by Amirabdollahian et al. [27] (average age 21.19 ± 0.10 years), the average concentrations of TC, LDL-c, and TG were 158.70 ± 1.49; 104.83 ± 16.56; and 59.30 ± 5.59 mg/dL, respectively, reflecting a more favorable lipid profile. Similarly, research conducted in Mexico has reported that young people between the ages of 18 and 24 generally have a better lipid profile [28].
However, variations in lipid profiles observed in young adults from different regions do not appear to be determined solely by age. In the study by Nkwana et al.[29], conducted in young South African adults aged 21 to 30 years, men reported lower average TC, LDL-c, and TG values, along with HDL-c concentrations above 45 mg/dL. In contrast, women had a higher average LDL-c concentration (105.6 mg/dL) and lower HDL-c levels (42.1 mg/dL) compared to those observed in Trujillo. These differences appear to be related to characteristics specific to each region. In this regard, Grigner et al.[30], noted that low HDL-c levels are extremely common in sub-Saharan African populations, including South Africa, and that this condition has often been interpreted as an indicator of increased cardiovascular risk. Thus, in these populations, the prevalence of HDL-c below 50 mg/dL slightly exceeds 70%, suggesting the possible influence of genetic factors in determining the lipid profile.
Table 2 shows the bivariate analysis, in which anthropometric indicators, sedentary lifestyle, and family history were not associated with high cholesterol levels.
These findings differ from those reported in other studies, where BMI and WC showed a correlation with total cholesterol in both sexes [31,32,33], as did the BRI [33]. However, another study found that both the BRI and the conicity index were associated only with TC in women [29]. In the present study, a slightly higher proportion of participants with a family history of CVD was observed in the group with TC > 200 mg/dL, compared to those with values ≤ 200 mg/dL. However, the association between TC and family history did not reach statistical significance (p = 0.067). This finding is inconsistent with that reported by Bustamante et al.[11], who, in a sample of 267 participants with a higher average age, demonstrated a significant association between a history of CVD in the grandfather and the Castelli index (TC/HDL-c). The discrepancy between the two studies can be attributed to several factors. First, the sample size in our study may have limited the statistical power to detect real differences. Second, the cross-sectional design used prevents the establishment of causal relationships and restricts the ability to observe the evolution of the lipid profile in individuals with a family history of CVD. The absence of a significant association between family history and dyslipidemia due to elevated TC could be explained by the average age of the young adult participants, given that the clinical expression of hereditary risk tends to manifest more clearly at older ages, as is the case with older adults.
Table 3 shows that LDL-c is associated with WC, RFM, and BRI, but not with BMI, CI, physical inactivity, or family history. This finding differs from that reported in other studies, where WC, BRI, and CI did show a correlation with LDL-c, while BMI did not [33]. Similarly, in a study conducted in Turkey in adults with MetS between the ages of 32 and 43, it was found that LDL-c is not related to BMI or WC, although it is related to BRI [34]
Evidence also shows that WC can be significantly related to LDL-c, although with a lower correlation than that of fat mass percentage [15]. Likewise, Kobo et al. [8] demonstrated that RFM has a stronger association with LDL-c and a higher odds ratio than BMI, reinforcing the idea that body composition is a better predictor than traditional anthropometric measurements. The present study considered RFM due to the ease and time required for its determination compared to fat mass percentage.
Currently, dual-energy X-ray absorptiometry (DXA) is the gold standard method for estimating total fat mass, differentiating between subcutaneous and visceral adipose tissue. However, due to its complexity and cost, more accessible alternatives have been proposed, such as RFM, which has been shown to correlate better with DXA than BMI. Comparative studies have concluded that RFM more accurately predicts the prevalence of diseases such as type 2 diabetes mellitus (T2DM), hypertension, and coronary heart disease compared to WC, making it a useful tool in settings where DXA is not available [35].
The relationship between RFM and LDL-c can be explained by the metabolic role of adipose tissue. This tissue stores more than 50% of TC, and when body fat reaches levels close to 60%, an increase in LDL-c in the blood is observed, accompanied by a decrease in HDL-c. In addition, adipocytes express transporters such as ABCA1, which facilitate the efflux of cholesterol to HDL-c particles. In obesity, increased activity of cholesterol ester transfer protein (CETP) promotes the transfer of cholesterol esters from HDL-c to LDL-c, increasing the latter and reducing circulating HDL [36].
In the present study, conducted in young adults, RFM showed a better association with LDL-c than WC and other indicators derived from it, such as BRI and CI. This finding highlights the importance of considering more specific measures of body composition, such as RFM, in the early assessment of cardiovascular risk.
Table 4 shows the bivariate analysis of anthropometric indicators, sedentary lifestyle, and family history associated with HDL-c, finding no significant relationship with any of the indicators; this differs from other studies in which HDL-c has been found to correlate negatively with the anthropometric indicators evaluated, such as CI, BMI, BRI [14,33] and WC [14]. This demonstrates the variability of the results obtained from anthropometric adiposity indicators when related to HDL-c concentration. The inconsistency in the correlation between HDL-c and anthropometric indicators in different studies can be attributed to variations in population characteristics, measurement techniques, study design, and health status, aspects that are discussed in the study limitations.
In Table 5, the bivariate analysis shows a significant relationship between BMI obesity, WC, BRI, and sedentary lifestyle with TG. Recent research in people with MetS indicates that there is a relationship between TG levels, WC, and BMI, with these values being higher [34]. A local study indicates that normal BMI is a protective factor against the diagnosis of elevated TG compared to obesity, and that a sedentary lifestyle represents a risk for elevated TG [11].
Sedentary lifestyles involve the suppression of lipoprotein lipase (LPL) activity in skeletal muscle, which is associated with higher TG levels [37].
In multivariate analysis, WC was the indicator most strongly associated with dyslipidemia due to hypertriglyceridemia. This finding is consistent with studies in young Canadians, where WC showed a higher OR value than BMI [38]. Similarly, Zhou et al. [14], reported that WC was more closely linked to triglycerides than other indicators such as BMI, BRI, and CI, although with an OR = 2.53, approximately 2.4 times lower than that observed in Trujillo. It should be noted that in that study, WC was also associated with reduced HDL-c, an aspect not evidenced in the present study.
However, in another study conducted by Lara et al.[39] in young Chilean adults, they found a relationship between hypertriglyceridemia and WC and BMI, both anthropometric indicators had similar OR in predicting the risk of dyslipidemia due to high TG.
Abdominal obesity is the accumulation of ectopic fat in the abdominal region, which occurs both viscerally and subcutaneously [40]. Visceral fat is a highly active tissue from a metabolic point of view, as it is more susceptible to lipolysis than subcutaneous adipose tissue and more resistant to insulin [41].
The free fatty acids produced by this lipolysis are taken up by liver tissue to be used in the synthesis of new triglycerides, which are exported to the bloodstream in the form of Very low density lipoprotein (VLDL) [40,41].
The main limitation of this research was the sample size and the cross-sectional nature of the study. Although the number of cases was sufficient for logistic regression analysis (≥15 cases per variable) [42], the sample size remains relatively small for detecting subtle effects or performing stratified analyses by subgroups. For the reasons explained above, the association of family history with total cholesterol and WC with LDL-c cannot be ruled out, as it can be established in a larger sample and in a longitudinal study that allows its inclusion in predictive models for total cholesterol and LDL-c.
A methodological limitation of this study was the use of a portable cholesterol meter with capillary samples obtained from the finger. This procedure was chosen for its practicality, low cost, and rapid results in the field, which facilitated the participation of young adults and allowed for the evaluation of lipid profiles without the need for laboratory infrastructure. However, capillary blood has limitations compared to venous blood, as it can be influenced by the puncture technique, the reduced sample volume, and the pressure exerted on the finger, factors that can introduce variability in the results.
In terms of accuracy, validation studies have shown that portable cholesterol meters offer acceptable agreement with reference methods, especially for screening and population monitoring purposes, although they do not achieve the accuracy of serum analyses performed in laboratories. Equipment standardization is ensured through internal calibration and certified test strips, which guarantee reproducibility within the ranges established by the manufacturer. However, it is necessary to recognize that interindividual variability and sampling conditions can affect the absolute accuracy of the values.
A strength of this research is that it addresses dyslipidemia in young adults, a population group that has been little explored but is key to early cardiovascular prevention and in which the main risk factors for the presence of dyslipidemia was WC in the case of hypertriglyceridemia and RFM for elevated LDL-c, are extremely relevant and easy to determine. They should be considered in all consultations for the timely prevention of dyslipidemia by health professionals and to strengthen epidemiological surveillance of these problems, which are closely related to cardiovascular risk.
5. Conclusions
Adiposity indicators such as RFM and WC are risk factors for dyslipidemia, elevated LDL-c, and hypertriglyceridemia, respectively. Therefore, both are relevant adiposity parameters to consider in the prevention of cardiovascular disease.
Supplementary Materials
The following supporting information can be downloaded at: Preprints.org.
Author Contributions
Conceptualization, D.A.G.D.; methodology, D.A.G.D. and J.L.D.-O.; software, J.L.D.-O.; validation, D.A.G.D. and J.L.D.-O.; formal analysis, J.L.D.-O.; investigation, D.A.G.D.; resources, D.A.G.D. and J.L.D.-O.; data curation, J.L.D.-O.; writing—original draft preparation, D.A.G.D. and J.L.D.-O.; writing—review and editing, D.A.G.D. and J.L.D.-O.; visualization, D.A.G.D. and J.L.D.-O.; supervision, D.A.G.D. and J.L.D.-O.; project administration, D.A.G.D. and J.L.D.-O.; funding acquisition, J.L.D.-O. All authors have read and agreed to the published version of the manuscript.
Funding
This research was funded by the Vice-Rectorate for Research of the Universidad César Vallejo through University Council Resolution No. 0332-2023/UCV.
Institutional Review Board Statement
The study adhered to the tenets of the Declaration of Helsinki and was approved by the Ethics Committee of the School of Nutrition of the Universidad César Vallejo on 11 November 2023, as described in report PI-CEI-NUT-EST.2024-0056.
Informed Consent Statement
Informed consent was obtained from all subjects involved in the study. Written informed consent has been obtained from the patient(s) to publish this paper.
Data Availability Statement
The original contributions presented in this study are included in the article. Further inquiries can be directed to the corresponding author.
Acknowledgments
Special thanks to the Research Department and the Center for Formative Research and Scientific Integrity of the Vice-Rectorate for Research at Cesar Vallejo University for their support in financing this publication. We would also like to thank the laboratory department at Victor Lazarte Echegaray Hospital in Trujillo, Peru.
Conflicts of Interest
The authors declare no conflicts of interest.
Abbreviations
The following abbreviations are used in this manuscript:
| ABCA1 | ATP Binding Cassette A1 |
| BMI | Body mass index |
| BRI | Body roundness index |
| CI | Conicity index |
| CVD | Cardiovascular disease |
| DM | Diabetes mellitus |
| DXA | X-ray absorptiometry |
| HDL-c | High-density lipoprotein cholesterol |
| LDL-c | Low-density lipoprotein cholesterol |
| MET | metabolic equivalent of task |
| MetS | Metabolic syndrome |
| RFM | Relative fat mass |
| TC | Total cholesterol |
| TG | Triglycerides |
| WC | Waist circumference |
| WHtR | Waist-to-height ratio |
References
- Jerez, C.; Irribarren, J.; Diaz, F.; Kusanovic, J.; Araya, B. Mecanismos fisiopatológicos de la dislipidemia. NOVA 2023, 21, 11–29. Available online: https://hemeroteca.unad.edu.co/index.php/nova/article/view/6882/6081 (accessed on 6 October 2024). [CrossRef]
- Carrero, C.; Navarro, E.; Lastre, G.; Oróstegui, M.; González, G.; Sucerquia, A.; Sierra, L. Dislipidemia como factor de riesgo cardiovascular: uso de probióticos en la terapéutica nutricional. AVFT 2020, 39, 127–139. Available online: https://www.revistaavft.com/images/revistas/2020/avft_1_2020/22_dislipidemia.pdf (accessed on 6 October 2024).
- Ministerio de Salud (MINSA). Vigilancia de la situación del sobrepeso, obesidad y sus determinantes en el marco del observatorio de nutrición y estudio del sobrepeso y obesidad . In Informe Técnico 2023; Instituto Nacional de Salud/Centro Nacional de Alimentación, Nutrición y Vida Saludable: Lima, Peru, 2013; pp. 211–13. [Google Scholar]
- Basurto, M.L.; Abdo-Francis, M.; Aguilar-Salinas, C.A.; Balcázar-Hernández, L.; Borrayo-Sánchez, G.; Castro-Narro, G.E.; Chávez-Negrete, A.; Díaz-Aragón, A.; Enciso-Muñoz, J.M.; Fernández-Barros, C.; et al. Dislipidemia: recomendaciones para el diagnóstico y tratamiento en el primer nivel de contacto médico. Gac. Med. Mex. 2024, 160, 370–378. [Google Scholar] [CrossRef]
- Muñoz, R.E. Asociación entre indicadores antropométricos y dislipidemia en adolescentes y adultos jóvenes de la ciudad de Caracas. ALAN 2021, 71, 85–93. Available online: https://www.alanrevista.org/ediciones/2021/2/art-1/ (accessed on 8 October 2024).
- Dong, J.; Ni, Y.Q.; Chu, X.; Liu, Y.Q.; Liu, G.X.; Zhao, J.; Yang, Y.B.; Yan, Y.X. Association between the abdominal obesity anthropometric indicators and metabolic disorders in a Chinese population. Public Health 2016, 131, 3–10. [Google Scholar] [CrossRef]
- Zaid, M.; Ameer, F.; Munir, R.; Rashid, R.; Farooq, N.; Hasnain, S.; Zaidi, N. Anthropometric and metabolic indices in assessment of type and severity of dyslipidemia. J. Physiol. Anthropol. 2017, 36, 19. [Google Scholar] [CrossRef] [PubMed]
- Kobo, O.; Leiba, R.; Avizohar, O.; Karban, A. Relative fat mass is a better predictor of dyslipidemia and metabolic syndrome than body mass index. Cardiovasc. Endocrinol. Metab. 2019, 8, 77–81. [Google Scholar] [CrossRef]
- Kutkienė, S.; Petrulionienė, Ž.; Laucevičius, A.; Petrylaitė, M.; Maskeliūnaitė, D.; Puronaitė, R.; Kovaitė, M.; Kalibaitaitė, I.; Rinkūnienė, E.; Dženkevičiūtė, V.; et al. Severe dyslipidemia and concomitant risk factors in the middle-aged Lithuanian adults: a cross-sectional cohort study. Lipids Health Dis. 2018, 17, 88. [Google Scholar] [CrossRef]
- Park, J.H.; Moon, J.H.; Kim, H.J.; Kong, M.H.; Oh, Y.H. Sedentary lifestyle: overview of updated evidence of potential health risks. Korean J. Fam. Med. 2020, 41, 365–373. [Google Scholar] [CrossRef]
- Bustamante, J.; Neglia, C.; Díaz, J.; Yupari, I. Modelos predictivos del riesgo aterogénico en ciudadanos de Trujillo (Perú) basados en factores asociados. Nutrients 2024, 16, 4138. Available online: https://www.mdpi.com/2072-6643/16/23/4138 (accessed on 8 October 2024).
- Rod, N.H.; Davies, M.; de Vries, T.R.; Kreshpaj, B.; Drews, H.; Nguyen, T.L.; Elsenburg, L.K. Young adulthood: a transitional period with lifelong implications for health and wellbeing. BMC Glob. Public Health 2025, 3, 1. [Google Scholar] [CrossRef]
- Sandoval, S. Psicología del Desarrollo Humano II, 2nd ed.; Universidad Autónoma de Sinaloa: Sinaloa, México, 2018; pp. 19–202. [Google Scholar]
- Zhou, X.; Zou, Z.; Liu, Y.; Yan, Y.; Wu, J.; Zhou, G.; et al. Association of anthropometric and obesity indices with abnormal blood lipid levels in young and middle-aged adults. Heliyon 2025, 11, e41310. [Google Scholar] [CrossRef]
- Hernández-Reyes, A.; Vidal, Á.; Moreno-Ortega, A.; Cámara-Martos, F.; Moreno-Rojas, R. Waist Circumference as a Preventive Tool of Atherogenic Dyslipidemia and Obesity-Associated Cardiovascular Risk in Young Adults Males: A Cross-Sectional Pilot Study. Diagnostics 2020, 10, 1033. [Google Scholar] [CrossRef]
- Ministerio de Salud (MINSA). Guía Técnica para la valoración nutricional antropométrica de la persona adulta . Ministerio de Salud, Instituto Nacional de Salud; Lima, Peru, 2013; pp. 13–16. Available online: https://cdn.www.gob.pe/uploads/document/file/382688/Gu%C3%ADa_t%C3%A9cnica_para_la_valoraci%C3%B3n_nutricional_antropom%C3%A9trica_de_la_persona_adulta20191011-25586-13mvsvf.pdf?v=1605196582.
- Vinueza, A.; Tapia, E.; Tapia, G.; Nicolade, T.; Carpio, T. Estado nutricional de los adultos ecuatorianos y su distribución según sus características sociodemográficas. Estudio transversal. Nutr. Hosp. 2023, 40, 102–108. Available online: https://scielo.isciii.es/scielo.php?script=sci_arttext&pid=S0212-16112023000100014 (accessed on 18 October 2024).
- Woolcott, O.; Bergman, R. Relative fat mass (RFM) as a new estimator of whole-body fat percentage: a cross-sectional study in American adult individuals. Sci. Rep. 2018, 8, p. 10980. Available online: https://www.nature.com/articles/s41598-018-29362-1 (accessed on 18 October 2024).
- Vallejo, S.; Sánchez, J.; Paz, W.; Guamán, W.; Montaluisa, F.; Correa, F.; Vásquez, M. Índice de redondez corporal como indicador antropométrico para identificar riesgo de síndrome metabólico en médicos del hospital San Francisco del IESS, en la ciudad de Quito. Rev. Fac. Cien. Med. (Quito) 2018, 43, 116–224. Available online: https://docs.bvsalud.org/biblioref/2022/03/1361297/doi-131.PDF (accessed on 22 October 2024). [CrossRef]
- Raya, E.; Molina, G.; Romero, M.; Álvarez, C.; Hernández, A.; Molina, R. Comparación de índices antropométricos, clásicos y nuevos, para el cribado de síndrome metabólico en población adulta laboral. Rev. Esp. Salud Pública 2020, 94, 1–13. Available online: https://pmc.ncbi.nlm.nih.gov/articles/PMC11582906/pdf/1135-5727-resp-94-e202006042.pdf (accessed on 22 October 2024).
- Carrera, Y. Cuestionario Internacional de actividad física (IPAQ). Rev. Enfermería Trab. 2017, 7, 49–54. Available online: https://dialnet.unirioja.es/servlet/articulo?codigo=5920688 (accessed on 22 October 2024).
- Asociación Médica Mundial. Declaración de Helsinki de la AMM—Principios éticos para las investigaciones médicas en seres humanos. Adoptada por la 18ª Asamblea Médica Mundial, Helsinki, Finlandia, junio 1964. Available online: https://www.wma.net/es/policies-post/declaracion-de-helsinki-de-la-amm-principios-eticos-para-las-investigaciones-medicas-en-seres-humanos/ (accessed on 22 October 2024).
- Liu, L.Y.; Aimaiti, X.; Zheng, Y.Y.; Zhi, X.Y.; Wang, Z.L.; Yin, X.; et al. Epidemic trends of dyslipidemia in young adults: a real-world study including more than 20,000 samples. Lipids Health Dis. 2023, 22, 1–10. [Google Scholar] [CrossRef]
- Rodríguez, M. Impacto del ejercicio físico en la dislipidemia diabética. Rev. Soc. Argent. Diabetes 2019, 52, 86–93. Available online: https://revistasad.com/index.php/diabetes/article/view/122/106 (accessed on 29 April 2025). [CrossRef]
- Imierska, M.; Kurianiuk, A.; Błachnio-Zabielska, A. The influence of physical activity on the bioactive lipids metabolism in obesity-induced muscle insulin resistance. Biomolecules 2020, 10, 1665. [Google Scholar] [CrossRef]
- Polito, R.; Monda, V.; Nigro, E.; Messina, A.; Di Maio, G.; Giuliano, M.T.; Orrù, S.; Imperlini, E.; Calcagno, G.; Mosca, L. The important role of adiponectin and orexin-A, two key proteins improving healthy status: focus on physical activity. Front. Physiol. 2020, 11, 356. [Google Scholar] [CrossRef] [PubMed]
- Amirabdollahian, F.; Haghighatdoost, F. Anthropometric indicators of adiposity related to body weight and body shape as cardiometabolic risk predictors in British young adults: superiority of waist-to-height ratio. J. Obes. 2018, 2018, 8370304. [Google Scholar] [CrossRef]
- Mederos-Torres, C.V.; Díaz-Burke, Y.; Muñoz-Almaguer, M.L.; García-Zapién, A.G.; Uvalle-Navarro, R.L.; González-Sandoval, C.E. Triglyceride/high-density cholesterol ratio as a predictor of cardiometabolic risk in young population. J. Med. Life 2024, 17, 722–727. [Google Scholar] [CrossRef] [PubMed]
- Nkwana, M.R.; Monyeki, K.D.; Lebelo, S.L. Body roundness index, a body shape index, conicity index, and their association with nutritional status and cardiovascular risk factors in South African rural young adults. Int. J. Environ. Res. Public Health 2021, 18, 281. [Google Scholar] [CrossRef]
- Greiner, R.; Nyrienda, M.; Rodgers, L.; Asiki, G.; Banda, L.; Shields, B.; Hattersley, A.; Crampin, A.; Newton, R.; Jones, A. Associations between low HDL, sex and cardiovascular risk markers are substantially different in sub-Saharan Africa and the UK: analysis of four population studies. BMJ Glob. Health 2021, 6, e005222. [Google Scholar] [CrossRef]
- Eslami, O.; Shahraki, M.; Shahraki, T. Obesity indices in relation to lipid abnormalities among medical university students in Zahedan, South-East of Iran. Int. J. Prev. Med. 2019, 10, 15. [Google Scholar] [CrossRef]
- Samamalee, K.; Champa, J.; Rasika, P. Screening of serum cholesterol level amongst Sri Lankan women in relation to waist-height ratio (WHtR), waist circumference (WC), body mass index (BMI), waist-hip ratio (WHR), and waist-thigh ratio (WTR): a cross-sectional study. Int. J. Adv. Multidisc. Res. Stud. 2024, 4, 304–308. Available online: https://www.multiresearchjournal.com/admin/uploads/archives/archive-1726844928.pdf (accessed on 29 April 2025). [CrossRef]
- Rai, S.; Rai, T.; Rai, B.; Pakkala, P.; Mathur, N.; Sujith, N.; Orru, G. A formal analysis of anthropometric parameters for effective forecasting of dyslipidemia in healthy young adults. J. Pharm. Res. Int. 2021, 33, 308–319. Available online: https://journaljpri.com/index.php/JPRI/article/view/3435 (accessed on 30 April 2025). [CrossRef]
- Bilgin, D.; Bas, M.; Cakir, N.; Hajhamidiasl, L. Predicción del síndrome metabólico mediante el índice de adiposidad visceral, el índice de redondez corporal, el índice de adiposidad disfuncional, el índice de producto de acumulación lipídica y el índice de forma corporal en adultos. Nutr. Hosp. 2022, 39. Available online: https://scielo.isciii.es/scielo.php?script=sci_arttext&pid=S0212-16112022000600012 (accessed on 30 April 2025).
- Lebech, S.; Rasmussen, N.; Vestergaard, P.; Hejlesen, O. Is predicted body-composition and relative fat mass an alternative to body-mass index and waist circumference for disease risk estimation? Clin. Nutr. 2022, 16, 9. [Google Scholar] [CrossRef]
- Edward, H.; Kirkpatrick, C.; Maki, K.; Toth, P.; Morgan, R.; Tondt, J.; Christensen, S.M.; Dixon, D.; Jacobson, T.A. Obesity, dyslipidemia, and cardiovascular disease: A joint expert review from the Obesity Medicine Association and the National Lipid Association. Obes. Pillars 2024, 10, 100108. [Google Scholar] [CrossRef]
- Zderic, T.W.; Hamilton, M.T. Physical inactivity amplifies the sensitivity of skeletal muscle to the lipid-induced downregulation of lipoprotein lipase activity. J. Appl. Physiol. 2006, 100, 249–257. [Google Scholar] [CrossRef] [PubMed]
- Brenner, D.; Tepylo, K.; Eny, K.; Cahill, L.; Sohemy, A. Comparación del índice de masa corporal y la circunferencia de la cintura como predictores de la salud cardiometabólica en una población de adultos jóvenes canadienses. Diabetol. Metab. Syndr. 2010, 2, 28. [Google Scholar] [CrossRef]
- Lara, M.; Bustos, P.; Amigo, H.; Silva, C.; Rona, R. Is waist circumference a better predictor of blood pressure, insulin resistance and blood lipids than body mass index in young Chilean adults? BMC Public Health 2012, 12, 638. [Google Scholar] [CrossRef]
- Verdú, E.; Homs, J.; Boadas-Vaello, P. Physiological changes and pathological pain associated with sedentary lifestyle-induced body systems fat accumulation and their modulation by physical exercise. Int. J. Environ. Res. Public Health 2021, 18, 13333. [Google Scholar] [CrossRef] [PubMed]
- Khawaja, T.; Nied, M.; Wilgor, A.; Neeland, I.J. Impact of visceral and hepatic fat on cardiometabolic health. Curr. Cardiol. Rep. 2024, 26, 1297–1307. [Google Scholar] [CrossRef] [PubMed]
- Sagaró, N.M.; Zamora, L. Análisis estadístico implicativo versus regresión logística binaria para el estudio de la causalidad en salud. Multimed. 2019, 23, pp. 1416–1440. Available online: https://scielo.sld.cu/scielo.php?script=sci_arttext&pid=S1028-48182019000601416 (accessed on 2 May 2025).
Figure 1.
Flowchart of inclusion and exclusion criteria for participants.
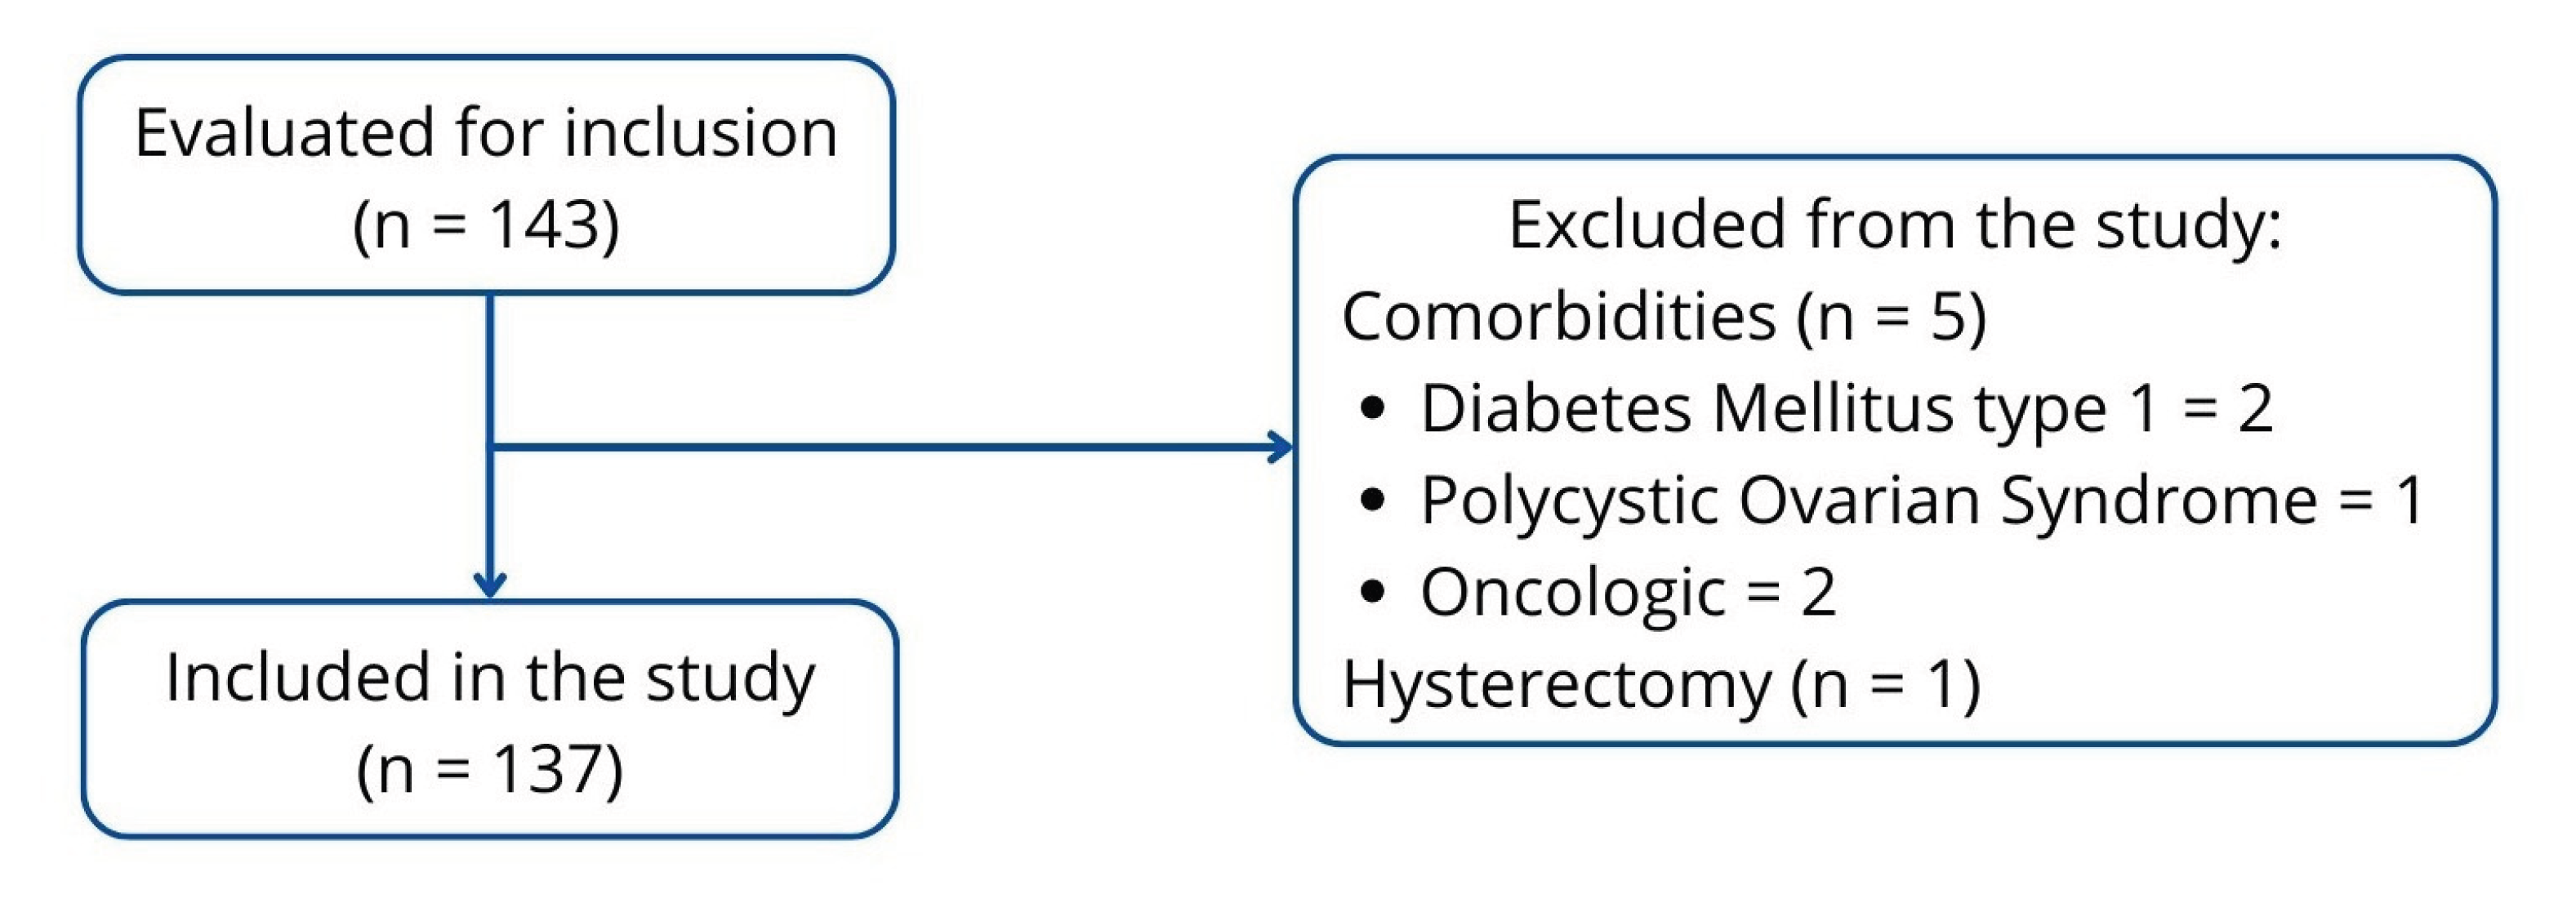

Table 1.
Baseline characteristics of young adults in the city of Trujillo, 2025.
| Baseline characteristics | Men (n = 41) |
Women (n = 96) |
Mann Whitney U-test Significance (p) |
|---|---|---|---|
| Age (years) | 34.39 ± 7.49 | 32.23 ± 6.90 | 0.088 |
| Adiposity indicators | |||
| Waist circumference (m) | 0.94 ± 0.12 | 0.87 ± 0.11 | 0.001 |
| Relative fat mass (%) | 27.31 ± 4.43 | 39.33 ± 4.72 | < 0.001 |
| Conicity index | 1.28 ± 0.06 | 1.21 ± 0.07 | < 0.001 |
| Body roundness index | 4.48 ± 1.37 | 4.55 ± 1.67 | 0.767 |
| Body mass index (kg/m2) | 27.01 ± 4.47 | 27.90 ± 5.23 | 0.637 |
| Lipid profile | |||
| Total cholesterol (mg/dL) | 166.44 ± 45.75 | 172.95 ± 39.40 | 0.215 |
| LDL cholesterol (mg/dL) | 103.39 ± 36.36 | 102.74 ± 33.60 | 0.803 |
| HDL cholesterol (mg/dL) | 38.90 ± 16.45 | 47.42 ± 15.82 | 0.005 |
| Triglycerides (mg/dL) | 122.41 ± 59.64 | 122.61 ± 69.40 | 0.659 |
| Physical activity | |||
| METs | 1205.36 ± 1138.25 | 845.35 ± 986.19 | 0.048 |
| Sedentary lifestyle | |||
| Sitting time (h) | 5.37 ± 2.82 | 5.45 ± 2.75 | 0.951 |
| Sedentary lifestyle (%) | 43.9 | 57.3 | 0.150 |
LDL: Low-density lipoprotein; HDL: High-density lipoprotein; METs: Metabolic Equivalent of Task.
Table 2.
Association of anthropometric indicators, sedentary lifestyle, and family history with total cholesterol levels.
Table 2.
Association of anthropometric indicators, sedentary lifestyle, and family history with total cholesterol levels.
| Bivariate Analysis for Total Cholesterol | |||
| Indicator | Cholesterol < 200 mg/dL f (%) | Cholesterol ≥ 200 mg/dL f (%) | Significance (p) |
| Gender | 0.612 | ||
| Female | 71 (68.9) | 25 (73.5) | |
| Male | 32 (31.1) | 9 (26.5) | |
| Body mass index (BMI) | |||
| BMI Thin | 1 (1.0) | 0 (0.0) | 0.763 |
| BMI Normal | 32 (31.1) | 8 (23.5) | 0.402 |
| BMI Overweight | 45 (43.7) | 16 (47.1) | 0.732 |
| BMI Obesity | 25 (24.3) | 10 (29.4) | 0.551 |
| Waist circumference | 0.092 | ||
| No risk | 44 (42.7) | 9 (26.5) | |
| At risk | 59 (57.3) | 25 (73.5) | |
| Relative fat mass | 0.183 | ||
| Normal | 15 (14.6) | 2 (5.9) | |
| Obesity | 88 (85.4) | 32 (94.1) | |
| Body roundness index | 0.088 | ||
| No risk | 34 (33.0) | 6 (17.6) | |
| At risk | 69 (67.0) | 28 (82.4) | |
| Conicity index | 0.389 | ||
| No risk | 45 (43.7) | 12 (35.3) | |
| At risk | 58 (56.3) | 22 (64.7) | |
| Sedentary lifestyle | 0.726 | ||
| No | 49 (47.6) | 15 (44.1) | |
| Yes | 54 (52.4) | 19 (55.9) | |
| Family History | 0.067 | ||
| No family history | 15 (14.6) | 1 (2.9) | |
| With family history | 88 (85.4) | 33 (97.1) | |
BMI = Body Mass Index. The categories of the BMI variable were transformed into dummy variables, with values of 0 (absence) and 1 (presence) for correlation with cholesterol levels.
Table 3.
Association of anthropometric indicators, sedentary lifestyle, and family history with LDL-c concentration.
Table 3.
Association of anthropometric indicators, sedentary lifestyle, and family history with LDL-c concentration.
| Bivariate analysis for LDL-c | Binary Logistic Regression Model* | |||
| Indicator | LDL-c < 100 mg/dL f (%) | LDL-c ≥ 100 mg/dL f (%) | Significance | Significance (p), odds ratio (OR), and confidence interval (CI) at 95% |
| Gender | 0.113 | |||
| Female | 42 (63.6) | 54 (76.1) | ||
| Male | 24 (36.4) | 17 (23.9) | ||
| Body mass index (BMI) | ||||
| BMI Thin | 1 (1.5) | 0 (0.0) | 0.215 | |
| BMI Normal | 24 (36.4) | 16 (22.5) | 0.075 | |
| BMI Overweight | 26 (39.4) | 35 (49.3) | 0.244 | |
| BMI Obesity | 15 (22.7) | 20 (28.2) | 0.466 | |
| Waist circumference | 0.023 | |||
| No risk | 32 (48.5) | 21 (29.6) | ||
| At risk | 34 (51.5) | 50 (70.4) | ||
| Relative fat mass | 0.013 | p: 0.019 (OR = 4.108; IC 95%: 1.266 – 13.332) | ||
| Normal | 13 (19.7) | 4 (5.6) | ||
| Obesity | 53 (80.3) | 67 (94.4) | ||
| Body roundness index | 0.031 | |||
| No risk | 25 (37.9) | 15 (21.1) | ||
| At risk | 41 (62.1) | 56 (78.9) | ||
| Conicity index | 0.378 | |||
| No risk | 30 (45.5) | 27 (38.0) | ||
| At risk | 36 (54.5) | 44 (62.0) | ||
| Sedentary lifestyle | 0.278 | |||
| No | 34 (51.5) | 30 (42.3) | ||
| Yes | 32 (48.5) | 41 (57.7) | ||
| Family History | 0.222 | |||
| No family history | 10 (15.2) | 6 (8.5) | ||
| With family history | 56 (84.8) | 65 (91.5) | ||
BMI = Body Mass Index. The categories of the BMI variable were transformed into dummy variables, with values of 0 (absence) and 1 (presence) for correlation with cholesterol levels. *Wald forward method.
Table 4.
Association of anthropometric indicators, sedentary lifestyle, and family history with HDL-c concentration.
Table 4.
Association of anthropometric indicators, sedentary lifestyle, and family history with HDL-c concentration.
| Bivariate analysis for HDL-c | |||
| Indicator | Normal HDL-c f (%) | Low HDL-c f (%) | Significance |
| Gender | 0.958 | ||
| Female | 37 (69.8) | 59 (70.2) | |
| Male | 16 (30.2) | 25 (29.8) | |
| Body mass index (BMI) | |||
| BMI Thin | 1 (1.9) | 0 (0.0) | 0.181 |
| BMI Normal | 18 (34.0) | 22 (26.2) | 0.330 |
| BMI Overweight | 25 (47.2) | 36 (42.9) | 0.621 |
| BMI Obesity | 9 (17.0) | 26 (31.0) | 0.068 |
| Waist circumference | 0.105 | ||
| No risk | 25 (47.2) | 28 (33.3) | |
| At risk | 28 (52.8) | 56 (66.7) | |
| Relative fat mass | 0.197 | ||
| Normal | 9 (17.0) | 8 (9.5) | |
| Obesity | 44 (83.0) | 76 (90.5) | |
| Body roundness index | 0.174 | ||
| No risk | 19 (35.8) | 21 (25.0) | |
| At risk | 34 (64.2) | 63 (75.0) | |
| Conicity index | 0.985 | ||
| No risk | 22 (41.5) | 35 (41.7) | |
| At risk | 31 (58.5) | 49 (58.3) | |
| Sedentary lifestyle | 0.790 | ||
| No | 24 (45.3) | 40 (47.6) | |
| Yes | 29 (54.7) | 44 (52.4) | |
| Family History | 0.232 | ||
| No family history | 4 (7.5) | 12 (14.3) | |
| With family history | 49 (92.5) | 72 (85.7) | |
BMI = Body Mass Index. The categories of the BMI variable were transformed into dummy variables, with values of 0 (absence) and 1 (presence) for correlation with cholesterol levels.
Table 5.
Association between anthropometric indicators, sedentary lifestyle, and family history with triglyceride concentration.
Table 5.
Association between anthropometric indicators, sedentary lifestyle, and family history with triglyceride concentration.
| Bivariate analysis for [Triglycerides] | Binary Logistic Regression Model* | |||
| Indicator | TG < 150 mg/dL f (%) |
TG ≥ 150 mg/dL f (%) |
Significance | Significance (p), odds ratio (OR), and confidence interval (CI) at 95% |
| Gender | 0.799 | |||
| Female | 73 (69.5) | 23 (71.9) | ||
| Male | 32 (30.5) | 9 (28.1) | ||
| Body mass index (BMI) | ||||
| BMI Thin | 1 (1.0) | 0 (0.0) | 0.019 | |
| BMI Normal | 37 (35.2) | 3 (9.4) | 0.005 | |
| BMI Overweight | 45 (42.9) | 16 (50.0) | 0.477 | |
| BMI Obesity | 22 (21.0) | 13 (40.6) | 0.025 | |
| Waist circumference | 0.001 | p: 0.001 (OR = 6.125; IC 95%: 2.007 – 18.690) | ||
| No risk | 49 (46.7) | 4 (12.5) | ||
| At risk | 56 (53.3) | 28 (87.5) | ||
| Relative fat mass | 0.069 | |||
| Normal | 16 (15.2) | 1 (3.1) | ||
| Obesity | 89 (84.8) | 31 (96.9) | ||
| Body roundness index | 0.005 | |||
| No risk | 37 (35.2) | 3 (9.4) | ||
| At risk | 68 (64.8) | 29 (90.6) | ||
| Conicity index | 0.175 | |||
| No risk | 47 (44.8) | 10 (31.3) | ||
| At risk | 58 (55.2) | 22 (68.8) | ||
| Sedentary lifestyle | 0.045 | |||
| No | 54 (51.4) | 10 (31.3) | ||
| Yes | 51 (48.6) | 22 (68.8) | ||
| Family History | 0.643 | |||
| No family history | 13 (12.4) | 3 (9.4) | ||
| With family history | 92 (87.6) | 29 (90.6) | ||
BMI = Body Mass Index. The categories of the BMI variable were transformed into dummy variables, with values of 0 (absence) and 1 (presence) for correlation with cholesterol levels. *Wald forward method.
Disclaimer/Publisher’s Note: The statements, opinions and data contained in all publications are solely those of the individual author(s) and contributor(s) and not of MDPI and/or the editor(s). MDPI and/or the editor(s) disclaim responsibility for any injury to people or property resulting from any ideas, methods, instructions or products referred to in the content. |
© 2026 by the authors. Licensee MDPI, Basel, Switzerland. This article is an open access article distributed under the terms and conditions of the Creative Commons Attribution (CC BY) license (http://creativecommons.org/licenses/by/4.0/).
Copyright: This open access article is published under a Creative Commons CC BY 4.0 license, which permit the free download, distribution, and reuse, provided that the author and preprint are cited in any reuse.


