
Submitted:
14 January 2026
Posted:
15 January 2026
You are already at the latest version
Abstract
The most severe premalignant lesion of glandular epithelium of the cervix is adenocarcinoma in situ (AIS). In most cases it is associated with persistent Human papillomavirus (HPV) infection and most often occurs in women in the fourth decade of life. In most high-income countries, primary screening has shifted to HPV testing, while cytology is used for patient triage. Even with current robust screening protocols, their sensitivity for glandular lesions remains limited. Diagnosis of AIS obtained by biopsy, brushing or curettage is confirmed by excisional methods and pathohistological verification. Therapy depends on the patient’s lifestyle and reproductive age. In our case, we present nulliparous patient with persistent ASC-US, HPV infection with alpha-7 types (without HPV 16 and 18 types), and AIS which was diagnosed after conization, follow up and two biopsies with curettage of cervical canal. Our case report highlights limitations in detection of glandular lesions and need for caution in patients with persistent and seemingly low-grade cytological abnormalities, notably in young patients with high-risk HPV types.
Keywords:
generative design
; power electronics
; cooling manifold
; thermal management
; additive manufacturing
1. Introduction
Effective thermal management has become a crucial design consideration in modern power electronics. With the continuous shift to wide-bandgap (WBG) semiconductors such as silicon carbide (SiC) and gallium nitride (GaN), higher switching efficiencies and power densities can be achieved compared to conventional silicon (Si) devices [1]. These devices are also capable of stable operation at higher temperatures, often exceeding 200 °C, making them ideal for demanding applications in harsh environments. However these performance characteristics also result in significant thermal energy being concentrated in compact packages, making heat dissipation a greater challenge [2].
Insufficient cooling can compromise reliability and longevity as a result of material degradation. Thermal stresses and differences in coefficient of thermal expansion (CTE) can lead to cracks and voids in the device packaging, as well as damaged solder joints and connection failures [3]. Therefore, innovations in advanced cooling techniques are necessary to maximize the potential of these high-power WBG devices.
Traditional cooling solutions often prove to be inadequate for these applications. One example includes heat sinks that dissipate heat using structures that maximize surface area for natural or forced convection [4]. While effective for lower-power devices, they are often bulky and cannot handle the high heat flux of WBG devices. Liquid-cooled cold plates are another example of traditional cooling solutions that offer higher performance through the use of internal channels to circulate fluid [5]. However, a significant limitation with these systems is the presence of a physical boundary between the heat source and the cooling fluid, greatly increasing thermal resistance and lowering the effectiveness of the cold plate. While these methods were proven for Si devices, the higher thermal energy from WBG devices requires more advanced cooling strategies.
Direct-contact liquid cooling is one of the advanced strategies being explored to address the aforementioned shortcomings of traditional cooling systems. In contrast to cold plates, this approach allows the fluid to directly contact the module substrate, completely eliminating any thermal interface materials (TIMs). This greatly reduces thermal resistance and yields more effective heat transfer performance. A study by McPherson et al. [6] applied this for high-performance SiC power modules, finding a 25% improvement in thermal resistance and a greater than 30% increase in total power loss capability.
Another advanced strategy is the use of double-sided cooling (DSC), which enables heat dissipation from both sides of the device. This maximizes the available surface area for heat transfer and reduces temperature gradients. Abramushkina et al. [7] developed a double-sided liquid cooling concept to produce an integrated cold plate for SiC inverters. The design featured internal microchannels that sequentially distributed fluid to the top and bottom sides of three horizontally-laid power modules. Results showed a maximum junction temperature of only 67.8 °C under an 800 W heat load. Even when increased to the worst-case scenario load of 2100 W, the maximum temperature reached only 174.4 °C, remaining within operational limits.
New design approaches are necessary to maximize the integration of these advanced cooling strategies. Computationally-driven design methods allow for the creation of geometry that can be tailored to meet defined objectives for specific performance parameters [8]. One emerging technique is Generative Design (GD). GD is an iterative, algorithm-based process where geometry is generated based on constraints and requirements set by the user. Unlike conventional design, which relies on manual modeling, GD automates the process by producing a range of options that satisfy specific goals such as minimizing pressure drop or weight [9]. This approach differs from Topology Optimization (TO), which typically removes material from an existing geometry pre-defined. GD produces geometry from scratch, with pre-defined shapes only being used as dimensional constraints and boundary conditions [10].
However, the high-performance and lightweight structures generated by GD process are often complex, organically-shaped geometries that would be difficult or impossible to produce using conventional manufacturing techniques due to limitations in tooling, molds, or CNC toolpath access. The rise of Additive Manufacturing (AM) has become an important enabler for the adoption of GD. The layer-by-layer nature of the AM process overcomes many of the constraints imposed by traditional manufacturing, allowing for much greater design freedom and enabling the fabrication of high-performance components that were previously not practical for production [11].
Traditionally, the application of AM in power electronics cooling has focused on metallic materials such as aluminum or copper. This study investigates the potential of high-performance polymers for end-use thermal management applications as a functional alternative to metals. By utilizing specialized photopolymers with Heat Deflection Temperatures (HDT) exceeding 200 °C, the study aims to demonstrate the capability of polymer-based cooling manifolds to withstand the thermal loads of SiC devices while being lightweight and corrosion-resistant.
A study by Vervecken et al. [12] demonstrates the potential of GD for thermal management through the development of a two-phase heat sink. The method combined proprietary GD software with two-phase flow simulations using a homogenous equilibrium model (HEM). This approach allowed for an iterative performance-based design process with minimal human input. The optimization objective was set to minimize the heat source temperature while also considering pressure drop and AM constraints. The final design featured organically shaped internal channels that achieved a 15% improvement in thermal performance over the baseline, without creating any negative impact on the pressure drop or manufacturing difficulty.
While these studies highlight the powerful outcomes of GD, a clear and repeatable process using more accessible tools is necessary to apply these concepts more successfully on a more widespread scale. This study presents an integrated end-to-end workflow using generative design to develop a lightweight, high-performance cooling manifold for a double-sided SiC power module. As a result of sequentially coupling fluid flow optimization with structural lightweighting, the study demonstrates a design methodology that achieves superior thermal uniformity and mass reduction compared to conventional methods.
2. Materials and Methods
The study followed a sequential, multi-stage optimization process designed to integrate fluid optimization with structural lightweighting for power electronics thermal management. The workflow began with the creation of a baseline design, which was simulated to establish performance benchmarks. A two-stage GD optimization was then performed, consisting of a fluid flow path optimization to minimize flow resistance and maximize heat transfer performance, followed by a structural optimization to minimize mass while ensuring manufacturability. The resulting geometry is then validated using Computational Fluid Dynamics (CFD) and Finite Element Analysis (FEA). Finally, a prototype of the optimized manifold was fabricated using vat photopolymerization (VPP) to demonstrate manufacturability and feasibility for end-use applications.
2.1. Target Application and Baseline Design
The primary objective of the study was to develop a cooling system for a high-power density WBG application. The target device was a DSC SiC power module developed by Arriola et al. [13] with overall dimensions of 37 mm × 20 mm × 3.5 mm. As shown in Figure 1, three of these power modules were vertically mounted on a printed circuit board (PCB), allowing for power densities of up to 100 kW/l (R3C3). To achieve this, all three power modules must be effectively cooled simultaneously.
To establish a performance benchmark, a baseline manifold was designed as shown in Figure 2. This featured as single inlet distributing fluid into four parallel channels to cool the opposing substrates of the three power modules. This baseline design defined the geometric and dimensional constraints for the design optimization process.
2.2. Fluid Flow Generative Design Process
The first stage of the design workflow utilized the Autodesk Fusion Generative Design Fluid Path workspace to generate the internal coolant domain. The optimization process began with the definition of the geometric constraints. Figure 3a shows the Fluid Preserve Geometry in green, which are the regions of the fluid volume that must remain unmodified, specifically the inlet, outlet, and the interface surfaces contacting the power module substrates. The Solid Obstacle Geometry, shown in red, was set to the manifold body to prevent the generation of fluid paths outside the allowable volume. Lastly, the Fluid Starting Shape, shown in yellow defined the geometry that can be modified by the solver.
For the boundary conditions, the inlet face, highlighted in blue, was assigned a volumetric flow rate of 3 L/min while the outlet face, highlighted in purple, was assigned a gauge pressure of 0 Pa. To ensure that the solver considers fluid flow uniformity across the three modules, the interface surfaces at each substrate were assigned to have target pressures of 1000 Pa, which was derived from the simulation results of the baseline manifold design, where the surface integral of the static pressure at the module interfaces was obtained to be around 1 kPa.
The solver output and post-processing evolution of the fluid volume can be seen in Figure 4. It can be seen in Figure 4a that the initial output generated an unconventional, discontinuous shape with significant missing sections. This result was expected due to solver limitations regarding internal pressure boundaries. To resolve this, a manual post-processing workflow was implemented. The generated geometry was split latitudinally and longitudinally to isolate the fully developed channel structure as seen in Figure 3b. This quarter-section was then mirrored to obtain the half-section shown in Figure 3c and mirrored again to construct the full, symmetrical, and watertight fluid volume shown in Figure 3d.
2.3. Structural Generative Design Process
The optimized fluid volume extracted from the previous stage served as the core geometric input for the structural optimization process using the Autodesk Fusion Structural Generative Design workspace. The transition from fluid topology to structural geometry is illustrated in Figure 5. The process initiated with a solid version of the baseline manifold body as seen in Figure 5a. A Boolean subtraction was then performed to remove the optimized fluid volume, ensuring that the inlet, outlet, and module interface regions aligned perfectly with the original geometry as shown in Figure 5b. To create the minimum wall geometry required to contain the fluid, the fluid volume was hollowed out using a shell command. The resulting thin-walled shell, which can be seen in Figure 5c was assigned as Preserve Geometry ensuring the structural solver would generate material specifically to enclose the fluid path.
For the geometry definitions of the structural optimization, the solid baseline manifold body was set as the Starting Shape, depicted as yellow in Figure 6a. The spaces in between the channels were defined as Obstacle Geometry, shown in red, to prevent any obstructions in the power module slots. The inlet and outlet sections were set as preserve geometry, shown in green, to keep the mounting points unmodified. Additionally, these faces were also set as fixed constraints to simulate the connection to the external liquid cooling system. To ensure that these mounting points can withstand the weight of the cooling manifold filled with fluid, a vertical load of 0.35 N was applied. This magnitude was derived from the mass of the solid baseline manifold and served as a conservative estimate for the self-weight of the final component. Minimal post-processing was performed for the final design shown in Figure 6b, which included the addition of gasket grooves and hose barbs to ensure functionality.
2.4. Numerical Simulation and Analysis
To validate the thermal and fluid flow performance of the baseline and optimized cooling manifold designs, CFD and FEA simulations were conducted using Ansys Fluent. The simulation setup consisted of the extracted fluid volume and a simplified model of the DSC power module to reduce meshing complexity. This consisted of only the components necessary for thermal analysis such as the substrate, inter-posts, and SiC MOSFETs. Materials for the components such as Aluminum Nitride, Copper, Sintered Silver, and Silicon Carbide were sourced from the Ansys Granta material database [14]. The working fluid used for the simulation was liquid water with temperature-dependent properties evaluated at 300 K. The material properties and assignments can be found in Table 1.
The boundary conditions were defined to replicate the experimental operating conditions of the DSC power module . A heat flux of 100 W was set for each of the six SiC MOSFETs located on either side of the power module. An inlet volumetric flow rate of 3 L/min with an inlet temperature of 300 K was defined, while the outlet was set to a gauge pressure of 0 Pa. The mesh interfaces between the fluid volume and the power modules were defined as coupled walls to enable conjugate heat transfer, assuming ideal contact.
In order to ensure that the correct simulation model was used, the flow was first characterized by calculating the Reynolds number (Re) based on the inlet flow condition of 3 L/min, the channel hydraulic diameter (Dh) of 8.08 mm, and a dynamic viscosity (μ) of 0.001003 kg/m·s using Equation (1).
At a flow rate of 3 L/min, the calculated Re was approximately 7836, indicating turbulent flow. Based on this, the Shear Stress Transport (SST) k-ω turbulence model was selected. This was chosen over the more conventional k-ϵ model due to its superior accuracy in predicting heat transfer near walls in complex geometries. The fluid volume was meshed with a uniform element size of 0.5 mm to maximize accuracy for the simulation. Strict mesh quality metrics were enforced to ensure convergence, with the resulting meshes for both the baseline and generative design fluid volumes exhibiting high mesh quality detailed in Table 2. The generated meshes used for the simulation are shown in Figure 7.
After performing the simulation, key performance parameters were obtained through both Ansys Fluent and Ansys CFD-Post. Pressure drop was obtained by getting the surface integral of static pressure on the inlet face of the manifold. Similarly, the average HTC between the fluid and the substrates was also obtained by obtaining the surface integral on the contact interface at each side of the power modules. The average temperature for each of the six SiC MOSFETs was extracted using volume integration over the respective chip domains. To address the requirement for flow and cooling uniformity across the three modules, the temperature uniformity was explicitly defined and calculated as the standard deviation of the six average chip temperatures. These metrics served as the quantitative basis for evaluating and comparing the baseline and GD cooling manifold designs.
2.3. Mass Estimation
To quantify the material reduction as a result of the structural optimization stage, a mass estimation was performed for the manifold designs. The CAD geometries were imported into the Formlabs PreForm slicing software to get the estimated resin volume required for fabrication. This was restricted to only the manifold geometry, excluding AM specific features such as rafts and support structures. Using Equation (2), the theoretical mass (m) was then derived using resin volume (V) and a known resin density ( of 1.14 g/cm3, which was obtained from the Formlabs High Temp Resin V2 safety data sheet [15].
2.6. Prototype Fabrication
The optimized manifold geometry was prepared for fabrication using Formlabs PreForm slicing software and manufactured using VPP, selected for its ability to produce watertight, non-porous parts with high dimensional accuracy. The prototype was fabricated using Formlabs High Temp Resin V2. This material was specifically chosen for its Heat Deflection Temperature (HDT) of 238 °C @ 0.45 MPa. This is critical to prevent material degradation from the heat generated by the power modules, especially with the direct-contact nature of the cooling manifold design.
To reproduce the fine structures of the internal channels, a layer resolution of 0.05 mm was utilized. Furthermore, a combination of both automatic and manual support generation strategies was employed to ensure manufacturability. As illustrated in Figure 8, the print orientation was optimized to minimize overhangs and cupping forces. While external support structures were automatically generated, internal supports were manually placed and restricted to regions strictly accessible through the manifold openings. This ensured that all internal support material could be mechanically removed after printing, preventing the risk of obstructions affecting the fluid flow performance.
3. Results and Discussions
3.1. Baseline Manifold Performance
Performance evaluation of the baseline manifold revealed significant limitations with regard to thermal performance. The average chip temperature was recorded at 430.68 K, with individual temperatures varying considerably from 405.51 K to 461.15 K. As illustrated in the temperature contours in Figure 9a, thermal uniformity was a critical concern, evidenced by a standard deviation of 21.99 K. Low cooling uniformity was observed, with the outer power modules exhibiting significantly higher temperatures compared to the center module.
This is attributed to the restricted fluid behavior as a result of the unoptimized geometry. The manifold produced an average HTC of 3752.34 W/m²·K and a pressure drop of 3247.38 Pa. Analysis of the velocity streamlines in Figure 9b indicates that the sharp rectangular transitions induced regions of flow stagnation, which inhibited effective fluid flow and heat transfer. Additionally, the mass estimation yielded an estimated manifold weight of 35.16 g. The combination of elevated operating temperatures, non-uniform cooling, and inefficient material usage defined the performance baseline for the optimization study.
3.2. GD Manifold Performance
The GD manifold exhibited a notable improvement in thermal and fluid flow performance. An average chip temperature of 398.22 K was obtained, representing a significant reduction in the thermal load on the DSC power modules. As shown in the temperature contours in Figure 10a, the temperature uniformity was greatly enhanced, achieving a standard deviation of only 5.13 K. Unlike the baseline manifold, the GD manifold was able to evenly distribute fluid to the parallel channels and maintain consistent cooling across all three power modules.
This improved cooling performance was driven by the optimized fluid volume, which yielded an average HTC of 5256.97 W/m²·K. While the pressure drop increased slightly to 3411.88 Pa, the substantial gain in heat transfer efficiency indicates a highly effective trade-off. The velocity streamlines in Figure 10b show that the organic, variable-cross-section channels allow for continuous fluid flow and mixing. This behavior directs high-velocity fluid more effectively onto the heat transfer surfaces compared to the passive flow of the baseline. Furthermore, the structural optimization was able to successfully reduce the material volume, resulting in a final estimated mass of just 12.90 g. The results confirm that the generative workflow successfully achieved the target objectives of thermal management, flow efficiency, and lightweighting.
3.3. Design Performance Comparison
A quantitative comparison of the key performance metrics is presented in Table 3. The GD manifold achieved a 7.5% reduction in average chip temperature, decreasing from 430.68 K to 398.22 K. This improvement is a direct result of a 40.1% increase in the average HTC, which increased to 5256.97 W/m²·K from 3752.34 W/m²·K.
Furthermore, the optimized fluid channels effectively resolved the issue of non-uniform cooling. The temperature uniformity improved by 76.6%, with the standard deviation across the chips dropping from 21.99 K to 5.13 K. These improvements were achieved with minimal compromise to fluid flow efficiency, with the pressure drop increasing by only 5.1%, from 3247.38 Pa to 3411.88 Pa.
Finally, the structural optimization was found to be highly effective, resulting in a 63.3% reduction in total mass, lowering the component weight from 35.16 g to 12.90 g.
3.4. Physical Prototype
To validate the manufacturability of the optimized geometry, the GD manifold was fabricated using the VPP process described in Section 2.5. The slicing strategy proved effective, with all support structures being successfully removed through the manifold openings. Visual inspection confirmed that no obstructions and manufacturing flaws were observed in the internal channels and power module slots.
Furthermore, the use of High Temp Resin V2 provided sufficient structural rigidity, ensuring that the manifold was capable of withstanding the clamping loads required to seal against the power module surfaces. The manufactured prototype is shown in Figure 11. While the thermal performance presented in this study relies on numerical simulation, the successful fabrication of this prototype establishes the necessary platform for future experimental validation. The prototype serves as a verified test specimen for subsequent work aimed at correlating the simulation results with real-world testing.
5. Conclusions
The developed cooling manifold, realized through a rigorous generative design (GD) protocol, demonstrated transformative improvements over the conventional baseline. The thermal performance optimization was profound, evidenced by a 40.1% enhancement in the average heat transfer coefficient (HTC) and a critically important 76.6% improvement in thermal uniformity across the SiC power modules. This uniformity enhancement is particularly noteworthy, with the temperature standard deviation plummeting from 21.99 K to 5.13 K, greatly improving cooling consistency.
Concurrently, the structural optimization phase achieved an outstanding 63.3% mass reduction, lowering the manifold’s weight from 35.16 g to just 12.90 g. Achieving these dual-criteria optimizations—superior heat dissipation and significant lightweighting—with only a marginal 5.1% increase in pressure drop confirms the potential of the GD approach in advancing the design of high-performance power electronic cooling systems.
While this study established theoretical thermal and fluid flow performance, the findings are currently limited to numerical simulations. However, the successful fabrication of the functional prototype using the VPP process serves as an important step toward actual experimental validation. Future work will focus on the experimental characterization of this prototype, utilizing a dedicated fluid flow loop test bench setup consisting of flow regulators, temperature sensors, and differential pressure sensors to correlate the numerical predictions with empirical data. Beyond the specific application to SiC MOSFETs, future studies will also explore the scalability of this generative design framework to other high-flux power electronic devices, such as Silicon-based IGBTs and high-performance computing processors. Ultimately, this will establish the proposed framework as a robust tool for next-generation thermal management applications.
Funding
This research was funded by the Department of Science and Technology – Philippine Council for Industry, Energy and Emerging Technology Research and Development (DOST–PCIEERD), with facility support from the Department of Science and Technology – Metals Industry Research and Development Center – Advanced Manufacturing Center (DOST–MIRDC AMCen). The APC was not externally funded.
Data Availability Statement
The data presented in this study are available on reasonable request from the corresponding author.
Acknowledgments
The authors gratefully acknowledge the Department of Science and Technology – Philippine Council for Industry, Energy and Emerging Technology Research and Development (DOST–PCIEERD) for funding support and the Department of Science and Technology – Metals Industry Research and Development Center – Advanced Manufacturing Center (DOST–MIRDC AMCen) for providing research facilities. And Engr. Fred P. Liza for the endless support and guidance.
Conflicts of Interest
The authors declare no conflicts of interest. The funders had no role in the design of the study; in the collection, analyses, or interpretation of data; in the writing of the manuscript; or in the decision to publish the results.
References
- Rodriguez, L.A.G.; et al. A comparison of selected silicon and silicon-carbide switching devices for PV microinverter applications. 2013 4th IEEE International Symposium on Power Electronics for Distributed Generation Systems (PEDG), 2013. [Google Scholar]
- Qin, Y.; et al. Thermal management and packaging of wide and ultra-wide bandgap power devices: a review and perspective. Journal of Physics D: Applied Physics 2023, 56(9). [Google Scholar] [CrossRef]
- Regalado, I.L.; et al. X-Ray Microtomography of Thermal Cycling Damage in Sintered Nano-Silver Solder Joints. Advanced Engineering Materials 2019, 21(3). [Google Scholar] [CrossRef]
- Moubayed, N.; et al. Cooling Performance of Heat Sinks Used in Electronic Devices. MATEC Web of Conferences, 2018; p. 171. [Google Scholar]
- Schultz, M.D.; et al. High Performance Compliant Heat Sinks. 2022 21st IEEE Intersociety Conference on Thermal and Thermomechanical Phenomena in Electronic Systems (iTherm), 2022. [Google Scholar]
- McPherson, B.; et al. Direct liquid cooling of high performance Silicon Carbide (SiC) power modules. 2017 IEEE International Workshop On Integrated Power Packaging (IWIPP), 2017; pp. 1–5. [Google Scholar]
- Abramushkina, E.E.; et al. An Innovative Additively Manufactured Design Concept of a Dual-Sided Cooling System for SiC Automotive Inverters. IEEE Access 2024, 12, 20454–20470. [Google Scholar] [CrossRef]
- Sun, Q.; et al. Advanced Design and Manufacturing Approaches for Structures with Enhanced Thermal Management Performance: A Review. Advanced Materials Technologies 2024. [Google Scholar] [CrossRef]
- Dilibal, C.; Davis, B.L.; Chakraborty, C. Generative Design Methodology for Internet of Medical Things (IoMT)-based Wearable Biomedical Devices. 2021 3rd International Congress on Human-Computer Interaction, Optimization and Robotic Applications (HORA), 2021; pp. 1–4. [Google Scholar]
- Srivastava, J.; Kawakami, H. Systematic Review of Difference Between Topology Optimization and Generative Design. IFAC-PapersOnLine 2023, 56(2), 6561–6568. [Google Scholar] [CrossRef]
- Hamza, A.; et al. Revolutionizing Automotive Design: The Impact of Additive Manufacturing. Vehicles 2025, 7(1). [Google Scholar] [CrossRef]
- Vervecken, L.; et al. Generative Design and Experimental Validation of a Two-phase Heat Sink . 2022 38th Semiconductor Thermal Measurement, Modeling & Management Symposium (SEMI-THERM), 2022. [Google Scholar]
- Arriola, E.; et al. Double-Side Cooled 1.2kV, 300A SiC MOSFET Phase-leg Modules for 200 kW. CIPS 2024. 13th International Conference on Integrated Power Electronics Systems, 2024. [Google Scholar]
- Granta Materials Data Library, in Ansys Workbench. Ansys Inc, 2025.
- Safety Data Sheet: High Temp V2 Resin; Formlabs, Inc.: Somerville, MA, 2020.
Figure 1.
Double-side cooled silicon carbide power module used as the target device to be cooled by the cooling manifold.
Figure 1.
Double-side cooled silicon carbide power module used as the target device to be cooled by the cooling manifold.
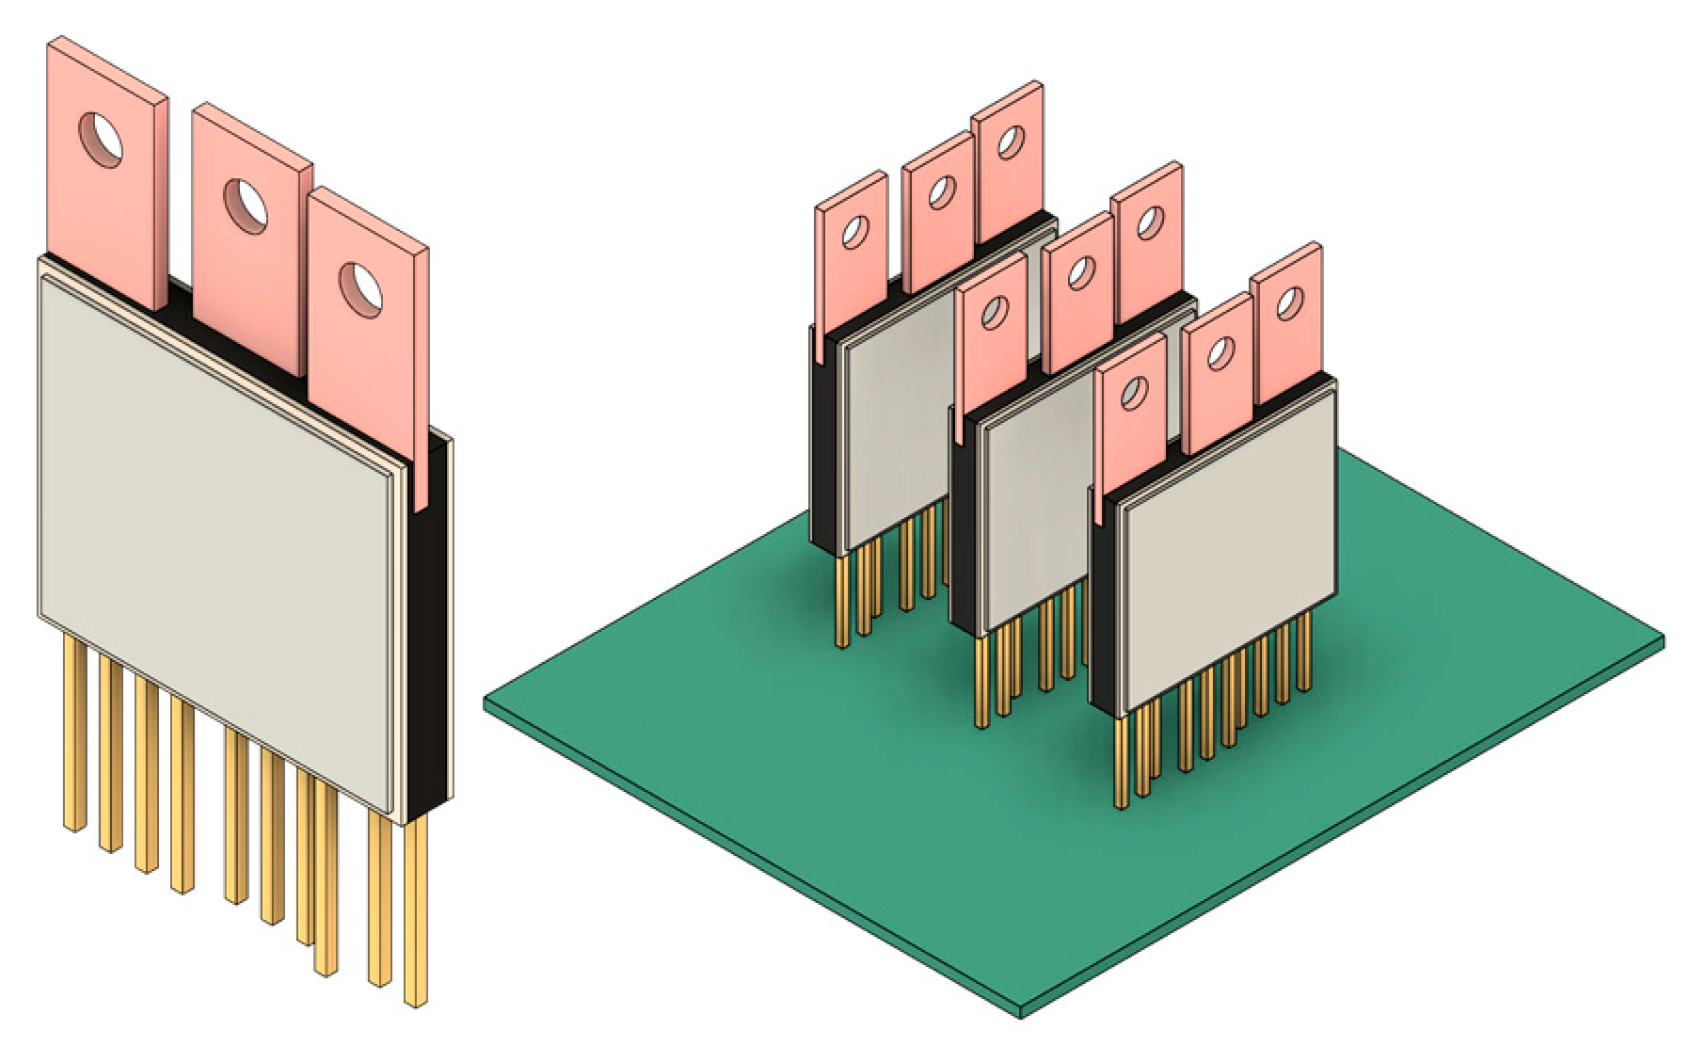
Figure 2.
Baseline cooling manifold design: (a) Isometric view; (b) Cross-section view of fluid flow path.
Figure 2.
Baseline cooling manifold design: (a) Isometric view; (b) Cross-section view of fluid flow path.
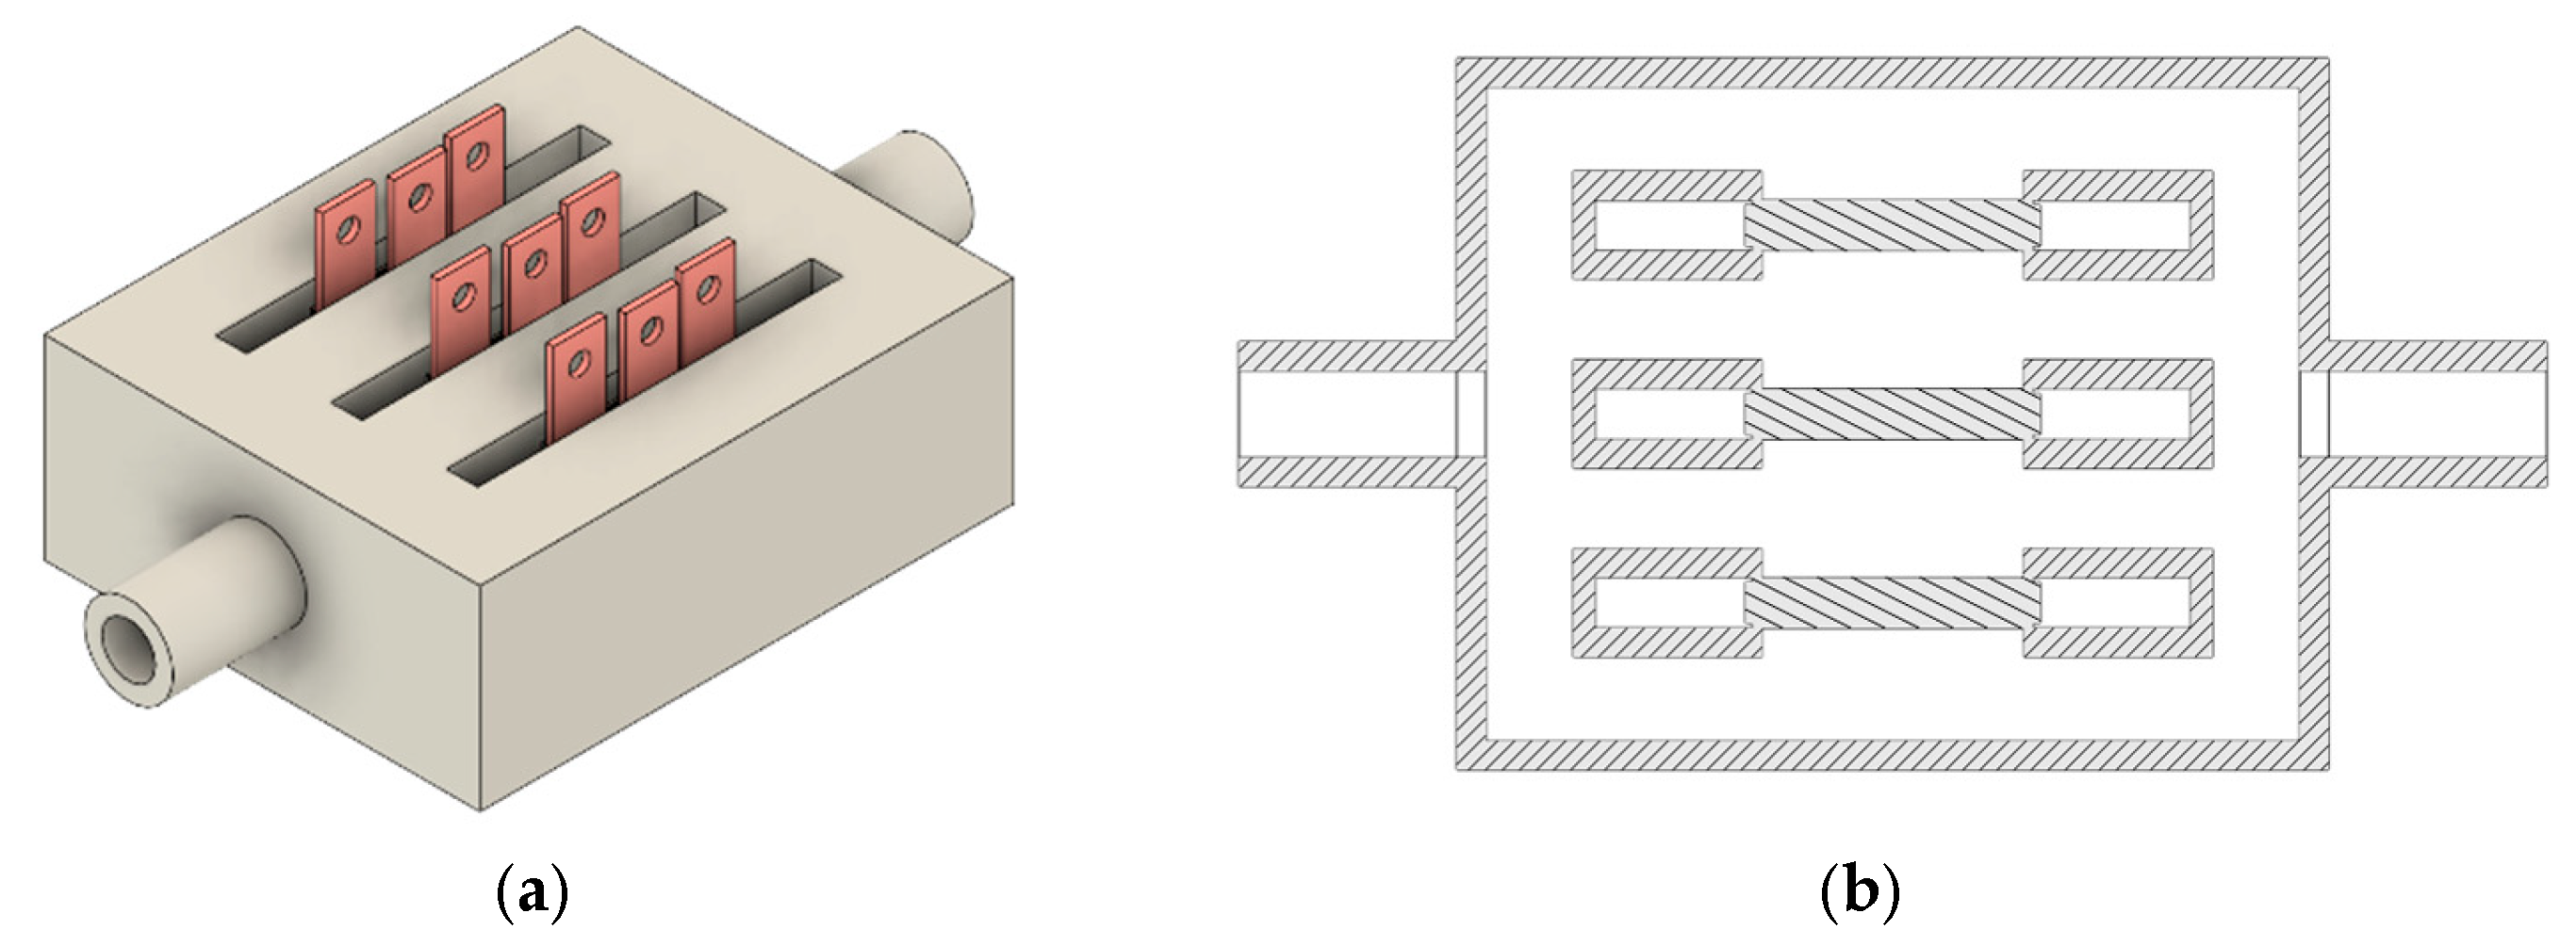
Figure 3.
Geometry definitions for fluid flow generative design optimization: (a) Internal fluid volume assignments; (b) External manifold body as solid obstacle geometry.
Figure 3.
Geometry definitions for fluid flow generative design optimization: (a) Internal fluid volume assignments; (b) External manifold body as solid obstacle geometry.
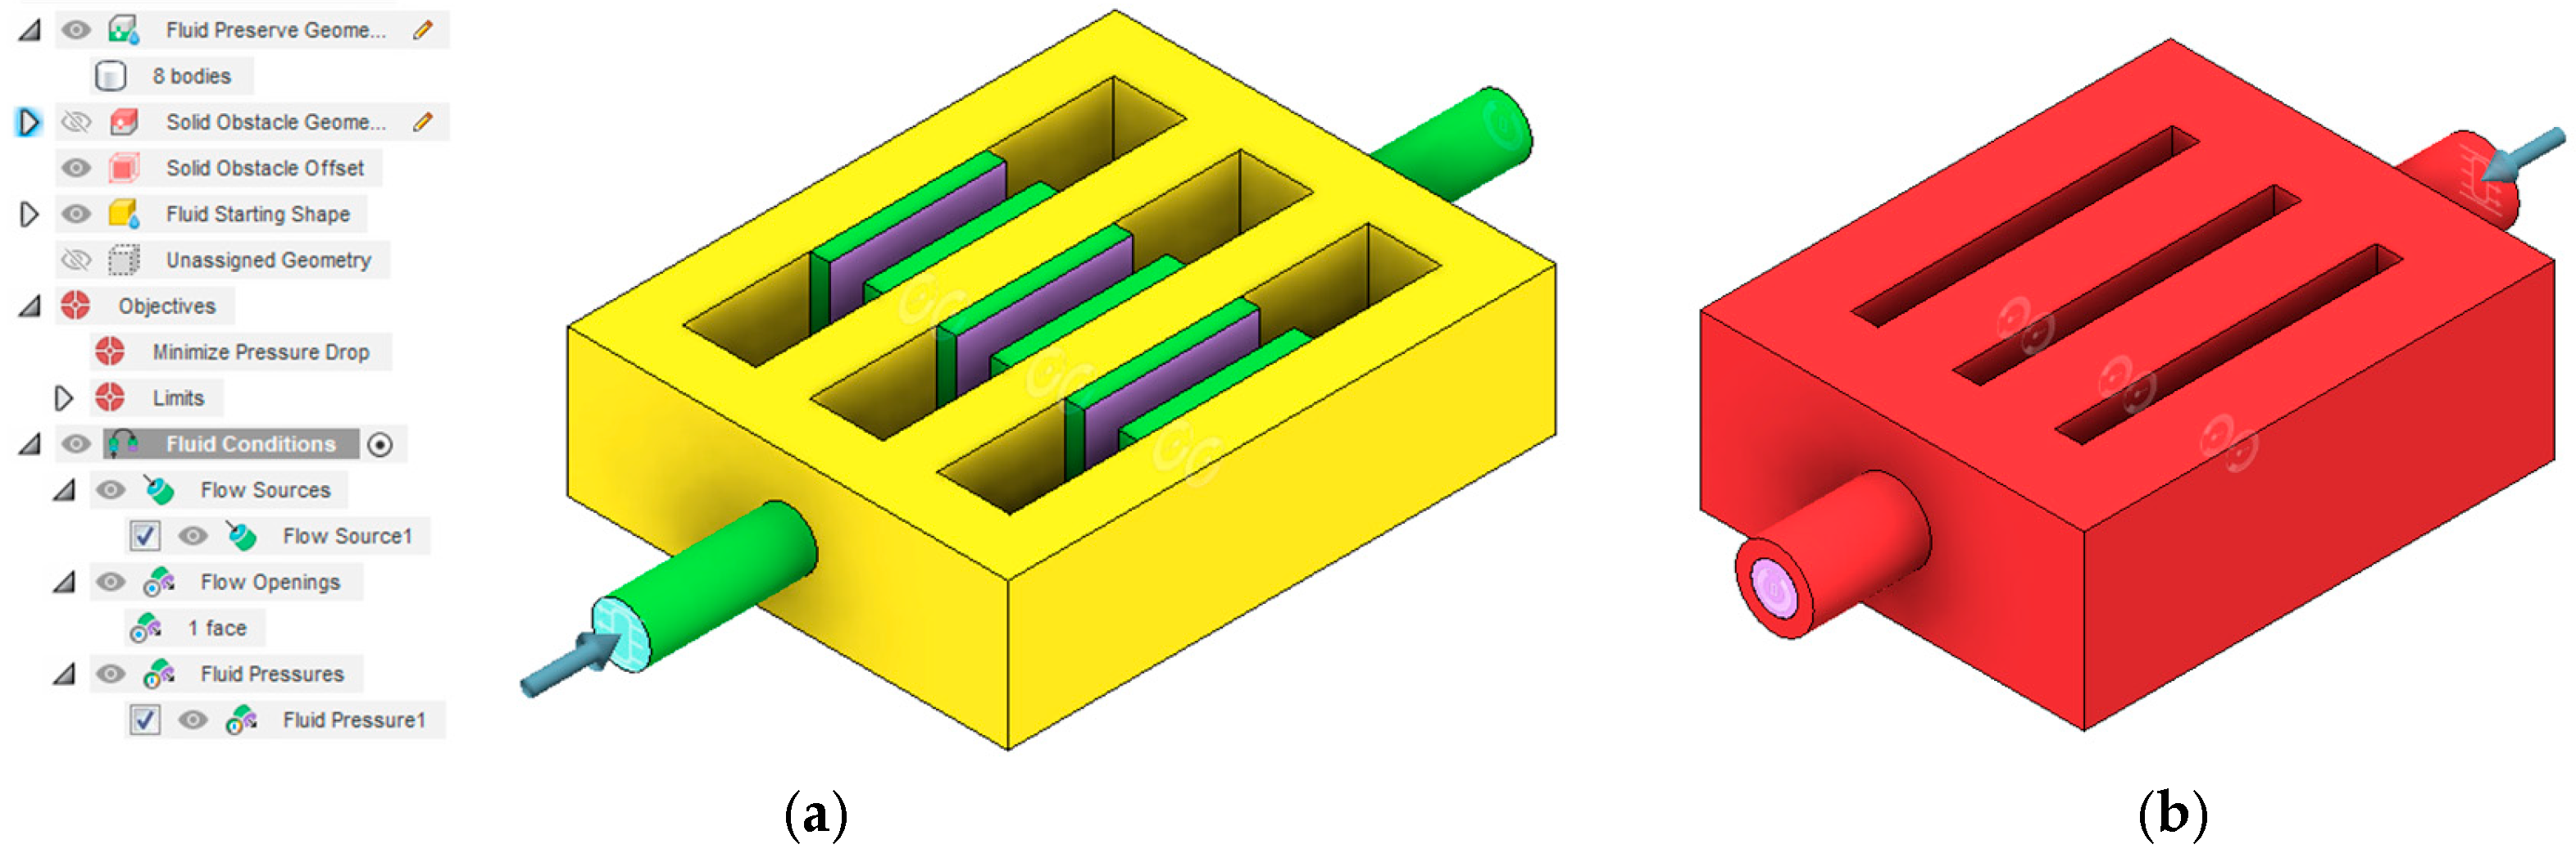
Figure 4.
Fluid flow optimization output and post-processing steps: (a) Initial solver output; (b) Quarter volume; (c) Half-mirrored fluid volume; (c) Final GD fluid volume.
Figure 4.
Fluid flow optimization output and post-processing steps: (a) Initial solver output; (b) Quarter volume; (c) Half-mirrored fluid volume; (c) Final GD fluid volume.
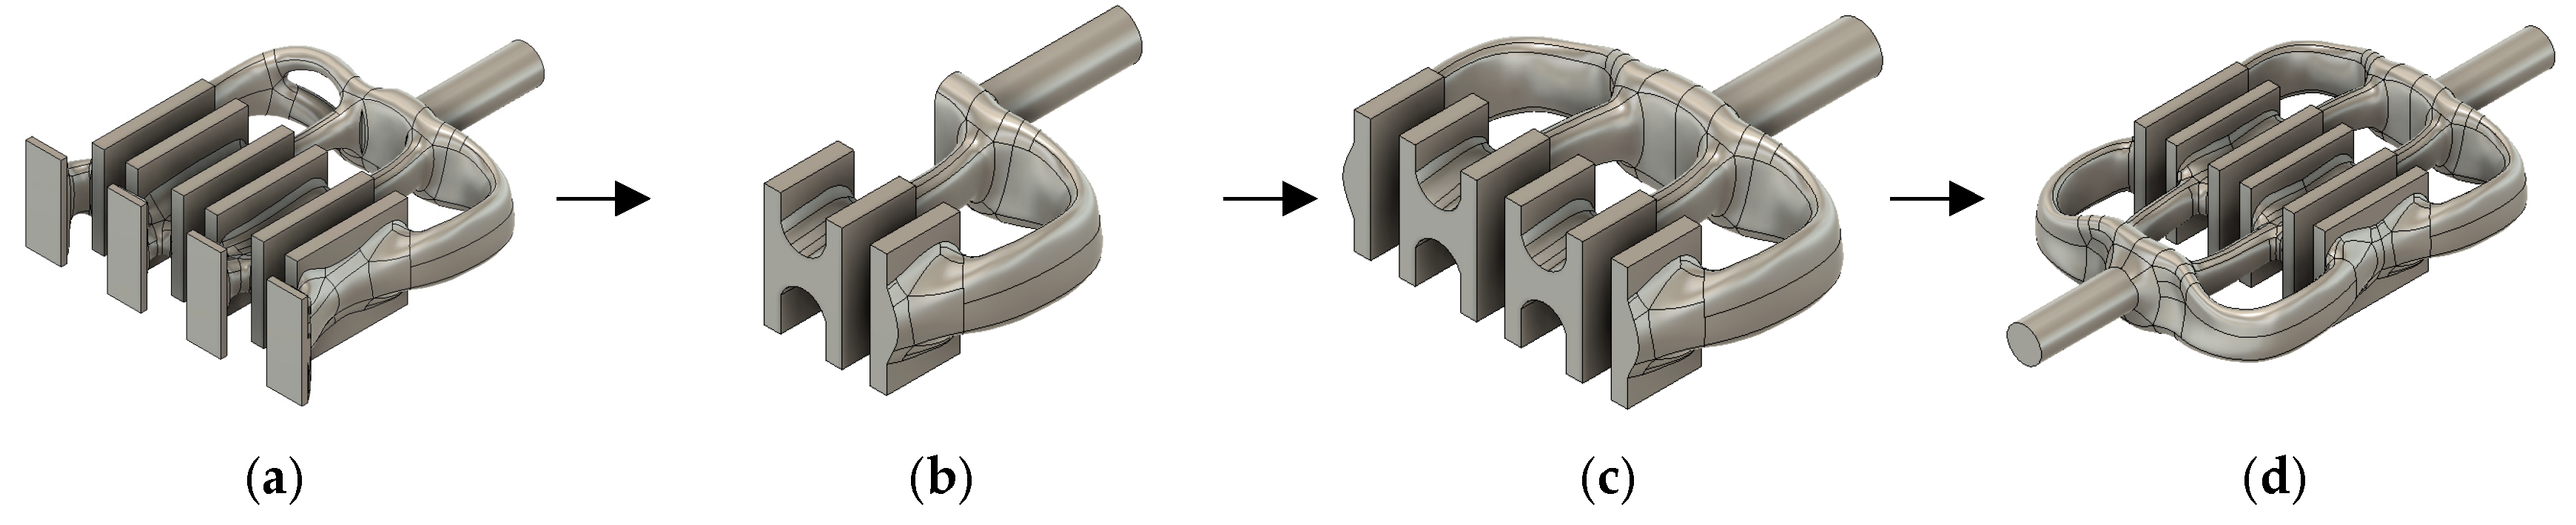
Figure 5.
Geometry setup for structural generative design optimization: (a) Solid baseline manifold geometry; (b) Boolean subtraction of GD fluid volume; (c) Shell operation performed on fluid volume.
Figure 5.
Geometry setup for structural generative design optimization: (a) Solid baseline manifold geometry; (b) Boolean subtraction of GD fluid volume; (c) Shell operation performed on fluid volume.
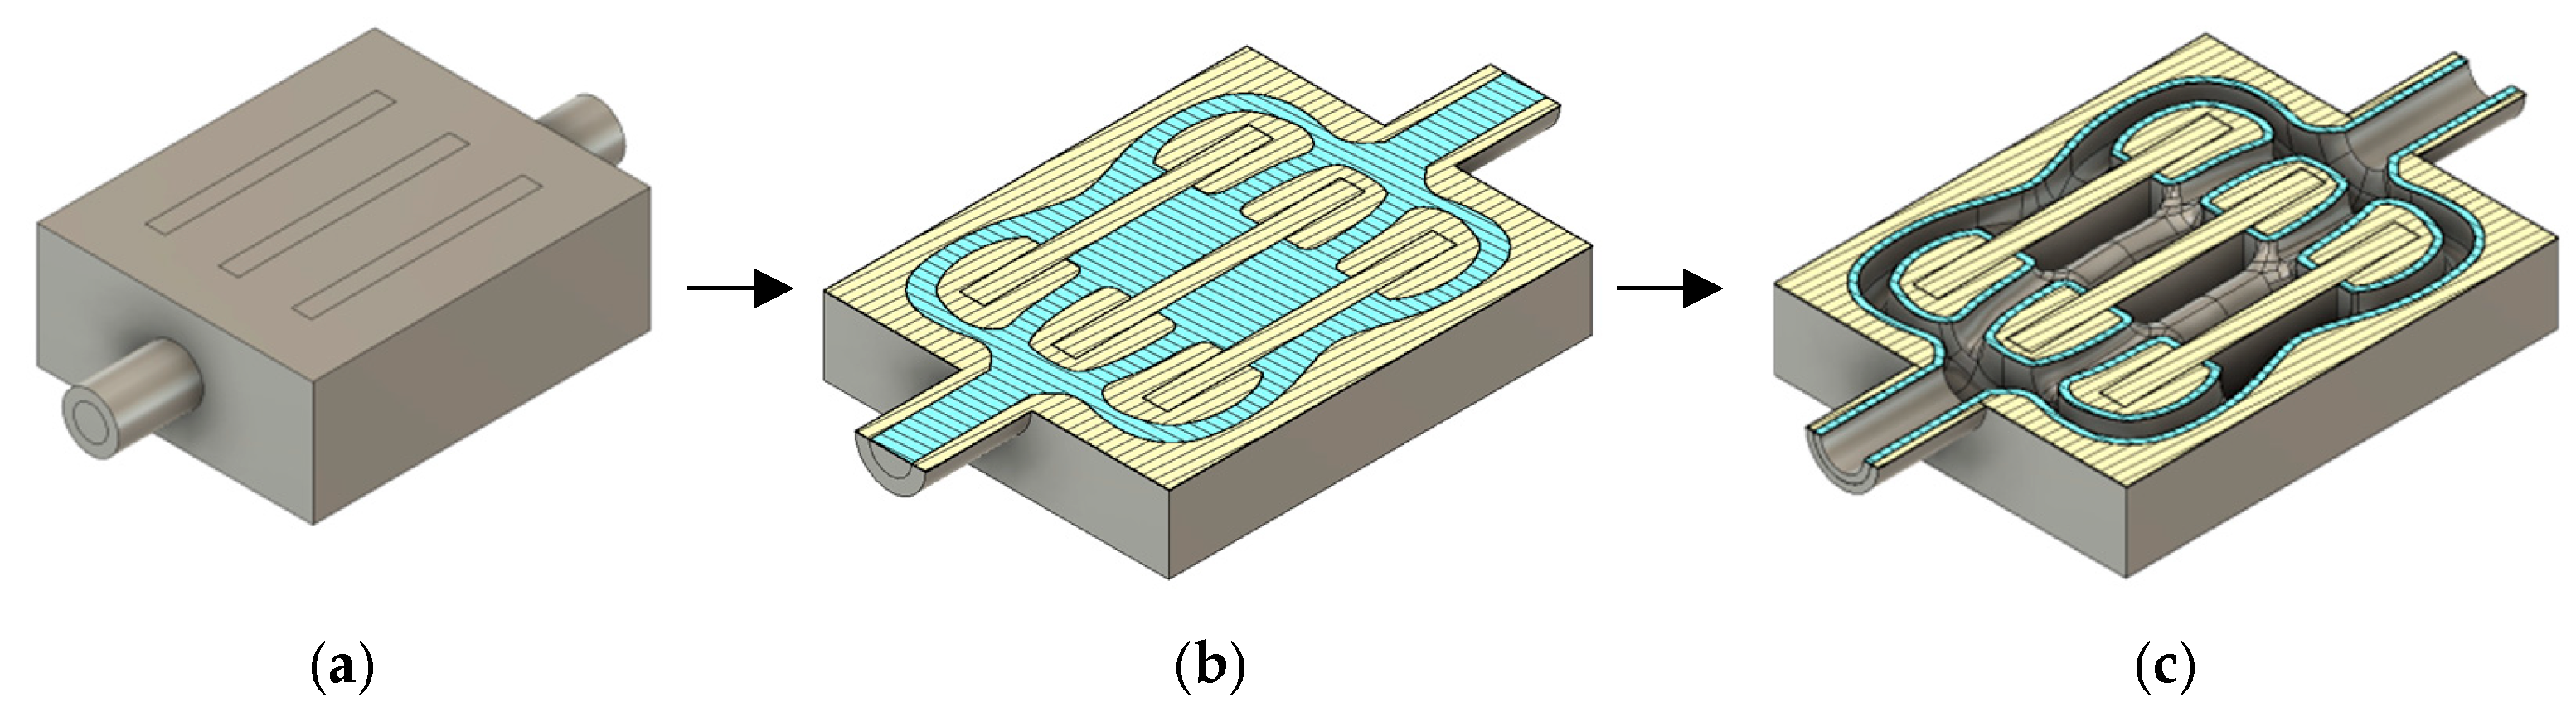
Figure 6.
Structural optimization geometry definitions and final optimized manifold: (a) Structural loads and constraints applie; (b) Final post-processed GD cooling manifold design.
Figure 6.
Structural optimization geometry definitions and final optimized manifold: (a) Structural loads and constraints applie; (b) Final post-processed GD cooling manifold design.
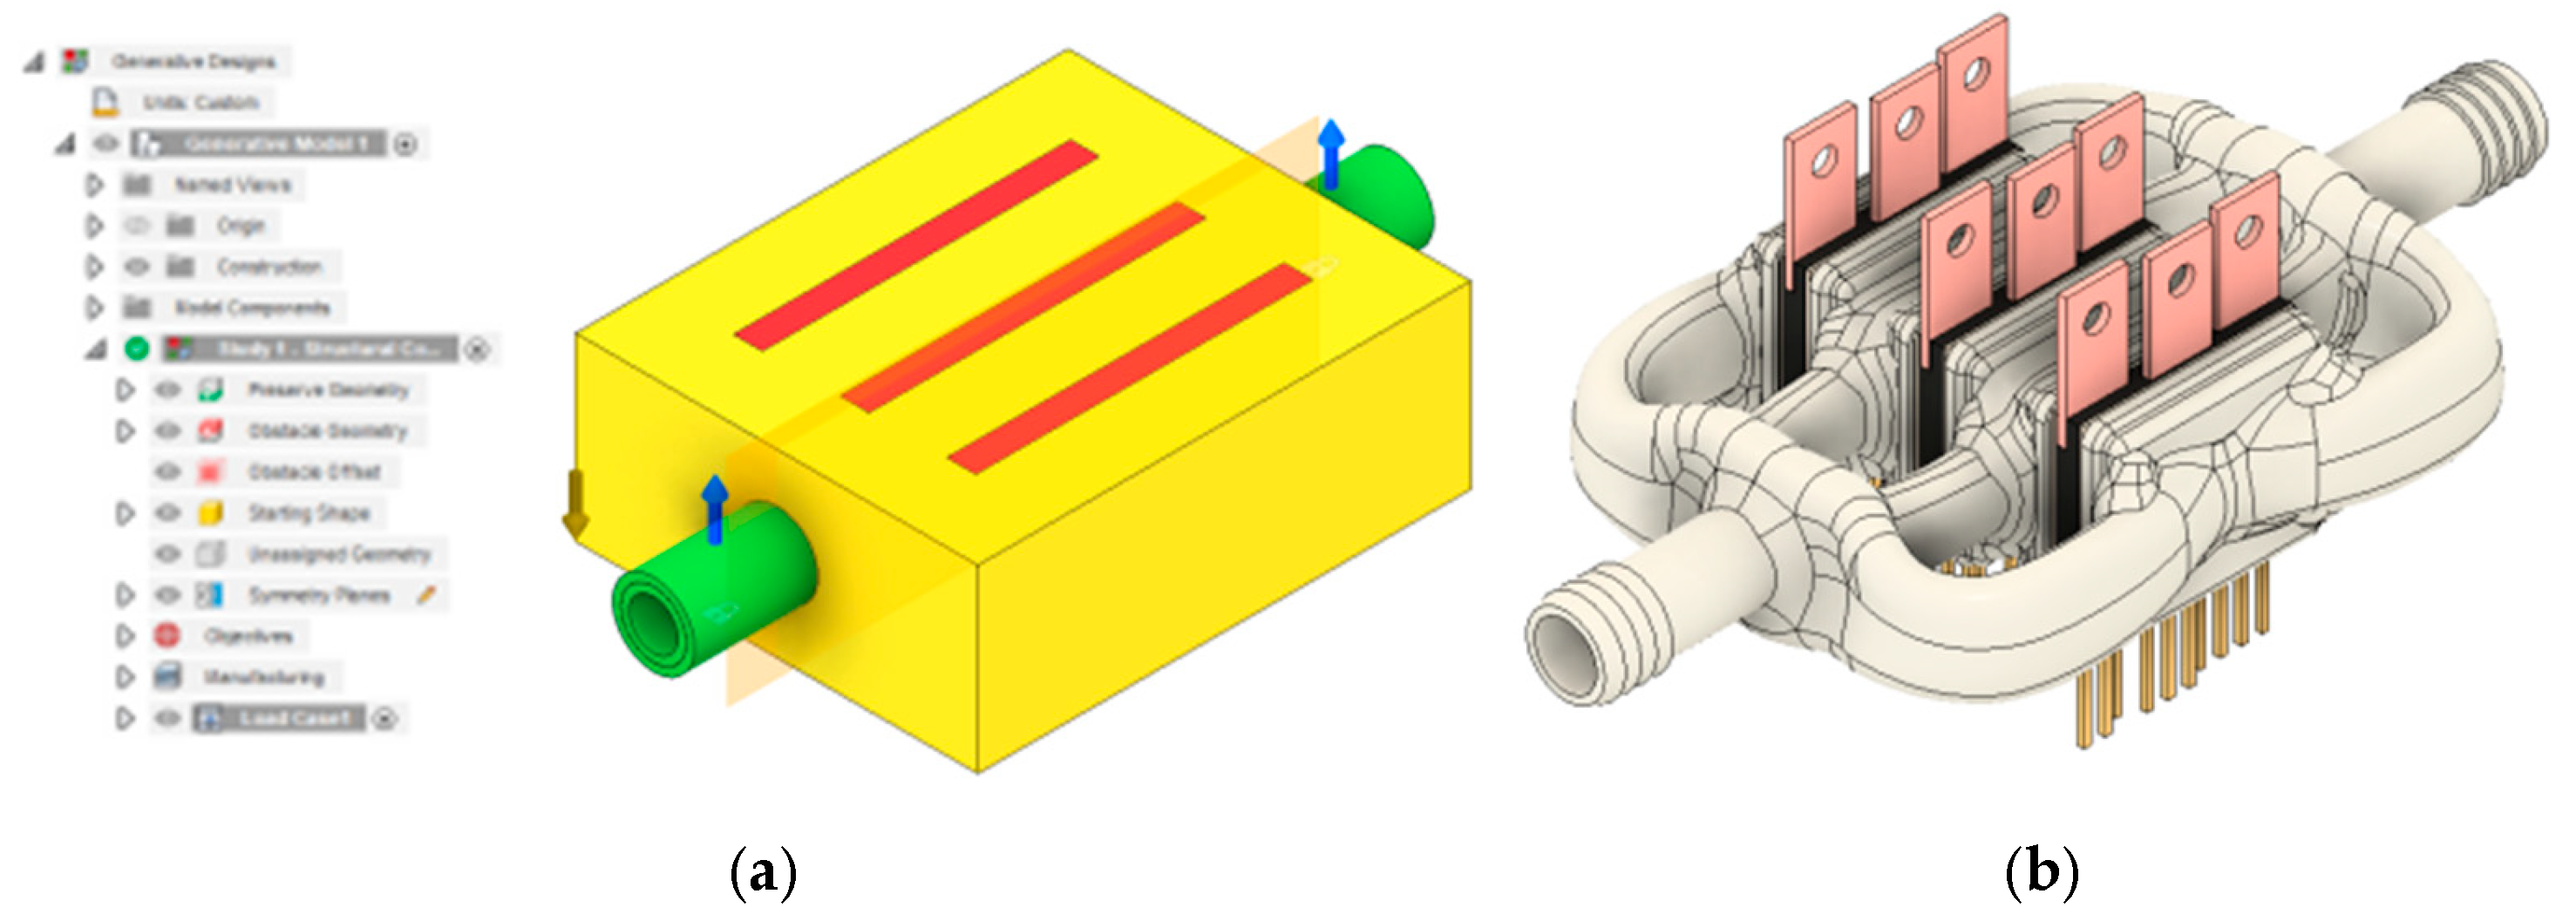
Figure 7.
Generated fluid volume meshes: (a) Baseline fluid volume; (b) GD fluid volume.
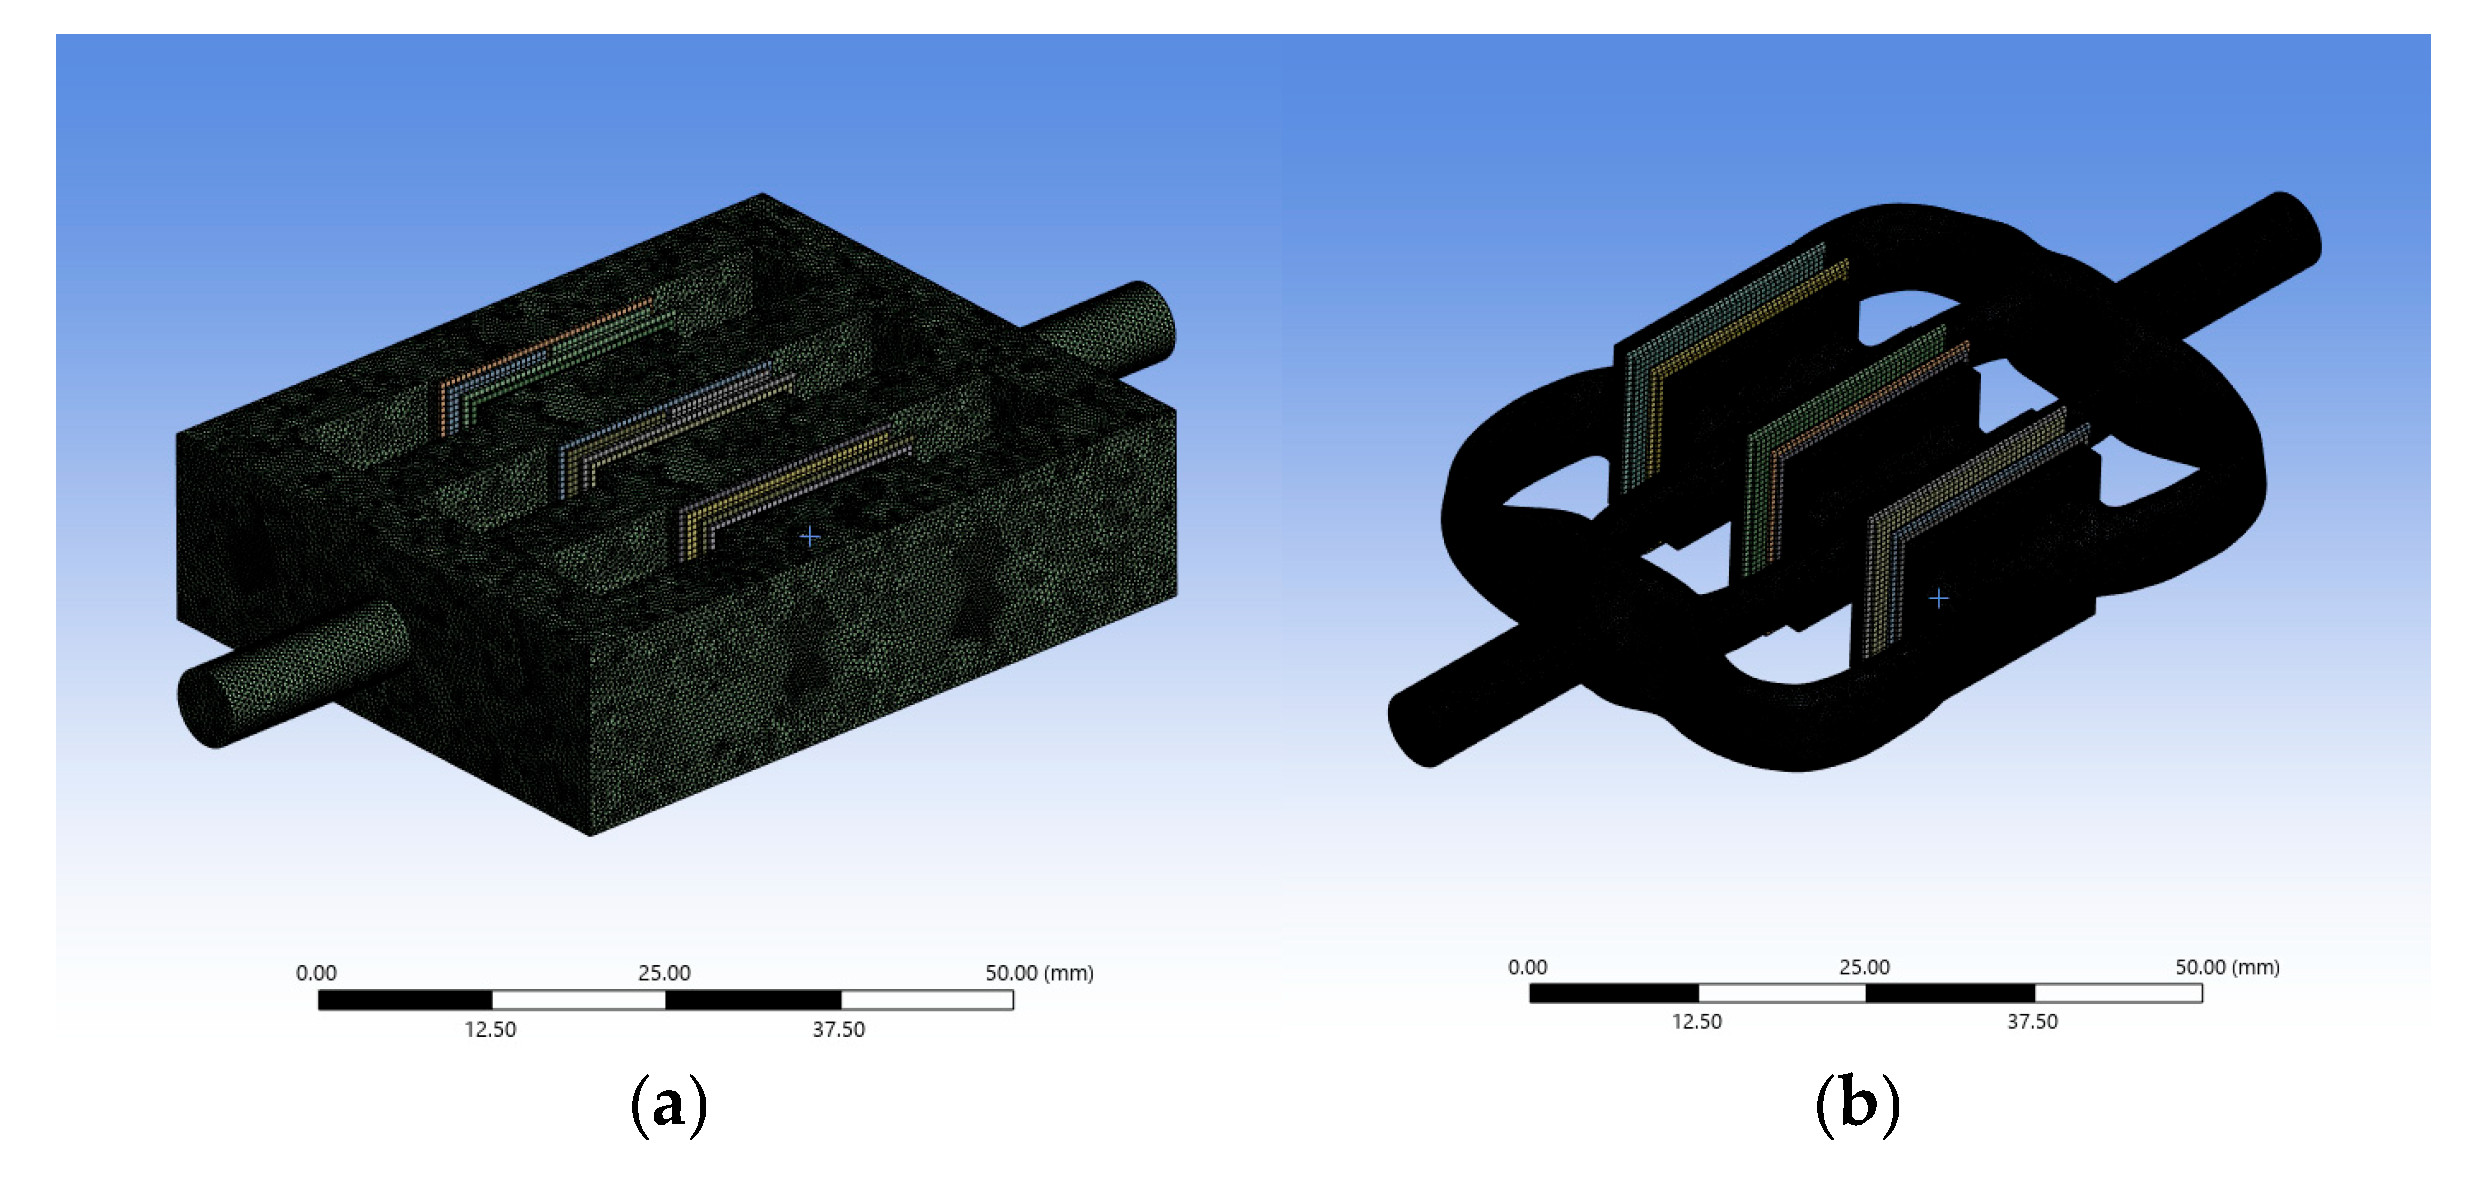
Figure 8.
Slicing setup for the GD manifold prototype.
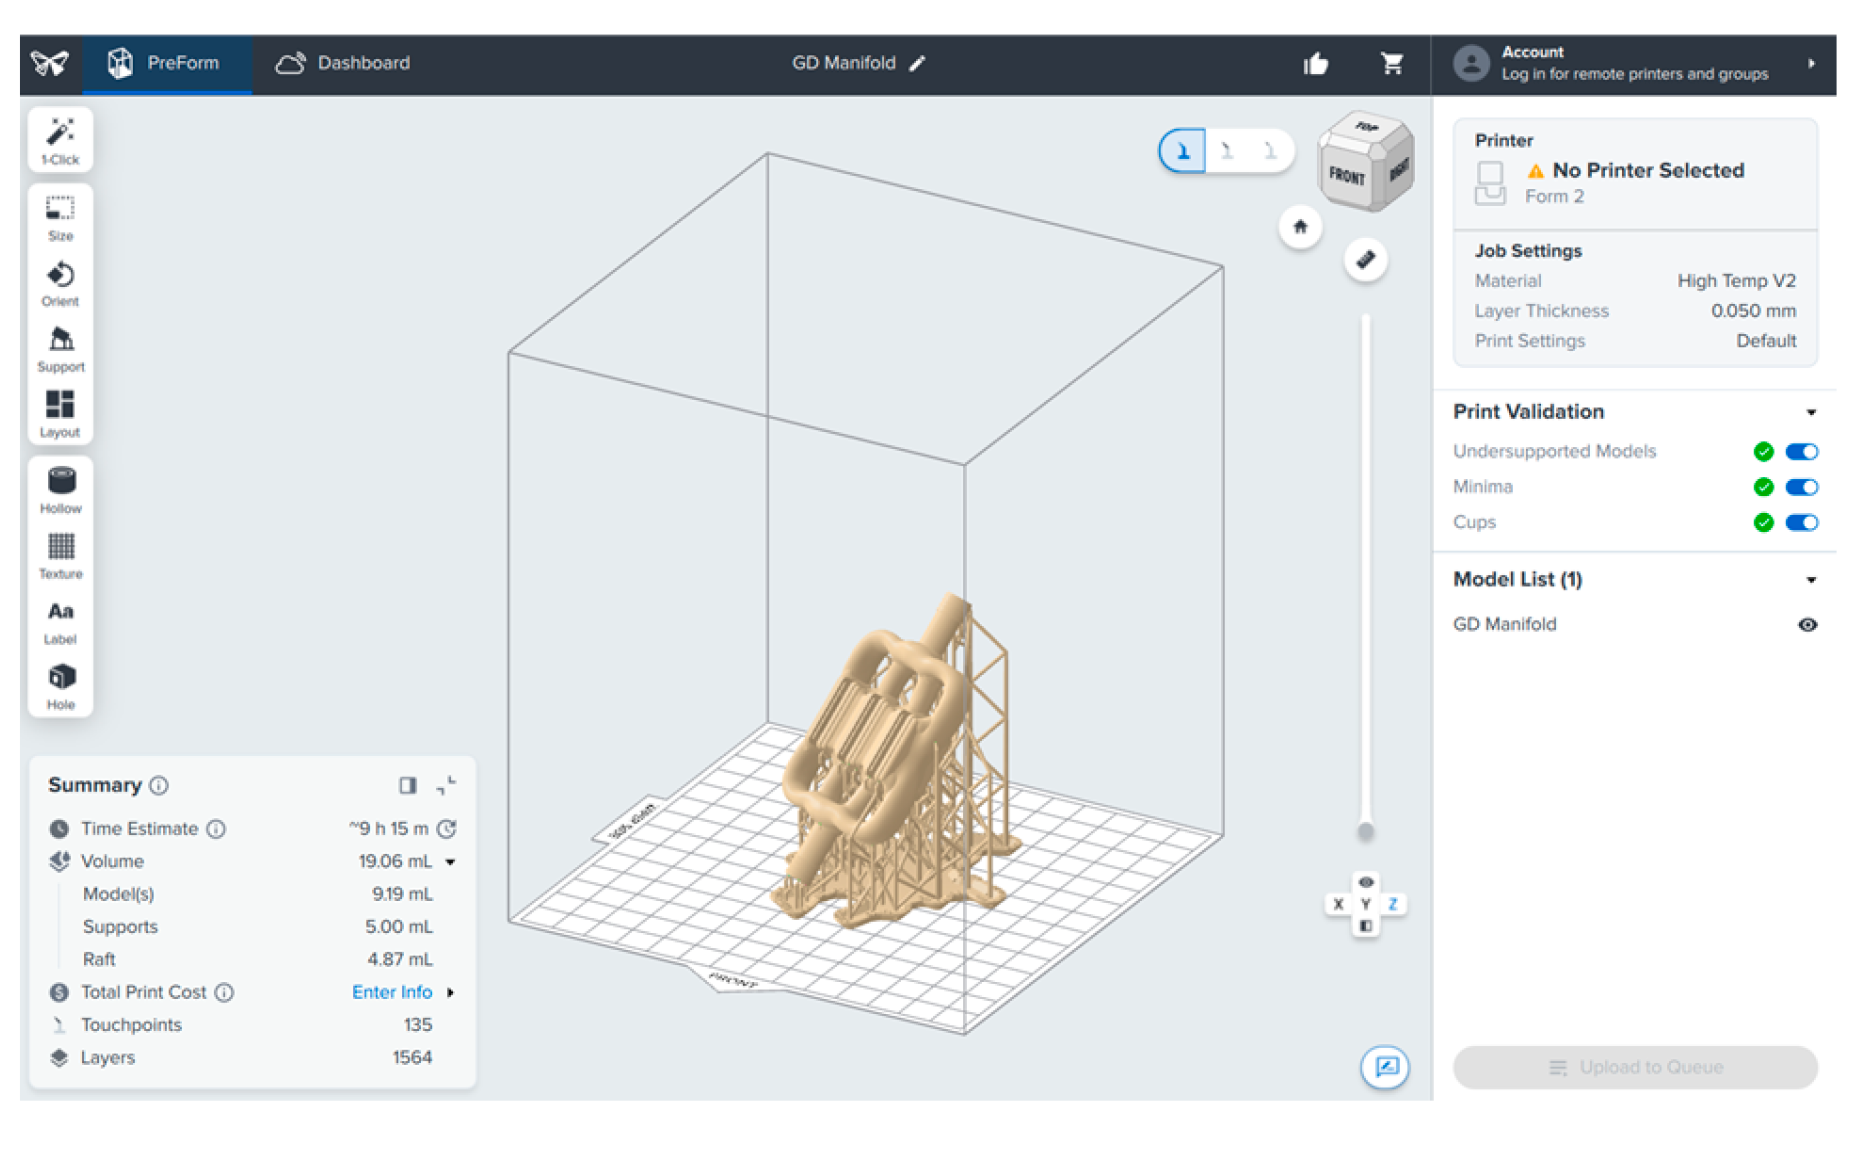
Figure 9.
Baseline cooling manifold simulation results: (a) Temperature contour; (b) Velocity streamlines.
Figure 9.
Baseline cooling manifold simulation results: (a) Temperature contour; (b) Velocity streamlines.
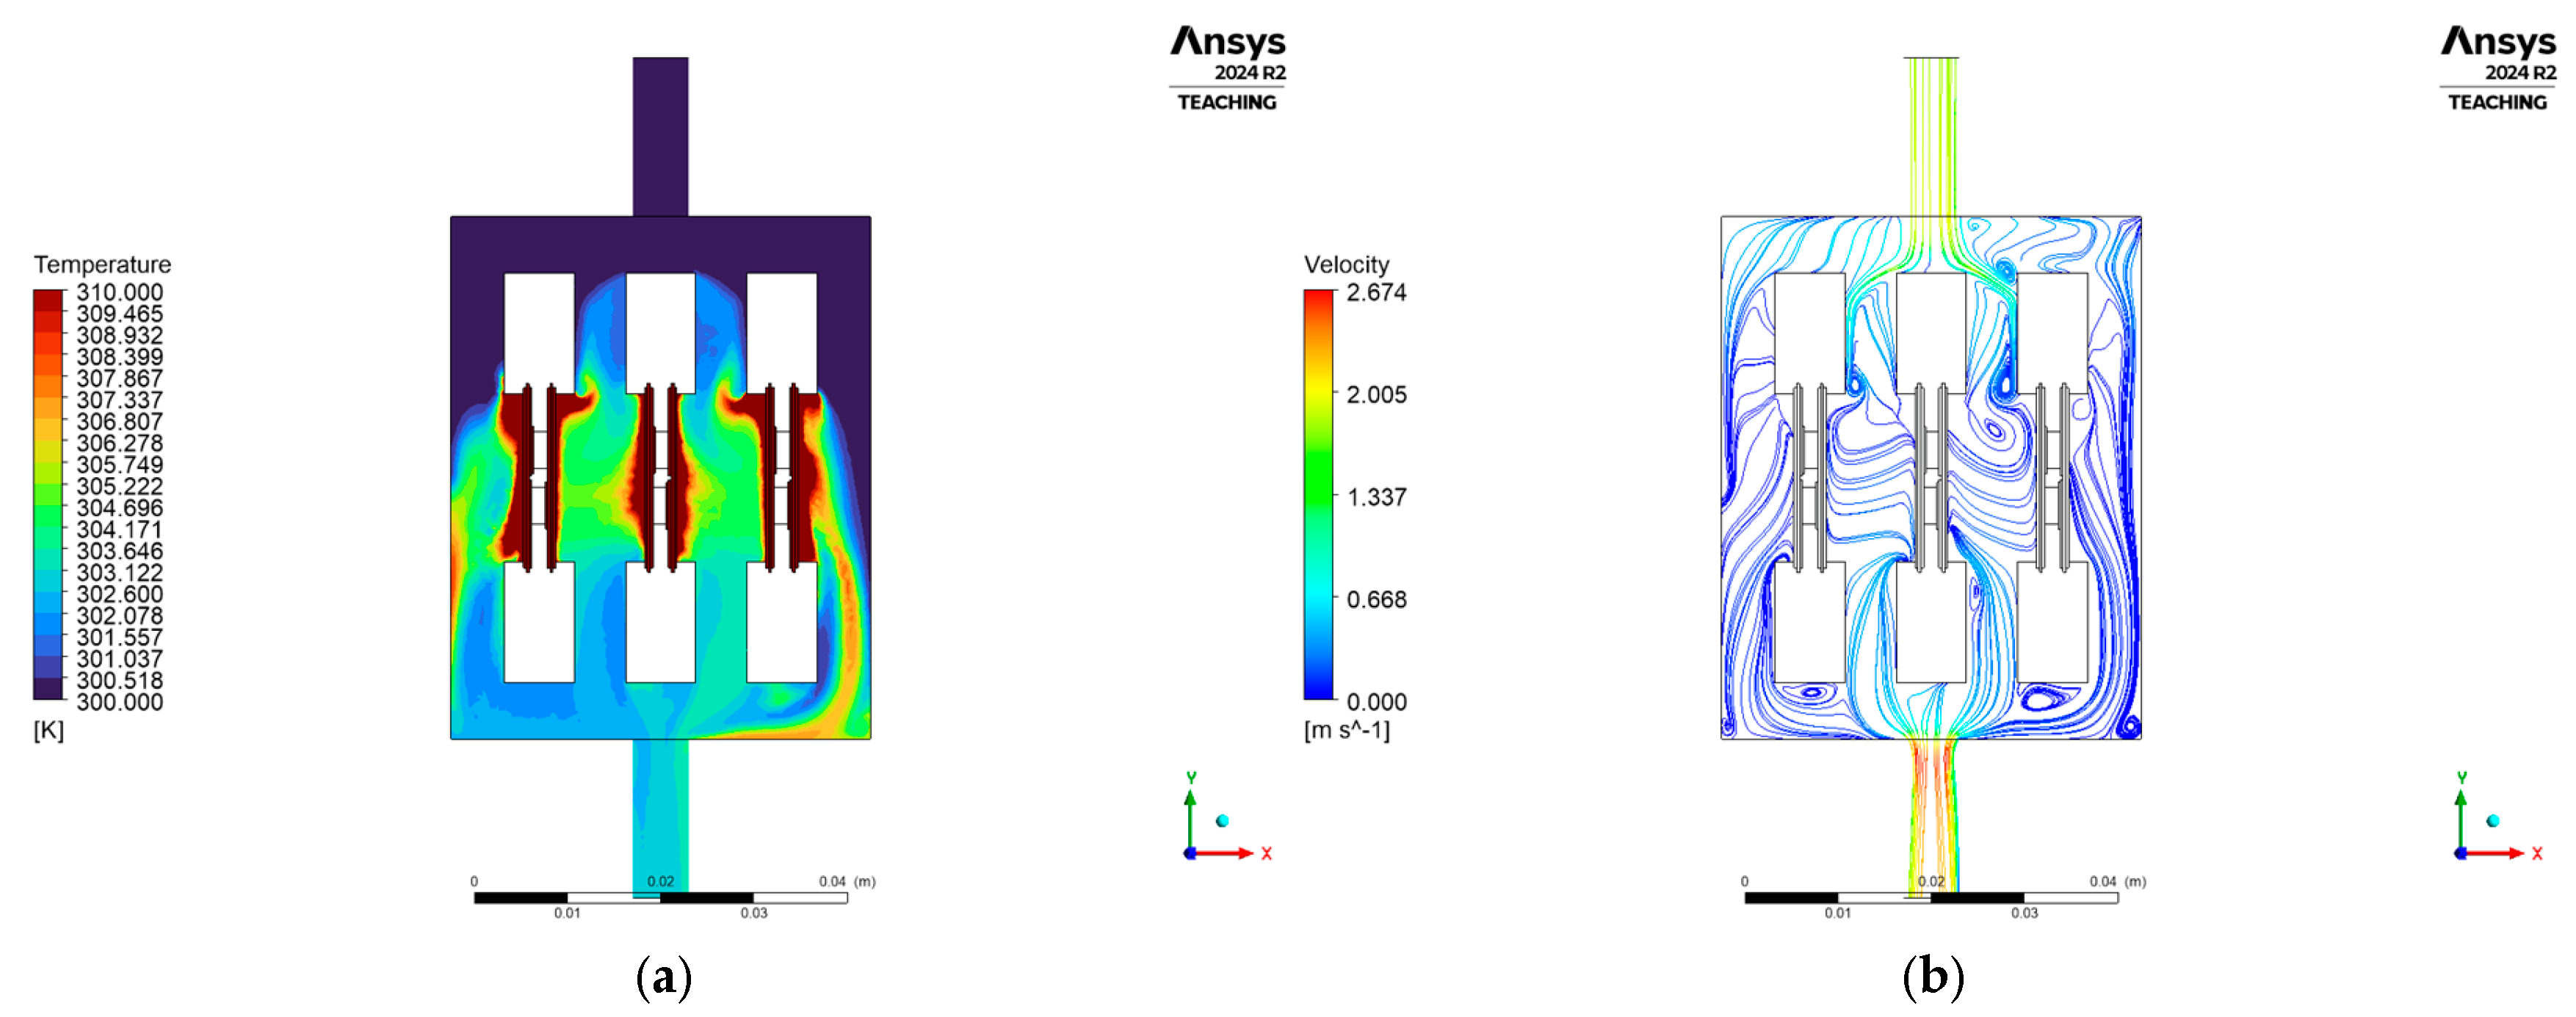
Figure 10.
GD cooling manifold simulation results: (a) Temperature contour; (b) Velocity streamlines.
Figure 10.
GD cooling manifold simulation results: (a) Temperature contour; (b) Velocity streamlines.
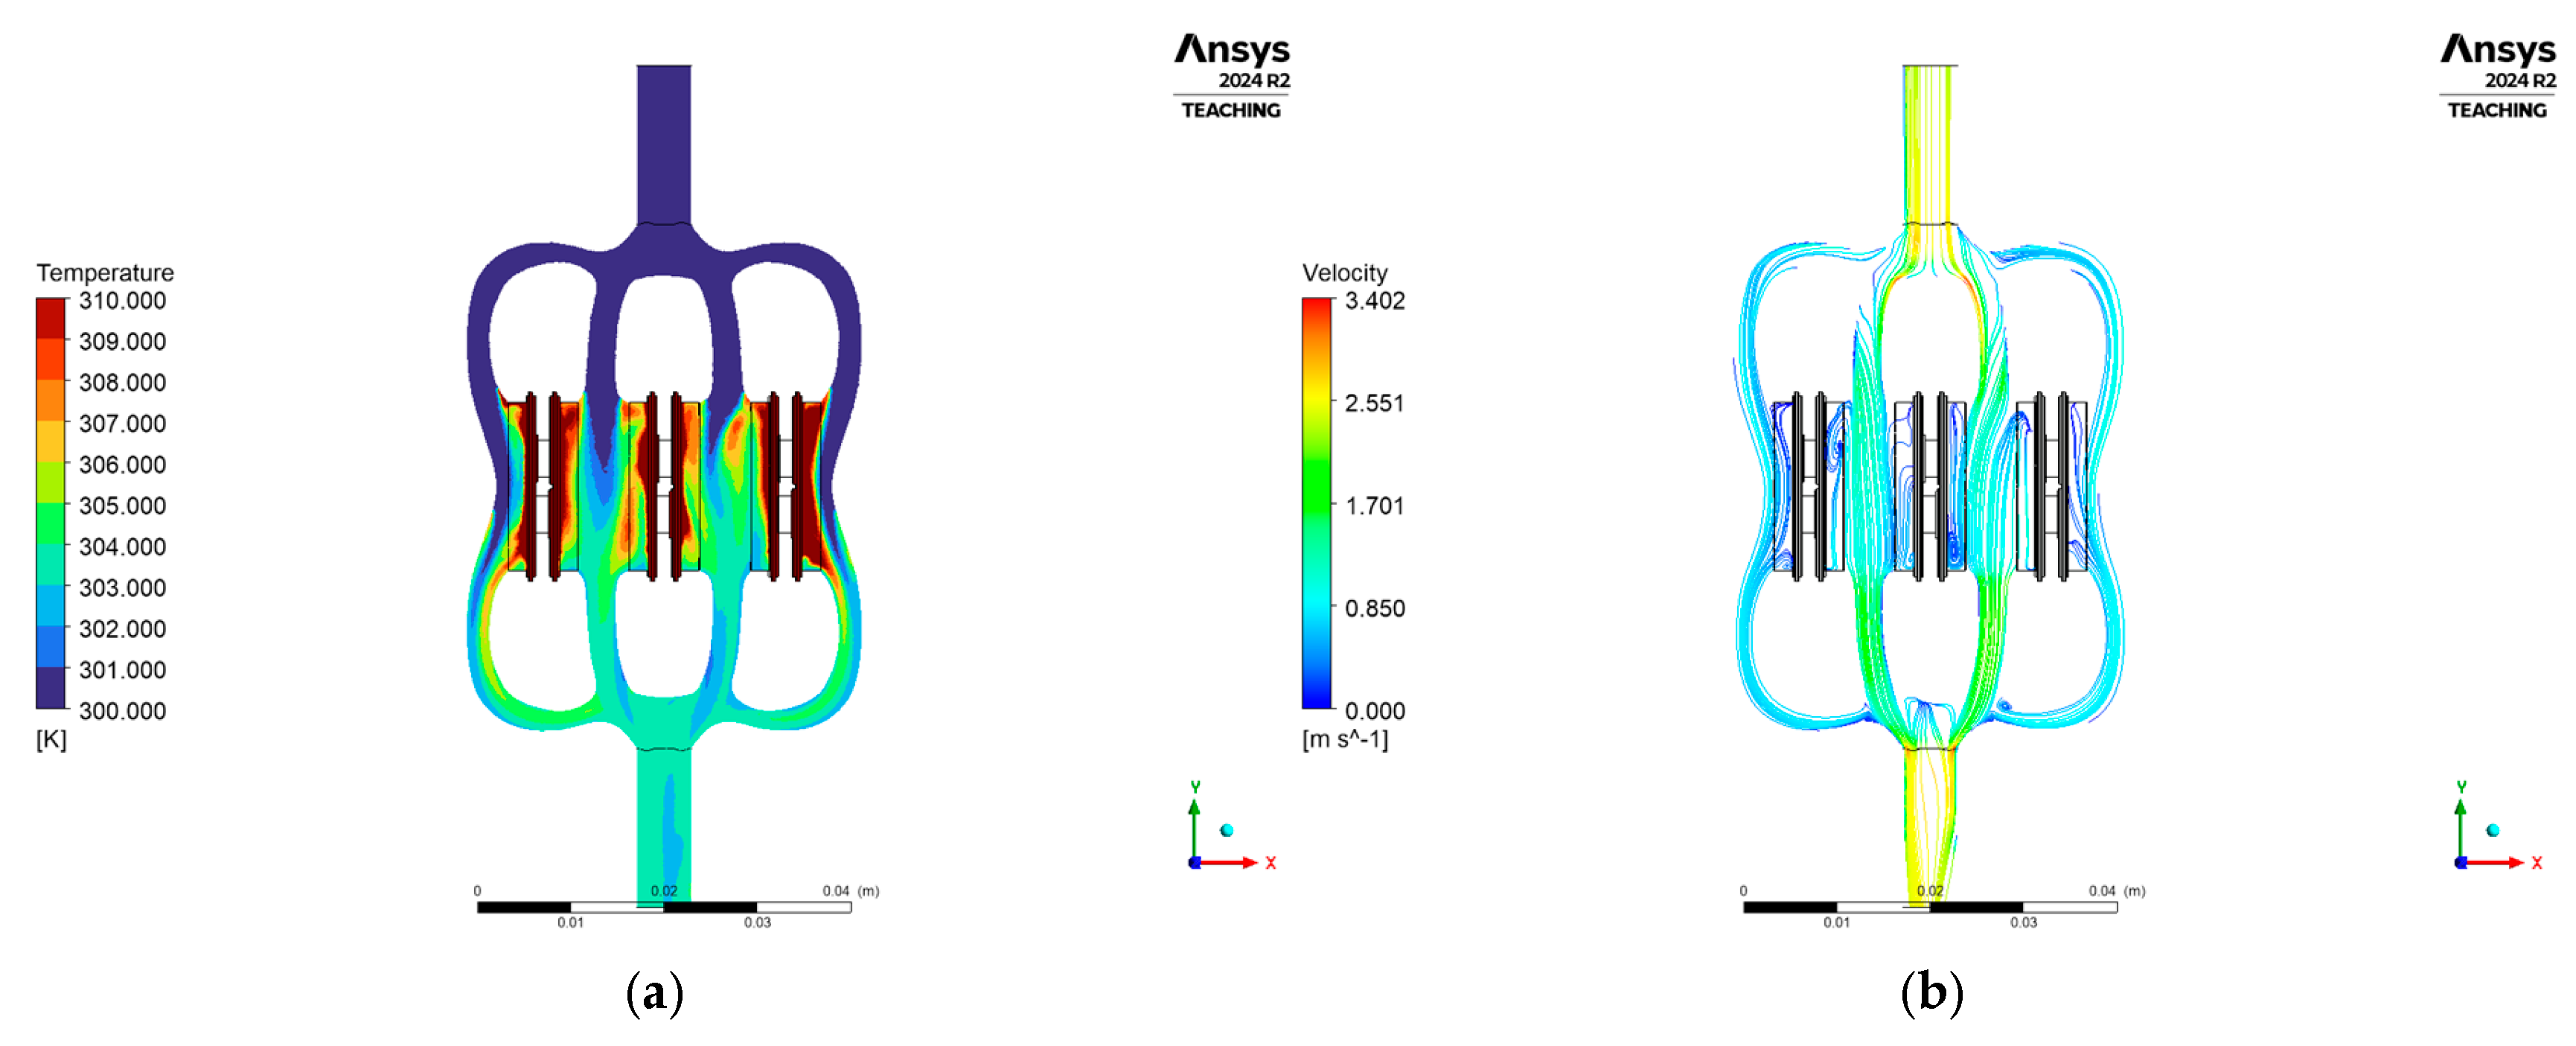
Figure 11.
Fabricated prototype of the GD cooling manifold.
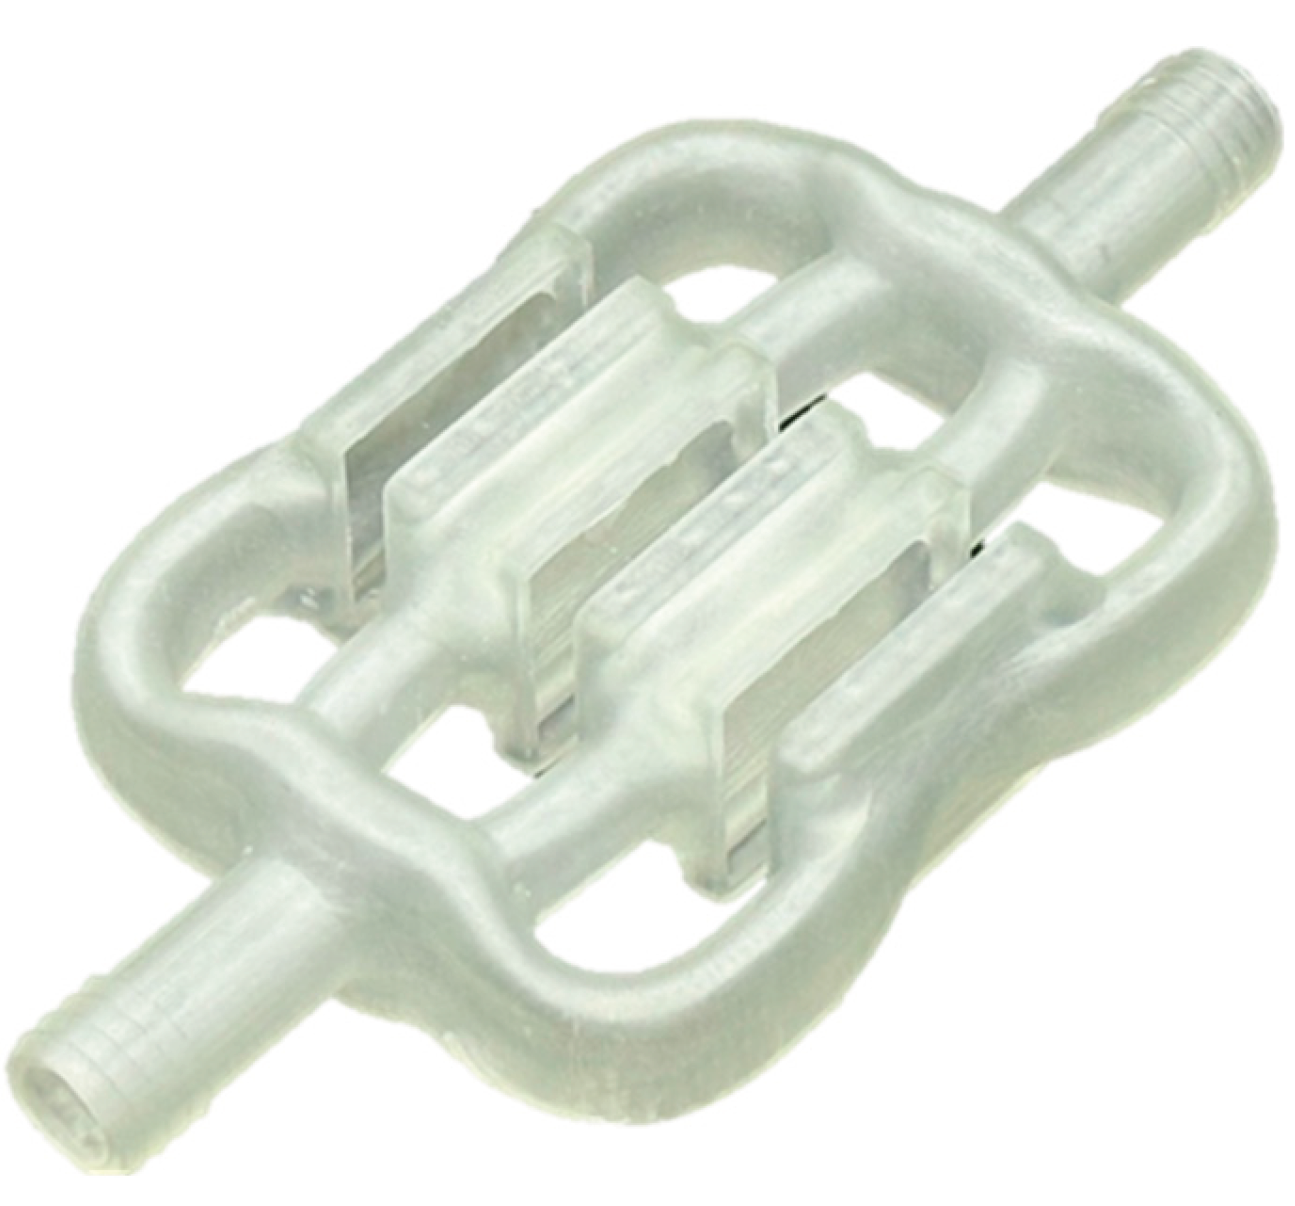

Table 1.
Material properties and assignments.
| Material | Density (kg/m3) | Specific Heat (J/kg·K) | Thermal Conductivity (W/m·K) | Component |
|---|---|---|---|---|
| Aluminum Nitride | 3299.9 | 736.62 | 169.86 | Substrate |
| Copper | 8978 | 381 | 387.6 | Substrate |
| Sintered Silver | 8500 | 234.28 | 175 | Inter-posts |
| Silicon Carbide | 3098.4 | 657.98 | 117.4 | MOSFETs |
| Water | 998.2 | 4182 | 0.6 | Fluid |
Table 2.
Mesh quality metrics.
| Mesh Metric | Baseline Manifold | GD Manifold |
|---|---|---|
| Element Quality | 0.8380 | 0.8378 |
| Aspect Ratio | 1.8548 | 1.8493 |
| Skewness | 0.2229 | 0.2252 |
| Orthogonal Quality | 0.7765 | 0.7737 |
Table 3.
Comparative performance summary of Baseline and GD manifold designs.
| Parameter | Baseline | GD | Percent Improvement |
|---|---|---|---|
| Mass (g) | 35.16 | 12.90 | 63.3% |
| Pressure Drop (Pa) | 3247.38 | 3411.80 | -5.1% |
| Average HTC (W/m²·K) | 3752.34 | 5256.97 | 40.1% |
| Average Chip Temperature (K) | 430.68 | 398.22 | 7.5% |
| Temperature Uniformity (K) | 21.99 | 5.13 | 76.6% |
Disclaimer/Publisher’s Note: The statements, opinions and data contained in all publications are solely those of the individual author(s) and contributor(s) and not of MDPI and/or the editor(s). MDPI and/or the editor(s) disclaim responsibility for any injury to people or property resulting from any ideas, methods, instructions or products referred to in the content. |
© 2026 by the authors. Licensee MDPI, Basel, Switzerland. This article is an open access article distributed under the terms and conditions of the Creative Commons Attribution (CC BY) license (http://creativecommons.org/licenses/by/4.0/).
Copyright: This open access article is published under a Creative Commons CC BY 4.0 license, which permit the free download, distribution, and reuse, provided that the author and preprint are cited in any reuse.


