
Submitted:
14 January 2026
Posted:
15 January 2026
You are already at the latest version
Abstract
Background/Objectives: Cocrystallisation is a well-established path for altering the physicochemical properties and bioavailability of active pharmaceutical ingredients (APIs). A common side effect of anti-tubercular medicines is depletion of group B vitamin reserves in TB patients. Co-administration of supplements such as pyridoxine (vitamin B6) during TB therapy may be used to ameliorate the harmful side effects of vitamin B6 deficiency. Methods: Mechanochemical grinding and solvent evaporation experiments using pyridoxine (PN) with 4-aminosalicylic acid (PAS) and separately with pyrazinecarboxylic acid (PCBA) were conducted. The bulk powder and crystal analysis was performed using FTIR, PXRD, DSC, TGA and SCXRD . Results: The isolation and characterization of two multicomponent salts containing pyridoxine, i.e., PN-PAS‧H2O and PN-PCBA. Mechanochemistry is an efficient method for the preparation of cocrystals. Conclusions: The drug-vitamin combinations may be useful for the development of new treatment regimens with improved therapeutic outcomes and reduced adverse effects.
Keywords:
TB
; cocrystallisation
; salt
; pyridoxine
; 4-aminosalicylic acid
; pyrazinecarboxylic acid
; mechanochemistry
; adjunctive cocrystal
; multicomponent crystals
1. Introduction
Tuberculosis (TB) is a bacterial infection caused by Mycobacterium tuberculosis, that is the second most infectious disease after COVID-19. It is ranked as the 13th leading cause of death worldwide with an estimated 10.6 million people having contracted TB in 2021, while about 1.6 million TB related deaths were reported over the same period [1]. TB is a treatable disease; however, it suffers from issues associated with drug resistance due to patient non-adherence to treatment regimens, health care providers prescribing the wrong treatment and the unavailability of medicines in some communities [1].
The first- and second-line therapies recommended by the WHO were introduced more than 50 years ago. The youngest member of the first-line quartet of drugs consisting of rifampicin, isoniazid, ethambutol and pyrazinamide was introduced in 1970 [1]. During this time first-line medicines have been linked with issues that include rifampicin, isoniazid and pyrazinamide resistance as well as isoniazid-induced pyridoxine deficiency, among others [2]. On the other hand, the second-line regimens are less effective, more toxic and are often requiring parenteral administration, which can cause significant patient discomfort [3].
The new drug ‘pipeline’ for TB is slow, and the process is costly with uncertain outcomes. The attrition rate of new medicines in preclinical and clinical development stages is high and ultimately leads to long periods between registration of new medicinal therapies. Only two new drug candidates, bedaquiline and delamanid, have reached the market within the last decade (2014) [4,5,6]. These issues have led to the repurposing and reuse of active pharmaceutical ingredients (APIs) to define new treatment regimens.
Cocrystallisation (i.e., cocrystal formation) is a well-established vehicle for the repurposing and reuse of existing APIs through the preparation of unique crystalline materials, which consist of two or more components that are atoms, ions or molecules. Cocrystallisation is based on crystal engineering principles that are well suited to the solid-state modification of physicochemical properties [7,8,9,10]. When suitable, pharmaceutically acceptable, coformers are chosen it may lead to cocrystals that possess altered physicochemical properties as well as an improved pharmacological efficacy. The formation of pharmaceutical cocrystals or salts through cocrystallisation has previously been used to address some of the aforementioned issues with TB therapy[11,12,13,14,15].
Mechanochemistry is defined as any chemical reaction induced by the direct absorption of mechanical energy [16]. These reactions are consistent with green chemistry owing to reduced or non-existent solvent use, improved atom economy, involvement of catalysts, minimal energy input and minimal waste production, among others [17]. Mechanochemistry is an efficient cocrystal screening or viability determination method that can be implemented to avoid multiple recrystallizations, or sublimation attempts in search of a suitable solvent, to negate solubility issues, to prevent the exposure of starting materials to harsh conditions and to minimize the waiting times associated with numerous recrystallisation attempts [18,19,20].
Our choice of API is based on an adjunctive approach to the selection of coformers (Scheme 1), which means the coformers can potentially enhance the efficacy of the API [21]. The APIs selected for the study are 4-aminosalicylic acid (PAS), pyrazinecarboxylic acid (PCBA), and pyridoxine (PN). The aim of our investigation is the preparation and characterization of multicomponent crystals of the selected APIs.
2. Materials and Methods
2.1. Materials
PN, PAS, and PCBA were purchased from Sigma-Aldrich, South Africa. Methanol (MeOH), ethyl acetate (EtOAc) and acetonitrile (MeCN) were purchased from Tag Solvent Products. Ultrapure water was produced using a RephiLe Direct-Pure Microsep®, Sandton, South Africa) and a 10-inch 4-stage prefiltration kit comprised of a 10 µm SupaSpun DOE prefilter, an anti-scale conditioning cartridge, a 5 µm SupaCarb activated carbon filter, and a 0.5 µm SupaSpun II Absolute filter. The water was filtered through a 0.2 µm PES high flux capsule filter at the collection point before use, and the water quality was 18.2 MΩ·cm at 25 °C, with a total organic carbon (TOC) level of < 2 ppb. All materials were used as received without any further purification.
2.2. Cocrystal Preparation
2.2.1. Solution Crystallization
Single crystals of PN-PAS·H2O (1) (1:1) were prepared by dissolving equimolar quantities of PN (0.065 mmol, 11.4 mg) and PAS (0.065 mmol, 10.4 mg) in a mixture of MeOH and EtOAc (ratio 1:3 v/v) at 45 °C to facilitate complete dissolution. The solution was left under ambient conditions (approximately 20 °C and 101.3 kPa) to slowly evaporate producing diffraction-quality crystals after several days. Single crystals of PN-PCBA (2) (1:1) were prepared by dissolving equimolar quantities of PN (0.08 mmol, 13.6 mg) and PCBA (0.08 mmol, 10.4 mg) in a mixture of MeOH and MeCN (ratio 1:3 v/v) at 50 °C to facilitate complete dissolution. The solution was left at approximately 20 °C to slowly evaporate, producing diffraction-quality crystals.
2.2.2. Mechanochemical Reactions (NG and LAG)
All products were prepared by grinding equimolar amounts of reactant APIs using a mechanical ball mill constructed from a Makita Jigsaw (Makita Corporation Japan) fitted with a 2748.99o mm3 milling steel capsule. Each grind was performed for 20 min at a frequency of 16 Hz, and each reaction used only a single stainless-steel ball with a 4.5 mm diameter. In the case of the liquid-assisted grinding (LAG) experiments, 15 μl of solvent was added to the reaction mixture prior to grinding. The LAG experiments were repeated four times, each time using a different solvent viz., MeOH, EtOAc, MeCN and H2O. No solvent was added to the neat grind (NG) experiments.
2.3. Single-Crystal X-Ray Diffraction (SCXRD)
Single-crystal X-ray Diffraction (SCXRD) was carried out using a Bruker D8 Venture diffractometer fitted with a PHOTON II CPAD detector (Bruker, Karlsruhe, Germany) and an Incoatec IμS 3.0 micro source combined with HELIOS optics. Mo-Kα radiation of wavelength 0.71073 Å was used for all data collections. Data was collected using ϕ- and ω-scans. An Oxford Cryosystems Cryostream 800 series was used for temperature control at 100(2) K. Data reduction was carried out by means of a standard procedure using the Bruker software package SAINT, and absorption corrections and correction of other systematic errors were performed using SADABS within APEX4 [22]. The structures were solved by direct methods using SHELXT [23] and refined using SHELXL [24]. X-Seed [25] was used as the graphical interface for the SHELX program suite. All atoms were refined anisotropically based on well-behaved isotropic temperature factors while hydrogen atoms were placed in idealized positions in a riding model, except when they were attached to heteroatoms; these were refined using observed peak heights in the difference Fourier map. The disorder of the aliphatic hydroxyl group observed in 1 was refined by summing the electron density for the two sites and calculating a percentage occupancy based on the electron density at each site, The site occupancy of the water molecule present in 1 is based on its proximity to the disordered aliphatic hydroxyl moiety.
2.4. Powder X-Ray Diffraction (PXRD)
Powder X-ray diffraction data were collected on a Bruker D2 phaser 2nd generation instrument (Bruker, Karlsruhe, Germany) fitted with Cu-Kα radiation source (λ = 1.54184 Å) and Lynxeye detector, with power settings of 30 kV and 10 mA. Data were collected over the 2θ range 5-40° with a step size of 0.04°.
2.5. Differential Scanning Calorimetry (DSC)
DSC experiments were performed on a Discovery DSC 250 (TA instruments, New Castle, USA). Samples were placed in sealed Tzero aluminium pans, heated at a rate of 10 K/min with nitrogen purge flow rate of 50 ml/min.
2.6. Thermogravimetric Analysis (TGA)
TGA was carried out on a PerkinElmer TGA 4000 instrument (Waltham, USA). Samples were placed in a 180 μl ceramic pan and heated in a ceramic furnace at 10 K/min with a nitrogen purge flow rate of 20 ml/min.
2.7. Fourier Transform Infrared-Attenuated Total Reflectance Spectroscopy (ATR-FTIR)
FTIR spectra were recorded using a PerkinElmer Spectrum TWO FTIR instrument fitted with a universal attenuated total reflectance accessory. The collection window was set to 4000 – 400 cm-1, using 32 scans at a scan speed of 0.2 cm-1/s. The samples prepared by mechanochemical milling were scanned without further processing while single crystals were dried on filter paper prior to crushing and scanning.
3. Results and Discussion
The investigation commenced with a viability study involving the milling of pairs of APIs in equimolar quantities under neat (NG) and liquid-assisted grinding (LAG) conditions. The LAG solvents were either polar protic or polar aprotic. The polar protic solvents used were water and methanol while the polar aprotic solvents used were ethyl acetate and acetonitrile. Henceforth, the products obtained from NG will be denoted 1a and 2a, the LAG products will be denoted 1b and 2b (acetonitrile), 1c and 2c (ethyl acetate), 1d and 2d (methanol), and 1e and 2e (water). The resulting products were characterized by PXRD, DSC, FTIR, and TGA, to establish multicomponent phase formation. When new phases (i.e., multicomponent phases) were detected, recrystallization experiments were carried out to obtain single crystals suitable for single-crystal X-ray diffraction. We commence with the single-crystal study first and report on the viability study last.
3.1. Crystal Structure Analysis
The two pyridoxine salts, 1 and 2, were recrystallized from a mixture of methanol and ethyl acetate in the case of 1 and methanol and acetonitrile in the case of 2. Crystal data for both salts are summarized in Table S1 (ESI). Salt formation was established based on changes in the individual bond lengths of the carboxylate moieties of PAS and PCBA, while electron density peaks near the nitrogen atom of the PN molecule, located in the difference Fourier map, were refined as hydrogen atoms.
Crystallizing in the monoclinic space group P21/c; the asymmetric unit of 1 (Figure 1) consists of a single molecule of PAS, a molecule of PN and a single water molecule with partial occupancy (s.o.f. = 0.63). The methyl hydroxy group located at the 3-position of the PN ring is disordered over two positions, where the methyl hydroxy group disorder is related to its proximity to the included water molecule. In the absence of the water molecule from the structure, the disordered methyl hydroxy group is co-planar to the pyridine ring of PN. When the water molecule is present, the methyl hydroxy group is rotated out of the plane of the ring, almost perpendicular to the mean plane of the ring. Therefore, the water molecule and the methyl hydroxy group have the same site occupancy value of 0.63 (or 63%) while in the absence of the water molecule the methyl hydroxy group has an occupancy of 0.37 (or 37%), as shown in Figure S1 (ESI). PN and PAS interact via a charge assisted N-H···O hydrogen bond involving the protonated pyridine nitrogen atom (N11) and the deprotonated carboxylate oxygen atom belonging to PAS (O12). The interaction is further supported by a weak C-H···O interaction between a neighboring methyl group (C81) of PN and the carboxylate oxygen atom of PAS (atom O22).
The packing arrangement of 1, when viewed down the a axis (onto the bc plane), shows a layer consisting of hydrogen bonded PN and PAS molecules in an extensive network that contains three intermolecular hydrogen bonded ring motifs. The first ring consists of five donor atoms and four acceptor atoms with a total of 25 atoms completing the ring (the graph set descriptor is (25)); while the second ring involves six donor atoms and four acceptor atoms with a total of 19 atoms completing the ring. Its graph set descriptor is (19), Figure 2(a) [23] and refined using SHELXL [26,23] and refined using SHELXL [27]. The third ring contains two donors, two acceptors and involves eight atoms ((8)). Successive layers are hydrogen bonded to each other via the interstitial water molecules and methyl hydroxy moieties which hydrogen bond to layers above and below (Figure 2(b)).
The asymmetric unit of 2 comprises a molecule each of PN and PCBA, which are hydrogen bonded to each other via a charge-assisted N-H···O interaction, as depicted in Figure 3. As with 1, PN and PBCA form a hydrogen bonded unit that is part of a larger hydrogen bonded network. One of the oxygen atoms (O12) of the carboxylate moiety of PCBA is bifurcated, forming two O-H···O hydrogen bonds to the methyl hydroxy moiety of two different PN molecules (O11 and O21).
The O11-H61···O12 and the N11-H11n···O22 hydrogen bonding interactions are repeated through a center of inversion, halfway along the b axis forming a centrosymmetric ring consisting of 20 atoms, four H-bond donor atoms and four H-bond acceptor atoms involving two PN molecules and two PCBA molecules. The graph set descriptor for this ring is and is highlighted in blue in Figure 4(a). [26,27] The second hydrogen bonded ring, at the center of the cell, is formed by a different set of PN and PCBA molecules. The bifurcated carboxylate atom (O12) hydrogen bonds with two different PN molecules through the oxygen atoms of the methyl hydroxy moieties located on the different molecules (O11-H61···O12 and O21-H71···O12), shaded green in Figure 4(a). The hydrogen bonding is repeated through the center of inversion at the center of the cell forming a ring with graph set descriptor . The third hydrogen bonded intermolecular ring consists of five donors and acceptors and involves 25 atoms to complete the ring. The three hydrogen bonded rings share atoms and molecules and combine to form corrugated sheets that span the crystal parallel to the c axis. The sheets are hydrogen bonded to each other by a single C81-H81c···N12 interaction, where the hydrogen bond donor and acceptors are in different layers, see Figure 4(b).
Diffractograms of the crystalline batches of 1 and 2 were compared to the simulated PXRD profiles of 1 and 2. An excellent correlation exists between the experimental and simulated diffractograms, even though the experimental profile of 1 shows evidence of unreacted starting materials (Figures S2a and S2b, ESI), as indicated by the asterisks in Figure 5.
3.2. Milling Experiments
After milling for approximately twenty minutes the products of the mechanochemical experiments were analyzed using PXRD, DSC, TGA and FTIR. The thermograms of the reactants were used as reference thermograms and used to compare the thermograms of the NG and LAG products.
The PXRD profiles of the mechanochemically prepared samples (1a, 1b, 1c, 1d, and 1e) were compared to the simulated profile 1sim, see Figure 6(a). The PXRD profiles of 1a, 1b, 1c, and 1d correlate poorly with the profile of 1sim owing to the presence of several peaks that belong to unreacted starting materials (PN and PAS). These peaks are indicated in Figure 6(a) with an asterisk. Moreover, 1a, 1b, and 1d correlate well with each other, suggesting that the mechanochemical preparation of the salt is less favorable than the preparation by solution recrystallisation. The profile of 1e does not match any of the other profiles and the mismatch can be attributed to the presence of the decomposition products of PAS when ground with water and the presence of reactants [28,29].
While the PXRD profiles of 1a, 1b, 1c, 1d, and 1e were a poor correlation to the profile of 1sim, the PXRD profiles for 2a, 2b, 2c, and 2d correlate well with the profile of 2sim. However, there are some additional peaks which correspond to the unreacted starting materials, indicated with an asterisk (Figure 6(b)). The only exception seems to be 2e, the LAG experiment performed using water as solvent has no obvious peaks that belong to the unreacted starting material and thus, implies a higher level of conversion when using water as the solvent during LAG and is in stark contrast to 1e, which appears to have decomposed.
The DSC thermograms for 1a, 1b, 1c, and 1d each exhibit two endotherms: a broad shallow endotherm in the range 50–90 °C, and a second sharp endotherm in the range 112–122 °C. The first set of endotherms correlate well with the observed weight loss in the range 45 to 80 °C on TGA and is probably the loss of solvent used during the milling process. The second set of endotherms are the melting endotherms occurring in a lower temperature range than the melting endotherms of the starting materials (see Figure S3, ESI), consistent with salt formation since it coincides with the melting endotherm of 1. However, the thermogram for 1e has a single large endotherm in the 65–90 °C range, that is immediately followed by the onset of decomposition, Figure 7(a).
These thermal events are also observed in the TGA thermograms, a mass loss in the range 65–90 °C followed by the onset of decomposition as depicted see Figure S4 of the ESI. Based on the work reported by Jivani et al. [28], and Perlovich et al. [29], we hypothesize that PAS, when exposed to H2O vapor and heat, may undergo decomposition [28,29].
Similarly, the thermograms for 2a, 2b, 2c and 2d exhibit two thermal events (endotherms), Figure 7(b). The first endotherm, in the range 122–129 °C, is probably due to the melting of unreacted starting materials remaining after milling, whereas the second sharp endotherm in the range 140–148 °C is likely the melting endotherm. This was confirmed using temperature cycled experiments followed by PXRD experiments of the products after temperature cycling, see Figures S5a and S5b of the ESI. The thermogram of 2e exhibits a single endotherm in the range 140–148 °C, which coincides with the melting endotherm of 2. None of the samples show any evidence of solvent loss during thermogravimetric analysis (Figure S6, ESI). All melting point onset and peak temperatures are reported in Table 1.
The FTIR spectrum of PAS is characterized by two amine bands ν(N-H) at 3494 and 3387 cm-1, a carbonyl stretch ν(C=O) at 1634 cm-1 and a broad ν(OH) band between 3095–2452 cm-1, while the spectrum of PN is characterized by a hydroxyl peak ν(OH) at 3278 cm-1, an aromatic amine band ν(C-N) centered at 1345 cm-1 and a secondary alcohol band ν(C-O) centered at 1067 cm-1, Figure S7 ESI. The amine bands belonging to PAS are retained in the spectra of 1a, 1b, 1c and 1d with peak positions shifting to lower wavenumbers, Figure 8(a). However, these peaks are split, doubling up on the number of peaks in the amine region, which is attributed to the presence of unreacted starting material. The hydroxyl and secondary alcohol bands present in the spectrum of PN are shifted relative to their position in the spectrum of pure PN (Figure S7). Two new broad bands are observed in the range 1900–2200 cm-1 and 2200–2800 cm-1.
The formation of these broad bands in this region is indicative of strong hydrogen bond formation between the sample components PAS and PN [30]. Apart from 1e, the bands are present in the spectra of all the milled samples. Table 2 provides a summary of the shifts in wavenumbers for pertinent functional groups.
The spectrum for pure PCBA contains two broad characteristic bands centered at 2214 cm-1 and 1884 cm-1 due to intermolecular hydrogen bonding between the carboxylic acid moiety and the aromatic nitrogen atom ν(O-Hacid···Naromatic) as well as a carbonyl stretch at 1715 cm-1 [30], see Figure S7 ESI. The milled samples possess several aspects of both starting materials which contribute substantially to the final spectra, especially for 2a, 2b, and 2c. The two broad bands centered at 2214 cm-1 and 1884 cm-1 ascribed to PCBA become less prominent in all the LAG spectra. The spectrum for 2a exhibits characteristic peaks for unreacted PCBA (at 3065, 2496, 1887 and 1716 cm-1); however, these occur at slightly shifted wavenumbers compared to the pure PCBA, Figure 8(b).
4. Conclusions
Mechanochemistry proved to be an efficient route for the rapid preparation of multicomponent forms; however, careful optimization remains essential for interpreting viability studies. Phase-verification analyses revealed the presence of unreacted starting materials, underscoring the need to employ complementary characterization techniques to confirm phase formation. For example, PXRD diffractograms clearly indicated residual starting materials (marked with asterisks), whereas the DSC data confirmed such residues only for compound 2. Despite several positive outcomes, solvent selection continues to be a critical factor in identifying conditions conducive to crystallization. Even a limited set of protic and aprotic solvents enabled systematic evaluation of solvent effects on the reaction outcomes.
- Water proved unsuitable for all systems: PAS decomposed under both LAG and recrystallisation conditions, while the PN–PCBA salt showed little to no unreacted material, exhibiting a single DSC event and a clean PXRD pattern.
- Both pyridoxine salts were obtained using LAG and NG methods, providing greener and operationally simple synthetic alternatives.
- The remaining solvents (MeOH, EtOAc and MeCN) yielded crystalline pyridoxine salts suitable for single-crystal structure determination.
The ability to obtain crystalline products remains central to comprehensive solid-state characterization. Importantly, the mechanochemical approach substantially reduced solvent-screening requirements, solvent consumption and the extended time frames typically associated with conventional recrystallisation workflows.
Supplementary Materials
The following supporting information can be downloaded at the website of this paper posted on Preprints.org, Table S1: Crystal data and structure refinement for 1 and 2, Figure S1: Observed disorder of the aliphatic hydroxyl group and the water molecule in structure of 1 (PN-PAS‧H2O, the colors represent the corresponding site occupancies), Figure S2a:The simulated and experimental PXRD profiles of 1 along with the profiles of the starting materials for 1, Figure S2b:The simulated and experimental PXRD profiles of 2 along with the profiles of the starting materials for 2, Figure S3: DSC thermograms of the starting materials, Figure S4: TGA thermograms for the crystalline and milling products of 1 (PN-PCBA), Figure S5a: DSC thermogram of 2a showing disappearance of the first endotherm after temperature cycling, Figure S5b: PXRD profiles of 2a and 2c before and after temperature cycling, Figure S6: TGA thermograms for the milling products of 2 (PN-PCBA), Figure S7: FTIR spectra of the starting materials.
Author Contributions
V.J.S. conceived and designed the study. T.A.M. carried out experimental data collection. T.A.M. wrote the original draft. All authors contributed to the writing and revision of all manuscripts including the approved final version.
Funding
This research was funded by the National Research Foundation (NRF) of South Africa (Grant Number 129774), Sandisa Imbewu and Rhodes University.
Data Availability Statement
The results obtained for all experiments performed are shown in the manuscript and Supplementary Materials, the raw data will be provided upon request. Crystallographic data for all compounds has been deposited at the CCDC (2517508, 2517506) and contain the supplementary crystallographic data for this paper.
Acknowledgments
T.A.M. gratefully acknowledges the contributions of Prof G. Watkins and the late Prof R.W.M. Krause for their guidance with FTIR spectra analysis.
Conflicts of Interest
The authors declare no conflicts of interest.
Abbreviations
The following abbreviations are used in this manuscript:
| API | Active pharmaceutical ingredient |
| NG | Neat grind |
| LAG | Liquid assisted grind |
References
- Global tuberculosis report 2022; License: CC BY-NC-SA 3.0 IGO; World Health Organization: Geneva, 2022.
- Louis, L.; Higgins, J.; Burbridge, T.N. Am. Rev. Respir. Dis. 1967, 96, 910–917.
- Mase, S.R.; Chorba, T. Clin Chest Med. 2019, 40, 775–795.
- Pai, M.; Behr, M.A.; Dowdy, D.; Dheda, K.; Divangahi, M.; Boehme, C.; Ginsberg, A.; Swaminathan, S.; Spigelman, M.; Getahun, H.; Menzies, D.; Raviglione, M.C. Nat. Rev. Dis. Primers 2016, 2, 1–23.
- Villemagne, B.; Crauste, C.; Flipo, M.; Baulard, A.R.; Déprez, B.; Willand, N. Eur. J Med. Chem. 2012, 51, 1–16. [CrossRef] [PubMed]
- Lienhardt, C.; Vernon, A.; Raviglione, M.C. Curr. Opin. Pulm. Med. 2010, 16, 186–193.
- Aakeröy, C.B.; Champness, N.R.; Janiak, C. CrystEngComm 2010, 12, 22−43.
- Aakeröy, C.B. Acta Crystallogr 1997, B53, 569−586.
- Desiraju, G.R. Acc. Chem. Res. 2002, 35, 565−573. [CrossRef]
- Elder, D.P.; Holm, R.; Diego, H.L.D. Int. J. Pharm. 2013, 453, 88–100. [CrossRef]
- Haddad and Winchester’s Clinical Management of Poisoning and Drug Overdose, 4th ed.; Haddad, L.M., Winchester, J.F., Shannon, M.W., Eds.; Saunders/Elsevier: Amsterdam, The Netherlands, 2007. [Google Scholar]
- Salem, A.; Khanfar, E.; Nagy, S.; Széchenyi, A. Int. J. Pharm. 2022, 623, 1–16. [CrossRef]
- Berge, S.M.; Bighley, L.D.; Monkhouse, D.C. Pharm. Sci. 197(66), 1–19.
- Duggirala, N.K.; Perry, M.L.; Almarsson, Ö.; Zaworotko, M.J. Chem Commun. 2016, 52, 640–655.
- Serajuddin, A.T.M. Adv. Drug Deliv. Rev. 2007, 59, 603–616. [PubMed]
- IUPAC. Compendium of Chemical Terminology, 2nd ed.; McNaught, A.D., Wilkinson, A., Eds.; Blackwell: Oxford; Scientific Publications, 1997. [Google Scholar]
- Ardila-Fierro, K.J.; Hernández, J.G. ChemSusChem 2021, 14, 2145–2162. [CrossRef] [PubMed]
- Fris, T.; Lancaster, R.W.; Fa, L.; Karamertzanis, P.G. Proc. Natl. Acad. Sci. 2010, 107, 13216−13221.
- Caira, M.R.; Nassimbeni, L.R.; Wildervanck, A.F.J. Chem. Soc. Perkin Trans. 1995, 2, 2213−2216.
- Carstens, T.; Haynes, D.A.; Smith, V.J. Cocrystals: Solution, Mechanochemistry and Sublimation. Cryst. Growth Des. 2019, 20, 1139–1149. [Google Scholar] [CrossRef]
- Bolla, G.; Sarma, B.; Nangia, A.K. Chem. Rev. 2022, 122, 11514–11603. [CrossRef] [PubMed]
- APEX4, SAINT, and SADABS; Bruker AXS Inc.: Madison, WI, USA, 2016.
- Sheldrick, G.M. Acta Crystallogr Sect A Found Adv 2015, 71, 3–8.
- Sheldrick, G.M. Acta Crystallogr Sect C Struct Chem. 2015, 71, 3–8. [CrossRef]
- Barbour, L.J. J. Supramol. Chem. 2001, 1, 189–191. [CrossRef]
- Etter, M.C. Acc. Chem. Res. 1990, 23, 120–126.
- Etter, M.C.; MacDonald, J.C.; Berstein, J. Acta Cryst 1990, B46, 256–262.
- Jivani, S.G.; Stella, V. Pharm. Sci. 1985, 74, 1274–1282. [CrossRef]
- Drozd, K.V.; Manin, A.N.; Churakov, A.V.; Perlovich, G.L. Eur. J. Pharm. Sci. 2017, 99, 228–239. [CrossRef]
- de Almeida, A.C.; Ferreira, P.O.; Torquetti, C.; Ekawa, B.; Carvalho, A.C.S.; Santos, E.C.D.; Caires, F.J. J Therm Anal. Calorim. 2020, 140, 2293–2303.
Scheme 1.
Molecular diagrams of PAS, PCBA, INH and PN.
Figure 1.
The labelled asymmetric unit of 1 containing a molecule each of PN and PAS and a water molecule with partial occupancy.
Figure 1.
The labelled asymmetric unit of 1 containing a molecule each of PN and PAS and a water molecule with partial occupancy.
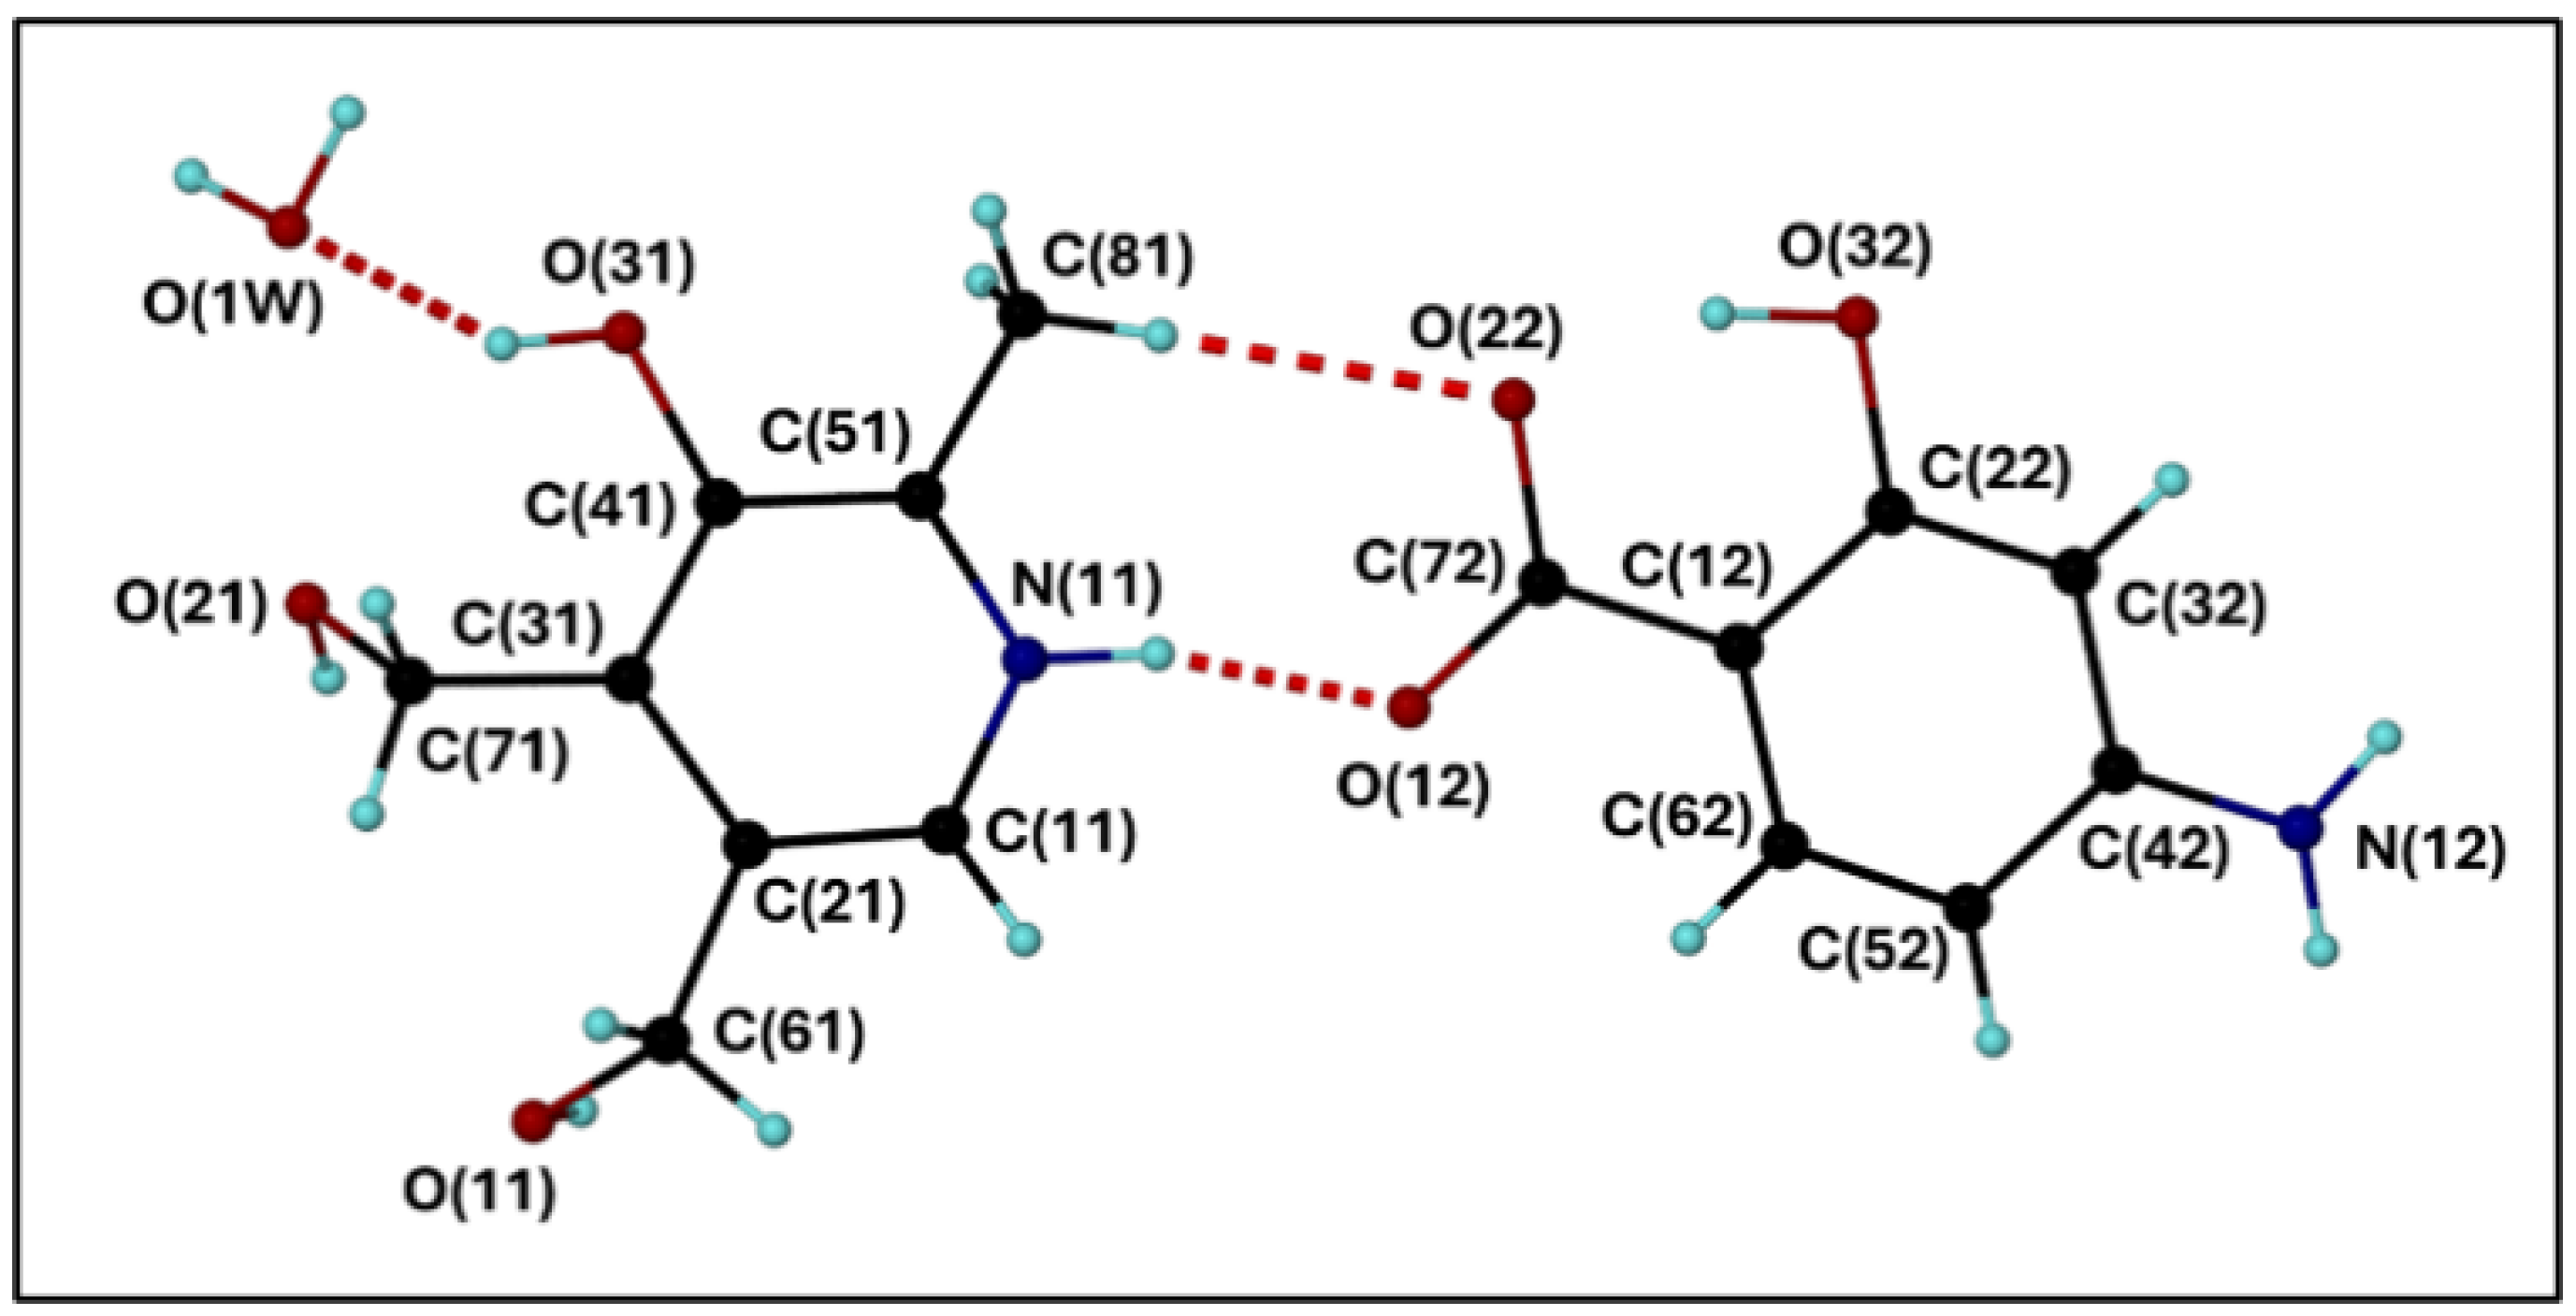
Figure 2.
(a) The bc plane depicting the intricate hydrogen bonding network and motifs. (b) The view down the b axis showing how consecutive layers is linked via hydrogen bonds. (purple = water molecules, green = oxygen atoms belonging to molecules in layers above and below).
Figure 2.
(a) The bc plane depicting the intricate hydrogen bonding network and motifs. (b) The view down the b axis showing how consecutive layers is linked via hydrogen bonds. (purple = water molecules, green = oxygen atoms belonging to molecules in layers above and below).
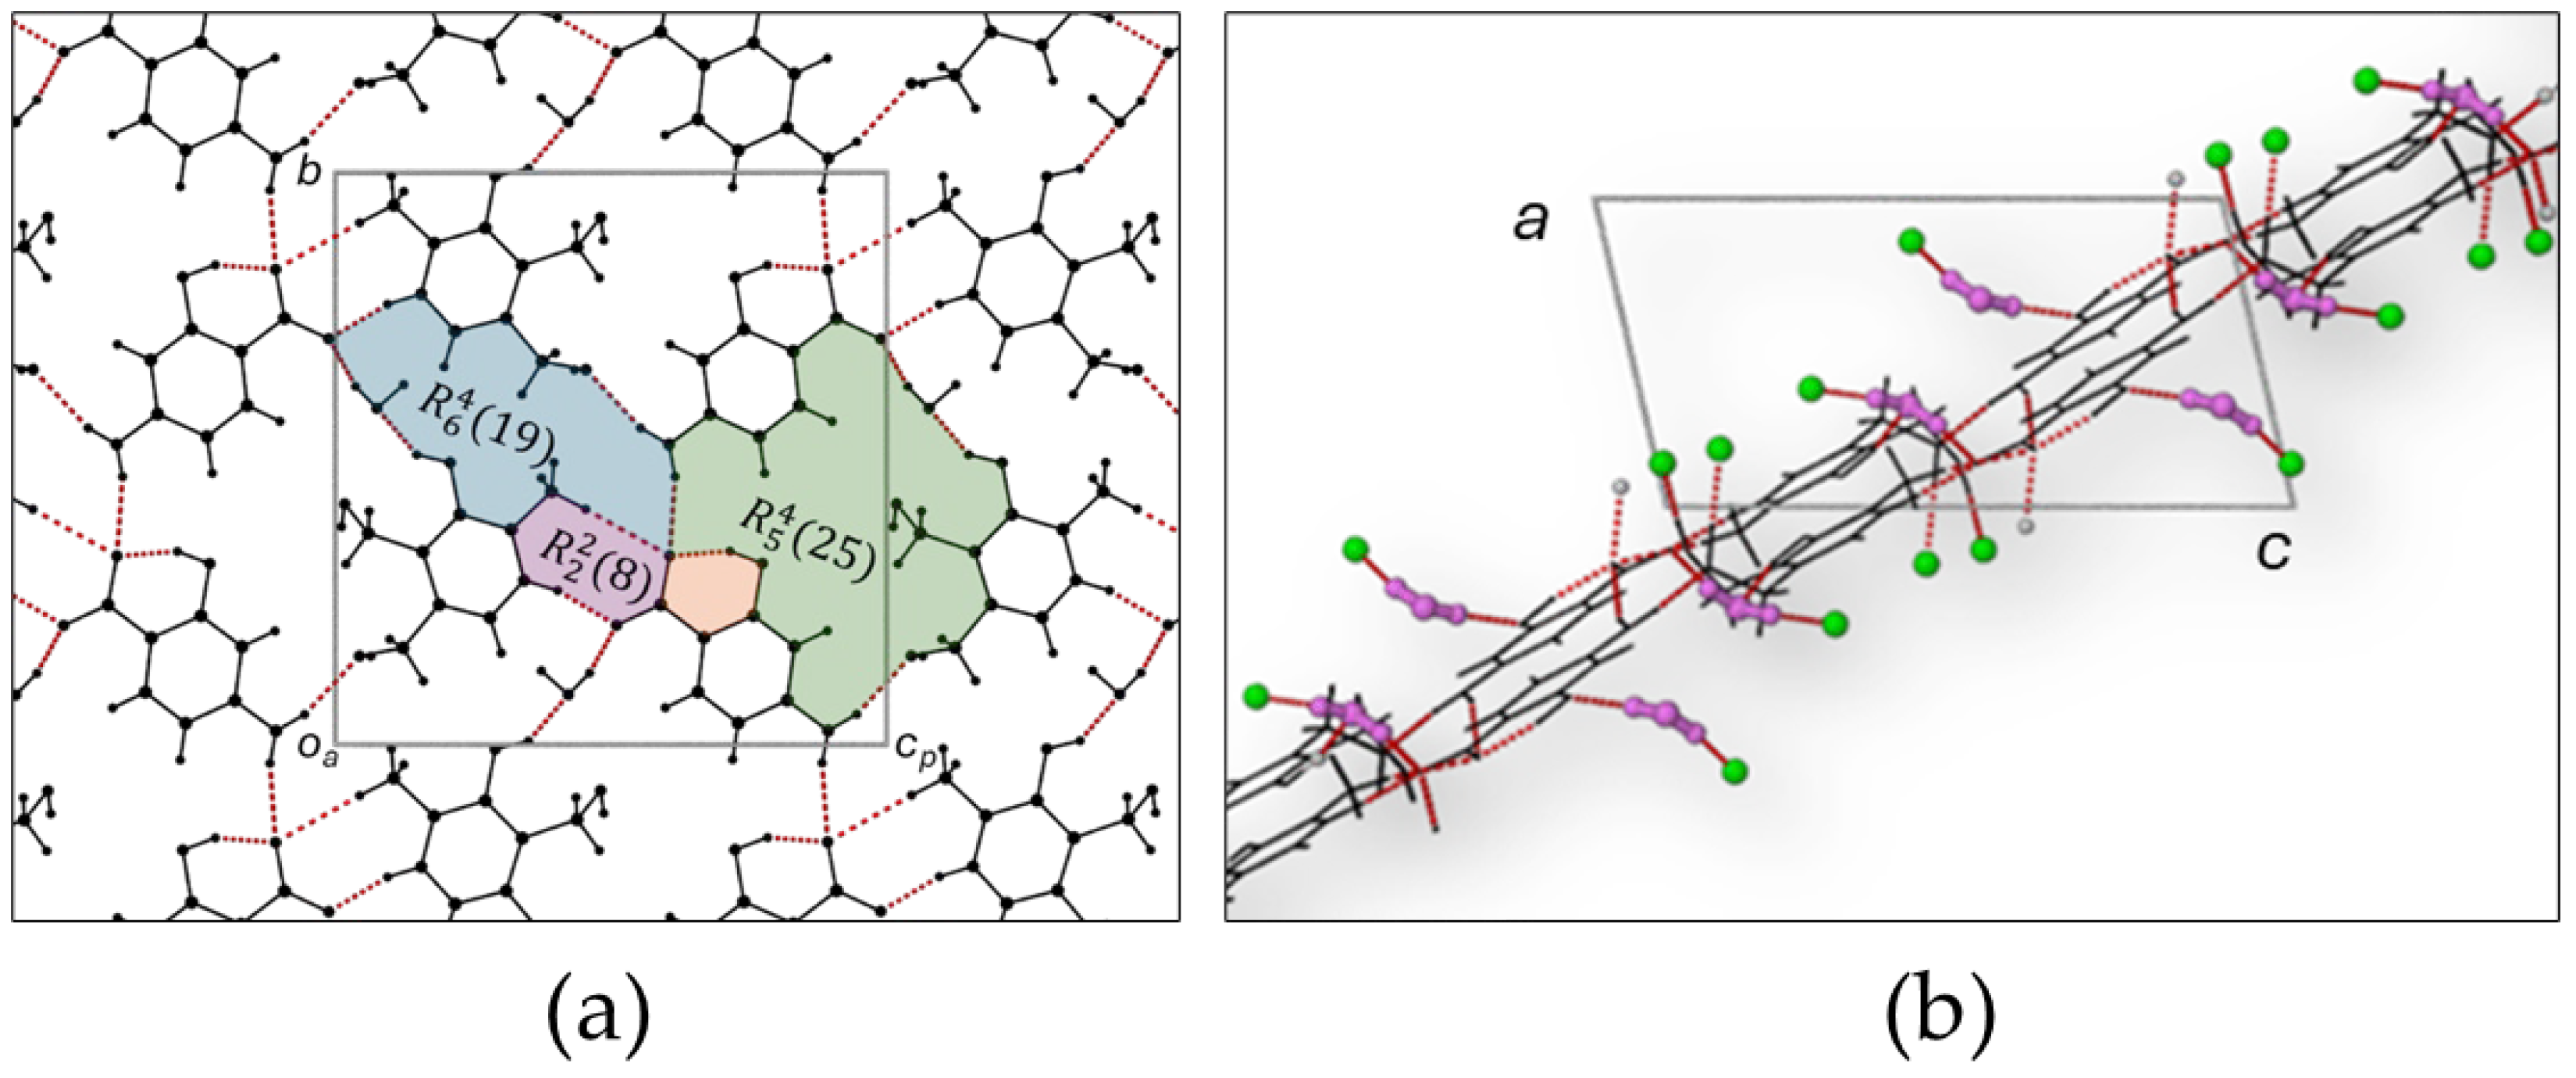
Figure 3.
The labelled asymmetric unit of 2 containing a molecule each of PN and PCBA.
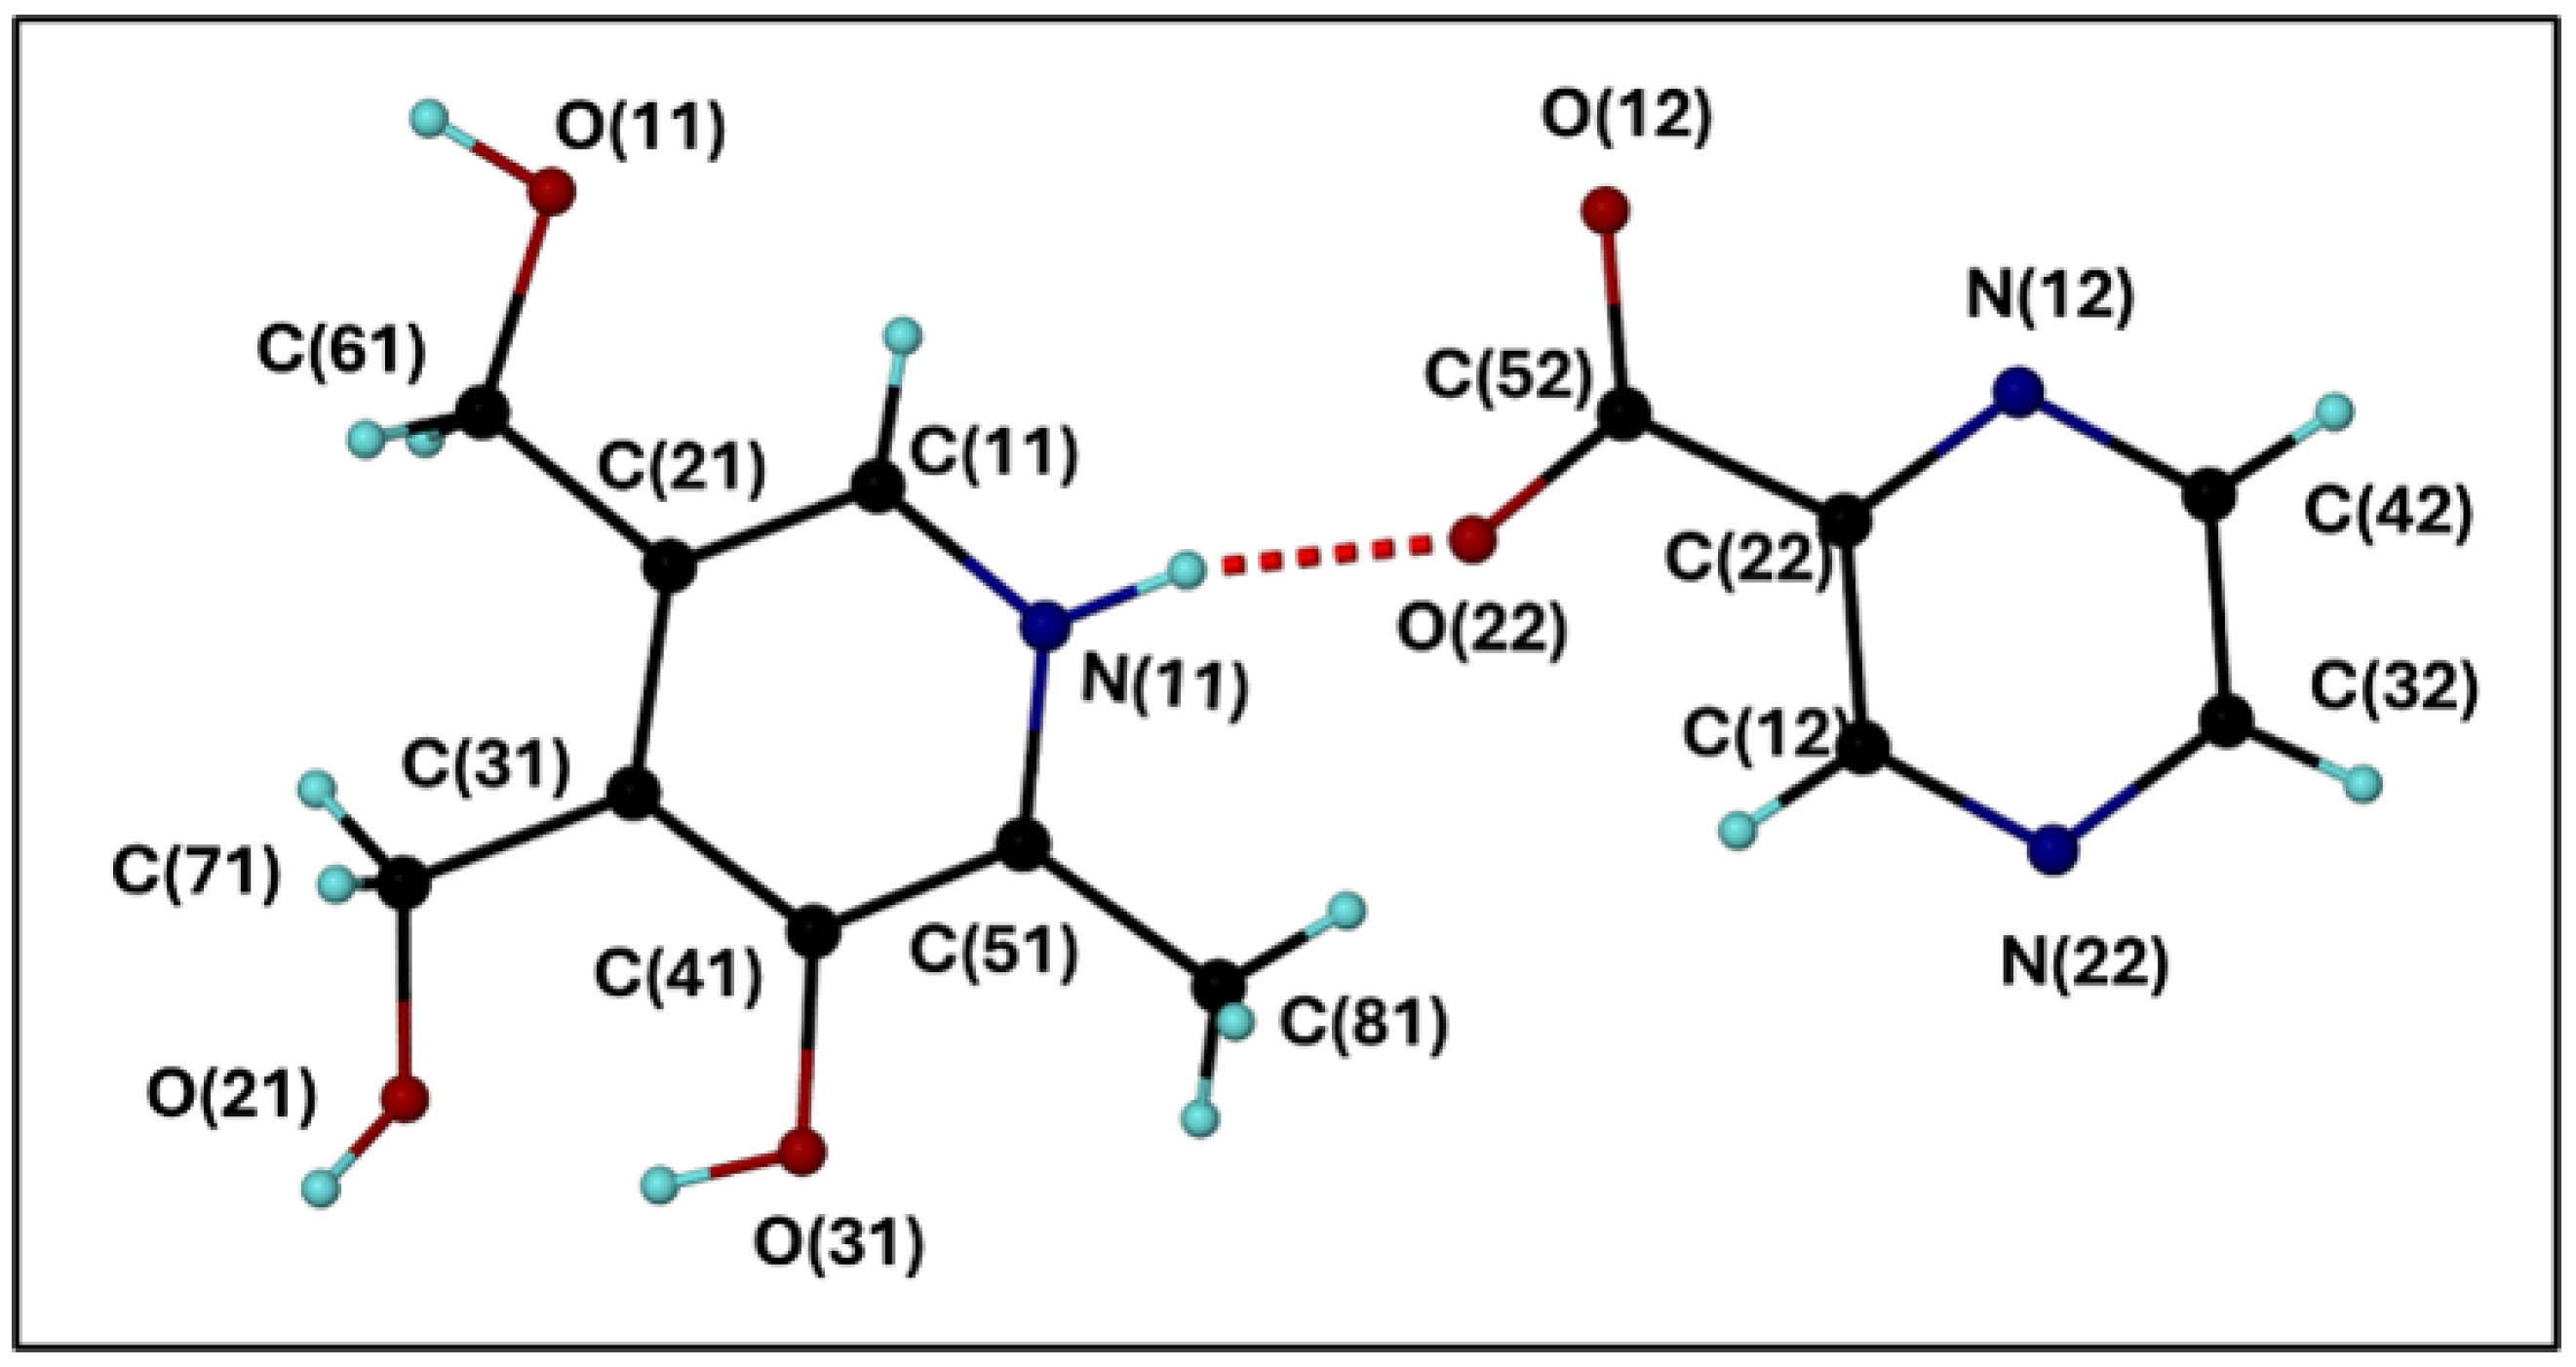
Figure 4.
(a) The bc plane depicting the hydrogen bonding network and hydrogen bonding motifs. (b) View along the diagonal showing the zigzag arrangement of layers. Consecutive layers are hydrogen bonded to each other.
Figure 4.
(a) The bc plane depicting the hydrogen bonding network and hydrogen bonding motifs. (b) View along the diagonal showing the zigzag arrangement of layers. Consecutive layers are hydrogen bonded to each other.
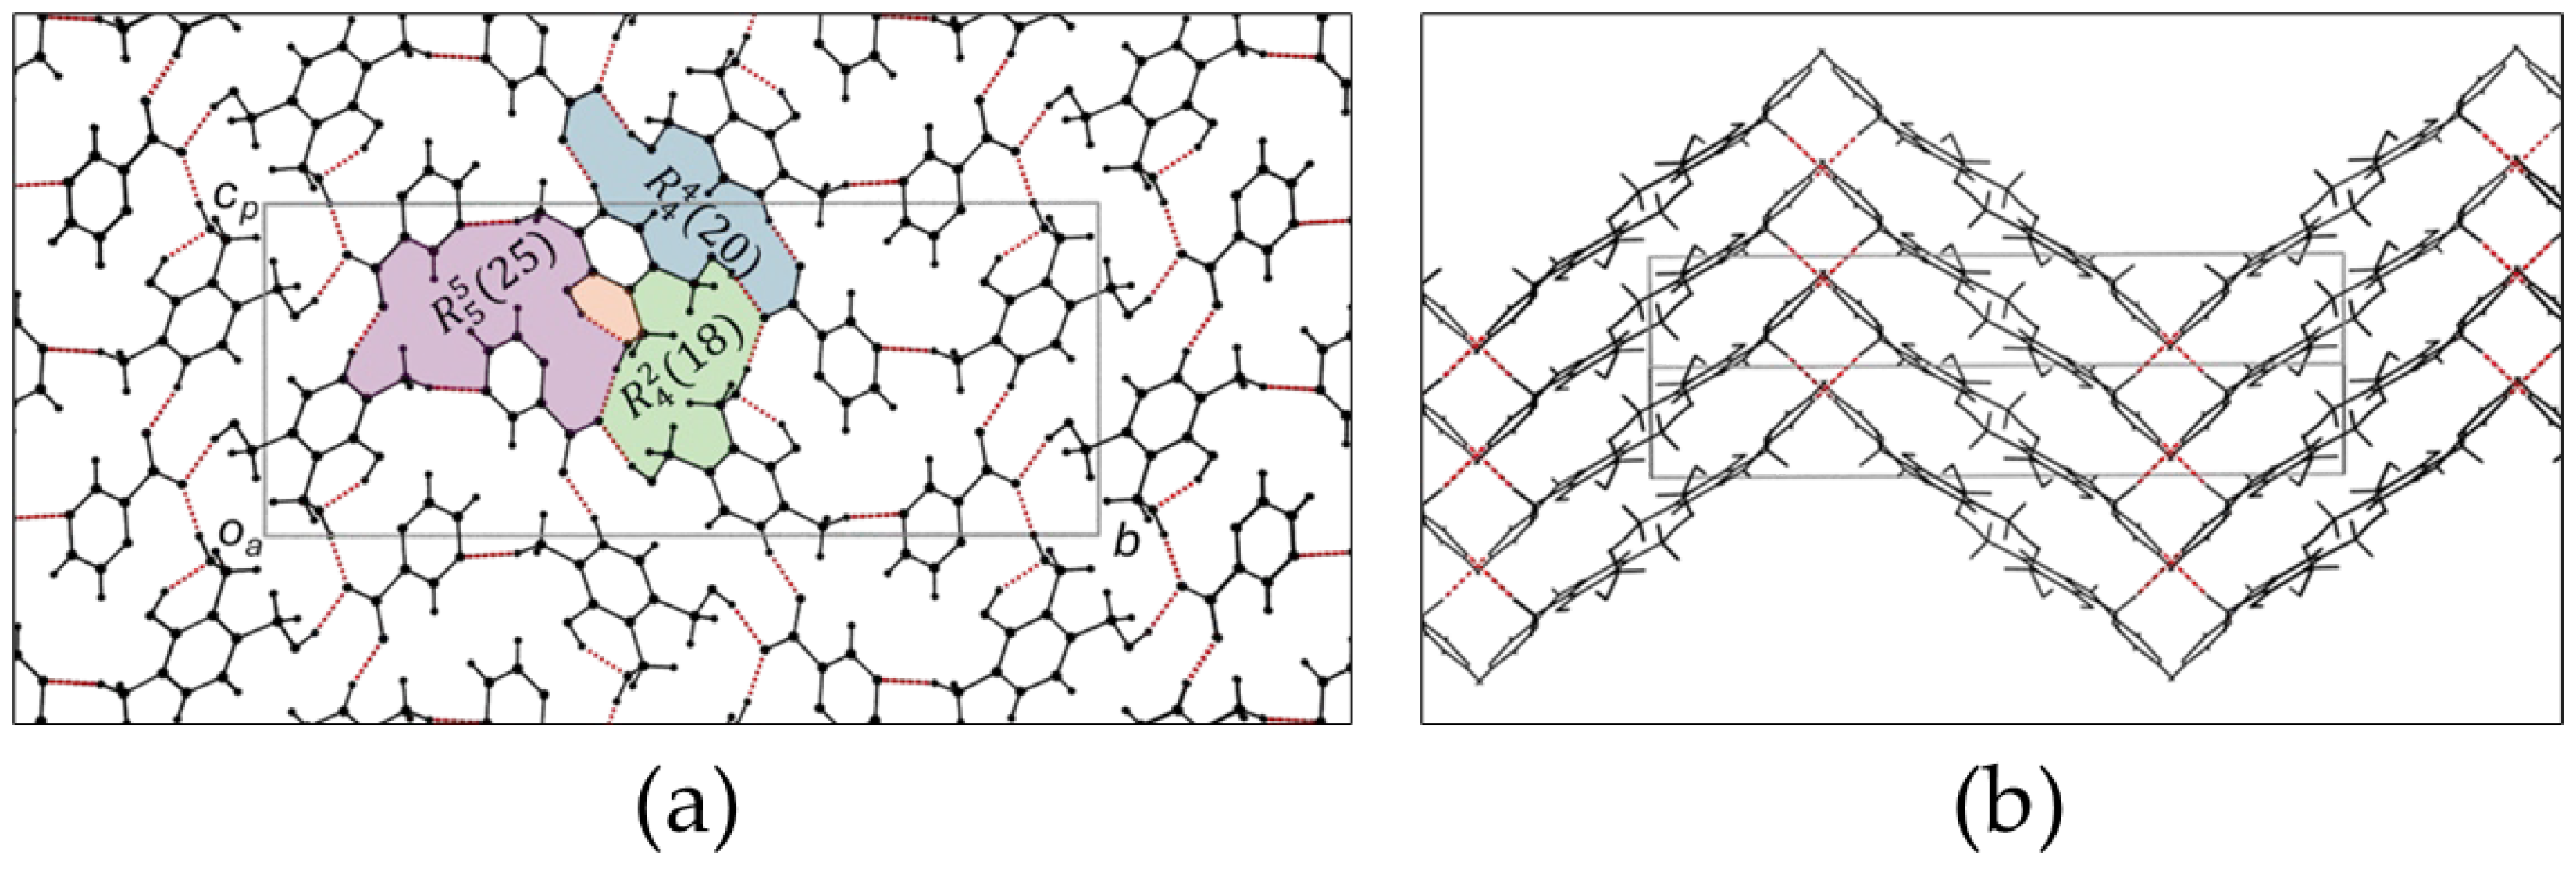
Figure 5.
Comparison of the experimental and simulated PXRD profiles for compounds 1 and 2. The asterisks in the experimental profile of 1 indicate peaks related to unreacted starting material.
Figure 5.
Comparison of the experimental and simulated PXRD profiles for compounds 1 and 2. The asterisks in the experimental profile of 1 indicate peaks related to unreacted starting material.
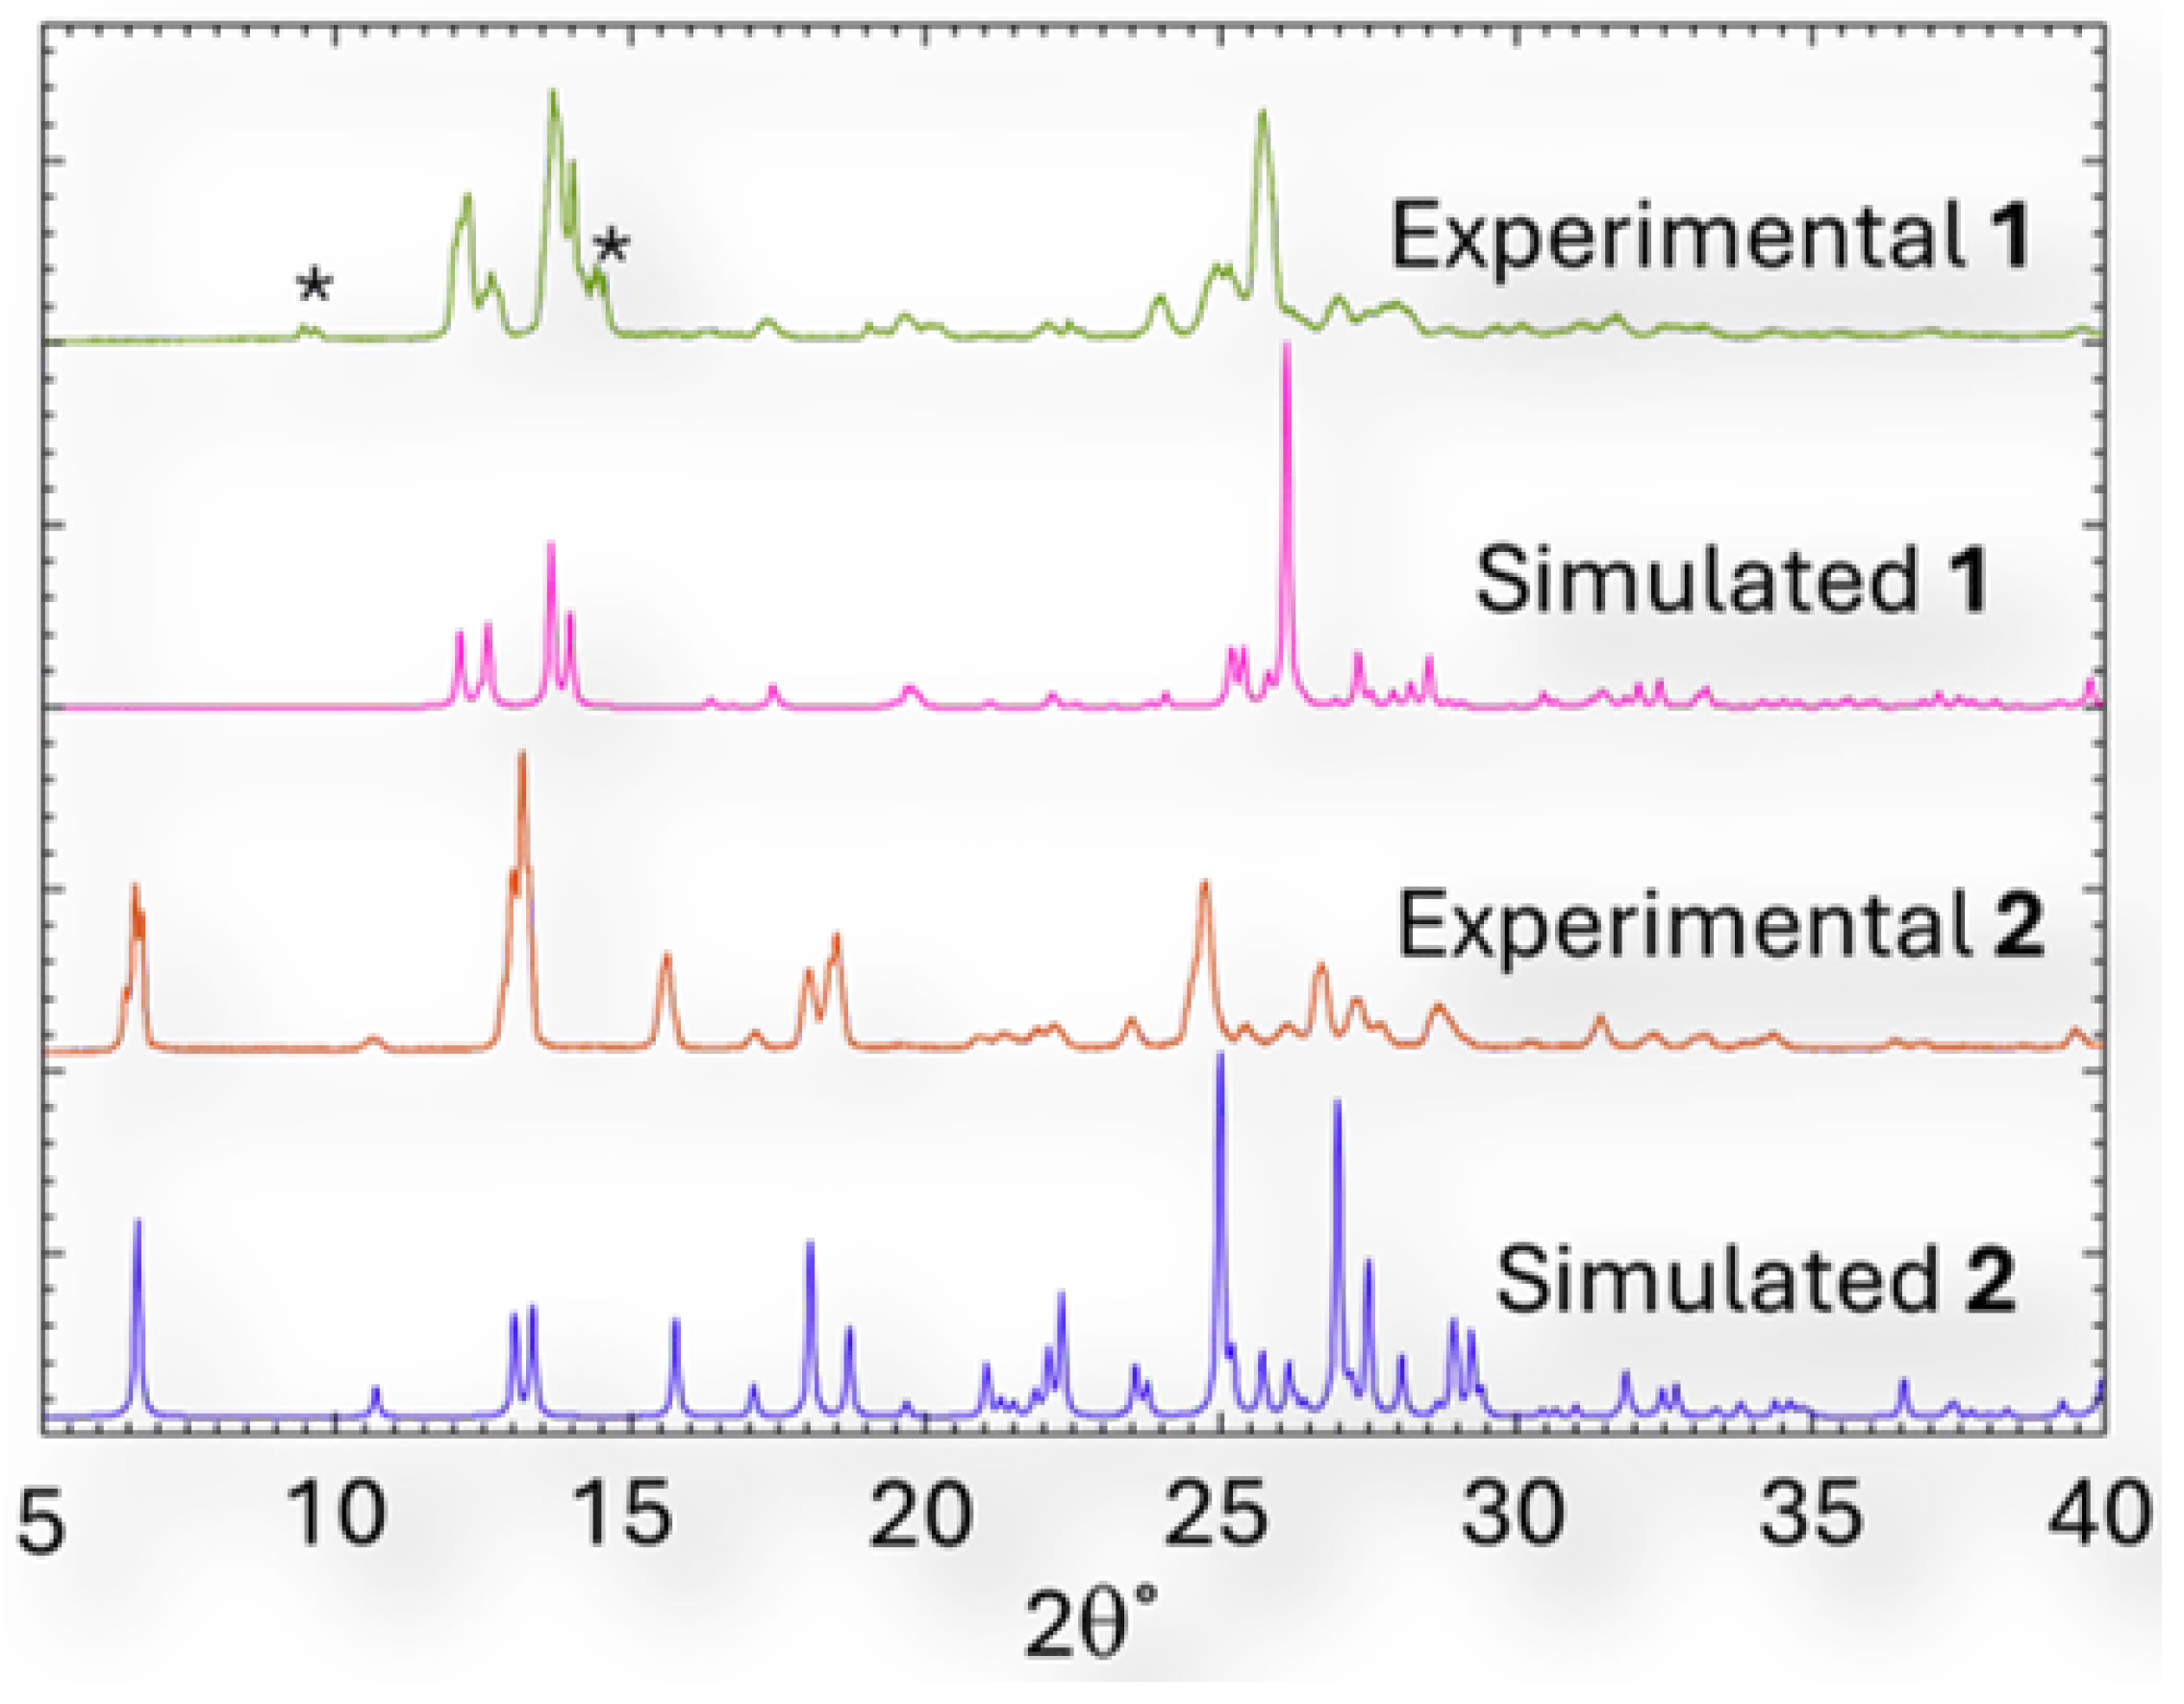
Figure 6.
PXRD profiles of the simulated and mechanochemical preparations of: (a) 1 and (b) 2.
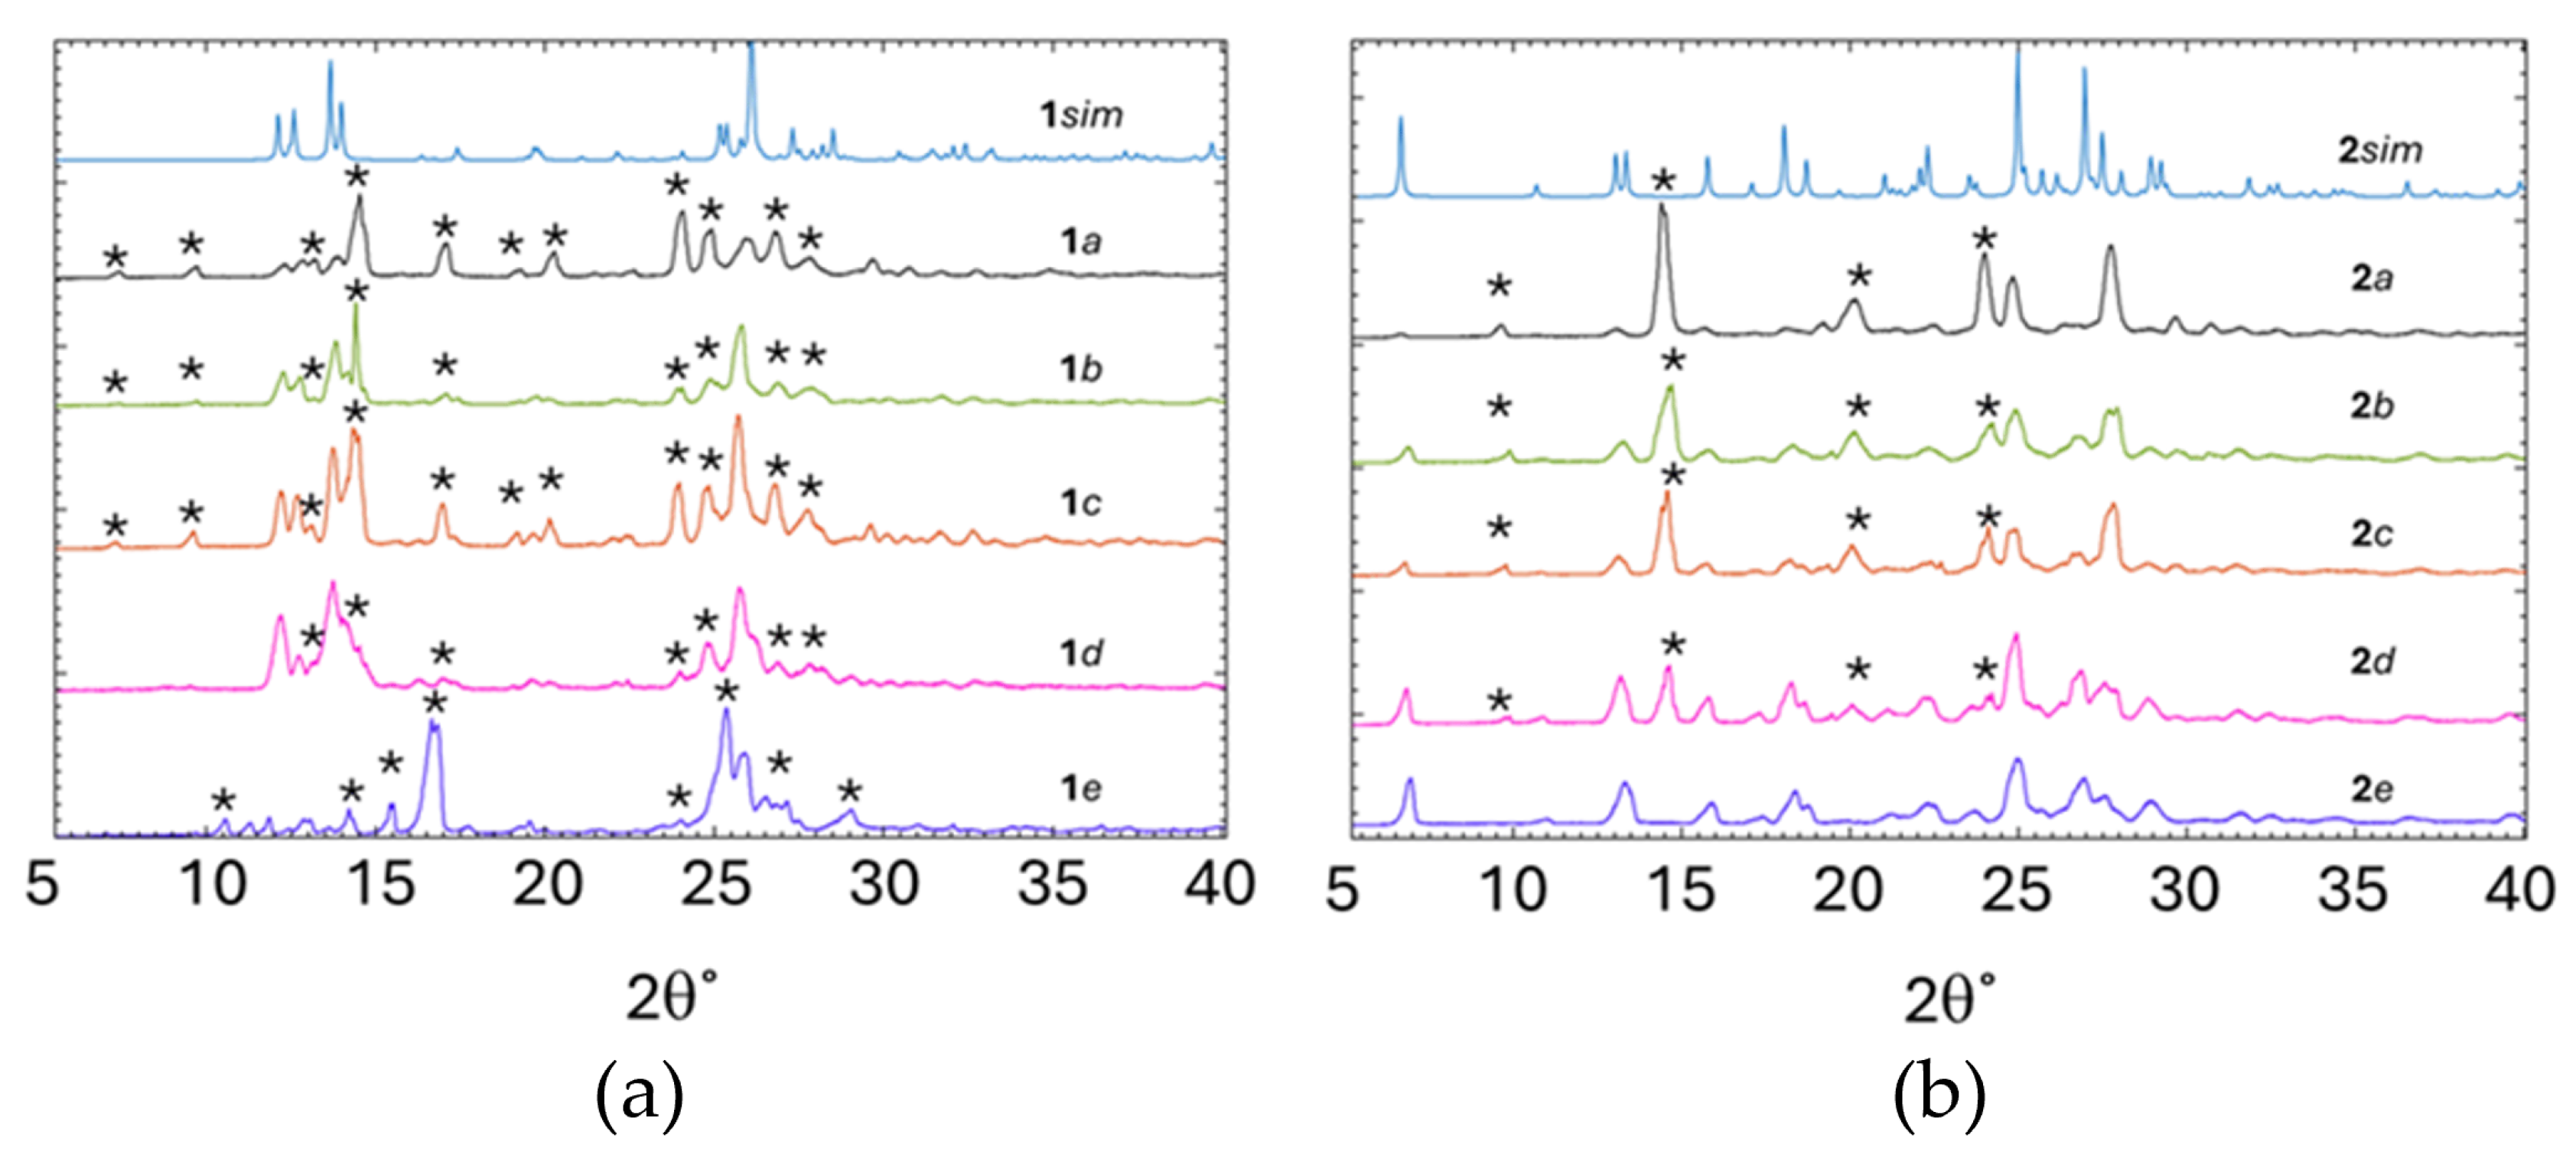
Figure 7.
DSC thermograms of the milling samples and crystalline products of: (a) 1 and (b) 2.
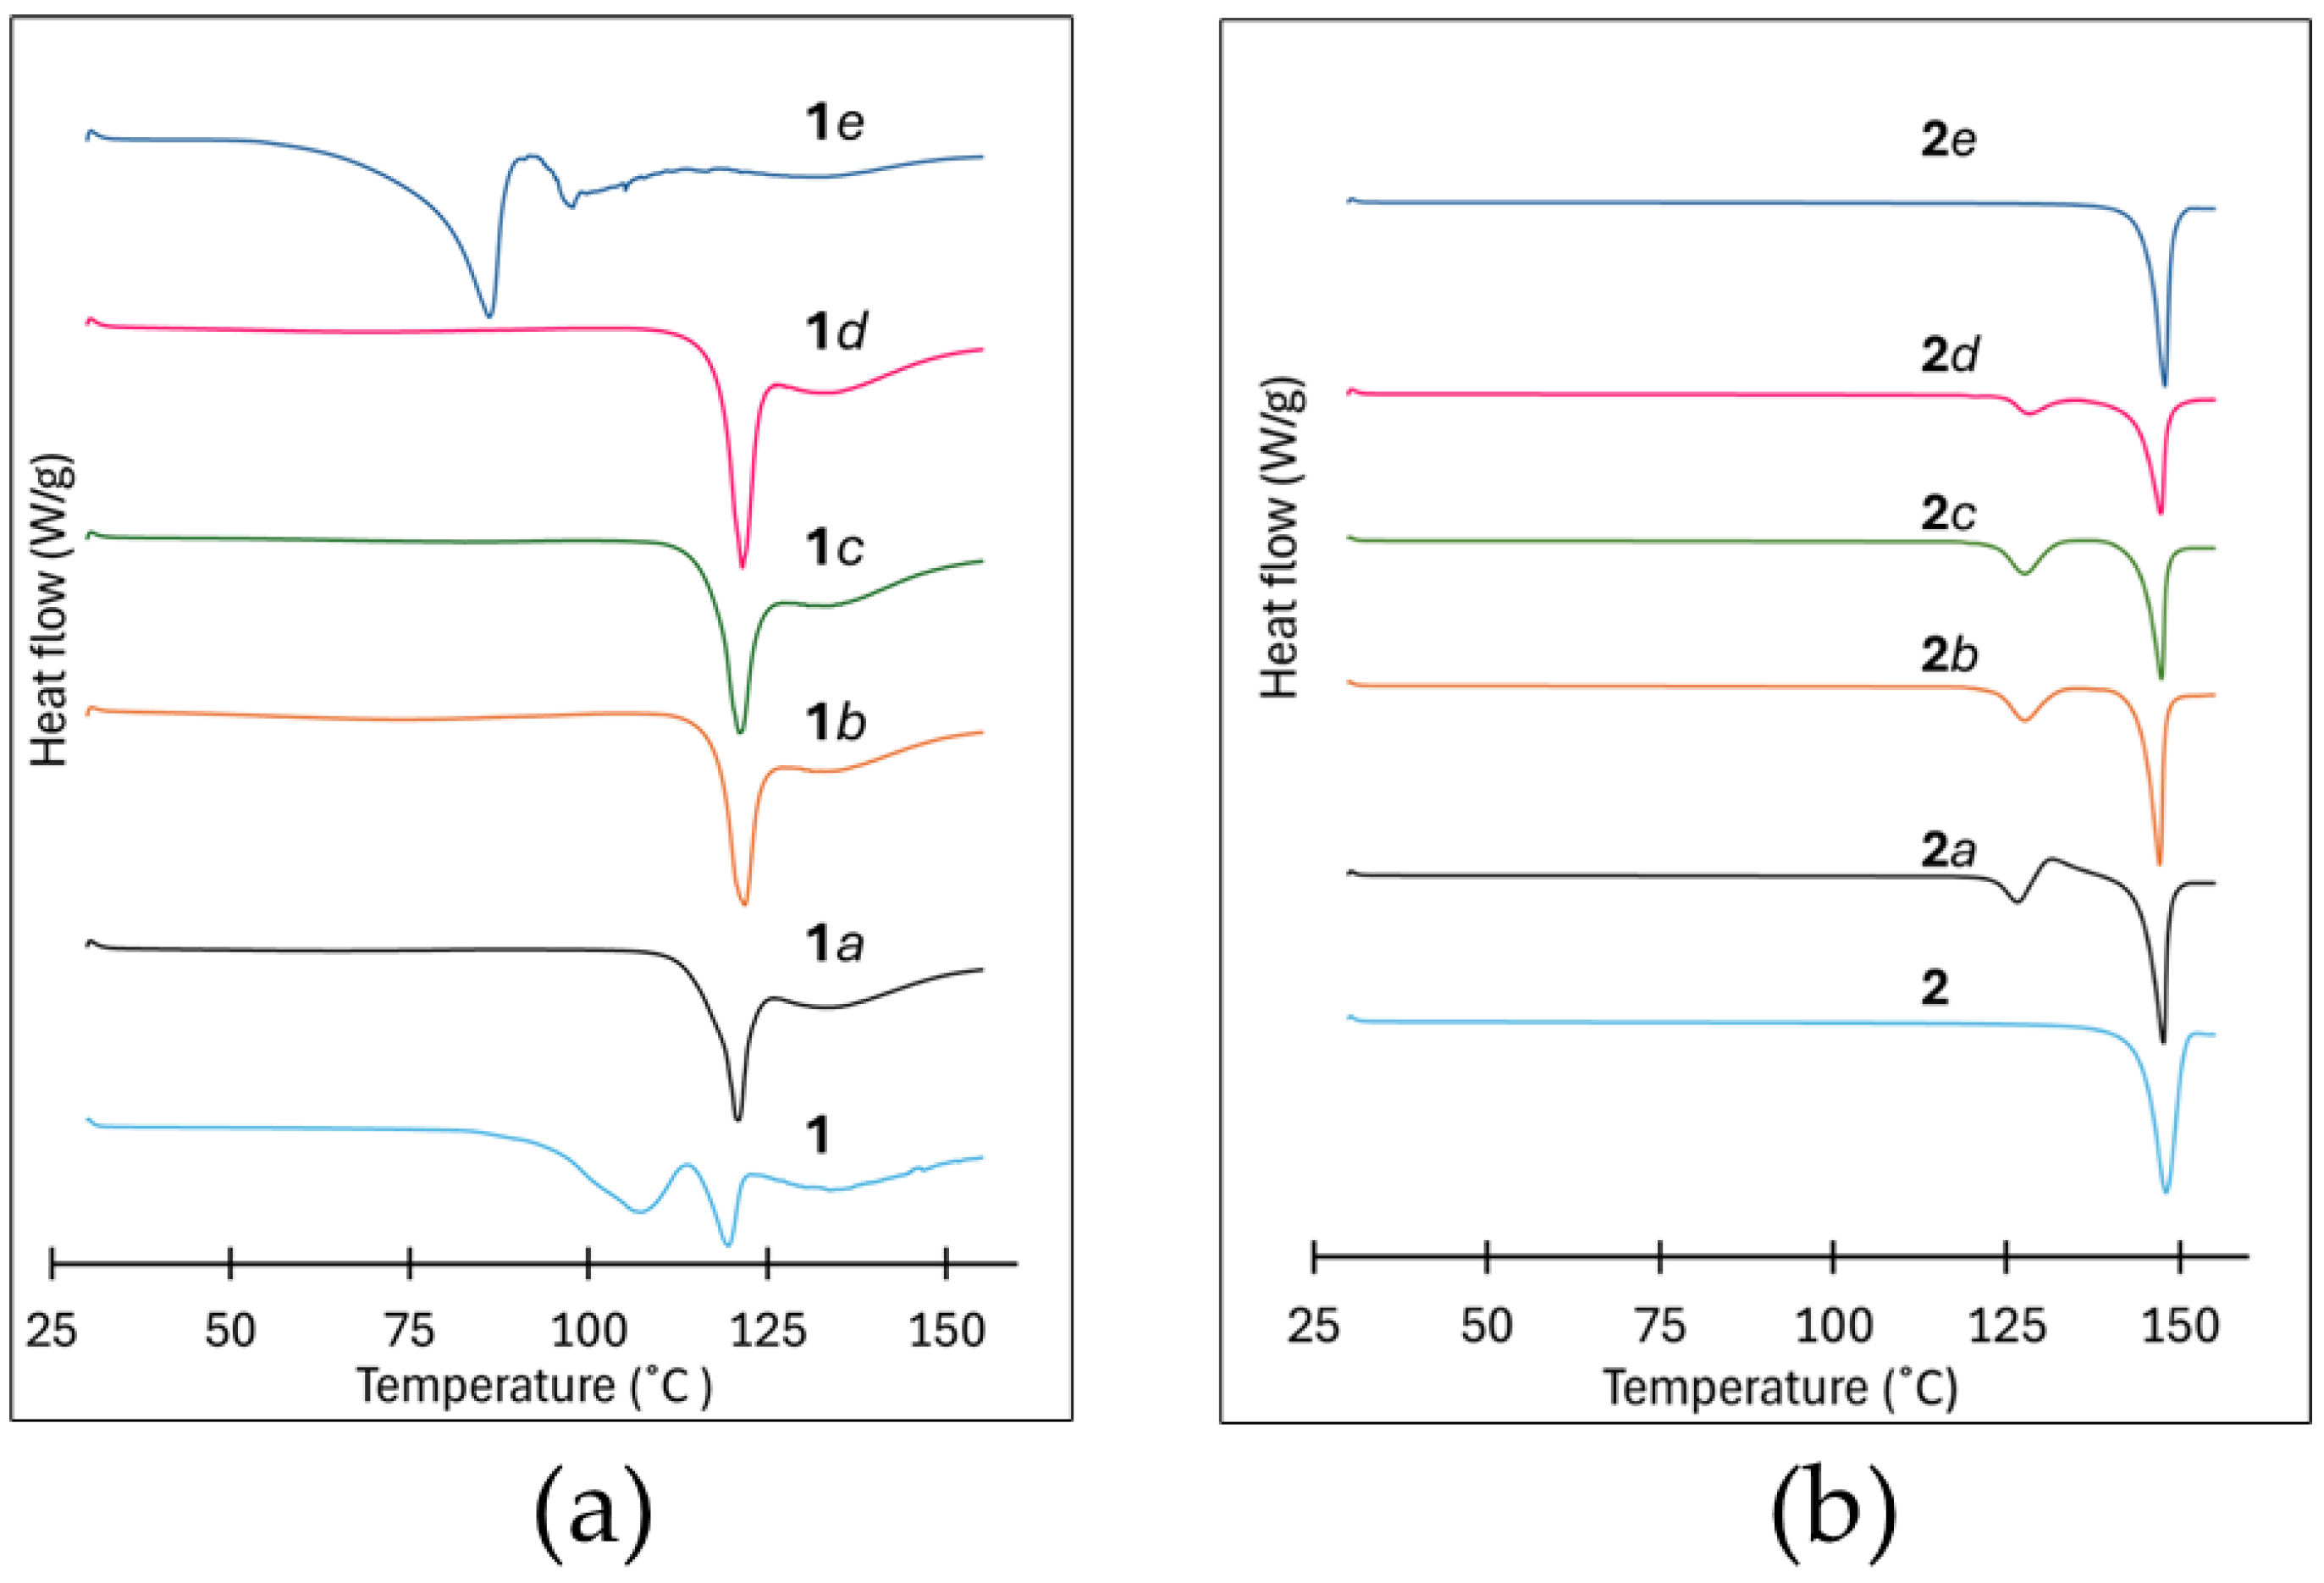
Figure 8.
FTIR spectra of the crystalline and milling products of: (a) 1 and (b) 2.
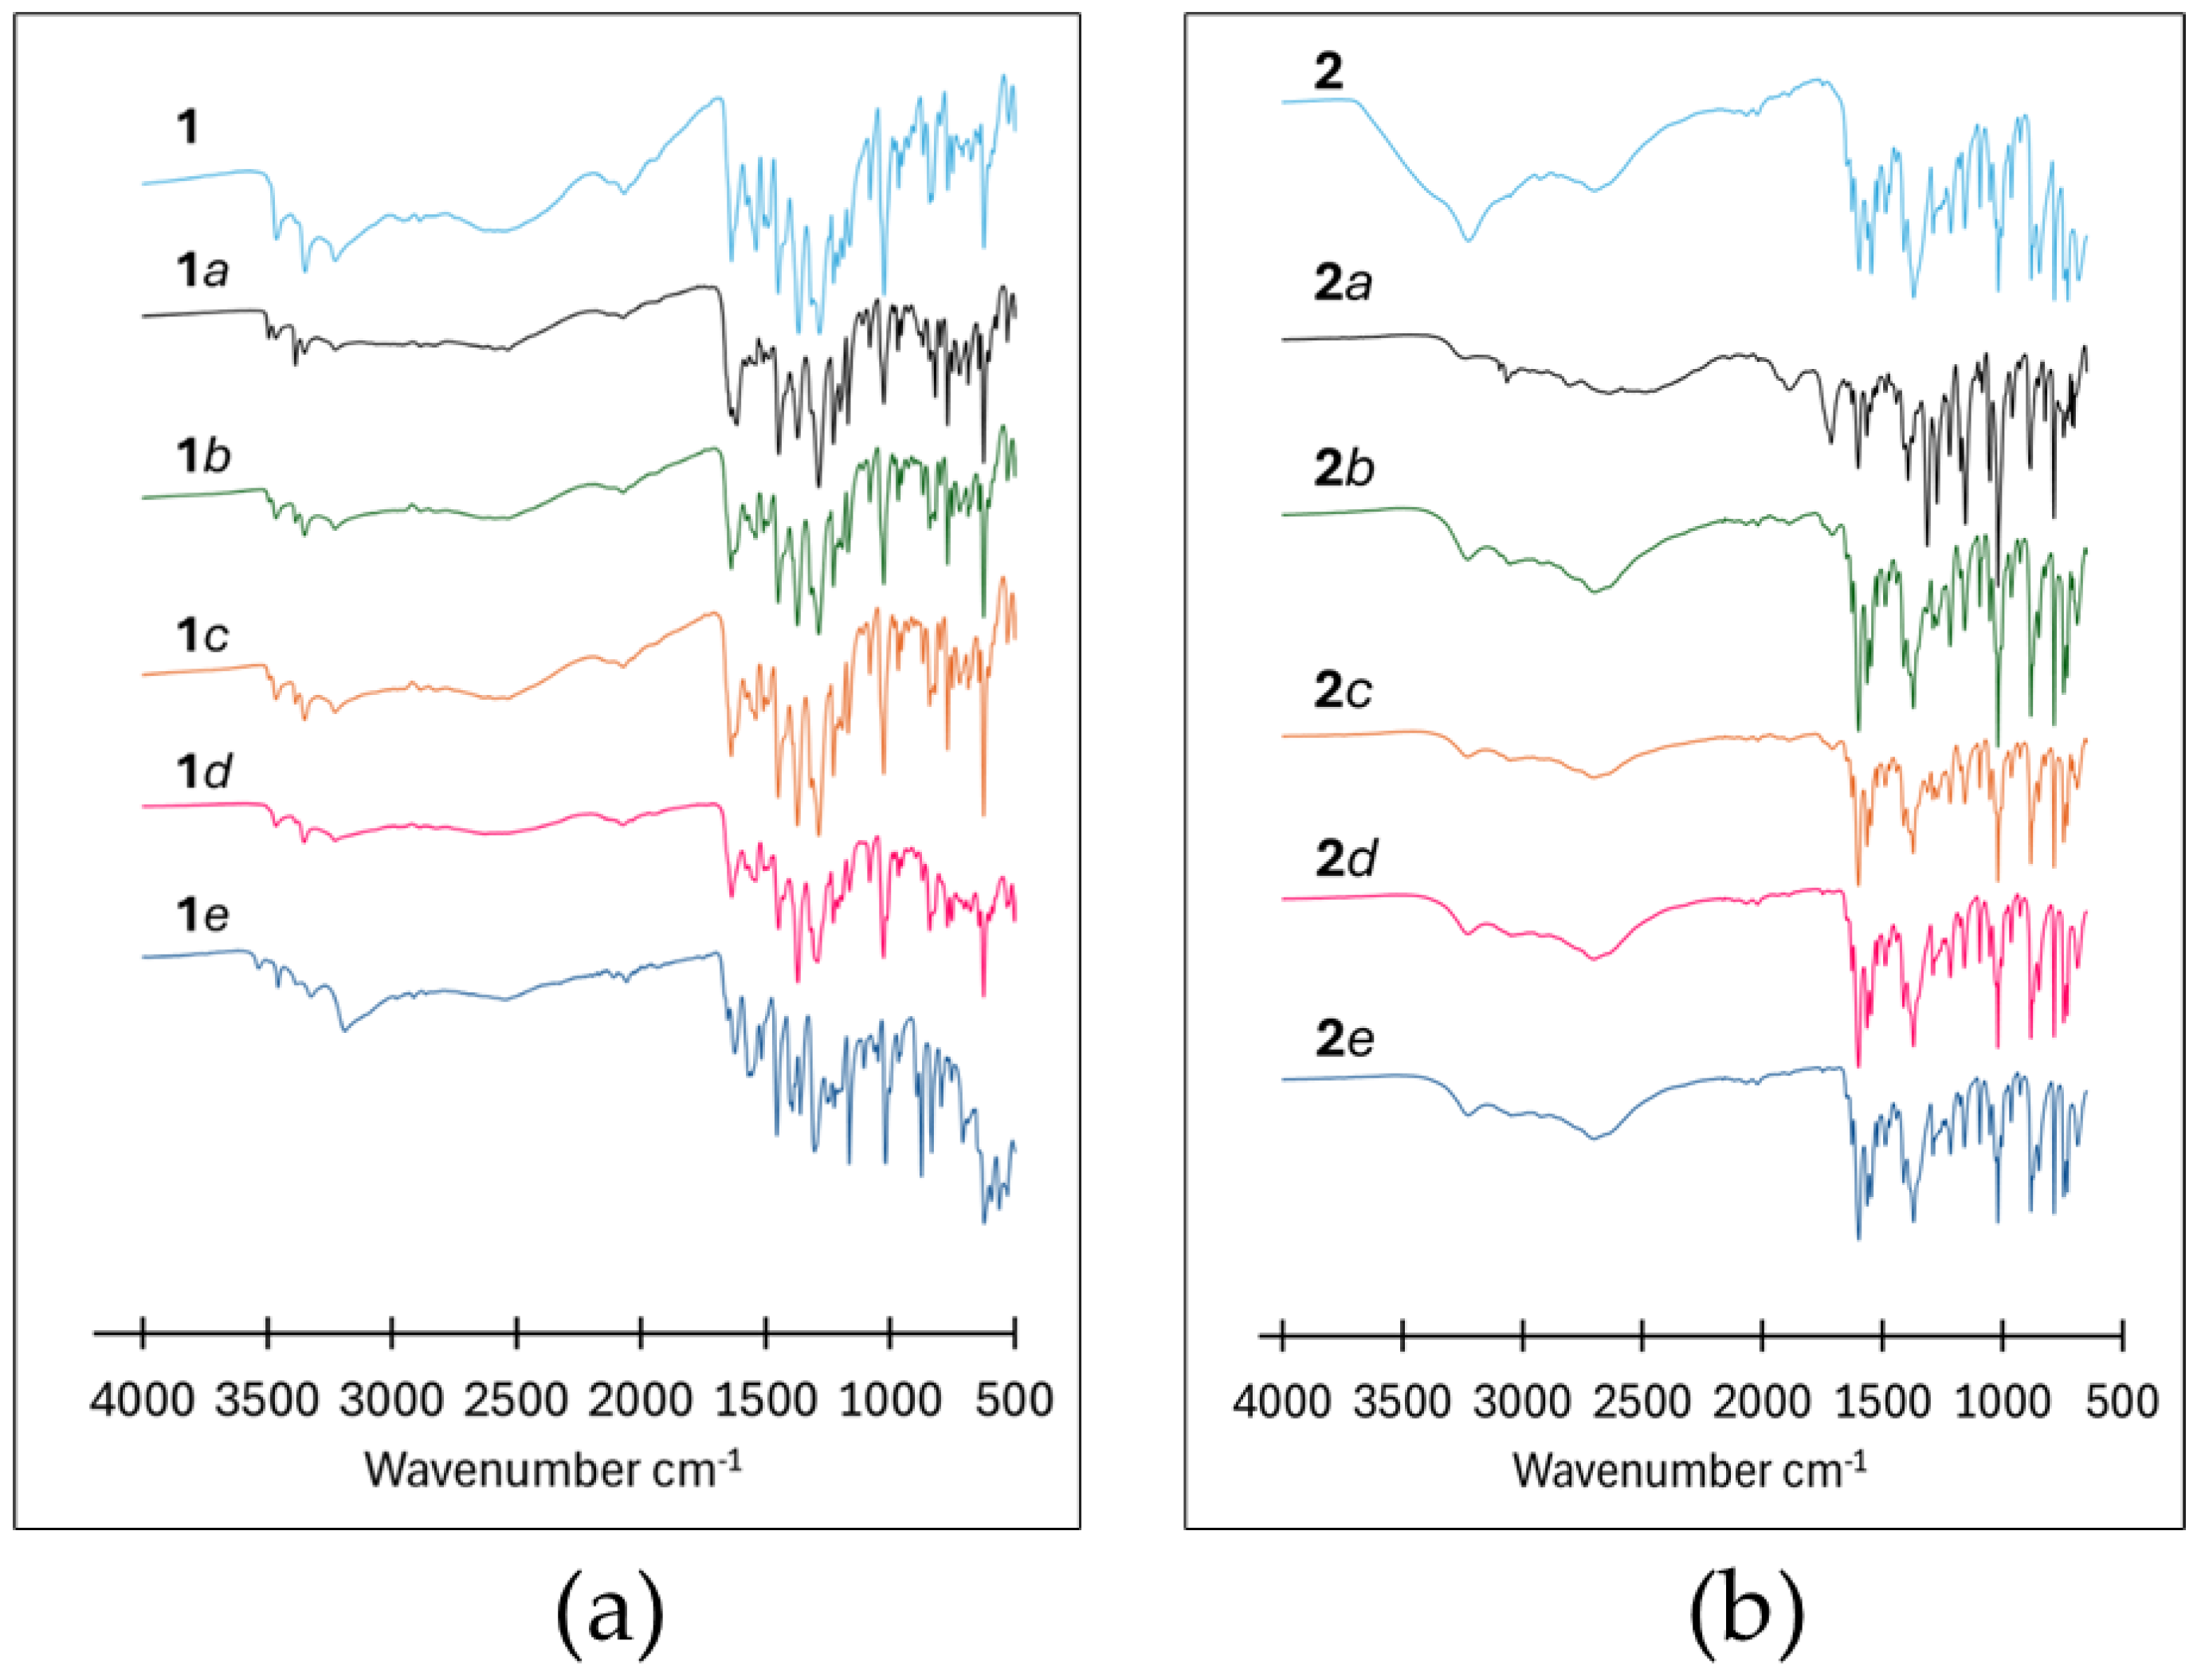

Table 1.
Melting point onset and peak temperatures for 1 and 2.
| Samples | Tonset (°C) | Tpeak (°C) |
| 1 | 110.6 | 120.0 |
| 1a | 112.3 | 120.8 |
| 1b | 113.3 | 121.0 |
| 1c | 115.2 | 121.9 |
| 1d | 115.8 | 121.6 |
| 1e | decomp. | decomp. |
| 2 | 143.9 | 149.0 |
| 2a | 141.9 | 147.4 |
| 2b | 140.6 | 147.1 |
| 2c | 141.1 | 146.9 |
| 2d | 140.6 | 147.3 |
| 2e | 142.5 | 147.6 |
Table 2.
Common stretching/bending frequencies (cm-1) for all preparations of 1 and 2.
| Vibrational modes | PAS | PN | 1 |
| ν(OH) | - | 3278 | 3234 |
| ν(NH2) | 3494, 3387 | - | 3499,3391 |
| ν(C=O) | 1615 | - | 1638 |
| ν(C-O) | 1286 | - | 1286 |
| ν(C-OH) | - | 1019 | 1025 |
| 1a | 1b | 1c | |
| ν(OH) | 3237 | 3238 | 3237 |
| ν(NH2) | 3472, 3357 | 3472, 3356 | 3470, 3354 |
| ν(C=O) | 1622 | 1639 | 1640 |
| ν(C-O) | 1289 | 1289 | 1289 |
| ν(C-OH) | 1026 | 1027 | 1027 |
| 1d | 1e | ||
| ν(OH) | 3235 | 3334 | |
| ν(NH2) | 3472, 3358 | 3462, 3358 | |
| ν(C=O) | 1638 | 1625 | |
| ν(C-O) | 1293 | 1253 | |
| ν(C-OH) | 1028 | 1020 | |
| PCBA | PN | 2 | |
|
ν(OH) ν(C=O) |
- 1714 |
3278 - |
3240 1607 |
| ν(C-O) | 1272 | - | 1290 |
| ν(C-OH) | - | 1019 | 1018 |
| 2a | 2b | 2c | |
|
ν(OH) ν(C=O) |
3258 1716 |
3248 1602 |
3253 1603 |
| ν(C-O) | 1274 | 1291 | 1291 |
| ν(C-OH) | 1019 | 1019 | 1019 |
| 2d | 2e | ||
|
ν(OH) ν(C=O) |
3246 1603 |
3244 1601 |
|
| ν(C-O) | 1291 | 1290 | |
| ν(C-OH) | 1019 | 1019 |
Disclaimer/Publisher’s Note: The statements, opinions and data contained in all publications are solely those of the individual author(s) and contributor(s) and not of MDPI and/or the editor(s). MDPI and/or the editor(s) disclaim responsibility for any injury to people or property resulting from any ideas, methods, instructions or products referred to in the content. |
© 2026 by the authors. Licensee MDPI, Basel, Switzerland. This article is an open access article distributed under the terms and conditions of the Creative Commons Attribution (CC BY) license.
Copyright: This open access article is published under a Creative Commons CC BY 4.0 license, which permit the free download, distribution, and reuse, provided that the author and preprint are cited in any reuse.


