
Submitted:
14 January 2026
Posted:
15 January 2026
You are already at the latest version
Abstract
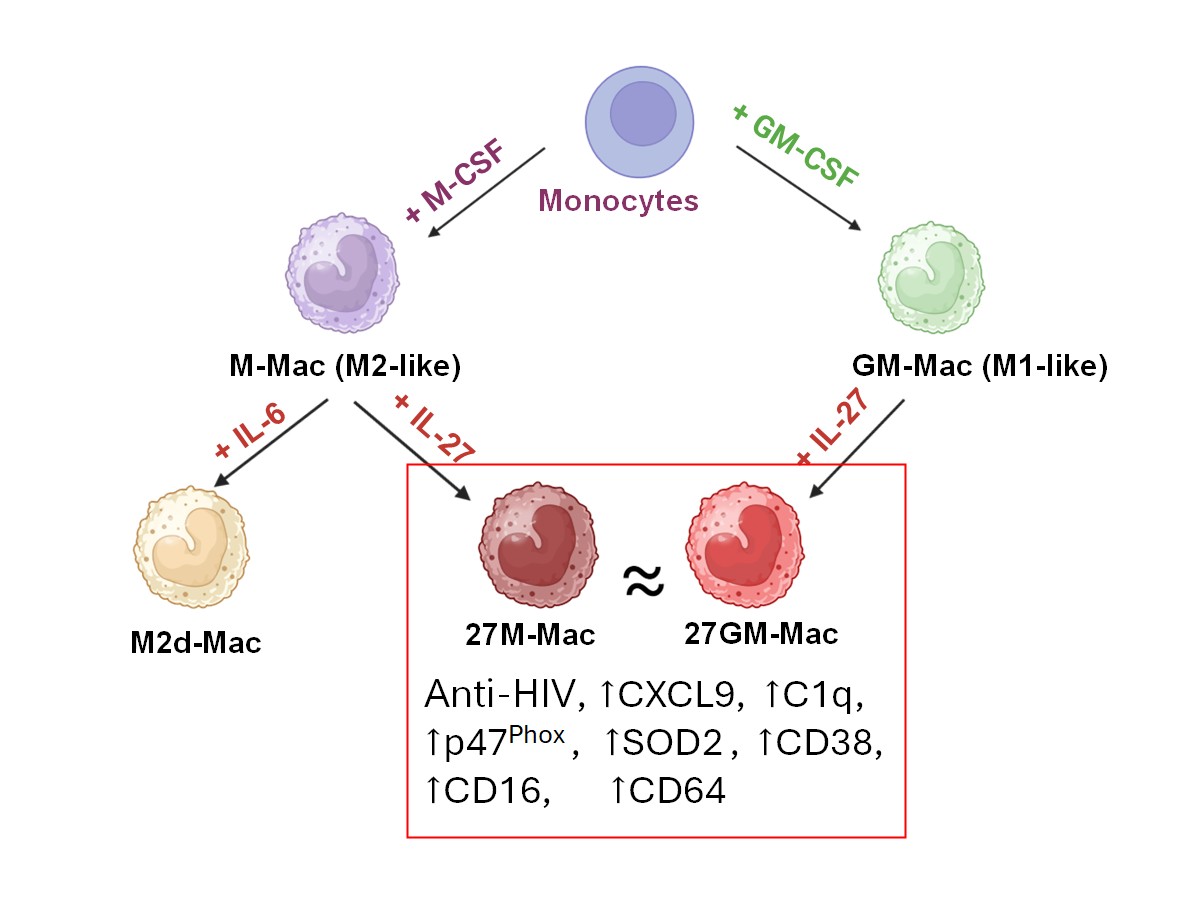
Macrophages differentiated with macrophage colony-stimulating factor (M-CSF) (M-Mac) are widely used as an experimental model. Interleukin 27 (IL-27)-polarized M-Mac (27M-Mac) suppress HIV replication; however, the effects of IL-27 polarization on granulocyte-macrophage colony-stimulating factor (GM-CSF)-induced macrophages (GM-Mac) remain less investigation. Here, we compare multiple functional properties and gene expression profiles of 27M-Mac and IL-27-polarized GM-Mac (27GM-Mac). M-Mac and GM-Mac were generated from monocytes of healthy donors and subsequently treated with IL-27 for three-day. HIV replication in 27M-Mac, GM-Mac, and 27GM-Mac was suppressed to nearly 10 % of that in M-Mac; however, single-cell RNA sequencing showed that M-Mac clustered with GM-Mac, and 27M-Mac clustered with 27GM-Mac. Expression of CD38 and secretion of CXCL9 and C1q were significantly increased in 27M-Mac and 27GM-Mac compared with M-Mac and GM-Mac. Although CD16 and CD64 expression increased in 27M-Mac and 27GM-Mac relative to their respective controls, phagocytic activity in 27M-Mac and 27GM-Mac was 30% of that in M-Mac. Autophagy was induced 3.7-fold more strongly in 27M-Mac than in M-Mac, reaching levels comparable to those in GM-Mac and 27GM-Mac. Collectively, these findings indicate that IL-27 polarizes M-Mac and GM-Mac toward transcriptionally and functionally similar subtypes, providing insight into the role of IL-27 in macrophage polarization and plasticity.
Keywords:
IL‐27
; convergence
; scRNA Seq
; M‐CSF‐differentiated MDMs
; GM‐CSF‐differentiated MDMs
1. Introduction
Interleukin (IL)-27 is a heterodimeric cytokine that belongs to the IL-12 family based on structural similarity and to the IL-6/gp130 family based on receptor usage [1,2]. IL-27 was initially identified as a modifier of T-cell function, but subsequent studies have demonstrated its multifaceted role in numerous cell types, including neutrophils, macrophages, dendritic cells, hepatocytes, and keratinocytes [3,4,5,6,7,8]. IL-27 signals through the IL-27 receptor (IL-27R), which comprises gp130 and WSX-1 [2,9]. IL-27 was identified as anti-HIV factor in the culture supernatants from peripheral blood mononuclear cells (PBMCs) treated with a cervical cancer vaccine [4], and it was subsequently shown to suppress HIV replication in T cells, macrophages, and dendritic cells [10,11]. IL-27 also inhibits infection by multiple other viruses, including influenza virus [12], hepatitis C virus [7], hepatitis B virus [13,14], cytomegalovirus [15], coxsackievirus B3 [16], respiratory syncytial virus [17], dengue virus [18], chikungunya virus [19], Zika virus [20], and Mayaro virus [21]. Recent studies suggest that IL-27 may contribute to suppression of SARS-CoV-2 infection [22,23].
The antiviral activity of IL-27 is mediated by induction of multiple interferon-stimulated genes (ISGs) [10,19,21,24] via activation of STAT1 and STAT3 [10,11]. ISG induction by IL-27 is cell type dependent: in some contexts it requires type I interferon (IFN) (IFN-α or IFN-β) [24], whereas in others it is IFN independent [10,25]. Accordingly, IL-27 has been proposed as an immunotherapeutic agent for viral infections [26] and other diseases [27]. However, in vitro studies of IL-27 antiviral activity in human primary macrophages typically do not account for macrophage subset heterogeneity. Macrophages are commonly differentiated from peripheral blood monocytes using macrophage colony-stimulating factor (M-CSF) [4,12,18,28], human serum [4,29,30], or fetal bovine serum (FBS) [24], and the resulting monocyte-derived macrophages (MDMs) are used as virus-permissive host cells. Given macrophage diversity, distinct subsets can differ substantially in function and activity.
Macrophages act as phagocytes, generate reactive oxygen species (ROS), exhibit chemotaxis, secrete cytokines and chemokines, present antigens to support adaptive immune response, and secrete type-I and type-III IFNs in response to various pathogens in the innate immunity [31,32,33,34,35,36,37,38]. Macrophages are often categorized as M1 (classically activated, pro-inflammatory) or M2 (alternatively activated, anti-inflammatory) [39,40,41]. In addition, several other macrophage subsets have been described, including regulatory macrophages (Mreg), heme-related macrophages (Mhem), oxidized macrophages (Mox), M3 macrophages, and CD169⁺/TCR⁺ macrophages [42,43,44,45,46,47,48,49,50,51,52,53]. Monocyte-derived macrophages (MDMs) induced by GM-CSF or M-CSF are considered M0 (resting) macrophages [40,54,55,56,57]. GM-CSF-induced M0 macrophages (M1-like; GM-Mac) can be polarized to M1 by Type-II IFN (IFN-γ) plus lipopolysaccharide (LPS) [58,59,60,61,62] or by Th1 cytokine stimulation [58,63]. M1 macrophages produce pro-inflammatory cytokines, including Tumor necrosis factor (TNF)-α, IL-1α, IL-1β, IL-6, and IL-12, as well as chemokines such as C-X-C motif chemokine (CXCL)9, and CXCL10 [64], which initiate the immune responses. M1 macrophages produces nitric oxide (NO) and ROS, and transcription factors including NF-kB, STAT1, STAT5, IRF3, and IRF5, have been shown to regulate M1 macrophages. Toll-like receptor (TLR)2, TLR4, CD80, CD86, and MHC-II are characteristic surface markers of M1 [65]. In contrast, M-CSF-induced MDMs (M2-like; M-Mac) can be polarized into M2a, M2b, M2c, and M2d subtypes [42,44,64]. For example, IL-4 and IL-13 polarize M-Mac to M2a [54,57,66,67,68], whereas immune complexes and TLR ligands induce M2b polarization. IL-10, transforming growth factor β (TGF-β), and glucocorticoids promote M2c polarization, and IL-6 or adenosine analogs stimulation can polarize M-Mac toward M2d [42,69,70,71]. These M2 macrophages subsets are regulated by transcription factors including STAT3, STAT6, IRF4, and KLF4 [64,72,73,74], and M2-associated markers include CD80, CD86, CD163, CD206, and CD209 [64,74].
We previously investigated the response of M-Mac to IL-27. Since IL-6 polarizes M-Mac toward M2d and IL-27 shares gp130-dependent signaling with IL-6, we hypothesized that IL-27 might polarize M-Mac toward an M2d or M2d-like phenotype. In our prior study, we compared the functions and gene expression profiles of IL-27-polarized M-Mac (27M-Mac) and IL-6-polarized M2d macrophages [75]. We found that 27M-Mac, but not M2d macrophages, were resistant to HIV replication, and only 27M-Mac increased ROS production. The gene expression profile of 27M-Mac also differed from that of M2d macrophages. Notably, 27M-Mac expressed CD38 and secreted CXCL9 and C1q. Since CD38 and CXCL9 are associated with M1 macrophages and C1q has been linked to M3 macrophages, we considered that 27M-Mac may resemble GM-CSF-induced M0, M1-like, M1, or M3. As the effects of IL-27 on GM-Mac remain poorly defined, the current study compares biological functions among M-Mac, 27M-Mac, GM-Mac, and IL-27-polarized GM-Mac (27GM-Mac) and single-cell RNA sequencing (scRNA-Seq) analysis, to define the distinguishing features of 27M-Mac and 27GM-Mac.
2. Materials and Methods
2.1. Cells and Reagents
Peripheral blood mononuclear cells (PBMCs) were isolated from healthy donors’ apheresis packs obtained from the National Institutes of Health Blood Bank (Bethesda, MD, USA) or STEMCELL (Cambridge, MA, USA) using lymphocyte separation medium (ICN Biomedical, Aurora, OH, USA), as previously described [28]. CD14⁺ monocytes were isolated from PBMCs using CD14 MicroBeads (Miltenyi Biotec, Auburn, CA, USA) according to the manufacturer’s instructions. Cell purity was ≥90%, as determined by flow cytometry. Cell viability was assessed by trypan blue (Thermo Fisher Scientific, Waltham, MA, USA) exclusion. CD14⁺ monocytes were differentiated into M-Mac and GM-Mac macrophages using M-CSF (R&D Systems, Minneapolis, MN, USA) and GM-CSF (R&D Systems), respectively, as previously described [75]. After differentiation, M-Mac and GM-Mac cells were polarized to 27M-Mac and 27GM-Mac by culturing for 3 days in the presence of 100 ng/mL IL-27 (R&D Systems) in complete DMEM (Thermo Fisher Scientific) supplemented with 10% (v/v) FBS (R&D Systems), 10 mM HEPES, and 10 μg/mL gentamicin (D10 medium), as previously described [10,12,28]. HEK293T cells were obtained from ATCC (Manassas, VA, USA) and maintained in D10 medium. A plasmid encoding HIV-1AD8 was obtained from Dr. M. Martin (NIAID, Bethesda, MD, USA) [76]. The plasmid was propagated in STBL3 cells (Thermo Fisher Scientific) and purified using the EndoFree Plasmid Maxi Kit (Qiagen, Germantown, MD, USA) [4]. Infectious HIV-1AD8 virus stock was prepared and titrated as describe before [4].
2.2. HIV-1 Replication Assay
HIV-1 replication assays were performed in 96-well plates as previously described [28]. Macrophages were seeded at 50 × 103 cells/well and cultured overnight at 37 °C in D10 medium. Cells were then polarized with IL-27 for 3–days as described above. Polarized cells were washed with D10 medium and infected with 250 TCID₅₀ HIV-1AD8 (multiplicity of infection, MOI = 0.005) for 2 h at 37 °C [5]. Infected cells were cultured in 200 μL D10 medium for 14 days, with half-medium changes every 3 to 4 days using prewarmed D10 medium. All replication assays were performed in quadruplicate. HIV-1 replication was quantified by measuring p24 antigen in culture supernatants using a p24 antigen capture assay kit (PerkinElmer, Boston, MA, USA).
2.3. Quantitation of C1q, and CXCL9 in Culture Supernatants
To compare C1q and CXCL9 production during IL-27 treatment, M-Mac or GM-Mac from four independent donors were cultured for 3–days in the absence or presence of 100 ng/mL of IL-27. Cell-free culture supernatants were collected and stored at −20 °C until analysis. C1q and CXCL9 concentrations were quantified using a Human C1q ELISA kit (Invitrogen, Thermo Fisher Scientific; detection limit, 937 pg/mL) and a CXCL9 kit (R&D Systems; detection limit, 11.4 pg/mL), respectively [28].
2.4. Flow Cytometric Analysis
Cellular phenotypes were assessed by single-color staining, with an unstained negative control for each cell type. Compensation controls for each fluorochrome were prepared using compensation beads (Supplementary Table S1), and compensation was calculated before acquisition. A total of 3 × 10⁶ cells were washed three times with ice-cold Dulbecco’s PBS (Thermo Fisher Scientific) containing 2% bovine serum albumin (BSA; Sigma-Aldrich, St. Louis, MO, USA) and 0.5% NaN₃ (MilliporeSigma, Burlington, MA, USA) (DPBS-BSA-NaN₃). Cells were blocked with Fc Receptor Blocker (Innovex Biosciences, Richmond, CA, USA) for 30 min at room temperature in the dark, washed twice with DPBS-BSA-NaN₃, and stained with individual antibodies for 15 min at room temperature in the dark, with an unstained negative control. Antibodies are listed in Supplementary Table S1. Cells were washed twice with DPBS-BSA-NaN₃ and analyzed immediately on an LSRFortessa flow cytometer (BD Biosciences). Data were analyzed using FCS Express version 7 (De Novo Software, Pasadena, CA, USA) [77].
2.5. Reactive Oxygen Species
ROS were quantified using the Amplex Red Hydrogen Peroxide/Peroxidase Assay Kit (Thermo Fisher Scientific), as previously described [5,28]. Cells were stimulated with 100 nM phorbol 12-myristate 13-acetate (PMA) (Sigma-Aldrich) for 30 min at 37 °C, and ROS generation was measured using a Spark microplate reader (Tecan, Männedorf, Switzerland).
2.6. Phagocytosis Assay
Endogenous phagocytic activity was measured using fluorescent Escherichia coli (K-12 strain) BioParticles (Thermo Fisher Scientific), conjugated to Alexa Fluor 488. BioParticles (2 mg) were reconstituted in 100 μL PBS (Quality Biological Inc; QBI, Gaithersburg, MD, USA) and vortexed for 15 s three times. After confirming a homogeneous suspension, particles were /d using the BioParticles Opsonizing Reagent (Thermo Fisher Scientific). Briefly, 30 μL of reconstituted opsonizing reagent was mixed with 30 μL of reconstituted BioParticles (20 mg/mL), vortexed, and incubated at 37 °C for 1 h. The mixture was centrifuged at 1,000 × g for 5 min and washed three times with PBS. Pellets were resuspended in 100 μL PBS, and particle numbers were determined by microscopy. Phagocytosis assays were performed in 96-well plates. M-Mac or GM-Mac cells were polarized in 96-well plates as described above, washed three times with prewarmed D10 medium, and incubated with opsonized fluorescent E. coli at a target-to-effect ratio of 10 for 1 h in D10 medium. As a control, cells were treated with 5 μg/mL cytochalasin D (Sigma-Aldrich) for 30 min before addition of opsonized E. coli. Heat-inactivated E. coli particles were also included as controls. Images were acquired using an Axio Observer A1 motorized microscope (Zeiss, Oberkochen, Germany). Phagocytic activity was quantified using Fiji (National Institutes of Health, Bethesda, MD, USA). Background thresholds were applied to generate 8-bit masks. For the red channel, the total stained fluorescence area was quantified as a measure of phagocytic staining, and particle counts were obtained following measurement of the staining area. Results are presented as the average fluorescence area per cell for each condition, quantified from images containing approximately 1,000 cells.
2.7. Autophagy Assay
Autophagy was assessed using the Cyto-ID Autophagy Detection Kit (ENZ-51031; Enzo Life Sciences, Farmingdale, NY, USA) with modifications to a previous report [29]. Polarized cells were incubated overnight at 37 °C in D10 medium with or without 10 μM chloroquine (Enzo Life Sciences). Autophagosomes were stained with the Cyto-ID reagent, and Hoechst 33342 was used as a nuclear counterstain, according to the manufacturer’s instructions. Briefly, cells were washed twice, and culture medium was replaced with PBS supplemented with 5% FBS and containing both stains. Cells were incubated at 37 °C for 30 min in the dark and then imaged using a Zeiss Axio Observer A1 motorized microscope with a 10 × objective. Excitation/emission wavelengths were 463/534 nm for the Cyto-ID dye and 350/461 nm for Hoechst 33342. Image analysis was performed using Fiji. Background thresholds were applied to generate 8-bit masks. Total green area was used as a measure of autophagosome staining, and cell numbers were determined by particle counting after watershed segmentation of the nuclear channel. Results are presented as the average stained area per cell for each condition [29].
2.8. Western Blotting
Western blotting (WB) was performed as previously described [5,28]. Briefly, unpolarized or polarized cells in 6-well plates (1.5 × 10⁶ cells/well) were washed with cold PBS, lysed using 150 μL 1 × Radioimmunoprecipitation assay (RIPA) lysis buffer (Boston BioProducts, Milford, MA, USA) supplemented with 5 mM EDTA (Thermo Fisher Scientific) and 1 × phosphatase and protease inhibitor cocktail (Thermo Fisher Scientific). Lysates were incubated on ice for 15 min, and debris-free lysates were obtained by centrifugation at 15,000 × g at 4 °C for 10 min. Protein concentration was determined using the BCA Protein Assay Kit (Pierce, Thermo Fisher Scientific). For each sample, 20 μg total protein was resolved by SDS-PAGE on NuPAGE Bis-Tris gels (4% to 12%; Thermo Fisher Scientific) in MOPS buffer (Thermo Fisher Scientific) under reducing conditions. Proteins were transferred onto 0.45 μm nitrocellulose membranes (Thermo Fisher Scientific) and probed with antibodies (Supplementary Table S1). Bands were detected using ECL Prime Western Blotting Detection Reagent (Cytiva Life Sciences, Marlborough, MA, USA) and imaged with an Azure 300 system (Azure Biosystems, Dublin, CA, USA). Band intensities were quantified using Fiji.
2.9. Construction of scRNA-Seq Libraries
M-Mac or GM-Mac macrophages (4 × 10⁶ cells) were seeded in 60 mm Petri dishes and cultured at 37 °C for ≥16 h in D10 medium. Cells were polarized with 100 ng/mL IL-27 for 3 days, washed three times with warm PBS, and incubated with 2.5 mL 0.25% trypsin-EDTA (QBI) at 37 °C for 15 min in a 5% CO₂ incubator. D10 medium (5 mL) was added, and cells were detached by gentle flushing. Cells were washed three times with D10 medium, and cell viability and counts were determined using a Cellometer Auto 2000 (Nexcelom Bioscience, Lawrence, MA, USA) with ViaStain AOPI Staining Solution (Nexcelom Bioscience). Cell viability was consistently 98% to 100%. Cells were resuspended at 1 × 10⁶ cells/mL in D10 medium. scRNA-Seq libraries were generated using the Chromium Next GEM Single Cell 5′ Reagent Kit v2 (Dual Index) (10x Genomics, Pleasanton, CA, USA) according to the manufacturer’s instructions. Briefly, 16.5 μL of cell suspension was combined with reverse transcription reagents, template-switch oligonucleotides, and reverse transcriptase, and loaded onto a Chromium Chip K (10x Genomics). Single-cell GEM generation and barcoding, followed by cDNA synthesis, were performed using the 10x Chromium Controller. cDNA was amplified for 13 cycles. Based on Agilent 2100 Bioanalyzer (Agilent Biotechnology, Santa Clara, CA, USA) and Qubit 4 (Thermo Fisher Scientific) analyses, libraries showed a single DNA peak between 300 and 1,000 bp (average fragment size, 450 to 550 bp) [28].
2.10. Analysis of scRNA-Seq
Sequence data were processed using Cell Ranger v6.0.1 (10x Genomics) as previously described[75] Resulting count matrices were generated using the standard pipeline with default parameters and imported into Partek Flow (version 12.9.1: https://www.partek.com) for quantification and statistical analysis. Data underwent quality control (QC) and filtering using the following criteria: (1) low-quality cells and potential doublets were removed based on total reads per cell (1,000 to 60,000), expressed genes per cell (1,000 to 7,000), and mitochondrial reads (<15%); and (2) genes with maximum values ≤1 were excluded. Counts were normalized to counts per million, offset by 1, and log₂-transformed. The top 20 principal components (PCA) were used for unbiased graph-based clustering. Clusters were visualized using t-distributed stochastic neighbor embedding (t-SNE). Differential gene expression was assessed using an analysis of variance (ANOVA) model. Genes were considered differentially expressed at p ≤ 0.05 with an absolute fold change ≥3.
2.11. Quantitative RT-PCR (qRT-PCR)
Total cellular RNA was isolated using the RNeasy Kit (Qiagen, Germantown, MD, USA). cDNA was synthesized from total RNA using TaqMan reverse transcription reagents (Thermo Fisher Scientific) with random hexamer primers, according to the manufacturer’s instructions. mRNA levels of genes of interest were measured by qRT-PCR on a CFX96 real-time system (Bio-Rad, Hercules, CA, USA) using the following cycling conditions: 95 °C for 15 s and 60 °C for 1 min, repeated for 40 cycles [75]. Relative transcript abundance was calculated using the ΔΔCt method with GAPDH as the reference. Normalized expression values were expressed relative to the mean ΔCt of control samples to obtain fold changes. Gene-specific probes were purchased from Applied Biosystems (Thermo Fisher Scientific).
2.12. Statistical Analysis
Intergroup comparisons were performed using an unpaired t-test, one-way or two-way ANOVA (GraphPad, San Diego, CA, USA). p-values <0.05 were considered statistically significant: * p < 0.05, ** p < 0.01, *** p < 0.001, **** p < 0.0001; p > 0.05 was considered not significant (ns).
3. Results
3.1. Antiviral Effect
3.1.1. Comparison of Anti-HIV Activity
HIV replication among M-Mac, 27M-Mac, GM-Mac, and 27GM-Mac was compared. Each macrophage subtype was infected with HIVAD8 strain at an MOI of 0.005 and cultured for 14 days. HIV replication in culture supernatants was quantified using an HIV-1 p24 antigen capture kit. Consistent with a previous study [28], HIV replication in 27M-Mac was significantly reduced to 4.9 ± 2.0% of that in M-Mac (n = 4, p < 0.001) (Figure 1). As both M-Mac and GM-Mac are frequently described as M0 or naïve cells [31,78], we speculated that both cell types might exhibit comparable HIV replication. However, HIV replication in GM-Mac was markedly lower than in M-Mac (11.2 ± 4.3% of M-Mac; n = 5, p < 0.001), which was comparable to that in 27M-Mac (p = 0.731). HIV replication in 27GM-Mac was significantly lower than that in M-Mac (4.0 ± 1.4% of M-Mac); however, it was only modestly reduced relative to GM-Mac (36.1 ± 13.5% of GM-Mac; n = 5, p = 0.166). Thus, IL-27 polarization conferred resistance to HIV replication in both cell types, although the magnitude of the effect differed.
3.1.2. Comparison of Gene Expression Among Four Cell Types
To characterize the four cell types, we compared their gene expression profiles by single-cell RNA sequencing (scRNA-Seq). Monocytes from two independent donors (Donor A and Donor B) were differentiated and polarized into each cell type and subjected to scRNA-Seq. Quality control yielded 15,619 genes (features) and 11,183 cells from Donor A, and 15,245 genes and 17,427 cells from Donor B. In Donor A, 3,676 cells were classified as M-Mac, 2,429 as 27M-Mac, 1,470 as GM-Mac, and 3,608 as 27GM-Mac (Supplementary Table S2). In Donor B, 3,808 cells were classified as M-Mac, 5,297 as 27M-Mac, 3,526 as GM-Mac, and 4,796 as 27GM-Mac (Supplementary Table S2). To visualize cell-type distribution and pairwise similarity, we performed t-SNE analysis (Figure 2A and 2B).
In datasets from both donors, M-Mac clustered closely with GM-Mac, and 27M-Mac clustered closely with 27GM-Mac. IL-27-treated cells formed clusters distinct from untreated M-Mac and GM-Mac. Notably, although 27M-Mac suppressed HIV replication to a similar extent as GM-Mac, the gene expression profile of 27M-Mac was distinct from that of GM-Mac. To define similarities and differences in gene expression, we analyzed differentially expressed genes (DEGs) among the four cell types. As shown in Figure 2A,B, gene expression profiles differed between M-Mac and GM-Mac in both donors. Therefore, comparing DEGs between 27M-Mac and M-Mac (27M vs. M) with those between 27GM-Mac and GM-Mac (27GM vs. GM) could be confounded by baseline differences between M-Mac and GM-Mac, potentially introducing bias. To mitigate this issue, we compared normalized reads for each gene in 27M-Mac, GM-Mac, and 27GM-Mac with the corresponding reads in M-Mac. DEGs were defined using p < 0.05 and an absolute fold change ≥3. In Donor A, the numbers of DEGs for 27M vs. M, GM vs. M, and 27GM vs. M were 560, 119, and 398, respectively (Table 1).
In Donor B, the numbers of DEGs for 27M vs. M, GM vs. M, and 27GM vs. M were 406, 52, and 464, respectively (Table 1). The relatively small number of DEGs in GM vs. M suggests that GM-Mac and M-Mac were transcriptionally more similar than the other comparisons. Additional comparison analysis of 27GM-Mac and 27M-Mac was conducted. The number of DEGs between 27GM-Mac and 27M-Mac (27GM vs. 27M) in Donor A and in Donor B were 219 and 30, respectively (Table 1). These values were lower than those observed in DEGs for 27M vs. M, supporting substantial transcriptional similarity between 27M-Mac and 27GM-Mac and suggesting that IL-27 polarization of M-Mac yields a state comparable to 27GM-Mac.
3.1.3. Potential Mechanisms Underlying Anti-HIV Activity
HIV replication in M-Mac was significantly higher than that in 27M-Mac, GM-Mac, and 27GM-Mac, suggesting that the expression of host dependency factor(s) [79] might be suppressed in those cell types compared with M-Mac or that the expression of host restriction factors might be induced in those cell types. To identify the genes commonly associated with anti-HIV activity in 27M-Mac, GM-Mac, and 27GM-Mac across both donors, we first employed Venn diagrams to define common DEGs (combining upregulated and downregulated genes) shared by both donors. This analysis identified 313, 25, and 248 DEGs in common 27M.DEG, GM.DEG, and 27GM.DEG sets, respectively (Figure 3A–C; all DEG names are listed in Supplementary Table S3). We then performed functional annotation of these DEG sets to define biological functions and pathways associated with IL-27 treatment (Figure 3D–F).
Comparison of the top five annotations in the common 27.DEGs(Figure 3D) and the common 27GM.DEGs(Figure 3F) showed strong similarity including genes related with response to bacterium, although the ordering differed. WB demonstrated persistent activation of STAT1 and STAT3 in 27M-Mac and 27GM-Mac over 3-days of culture (Supplementary Figure S1). As IL-27–mediated STAT1 and STAT3 activation is similar to Type-II IFN (IFN-γ) stimulation [3,6,28], and consistently, responses to type II IFNs were annotated in 27M.DEG (Figure 3D), 27GM.DEG (Figure 3F), and DEGs from 27GM vs. GM (Supplementary Figure S2A). Responses to type I IFN (IFN-α/β) were annotated only in the DEG set from 27GM vs. GM and were not present in the annotation of 27GM vs. 27M (Figure 2B). To identify genes potentially contributing to antiviral activity, we intersected each common DEG set with anti-HIV/host factor genes (Supplementary Table S4) [28]. This analysis identified 94, 83, and 5 antiviral/host factor genes in 27M.DEG (Figure 4A), 27GM.DEG (Figure 4B), and GM.DEG (Figure 4C), respectively (genes are listed in Supplementary Table S5).
As 27M-Mac, GM-Mac and 27GM-Mac demonstrated nearly 10 % of HIV replication compared to M-Mac, to determine whether the shared antiviral/host factor genes among the three cell types existed, we performed a Venn diagram analysis using these three gene lists (Figure 4D). Two genes, MT1G and MT1H, were common among all three cell types, 71 genes (listed in Supplementary Table S6) overlapped between 27M.Anti-HIV and 27GM.Anti-HIV, and 21 genes (listed in Supplementary Table S6) were DEGs in 27M.Anti-HIV. To visualize the distribution of antiviral gene expression, we performed t-SNE analysis focusing on the top 24 genes showing >10-fold differences relative to M-Mac (Figure 4E and 4F). Some antiviral genes (for example, GBP1, GBP4, GBP5, TAP1, and SERPING1) were expressed in nearly all 27M-Mac and 27GM-Mac cells, whereas others (for example, ANKRD22, APOL3, CXCL9, CXCL10, and MT1M) were restricted to subpopulations of 27M-Mac and 27GM-Mac. The same t-SNE analysis was employed for the 21 unique genes in 27M.Anti-HIV (Figure 4G and 4H andSupplementary Table S7). The expression levels of individual genes and population of cell expressing each gene varied among cells (Supplementary Table S8), suggesting that they may contribute to the robust anti-HIV activity of 27M-Mac in concert with the 71 shared genes. Antiviral mechanisms may differ across individual cells and across cell types, as previously described [28].
3.2. CD38 Expression and CXCL9 and C1q Production
In our previous work, we demonstrated that 27M-Mac express CD38 (an M1 marker) and secrete CXCL9 (an M1 marker) and C1q (an M3 marker). Therefore, we compared the expression of CD38 and secretion of CXCL9 and C1q across the four macrophage subtypes. FACS analysis showed that 12 ± 11% (n = 3) of M-Mac were CD38+, whereas the CD38+ population increased to 96 ± 3.0% (n = 3) in 27M-Mac (p < 0.01). In contrast, 41 ± 15% of naïve GM-Mac were CD38+, and the CD38+ population increased to 92 ± 6% in 27GM-Mac (p < 0.01) (Figure 5A andSupplementary Figure S3). The mean fluorescence intensity (MFI) of CD38 increased by 46.2 ± 6.7-fold in 27M-Mac relative to M-Mac (n = 3, p < 0.05) and by 5.6 ± 0.9-fold in 27GM-Mac relative to GM-Mac (n = 3, p<0.05). Thus, the frequency of CD38-positive cells was comparable between 27M-Mac and 27GM-Mac.
CXCL9 and C1q production over 3 days was quantified in culture supernatants. CXCL9 production was significantly increased in 27M-Mac compared to M-Mac (p < 0.01) and in 27GM-Mac relative to GM-Mac (p < 0.05). CXCL9 secretion by 27M-Mac was 6.6 ± 3.9-fold higher than that by 27GM-Mac (p < 0.01) (Figure 5B). Low levels of C1q were detected in supernatants from M-Mac and GM-Mac, whereas C1q production increased in both 27M-Mac and 27GM-Mac (Figure 5C). The amounts of secreted C1q was comparable between 27M-Mac and 27GM-Mac (Figure 5C).
3.3. Macrophage Marker Expression
Expression of macrophage markers (CD80, CD86, CD163, CD206, and CD209) [65] was assessed by flow cytometry in M-Mac, 27M-Mac, GM-Mac and 27GM-Mac from three independent donors. The percentage of cells expressing each marker did not differ among cell types (Supplementary Figure S4), and the MFI of CD80, CD86, CD163, and CD206 showed no significant differences across groups (Supplementary Figures S5A and S5B). In contrast, the CD209 MFI value was found to be significantly lower in M-Mac than in GM-Mac (p < 0.01). However, it increased by 3.13 ± 0.65-fold in 27M-Mac (p < 0.01), reaching levels comparable to those of GM-Mac (Figure 6A and 6B). Of interest, the expression of CD209 was modestly downregulated in 27GM-Mac compared to GM-Mac, however, it was comparable to that in 27M-Mac Thus, with respect to CD209 expression, 27M-Mac resembled 27GM-Mac.
3.4. ROS-Inducing Activity
3.4.1. Comparison of ROS-Inducing Activity
IL-27 treatment increases the potential for ROS production in M-Mac [5]. Therefore, we compared ROS-inducing activity among the four macrophage subtypes. Cells were stimulated with PMA, and ROS induction was measured. In the absence of PMA, endogenous ROS levels did not differ significantly between M-Mac and 27M-Mac. In contrast, GM-Mac and 27GM-Mac exhibited modestly higher endogenous ROS levels than M-Mac and 27M-Mac (Figure 7). Following PMA stimulation, ROS induction in 27M-Mac and 27GM-Mac increased significantly by 4.7 ± 0.6-fold (p < 0.0001) and 5.6 ± 0.8-fold (p < 0.0001), respectively, compared to M-Mac and GM-Mac. ROS production in 27M-Mac was lower than that in 27GM-Mac (p < 0.0001).
3.4.2. Mechanisms Underlying Enhanced ROS Production
IL-27 treatment of M-Mac increases expression of neutrophil cytosolic factor 1 (NCF1)/p47phox and superoxide dismutase 2 (SOD2), thereby enhancing the potential for ROS induction [5,28]. We therefore compared NCF1/p47phox and SOD2 expression among the four cell types. qRT-PCR analysis of total cellular RNA illustrated that NCF1/P47PHOX and SOD2 were significantly induced in 27M-Mac and 27GM-Mac compared with M-Mac and GM-Mac, respectively (Figure 8A). NCF1/P47PHOXexpression in 27GM-Mac was comparable to that in 27M-Mac, whereas SOD2 expression in 27GM-Mac was lower than in 27M-Mac (p < 0.01). Consistently, WB showed that NCF1/p47phox protein expression increased by a 2.2–fold in both 27M-Mac and 27GM-Mac, whereas SOD2 protein expression increased by 1.9–fold in 27M-Mac and 2.0-fold in 27GM-Mac (Figure 8B). To determine whether the existence of DEGs related to ROS production in 27M-Mac and 27GM-Mac, Venn diagram analysis was performed using 27M.DEGs and27GM.DEGs. Given that the endogenous ROS induction from GM-Mac was merely higher than that from M-Mac, GM.DEGs was also included in the analysis to identify the factor that may be related to endogenous activity(Figure 3A–C) with 395 ROS-associated genes (RAGs) (Supplementary Table S4) [80,81,82]. Nine genes in 27M.DEGs and nine genes in 27GM.DEGs overlapped with the RAG set, whereas four genes in GM.DEGs overlapped with the RAG set (Figure 9A–C). Additional Venn diagram analysis identified complete overlap between the nine 27M.RAGs and the nine 27GM.RAGs (Figure 9D): NCF1/P47PHOX, SOD2, leucine-rich repeat kinase 2 (LRRK2), matrix metalloproteinase 8 (MMP8), synuclein alpha (SNCA), formyl peptide receptor 2 (FPR2), GTP cyclohydrolase 1 (GCH1), selenoprotein P (SELENOP), and phosphotyrosine interaction domain containing 1 (PID1). PID1 was shared among all three cell types, and scRNA-Seq indicated that PID1 expression in 27M-Mac, 27GM-Mac, and GM-Mac was reduced relative to M-Mac (Supplementary Table S10). PID1 has been reported to exert bidirectional effects on oxidative stress-mediated ROS induction, functioning as either an enhancer or a suppressor [83]. However, PID1 primarily affects mitochondria-mediated ROS production, whereas this study focused on NADPH oxidase-mediated ROS induction on plasma membrane; therefore, PID1 is unlikely to contribute substantially under our experimental conditions. The remaining eight genes were shared between 27M.RAGs and 27GM.RAGs, suggesting that enhanced ROS induction in 27M-Mac and 27GM-Mac is regulated by similar mechanisms in both cell types. We next evaluated the distribution of NCF1/P47PHOX and SOD2 expression using t-SNE plots (Figure 9E). Between 95.0% and 99.5% of 27M-Mac cells and 97.0% to 98.0% of 27GM-Mac cells expressed NCF1/P47PHOX and SOD2 (Supplementary Table S11). These data suggested that elevated ROS-inducing potential is driven by NCF1/p47Phox expression, whereas co-expression of SOD2 may limit ROS-mediated cellular damage. SELENOP protein acts as an antioxidant that contributes to cellular redox homeostasis and protection from oxidative damage [81,82], thus, we considered it as a potential modulator of ROS production. The t-SNE analysis indicated that SELENOP expression was downregulated in 27M-Mac and 27GM-Mac (Figure 9E—F); therefore, SELENOP is unlikely to directly contribute to enhanced ROS production in these cells.
3.5. Phagocytosis Activity
3.5.1. Comparison of Phagocytic Activity
To compare phagocytic activity among the four macrophage subtypes, we used a fluorescence microscopy-based assay and quantified phagocytosis as stained area per cell. Quantification was performed for 1,000 randomly selected cells using ImageJ [29]. All subsets were incubated with opsonized pHrodo BioParticles Red-labeled E. coli, and only internalized E. coli generated pHrodo Red signal (Figure 10A). Among the subtypes examined, M-Mac exhibited the highest phagocytic activity (Figure 10B). Phagocytic activity in 27M-Mac was significantly reduced by 64 ± 13% (n = 3) compared with M-Mac (p < 0.001) and was comparable to that in GM-Mac and 27GM-Mac. Thus, 27M-Mac displayed phagocytic activity similar to 27GM-Mac and GM-Mac.
3.5.2. Potential Mechanisms Regulating Phagocytosis
Since the phagocytosis of opsonized particles in 27M-Mac was markedly lower than in M-Mac (p < 0.001) but was comparable to GM-Mac and 27GM-Mac (Figure 10B), we hypothesized that the reduced phagocytosis in 27M-Mac was cause by the decrease in the expression of immunoglobulin G Fc receptors (FcγRs) on the cell surface. We therefore compared FcγR expression across the four subtypes. Flow cytometry showed that each MFI for CD16, CD32, and CD64 increased by approximately 5–10-fold in 27M-Mac and 27GM-Mac (Figure 11A). To determine whether total protein amounts increased, we performed WB on whole-cell lysates and then quantified the amount of each FcγR by normalizing to β-actin. This analysis demonstrated that total CD16 was 37 ± 1.5-fold higher in 27M-Mac than in M-Mac. In contrast, CD16 abundance in GM-Mac and 27GM-Mac was 5.3 ± 0.37-fold and 64 ± 2.9-fold higher than in M-Mac, respectively (Figure 11B and 11C). CD32 abundance in 27M-Mac was comparable to that in M-Mac, whereas CD32 in GM-Mac was ~20% of the M-Mac level. CD32 in 27GM-Mac increased by nearly 3-fold relative to GM-Mac (Figure 11C). CD64 abundance increased 4.0 ± 0.06-fold in 27M-Mac compared with M-Mac and increased 1.8 ± 0.02-fold in GM-Mac and 5.3 ± 0.01-fold in 27GM-Mac relative to M-Mac. As FcγR expression increased in 27M-Mac and 27GM-Mac, reduced phagocytosis was unlikely associated with FcγR expression levels. Instead, suppression may reflect intracellular regulations. Since residual phagocytic activity in 27M-Mac resembled that in GM-Mac and 27GM-Mac, we reasoned that 27M-Mac might upregulate genes encoding phagocytosis inhibitors and/or downregulate genes encoding phagocytosis inducers relative to M-Mac, with similar changes occurring in 27GM-Mac.
To identify potential regulators, we intersected each of the three DEG sets (27M.DEG, 27GM.DEG, and GM.DEG; Figure 12A–D) with 248 phagocytosis-associated genes (PAGs) curated from available phagocytosis databases (Table S4: https://maayanlab.cloud/Harmonizome/gene_set/phagocytosis/GO+Biological+Process+Annotations+2023; https://www.gsea-msigdb.org/gsea/msigdb/cards/%20GOBP_PHAGOCYTOSIS). Ten genes in 27M.DEG (Figure 12A), ten genes in 27GM.DEG (Figure 12B), and one gene in GM.DEG (Figure 12C) overlapped with the PAG list as 27M.PAGs, 27GM.PAG s and GM.PAG, respectively. To assess similarity between 27M-Mac and 27GM-Mac, we performed an additional Venn analysis, which identified seven overlapping PAGs between 27M.PAG and 27GM.PAG (Figure 12D). Among these seven genes, Ras-related protein B (RAB7B) and dysferlin (DYSF) encode intracellular proteins, whereas the remaining genes encode receptors or soluble factors. We therefore prioritized RAB7B and DYSF as candidate intracellular regulators of phagocytosis. DYSF is a negative regulator of phagocytosis, whereas RAB7B contributes to intracellular trafficking in macrophages [84]. qRT-PCR analysis in three independent donors confirmed expression patterns for these genes. RAB7B expression in 27M-Mac and GM-Mac was modestly reduced compared with M-Mac (Figure 12E). Although RAB7B expression in 27GM-Mac was significantly lower than that in M-Mac (p < 0.05), WB demonstrated that amounts of RAB7B protein expression did not significantly differ among the four subtypes (Figure 12F). In contrast, expression of the negative regulator DYSF was significantly increased in 27M-Mac and 27GM-Mac compared with M-Mac (n = 3, p < 0.01) and GM-Mac (n = 3, p < 0.05), respectively (Figure 12G). WB confirmed a 2.2 ± 0.02-fold increase in DYSF protein abundance in 27M-Mac relative to M-Mac (Figure 12F). Of interest, DYSF protein expression in GM-Mac was 57 ± 2% of M-Mac, while the protein expression in 27GM-Mac was comparable to 27M-Mac (DYSF in 27GM-Mac was 2.2 ± 0.06-fold higher than that in M-Mac), suggesting that the increased DYSF may contribute to phagocytic suppression in 27M-Mac and 27GM-Mac. Despite reduced phagocytic activity in GM-Mac, DYSF protein expression was suppressed, thus SLENOP may not play a key role in the inhibition of phagocytosis in the cell type. We next examined the distribution of RAB7B- and DYSF-expressing cells using t-SNE plots (Figure 12H and Supplementary Table S12). The fraction of cells expressing DYSF increased by ~ 4–5-fold in 27M-Mac and 27GM-Mac relative to M-Mac and GM-Mac, whereas RAB7B expression in 27M-Mac and 27GM-Mac decreased by ~30–50% relative to M-Mac (Supplementary Table S12).
3.6. Autophagy Induction
3.6.1. Comparison of Autophagy-Inducing Activity
IL-27 induces autophagy in human AB serum-differentiated macrophages [29], but the effects of IL-27 on autophagy induction in M-Mac and GM-Mac have not been investigated. Therefore, we compared autophagic activity among the four subsets (M-Mac, 27M-Mac, GM-Mac and 27GM-Mac). Cells were stained with Cyto-ID in the presence of chloroquine (CQ), and autophagy-inducing activity was assessed by fluorescence microscopy. To quantify the proportion of cells exhibiting autophagy, 1,000 cells were counted per condition, and CQ-dependent autophagy activity was quantified as the stained area per cell, as described previously [29]. GM-Mac exhibited 2.4 ± 0.1-fold higher basal autophagy activity than M-Mac (n = 3, p < 0.001). An effect of IL-27 on autophagy was observed only in 27M-Mac (Figure 13A). Specifically, IL-27 treatment of M-Mac, but not GM-Mac, increased the percentage of cells exhibiting autophagy by 2.1 ± 0.15-fold (n = 3, p < 0.001) compared with M-Mac and increased autophagy activity by 3.7 ± 0.5-fold (n = 3, p < 0.01) in 27M-Mac relative to M-Mac (Figure 13B–C). Thus, in terms of autophagy-inducing activity, 27M-Mac possessed autophagy activity comparable to that observed in GM-Mac and 27GM-Mac. And IL-27 treatment only enhanced autophagy in M-Mac not GM-Mac.
3.6.2. Potential Mechanism Underlying Autophagy Regulation
To elucidate mechanisms underlying enhanced autophagy in 27M-Mac and to identify genes potentially associated with autophagy, Venn diagram analysis was carried out using the 313 common 27M.DEGs (Figure 3A) with 1,115 human autophagy-related genes (ATGs) curated in the Autophagy Database (Supplementary Table S4; https://autophagy.info/download/download.html). This analysis identified eight ATGs within the 27M.DEG set (Figure 14A; Supplementary Table S9). Similarly, we intersected the 248 common 27GM.DEGs (Figure 3B) and the 25 common GM.DEGs (Figure 3C) with ATGs, identifying seven and one overlapping genes, respectively (Figure 4B –C; Supplementary Table S9). To determine whether any ATGs were shared among 27M-Mac, 27GM-Mac, and GM-Mac, we performed a Venn diagram analysis using the 27M.ATG, 27GM.ATG, and GM.ATG gene sets. No DEGs were common to all three subtypes (Figure 14D), suggesting that the mechanisms regulating autophagy differ across these cell types. Four genes (CDK1,EXOC3L1, SOD2, and MX1) overlapped between 27M-Mac and 27GM-Mac, whereas SLC1A2 was shared between GM-Mac and 27GM-Mac. The SLC1A2 gene product may contribute to basal autophagy in these cells. As IL-27 enhanced autophagy in 27M-Mac, four genes in the 27M.ATG (ARNTL2, SESN3, SLC7A11, and NFE2L3) were considered candidates mediating this induction. In scRNA-Seq data, three of these genes (all except SESN3) were induced ≥3-fold in both Donor A and Donor B (Supplementary Table S13). Autophagy was detected in >60% of 27M-Mac. To assess cellular distribution, expression of each candidate gene was examined by t-SNE analysis for Donor A (Figure 14E) and Donor B (Figure 14F) (Supplementary Table S14). Notably, NFE2L3 (nuclear factor erythroid 2-related factor 3) was expressed in 50% to 70% of 27M-Mac. Since NFE2L3 encodes a transcription factor, it is unlikely to directly regulate autophagy; however, it may promote autophagy by inducing downstream ATG expression in 27M-Mac.
4. Discussion
In the present study, we compared the effects of IL-27-mediated polarization of M-Mac and GM-Mac by assessing anti-HIV activity, ROS induction, phagocytosis, autophagy, cell surface marker expression, and gene expression profiles by scRNA-Seq. As shown in Table 1 and summarized in Table 2, 27M-Mac and 27GM-Mac exhibited transcriptional and phenotypic similarity, despite modest differences across select functional assays (blue-highlighted cells in Table 2).
M-Mac and GM-Mac exhibit distinct baseline phenotypes, however, upon IL-27 stimulation for 3-days, both subtypes activate overlapping STAT1- and STAT3-dependent signaling pathways, resulting in convergence toward a shared activation state characterized by common gene expression profiles and partially overlapping inflammatory and immunoregulatory functions (Figure 15).
M-CSF-differentiated MDMs (M2-like) can be polarized toward M2a, M2b, M2c, or M2d with appropriated stimulants, whereas GM-CSF-differentiated MDMs (M1-like) can be polarized toward classically activated M1 by a high concentration of IFN-γ or IFN-γ plus LPS stimulation [58,59,60,61,62]. Although IL-6 induces M2d [42,69,70,71] and IL-27 shares gp130 with IL-6, IL-27-polarized M-Mac was distinct from M2d [75], it was considered the possibility that 27M-Mac may resemble M1. However, the current study shows that 27M-Mac are most similar to 27GM-Mac. In preliminary experiments, 100 ng/ml of IFN-γ or a combination of 20 ng/ml IFN-γ plus 20 ng/mL of LPS-induced M1 macrophages were functionally distinct from 27M-Mac and 27GM-Mac. Specifically, the IFN-γ–induced M1 macrophages showed approximately 5-fold higher ROS induction, nearly 3-fold higher CD38 expression and approximately 5-fold higher C1q production compared with 27M-Mac and 27GM-Mac. Comparing the results of the current study with the observations from the preliminary studies suggests that 27M-Mac and 27GM-Mac represent either partially polarized M1 macrophages or a distinct macrophage subtype. Further characterization is needed to define these states and their relationship to canonical polarized cells. The effects of IL-27 on other macrophage subsets (for example, M2b, M2c, or M3) also remain to be determined and may clarify whether IL-27 facilitates macrophage plasticity in vitro. In vivo mouse studies indicate that IL-27 augments M1 induction and alters the M1/M2 ratio [85,86]. Our findings may explain a mechanism in the skewed ratio, since IL-27 can directly shift M2-like macrophages toward an M1-biased or M1-associated profile.
HIV host factors, including dependency and restriction factors [79], have been extensively defined in HIV-susceptible cell types using siRNA, shRNA, and CRISPR screening approaches. In the present study, scRNA-Seq was performed using cells from two donors, which limits the generalizability of the inferred gene expression profiles. Nevertheless, t-SNE visualization (Figure 4E and 4F) indicated that individual cells displayed heterogeneous expression of host factor genes following IL-27 polarization, thus a gold standard mechanism for anti-HIV activity may not exist in primary macrophages. These results suggest that antiviral mechanisms differ across individual macrophage subsets. Because 27M-Mac significantly suppressed HIV replication, with residual activity comparable to GM-Mac, we hypothesized that endogenous genes in GM-Mac contribute to HIV suppression and may also be induced in 27M-Mac. Venn diagram analysis identified MT1G and MT1H as genes meeting these criteria (Figure 4D). MT1G and MT1H are members of metallothionein family [87], and contribute metal ion (zinc and copper) homeostasis and protection against oxidative stress by scavenging ROS. Because oxidative stress has been reported to suppress HIV-1 replication [88], induction of MT1G and MT1H in cells may counteract the anti-HIV effect by buffering ROS. Therefore, despite their upregulation in 27M-Mac, MT1G and MT1H are unlikely to be the primary mediators of the anti-HIV activity. A total of 21 anti-HIV/host factor genes were identified as differentially expressed genes in 27M-Mac. The t-SNE plots demonstrated that APOBEC3A was uniquely and strongly induced in IL-27-treated cells compared to other cell types as reported by others [18] and APOBEC3A functions as anti-HIV in macrophages [89]. As demonstrated inSupplementary Table S8, 21 to 38% of 27M-Mac expressed APOBEC3A, yet suppressed HIV by over 90%, thereby indicating a potential collaborative effect between APOBEC3A and other factors in the suppression of HIV in 27M-Mac. The heterogeneity in the anti-viral gene expression suggests that mechanisms of antiviral effect may vary across individual macrophages. Consequently, the efficacy of viral suppression in 27M-Mac (and 27GM-Mac) may not be limited to HIV, but rather extend to other viruses, including RNA (such as influenza, SARS-COV2, Hepatitis C virus) and DNA virus (e.g. Hepatitis B virus, HSV, or the Cytomegalovirus).
Phagocytic activity in 27M-Mac and 27GM-Mac was reduced to 35% (p < 0.01) and 23% (p < 0.001) of that in M-Mac, respectively (Figure 10A and 10B). Among DEGs associated with phagocytosis, DYSF and RAB7B were shared between 27M-Mac and 27GM-Mac. Population composition analysis of the scRNA-Seq data demonstrated that 21–26% of 27M-Mac and 19–33% of 27GM-Mac expressed DYSF, which encodes a negative regulator of phagocytosis (Supplementary Table S7). In contrast, RAB7B, a positive regulator of phagocytosis, expressed in approximately 20% of 27M-Mac and 27GM-Mac. Notably, scRNA-Seq indicated that nearly 60% of 27M-Mac and 27GM-Mac lacked detectable expression of both genes (Supplementary Table S7), whereas >90% of 27M-Mac and >80% of 27GM-Mac displayed phagocytic activity. These findings suggest that the increased phagocytosis in IL-27-polarized macrophages may be regulated by additional gene products and/or by post-translational modification. GM-Mac also exhibited lower phagocytic activity than M-Mac. SPON2 was the only phagocytosis-associated gene identified in GM-Mac DEGs, and it encodes an extracellular matrix protein that regulates Fc-independent phagocytosis [90,91]. Additional factors may likely contribute to the reduced phagocytic activity of GM-Mac.
Autophagy assays showed that endogenous autophagy in GM-Mac was 3.7 ± 0.23-fold higher than in M-Mac. Thus, although M-Mac and GM-Mac are often described as naïve or resting macrophages, their baseline functional states differ with respect to HIV replication, phagocytosis, and autophagy. These differences may be governed by GM-associated transcriptional profiles, including the 27GM.DEG set. In our previous study, IL-27 treatment enhanced autophagy in human AB serum-induced macrophages (AB-Mac) [29]. The present study extends these observations by showing that IL-27 differentially modulates autophagy in M-Mac and GM-Mac. Venn diagram analysis of autophagy-related gene sets (27M.ATGs, 27GM.ATGs, and GM.ATGs) revealed no genes shared among all three cell types, suggesting that autophagy induction in 27M-Mac is regulated differently from the elevated basal autophagy observed in GM-Mac and 27GM-Mac. Consistent with this interpretation, four genes uniquely induced in 27M-Mac (ARNTL2, SLC7A11, SESN3, and NFE2L3) may contribute to autophagy induction. IL-27-enhacned autophagy in AB-Mac is induced through an LC3- and mTOR-independent mechanism [29]; therefore, the mechanism of driving enhanced autophagy in 27M-Mac may be similar.
In summary, this study shows that IL-27 polarizes M-Mac and GM-Mac toward a similar macrophage subset. These IL-27-polarized macrophages secrete CXCL9 and C1q and exhibit high expression of CD38, CD16, and CD64. In the present study, scRNA-Seq was performed using cells from two donors, which limits the generalizability of the inferred gene expression profiles. Further characterization of these IL-27-induced polarization should advance understanding of macrophage polarization and clarify the role of IL-27 in macrophage plasticity.
Supplementary Materials
The following supporting information can be downloaded at the website of this paper posted on Preprints.org.
Author Contributions
Conceptualization, T.I. ; Methodology, T.I. and U.K.; Validation, T.I., J.Y. and U.K.; Formal Analysis, T.I., J.Y, J.H., H.S.; Investigation, T.I., Q.C., U. K., M.M, J.M., H.N.S.; Resources, T.I..; Data Curation, T.I.; Writing – Original Draft Preparation, T.I.; Writing – Review &Editing, T.I., J.Y, .; Visualization, T.I.; Supervision, T.I.; Project Administration, M.B..; Funding Acquisition, T.I.,.:
Funding
The author(s) declared that financial support was received for the research, authorship, and/or publication of this article. This project has been funded in whole or in part with federal funds from the National Cancer Institute, National Institutes of Health, under Contract No. HHSN261200800001E. This research was supported [in part] by the National Institute of Allergy and Infectious Disease.
Institutional Review Board Statement
Approval of these studies, including all sample materials, was granted by the National Institute of Allergy and Infectious Diseases Institutional Review Board. All experimental procedures in these studies were approved by the National Cancer Institute at Frederick and Frederick National Laboratory for Cancer Research and were performed in accordance with the relevant guidelines and regulations (the protocol code number: IBC: 2016-19 A8 / 11-30, approval data: 8 August 2023).
Informed Consent Statement
Informed consent was obtained from all subjects involved in the study and all participants provided written consent prior to blood being drawn.:
Data Availability Statement
The sequencing Data has been deposited to SRA database at National Center for Biotechnology Information. the SRA database accession numbers : SAMN52956008, SAMN52956009, SAMN52956010, SAMN52956011, SAMN52956012, SAMN52956013, SAMN52956014, SAMN52956015, SAMN52956016, SAMN52956017. SAMN52956018. SAMN52956019. SRA records will be accessible with the following link after 2026-11-01 at https://www.ncbi.nlm.nih.gov/sra/PRJNA1354435.
Acknowledgments
The authors thank H.C. Lane for discussing this project, A. Jamanis for technical support, S. Laverdure for discussing data and technical support, and W. Chang for discussionThe content of this publication does not necessarily reflect the views or policies of the Department of Health and Human Services, nor does mention trade names, commercial products, or organizations imply endorsement by the U.S. Government. This research was supported (in part) by the National Institute of Allergy and Infectious Diseases.:
Conflicts of Interest
The authors declare no conflict of interest.
Abbreviations
The following abbreviations are used in this manuscript:
| ATGs | autophagy-related genes |
| CQ | Chloroquine |
| DEGs | differentially expressed genes |
| DYSF | dysferlin |
| FBS | fetal bovine serum |
| FPR2 | formyl peptide receptor 2 |
| GM-Mac | GM-CSF-induced macrophages |
| GM-CSF | Granulocyte-macrophage colony-stimulating factor |
| GCH1 | GTP cyclohydrolase 1 |
| AB-Mac | human AB serum-induced macrophages |
| IFN-g | IFN |
| IL-27R | IL-27 receptor |
| 27GM-Mac | IL-27-polarized GM-Mac |
| 27M-Mac | IL-27-polarized M-Mac |
| FcγRs | immunoglobulin G Fc receptors |
| IFN | interferon |
| ISGs | interferon-stimulated genes |
| IL-27 | Interleukin 27 |
| LRRK2 | leucine-rich repeat kinase 2 |
| LPS | lipopolysaccharide |
| M-CSF | Macrophage colony-stimulating factor |
| MMP8 | matrix metalloproteinase 8 |
| M-Mac | M-CSF-induced macrophages |
| MDMs | monocyte-derived macrophages |
| MOI | multiplicity of infection |
| NCF1 | neutrophil cytosolic factor 1 |
| PBMCs) | peripheral blood mononuclear cells |
| PMA) | phorbol 12-myristate 13-acetate |
| PID1 | phosphotyrosine interaction domain containing 1 |
| QC | quality control |
| qRT-PCR | Quantitative RT-PCR |
| RIPA | Radioimmunoprecipitation assay |
| RAB7B | Ras-related protein B |
| ROS | reactive oxygen species |
| SELENOP | selenoprotein P |
| scRNA-Seq | single-cell RNA sequencing |
| SOD2 | superoxide dismutase 2 |
| SNCA | synuclein alpha |
| t-SNE | t-distributed stochastic neighbor embedding |
| TGF-β | transforming growth factor β |
| WB | Western blotting |
References
- Pflanz, S.; Timans, J.C.; Cheung, J.; Rosales, R.; Kanzler, H.; Gilbert, J.; Hibbert, L.; Churakova, T.; Travis, M.; Vaisberg, E.; et al. IL-27, a heterodimeric cytokine composed of EBI3 and p28 protein, induces proliferation of naive CD4+ T cells. Immunity 2002, 16, 779–790. [Google Scholar] [CrossRef]
- Pflanz, S.; Hibbert, L.; Mattson, J.; Rosales, R.; Vaisberg, E.; Bazan, J.F.; Phillips, J.H.; McClanahan, T.K.; de Waal Malefyt, R.; Kastelein, R.A. WSX-1 and glycoprotein 130 constitute a signal-transducing receptor for IL-27. J. Immunol. 2004, 172, 2225–2231. [Google Scholar] [CrossRef] [PubMed]
- Aioi, A.; Imamichi, T. IL-27 regulates cytokine production as a double-edged sword in keratinocytes. Trends Immunother. 2022, 6, 23–31. [Google Scholar] [CrossRef]
- Fakruddin, J.M.; Lempicki, R.A.; Gorelick, R.J.; Yang, J.; Adelsberger, J.W.; Garcia-Pineres, A.J.; Pinto, L.A.; Lane, H.C.; Imamichi, T. Noninfectious papilloma virus-like particles inhibit HIV-1 replication: implications for immune control of HIV-1 infection by IL-27. Blood 2007, 109, 1841–1849. [Google Scholar] [CrossRef] [PubMed]
- Sowrirajan, B.; Saito, Y.; Poudyal, D.; Chen, Q.; Sui, H.; DeRavin, S.S.; Imamichi, H.; Sato, T.; Kuhns, D.B.; Noguchi, N.; et al. Interleukin-27 Enhances the Potential of Reactive Oxygen Species Generation from Monocyte-derived Macrophages and Dendritic cells by Induction of p47(phox). Sci. Rep. 2017, 7, 43441. [Google Scholar] [CrossRef]
- Bender, H.; Wiesinger, M.Y.; Nordhoff, C.; Schoenherr, C.; Haan, C.; Ludwig, S.; Weiskirchen, R.; Kato, N.; Heinrich, P.C.; Haan, S. Interleukin-27 displays interferon-gamma-like functions in human hepatoma cells and hepatocytes. Hepatology 2009, 50, 585–591. [Google Scholar] [CrossRef]
- Frank, A.C.; Zhang, X.; Katsounas, A.; Bharucha, J.P.; Kottilil, S.; Imamichi, T. Interleukin-27, an anti-HIV-1 cytokine, inhibits replication of hepatitis C virus. J. Interferon Cytokine Res. 2010, 30, 427–431. [Google Scholar] [CrossRef]
- Zhao, X.; Ting, S.M.; Liu, C.H.; Sun, G.; Kruzel, M.; Roy-O'Reilly, M.; Aronowski, J. Neutrophil polarization by IL-27 as a therapeutic target for intracerebral hemorrhage. Nat. Commun. 2017, 8, 602. [Google Scholar] [CrossRef]
- Hall, A.O.H.; Silver, J.S.; Hunter, C.A. Chapter 1 - The Immunobiology of IL-27. In Advances in Immunology; Alt, F.W., Ed.; Academic Press, 2012; Vol. 115, pp. 1–44. [Google Scholar]
- Imamichi, T.; Yang, J.; Huang, D.W.; Brann, T.W.; Fullmer, B.A.; Adelsberger, J.W.; Lempicki, R.A.; Baseler, M.W.; Lane, H.C. IL-27, a novel anti-HIV cytokine, activates multiple interferon-inducible genes in macrophages. Aids 2008, 22, 39–45. [Google Scholar] [CrossRef]
- Chen, Q.; Swaminathan, S.; Yang, D.; Dai, L.; Sui, H.; Yang, J.; Hornung, R.L.; Wang, Y.; Huang da, W.; Hu, X.; et al. Interleukin-27 is a potent inhibitor of cis HIV-1 replication in monocyte-derived dendritic cells via a type I interferon-independent pathway. PLoS One 2013, 8, e59194. [Google Scholar] [CrossRef]
- Dai, L.; Lidie, K.B.; Chen, Q.; Adelsberger, J.W.; Zheng, X.; Huang, D.; Yang, J.; Lempicki, R.A.; Rehman, T.; Dewar, R.L. IL-27 inhibits HIV-1 infection in human macrophages by down-regulating host factor SPTBN1 during monocyte to macrophage differentiation. J. Exp. Med. 2013, 210, 517–534. [Google Scholar] [CrossRef] [PubMed]
- Cao, Y.; Zhang, R.; Zhang, W.; Zhu, C.; Yu, Y.; Song, Y.; Wang, Q.; Bai, L.; Liu, Y.; Wu, K.; et al. IL-27, a cytokine, and IFN-λ1, a type III IFN, are coordinated to regulate virus replication through type I IFN. J. Immunol. 2014, 192, 691–703. [Google Scholar] [CrossRef] [PubMed]
- Tan, G.; Xiao, Q.; Song, H.; Ma, F.; Xu, F.; Peng, D.; Li, N.; Wang, X.; Niu, J.; Gao, P.; et al. Type I IFN augments IL-27-dependent TRIM25 expression to inhibit HBV replication. Cell Mol. Immunol. 2018, 15, 272–281. [Google Scholar] [CrossRef] [PubMed]
- Garg, A.; Trout, R.; Spector, S.A. Human Immunodeficiency Virus Type-1 Myeloid Derived Suppressor Cells Inhibit Cytomegalovirus Inflammation through Interleukin-27 and B7-H4. Sci. Rep. 2017, 7, 44485. [Google Scholar] [CrossRef]
- Zhu, H.; Lou, C.; Liu, P. Interleukin-27 ameliorates coxsackievirus-B3-induced viral myocarditis by inhibiting Th17 cells. Virol. J. 2015, 12, 189. [Google Scholar] [CrossRef]
- Zeng, R.; Zhang, H.; Hai, Y.; Cui, Y.; Wei, L.; Li, N.; Liu, J.; Li, C.; Liu, Y. Interleukin-27 inhibits vaccine-enhanced pulmonary disease following respiratory syncytial virus infection by regulating cellular memory responses. J. Virol. 2012, 86, 4505–4517. [Google Scholar] [CrossRef]
- Valdés-López, J.F.; Hernández-Sarmiento, L.J.; Tamayo-Molina, Y.S.; Velilla-Hernández, P.A.; Rodenhuis-Zybert, I.A.; Urcuqui-Inchima, S. Interleukin 27, like interferons, activates JAK-STAT signaling and promotes pro-inflammatory and antiviral states that interfere with dengue and chikungunya viruses replication in human macrophages. Front. Immunol. 2024, 15, 1385473. [Google Scholar] [CrossRef]
- Valdés-López, J.F.; Fernandez, G.J.; Urcuqui-Inchima, S. Interleukin 27 as an inducer of antiviral response against chikungunya virus infection in human macrophages. Cell Immunol. 2021, 367, 104411. [Google Scholar] [CrossRef]
- Kwock, J.T.; Handfield, C.; Suwanpradid, J.; Hoang, P.; McFadden, M.J.; Labagnara, K.F.; Floyd, L.; Shannon, J.; Uppala, R.; Sarkar, M.K. IL-27 signaling activates skin cells to induce innate antiviral proteins and protects against Zika virus infection. Sci. Adv. 2020, 6, eaay3245. [Google Scholar] [CrossRef]
- Hernández-Sarmiento, L.J.; Tamayo-Molina, Y.; Valdés-López, J.F.; Urcuqui-Inchima, S. Interleukin 27, Similar to Interferons, Modulates Gene Expression of Tripartite Motif (TRIM) Family Members and Interferes with Mayaro Virus Replication in Human Macrophages. Viruses 2024, 16, 996. [Google Scholar] [CrossRef]
- Korobova, Z.R.; Arsentieva, N.A.; Santoni, A.; Totolian, A.A. Role of IL-27 in COVID-19: A Thin Line between Protection and Disease Promotion. Int. J. Mol. Sci. 2024, 25. [Google Scholar] [CrossRef] [PubMed]
- Valdés-López, J.F.; Urcuqui-Inchima, S. Antiviral response and immunopathogenesis of interleukin 27 in COVID-19. Arch. Virol. 2023, 168, 178. [Google Scholar] [CrossRef] [PubMed]
- Greenwell-Wild, T.; Vázquez, N.; Jin, W.; Rangel, Z.; Munson, P.J.; Wahl, S.M. Interleukin-27 inhibition of HIV-1 involves an intermediate induction of type I interferon. Blood 2009, 114, 1864–1874. [Google Scholar] [CrossRef] [PubMed]
- Guzzo, C.; Jung, M.; Graveline, A.; Banfield, B.W.; Gee, K. IL-27 increases BST-2 expression in human monocytes and T cells independently of type I IFN. Sci. Rep. 2012, 2, 974. [Google Scholar] [CrossRef]
- Swaminathan, S.; Dai, L.; Lane, H.C.; Imamichi, T. Evaluating the potential of IL-27 as a novel therapeutic agent in HIV-1 infection. Cytokine Growth Factor Rev. 2013, 24, 571–577. [Google Scholar] [CrossRef]
- Imamichi, T.; Bai, X.-F.; Robinson, C.; Gee, K. IL-27 in health and disease; Frontiers Media SA, 2023; Vol. 14, p. 1191228. [Google Scholar]
- Imamichi, T.; Yang, J.; Chen, Q.; Goswami, S.; Marquez, M.; Kariyawasam, U.; Sharma, H.N.; Wiscovitch-Russo, R.; Li, X.; Aioi, A.; et al. Interleukin-27-polarized HIV-resistant M2 macrophages are a novel subtype of macrophages that express distinct antiviral gene profiles in individual cells: implication for the antiviral effect via different mechanisms in the individual cell-dependent manner. Front. Immunol. 2025, 16, 1550699. [Google Scholar] [CrossRef]
- Laverdure, S.; Wang, Z.; Yang, J.; Yamamoto, T.; Thomas, T.; Sato, T.; Nagashima, K.; Imamichi, T. Interleukin-27 promotes autophagy in human serum-induced primary macrophages via an mTOR- and LC3-independent pathway. Sci. Rep. 2021, 11, 14898. [Google Scholar] [CrossRef]
- Helps, T.; Baker, C.; Wilson, H.M.; Arthur, S.; Murray, G.I.; McLean, M.H. Characterising interleukin-27 (IL-27) responses in human blood derived macrophage cells. Cytokine 2026, 198, 157097. [Google Scholar] [CrossRef]
- Gordon, S. Alternative activation of macrophages. Nat. Rev. Immunol. 2003, 3, 23–35. [Google Scholar] [CrossRef]
- Gordon, S.; Martinez, F.O. Alternative activation of macrophages: mechanism and functions. Immunity 2010, 32, 593–604. [Google Scholar] [CrossRef]
- Mantovani, A.; Sica, A. Macrophages, innate immunity and cancer: balance, tolerance, and diversity. Curr. Opin. Immunol. 2010, 22, 231–237. [Google Scholar] [CrossRef] [PubMed]
- Hume, D.A. Macrophages as APC and the dendritic cell myth. J. Immunol. 2008, 181, 5829–5835. [Google Scholar] [CrossRef] [PubMed]
- Arango Duque, G.; Descoteaux, A. Macrophage cytokines: involvement in immunity and infectious diseases. Front. Immunol. 2014, 5, 491. [Google Scholar] [CrossRef] [PubMed]
- Unanue, E.R. Antigen-presenting function of the macrophage. Annu. Rev. Immunol. 1984, 2, 395–428. [Google Scholar] [CrossRef]
- Jay Forman, H.; Torres, M. Redox signaling in macrophages. Mol. Asp. Med. 2001, 22, 189–216. [Google Scholar] [CrossRef]
- Jones, G.E. Cellular signaling in macrophage migration and chemotaxis. J. Leukoc. Biol. 2000, 68, 593–602. [Google Scholar] [CrossRef]
- Lewis, C.E.; Pollard, J.W. Distinct role of macrophages in different tumor microenvironments. Cancer Res. 2006, 66, 605–612. [Google Scholar] [CrossRef]
- Martinez, F.O.; Gordon, S. The M1 and M2 paradigm of macrophage activation: time for reassessment. F1000Prime Rep. 2014, 6, 13. [Google Scholar] [CrossRef]
- Italiani, P.; Boraschi, D. From Monocytes to M1/M2 Macrophages: Phenotypical vs. Functional Differentiation. Front. Immunol. 2014, 5, 514. [Google Scholar] [CrossRef]
- Nakai, K. Multiple roles of macrophage in skin. J. Dermatol. Sci. 2021, 104, 2–10. [Google Scholar] [CrossRef]
- Naito, Y.; Takagi, T.; Higashimura, Y. Heme oxygenase-1 and anti-inflammatory M2 macrophages. Arch. Biochem. Biophys. 2014, 564, 83–88. [Google Scholar] [CrossRef] [PubMed]
- Chinetti-Gbaguidi, G.; Colin, S.; Staels, B. Macrophage subsets in atherosclerosis. Nat. Rev. Cardiol. 2015, 12, 10–17. [Google Scholar] [CrossRef]
- Blagov, A.V.; Markin, A.M.; Bogatyreva, A.I.; Tolstik, T.V.; Sukhorukov, V.N.; Orekhov, A.N. The role of macrophages in the pathogenesis of atherosclerosis. Cells 2023, 12, 522. [Google Scholar] [CrossRef] [PubMed]
- Chistiakov, D.A.; Bobryshev, Y.V.; Orekhov, A.N. Changes in transcriptome of macrophages in atherosclerosis. J. Cell. Mol. Med. 2015, 19, 1163–1173. [Google Scholar] [CrossRef] [PubMed]
- Jackaman, C.; Yeoh, T.L.; Acuil, M.L.; Gardner, J.K.; Nelson, D.J. Murine mesothelioma induces locally-proliferating IL-10(+)TNF-α(+)CD206(-)CX3CR1(+) M3 macrophages that can be selectively depleted by chemotherapy or immunotherapy. Oncoimmunology 2016, 5, e1173299. [Google Scholar] [CrossRef]
- Kalish, S.; Lyamina, S.; Manukhina, E.; Malyshev, Y.; Raetskaya, A.; Malyshev, I. M3 Macrophages Stop Division of Tumor Cells In Vitro and Extend Survival of Mice with Ehrlich Ascites Carcinoma. Med. Sci. Monit. Basic. Res. 2017, 23, 8–19. [Google Scholar] [CrossRef]
- Schoggins, J.W.; Wilson, S.J.; Panis, M.; Murphy, M.Y.; Jones, C.T.; Bieniasz, P.; Rice, C.M. A diverse range of gene products are effectors of the type I interferon antiviral response. Nature 2011, 472, 481–485. [Google Scholar] [CrossRef]
- Malyshev, I.; Malyshev, Y. Current Concept and Update of the Macrophage Plasticity Concept: Intracellular Mechanisms of Reprogramming and M3 Macrophage "Switch" Phenotype. Biomed. Res. Int. 2015, 2015, 341308. [Google Scholar] [CrossRef]
- Zitta, K.; Hummitzsch, L.; Lichte, F.; Fändrich, F.; Steinfath, M.; Eimer, C.; Kapahnke, S.; Buerger, M.; Hess, K.; Rusch, M.; et al. Effects of temporal IFNγ exposure on macrophage phenotype and secretory profile: exploring GMP-Compliant production of a novel subtype of regulatory macrophages (Mreg(IFNγ0)) for potential cell therapeutic applications. J. Transl. Med. 2024, 22, 534. [Google Scholar] [CrossRef]
- Zhang, F.; Zhang, J.; Cao, P.; Sun, Z.; Wang, W. The characteristics of regulatory macrophages and their roles in transplantation. Int. Immunopharmacol. 2021, 91, 107322. [Google Scholar] [CrossRef]
- Chávez-Galán, L.; Olleros, M.L.; Vesin, D.; Garcia, I. Much More than M1 and M2 Macrophages, There are also CD169(+) and TCR(+) Macrophages. Front. Immunol. 2015, 6, 263. [Google Scholar] [CrossRef]
- Martinez, F.O.; Gordon, S.; Locati, M.; Mantovani, A. Transcriptional profiling of the human monocyte-to-macrophage differentiation and polarization: new molecules and patterns of gene expression. J. Immunol. 2006, 177, 7303–7311. [Google Scholar] [CrossRef] [PubMed]
- Fleetwood, A.J.; Lawrence, T.; Hamilton, J.A.; Cook, A.D. Granulocyte-macrophage colony-stimulating factor (CSF) and macrophage CSF-dependent macrophage phenotypes display differences in cytokine profiles and transcription factor activities: implications for CSF blockade in inflammation. J. Immunol. 2007, 178, 5245–5252. [Google Scholar] [CrossRef] [PubMed]
- Trus, E.; Basta, S.; Gee, K. Who’s in charge here? Macrophage colony stimulating factor and granulocyte macrophage colony stimulating factor: Competing factors in macrophage polarization. Cytokine 2020, 127, 154939. [Google Scholar] [CrossRef]
- Hickman, E.; Smyth, T.; Cobos-Uribe, C.; Immormino, R.; Rebuli, M.E.; Moran, T.; Alexis, N.E.; Jaspers, I. Expanded characterization of in vitro polarized M0, M1, and M2 human monocyte-derived macrophages: Bioenergetic and secreted mediator profiles. PLoS One 2023, 18, e0279037. [Google Scholar] [CrossRef]
- Murray, P.J.; Wynn, T.A. Protective and pathogenic functions of macrophage subsets. Nat. Rev. Immunol. 2011, 11, 723–737. [Google Scholar] [CrossRef]
- Gao, C.H.; Dong, H.L.; Tai, L.; Gao, X.M. Lactoferrin-Containing Immunocomplexes Drive the Conversion of Human Macrophages from M2- into M1-like Phenotype. Front. Immunol. 2018, 9, 37. [Google Scholar] [CrossRef]
- Liao, Z.X.; Ou, D.L.; Hsieh, M.J.; Hsieh, C.C. Synergistic Effect of Repolarization of M2 to M1 Macrophages Induced by Iron Oxide Nanoparticles Combined with Lactate Oxidase. Int. J. Mol. Sci. 2021, 22. [Google Scholar] [CrossRef]
- Vidyarthi, A.; Khan, N.; Agnihotri, T.; Negi, S.; Das, D.K.; Aqdas, M.; Chatterjee, D.; Colegio, O.R.; Tewari, M.K.; Agrewala, J.N. TLR-3 Stimulation Skews M2 Macrophages to M1 Through IFN-αβ Signaling and Restricts Tumor Progression. Front. Immunol. 2018, 9, 1650. [Google Scholar] [CrossRef]
- Yunna, C.; Mengru, H.; Lei, W.; Weidong, C. Macrophage M1/M2 polarization. Eur. J. Pharmacol. 2020, 877, 173090. [Google Scholar] [CrossRef]
- Murray, P.J. Macrophage polarization. Annu. Rev. Physiol. 2017, 79, 541–566. [Google Scholar] [CrossRef] [PubMed]
- Yao, Y.; Xu, X.H.; Jin, L. Macrophage Polarization in Physiological and Pathological Pregnancy. Front. Immunol. 2019, 10, 792. [Google Scholar] [CrossRef] [PubMed]
- Yao, Y.; Xu, X.-H.; Jin, L. Macrophage polarization in physiological and pathological pregnancy. Front. Immunol. 2019, 10, 792. [Google Scholar] [CrossRef]
- Xue, J.; Schmidt, S.V.; Sander, J.; Draffehn, A.; Krebs, W.; Quester, I.; De Nardo, D.; Gohel, T.D.; Emde, M.; Schmidleithner, L.; et al. Transcriptome-based network analysis reveals a spectrum model of human macrophage activation. Immunity 2014, 40, 274–288. [Google Scholar] [CrossRef] [PubMed]
- Tarique, A.A.; Logan, J.; Thomas, E.; Holt, P.G.; Sly, P.D.; Fantino, E. Phenotypic, functional, and plasticity features of classical and alternatively activated human macrophages. Am. J. Respir. Cell Mol. Biol. 2015, 53, 676–688. [Google Scholar] [CrossRef]
- Lavrich, K.S.; Speen, A.M.; Ghio, A.J.; Bromberg, P.A.; Samet, J.M.; Alexis, N.E. Macrophages from the upper and lower human respiratory tract are metabolically distinct. Am. J. Physiol. Lung Cell Mol. Physiol. 2018, 315, L752–l764. [Google Scholar] [CrossRef]
- Wang, Q.; Ni, H.; Lan, L.; Wei, X.; Xiang, R.; Wang, Y. Fra-1 protooncogene regulates IL-6 expression in macrophages and promotes the generation of M2d macrophages. Cell Res. 2010, 20, 701–712. [Google Scholar] [CrossRef]
- Wang, Y.; Smith, W.; Hao, D.; He, B.; Kong, L. M1 and M2 macrophage polarization and potentially therapeutic naturally occurring compounds. Int. Immunopharmacol. 2019, 70, 459–466. [Google Scholar] [CrossRef]
- Ferrante, C.J.; Leibovich, S.J. Regulation of Macrophage Polarization and Wound Healing. Adv Wound Care (New Rochelle) 2012, 1, 10–16. [Google Scholar] [CrossRef]
- Porta, C.; Riboldi, E.; Ippolito, A.; Sica, A. Molecular and epigenetic basis of macrophage polarized activation. Proceedings of Seminars in immunology; pp. 237–248.
- Wang, N.; Liang, H.; Zen, K. Molecular mechanisms that influence the macrophage M1–M2 polarization balance. Front. Immunol. 2014, 5, 614. [Google Scholar] [CrossRef]
- Shapouri-Moghaddam, A.; Mohammadian, S.; Vazini, H.; Taghadosi, M.; Esmaeili, S.A.; Mardani, F.; Seifi, B.; Mohammadi, A.; Afshari, J.T.; Sahebkar, A. Macrophage plasticity, polarization, and function in health and disease. J. Cell. Physiol. 2018, 233, 6425–6440. [Google Scholar] [CrossRef] [PubMed]
- Imamichi, T.; Yang, J.; Chen, Q.; Goswami, S.; Marquez, M.; Kariyawasam, U.; Sharma, H.N.; Wiscovitch-Russo, R.; Li, X.; Aioi, A. Interleukin-27-polarized HIV-resistant M2 macrophages are a novel subtype of macrophages that express distinct antiviral gene profiles in individual cells: implication for the antiviral effect via different mechanisms in the individual cell-dependent manner. Front. Immunol. 2025, 16, 1550699. [Google Scholar]
- Theodore, T.S.; Englund, G.; Buckler-White, A.; Buckler, C.E.; Martin, M.A.; Peden, K.W. Construction and characterization of a stable full-length macrophage-tropic HIV type 1 molecular clone that directs the production of high titers of progeny virions. AIDS Res. Hum. Retroviruses 1996, 12, 191–194. [Google Scholar] [CrossRef] [PubMed]
- Imamichi, T.; Chen, Q.; Sowrirajan, B.; Yang, J.; Laverdure, S.; Marquez, M.; Mele, A.R.; Watkins, C.; Adelsberger, J.W.; Higgins, J.; et al. Interleukin-27-induced HIV-resistant dendritic cells suppress reveres transcription following virus entry in an SPTBN1, autophagy, and YB-1 independent manner. PLoS One 2023, 18, e0287829. [Google Scholar] [CrossRef]
- Rőszer, T. Understanding the mysterious M2 macrophage through activation markers and effector mechanisms. Mediat. Inflamm. 2015, 2015, 816460. [Google Scholar] [CrossRef]
- Harris, R.S.; Hultquist, J.F.; Evans, D.T. The restriction factors of human immunodeficiency virus. J. Biol. Chem. 2012, 287, 40875–40883. [Google Scholar] [CrossRef]
- Bime, C.; Zhou, T.; Wang, T.; Slepian, M.J.; Garcia, J.G.; Hecker, L. Reactive oxygen species-associated molecular signature predicts survival in patients with sepsis. Pulm. Circ. 2016, 6, 196–201. [Google Scholar] [CrossRef]
- Guo, Y.; Chang, G.; Wan, R.; Zhang, X.; Ma, Z.; Bai, H.; Wang, J. Discovery of a novel ROS-based signature for predicting prognosis and immunosuppressive tumor microenvironment in lung adenocarcinoma. J. Cancer 2024, 15, 2691–2711. [Google Scholar] [CrossRef]
- Cen, K.; Wu, Z.; Mai, Y.; Dai, Y.; Hong, K.; Guo, Y. Identification of a novel reactive oxygen species (ROS)-related genes model combined with RT-qPCR experiments for prognosis and immunotherapy in gastric cancer. Front. Genet. 2023, 14, 1074900. [Google Scholar] [CrossRef]
- Yang, J.; Li, S.; He, J.; Xu, Q.; Xie, M.; Yang, C.; Wang, H.; Zhang, Y.; Wan, Q.; Xiang, M. Dual role of PID1 in regulating apoptosis induced by distinct anticancer-agents through AKT/Raf-1-dependent pathway in hepatocellular carcinoma. Cell Death Discov. 2023, 9, 139. [Google Scholar] [CrossRef]
- Sender, V.; Moulakakis, C.; Stamme, C. Pulmonary surfactant protein A enhances endolysosomal trafficking in alveolar macrophages through regulation of Rab7. J. Immunol. 2011, 186, 2397–2411. [Google Scholar] [CrossRef]
- Chiba, Y.; Mizoguchi, I.; Furusawa, J.; Hasegawa, H.; Ohashi, M.; Xu, M.; Owaki, T.; Yoshimoto, T. Interleukin-27 Exerts Its Antitumor Effects by Promoting Differentiation of Hematopoietic Stem Cells to M1 Macrophages. Cancer Res. 2018, 78, 182–194. [Google Scholar] [CrossRef] [PubMed]
- Ye, L.; Wang, L.; Kuang, G.; Zhang, Z.; Peng, Q.; He, M.; Fan, J. IL-27 aggravates acute hepatic injury by promoting macrophage M1 polarization to induce Caspase-11 mediated Pyroptosis in vitro and in vivo. Cytokine 2025, 188, 156881. [Google Scholar] [CrossRef] [PubMed]
- Thirumoorthy, N.; Manisenthil Kumar, K.T.; Shyam Sundar, A.; Panayappan, L.; Chatterjee, M. Metallothionein: an overview. World J. Gastroenterol. 2007, 13, 993–996. [Google Scholar] [CrossRef] [PubMed]
- Sandstrom, P.A.; Murray, J.; Folks, T.M.; Diamond, A.M. Antioxidant defenses influence HIV-1 replication and associated cytopathic effects. Free Radic. Biol. Med. 1998, 24, 1485–1491. [Google Scholar] [CrossRef]
- Peng, G.; Greenwell-Wild, T.; Nares, S.; Jin, W.; Lei, K.J.; Rangel, Z.G.; Munson, P.J.; Wahl, S.M. Myeloid differentiation and susceptibility to HIV-1 are linked to APOBEC3 expression. Blood 2007, 110, 393–400. [Google Scholar] [CrossRef]
- He, Y.W.; Li, H.; Zhang, J.; Hsu, C.L.; Lin, E.; Zhang, N.; Guo, J.; Forbush, K.A.; Bevan, M.J. The extracellular matrix protein mindin is a pattern-recognition molecule for microbial pathogens. Nat. Immunol. 2004, 5, 88–97. [Google Scholar] [CrossRef]
- Zhang, Y.L.; Li, Q.; Yang, X.M.; Fang, F.; Li, J.; Wang, Y.H.; Yang, Q.; Zhu, L.; Nie, H.Z.; Zhang, X.L.; et al. SPON2 Promotes M1-like Macrophage Recruitment and Inhibits Hepatocellular Carcinoma Metastasis by Distinct Integrin-Rho GTPase-Hippo Pathways. Cancer Res. 2018, 78, 2305–2317. [Google Scholar] [CrossRef]
Figure 1.
Comparison of HIV replication. M-Mac and GM-Mac were cultured for 3–days in the absence or presence of 100 ng/ml IL-27. The untreated cells (M-Mac and GM-Mac), IL-27–treated/polarized cells (27M-Mac and 27GM-Mac) were infected with HIVAD8 at 5000 TCID50/ 1x10⁶ cells [multiplicity of infection (MOI) = 0.005] for 2 hrs at 37°C. The infected cells were cultured in 200 µL D10 medium for 14 days with half of the medium changed every 3 to 4 days with fresh warm D10 medium in 96-well plates. All replication assays were conducted in quadruplicate, and HIV-1 replication was determined by measuring the p24 antigen in the culture supernatants using the p24 antigen capture assay kit (PerkinElmer, Boston, MA, USA). Results show mean ± SE from four independent assay. Statistical analysis was conducted using One way ANOVA. ****: p<0.001, ns: not significant.
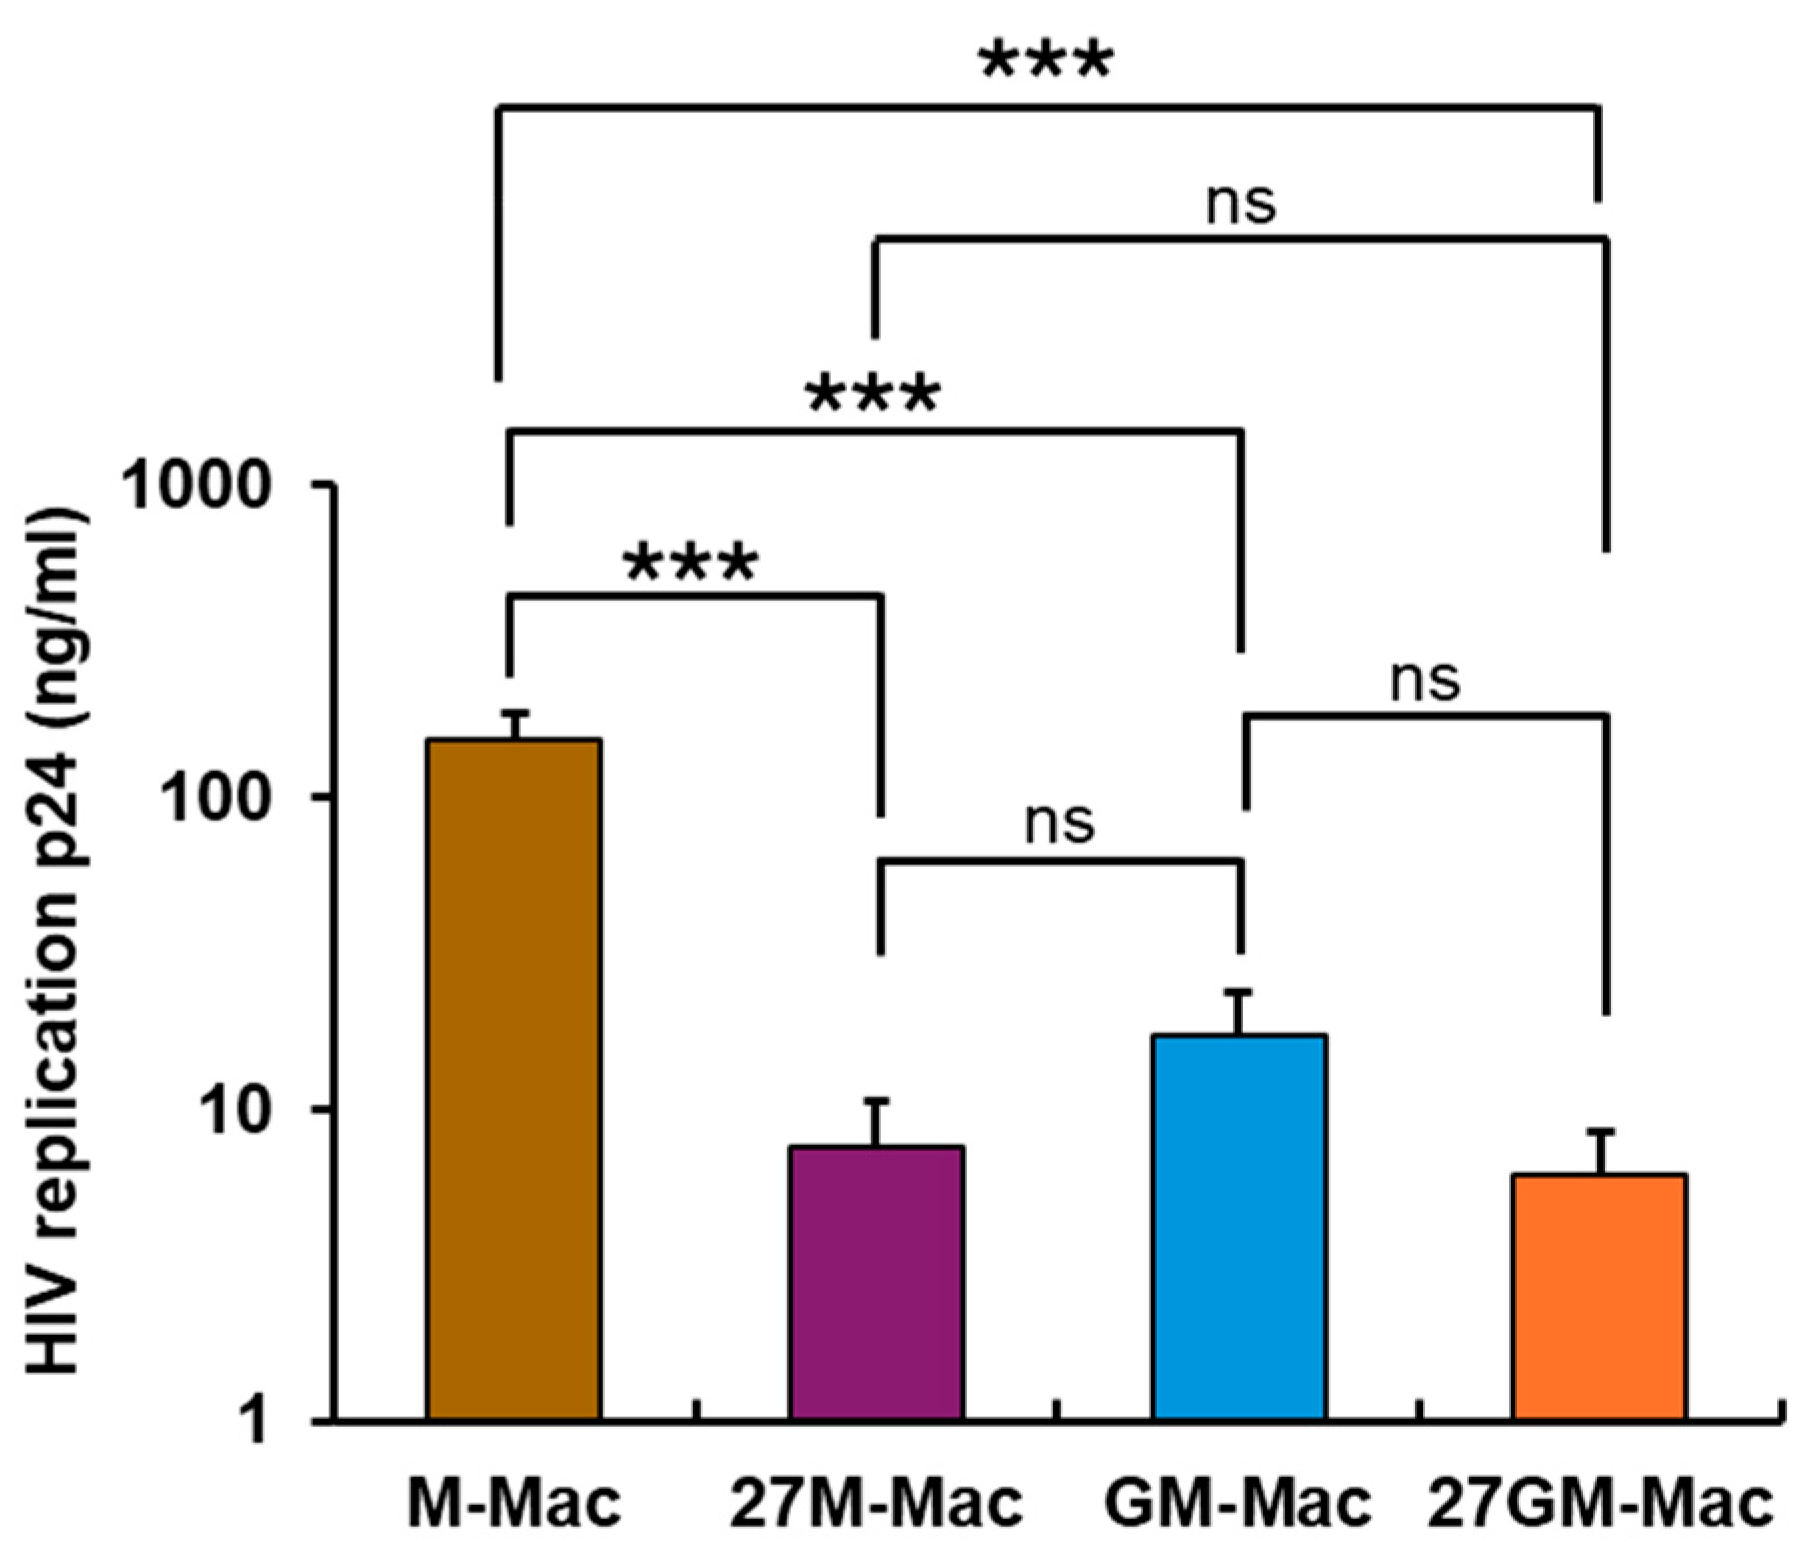
Figure 2.
The scRNA-Seq analysis. The scRNA-Seq using fresh M-Mac, 27M-Mac, GM-Mac, and 27GM-Mac cells from two independent donors, Donor A (A) and Donor B (B), was conducted as described in Materials and Methods. (A and B) t-distributed Stochastic Neighbor Embedding (t-SNE) plot was used for clustering and visualization. Each dot indicate single cells; M-Mac is brown, 27M-Mac is purple, GM-Mac is blue and 27GM-Mac is yellow.
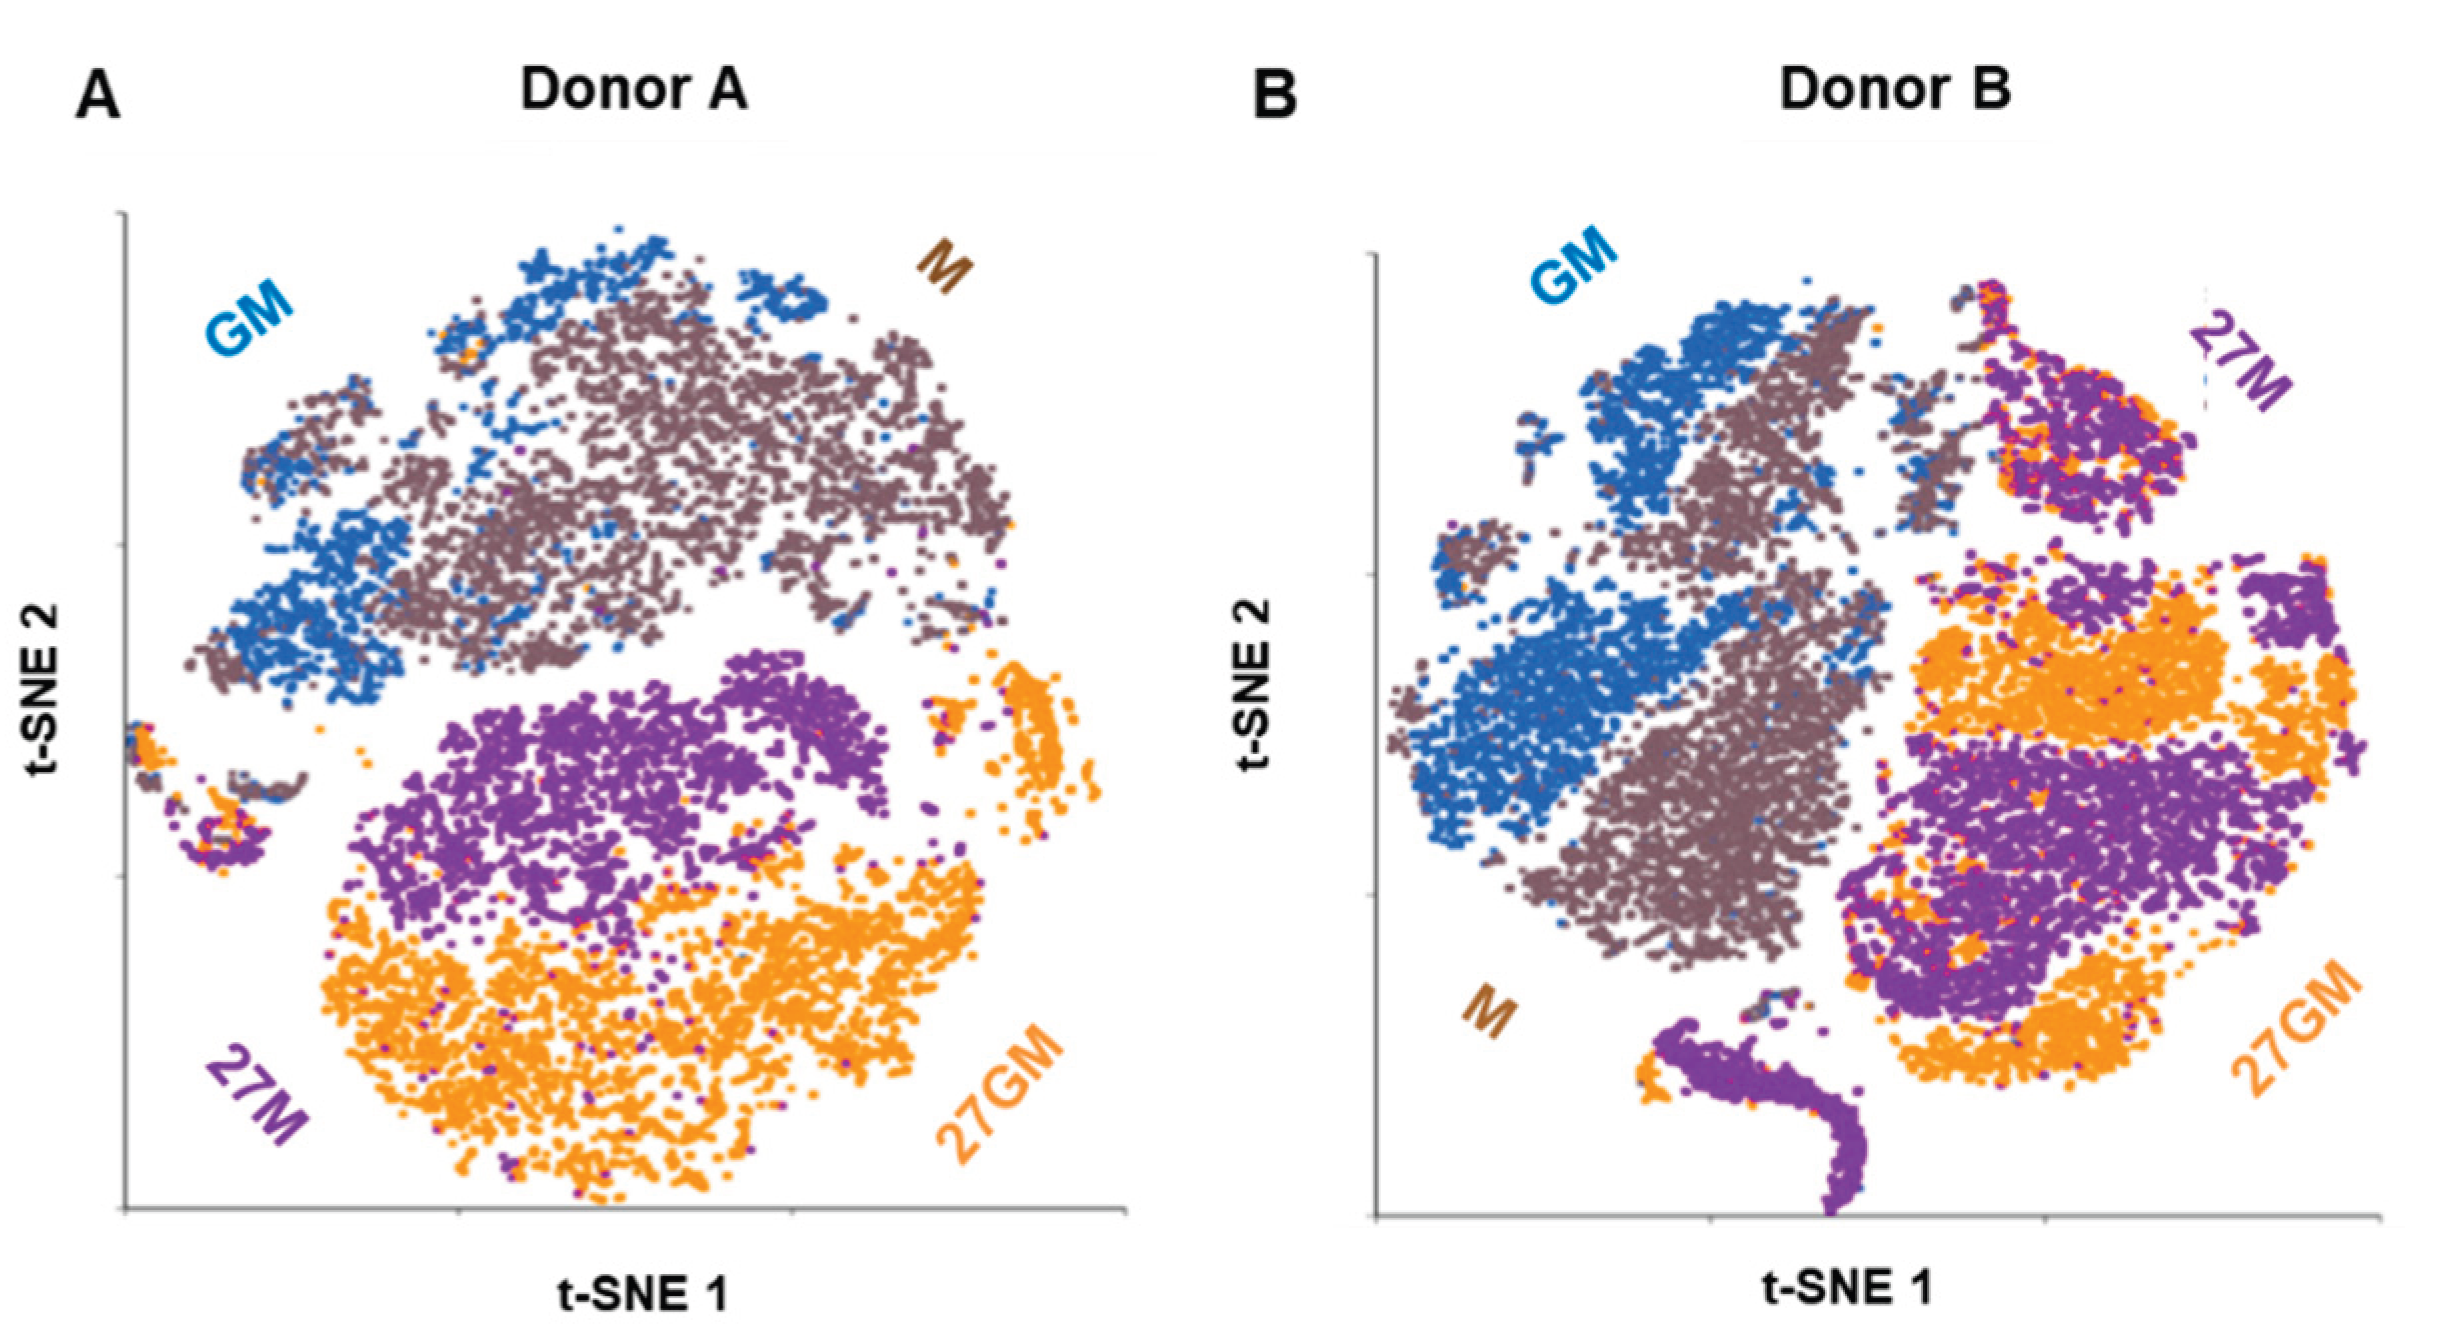
Figure 3.
Extraction of common DEGs compared to M-Mac cells and . (A–C) To identify the common DEGs between donor A and donor B for each cell type gene expression profiles of 27M-Mac, GM-Mac and 27GM-Mac were compared to that in M-Mac within each donor. Differentials expression was defined as genes exhibiting a greater than 3–fold change up- or down-regulation with a p-value less than 0.05. DEGs identified from comparisons of 27M-Mac vs. M-Mac (27M vs. M), GM-Mac vs M-Mac (GM vs. M), and 27GM-Mac (27GM vs. M) were then intersected between donors to define common DEGs using Venn diagrams. (D-F) The functional enrichment analyses of the common DEGs was conducted using Metascape (Metascape.Org) for 27M.DEGs (D). GM.DEGs (E), and 27GM.DEGs (F).
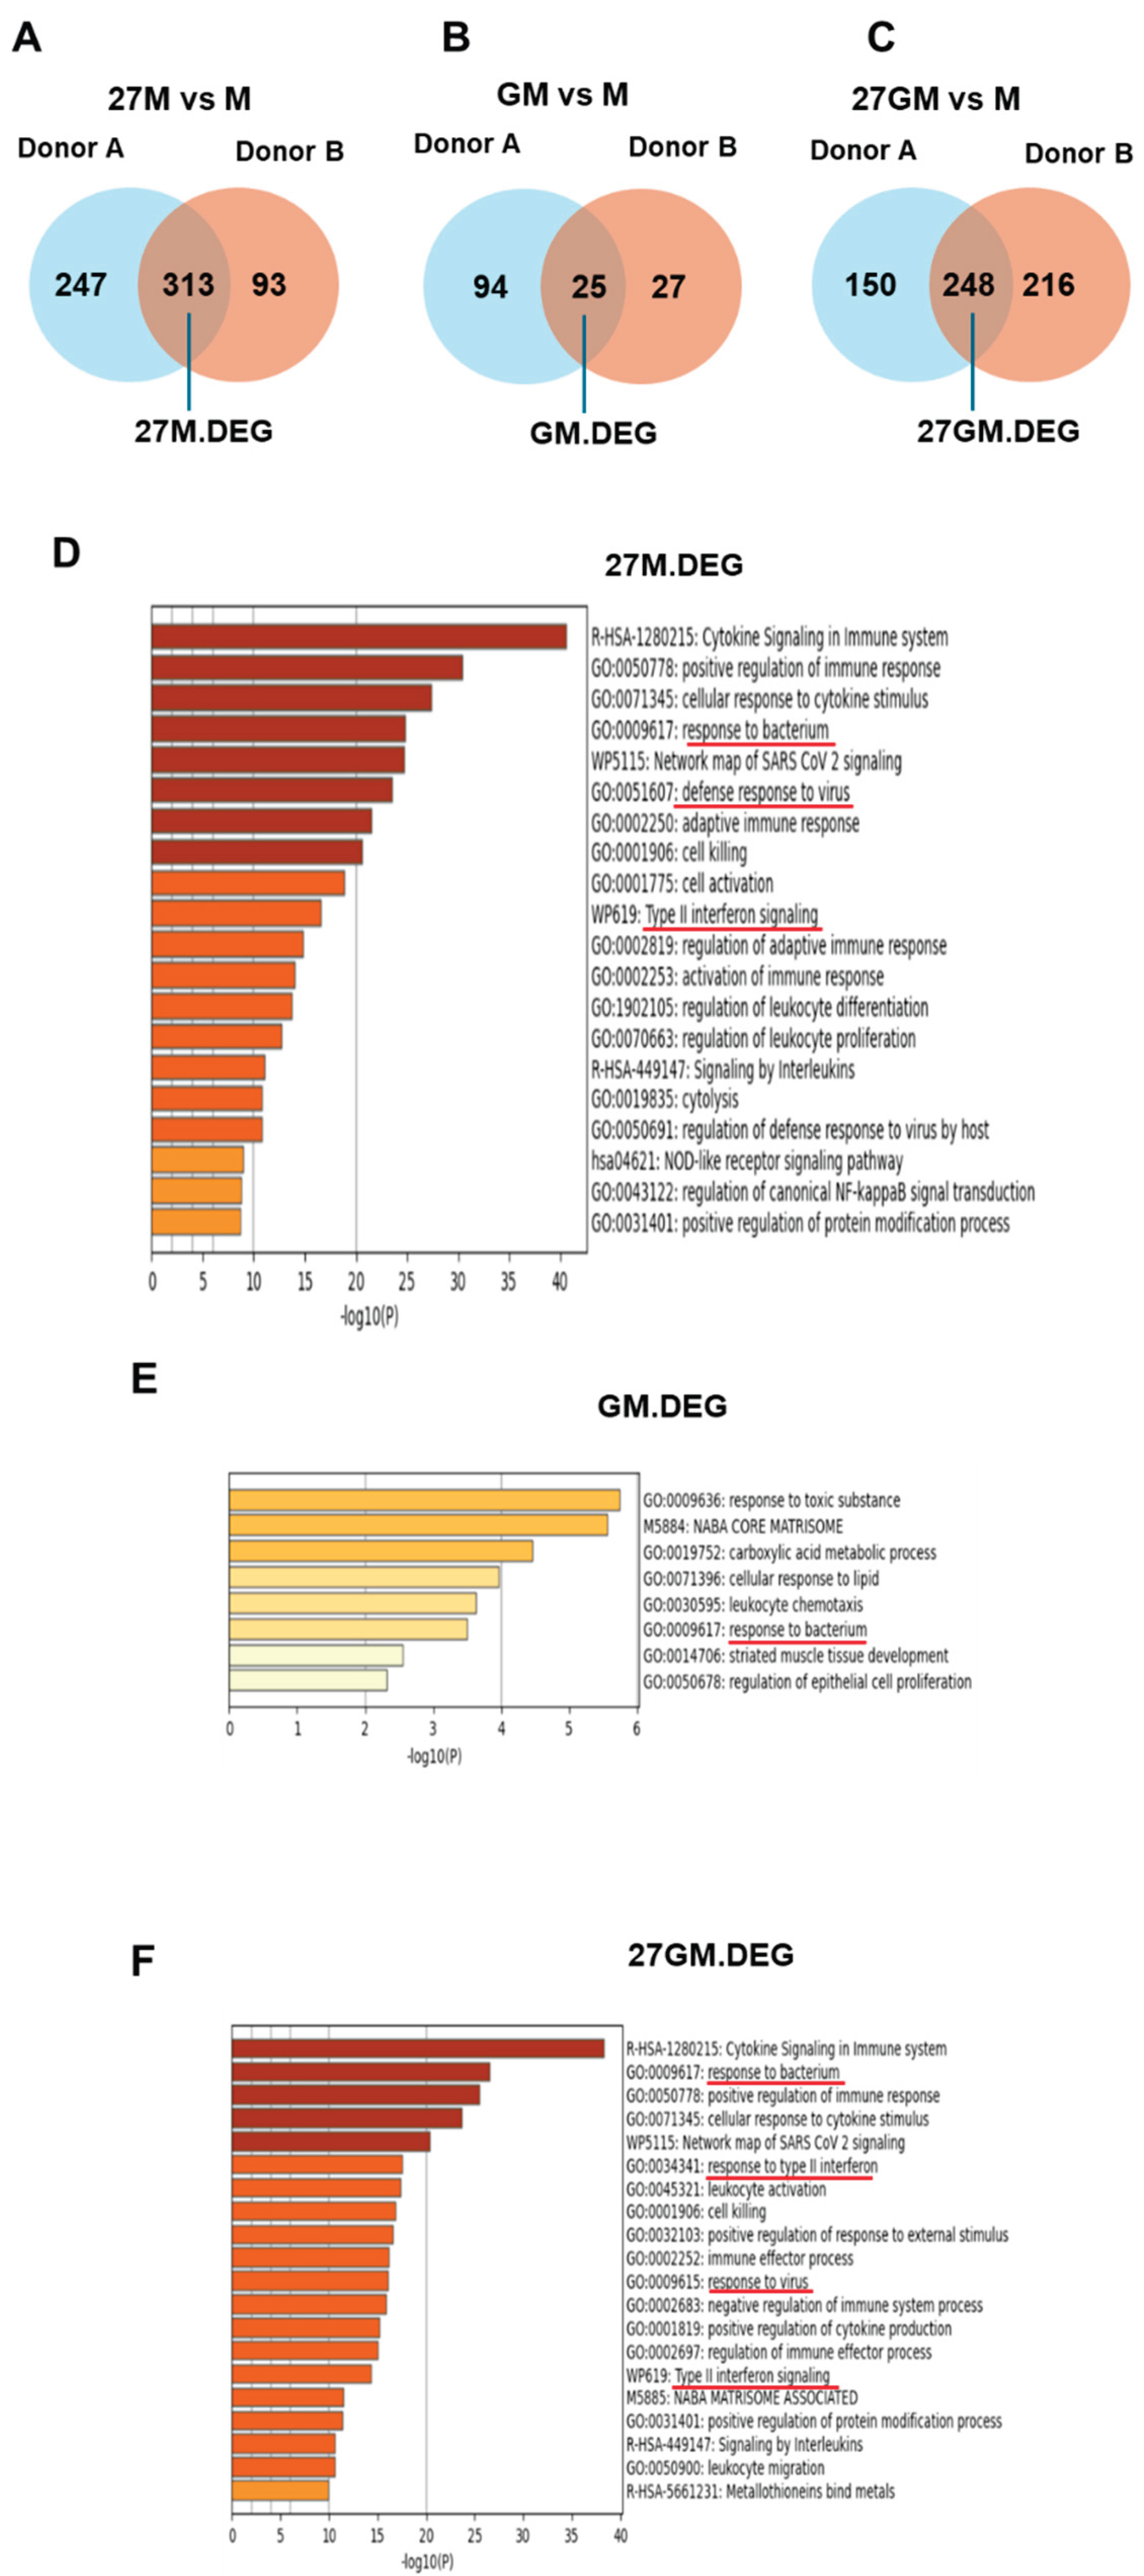
Figure 4.
Identification of genes associated with anti-HIV effect. (A-C) To identify genes associated with the suppression of HIV-1 replication in 27M-Mac (A, 27M.anti-HIV), 27GM-Mac (B, 27GM.Anti-HIV), and GM-Mac (C, GM.Anti-HIV), Venn diagram analyses were conducted between anti-HIV/HF gene list and corresponding DEGs: 27M.DEGs (Figure 3A), 27GM.DEGs (Figure 3B), and GM.GEGs (Figure 3C). (D) To identify common anti-HIV genes shared among 27M-Mac, 27GM-Mac and GM-Mac, a Venn diagram was carried out using the gene lists from 27M.Anti-HIV, 27GM.Anti-HIV, and GM.Anti-HIV. The names of genes are listed in red box alongside the Venn diagram. The names of 71 and 21genes are listed in Supplementary Table S6. (E and F) t-SNE plots showing expression of the top 24 genes from the common 71 genes in donor A (E) and donor B (F). (G and H) t-SNE plots showing for the 21-genes in Donor A (G) and Donor B (H). Blue dots indicate cell expressing the indicated genes, while gray dots represent cells lacking the expression of the gene. The color intensity indicates relative gene expression levels, with gray indicating low or absent expression and darker blue indicating higher expression.
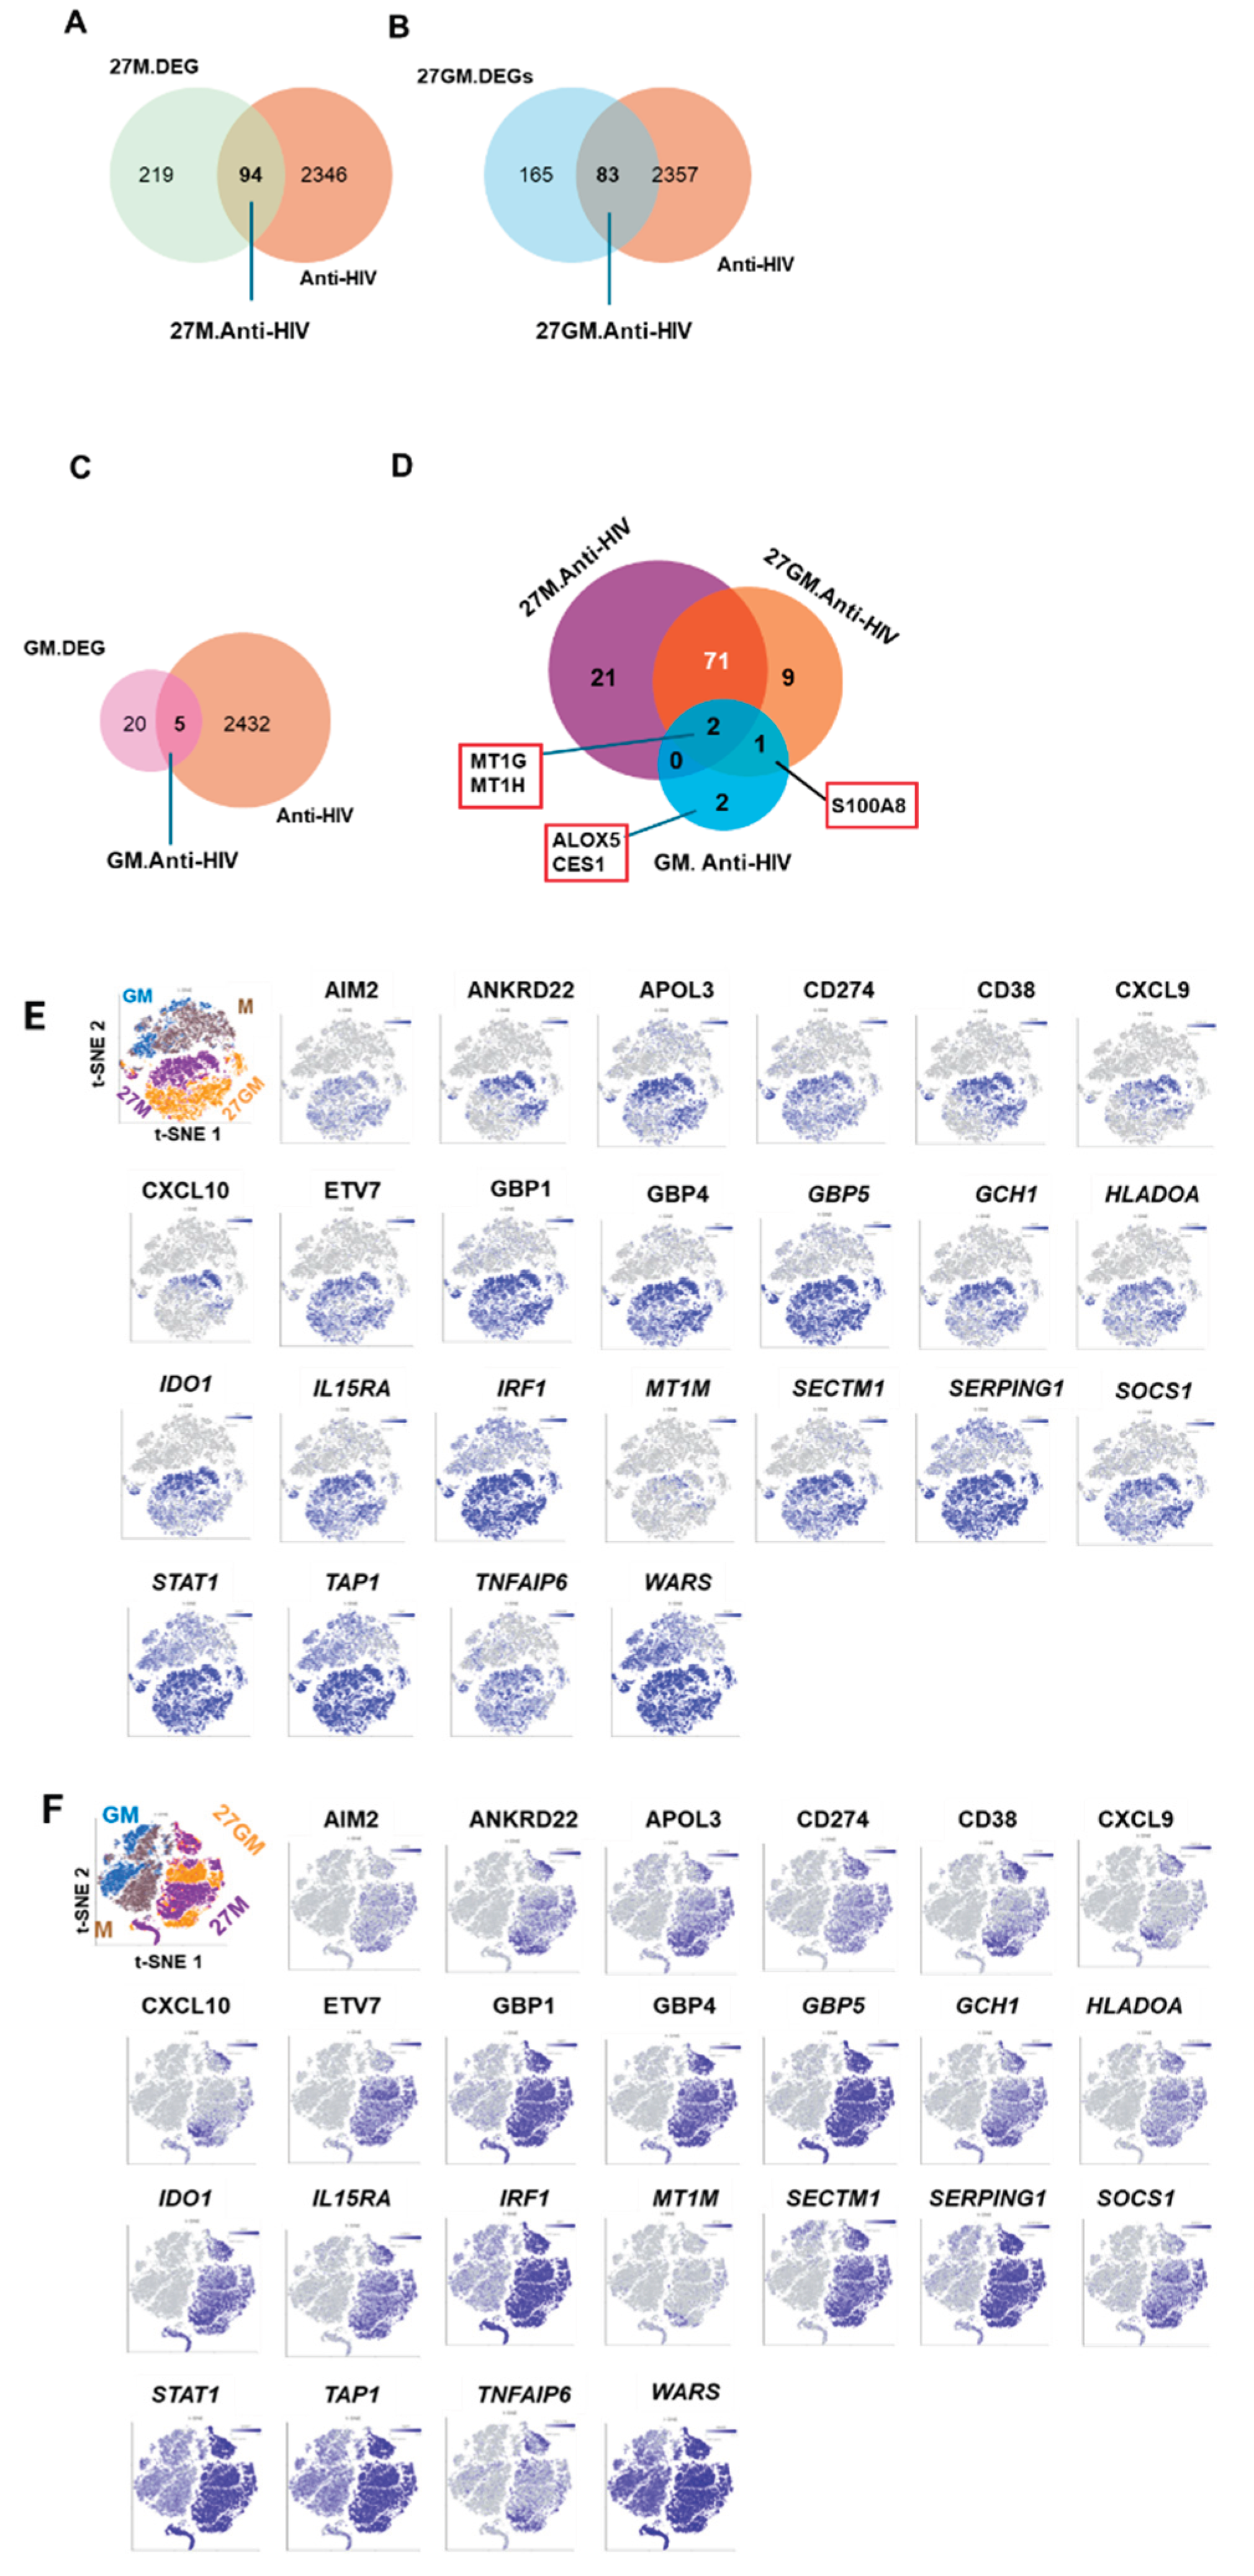
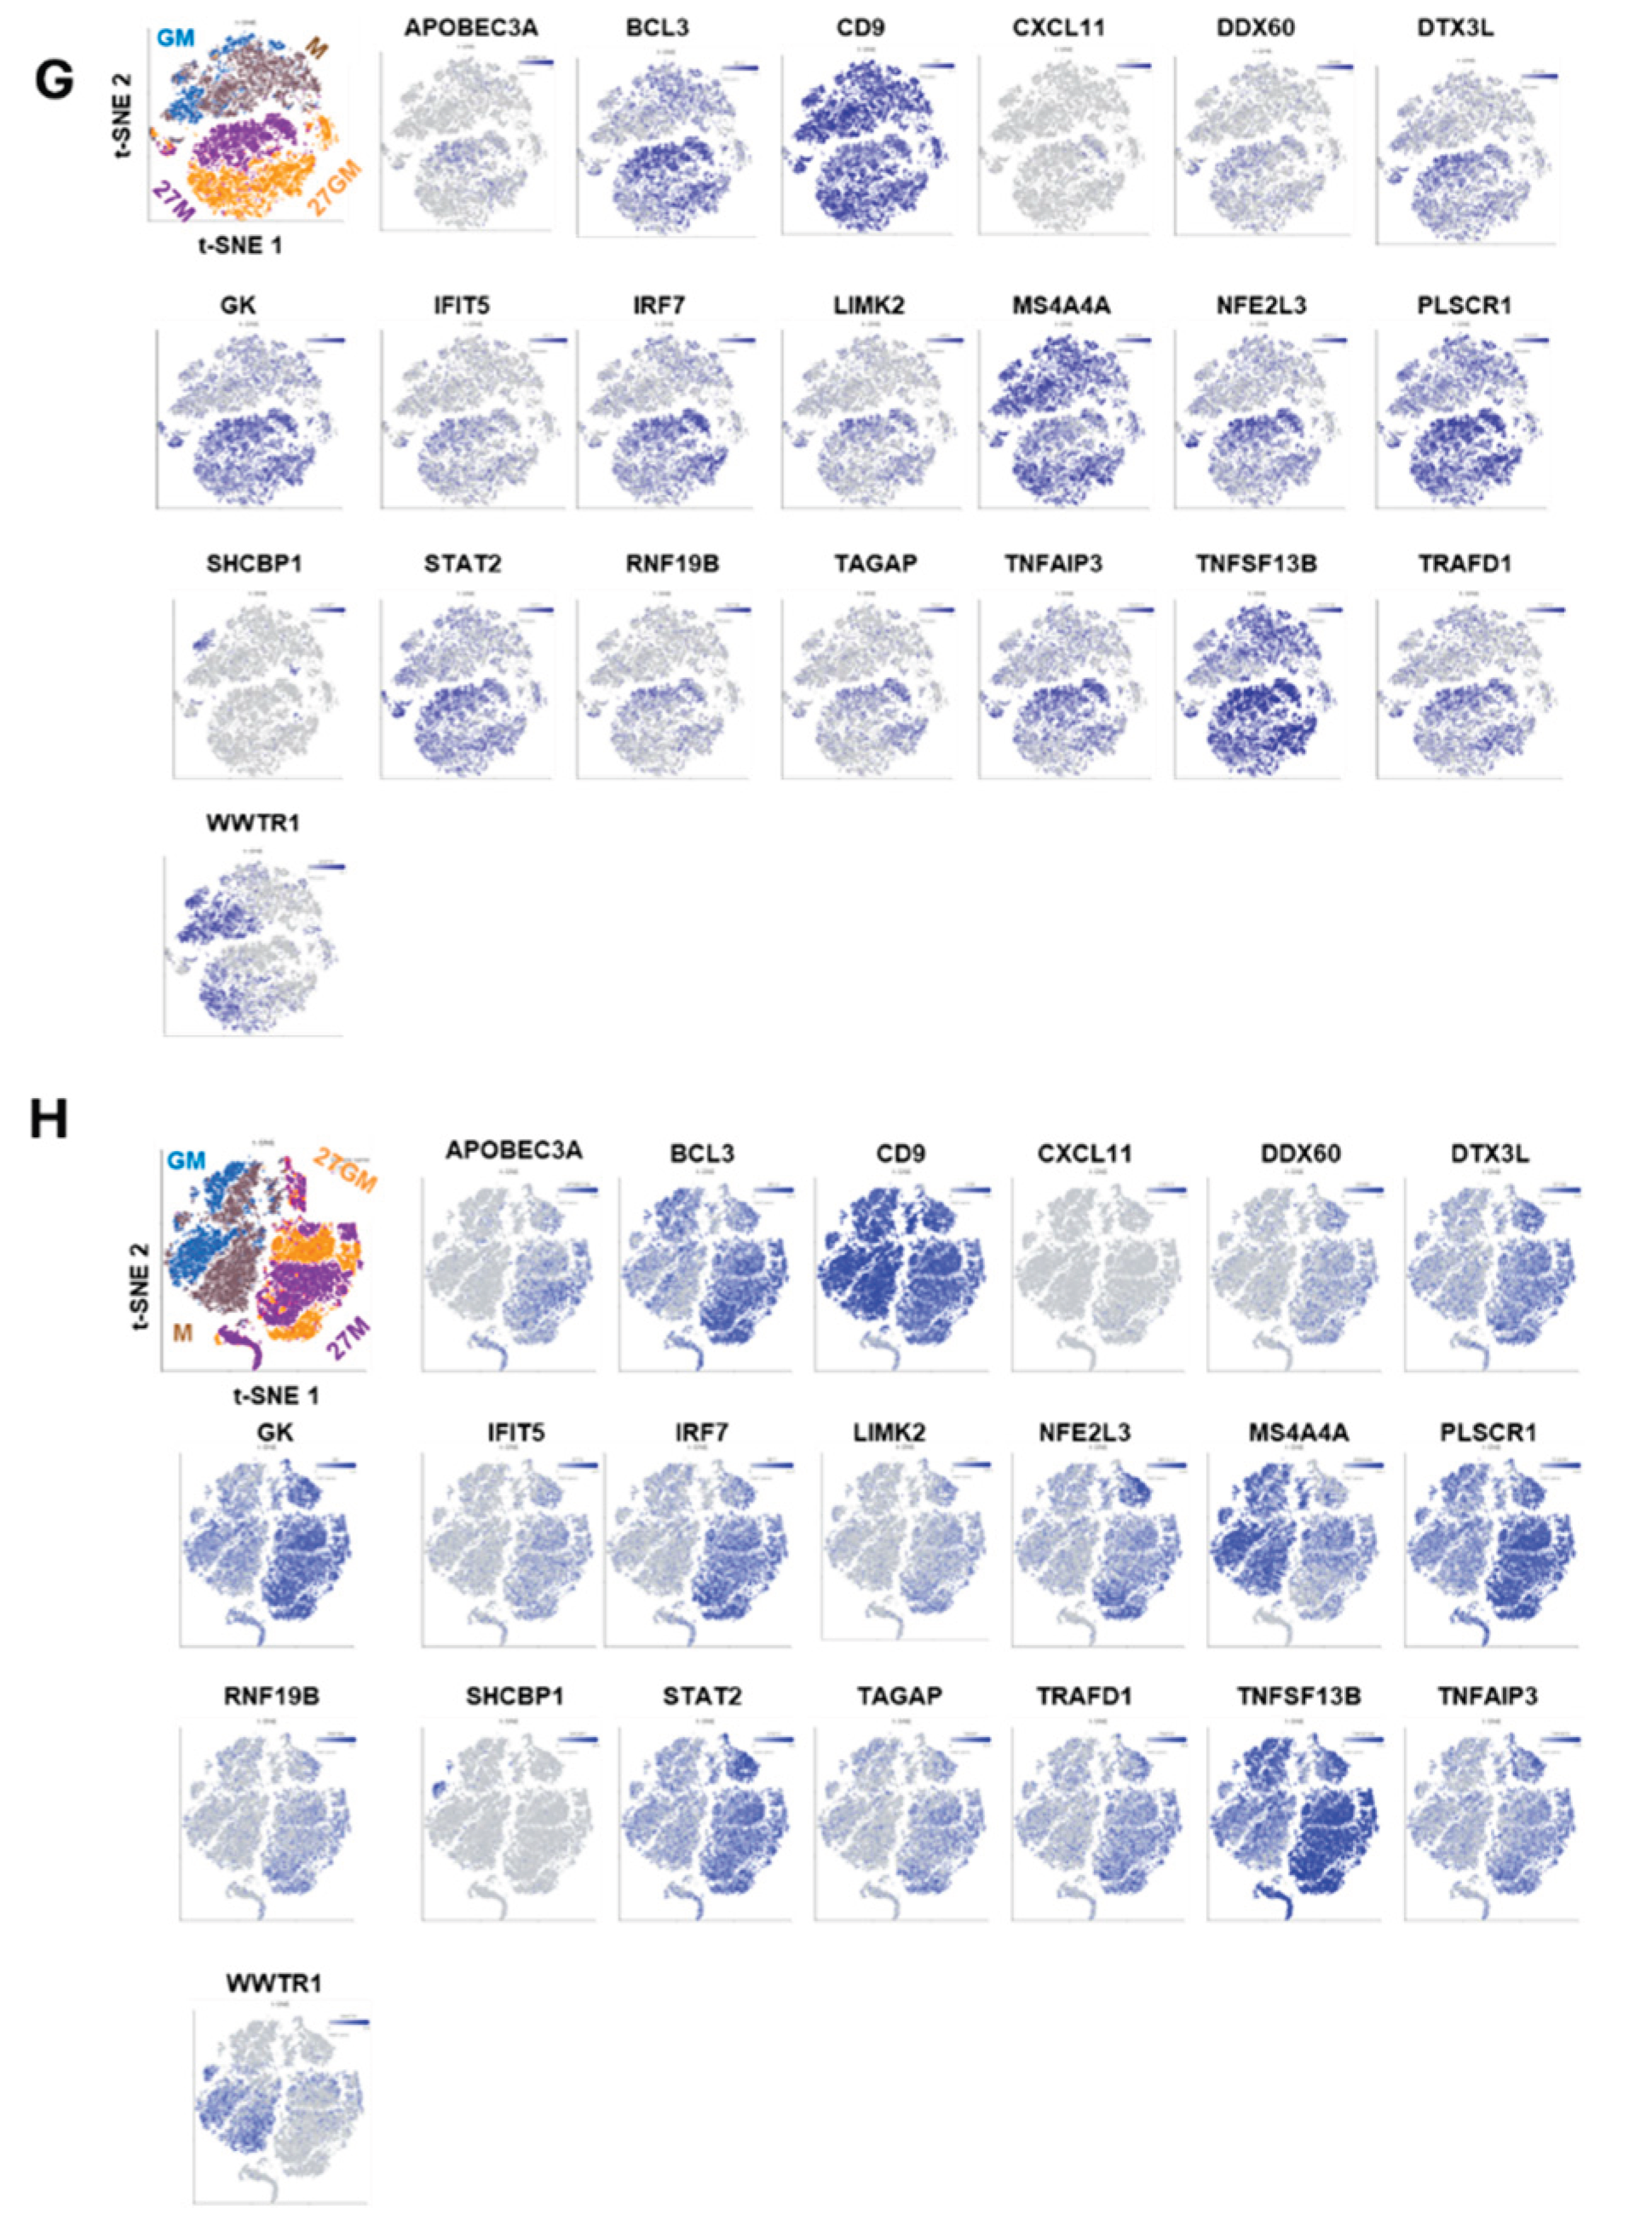
Figure 5.
Comparison of CD38 expression and the secretion of CXCL9 and C1q. (A) CD38 expressions on cell surfaces of M-Mac, 27M-Mac GM-Mac, and 27GM-Mac were analyzed using flow cytometry as described in the Materials and Methods. Representative results of CD38 staining from three independent essays are presented. Each isotype control was used to set positive gates shown using horizontal bars on histograms. (B and C) M-Mac or GM-Mac were cultured for 3-days in the absence or presence of IL-27, and then cell free supernatants were collected. The level of secreted CXCL9 (B) and C1q (C) were determined using ELISA kit. Results indicate mean ± SE from four independent donors. Statistical analysis was conducted using unpaired t-test. *: p<0.05, **: p<0.01, ns: not significant.
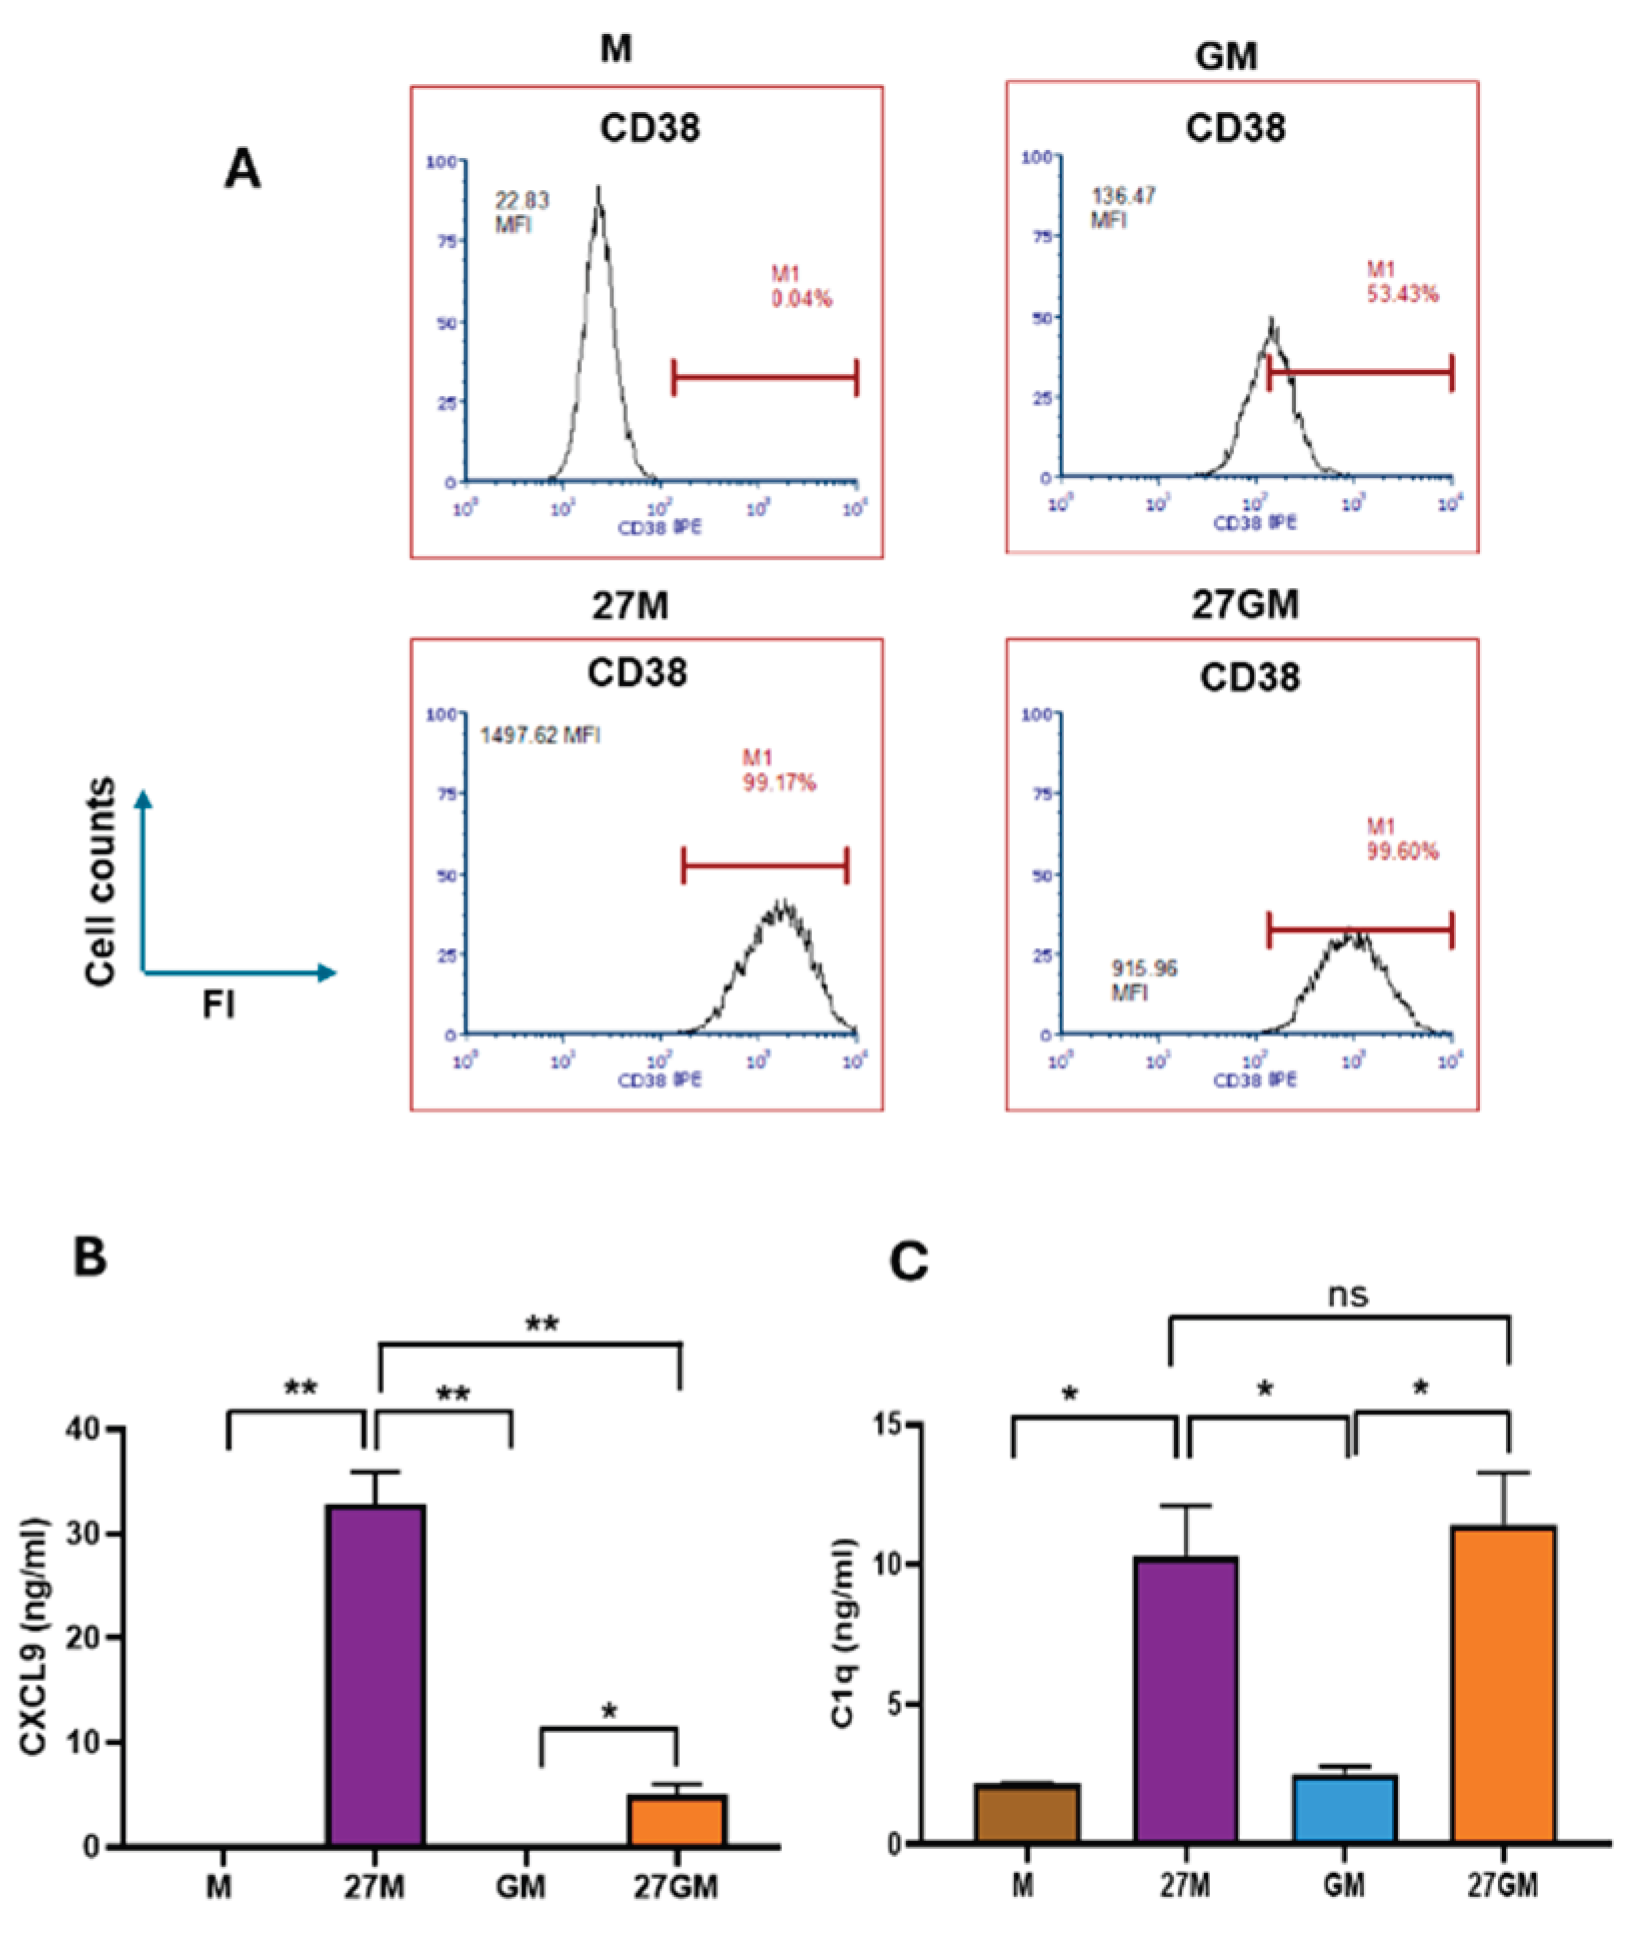
Figure 6.
Comparison of the expression of macrophage markers. (A) The expression of CD209 on M-Mac, 27M-Mac, GM-Mac, and 27GM-Mac were compared using FACS as shown in Materials and Methods. An isotype control was used to set positive gates shown using horizontal bars on histograms. Results are representative of data from three independent experiments. (B) MFI calculated from three independent donors were calculated. Data are presented as mean ± SE (n = 3). Statistical analysis was conducted using One-way ANOVA. **: p<0.01, ns: not significant.
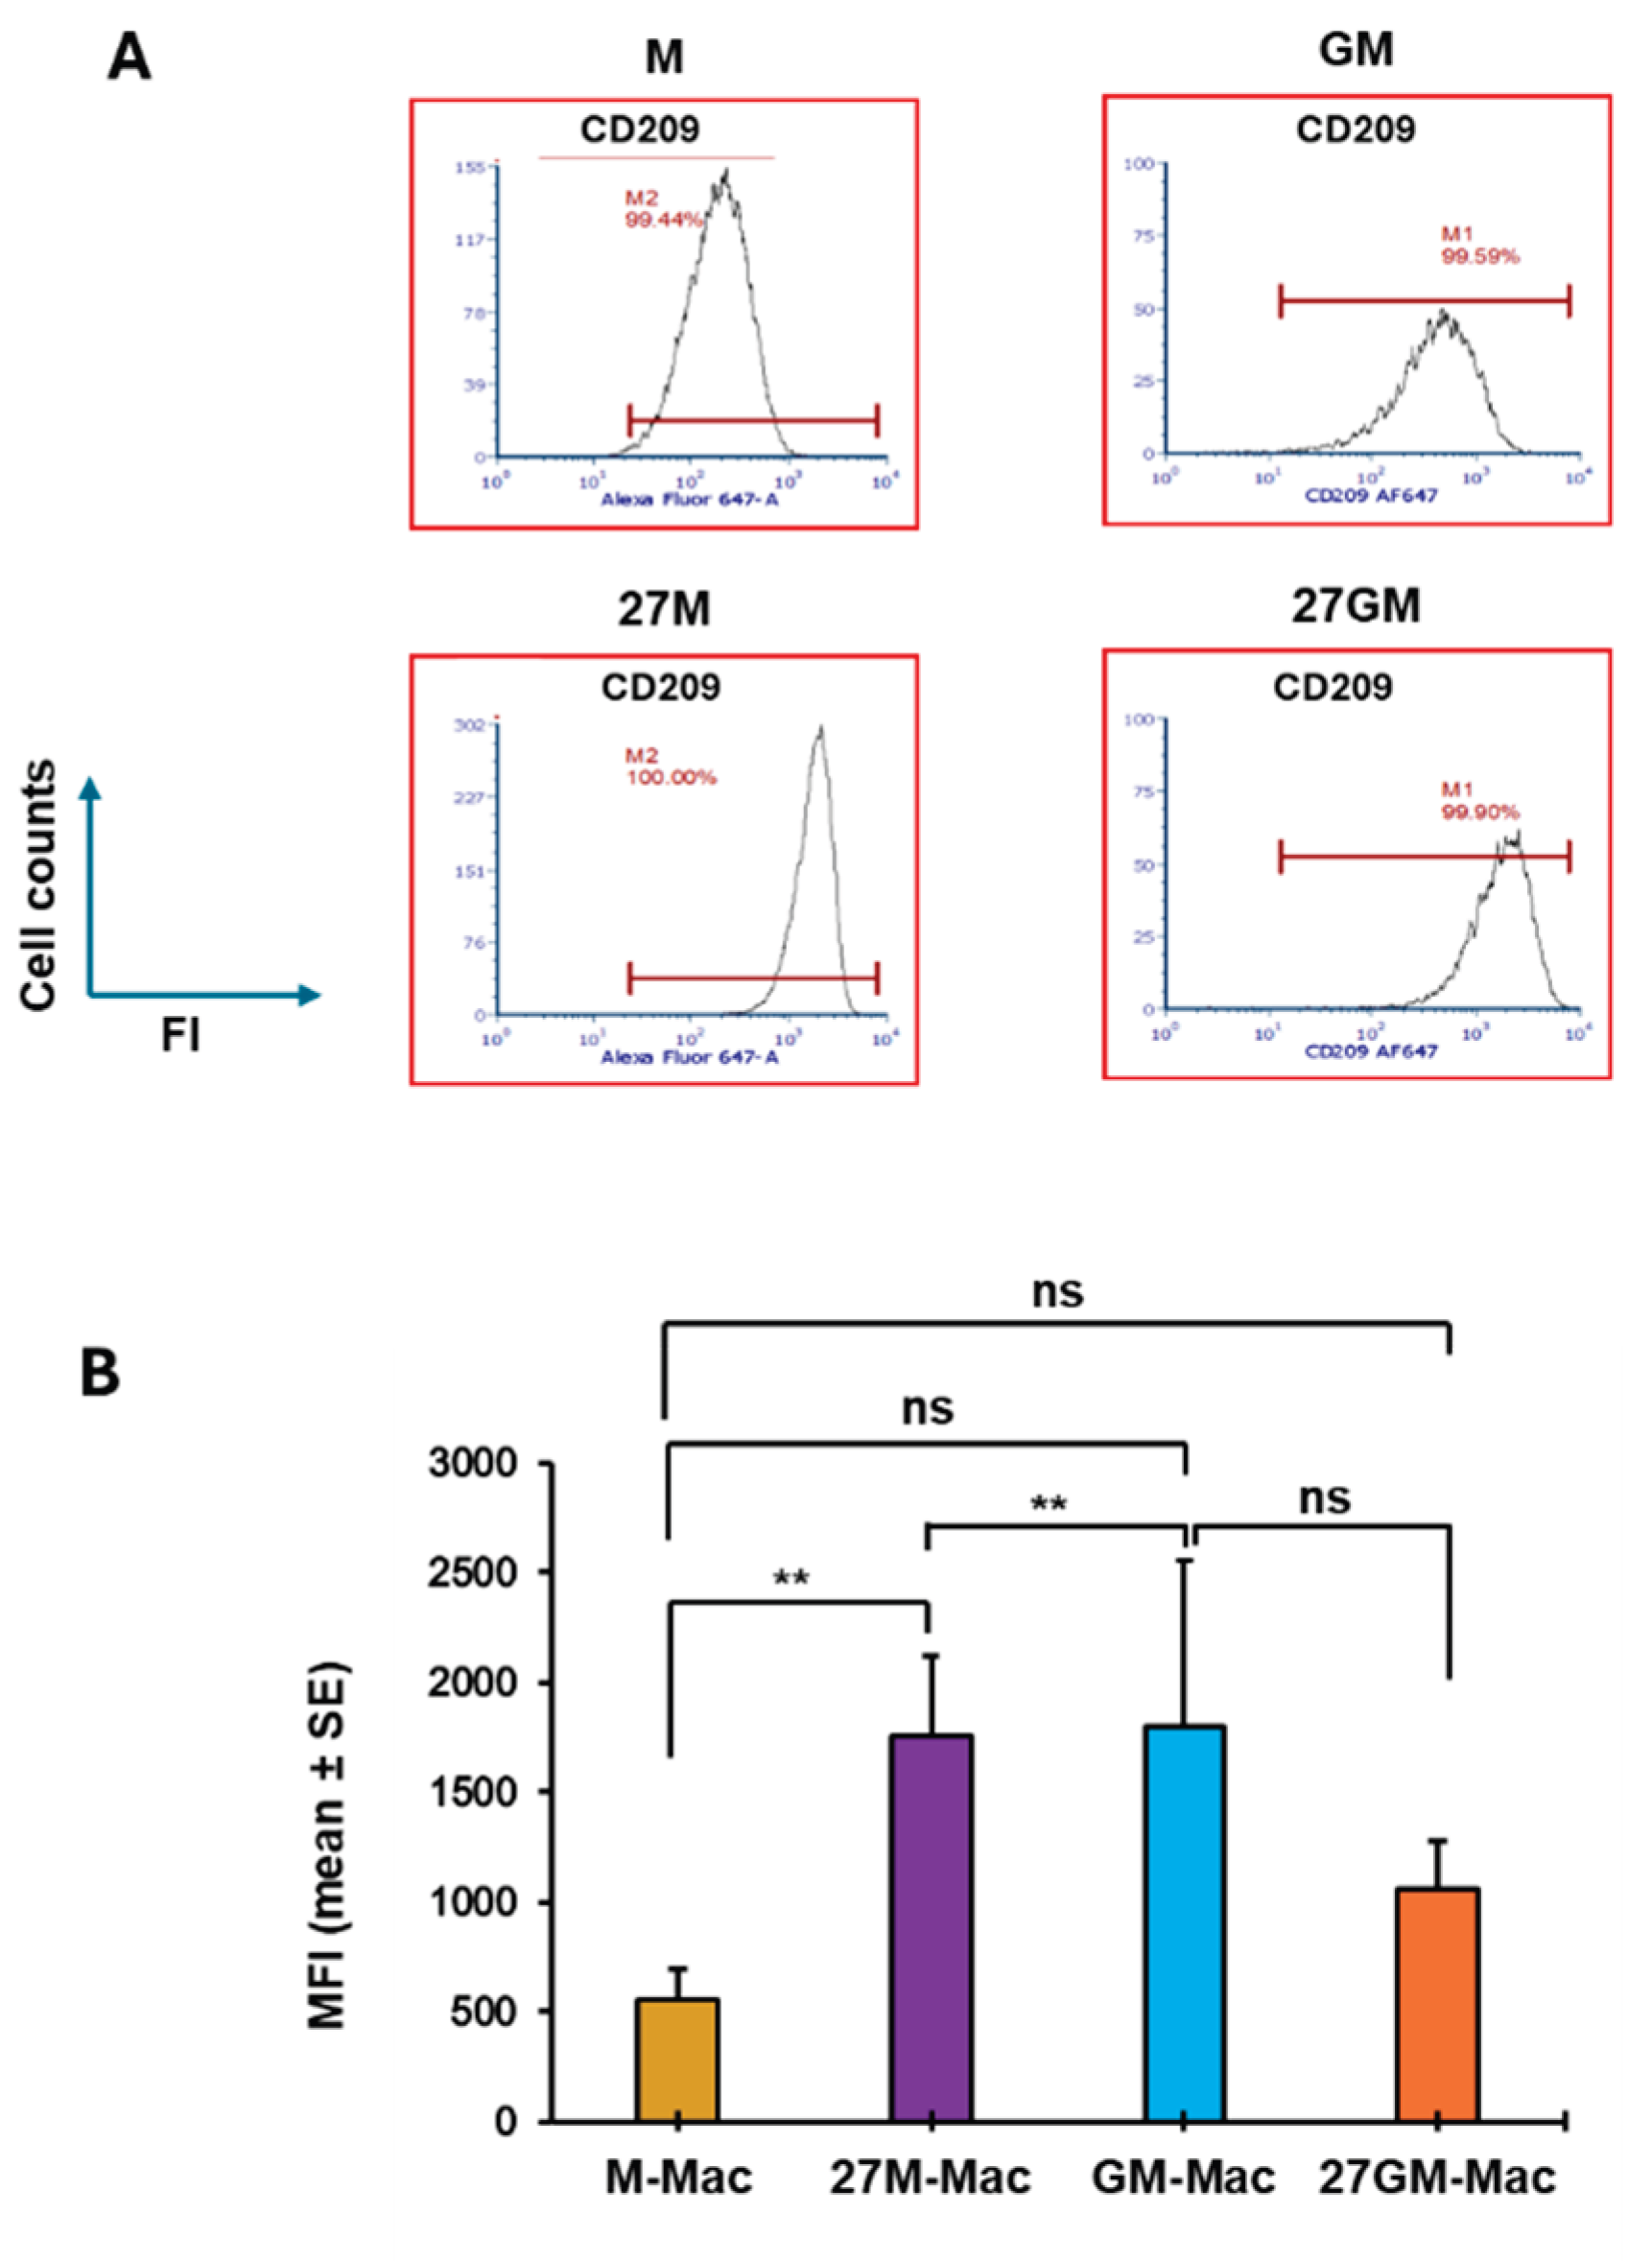
Figure 7.
Comparison of ROS inducing activity. M-Mac, 27M-Mac, GM-Mac and 27GM-Mac washed with D-PBS-glucose (PBS-G) and then stimulated without or with 100 nM PMA in PBS-G for 30 min at 37°C in the presence of Amplex Red Hydrogen Peroxide/Peroxidase Assay Reagent. Induced ROS amounts were determined using the Spark TECAN[28]. All assays were run in quadruplicate in 96-well black plates. Results are representative of three independent experiments and presented as mean ± SD. Statistical analysis was conducted using Two-way ANOVA. *: p<0.05, **: p<0.01, ***: p<0.001, ****: p<0.0001, ns: not significant.
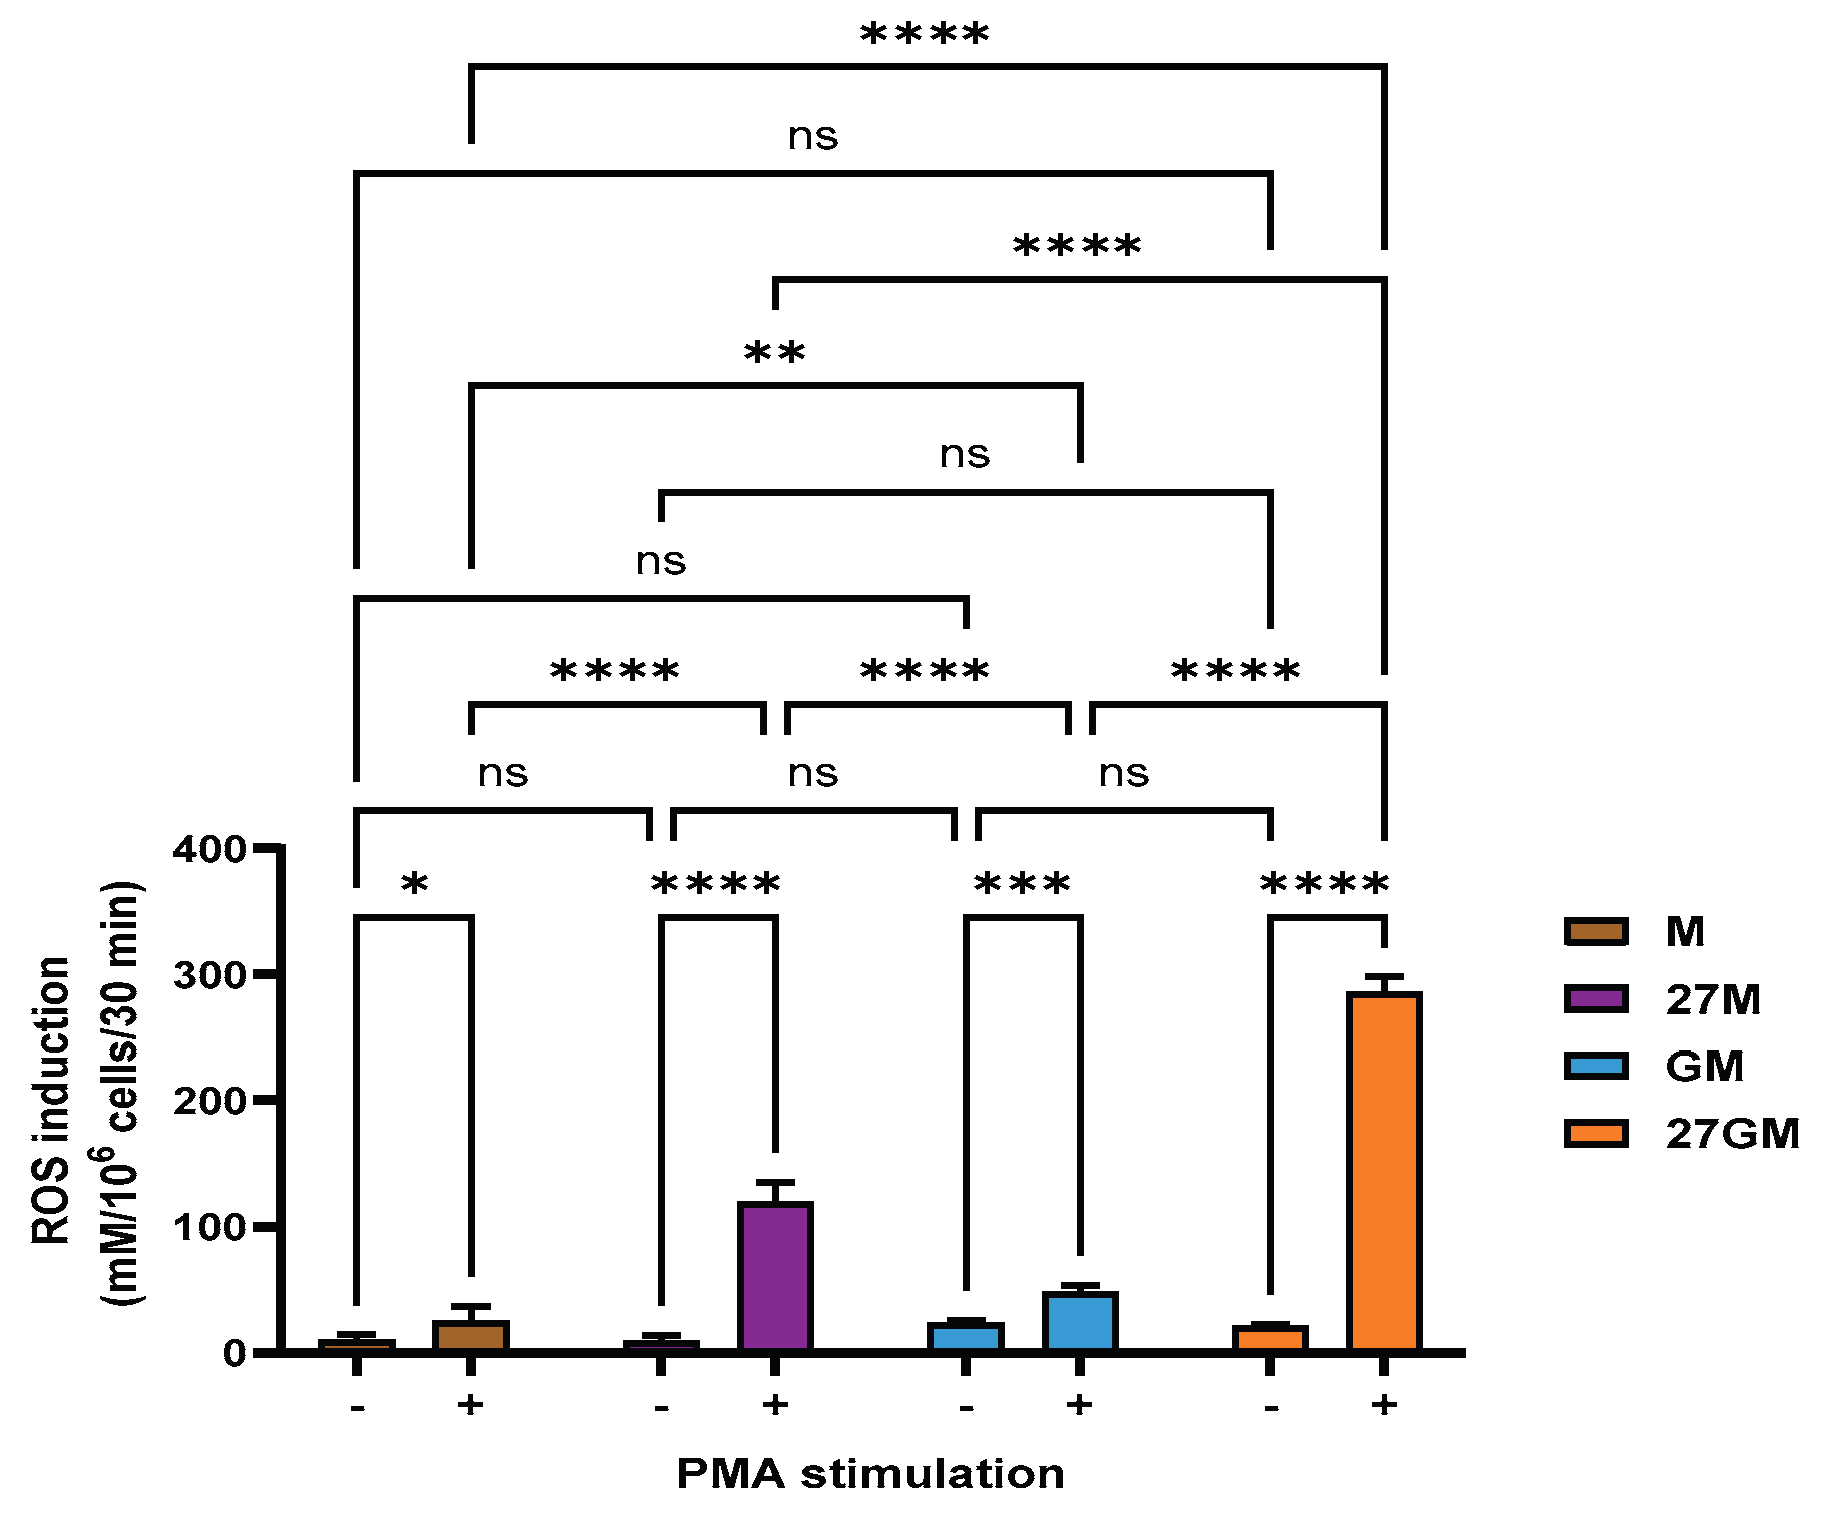
Figure 8.
Comparison of gene and protein expression. (A) The qRT-PCR was conducted to define the expression level of NCF-1/p47phox and SOD2 using total cellular RNA from M-Mac, 27M-Mac, GM-Mac and 27GM-Mac from four independent donors. Data show mean ±SE (B) The total cellular protein lysate was collected from M-Mac, 27M-Mac, GM-Mac and 27GM-Mac, and Western blotting was performed using anti-47Phox , anti-SOD2, and anti-β-Actin antibodies. The band intensity of each protein was analyzed using Fiji-ImageJ and then normalized by the band intensity of β-Actin. the resulting values are indicated in the image as fold change compared to the intensity of M-Mac. Results are representative of two independent experiments.
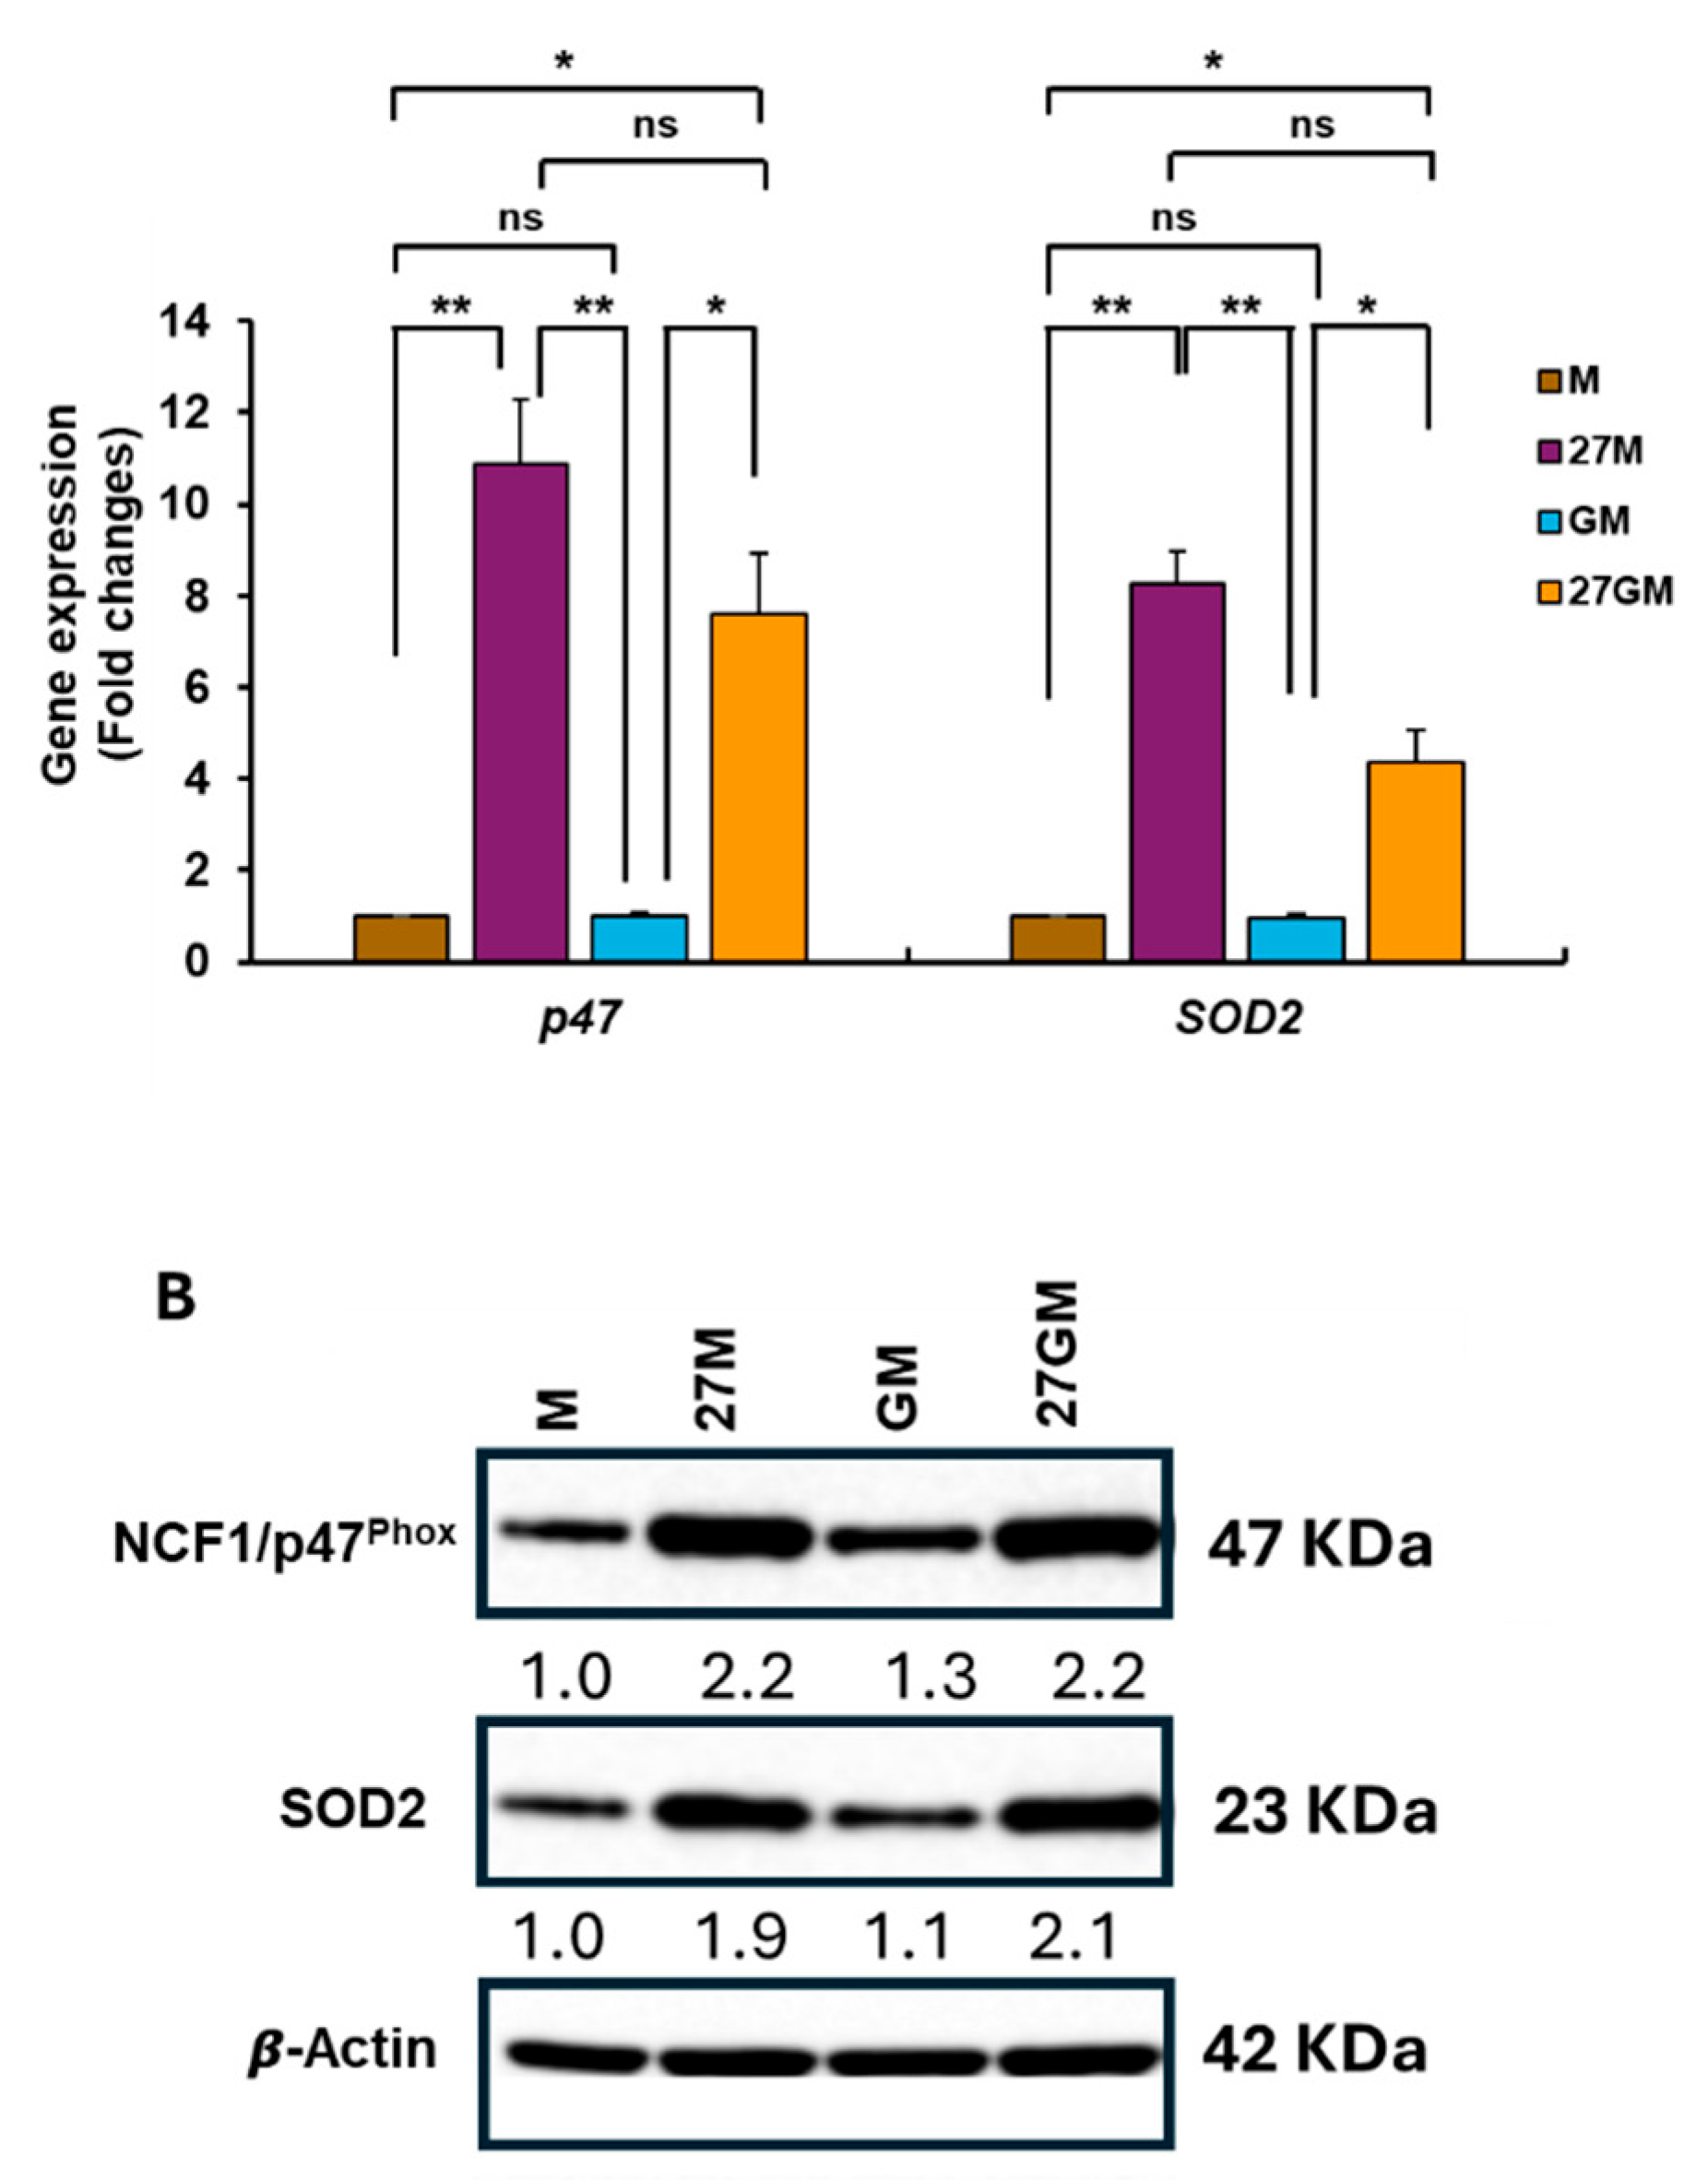
Figure 9.
Comparison of the expression of genes associated with ROS . (A-D) To identify ROS-associated genes (RAGs) in Com.27M.DEGs (A), in Com.27GM.DEGs (B), and in Com.GM.DEGs (C), a Venn diagram analysis was conducted between each DEGs and total RAG gene list. (D) To compare similarity among 27M.RAGs, 27GM.RAGs, and GM.RAGs, a Venn diagram analysis was carried out. (E and F) t-SNE plots demonstrate the distribution of SOD2 and NCF1/P47PHOX gene expression in Donor A (E) and Donor B (F). Blue dots indicate cell expressing the indicated gens, while gray dots represent cells lacking the expression of the gene. The color intensity indicates relative gene expression levels, with gray indicating low or absent expression and darker blue indicating higher expression.
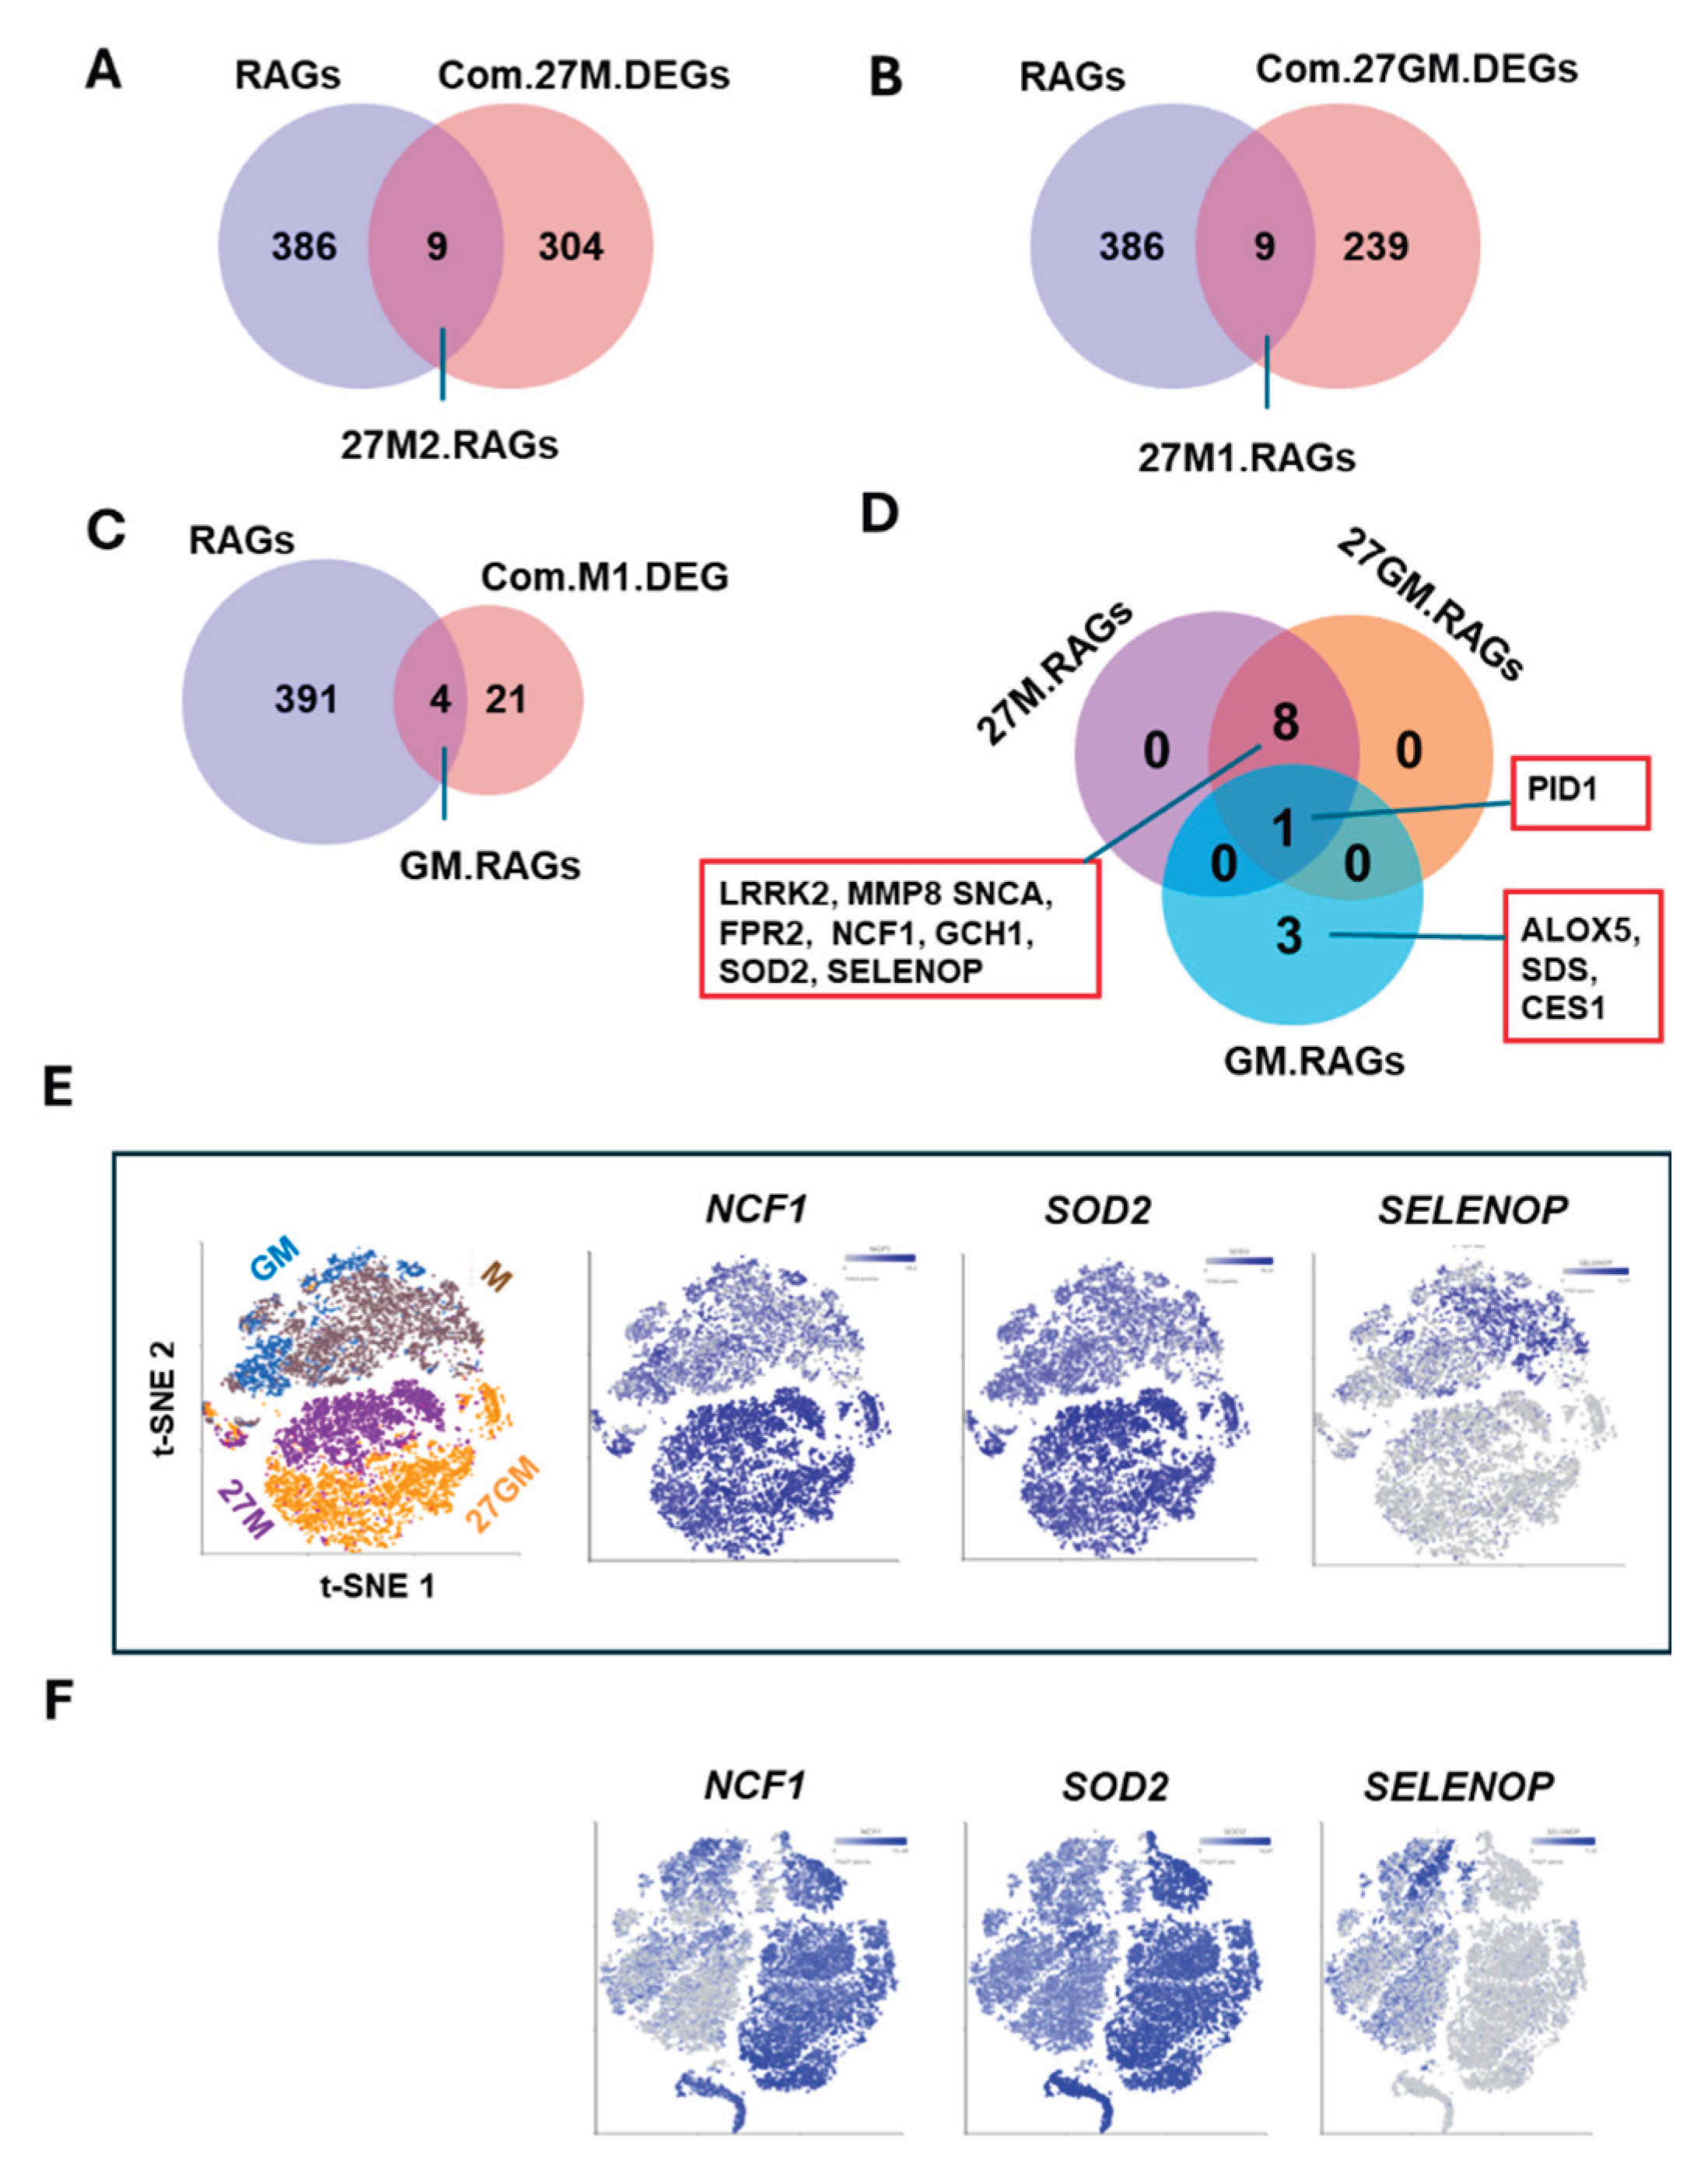
Figure 10.
Comparison of phagocytosis activity. (A-B) M-Mac, 27M-Mac, GM-Mac, and 27GM-Mac were cultured with or without opsonized Escherichia coli BioParticles-RED conjugate (T:E ratio at 10) in 96-well plates for 2 hrs at 37°C. The cells were washed, and the uptake of E. coli indicated red color was determined using a fluorescence microscope. (A) The phagocytosis images in one of three independent assays are shown. PHrodo Red fluorescence indicates phagocytic cells, while differential Interference Contrast (DIC) images show all cell morphology. (B) Image analysis was performed using the Fiji Image J software. For each channel, a background threshold was set up to create 8-bit masks. For the red channel, the total stained area was retrieved as a measure of phagosome staining, while a particle counts following watershed processing of the blue channel gave the corresponding cell number. Results therefore display the average stained area per cell for each experimental condition. Data show shows mean ± SE (n = 3) of three independent assays. Statistical analysis was conducted using One-way ANOVA. ***: p<0.001, ****: p<0.0001, ns: p>0.05, not significant.
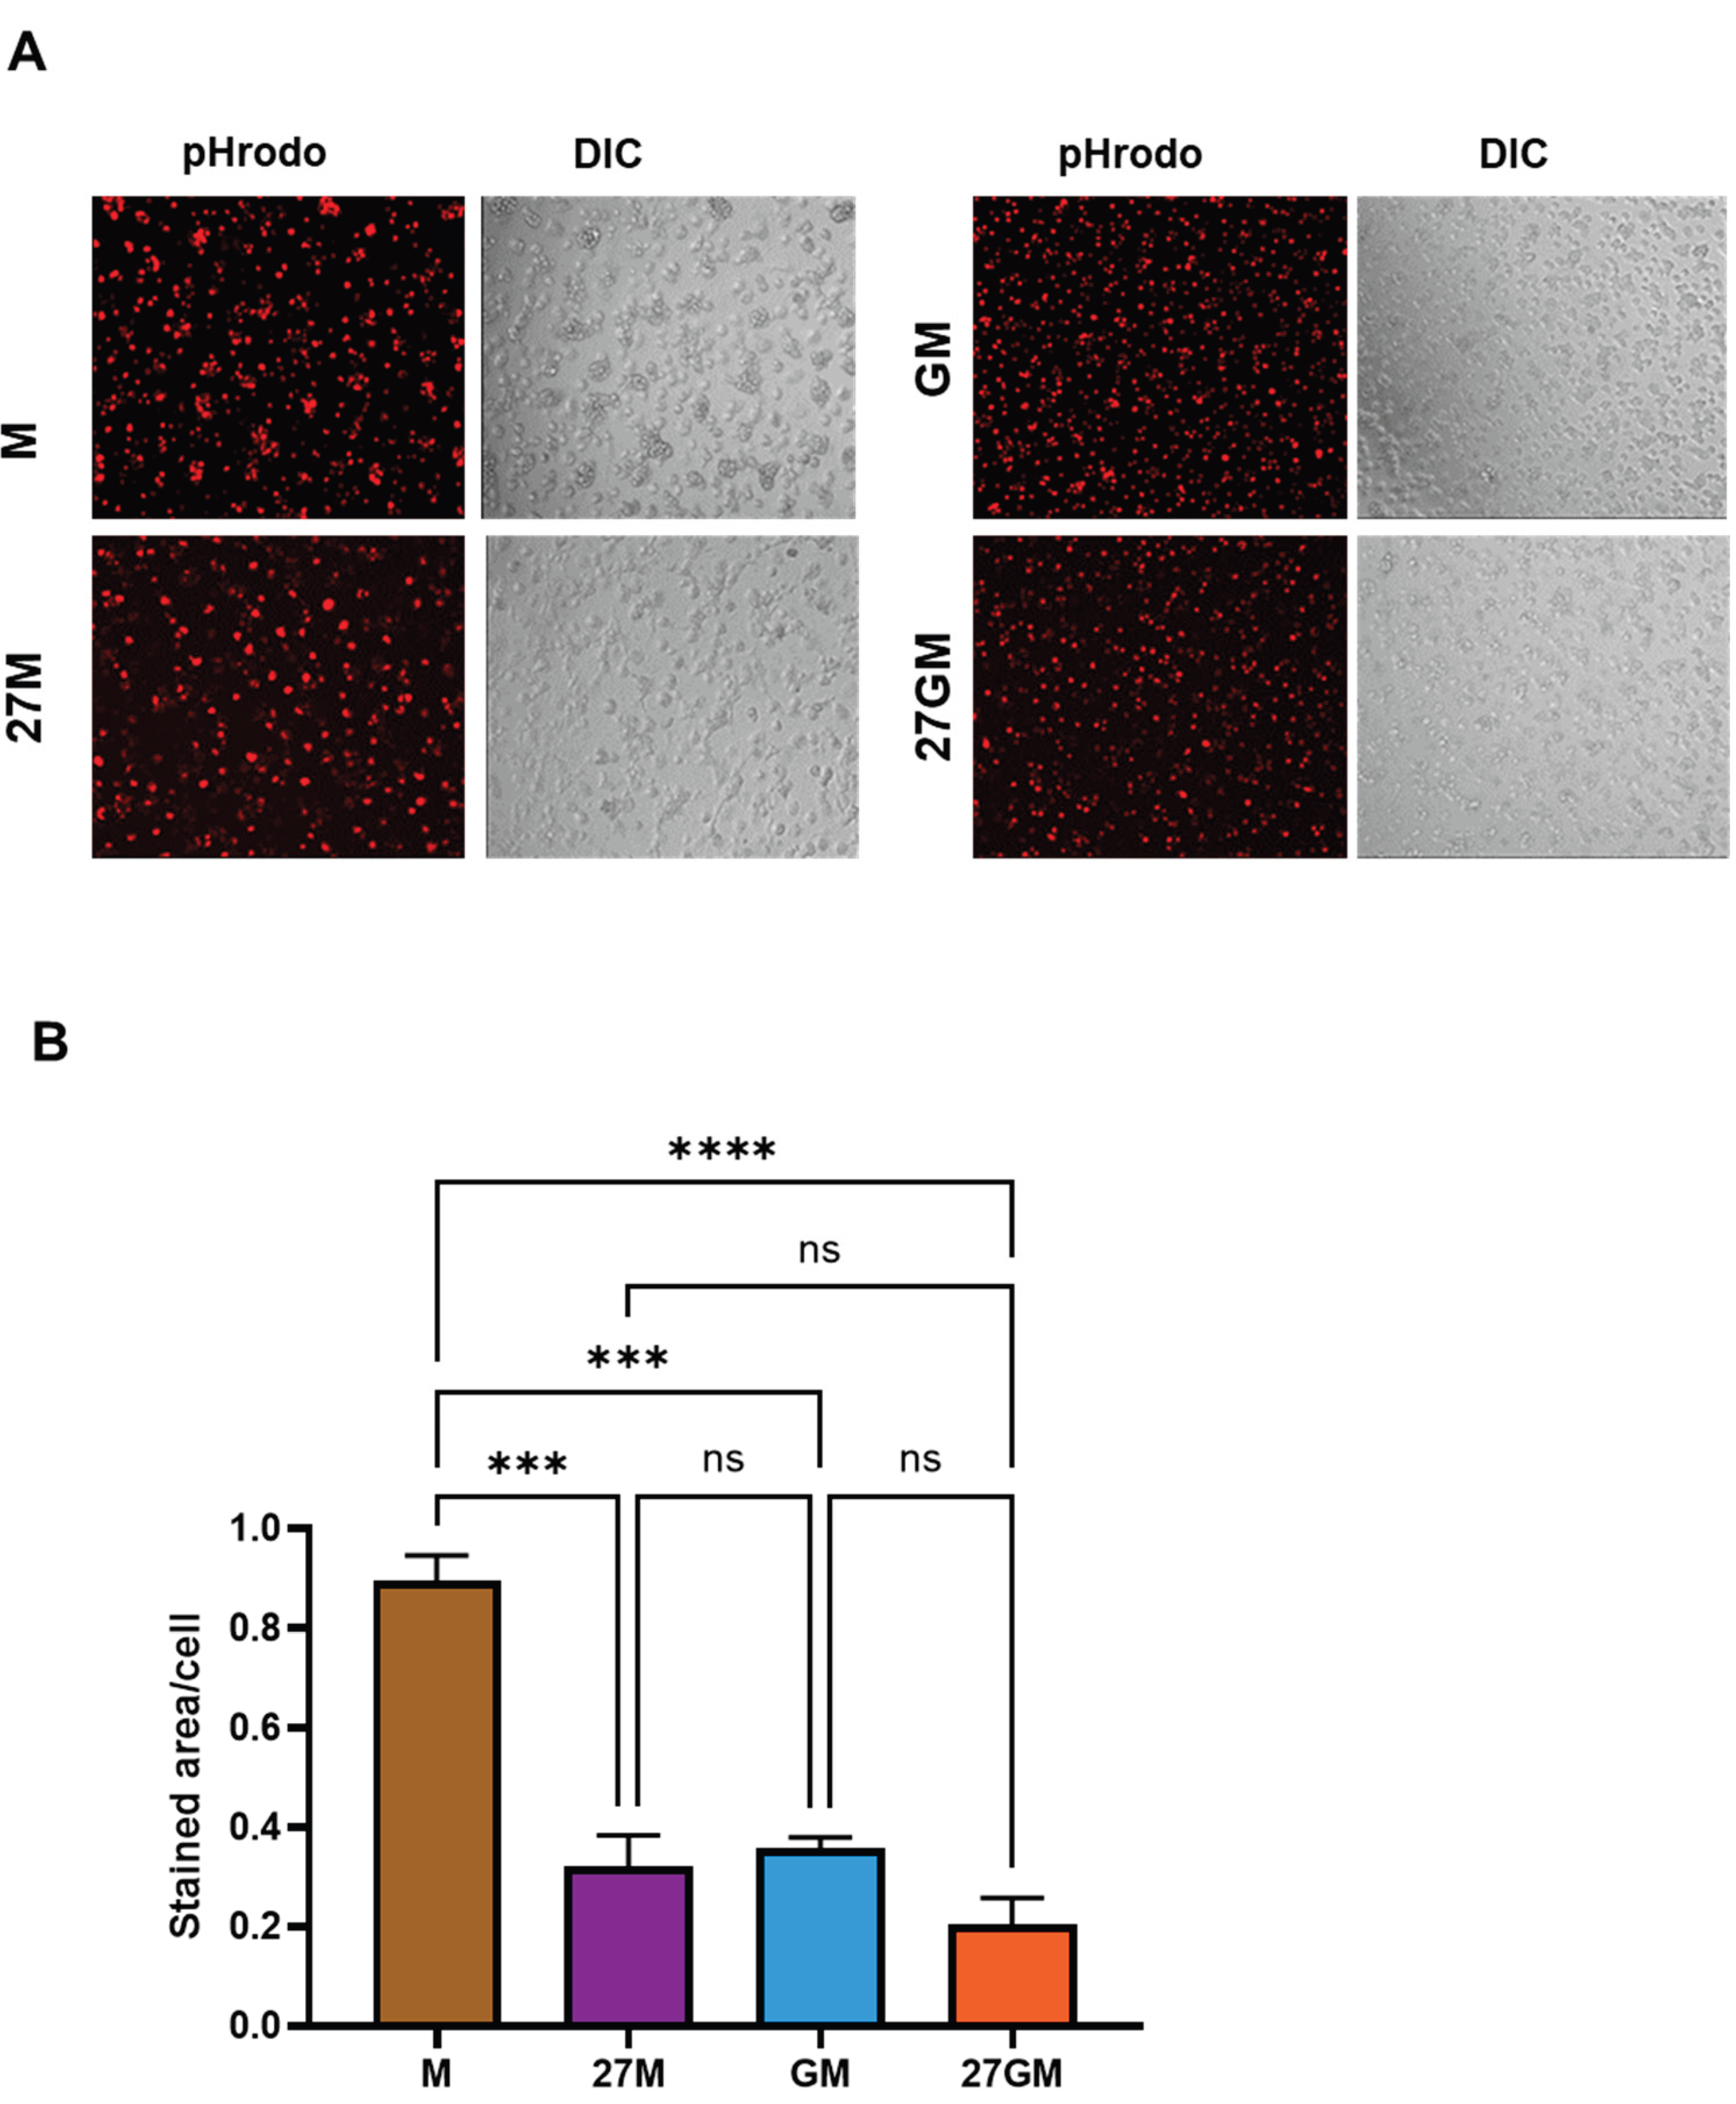
Figure 11.
Comparison of FCR expression and the expression of phagocytosis-associated genes . (A) Expression of FcγRIII (CD16), FcγRII (CD32), and FcγRI (CD64) on each M-Mac, 27M-Mac, GM-Mac and 27GM-Mac were analyzed by FACS as described in the materials and Methods. Cells from three independent donors were subject, and one of representative data is shown in histograms. Each isotype control was used to set positive gates shown using horizontal bars on histograms. (B) The total cellular protein lysate was collected from M-Mac, 27M-Mac, GM-Mac and 27GM-Mac, and WB was performed using anti-CD16, anti-CD32, anti-CD64, and anti-β-Actin antibodies. (C) Band intensities were quantified using Image J and normalized by the band intensity of β-Actin.
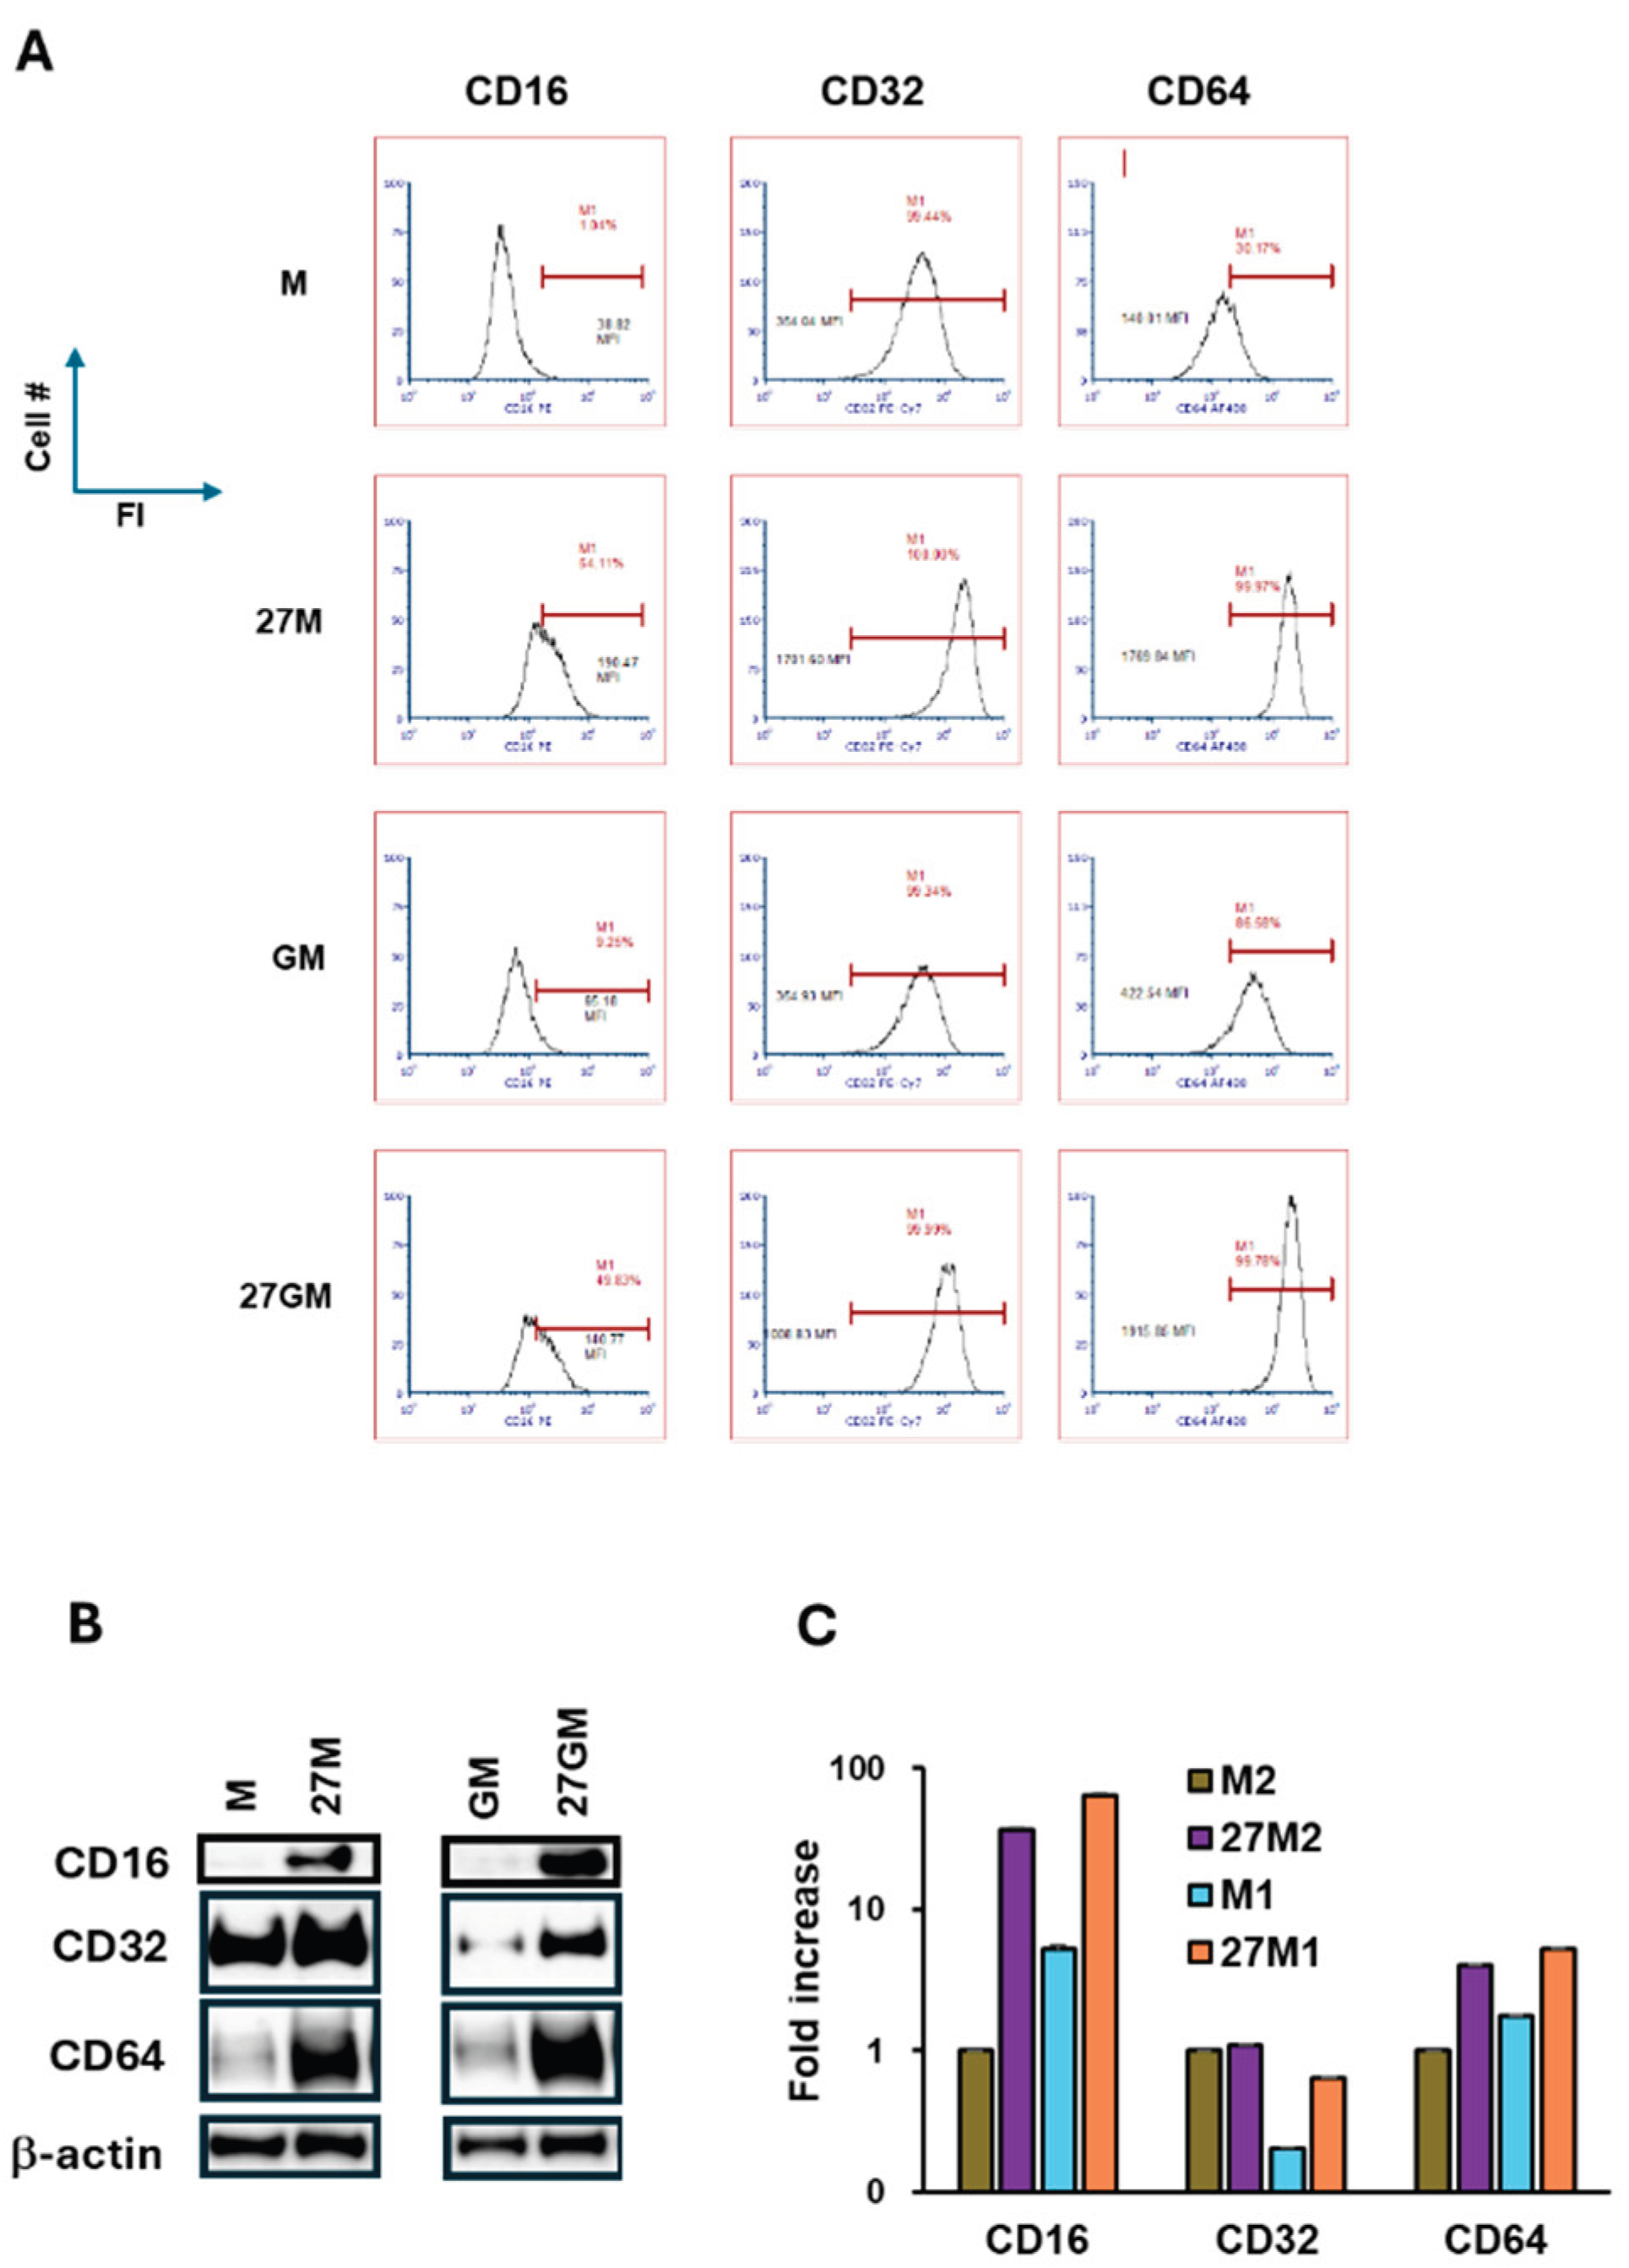
Figure 12.
Comparison of the expression of phagocytosis-associated genes. (A-C) To identification phagocytosis-associated genes (PAGs) within each DEGs, Venn diagram analyses were performed between PAGs and 27M.DEGs (A), between PAGs and 27GM.DEGs (B), and between PAGs and GM.DEGs (C). (D) To define common PAGs among cell types, a Venn diagram was conducted using 27M.PAGs, 27GM.DAGs and GM.DAGs. (H and J) The qRT-PCR was performed to define the expression level of RAB7B (E) and DYSF (F) using total cellular RNA from M-Mac, 27M-Mac, GM-Mac and 27GM-Mac from four independent donors. Data show mean ±SE. (G) The total cellular protein lysate was collected from M-Mac, 27M-Mac, GM-Mac and 27GM-Mac, and WB was performed using anti-RAB7B, anti-DYSF, and anti-β-Actin antibodies. The band intensity of each protein was normalized by the band intensity of β-Actin using Image J, the resulting values are indicated in the image as fold change compared to the intensity of M-Mac. (H) t-SNE plots showing the distribution of RAB7B and DYSF expression across cell populations from donors A and B. Blue dots indicate cell expressing the indicated gens, while gray dots represent cells lacking the expression of the gene. The color intensity indicates relative gene expression levels, with gray indicating low or absent expression and darker blue indicating higher expression.
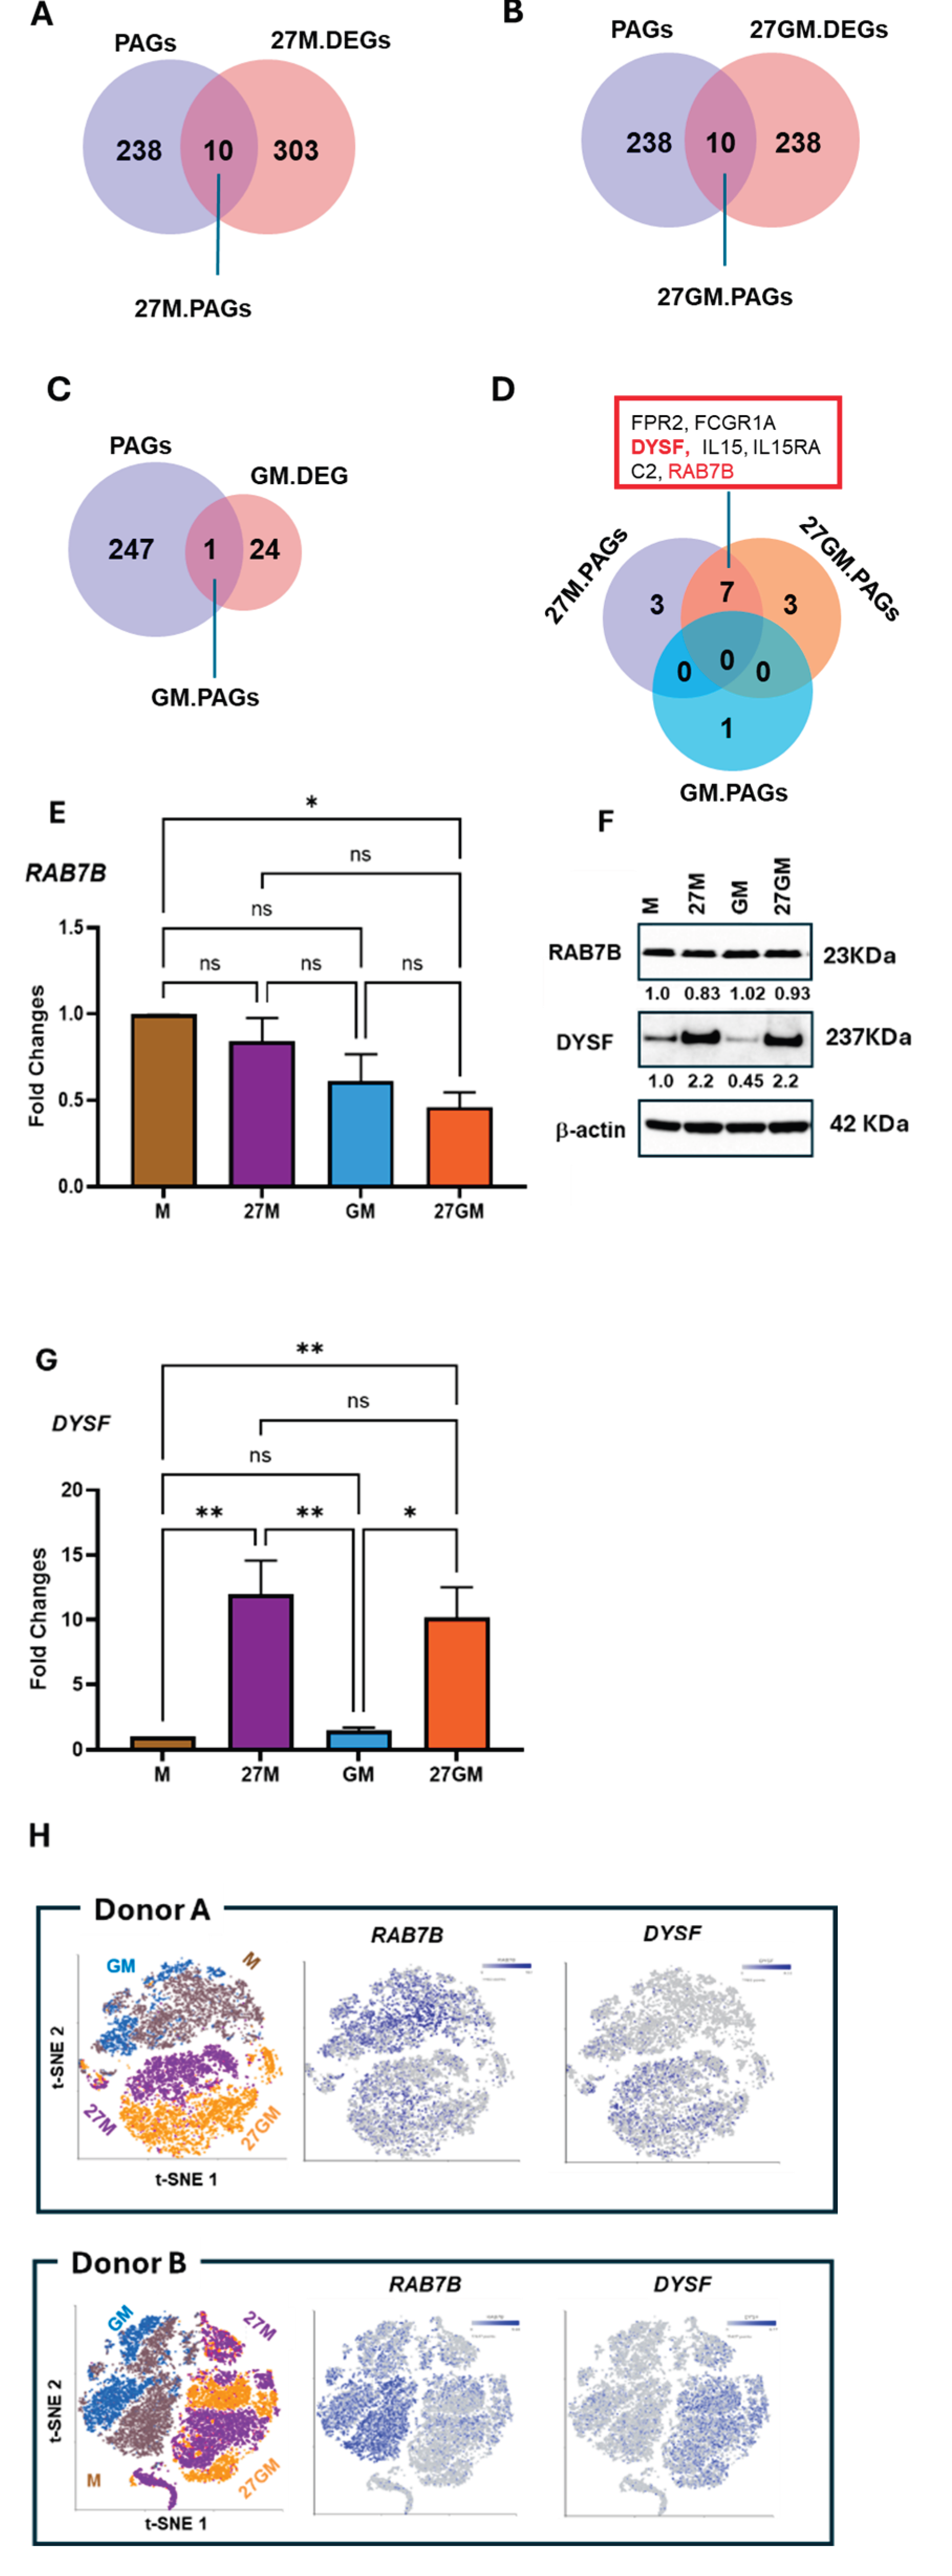
Figure 13.
Comparison of autophagy activity. (A and B) M-Mac, 27M-Mac, GM-Mac and 27GM-Mac were induced in 96-well plates and then cultured overnight in D10 medium with or without 10 μM chloroquine (CQ). Autophagosome staining with CYTO-ID and nuclear stain with Hoechst 33342 were performed using the Cyto-ID autophagy detection kit as described in the Materials and Methods. (A) Stained cells without or with CQ were imaged with a Zeiss Axio Observer.A1 motorized microscope at a 10× magnification. (B and C) Image analysis of stained cells with CQ was performed using the Fiji Image J software. For each channel, a background threshold was set up to create 8-bit masks. For the green channel, the total stained area was retrieved as a measure of autophagosome staining, while a particle counts following watershed processing of the blue channel for Hoechst 33342 gave the corresponding cell number. (B) The percentage of cells indicating green color and (C) autophagy activity, calculated by the average stained area per cell, for each experimental condition of randomly selected 1000 cells from three independent donors. Data are presented as mean ± SE (n=3). Statistical analysis was conducted using One-way ANOVA. , **: p<0.01, ***: p<0.001, ***: p<0.000, ns: not significant.
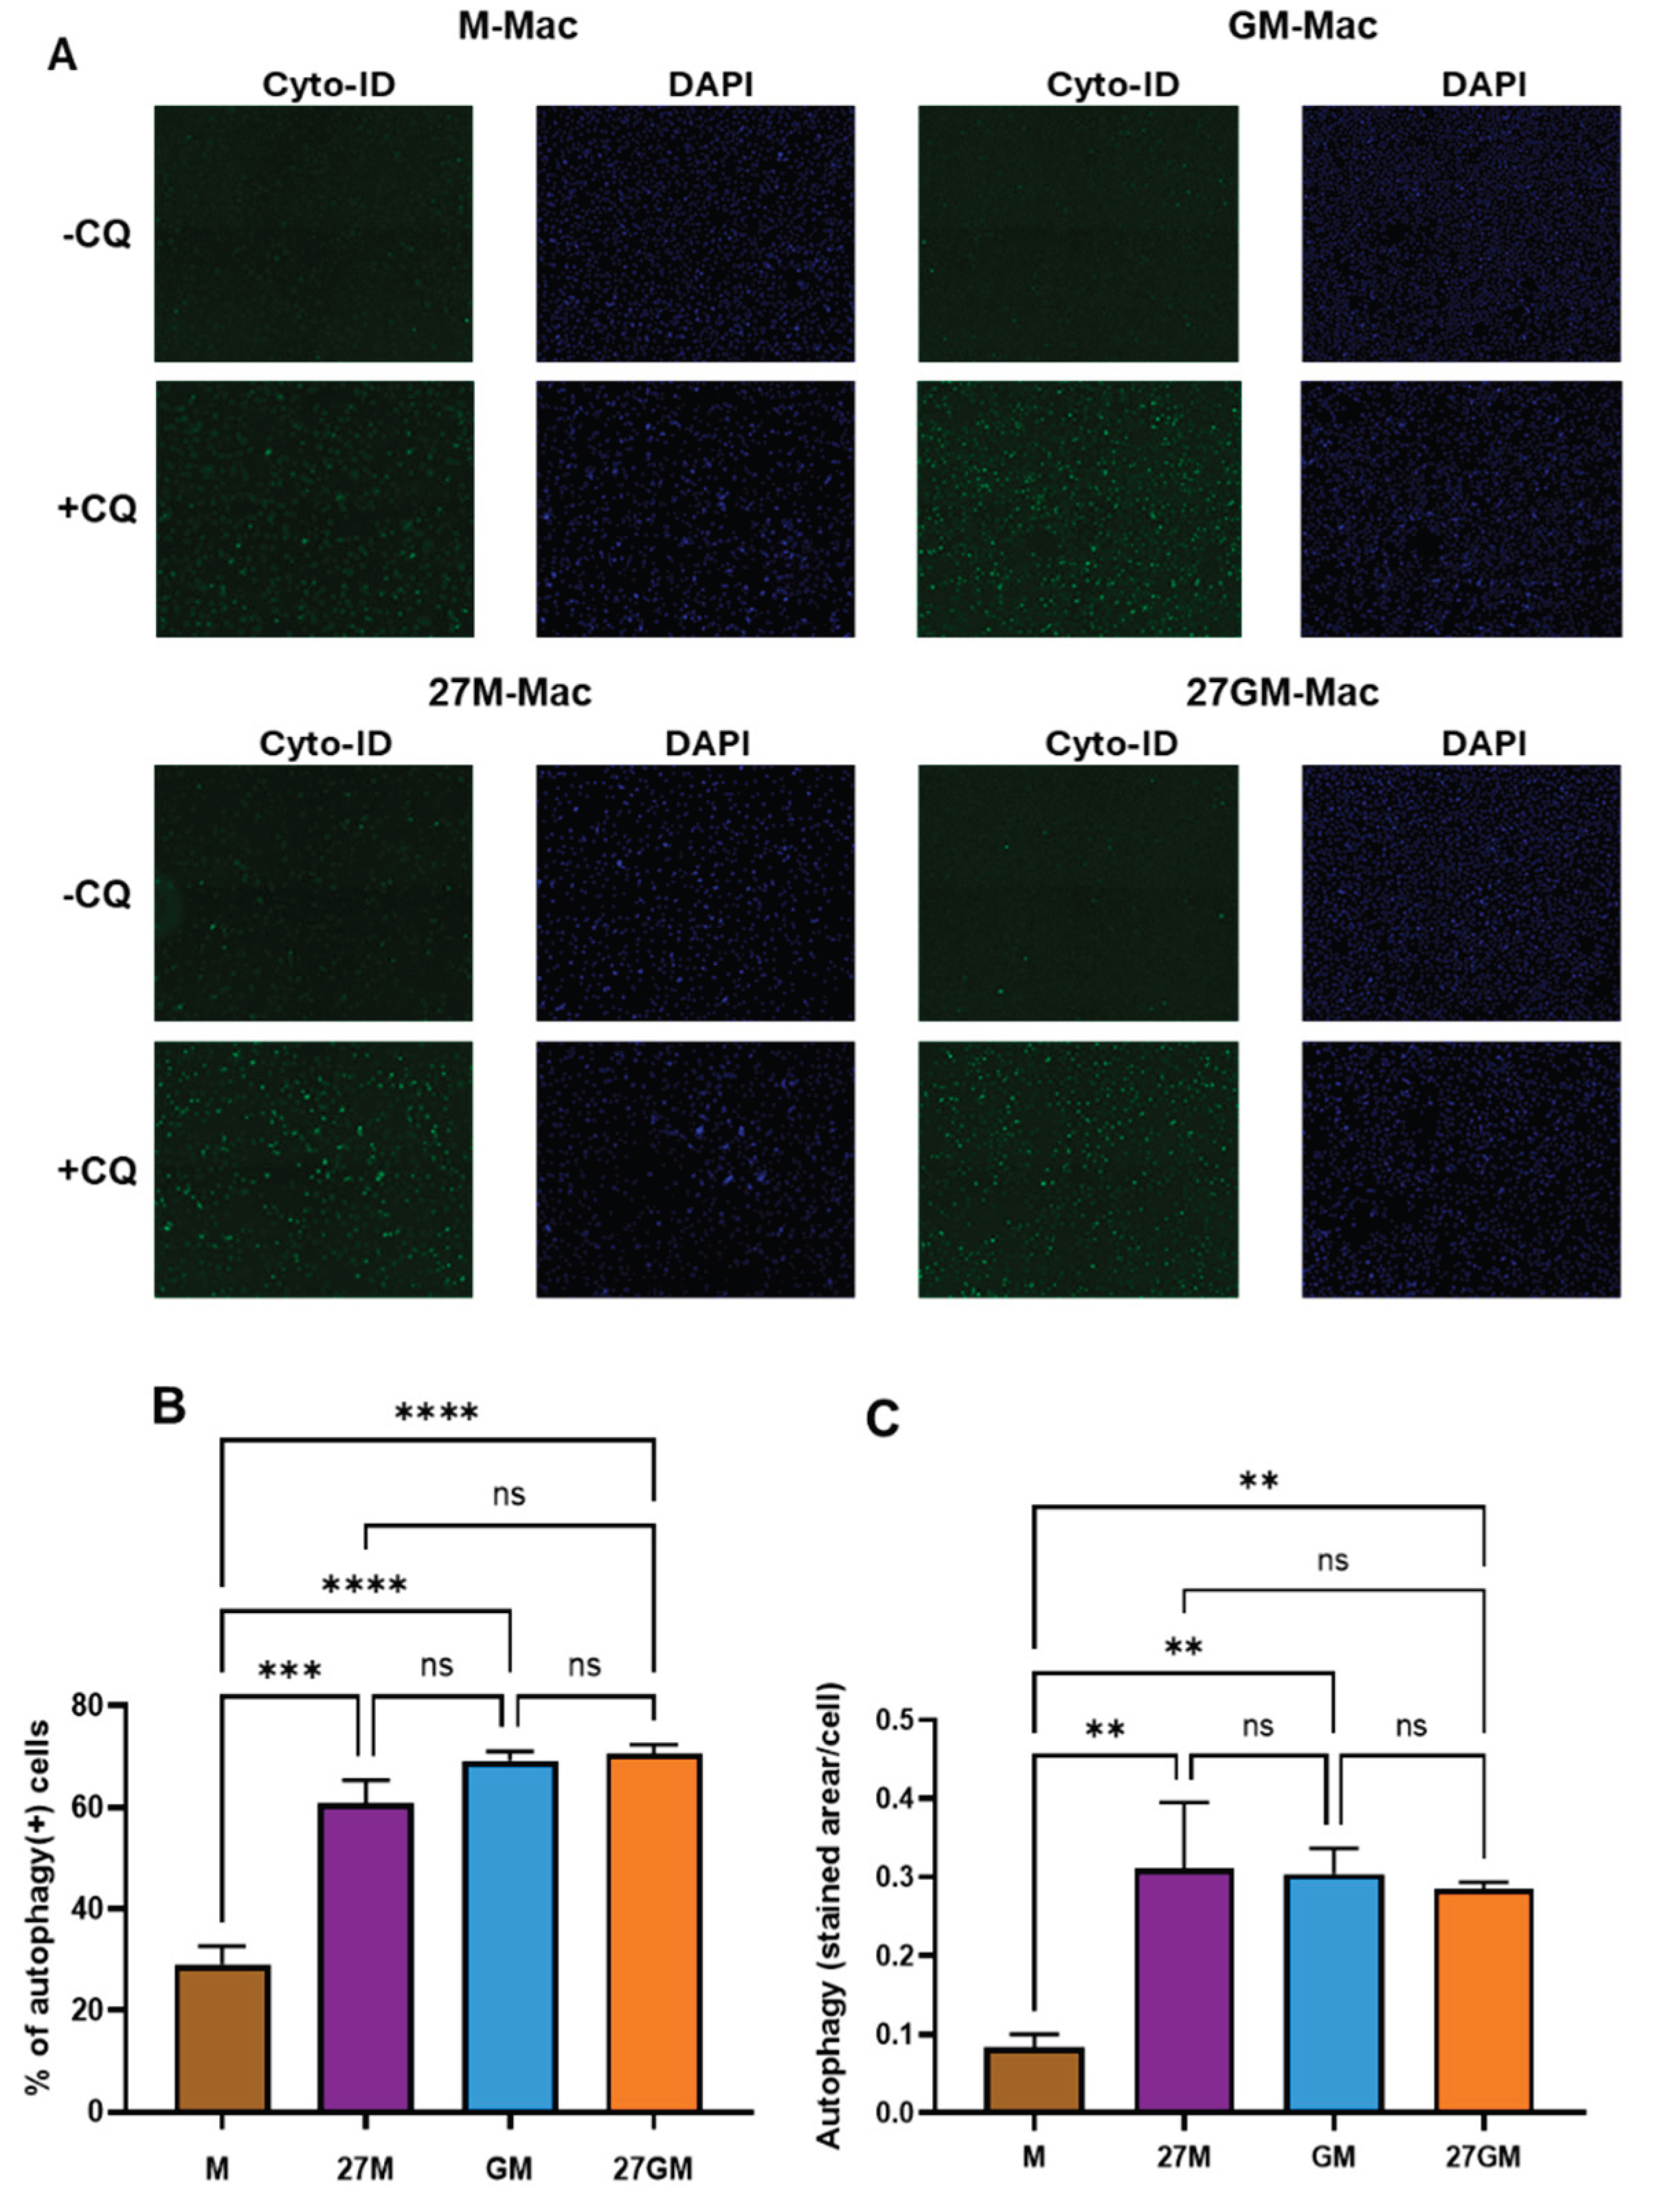
Figure 14.
Identification of autophagy-associated genes (ATGs) in each DEGs. (A-C) ATGs in Com.27M.DEGs: 27M.ATGs(A), ATGs in Com.27GM.DEGs: 27GM.ATGs (B), and ATGs in Com.GM.DEGs: GM.ATGs (C) were identified by Venn diagram analyses. (D) To identify common ATGs among 27M.ATGs, 27GM.ATG, and GM.ATG, a Venn diagram analysis among 27M.DEGs, 27GM.DAGs and GM.DAGs was performed. The names of overlapped or none-overlapped gene are shown in red boxes. (E and F) Th et-SNE plots indicate each gene distribution in Donor (E) and Donor B (F). Blue dots indicate cell expressing the indicated gens, while gray dots represent cells lacking the expression of the gene. The color intensity indicates relative gene expression levels, with gray indicating low or absent expression and darker blue indicating higher expression.
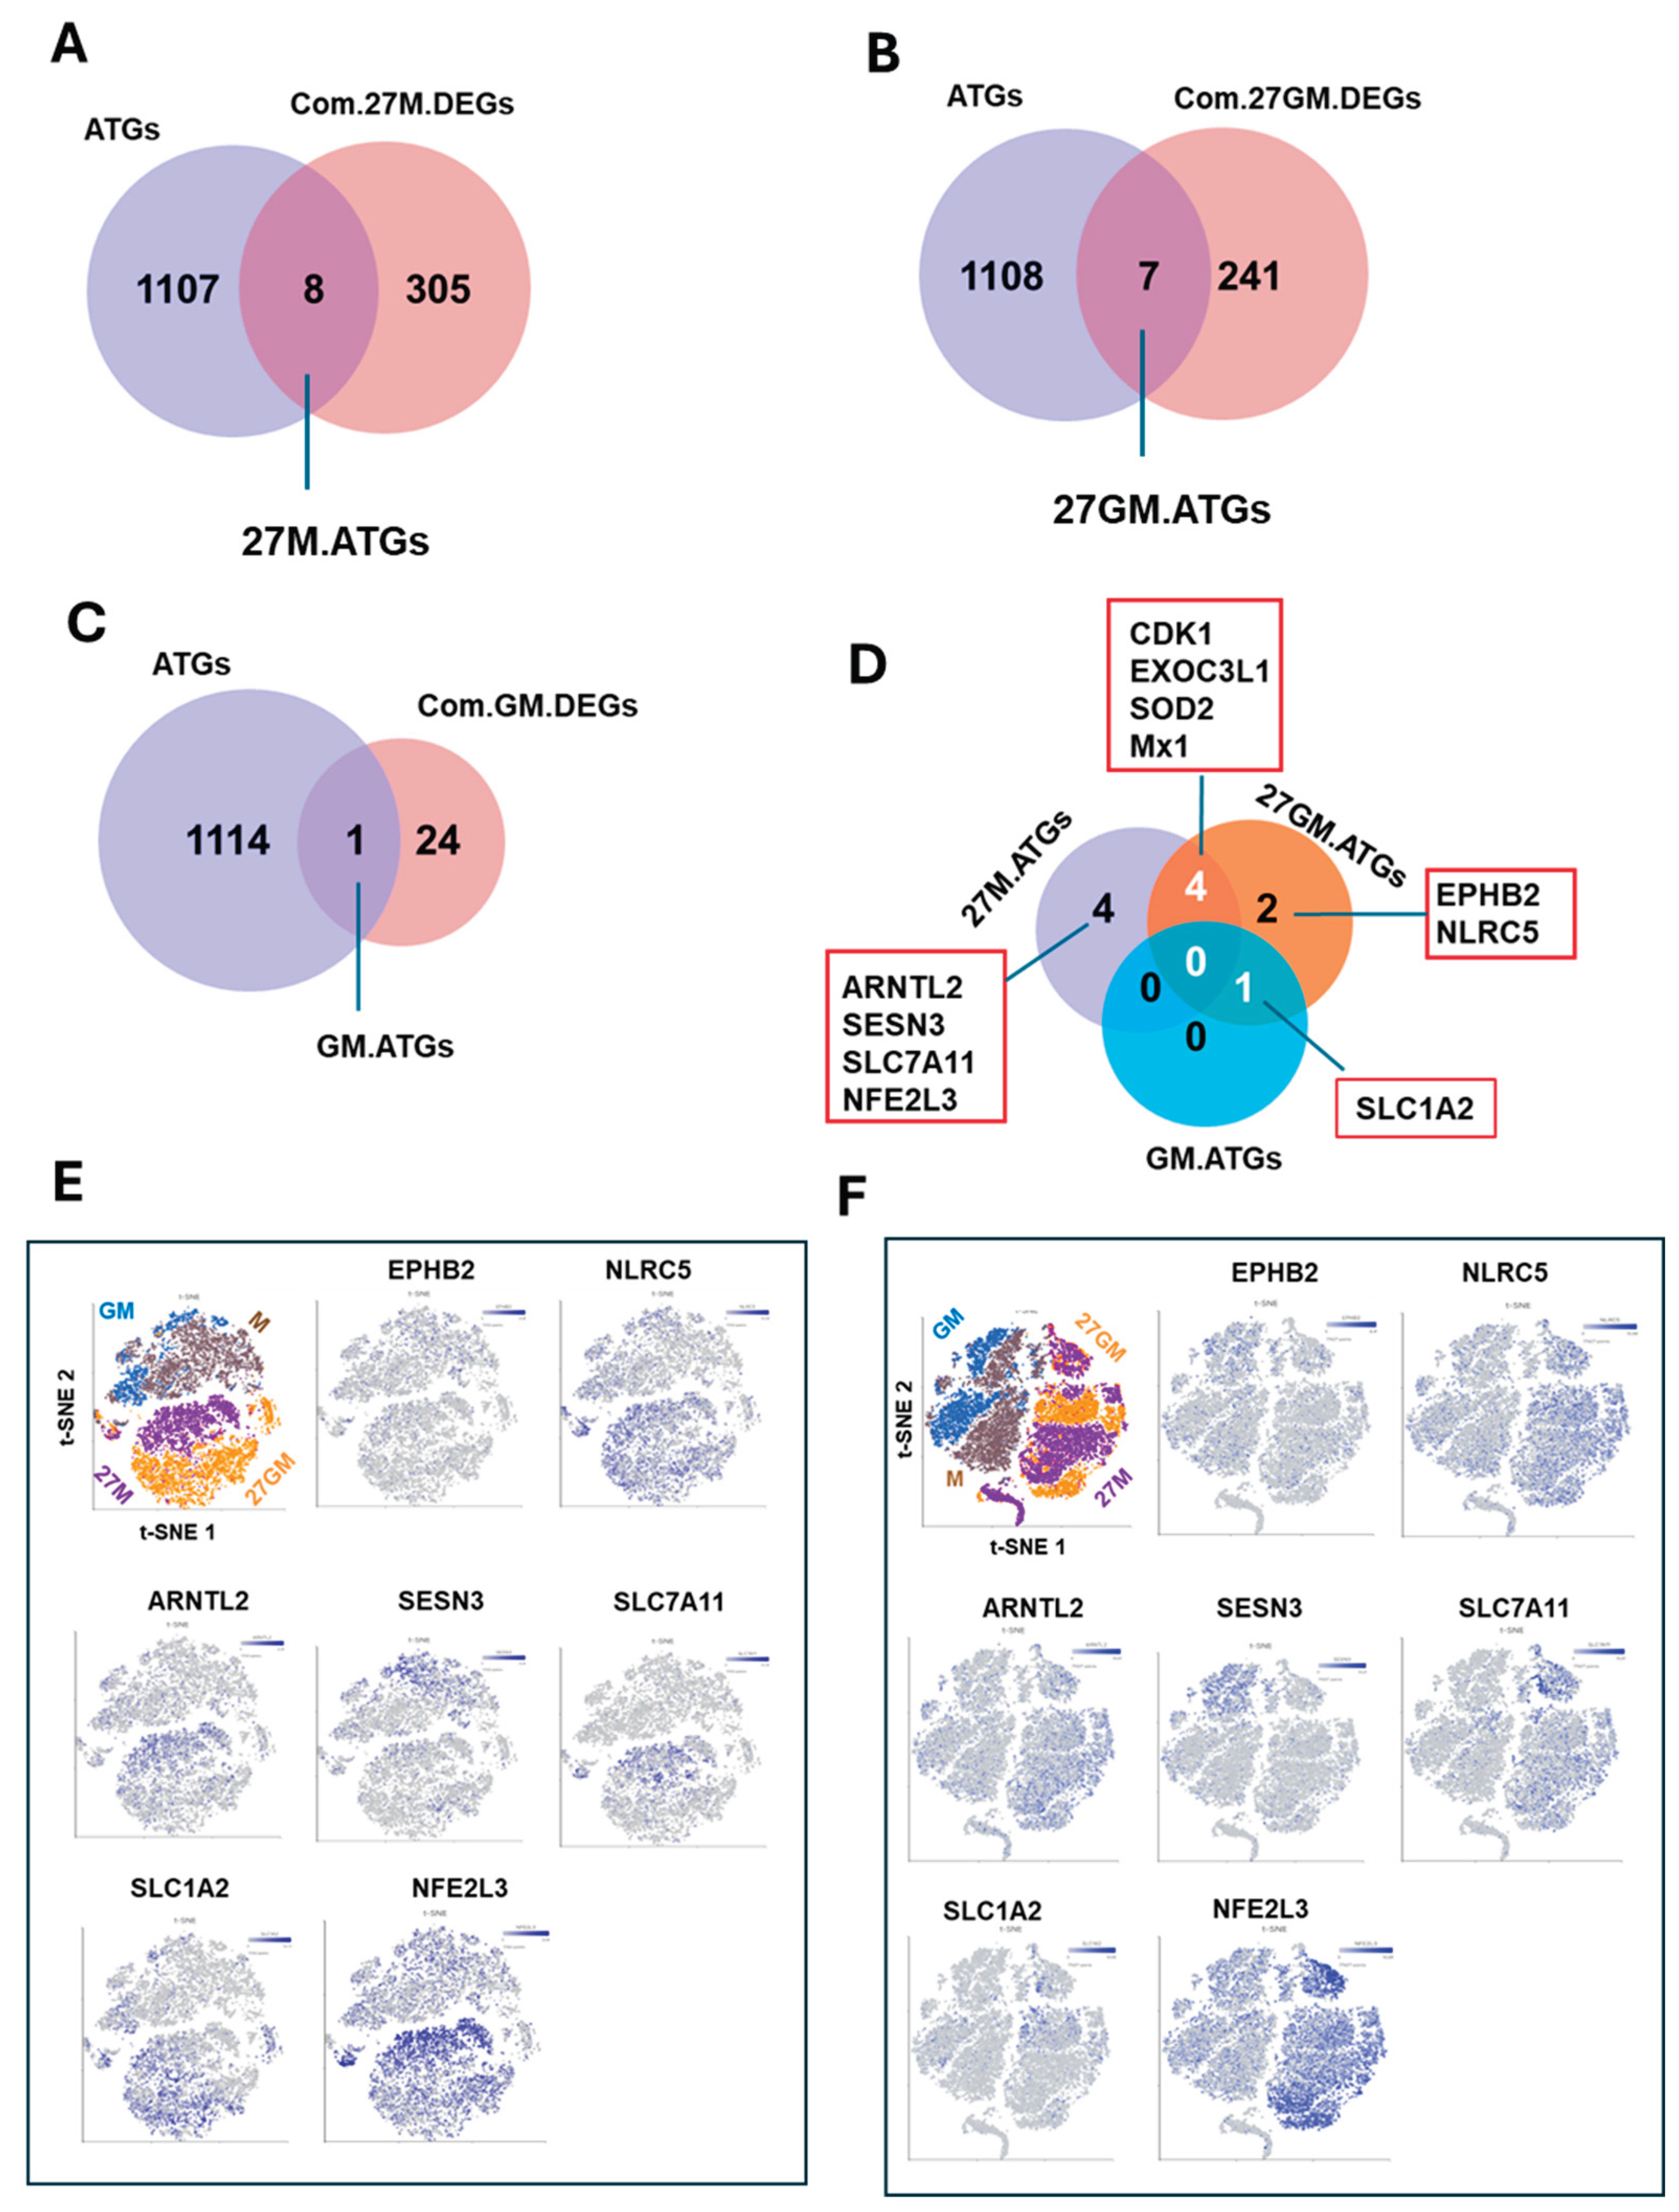
Figure 15.
Diagram for 27M-Mac and 27GM-Mac. Diagram of IL-27-mediated polarization of M-Mac and GM-Mac. Following polarization, both M-Mac and GM-Mac converge toward a subset characterized by high level of CD38, CD16 and CD68 (CD38hi/CD16hi/CD64hi), and CXCL9 secretion. This figure was created with BioRender.com.
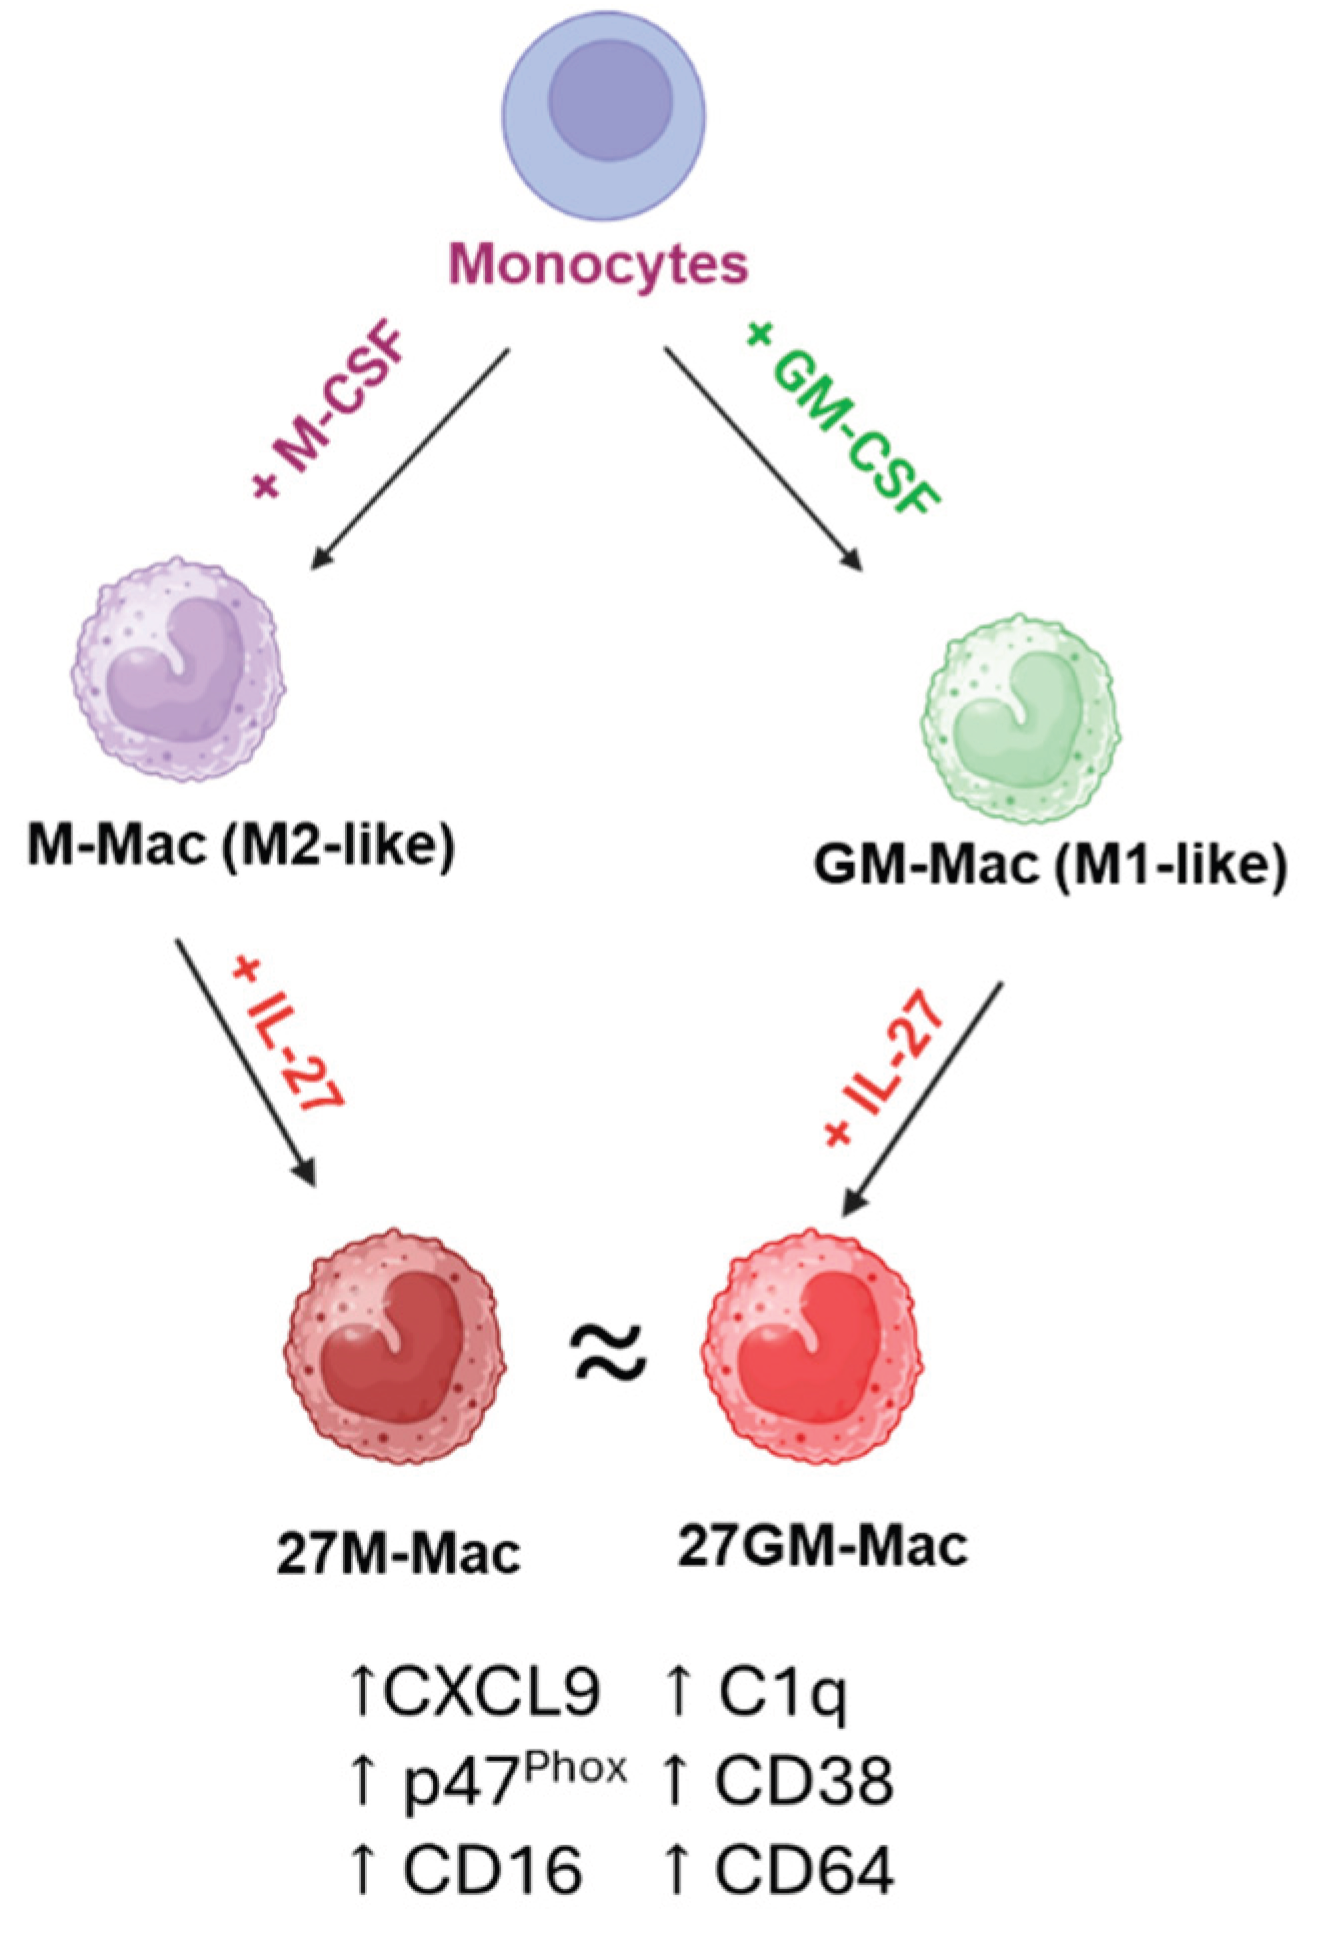

Table 1.
Comparison of DEGs numbers among four cell types.
| DEGs 1 | |||||
| Donor | Cell types | M | 27M | GM | 27GM |
| A | M | - | - | - | - |
| 27M | 560 | - | - | - | |
| GM | 119 | 755 | - | - | |
| 27GM | 398 | 219 | 264 | - | |
| B | M | - | - | - | - |
| 27M | 406 | - | - | - | |
| GM | 52 | 454 | - | - | |
| 27GM | 464 | 30 | 369 | - | |
1: DEGs were selected with absolute fold changes equal to or greater than three and p-values <0.05.
Table 2.
Summary of the assessed activities among subtypes *.
| Phenotypes | M-Mac | 27M-Mac | GM-Mac | 27GM-Mac |
| HIV replication | ++++ | + | + | + |
| ROS induction ** | + | ++ | + | +++ |
| Phagocytosis | +++ | + | + | + |
| Autophagy | + | ++ | ++ | ++ |
| Expression of | ||||
| CD38 | + | +++ | + | ++ |
| CD80 | + | + | + | + |
| CD86 | + | + | + | + |
| CD163 | + | + | + | + |
| CD206 | + | + | + | + |
| CD209 | + | ++ | ++ | ++ |
| CD16 | +/- | + | +/- | ++ |
| CD32 | + | ++ | + | ++ |
| CD64 | + | ++ | + | ++ |
| Secretion of § | ||||
| CXCL9 | +/- | ++ | + | + |
| C1q | +/- | + | - | + |
*: The activities in each phenotype in each cell type were subjected to a relative scoring analysis, with results compared to the corresponding activity in M-Mac. **: PMA-stimulated ROS induction. §: Macrophages were polarized in 6-well plates in the absence or presence of IL-27 for three days. Cell-free culture supernatants were collected and then protein amounts were assessed using ELISA.
Disclaimer/Publisher’s Note: The statements, opinions and data contained in all publications are solely those of the individual author(s) and contributor(s) and not of MDPI and/or the editor(s). MDPI and/or the editor(s) disclaim responsibility for any injury to people or property resulting from any ideas, methods, instructions or products referred to in the content. |
© 2026 by the authors. Licensee MDPI, Basel, Switzerland. This article is an open access article distributed under the terms and conditions of the Creative Commons Attribution (CC BY) license (http://creativecommons.org/licenses/by/4.0/).
Copyright: This open access article is published under a Creative Commons CC BY 4.0 license, which permit the free download, distribution, and reuse, provided that the author and preprint are cited in any reuse.


