
Submitted:
13 January 2026
Posted:
14 January 2026
You are already at the latest version
Abstract
The transition to a circular bioeconomy in developing economies is frequently hindered by the operational failure of biogas facilities due to feedstock supply discontinuity. Whilst biochemical potential is traditionally the primary selection criterion, this study postulates that logistic reliability serves as the governing constraint for sustainable implementation. To validate this paradigm shift, a spatially explicit decision-making framework integrating Shannon Entropy and TOPSIS was developed and applied to a representative tropical agro-industrial region. By evaluating conflicting criteria covering logistic availability, technical efficiency, and biochemical stability, the model identified Annual Residue Production as the dominant weighting factor. Results established Cattle Manure as the universal baseload substrate essential for mitigating seasonality risks, outweighing higher-yielding but intermittent agricultural residues. Spatial analysis further revealed distinct bioenergy clusters dictating tailored technological strategies: a high-potential Rice-Livestock cluster suitable for centralised industrial plants overseeing recalcitrant biomass, and a Cassava-Livestock cluster favourable for decentralised, low-tech digestion. This data-driven approach demonstrates that successful substrate selection must transcend theoretical yield maximisation to prioritise supply chain reliability, providing a robust roadmap for de-risking bioenergy investments in tropical regions.
Keywords:
anaerobic co-digestion
; circular bioeconomy
; feedstock logistic reliability
; bioenergy clusters
; Multi-Criteria Decision Analysis (MCDA)
; lignocellulosic biomass
; livestock waste
; agricultural residue
1. Introduction
Globally, the transition towards sustainable energy systems constitutes one of the most pressing challenges of the 21st century [1]. The agricultural sector plays a paradoxical role in this scenario, since while it is responsible for feeding a growing population, it generates approximately 180 billion tonnes (Gt) of lignocellulosic waste annually worldwide [2]. Despite the immense potential of these residues, it is estimated that only 1.6% to 2.2% of the global biogas potential is currently exploited, representing a missed opportunity to mitigate between 3.29 Gt and 4.36 Gt of CO2 equivalent emissions per year accounting for 10 % to 13 % of GHGs emissions worldwide [3,4].
In Latin America, a region that serves as a global food basket, the disparity between biomass availability and energetic valorisation is stark [5]. Colombia, for instance, generates an estimated 71.9 Mt/year of agricultural residues and 105 Mt/year of livestock waste [6]. However, waste management infrastructure often lags behind production capacity, leading to open-air disposal and environmental degradation [7]. The Caribbean region of Colombia, and specifically the department of Sucre, epitomizes this scenario. This territory is characterised by a vigorous agro-industrial vocation, contributing significantly to the national starch supply. Sucre produces over 576 kt/year of agricultural products, including cassava, rice and maize, accounting for approximately 10.8 %, 4.6 % and 3.5 % of the national production area, respectively [8]. Simultaneously, the region sustains a consolidated livestock sector with an inventory that supports the local dairy industry but generates over 3.6 Mt of livestock manure [6].
This high productivity brings an intrinsic challenge for the department of Sucre regarding the management of these organic streams. In rural areas of Sucre, crop residues like cassava stems and rice straw are typically left to decompose in open fields or burned. Additionally, the improper handling and direct discharge of livestock manure into wetlands has accelerated nutrient pollution, leading to eutrophication, harmful cyanobacteria growth, and the release of GHGs [9], which severely compromise local food security and water supplies. Consequently, there is an urgent need to transition from a linear waste disposal model to a circular bioeconomy approach, transforming these thousands of tonnes of “waste” into renewable energy vectors [10].
Anaerobic digestion (AD) stands out as a mature technology for treating organic waste while producing biogas and digestate [11]. However, the mono-digestion of single substrates often faces biochemical limitations that hinder process stability. For instance, cattle manure, despite its high buffering capacity [12], typically presents low Carbon-to-Nitrogen (C/N) ratio and modest methane yields [13]. Conversely, lignocellulosic residues, such as cassava stems and rice straw, possess significant biochemical methane potentials (BMP) but are hindered by their complex structural composition. Their high lignin content acts as a recalcitrant barrier, leading to slow hydrolysis rates and incomplete degradation [14]. Furthermore, these substrates often suffer from rapid acidification and nutritional imbalances—specifically high C/N ratios and low buffering capacity—which can result in process instability and failure in standalone digestion systems [15].
Anaerobic co-digestion (AcoD)—the simultaneous digestion of two or more substrates—emerges as a robust solution to these constraints [16]. By blending complementary substrates, AcoD balances the C/N ratio, dilutes potential inhibitors (such as ammonia or volatile fatty acids), and optimises the moisture content [17]. The synergistic effect achieved in AcoD not only enhances methane production kinetics but also improves the rheological properties of the digestate [18], potentially making the process more techno-economically feasible for regional implementation.
While the synergistic effects of AcoD offer clear metabolic advantages, the successful deployment of this technology requires transitioning from theoretical potential to territorial feasibility. Maximising methane yields becomes irrelevant if the substrates suffer from seasonal scarcity [19], prohibitive logistic-associated costs [20], or high competition from existing local markets [21]. Consequently, the selection process must transcend purely biochemical parameters to evaluate the specific “bioenergy vocation” of each territory, grounding the assessments on relevant, multidimensional criteria [22,23].
To address this complexity, Multi-Criteria Decision Analysis (MCDA) coupled with Geospatial Information Systems (GIS) has become a standard approach for bioenergy planning. Recent literature has extensively applied these tools for biogas plant site selection, focusing on identifying optimal locations for centralised facilities based on aggregated regional availability [24,25,26,27]. For instance, studies by Soha et al. [24] and Shi et al. [25] utilise GIS-MCDA to optimise supply areas and spatio-temporal stability for large-scale plants, while others like Akther et al. [26] and Venier & Yabar [27] focus on suitability analysis for single-site infrastructure in metropolitan or provincial contexts.
However, a critical gap persists in these assessments: they predominantly treat territories as homogeneous supply basins. By evaluating feedstock availability based on regional aggregates [28,29] or prioritising purely biochemical synergies determined in laboratory settings [30,31], current frameworks often overlook the local spatial co-existence of substrates. This oversight results in a significant divergence between theoretical potential and operational viability, where mixtures identified as biochemically optimal (e.g., through C/N ratio balancing) are presumed feasible without verifying their coexistence within an economically sustainable collection radius at the municipal scale. Consequently, the prevailing focus on facility siting tends to obscure the necessity for a substrate prioritisation framework that accounts for the intra-regional heterogeneity of agro-ecological systems.
This study addresses this methodological gap by establishing a spatially explicit decision-making framework that prioritises AcoD mixtures prior to defining plant locations. Using an Integrated Entropy-TOPSIS method, this research moves beyond generic regional assessments to rank specific residue combinations across twenty-six municipalities in the Department of Sucre, Colombia. Unlike traditional studies that seek a universal ‘optimal substrate’, this work assesses the hypothesis that territorial heterogeneity dictates the formation of distinct bioenergy clusters, where the feasibility of a co-digestion mixture is strictly a function of local dominant crops and livestock density rather than theoretical yield maximisation.
The primary objective of this study is, therefore, to provide a data-driven roadmap that shifts the selection paradigm from biochemical potential to logistic feasibility. By identifying these localised clusters—distinguishing, for instance, between a rice-based industrial cluster and a cassava-based decentralised cluster—this framework serves as a risk mitigation strategy for policymakers and investors. It ensures that bioenergy implementation strategies are grounded in the reality of local supply chain reliability, thereby addressing the operational risks associated with substrate seasonality and spatial dispersion in developing economies.
2. Materials and Methods
2.1. Study Area and Identification of Alternatives
2.1.1. Agro-industrial Profile of the Department of Sucre
The study focuses on the Department of Sucre, Colombia, comprising twenty-six municipalities distributed across five natural sub-regions, each characterised by distinct agro-ecological conditions and residue generation profiles. The Montes de María sub-region includes the municipalities of Chalán, Colosó, Morroa, Ovejas, and Sincelejo, known for their tuber and avocado production. The Mojana region, a major agricultural hub for rice, comprises Majagual, Sucre, and Guaranda. The San Jorge sub-region includes San Marcos, Caimito, La Unión, and San Benito Abad, balancing agriculture with livestock. The central Sabanas sub-region, the epicentre of intensive cattle ranching, encompasses Corozal, San Luis de Sincé, El Roble, Sampués, San Pedro, Los Palmitos, Buenavista, Galeras, and San Juan de Betulia. Finally, the Golfo de Morrosquillo sub-region covers the coastal municipalities of Coveñas, Santiago de Tolú, San Onofre, Toluviejo, and San Antonio de Palmito. This spatial subdivision is critical as the availability of biomass varies significantly. The analysis treats each municipality as a distinct spatial unit for residue quantification.
To illustrate this spatial heterogeneity, Figure 1 presents the geolocalised density of agricultural production and livestock inventory across the department. Figure 1a highlights agricultural production, which is primarily concentrated in the Mojana sub-region (e.g., Majagual and Guaranda) and specific areas of Montes de María (e.g., Ovejas), driven by intensive rice and tuber farming. In contrast, Figure 1b reveals the livestock inventory density, showing a high concentration in the central Sabanas sub-region (e.g., Corozal and Sampués) and ranching hubs in San Jorge sub-region (e.g., La Unión). This geospatial distribution of primary production and livestock is a key determinant for estimating the biomass potential and the logistic feasibility of implementing anaerobic digestion plants.
2.1.2. Selection of Substrates and Residue Generation Factors
The selection of substrates for this study was driven by the predominant agro-economic activities in the Department of Sucre, ensuring that the proposed co-digestion scenarios are regionally relevant and logistically feasible. Consequently, the analysis focuses on the most abundant lignocellulosic residues from staple crops (cassava, yam, maize, and rice) and organic effluents from the livestock sector (cattle, poultry, and porcine manure).
To quantify the theoretical availability of these substrates at the municipal level, specific Residue Generation Factors (RGF) were adopted from specialised literature. These factors, presented in Table 1, represent the ratio of residue generated per unit of main product harvested or per animal head, enabling the conversion of agricultural statistical data into biomass potential.
2.2. Definition of Decision Criteria
To provide a holistic assessment of the substrate suitability for anaerobic co-digestion, a set of ten conflicting criteria was established. These criteria were selected to address the multidimensional nature of bioenergy projects, encompassing supply chain reliability, bio-energy efficiency, and biochemical stability. As detailed in Table 2, the criteria are categorised into three domains:
- Availability and Logistics (C1, C6, and C10): These criteria assess the feasibility of the supply chain. High annual production and total solids content are desirable for reducing collection radii and transport costs; while competing local uses (e.g., animal feed) represent a barrier to energy valorisation.
- Physicochemical Properties (C2, C3, C4, and C5): These parameters determine the theoretical energy yield and process stability. Special attention is given to the C/N ratio and moisture content, which must fall within specific biological ranges to avoid inhibition.
- Lignocellulosic Composition (C7, C8, and C9): Reflecting the complexity of tropical biomass, these criteria evaluate the biodegradability kinetics. High cellulose and hemicellulose fractions are preferred for rapid conversion, whereas lignin acts as a recalcitrant barrier limiting hydrolysis.
2.3. Data Acquisition and Matrix Construction
2.3.1. Municipal Biomass Inventory and Data Collection
Data for estimating agricultural residue production were based on the main product values of the evaluated crops reported by the Agronet database (Colombian Ministry of Agriculture and Rural Development) [8]. Similarly, data required for livestock residue calculations were obtained from the same source, determining the reported annual animal inventory for each of the twenty-six municipalities ().
The Annual Residue Production (C1) for each specific residue in municipality was calculated individually to serve as a criterion for that specific alternative. This calculation follows Equation (1).
where is the estimated annual production of residue in municipality (t/year); is the reported annual production of the main crop or the animal inventory associated with residue in municipality ; and is the Residue Generation Factor for residue , as defined in Table 1. This allows for the creation of a spatially explicit decision matrix where the feasibility of a mixture depends on the local availability of both components in municipality .
2.3.2. Experimental Characterisation
The thermal and physical properties of the substrates were determined through proximate analysis in accordance with international standards. Specifically, moisture content was evaluated following ASTM E871-82, while volatile matter and ash content were assessed using ASTM E872-82 and ASTM E1755-01, respectively. Fixed carbon was subsequently derived by difference. The ultimate analysis was performed to quantify the elemental composition, employing a Velp EMA 502 elemental analyser and following the protocols outlined in ASTM D591-92.
The lignocellulosic composition (C7, C8, C9) was analysed to determine the structural carbohydrate fractions essential for methane yield estimation. The content of cellulose (), hemicellulose (), and lignin () was quantified using the Van Soest method (AOAC 973.18). These experimentally determined fractions were then input into the model proposed by Thomsen et al. [50] (Equation 2) to calculate the theoretical Biochemical Methane Potential (C2), ensuring the energy estimates reflect the specific biochemical reality of the region’s biomass.
where is the Biochemical Methane Potential (L of CH4/kg of VS); , , and represent the fractions of cellulose, hemicellulose, and lignin, respectively; and is the fraction of extractives (non-structural components like soluble sugars, proteins, waxes, etc.), calculated by difference.
2.3.3. Assessment of Local Market Utilisation and Competition (C10)
To quantify the operational risk associated with feedstock accessibility, a semi-quantitative assessment of the Local Market Utilisation (C10) was conducted. Unlike physicochemical properties, this criterion evaluates the ‘opportunity cost’ of diverting a residue from its current application to energy generation. An elevated level of existing competition implies a lower availability for AD or AcoD projects, categorising C10 as a Cost-type criterion.
The market scores were ascertained through a triangulation of secondary data sources, including:
- Official Agrarian Reports: Statistical data from the Ministry of Agriculture and Rural Development (Agronet) and the Mining-Energy Planning Unit (UPME) regarding biomass residual factors and current disposal practices.
- Scientific Literature Review: Analysis of regional studies focusing on the waste management practices specific to the department of Sucre.
- Departmental Development Plans: Review of official documents from the Government of Sucre describing local agricultural supply chains.
Based on this evidence, a five-point Market Competition Scale was established to translate qualitative logistics data into numerical inputs for the TOPSIS algorithm. The scoring rubric was defined as follows:
- Score 1 (Negligible Competition): Residues currently treated as a disposal liability. There is no established market; the producer incurs costs for removal or burning. These are the most favourable for AD.
- Score 2 (Low Competition): Residues with minimal economic value, limited to sporadic on-farm nutrient cycling or inefficient uses with high perishability constraints.
- Score 3 (Moderate/Seasonal Competition): Residues with an established but fluctuating market. Competition arises during specific seasons (e.g., dry periods) for uses such as animal ensilage or bedding.
- Score 4 (High/Captive Competition): Residues integrated into mature commercial supply chains or possessing high captive use value for internal energy generation within industrial facilities.
- Score 5 (Prohibitive Competition): Commodities with a high market price where energy valorisation is economically unfeasible due to the cost of acquisition.
Each alternative (A1 to A16) was assigned a discrete integer value based on its predominant management practice in the Department of Sucre.
2.4. Implementation of the Integrated Etropy-TOPSIS Method
The ranking of alternatives was performed using a multi-step computational framework implemented in the R statistical environment.
2.4.1. Pre-Processing
Before normalization, criteria that are neither strictly Benefit nor Cost types must be converted. The C/N ratio (C3) and Moisture Content (C4) are range criteria with optimal intervals [L,U] (e.g., [20,30] for C/N). To integrate these into the TOPSIS framework, values were converted to a “Benefit” type using the following transformation, where values closer to the optimal range receive higher scores:
where is the raw value, and is the transformed value used in subsequent steps.
2.4.2. Normalisation of the Decision Matrix
To allow comparison across dimensions with different units, the decision matrix was vector-normalised. For each element (after range conversion), the normalised value is calculated using Equation (4):
2.4.3. Determination of Objective Weighting Factors via Shannon Entropy
Shannon Entropy was used to calculate objective weights (). First, the probability of the j-th criterion for alternative () is calculated using Equation (5):
The entropy value () for each criterion is computed as:
Finally, the degree of divergence () is used to determine the objective weight :
2.4.4. Calculation of the Weighted Normalised Decision Matrix
The weighted normalised decision matrix V is obtained by multiplying the normalised matrix by the entropy weights:
2.4.5. Calculation of the Ideal and Negative-Ideal Solutions
The Positive Ideal Solution () and the Negative Ideal Solution () are defined as:
where represents the set of benefit criteria and the set of cost criteria.
2.4.6. Calculation of Relative Closeness to the Ideal Solution
The Euclidean distances of each alternative to the positive ideal () and negative ideal () solutions are calculated:
The relative closeness coefficient () represents the final ranking score:
An alternative with a closer to one is considered superior.
2.5. Formulation of Anaerobic Co-Digestion Scenarios Based on Local Availability
To evaluate the theoretical energy potential of implementing circular economy strategies at the local level, specific AcoD scenarios were defined for each municipality. These scenarios were constructed by pairing the highest-ranked agricultural residue () with the highest-ranked livestock residue () obtained from the Entropy-TOPSIS assessment for each specific location. This approach ensures that the proposed mixtures are not only theoretically optimal but also logistically feasible based on local dominance.
The scenarios were characterised by four key indicators derived from the mass balance of the available substrates. First, the Total Gross Availability () for municipality was calculated as the sum of the annual generation of the best-ranked substrates:
where and are the annual quantities (t/year) of the best agricultural and livestock residues in municipality k, respectively.
The physico-chemical properties of the substrate mixture were estimated assuming a complete mixing model based on the availability ratio. The Weighted Biochemical Methane Potential () and the Weighted Volatile Solids () were calculated as follows:
where and represent the biochemical methane potential of the individual residues, and and represent volatile solids content of the individual residues.
Finally, the Global Methane Potential (), which represents the theoretical maximum energy recovery capacity for the municipality per year, was determined by integrating the total availability with the mixture’s organic quality:
This variable serves as a proxy for the scalability of biogas projects in each territory, integrating both the quantity and quality of the prioritised waste streams.
3. Results
3.1. Municipal-Level Waste Generation Inventory
The municipal inventory, summarised in Figure 2, presents the total annual residue generation across the twenty-six municipalities. Majagual recorded the highest total biomass potential in the department, accumulating approximately 478.4 kt/year. This figure comprised 118.8 kt of agricultural residues—the maximum value observed for this category among all municipalities—and 359.6 kt of livestock residues. San Luis de Sincé and San Marcos followed as the subsequent largest producers, with total generation values of roughly 407.6 kt and 388.5 kt, respectively. In San Luis de Sincé, livestock waste constituted the predominant fraction (388.7 kt), whilst agricultural residues contributed 18.9 kt to the total mass.
In contrast, the municipalities of Chalán, Coveñas, and Colosó exhibited the lowest generation rates, with total combined residues remaining below 32 kt/year in each location. Regarding the composition of the waste streams, livestock residues exceeded agricultural residues in all evaluated territories. For instance, in Sucre and San Onofre, livestock waste accounted for over 90% of the locally generated biomass. Apart from Majagual, significant quantities of agricultural residues were recorded in Guaranda (52.1 kt) and Ovejas (43.0 kt), although these values remained lower than their respective livestock residue counterparts (150.8 kt and 118.6 kt, respectively).
3.2. Physicochemical Characterisation of Residues
The physicochemical characterisation of the sixteen selected substrates is detailed in Table 3. The C/N ratio exhibited a wide variation across the alternatives, ranging from a minimum of 6.68 in Poultry Manure (A16) to a maximum of 52.61 in Plantain Pseudostem (A10). Livestock residues (A14–A16) generally recorded lower C/N values compared to agricultural residues, with the exception of Cassava Leaves (A2), which presented a ratio of 10.99. Regarding MC, Plantain Pseudostem (A10) showed the highest value at 93.17 %, whilst Mango Prunings (A7) recorded the lowest at 47.63 %. The VS content ranged from 71.26 % in Poultry Manure to 94.42 % in Cassava Stump (A4).
Lignocellulosic composition analysis revealed distinct structural differences among the substrates. Cellulose content was highest in Plantain Pseudostem (66.01 %) and Coconut Prunings (65.33 %), whereas Pig Manure (A15) recorded the lowest fraction at 9.86 %. Hemicellulose content varied from 5.73 % in Poultry Manure to 28.49 % in Plantain Pseudostem. Regarding lignin, the highest concentrations were observed in Cassava Leaves (26.35 %) and Watermelon Stubble (25.08 %), whilst Poultry Manure and Avocado Prunings presented the lowest values, with 5.73 % and 6.62 %, respectively.
The BMP values demonstrated significant variability across the evaluated residues. Plantain Pseudostem (A10) yielded the highest theoretical potential at 433.6 L CH4/kg VS, followed by Maize Stover (A6) with 381.5 L CH4/kg VS. Conversely, the livestock residues recorded the lowest methane yields, with Cattle Manure (A14) and Pig Manure (A15) producing 136.4 L CH4/kg VS and 146.9 L CH4/kg VS, respectively.
3.3. Local Market Utilisation and Competition Assessment
The assessment of local market utilisation, detailed in Table 4, categorised the sixteen substrates based on their existing competition levels. A total of six residues received the lowest Market Score of 1, indicating negligible competition. This group included Avocado Prunings (A1), Cassava Stump (A4), Mango Prunings (A7), Plantain Pseudostem (A10), Watermelon Stubble (A12), and Yam Stubble (A13). The primary drivers associated with this score were disposal costs, land clearance requirements, and on-field nutrient cycling.
Five substrates were assigned a Market Score of 2, comprising Cassava Leaves (A2), Cassava Stems (A3), Coconut Prunings (A5), Plantain Leaves (A9), and Cattle Manure (A14). The competition factors identified for these residues included high perishability, specific agricultural applications such as vegetative propagation, and logistical constraints related to collection. Intermediate competition (Market Score 3) was recorded for three substrates: Maize Stover (A6), Rice Straw (A11), and Pig Manure (A15), where the determining factors were seasonal fluctuations, animal feed demand, and environmental management risks.
The highest competition level observed in the study corresponded to a Market Score of 4, assigned to Oil Palm Prunings (A8) and Poultry Manure (A16). For these residues, the key drivers limiting availability were internal energy valorisation within extraction mills and established commercial value as organic fertiliser, respectively. No residues were assigned a Market Score of 5.
3.4. Application of the Integrated ENTROPY-TOPSIS Method
3.4.1. Determination of Objective Weights
The vector-normalised decision matrix, presented in Table 5, displays the dimensionless scores for the sixteen alternatives across the evaluated criteria (excluding C1, which is calculated per municipality). Regarding the BMP (C2), Plantain Pseudostem (A10) achieved the highest normalised value of 0.370, followed by Maize Stover (A6) at 0.325. Conversely, the livestock residues recorded the lowest scores in this dimension, with Cattle Manure (A14) and Pig Manure (A15) registering values of 0.116 and 0.125, respectively.
In terms of physicochemical properties, the normalised C/N ratio (C3) showed uniform values of 0.299 for nine substrates, including Maize Stover and Cattle Manure. The lowest score for this criterion was observed for Plantain Pseudostem (0.000). Moisture Content (C4) exhibited distinct polarisation; six alternatives, such as Plantain Leaves (A9) and Cattle Manure, shared the maximum normalised score of 0.340, whilst Mango Prunings (A7) received a value of 0.000.
The lignocellulosic composition criteria demonstrated varied distributions. For Cellulose (C7), Plantain Pseudostem and Coconut Prunings obtained the highest scores (0.341 and 0.338), whereas Pig Manure recorded the minimum at 0.094. Regarding Lignin (C9), Oil Palm Prunings (A8) and Poultry Manure (A16) presented contrasting results, with normalised values of 0.311 and 0.079, respectively. Finally, for Local Market Utilisation (C10), Oil Palm Prunings and Poultry Manure achieved the maximum score of 0.434, while seven residues, including Avocado Prunings (A1), received the baseline score of 0.108.
The calculation of objective weights via Shannon Entropy, illustrated in Figure 3, identified Annual Residue Production (C1) as the criterion with the highest relative importance, assigned a mean weight of 0.761 (±0.027). This was followed by Moisture Content (C4) with a weight of 0.060, and Local Market Utilisation (C10) with 0.046. The C/N Ratio (C3) and Lignin Fraction (C9) received weights of 0.039 and 0.037, respectively.
The remaining criteria registered weights below 0.030. The structural carbohydrate fractions, Hemicellulose (C8) and Cellulose (C7), were assigned values of 0.021 and 0.018. Finally, the physical parameters of BMP (C2), Volatile Solids (C5), and Total Solids (C6) obtained the lowest objective weights in the assessment, with C5 and C6 recording values of 0.001 and 0.000, respectively.
3.4.2. Ranking of Co-Digestion Scenarios by Municipality
The theoretical energy potential and physicochemical properties of the prioritised co-digestion mixtures are detailed in Table 7. The GMP exhibited a wide range of variation across the department, with Majagual recording the highest value at 53.6 Million m³/year, derived from a Total Availability of 430.5 kt/year. Following Majagual, the municipalities of San Luis de Sincé, San Marcos, and San Onofre registered substantial potentials of 42.7, 39.5, and 34.1 Million m³/year, respectively. Conversely, the lowest energy potentials were observed in coastal or mountainous municipalities such as Coveñas (1.7 Million m³/year), Chalán (2.0 Million m³/year), and Colosó (3.2 Million m³/year).
Regarding the specific methane yields of the prioritised mixtures, the highest Weighted BMP was recorded in Chalán at 176.6 L CH4/kg VS, corresponding to a mixture of Cattle Manure and Maize Stover. High BMP values were also observed in municipalities where Rice Straw was the selected co-substrate, such as Guaranda (161.4 L CH4/kg VS) and Majagual (157.1 L CH4/kg VS). In contrast, municipalities utilising Plantain Leaves or Cassava Stems generally presented lower weighted yields. For instance, Buenavista and Sucre recorded BMP values of approximately 136.4 L CH4/kg VS.
The mass balance analysis revealed significant heterogeneity in the Agriculture-to-Livestock mixing ratios. The most balanced proportions were identified in the Mojana sub-region, specifically in Guaranda (1:2.9) and Majagual (1:3.7). A distinct group of municipalities, including San Onofre, Santiago de Tolú, and Sucre, exhibited ratios heavily skewed towards livestock residues. In Sucre, the ratio reached 1:5128.9, whilst Santiago de Tolú recorded 1:1783.9, indicating a mixture composition dominated almost exclusively by manure mass. Despite these variations in mixing ratios, the weighted VS content of the mixtures remained relatively stable across the territory, ranging between 79.1% and 81.1%.

Table 6.
Ranking of agricultural and livestock residues per municipality.
| Municipality | A1 | A2 | A3 | A4 | A5 | A6 | A7 | A8 | A9 | A10 | A11 | A12 | A13 | A14 | A15 | A16 |
|---|---|---|---|---|---|---|---|---|---|---|---|---|---|---|---|---|
| Buenavista | 7 | 13 | 6 | 12 | 16 | 4 | 15 | 9 | 3 | 14 | 11 | 10 | 8 | 1 | 2 | 5 |
| Caimito | 6 | 12 | 8 | 13 | 16 | 3 | 15 | 10 | 5 | 14 | 4 | 9 | 7 | 1 | 2 | 11 |
| Chalán | 9 | 14 | 6 | 13 | 16 | 2 | 15 | 10 | 7 | 3 | 5 | 11 | 8 | 1 | 4 | 12 |
| Colosó | 8 | 14 | 6 | 13 | 16 | 4 | 15 | 10 | 5 | 3 | 12 | 11 | 7 | 1 | 2 | 9 |
| Corozal | 8 | 13 | 3 | 11 | 16 | 5 | 15 | 9 | 6 | 14 | 12 | 10 | 7 | 1 | 4 | 2 |
| Coveñas | 9 | 14 | 3 | 12 | 16 | 4 | 15 | 10 | 7 | 6 | 13 | 11 | 5 | 1 | 2 | 8 |
| El Roble | 8 | 13 | 2 | 12 | 16 | 7 | 15 | 10 | 6 | 14 | 5 | 11 | 9 | 1 | 3 | 4 |
| Galeras | 8 | 13 | 2 | 12 | 16 | 6 | 15 | 10 | 5 | 14 | 7 | 11 | 9 | 1 | 3 | 4 |
| Guaranda | 6 | 12 | 9 | 13 | 16 | 5 | 15 | 10 | 4 | 14 | 2 | 8 | 7 | 1 | 3 | 11 |
| La Unión | 7 | 14 | 4 | 13 | 16 | 5 | 15 | 10 | 6 | 12 | 9 | 11 | 8 | 1 | 2 | 3 |
| Los Palmitos | 7 | 13 | 2 | 12 | 16 | 6 | 15 | 9 | 5 | 14 | 11 | 10 | 8 | 1 | 3 | 4 |
| Majagual | 8 | 12 | 10 | 13 | 16 | 7 | 15 | 11 | 6 | 14 | 2 | 3 | 9 | 1 | 5 | 4 |
| Morroa | 9 | 14 | 4 | 13 | 16 | 7 | 15 | 10 | 6 | 3 | 12 | 11 | 8 | 1 | 2 | 5 |
| Ovejas | 9 | 13 | 3 | 8 | 16 | 2 | 15 | 10 | 7 | 4 | 14 | 11 | 5 | 1 | 6 | 12 |
| Palmito | 11 | 14 | 2 | 9 | 16 | 3 | 15 | 8 | 7 | 4 | 6 | 12 | 10 | 1 | 5 | 13 |
| Sampués | 8 | 13 | 4 | 12 | 16 | 5 | 15 | 9 | 7 | 14 | 11 | 10 | 6 | 1 | 2 | 3 |
| San Benito Abad | 6 | 12 | 8 | 13 | 16 | 5 | 15 | 9 | 4 | 14 | 2 | 10 | 7 | 1 | 3 | 11 |
| San José de Toluviejo | 8 | 13 | 3 | 12 | 16 | 4 | 15 | 6 | 5 | 14 | 11 | 9 | 7 | 1 | 2 | 10 |
| San Juan de Betulia | 7 | 13 | 3 | 12 | 16 | 5 | 15 | 9 | 6 | 14 | 11 | 10 | 8 | 1 | 2 | 4 |
| San Luis de Sincé | 5 | 13 | 2 | 12 | 16 | 4 | 15 | 7 | 3 | 14 | 11 | 8 | 6 | 1 | 9 | 10 |
| San Marcos | 8 | 12 | 9 | 13 | 16 | 5 | 15 | 7 | 6 | 14 | 2 | 11 | 10 | 1 | 3 | 4 |
| San Onofre | 8 | 14 | 5 | 13 | 16 | 3 | 15 | 4 | 6 | 7 | 12 | 10 | 9 | 1 | 2 | 11 |
| San Pedro | 6 | 13 | 2 | 10 | 16 | 4 | 15 | 8 | 5 | 14 | 12 | 9 | 7 | 1 | 3 | 11 |
| Santiago de Tolú | 6 | 13 | 5 | 12 | 16 | 3 | 15 | 10 | 2 | 14 | 11 | 8 | 7 | 1 | 4 | 9 |
| Sincelejo | 7 | 13 | 4 | 12 | 16 | 5 | 15 | 9 | 6 | 14 | 11 | 10 | 8 | 1 | 2 | 3 |
| Sucre | 6 | 12 | 8 | 13 | 16 | 4 | 15 | 9 | 3 | 14 | 5 | 10 | 7 | 1 | 2 | 11 |
A1: Avocado Prunings, A2: Cassava Leaves, A3: Cassava Stems, A4: Cassava Stump, A5: Coconut Prunings, A6: Maize Stover, A7: Mango Prunings, A8: Oil Palm Prunings, A9: Plantain Leaves, A10: Plantain Pseudostem, A11: Rice Straw, A12: Watermelon Stubble, A13: Yam Stubble, A14: Cattle Manure, A15: Pig Manure, A16: Poultry Manure.
3.5. Cluster Analysis of Municipal Bioenergy Potential for AcoD
Table 7 displays the theoretical energy potential and physicochemical characteristics of the prioritised co-digestion mixtures for the twenty-six municipalities. These values correspond to the binary combination of Cattle Manure (A14) with the highest-ranked agricultural residue for each location.
Regarding the GMP, Majagual recorded the highest value in the department, driven by its leading total biomass availability. San Luis de Sincé and San Marcos followed with substantial potentials. Conversely, smaller coastal or mountainous municipalities, such as Coveñas and Chalán, registered the lowest bioenergy capacities.
The composition of the mixtures varied geographically. In the Mojana and San Jorge sub-regions, where Rice Straw (A11) functioned as the agricultural co-substrate, the mixtures exhibited the highest weighted BMP. In the central Sabanas sub-region, prioritised with Cassava Stems (A3), the mixtures yielded moderate BMP values. The highest individual specific methane yield was observed in Chalán, which incorporated Maize Stover (A6).
The Mixing Ratio (Agriculture:Livestock) demonstrated significant heterogeneity across the territory. Municipalities such as Guaranda and Majagual presented the most balanced agricultural-to-livestock proportions. In contrast, locations like Sucre and Santiago de Tolú exhibited ratios heavily dominated by livestock manure, although the Weighted VS content remained relatively stable across the department.
4. Discussion
4.1. Interpretation of Co-Digestion Synergy and Ranking Drivers
The fundamental divergence between theoretical biochemical potential and operational feasibility identified in this study challenges the prevailing selection paradigms in tropical bioenergy. Whilst traditional frameworks often prioritise feedstocks based solely on superior methanogenic yields, the dominance of the annual production criterion in our MCDA underscores that supply chain reliability acts as the governing constraint for sustainable implementation. This “logistics-first” paradigm suggests that the primary risk to project viability in developing economies is not low conversion efficiency, but rather feedstock discontinuity. This aligns with observations in comparable contexts, where the reliance on high-yielding but seasonal residues has frequently led to operational failures due to prohibitive collection costs and periods of reactor idleness [19,20]. Consequently, the universal ranking of cattle manure as the basal substrate serves as a strategic risk mitigation mechanism. By anchoring the co-digestion process to a continuously generated stream, the system is buffered against the seasonality inherent to agricultural residues, ensuring the operational stability required for baseload energy generation.
However, the prioritisation of cattle manure as the universal baseload introduces a critical techno-economic trade-off between logistic reliability and volumetric efficiency. Although manure guarantees a steady supply, its comparatively low specific methane yield implies a lower energy density per unit of reactor volume compared to strictly agro-industrial substrates [13]. This necessitates larger hydraulic retention times and, consequently, higher capital expenditure (CAPEX) for reactor sizing to achieve equivalent energy outputs compared to high-rate reactors treating energy crops.
Nevertheless, the results indicate that this hydraulic penalty is outweighed by the operational security provided. In the absence of established storage infrastructure for seasonal crops—a common limitation in the region [6]—the continuous availability of manure is the only factor that prevents system shutdown during off-harvest periods. Thus, the decision-making framework validates that in tropical supply chains, the cost of larger infrastructure is a necessary premium to insure against the risk of supply interruption.
From a biochemical perspective, the prioritised mixtures demonstrate a functional synergy that validates the necessity of the co-digestion approach beyond simple mass aggregation. The integration of carbon-rich agricultural co-substrates with the nitrogen-rich manure effectively rebalances the C/N ratio towards the optimal biological range, addressing the limitations of mono-digestion [16]. Kinetically, the high buffering capacity of cattle manure [12] is crucial for counteracting the rapid hydrolysis rates of the soluble sugars present in cassava residues or the potential acidification from fruit waste [15]. This interaction minimises the risk of volatile fatty acid (VFA) accumulation—a common failure mode in the digestion of rapidly hydrolysable carbohydrates—and significantly reduces the operational expenditure (OPEX) associated with chemical pH control. Therefore, the framework identifies mixtures where the metabolic complementarity reduces the technical complexity of the process, making it more robust for regional operators.
Furthermore, the model highlights the critical role of market competition in defining the real availability of biomass, effectively addressing the “Feed vs. Fuel” dilemma. Although substrates such as poultry manure and oil palm prunings possess rapid degradation kinetics and high energy densities, their penalisation in the ranking reflects the high opportunity cost associated with their diversion from existing value chains [21]. Diverting such commodities, which are deeply integrated into local agricultural cycles as commercial organic fertilisers, could inadvertently inflate prices for local farmers or displace established nutrient recycling practices.
In contrast, the high feasibility scores assigned to cassava stems and crop stubbles validate a truly circular approach, as these residues are currently treated as disposal liabilities with negligible economic value. This distinction ensures that the proposed bioenergy systems valorise underutilised waste streams without cannibalising existing local economies, aligning with the principles of sustainable waste management [2].
4.2. Spatial Heterogeneity and Bioenergy Clusters
The spatial identification of the Rice-Livestock cluster in the Mojana and San Jorge sub-regions unveils a high-potential yet technically demanding bioenergy landscape. While the synergy between cattle manure and rice straw offers the highest theoretical energy recovery in the department, the operational viability is contingent upon overcoming the significant recalcitrance of the lignocellulosic matrix. Rice straw is characterised by high silica and lignin fractions, which not only act as physical barriers to microbial hydrolysis but can also cause abrasive wear on mechanical equipment and lead to inert sludge accumulation in reactors [14].
Consequently, the substantial methane potential projected for this cluster must be critically weighed against the parasitic energy demands of necessary pretreatment steps or the enhanced maintenance costs of industrial mixing systems. From an engineering perspective, this implies that the feasibility of biogas projects in this zone is inextricably linked to economies of scale, where the energy surplus is sufficient to offset these intensive processing requirements, prohibiting the simple low-tech deployment often assumed for rural areas.
In contrast, the Cassava-Livestock cluster in the central Sabanas sub-region presents a biochemical profile that favours a distinct, decentralised technological trajectory. The lower lignin content of cassava residues implies faster degradation kinetics; however, this accessibility introduces the risk of rapid acidification if the organic loading rate is not carefully controlled [15]. Here, the consistent baseload of cattle manure acts as a critical alkalinity buffer [12], stabilising the pH during the hydrolysis of cassava’s fermentable sugars.
Table 7.
Theoretical energy potential and physicochemical characteristics of the prioritized co-digestion mixtures per municipality.
Table 7.
Theoretical energy potential and physicochemical characteristics of the prioritized co-digestion mixtures per municipality.
| Municipality | Best Agricultural Residue | Best Livestock Residue | Total Availability (kt/year) | Mixing Ratio (Agriculture:Livestock) | Mixture BMP (L CH4/kg VS) | Mixture VS (%) | Global Methane Potential (Million m3/year) |
|---|---|---|---|---|---|---|---|
| Buenavista | A9: Plantain Leaves | A14: Cattle Manure | 123.3 | 1:3339.7 | 136.4 | 79.1 | 13.3 |
| Caimito | A6: Maize Stover | A14: Cattle Manure | 136.3 | 1:29.2 | 144.5 | 79.5 | 15.7 |
| Chalán | A6: Maize Stover | A14: Cattle Manure | 14.2 | 1:5.1 | 176.6 | 81.1 | 2.0 |
| Colosó | A10: Plantain Pseudostem | A14: Cattle Manure | 25.1 | 1:12.3 | 158.8 | 79.6 | 3.2 |
| Corozal | A3: Cassava Stems | A14: Cattle Manure | 197.3 | 1:14.5 | 138.1 | 80.1 | 21.8 |
| Coveñas | A3: Cassava Stems | A14: Cattle Manure | 15.3 | 1:16 | 137.9 | 80.0 | 1.7 |
| El Roble | A3: Cassava Stems | A14: Cattle Manure | 76.5 | 1:17.2 | 137.8 | 79.9 | 8.4 |
| Galeras | A3: Cassava Stems | A14: Cattle Manure | 216.1 | 1:29.4 | 137.2 | 79.6 | 23.6 |
| Guaranda | A11: Rice Straw | A14: Cattle Manure | 190.3 | 1:2.9 | 161.4 | 79.2 | 24.3 |
| La Unión | A3: Cassava Stems | A14: Cattle Manure | 101.6 | 1:48.3 | 136.9 | 79.4 | 11.1 |
| Los Palmitos | A3: Cassava Stems | A14: Cattle Manure | 150.5 | 1:25 | 137.4 | 79.7 | 16.5 |
| Majagual | A11: Rice Straw | A14: Cattle Manure | 430.5 | 1:3.7 | 157.1 | 79.2 | 53.6 |
| Morroa | A10: Plantain Pseudostem | A14: Cattle Manure | 58.7 | 1:19.7 | 150.8 | 79.4 | 7.0 |
| Ovejas | A6: Maize Stover | A14: Cattle Manure | 123.1 | 1:10.8 | 157.2 | 80.1 | 15.5 |
| Palmito | A3: Cassava Stems | A14: Cattle Manure | 104.2 | 1:11 | 138.6 | 80.4 | 11.6 |
| Sampués | A3: Cassava Stems | A14: Cattle Manure | 125.1 | 1:19.3 | 137.7 | 79.9 | 13.8 |
| San Benito Abad | A11: Rice Straw | A14: Cattle Manure | 289.6 | 1:14.7 | 142.6 | 79.2 | 32.7 |
| San José de Toluviejo | A3: Cassava Stems | A14: Cattle Manure | 141.4 | 1:58.8 | 136.8 | 79.4 | 15.4 |
| San Juan de Betulia | A3: Cassava Stems | A14: Cattle Manure | 158.5 | 1:32.4 | 137.2 | 79.6 | 17.3 |
| San Luis de Sincé | A3: Cassava Stems | A14: Cattle Manure | 391.9 | 1:35.1 | 137.1 | 79.5 | 42.7 |
| San Marcos | A11: Rice Straw | A14: Cattle Manure | 354.8 | 1:22.4 | 140.6 | 79.1 | 39.5 |
| San Onofre | A6: Maize Stover | A14: Cattle Manure | 308.7 | 1:84.4 | 139.3 | 79.3 | 34.1 |
| San Pedro | A3: Cassava Stems | A14: Cattle Manure | 174.8 | 1:18.4 | 137.7 | 79.9 | 19.2 |
| Santiago de Tolú | A9: Plantain Leaves | A14: Cattle Manure | 159.6 | 1:1783.9 | 136.5 | 79.1 | 17.2 |
| Sincelejo | A3: Cassava Stems | A14: Cattle Manure | 148.2 | 1:22.6 | 137.5 | 79.8 | 16.3 |
| Sucre | A9: Plantain Leaves | A14: Cattle Manure | 324.1 | 1:5128.9 | 136.4 | 79.1 | 35.0 |
This self-regulating buffering capacity suggests that this cluster is particularly well-suited for robust, low-maintenance applications that align with the socio-economic structure of smallholder farmers. Furthermore, the metabolic compatibility of this mixture supports a circular fit, where the thermal energy generated can be directly synchronised with local agro-industrial needs—specifically cassava starch drying—thereby closing the production loop at the farm level rather than exporting energy to the grid.
Furthermore, the analysis of the coastal municipalities reveals a distinct manure dominated cluster, characterised by extreme mixing ratios where the agricultural contribution is negligible. This finding has profound implications for the strategic objectives of anaerobic digestion in these territories. With mixtures composed almost exclusively of livestock waste, the system effectively operates as a mono-digestion process, which typically exhibits lower specific methane yields compared to balanced co-digestion due to carbon limitations [13].
Therefore, the primary driver for implementation in this cluster shifts from maximised energy revenue to environmental sanitation. The operational focus in these zones should prioritise Hydraulic Retention Time (HRT) for pathogen reduction and the mitigation of nutrient pollution flowing into downstream wetlands [9], viewing biogas as a value-added byproduct rather than the sole financial anchor necessary for project bankability.
This observed spatial heterogeneity refutes the applicability of a uniform bioenergy policy for the Department of Sucre. The transition from the high-solids, recalcitrant mixtures of the south to the liquid, manure-heavy streams of the coast dictates that technology transfer must be strictly site-specific. Ignoring these territorial biochemical signatures—for instance, attempting to replicate the simple operational protocols suitable for the Sabanas sub-region in the recalcitrant-heavy Mojana sub-region—would likely result in process failure due to either substrate stratification or low conversion efficiencies. Thus, the bioenergy cluster concept serves as a crucial planning tool, ensuring that infrastructure investment is matched to the specific rheological and metabolic realities of the local biomass supply rather than generic regional averages [22].
4.3. Implications for Regional Bioenergy Implementation Strategies
Translating the identified biochemical clusters into engineering solutions implies that reactor configuration must be strictly dictated by the rheological properties of the substrate mixtures rather than a standardising technology policy. The Mojana cluster, characterised by high volumes of silica-rich rice straw, suggests a rheological requirement for Continuous Stirred Tank Reactors (CSTR) capable of providing vigorous mechanical agitation to prevent stratification and crust formation.
However, whilst the scale of the projected methane yields supports the economic case for such centralised facilities, this introduces a critical risk of technological lock-in. The deployment of high-complexity imported infrastructure in rural tropical regions has historically risked becoming ‘white elephants’—facilities that fail not due to biochemical potential, but due to a lack of local technical capacity for maintenance and spare parts supply chains [20]. Thus, the feasibility in this zone is constrained by the availability of skilled labour rather than biomass availability alone.
In contrast, the biochemical profile of the Sabanas cluster points towards a distributed generation paradigm. The rapid biodegradability of cassava residues, combined with the dispersed nature of smallholder farming, aligns coherently with the operational simplicity of low-cost tubular (plug-flow) digesters. Unlike the industrial requirements of the Mojana, the technical simplicity of these reactors matches the socio-economic context of rural producers, where the primary objective is energy autonomy rather than commercial sale. The suitability of the technology is defined by its ability to provide direct thermal energy for on-site agro-industrial processes—such as cassava starch drying—thereby closing the loop at the farm level with minimal maintenance requirements, effectively decoupling the project from the volatility of centralised electricity markets.
However, the feasibility of the Montes de María cluster, which relies on maize stover, faces a critical temporal constraint absent in the continuous manure-based systems. The pulsed generation of maize residues implies that the theoretical co-digestion synergy is contingent upon the implementation of silage infrastructure to bridge the gap between harvest windows and year-round reactor feeding [19]. This requirement mirrors the maize-based biogas models prevalent in Europe, yet in the absence of the feed-in tariffs that sustain those systems, the additional capital expenditure for storage bunkers and the operational costs for inoculants may erode the comparative advantage of this cluster in a developing economy. Consequently, the realisation of bioenergy projects in this zone is likely less dependent on reactor efficiency and more on the establishment of a logistical storage network capable of mitigating the risk of feedstock intermittency.
These findings suggest that successful technology transfer strategies must transcend the pursuit of thermodynamic maximisation to prioritise socio-technical fit. The imposition of uniform technology incentives would likely result in systemic failure given the distinct rheological signatures of the identified clusters. A resilient implementation strategy must therefore accept a trade-off regarding accepting lower specific yields in the Sabanas through low-tech solutions to ensure longevity, whilst reserving high-efficiency industrial systems for the Mojana only where the ‘economies of scale’ are sufficient to buffer the higher operational risks [24]. This site-specific matching of technology to both biomass rheology and local technical capacity is the prerequisite for avoiding the widespread abandonment of biogas facilities observed in similar tropical contexts.
4.4. Limitations and Future Research
Although the proposed Entropy-TOPSIS framework provides a robust initial screening for substrate selection, several limitations inherent to the methodology must be acknowledged to contextualise the findings properly. Firstly, the reliance on annualised residue generation data assumes a continuous biomass flow, effectively smoothing out the temporal variability characteristic of agricultural systems. In reality, residues such as maize stover and rice straw are generated in discrete seasonal pulses. By treating these resources as static annual aggregates, the model risks creating a ‘phantom’ availability during off-harvest periods.
For the Montes de María and Mojana clusters, this implies that the reported global methane potential represents a theoretical upper bound that may be physically impossible to mobilise without the implementation of massive storage capacities—potentially exceeding six months of inventory. Consequently, the operational feasibility is likely lower than the annualised figures suggest, as the system would require significant capital investment in silage infrastructure to bridge the temporal mismatch between generation peaks and continuous reactor feeding.
Secondly, the spatial analysis was conducted at the municipal resolution, treating each administrative unit as a homogeneous supply area. This approach prioritises total mass availability but fails to explicitly quantify the specific transport costs associated with collection logistics in a tropical context. In regions with underdeveloped road infrastructure, Euclidean distance is a poor proxy for economic accessibility due to high road tortuosity and seasonal impassability. Although the Annual Residue Production criterion serves as a proxy for spatial density, it does not distinguish between biomass concentrated in an industrial hub and biomass dispersed across fragmented smallholdings. Therefore, the framework likely overestimates the economically accessible biomass, as the collection radius required to feed a centralised plant in the Rice-Livestock cluster may be logistically prohibitive due to the distribution costs, despite the high theoretical density.
Furthermore, the physicochemical characterisation utilised in this study assumes constant composition values for each substrate type. However, biomass properties are subject to significant biological variability driven by crop varieties, soil quality, and climatic conditions. The use of mean experimental values for parameters like the C/N ratio or Lignin content provides a representative baseline but does not capture the stochastic fluctuations that characterise real-world supply chains.
This stochasticity poses a risk to reactor stability, particularly in the Cassava-Livestock cluster, where deviations in the buffering capacity of manure or the acidity of cassava residues could lead to process inhibition. Future iterations of this decision-making framework should, therefore, incorporate sensitivity analyses to evaluate how these natural deviations in feedstock quality might impact the robustness of the ranking and the projected methane yields.
To bridge the gap between this strategic prioritisation and bankable project implementation, future research lines must transcend static assessments. Specifically, the field requires the development of dynamic spatio-temporal optimisation models rather than simple Techno-Economic Analyses (TEA). Such models should couple the multi-criteria approach with dynamic GIS to simulate the temporal flow of biomass against the logistic constraints of the territory. This would allow for the identification of optimal plant siting based on minimised collection costs and temporal reliability, rather than just mass availability. Only by integrating the seasonality of supply with the tortuosity of transport can future studies validate whether the thermodynamically optimal mixtures identified here remain economically viable when subjected to the harsh logistical realities of the tropical bioeconomy.
5. Conclusions
This study overturns the traditional substrate selection paradigm for the tropical regions, establishing that in developing agro-industrial contexts, logistic reliability invariably overrides biochemical efficiency. By applying the Integrated Entropy-TOPSIS framework, we demonstrate that the primary barrier to bioenergy viability in the Department of Sucre is not the biochemical conversion yield, but the risk of feedstock discontinuity. Consequently, the results mandate a shift in the decision-making process regarding the maximisation of methane potential, which must be subordinated to the security of the supply chain to prevent the operational failures historically associated with seasonal feedstocks.
The universal identification of cattle manure as the basal substrate serves as a quantification of the necessary trade-off between energy density and operational stability. While manure exhibits lower specific methane yields compared to energy crops—implying a requirement for larger reactor volumes and higher initial capital expenditure (CAPEX)—this volumetric penalty acts as a vital insurance premium. It guarantees a baseload continuity that buffers the system against the ‘phantom’ availability of seasonal residues, transforming theoretically optimal but intermittent mixtures into bankable, operationally stable energy assets.
Furthermore, the spatial delineation of distinct bioenergy clusters confirms that ‘one-size-fits-all’ technology transfer policies are destined to fail. The high-potential Rice-Livestock cluster in the Mojana region is technically contingent upon industrial-scale pretreatment and agitation systems; however, its feasibility is strictly limited by the availability of skilled labour to maintain such complex infrastructure, posing a risk of technological lock-in or ‘white elephant’ projects if local capacity is ignored. Conversely, the Cassava-Livestock cluster in the Sabanas supports a robust, decentralised model where low-tech reactors align with the socio-economic reality of smallholders, prioritising resilience over industrial efficiency.
Ultimately, this research provides a data-driven roadmap for de-risking bioenergy investments in tropical regions. It concludes that the realisation of the theoretical potential in crop-based clusters is physically impossible without a parallel investment in silage and storage infrastructure to bridge harvest gaps. Therefore, policymakers must transition from generic bioenergy incentives to targeted supply chain interventions that subsidise not just the reactors, but the logistical network required to mobilise the biomass. Only by addressing these logistical and temporal constraints can the untapped bioenergy potential of the Latin American Caribbean be effectively harnessed to meet the Sustainable Development Goals.
Author Contributions
Conceptualisation, J.E.H.R., J.J.C.E. and D.D.O.M.; methodology, J.E.H.R., D.D.O.M., and J.J.C.E.; software, D.D.O.M. and C.A.N.P.; validation, J.E.H.R. and E.D.A.D.; formal analysis, J.J.C.E.; investigation, J.E.H.R., M.J.L.P., K.J.S.A., L.C.T.R., C.A.M.S. and C.A.N.P.; resources, J.G.S.M.; data curation, E.D.A.D., C.A.M.S., M.J.L.P., K.J.S.A., and L.C.T.R.; writing—original draft preparation, J.E.H.R. and D.D.O.M.; writing—review and editing, J.J.C.E., E.D.A.D., K.J.S.A., L.C.T.R., M.J.L.P., C.A.M.S., C.A.N.P. and J.G.S.M.; visualisation, J.E.H.R., D.D.O.M. and C.A.N.P.; supervision, J.J.C.E. and J.G.S.M.; project administration, J.G.S.M.; funding acquisition, J.E.H.R., J.G.S.M. and D.D.O.M. All authors have read and agreed to the published version of the manuscript.
Funding
This research was funded by the Colombian General System of Royalties (Sistema General de Regalías de Colombia), grant number BPIN 2020000100189; The APC was funded by Sistema General de Regalías de Colombia.
Institutional Review Board Statement
Not applicable.
Informed Consent Statement
Not applicable.
Data Availability Statement
The original contributions presented in this study are included in the article/supplementary material. Further inquiries can be directed to the corresponding author(s).
Acknowledgments
This work represents a partial result of the doctoral studies conducted by J.E. Henández Ruydíaz and in Energy Engineering at the University of the Coast (Universidad de la Costa), Colombia.
Conflicts of Interest
Authors declare no conflicts of interest. The funders had no role in the design of the study; in the collection, analyses, or interpretation of data; in the writing of the manuscript; or in the decision to publish the results.
References
- Bogdanov, D.; Ram, M.; Aghahosseini, A.; Gulagi, A.; Oyewo, A.S.; Child, M.; Caldera, U.; Sadovskaia, K.; Farfan, J.; De Souza Noel Simas Barbosa, L.; et al. Low-Cost Renewable Electricity as the Key Driver of the Global Energy Transition towards Sustainability. Energy 2021, 227, 120467. [Google Scholar] [CrossRef]
- Bhatia, T.; Sindhu, S.S. Sustainable Management of Organic Agricultural Wastes: Contributions in Nutrients Availability, Pollution Mitigation and Crop Production. Discover Agriculture 2024, 2, 130. [Google Scholar] [CrossRef]
- Farghali, M.; Osman, A.I.; Umetsu, K.; Rooney, D.W. Integration of Biogas Systems into a Carbon Zero and Hydrogen Economy: A Review. Environ Chem Lett 2022, 20, 2853–2927. [Google Scholar] [CrossRef]
- World Biogas Association Global Potential of Biogas; London, UK, 2019.
- Sampaolesi, S.; Briand, L.E.; Saparrat, M.C.N.; Toledo, M.V. Potentials of Biomass Waste Valorization: Case of South America. Sustainability 2023, 15, 8343. [Google Scholar] [CrossRef]
- Escalante Hernández, H.; Orduz Prada, J.; Zapata Lesmes, H.J.; Cardona Ruiz, M.C.; Duarte Ortega, M. Atlas Del Potencial Energético de La Biomasa Residual En Colombia; Unidad de Planeación Minero Energética (UPME): Bogotá, Colombia, 2010; ISBN 978-958-8504-59-9. [Google Scholar]
- Alean, J.; Bastidas, M.; Boom-Cárcamo, E.; Maya, J.C.; Chejne, F.; Ramírez, S.; Nieto, D.; Ceballos, C.; Saurith, A.; Córdoba-Ramirez, M. Design of a Technical Decision-Making Strategy to Collect Biomass Waste from the Palm Oil Industry as a Renewable Energy Source: Case Study in Colombia. Environments 2025, 12, 165. [Google Scholar] [CrossRef]
- Agronet Evaluaciones Agropecuarias - EVA y Anuario Estadístico Del Sector Agropecuario. Available online: https://www.agronet.gov.co/estadistica/paginas/home.aspx?cod=59 (accessed on 25 August 2025).
- Ijaz, M.U.; Akbar, A.; Eman, R.; Hayat, M.F.; Naz, H.; Ashraf, A. Mitigating Nutrient Pollution from Livestock Manure: Strategies for Sustainable Management. In Agricultural Nutrient Pollution and Climate Change; Springer Nature Switzerland: Cham, 2025; pp. 165–187. [Google Scholar]
- Kapoor, R.; Ghosh, P.; Kumar, M.; Sengupta, S.; Gupta, A.; Kumar, S.S.; Vijay, V.; Kumar, V.; Kumar Vijay, V.; Pant, D. Valorization of Agricultural Waste for Biogas Based Circular Economy in India: A Research Outlook. Bioresour Technol 2020, 304, 123036. [Google Scholar] [CrossRef]
- Antoniou, N.; Monlau, F.; Sambusiti, C.; Ficara, E.; Barakat, A.; Zabaniotou, A. Contribution to Circular Economy Options of Mixed Agricultural Wastes Management: Coupling Anaerobic Digestion with Gasification for Enhanced Energy and Material Recovery. J Clean Prod 2019, 209, 505–514. [Google Scholar] [CrossRef]
- Teixeira Franco, R.; Buffière, P.; Bayard, R. Cattle Manure for Biogas Production. Does Ensiling and Wheat Straw Addition Enhance Preservation of Biomass and Methane Potential? Biofuels 2020, 11, 671–682. [Google Scholar] [CrossRef]
- Jasińska, A.; Grosser, A.; Meers, E. Possibilities and Limitations of Anaerobic Co-Digestion of Animal Manure—A Critical Review. Energies (Basel) 2023, 16, 3885. [Google Scholar] [CrossRef]
- P, M.; Doriya, K.; Saroj, P.; Gunasekaran, S.; Hemalatha, M.; Habibullah, S.; Mallick, S.P. Advancements and Challenges in Biogas Technology: A Comprehensive Review on Sustainable Approach to Waste Management and Renewable Energy. Bioenergy Res 2025, 19, 7. [Google Scholar] [CrossRef]
- Ismail, N.; Fauzi, N.F.; Salehabadi, A.; Latif, S.; Awiszus, S.; Müller, J. A Study on Biogas Production from Cassava Peel and Stem in Anaerobic Digestion Reactor. International Journal of Environmental Science and Technology 2022, 19, 1695–1704. [Google Scholar] [CrossRef]
- Karki, R.; Chuenchart, W.; Surendra, K.C.; Shrestha, S.; Raskin, L.; Sung, S.; Hashimoto, A.; Kumar Khanal, S. Anaerobic Co-Digestion: Current Status and Perspectives. Bioresour Technol 2021, 330, 125001. [Google Scholar] [CrossRef]
- Rocamora, I.; Wagland, S.T.; Rivas Casado, M.; Hassard, F.; Villa, R.; Peces, M.; Simpson, E.W.; Fernández, O.; Bajón-Fernández, Y. Managing Full-Scale Dry Anaerobic Digestion: Semi-Continuous and Batch Operation. J Environ Chem Eng 2022, 10, 108154. [Google Scholar] [CrossRef]
- Cao, X.; Jia, M.; Tian, Y. Rheological Properties and Dewaterability of Anaerobic Co-Digestion with Sewage Sludge and Food Waste: Effect of Thermal Hydrolysis Pretreatment and Mixing Ratios. Water Science & Technology 2023, 87, 2441–2456. [Google Scholar] [CrossRef] [PubMed]
- Wardle, J.M.; Fischer, A.; Tesfaye, Y.; Smith, J. Seasonal Variability of Resources: The Unexplored Adversary of Biogas Use in Rural Ethiopia. Current Research in Environmental Sustainability 2021, 3, 100072. [Google Scholar] [CrossRef] [PubMed]
- Tucho, G.; Moll, H.; Schoot Uiterkamp, A.; Nonhebel, S. Problems with Biogas Implementation in Developing Countries from the Perspective of Labor Requirements. Energies (Basel) 2016, 9, 750. [Google Scholar] [CrossRef]
- Nigussie, A.; Kuyper, T.W.; Neergaard, A. de Agricultural Waste Utilisation Strategies and Demand for Urban Waste Compost: Evidence from Smallholder Farmers in Ethiopia. Waste Management 2015, 44, 82–93. [Google Scholar] [CrossRef]
- Feiz, R.; Ammenberg, J. Assessment of Feedstocks for Biogas Production, Part I—A Multi-Criteria Approach. Resour Conserv Recycl 2017, 122, 373–387. [Google Scholar] [CrossRef]
- Parajuli, R.; Knudsen, M.T.; Dalgaard, T. Multi-criteria Assessment of Yellow, Green, and Woody Biomasses: Pre-screening of Potential Biomasses as Feedstocks for Biorefineries. Biofuels, Bioproducts and Biorefining 2015, 9, 545–566. [Google Scholar] [CrossRef]
- Soha, T.; Papp, L.; Csontos, C.; Munkácsy, B. The Importance of High Crop Residue Demand on Biogas Plant Site Selection, Scaling and Feedstock Allocation – A Regional Scale Concept in a Hungarian Study Area. Renewable and Sustainable Energy Reviews 2021, 141. [Google Scholar] [CrossRef]
- Shi, Z.; Marinello, F.; Ai, P.; Pezzuolo, A. Assessment of Bioenergy Plant Locations Using a GIS-MCDA Approach Based on Spatio-Temporal Stability Maps of Agricultural and Livestock Byproducts: A Case Study. Science of the Total Environment 2024, 947. [Google Scholar] [CrossRef] [PubMed]
- Akther, A.; Ahamed, T.; Noguchi, R.; Genkawa, T.; Takigawa, T. Site Suitability Analysis of Biogas Digester Plant for Municipal Waste Using GIS and Multi-Criteria Analysis. Asia-Pacific Journal of Regional Science 2019, 3, 61–93. [Google Scholar] [CrossRef]
- Venier, F.; Yabar, H. Renewable Energy Recovery Potential towards Sustainable Cattle Manure Management in Buenos Aires Province: Site Selection Based on GIS Spatial Analysis and Statistics. J Clean Prod 2017, 162, 1317–1333. [Google Scholar] [CrossRef]
- Escalante, H.; Castro, L.; Gauthier-Maradei, P.; Rodríguez De La Vega, R. Spatial Decision Support System to Evaluate Crop Residue Energy Potential by Anaerobic Digestion. Bioresour Technol 2016, 219, 80–90. [Google Scholar] [CrossRef]
- Siegrist, A.; Bowman, G.; Burg, V. Energy Generation Potentials from Agricultural Residues: The Influence of Techno-Spatial Restrictions on Biomethane, Electricity, and Heat Production. Appl Energy 2022, 327. [Google Scholar] [CrossRef]
- Ruiz, L.M.; Fernández, M.; Genaro, A.; Martín-Pascual, J.; Zamorano, M. Multi-Parametric Analysis Based on Physico-Chemical Characterization and Biochemical Methane Potential Estimation for the Selection of Industrial Wastes as Co-Substrates in Anaerobic Digestion. Energies (Basel) 2023, 16. [Google Scholar] [CrossRef]
- González, R.; Peña, D.C.; Gómez, X. Anaerobic Co-Digestion of Wastes: Reviewing Current Status and Approaches for Enhancing Biogas Production. Applied Sciences 2022, 12, 8884. [Google Scholar] [CrossRef]
- Binod, P.; Sindhu, R.; Singhania, R.R.; Vikram, S.; Devi, L.; Nagalakshmi, S.; Kurien, N.; Sukumaran, R.K.; Pandey, A. Bioethanol Production from Rice Straw: An Overview. Bioresour Technol 2010, 101, 4767–4774. [Google Scholar] [CrossRef] [PubMed]
- Idris, S.; Rosnah, S.; Nor, M.Z.M.; Mokhtar, M.N.; Abdul Gani, S.S. Physicochemical Composition of Different Parts of Cassava (Manihot Esculenta Crantz) Plant. Food Res 2020, 4, 78–84. [Google Scholar] [CrossRef]
- Sivamani, S.; Chandrasekaran, A.P.; Balajii, M.; Shanmugaprakash, M.; Hosseini-Bandegharaei, A.; Baskar, R. Evaluation of the Potential of Cassava-Based Residues for Biofuels Production. Rev Environ Sci Biotechnol 2018, 17, 553–570. [Google Scholar] [CrossRef]
- Tippayawong, N.; Rerkkriangkrai, P.; Aggarangsi, P.; Pattiya, A. Biochar Production from Cassava Rhizome in a Semi-Continuous Carbonization System. Energy Procedia 2017, 141, 109–113. [Google Scholar] [CrossRef]
- Murgueitio-Manzanares, E.; Campo-Fernández, M.; Nirchio-Tursellino, M.; Cuesta-Rubio, O.; Tocto-León, J. Composición Química Y Actividad Biológica Del Pseudotallo De Musa X Paradisiaca L (Banano). Ciencia Unemi 2019, 12, 19–29. [Google Scholar] [CrossRef]
- Patiño, F.G.B.; Araque, J.A.; Kafarov, D.V. Assessment of the Energy Potential of Agricultural Residues in Non-Interconnected Zones of Colombia: Case Study of Chocó and Putumayo Katherine Rodríguez Cáceres. Chem Eng Trans 2016, 50, 349–354. [Google Scholar] [CrossRef]
- Mboumboue, E.; Njomo, D. Biomass Resources Assessment and Bioenergy Generation for a Clean and Sustainable Development in Cameroon. Biomass Bioenergy 2018, 118, 16–23. [Google Scholar] [CrossRef]
- Samsuri; Amanda, S.; Zaitunah, A.; Utomo, B.; Widyastuti, D.E. Aboveground Biomass of Forest and Oil Palm Land Cover Mapping Using Sentinel 2A Imagery, Asahan-Indonesia. IOP Conf Ser Earth Environ Sci 2023, 1239. [Google Scholar] [CrossRef]
- Williams, C.M. Gestión de Residuos de Aves de Corral En Los Países En Desarrollo. Función de las aves de corral en la nutrición humana 2013, 48. [Google Scholar]
- Vera-Romero, I.; Martínez-Reyes, J.; Estrada-Jaramillo, M.; Ortiz-Soriano, A. Potencial de Generación de Biogás y Energía Eléctrica Parte I: Excretas de Ganado Bovino y Porcino. Ingeniería, Investigación y Tecnología 2014, 15, 429–436. [Google Scholar] [CrossRef]
- Venegas Sepúlveda, A.; Carrasco Jiménez, J.; Aguirre Aguilera, C. Manejo de Rastrojos Del Cultivo de Maíz. In Rastrojos del cultivo del Maíz: elementos a considerar para su manejo;Boletín INIA; Carrasco Jiménez, J., Aguirre Aguilera, C., Eds.; Instituto de Investigaciones Agropecuarias (INIA): Rengo, Chile, 2018; pp. 5–28. [Google Scholar]
- Kraiphanont, A.; Nunes, B.; Bennett, D. The Main Criteria of Biomass Selection for Energy Generation in Brazil. In Proceedings of the 25th International association for management of technology conference proceedings; Pretorius, Y., Hosni, Y., Thopil, G., Eds.; IAMOT & the Graduate School of Technology Management, University of Pretoria: Orlando, Florida, 2016; pp. 759–774. [Google Scholar]
- Fernandes, T.C.; Mangerino, I.; Klarosk, J.; Zemiani, A.; Aparecido, M.; Fernandes, F.; Kiyomi, E. Valorization of Fruit and Vegetable Waste by Anaerobic Digestion: Definition of Co-Substrates and Inoculum Statement of Novelty. Waste Biomass Valorization 2022, 1, 3. [Google Scholar] [CrossRef]
- Zhong, Y.; Chen, R.; Rojas-Sossa, J.P.; Isaguirre, C.; Mashburn, A.; Marsh, T.; Liu, Y.; Liao, W. Anaerobic Co-Digestion of Energy Crop and Agricultural Wastes to Prepare Uniform-Format Cellulosic Feedstock for Biorefining. Renew Energy 2020, 147, 1358–1370. [Google Scholar] [CrossRef]
- Ahlberg-Eliasson, K.; Westerholm, M.; Isaksson, S.; Schnürer, A. Anaerobic Digestion of Animal Manure and Influence of Organic Loading Rate and Temperature on Process Performance, Microbiology, and Methane Emission From Digestates. Front Energy Res 2021, 9, 1–16. [Google Scholar] [CrossRef]
- Meng, L.; Jin, K.; Yi, R.; Chen, M.; Peng, J.; Pan, Y. Enhancement of Bioenergy Recovery from Agricultural Wastes through Recycling of Cellulosic Alcoholic Fermentation Vinasse for Anaerobic Co-Digestion. Bioresour Technol 2020, 311, 123511. [Google Scholar] [CrossRef] [PubMed]
- Giraldo Ramírez, D.P.; Arango Aramburo, S.; Martínez Jaramillo, J.E. Effects of Biofuels on Food Security in Colombia: A Systemic Approach. Rev Fac Nac Agron Medellin 2014, 67, 7375–7385. [Google Scholar] [CrossRef]
- Howari, H.; Parvez, M.; Khan, O.; Alhodaib, A.; Mallah, A.; Yahya, Z. Multi-Objective Optimization for Ranking Waste Biomass Materials Based on Performance and Emission Parameters in a Pyrolysis Process—An AHP–TOPSIS Approach. Sustainability 2023, 15, 3690. [Google Scholar] [CrossRef]
- Thomsen, S.T.; Spliid, H.; Østergård, H. Statistical Prediction of Biomethane Potentials Based on the Composition of Lignocellulosic Biomass. Bioresour Technol 2014, 154, 80–86. [Google Scholar] [CrossRef] [PubMed]
Figure 1.
Spatial distribution of agricultural production density (t/km2) and livestock inventory density (animals/km2) in the Department of Sucre: (a) Agricultural production; (b) Livestock inventory. Source: own elaboration with data from: [8].
Figure 1.
Spatial distribution of agricultural production density (t/km2) and livestock inventory density (animals/km2) in the Department of Sucre: (a) Agricultural production; (b) Livestock inventory. Source: own elaboration with data from: [8].
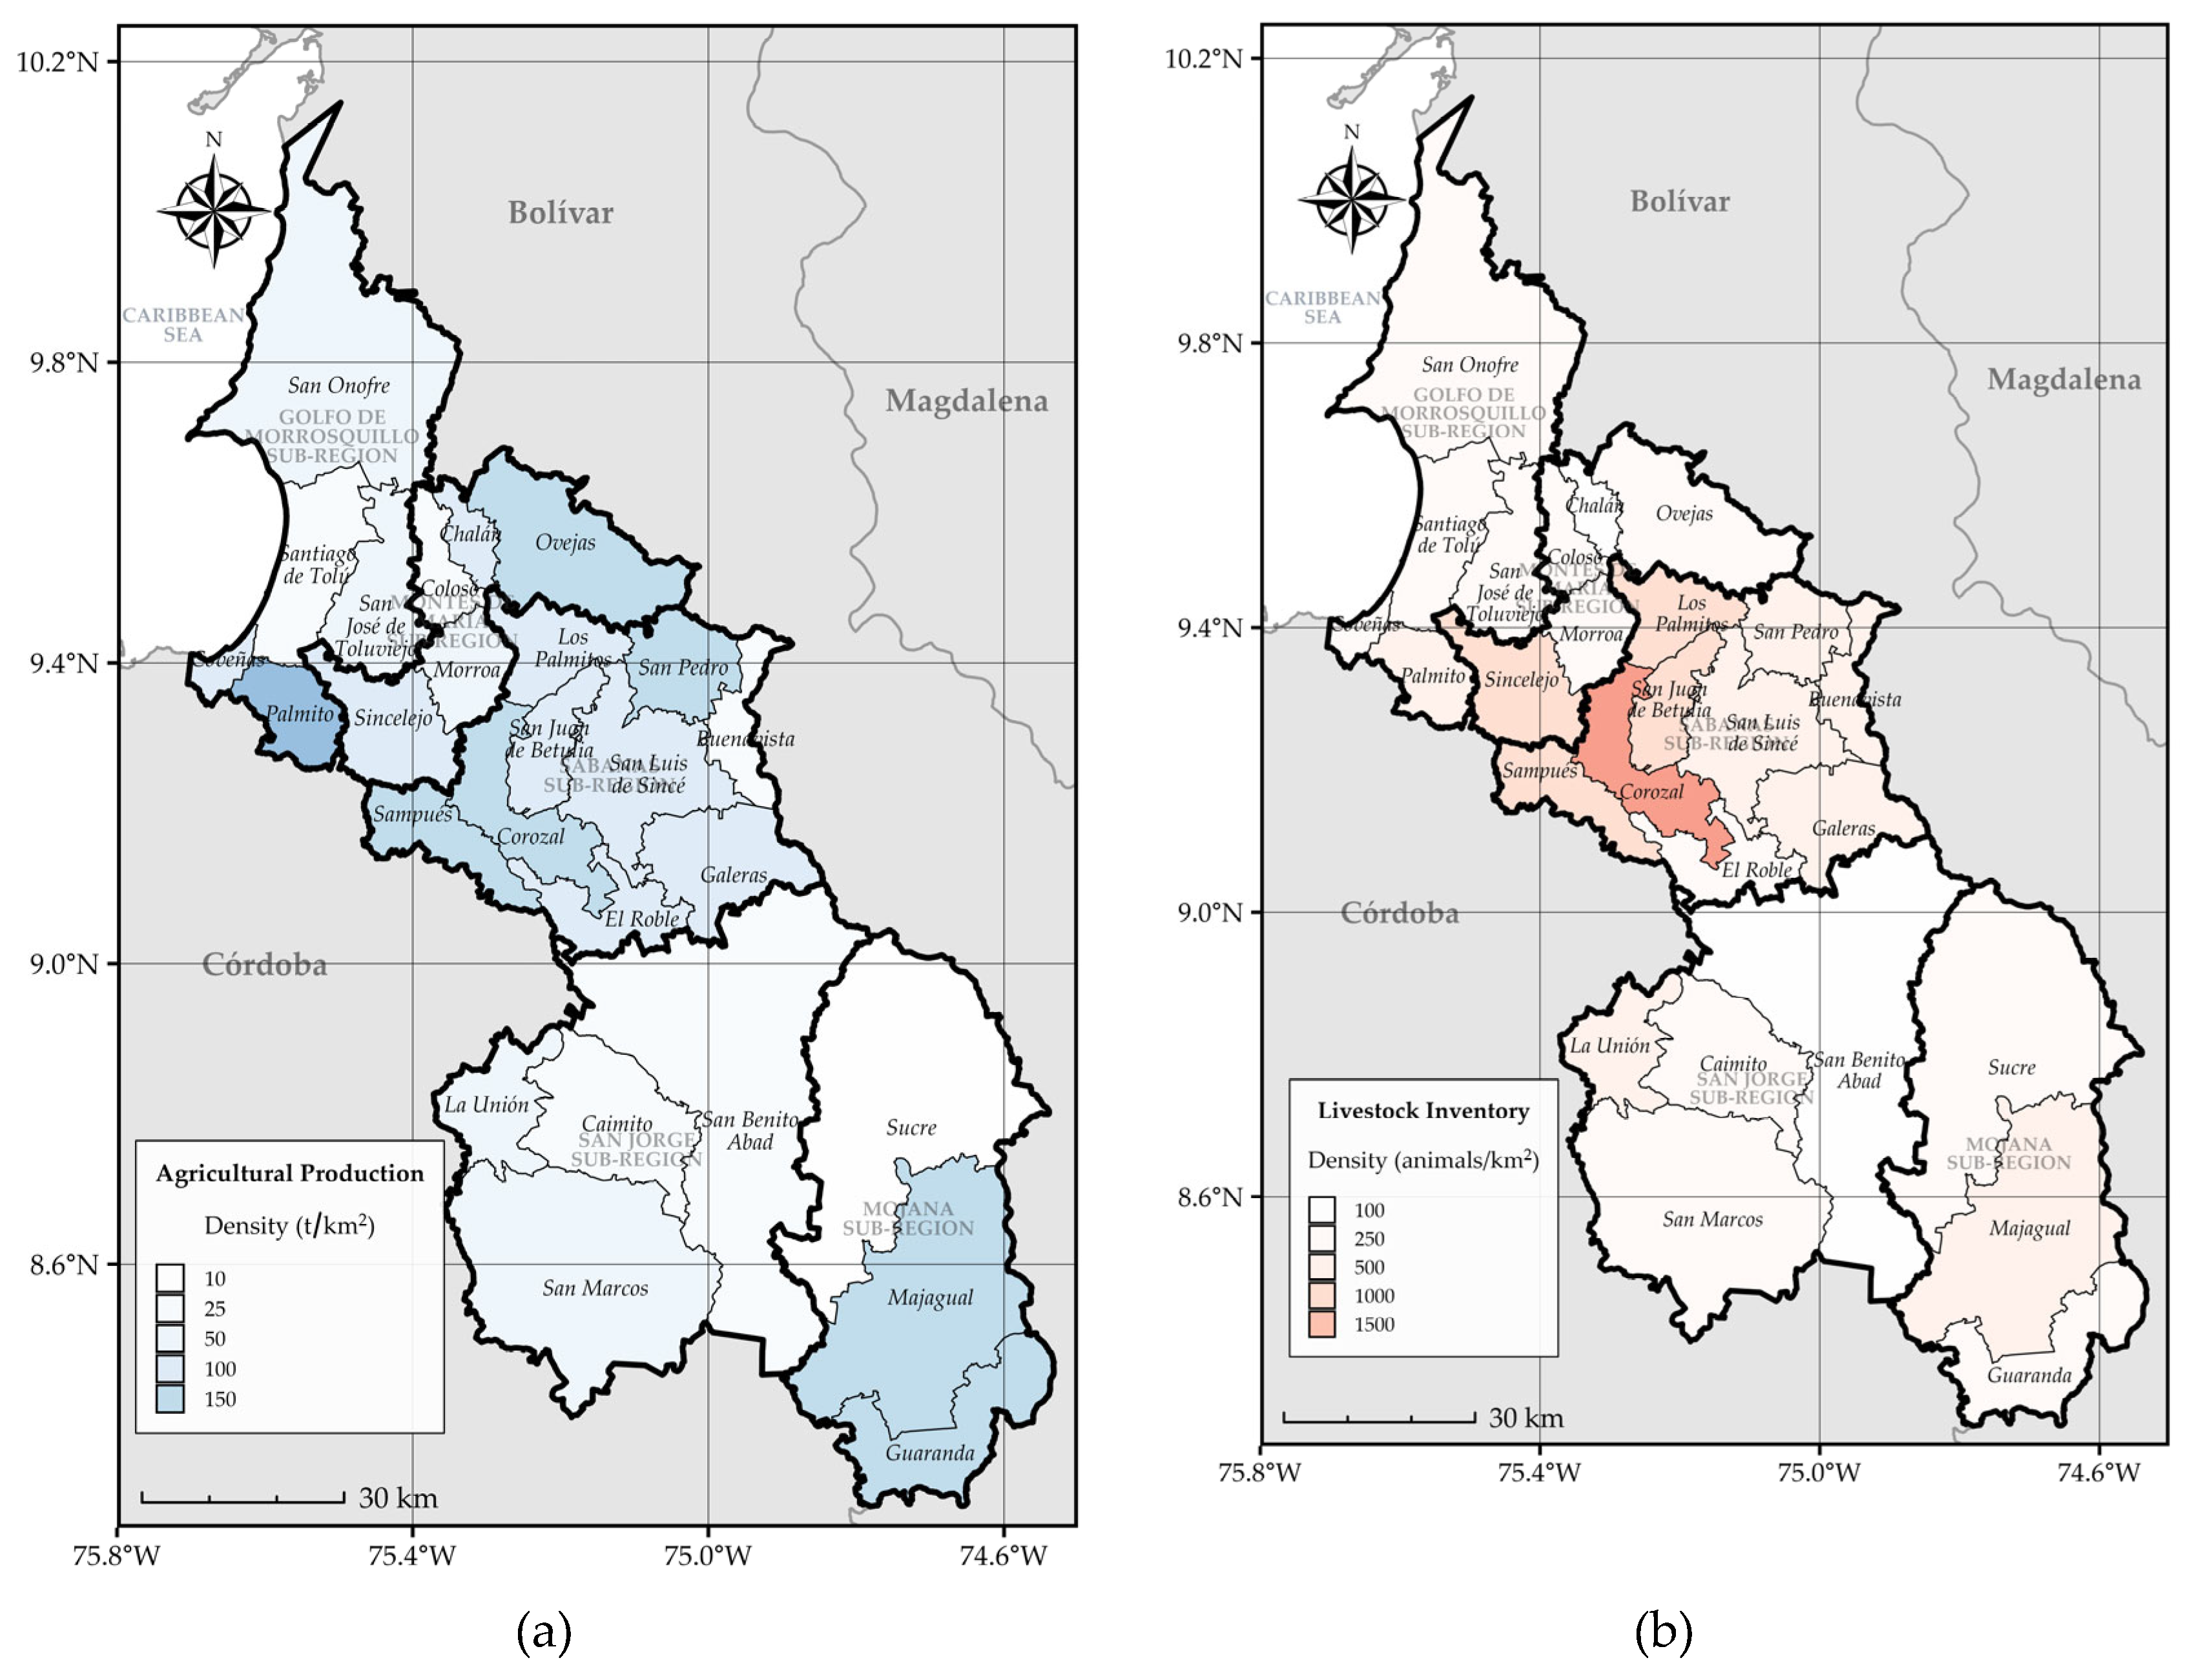
Figure 2.
Total annual residue generation (kt/y) by municipality in the Department of Sucre, categorised by sector (Agricultural vs. Livestock).
Figure 2.
Total annual residue generation (kt/y) by municipality in the Department of Sucre, categorised by sector (Agricultural vs. Livestock).
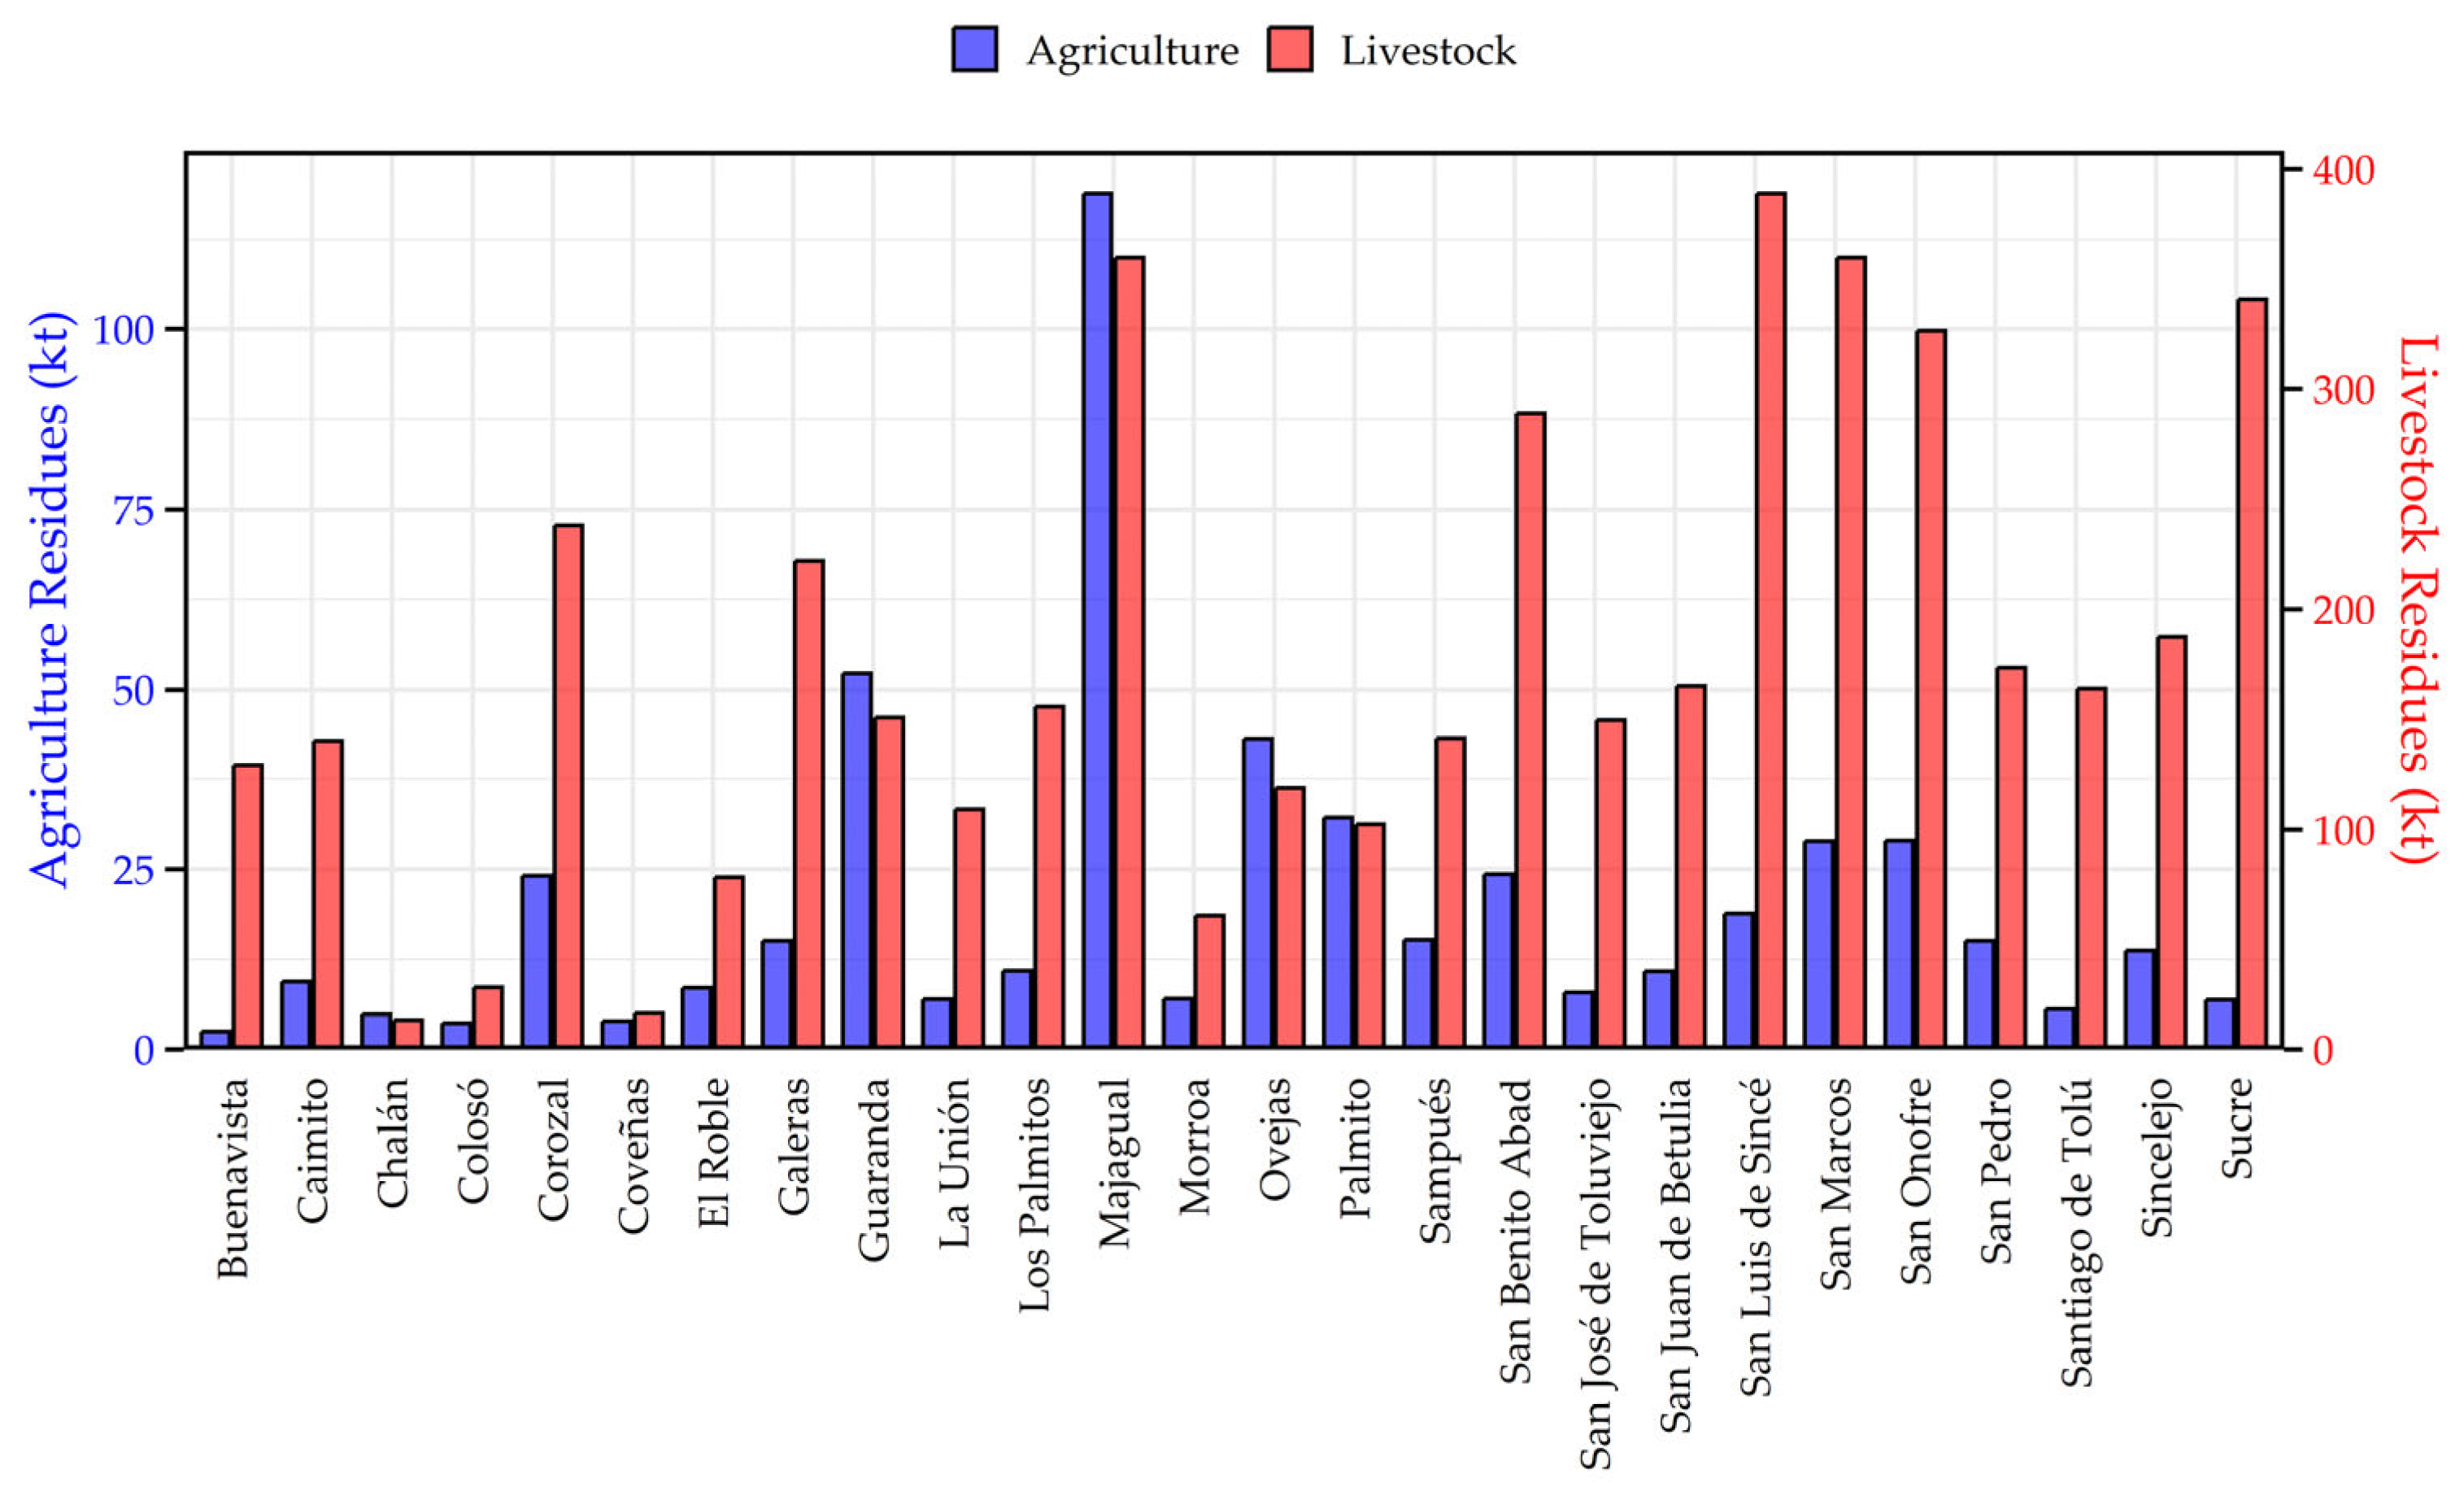
Figure 3.
Distribution of Shannon entropy weights for the multi-criteria assessment of residue suitability.
Figure 3.
Distribution of Shannon entropy weights for the multi-criteria assessment of residue suitability.
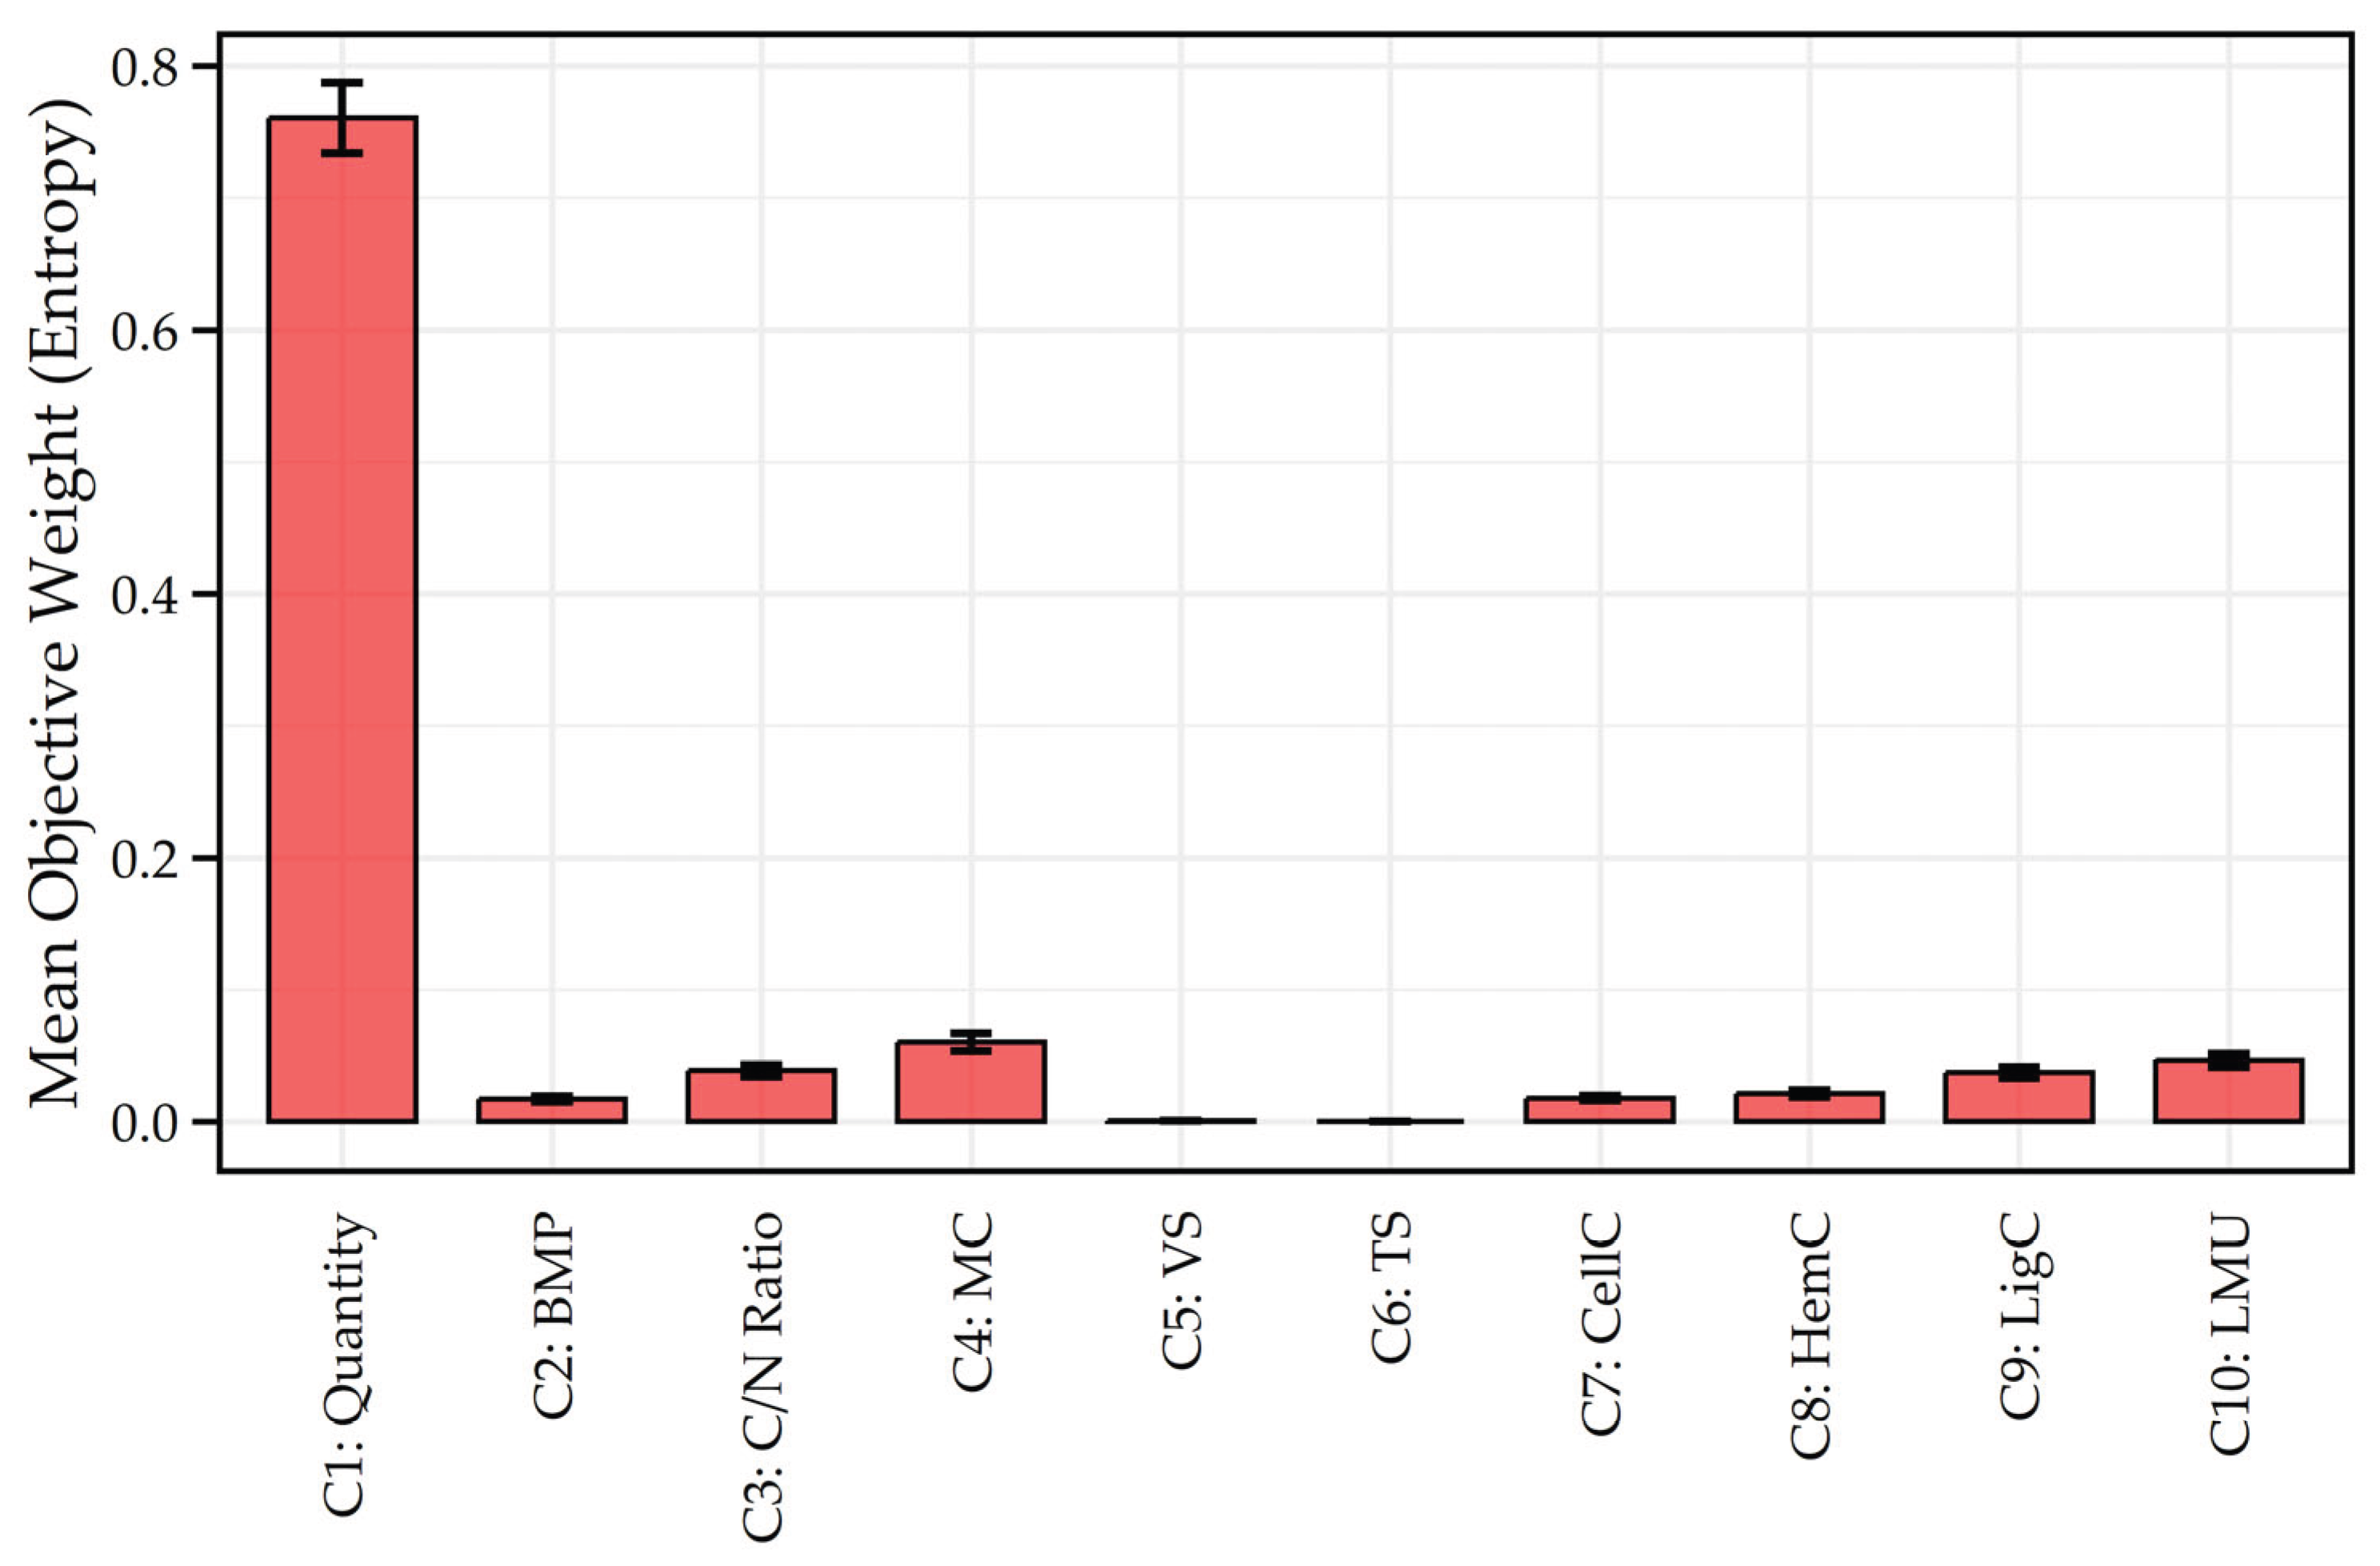
Table 1.
Residue generation factors. Source: own elaboration with data from: [6,32,33,34,35,36,37,38,39,40,41,42].
| Sector | Source | Specific Residues (Alternatives) |
Residue Generation Factor (RGF) |
|---|---|---|---|
| Agriculture | Avocado Crop | A1: Avocado Prunings | 0.06 t/fruit |
| Agriculture | Cassava Crop | A2: Cassava Leaves | 0.09 t/tubers |
| Agriculture | Cassava Crop | A3: Cassava Stems | 0.41 t/tubers |
| Agriculture | Cassava Crop | A4: Cassava Stump | 0.13 t/tubers |
| Agriculture | Coconut Crop | A5: Coconut Prunings | 0.59 t/fruit |
| Agriculture | Maize Crop | A6: Maize Stover | 1.07 t/grain |
| Agriculture | Mango Crop | A7: Mango Prunings | 0.37 t/fruit |
| Agriculture | Oil Palm Crop | A8: Oil Palm Prunings | 1.83 t/fruit |
| Agriculture | Plantain Crop | A9: Plantain Leaves | 0.39 t/fruit |
| Agriculture | Plantain Crop | A10: Plantain Pseudostem | 4.17 t/fruit |
| Agriculture | Rice Crop | A11: Rice Straw | 1.16 t/grain |
| Agriculture | Watermelon Crop | A12: Watermelon Stubble | 1.50 t/fruit |
| Agriculture | Yam Crop | A13: Yam Stubble | 0.36 t/tubers |
| Livestock | Cattle Farming | A14: Cattle Manure (Calf < 1 year) | 1.46 t/animal |
| Livestock | Cattle Farming | A14: Cattle Manure (Small 1-2 years) | 2.92 t/animal |
| Livestock | Cattle Farming | A14: Cattle Manure (Medium 2-3 years) | 3.65 t/animal |
| Livestock | Cattle Farming | A14: Cattle Manure (Large > 3 years) | 5.48 t/animal |
| Livestock | Pig Farming | A15: Pig Manure (Small 0-6 months) | 0.37 t/animal |
| Livestock | Pig Farming | A15: Pig Manure (Adult > 6 months) | 0.73 t/animal |
| Livestock | Poultry Farming | A16: Poultry Manure (Large/Adult) | 0.08 t/animal |
Table 2.
Definition of decision criteria for the ENTROPY-TOPSIS model. Source: own elaboration based on: [43,44,45,46,47,48,49].
| Criteria | Units | Criteria Type | Description |
|---|---|---|---|
| C1: Annual Residue Production | t/year | Benefit | Determines process viability and scale; ensures continuous raw material supply. |
| C2: Biochemical Methane Potential | L/kg of VS | Benefit | Indicates biomass energy potential and generation efficiency. |
| C3: Carbon-to-Nitrogen Ratio | mol/mol | Range | Critical for process stability and biogas production balance (optimal: 20 to 30). |
| C4: Moisture Content | % wt. | Range | Enhances microbial degradation and process yields (optimal: 80 % to 90 %). |
| C5: Volatile Solids | % | Benefit | Represents biodegradable fraction indicating biogas production potential. |
| C6: Total Solids | % | Benefit | Optimises logistics and storage volume; facilitates efficient reactor feeding. |
| C7: Cellulose Fraction | % | Benefit | Primary source of fermentable sugars influencing AD efficiency. |
| C8: Hemicellulose Fraction | % | Benefit | Secondary source of fermentable sugars affecting degradation efficiency. |
| C9: Lignin Fraction | % | Cost | Recalcitrant polymer that hinders biological conversion efficiency. |
| C10: Local Market Use | Scale: 1 to 5 | Cost | Evaluates competition with existing local applications (feed, compost, etc.). |
Table 3.
Physicochemical characterisation of selected substrates.
| Residue | C/N Ratio | MC (%) | VS (%) | TS (%) | EC (%) | CellC (%) | HemC (%) | LigC (%) | BMP (L/kgVS) |
|---|---|---|---|---|---|---|---|---|---|
| A1: Avocado Prunings | 16.79 | 68.32±0.36 | 89.38±0.59 | 93.12±0.26 | 15.77±0.77 | 46.57±0.54 | 25.30±1.81 | 6.62±1.32 | 302.1±7.6 |
| A2: Cassava Leaves | 10.99 | 63.00±1.80 | 89.89±0.06 | 91.93±0.17 | 33.87±0.92 | 40.75±1.20 | 18.81±0.61 | 26.35±0.92 | 275.5±6.1 |
| A3: Cassava Stems | 32.19 | 69.86±0.85 | 93.98±0.09 | 94.60±0.10 | 13.85±0.85 | 35.42±0.92 | 7.63±1.96 | 21.67±0.24 | 162.2±8.2 |
| A4: Cassava Stump | 31.47 | 58.22±0.27 | 94.42±0.59 | 93.28±0.07 | 11.33±1.59 | 38.61±0.32 | 13.87±0.51 | 10.12±0.56 | 210.9±5.5 |
| A5: Coconut Prunings | 44.65 | 49.52±1.19 | 85.86±1.67 | 95.77±0.17 | 21.20±0.86 | 65.33±0.32 | 21.19±0.51 | 19.72±0.56 | 350.1±3.6 |
| A6: Maize Stover | 30.05 | 65.52±0.56 | 91.11±0.02 | 93.58±0.17 | 22.68±0.04 | 60.87±1.16 | 26.58±1.06 | 7.06±0.24 | 381.5±5.8 |
| A7: Mango Prunings | 25.92 | 47.63±0.51 | 87.88±0.56 | 91.14±0.12 | 19.82±0.27 | 56.02±1.12 | 18.57±0.22 | 20.07±0.43 | 300.6±4.5 |
| A8: Oil Palm Prunings | 27.50 | 60.61±0.68 | 87.60±1.27 | 94.84±0.17 | 24.21±0.15 | 63.91±0.92 | 18.46±1.96 | 22.49±0.24 | 339.1±7.8 |
| A9: Plantain Leaves | 21.87 | 76.99±0.56 | 86.26±0.06 | 93.90±0.20 | 20.08±1.15 | 46.81±0.91 | 21.07±0.47 | 9.98±0.75 | 295±5.4 |
| A10: Plantain Pseudostem | 52.61 | 93.17±0.15 | 85.09±0.11 | 90.87±0.15 | 32.31±0.01 | 66.01±0.91 | 28.49±0.64 | 9.24±0.29 | 433.6±4.2 |
| A11: Rice Straw | 20.66 | 62.33±0.75 | 79.53±0.10 | 93.36±0.22 | 22.41±0.17 | 38.53±0.46 | 15.23±0.18 | 18.40±0.22 | 234±2.0 |
| A12: Watermelon Stubble | 15.55 | 75.61±2.88 | 86.66±0.35 | 93.03±0.10 | 40.05±0.54 | 42.74±1.62 | 13.59±1.77 | 25.08±1.47 | 286.4±9.4 |
| A13: Yam Stubble | 18.93 | 75.15±0.11 | 85.42±0.44 | 92.50±0.25 | 26.24±0.74 | 55.13±0.77 | 19.88±1.11 | 23.73±0.10 | 314.9±5.4 |
| A14: Cattle Manure | 28.33 | 73.06±2.30 | 79.13±0.62 | 93.22±0.07 | 10.68±0.33 | 24.41±0.15 | 13.26±0.12 | 18.68±0.07 | 136.4±1.3 |
| A15: Pig Manure | 14.05 | 61.82±3.07 | 83.11±0.25 | 93.16±0.18 | 27.26±0.40 | 18.15±0.20 | 9.86±0.11 | 21.63±0.09 | 146.9±1.5 |
| A16: Poultry Manure | 6.68 | 55.44±2.29 | 71.26±0.43 | 92.83±0.15 | 27.16±0.54 | 42.08±1.14 | 28.79±0.50 | 5.73±0.17 | 334.9±5.0 |
C-N Ratio: Carbon to Nitrogen Atomic Ratio, MC: Moisture Content, VS: Volatile Solids Content, TS: Total Solids Content, EC: Extractives Content, CellC: Cellulose content, HemC: Hemicellulose Content, LigC: Lignin Content, BMP: Biochemical Methane Potential.
Table 4.
Assessment of local market utilisation and competition for selected residues in Sucre.
| Residue | Market Score (1–5) | Key Competition Driver | Justification and Current Local Uses |
|---|---|---|---|
| A1: Avocado Prunings | 1 | Disposal Cost | Treated as waste to be pruned and discarded/burned. Negligible market value or competition. |
| A2: Cassava Leaves | 2 | Perishability | Left in the field or occasionally used for small-scale animal feed. High perishability limits marketability and transport range. |
| A3: Cassava Stems | 2 | Agricultural Use | Traditionally used by farmers in Sucre for vegetative propagation (cloning) of the cassava plant. Stems are cut into stakes for replanting; however, a surplus remains after selecting viable stakes. |
| A4: Cassava Stump | 1 | Land Clearance Cost | The root stump is usually left in the ground and requires manual or mechanical removal to prepare the land for the next cycle. No current commercial use; represents a disposal cost. |
| A5: Coconut Prunings | 2 | Collection Logistics | Mostly left in the field. Fibrous nature makes decomposition slow. Low competition, but collection can be labour intensive. |
| A6: Maize Stover | 3 | Animal Feed | Intense competition as cattle feeds during dry periods (ensilage). Availability for energy fluctuates with climatic conditions. |
| A7: Mango Prunings | 1 | Disposal Cost | Treated as waste to be pruned and discarded/burned. Negligible market value or competition. |
| A8: Oil Palm Prunings | 4 | Internal Energy Use | Often recycled within the plantation for nutrient cycling or used as fuel in extraction mill boilers. High captive use limits external availability. |
| A9: Plantain Leaves | 2 | Local Packaging/Feed | Leaves have a niche market for traditional food packaging (e.g., tamales) and minor use as animal feed but supply vastly exceeds demand. |
| A10: Plantain Pseudostem | 1 | Nutrient Cycling | Minimal current use. Left to decompose in the field to recycle nutrients. Exceptionally low competition, high potential for valorisation. |
| A11: Rice Straw | 3 | Seasonality | Often burned in the field (illegal but common) or used for cattle bedding/feed during dry seasons. Seasonality affects its competitive use. |
| A12: Watermelon Stubble | 1 | Nutrient Cycling | Crop residues are typically left in the field for decomposition and soil incorporation. No significant commercial market exists. |
| A13: Yam Stubble | 1 | Collection Logistics | Aerial vines remaining in the field after harvest. Difficult mechanisation due to entangled growth. Often burned or left for soil incorporation; no significant market value. |
| A14: Cattle Manure | 2 | Soil Amendment | Primarily used as direct fertiliser on pastures, though often in excess and inefficiently managed. Low commercial value, making it highly available for AD. |
| A15: Pig Manure | 3 | Environmental Risk | Used for fertilisation but poses environmental challenges due to odour and runoff. Moderate competition, often requires treatment before disposal. |
| A16: Poultry Manure | 4 | Commercial Value | High demand as a potent organic fertiliser for crops and fish farming. Established commercial value creates significant competition for energy use. |
Table 5.
Vector-Normalised Decision Matrix.
| Residue | C2: BMP | C3: C/N Ratio | C4: MC | C5: VS | C6: TS | C7: CellC | C8: HemC | C9: LigC | C10: LMU |
|---|---|---|---|---|---|---|---|---|---|
| A1: Avocado Prunings | 0.258 | 0.257 | 0.315 | 0.259 | 0.250 | 0.241 | 0.320 | 0.092 | 0.108 |
| A2: Cassava Leaves | 0.235 | 0.180 | 0.234 | 0.261 | 0.247 | 0.211 | 0.238 | 0.365 | 0.217 |
| A3: Cassava Stems | 0.138 | 0.270 | 0.338 | 0.272 | 0.254 | 0.183 | 0.096 | 0.300 | 0.217 |
| A4: Cassava Stump | 0.180 | 0.280 | 0.161 | 0.274 | 0.250 | 0.200 | 0.175 | 0.140 | 0.108 |
| A5: Coconut Prunings | 0.299 | 0.105 | 0.029 | 0.249 | 0.257 | 0.338 | 0.268 | 0.273 | 0.217 |
| A6: Maize Stover | 0.325 | 0.299 | 0.272 | 0.264 | 0.251 | 0.315 | 0.336 | 0.098 | 0.325 |
| A7: Mango Prunings | 0.256 | 0.299 | 0.000 | 0.255 | 0.244 | 0.290 | 0.235 | 0.278 | 0.108 |
| A8: Oil Palm Prunings | 0.289 | 0.299 | 0.197 | 0.254 | 0.254 | 0.331 | 0.233 | 0.311 | 0.434 |
| A9: Plantain Leaves | 0.252 | 0.299 | 0.340 | 0.250 | 0.252 | 0.242 | 0.266 | 0.138 | 0.217 |
| A10: Plantain Pseudostem | 0.370 | 0.000 | 0.140 | 0.247 | 0.244 | 0.341 | 0.360 | 0.128 | 0.108 |
| A11: Rice Straw | 0.200 | 0.299 | 0.223 | 0.231 | 0.250 | 0.199 | 0.193 | 0.255 | 0.325 |
| A12: Watermelon Stubble | 0.244 | 0.240 | 0.340 | 0.251 | 0.250 | 0.221 | 0.172 | 0.347 | 0.108 |
| A13: Yam Stubble | 0.269 | 0.285 | 0.340 | 0.248 | 0.248 | 0.285 | 0.251 | 0.328 | 0.108 |
| A14: Cattle Manure | 0.116 | 0.299 | 0.340 | 0.229 | 0.250 | 0.126 | 0.168 | 0.258 | 0.217 |
| A15: Pig Manure | 0.125 | 0.220 | 0.216 | 0.241 | 0.250 | 0.094 | 0.125 | 0.299 | 0.325 |
| A16: Poultry Manure | 0.286 | 0.123 | 0.119 | 0.207 | 0.249 | 0.218 | 0.364 | 0.079 | 0.434 |
Disclaimer/Publisher’s Note: The statements, opinions and data contained in all publications are solely those of the individual author(s) and contributor(s) and not of MDPI and/or the editor(s). MDPI and/or the editor(s) disclaim responsibility for any injury to people or property resulting from any ideas, methods, instructions or products referred to in the content. |
© 2026 by the authors. Licensee MDPI, Basel, Switzerland. This article is an open access article distributed under the terms and conditions of the Creative Commons Attribution (CC BY) license (http://creativecommons.org/licenses/by/4.0/).
Copyright: This open access article is published under a Creative Commons CC BY 4.0 license, which permit the free download, distribution, and reuse, provided that the author and preprint are cited in any reuse.


